Le Futur Système Régional de Prévision Déterministe SRPD...
88
Le Futur Système Régional de Prévision Déterministe SRPD 3.0.0 (10km-4DVAR) Séminaire RPN du 23 mars 2012 Paul Vaillancourt et Luc Fillion Proposition CPOP prévue pour le 27 mars 2012
-
Upload
hoangxuyen -
Category
Documents
-
view
214 -
download
0
Transcript of Le Futur Système Régional de Prévision Déterministe SRPD...
Le Futur Système Régional de Prévision Déterministe
SRPD 3.0.0(10km-4DVAR)
Séminaire RPN du 23 mars 2012
Paul Vaillancourt et Luc Fillion
Proposition CPOP prévue pour le 27 mars 2012

Merci aux principaux artisans!➔ Gang modele: CMDN :Alain Patoine, André Plante, Anne-Marie Leduc, Normand Gagnon, Manon Faucher, F. Roy, F. Dupont, Najat BenboutaRPN: Ayrton Zadra, Ron McTaggart-Cowan, Martin Charron, Claude Girard, Michel Desgagné, Jocelyn Mailhot, Michel Roch, Marcel Vallée,JF Lemieux, G.Smith
➔ Gang analyse: CMDA: Judy St-James, Matt Reszka, Manon LajoieARMA: Stephen MacPherson, Ervig Lapalme, Bin He RPN: Monique Tanguay
➔ A&P: Suzanne Roy, Charles Creese, Allan Rahill, Laura Lam, Victor Thomas, André Giguère

Plan du séminaire
I. Scores et évaluation par A&P (Paul) II. Changements au modèle (Paul)III.Changements au pilote et à l'analyse (Luc)
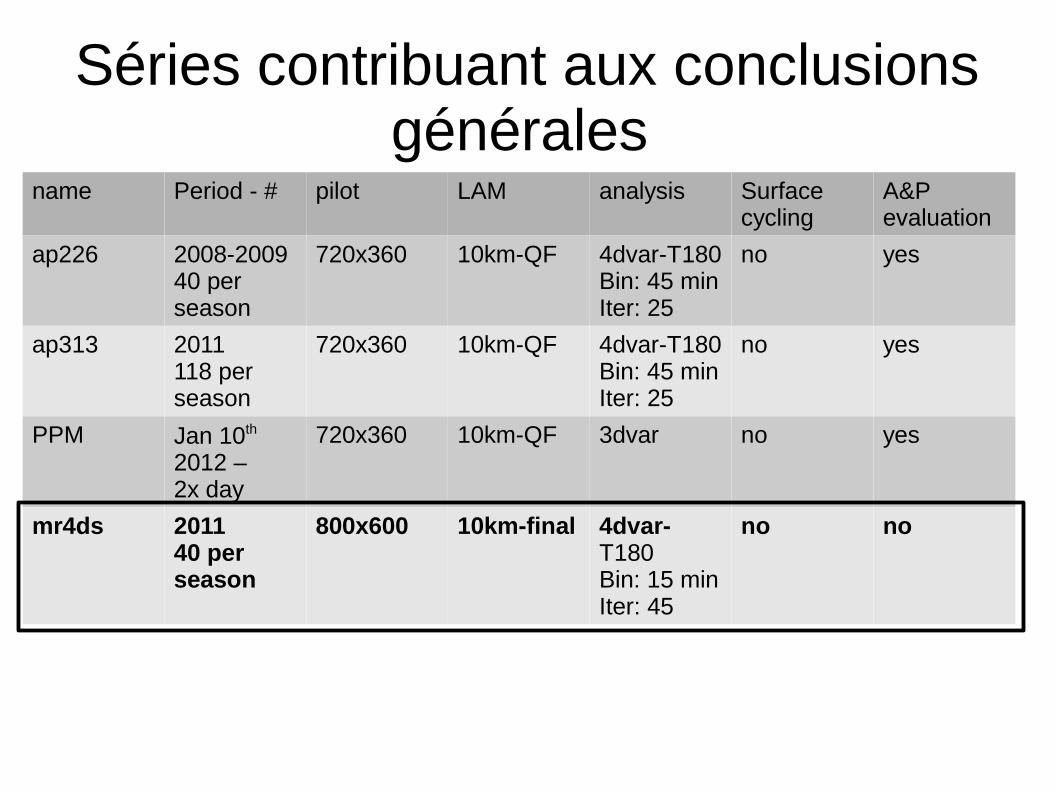
Séries contribuant aux conclusionsgénérales
name Period - # pilot LAM analysis Surface cycling
A&P evaluation
ap226 2008-200940 per season
720x360 10km-QF 4dvar-T180Bin: 45 minIter: 25
no yes
ap313 2011118 per season
720x360 10km-QF 4dvar-T180Bin: 45 minIter: 25
no yes
PPM Jan 10th 2012 –2x day
720x360 10km-QF 3dvar no yes
mr4ds 201140 per season
800x600 10km-final 4dvar-T180Bin: 15 minIter: 45
no no
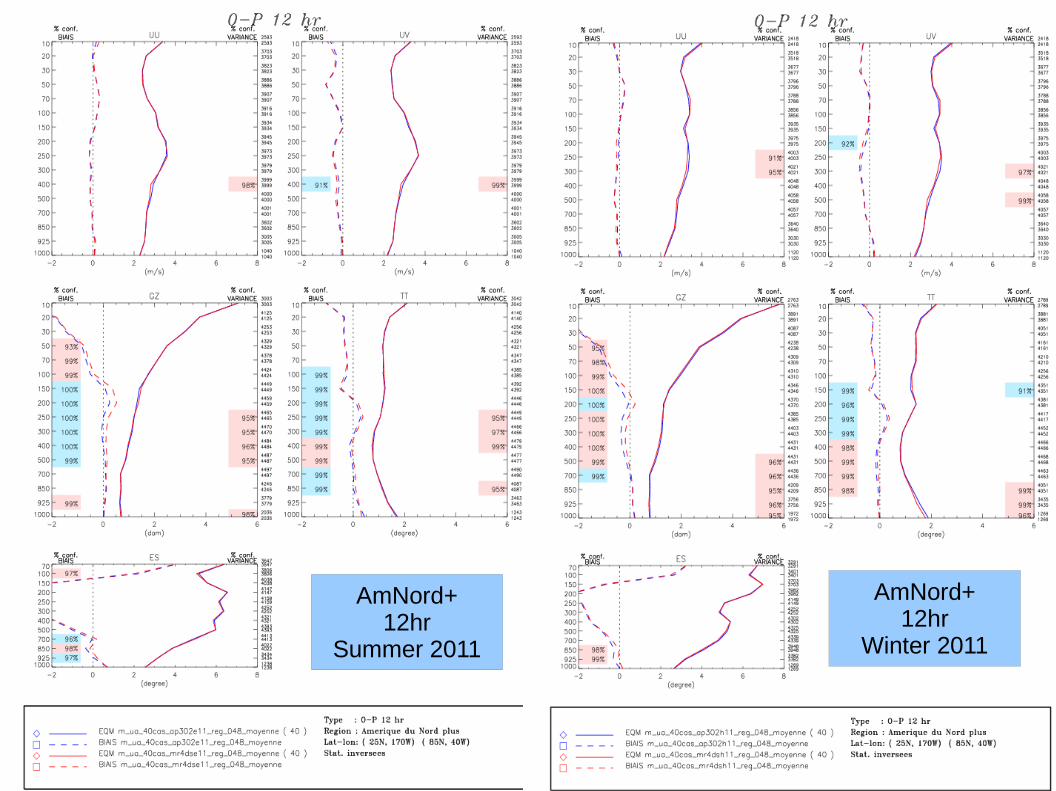
AmNord+12hr
Summer 2011
AmNord+12hr
Winter 2011
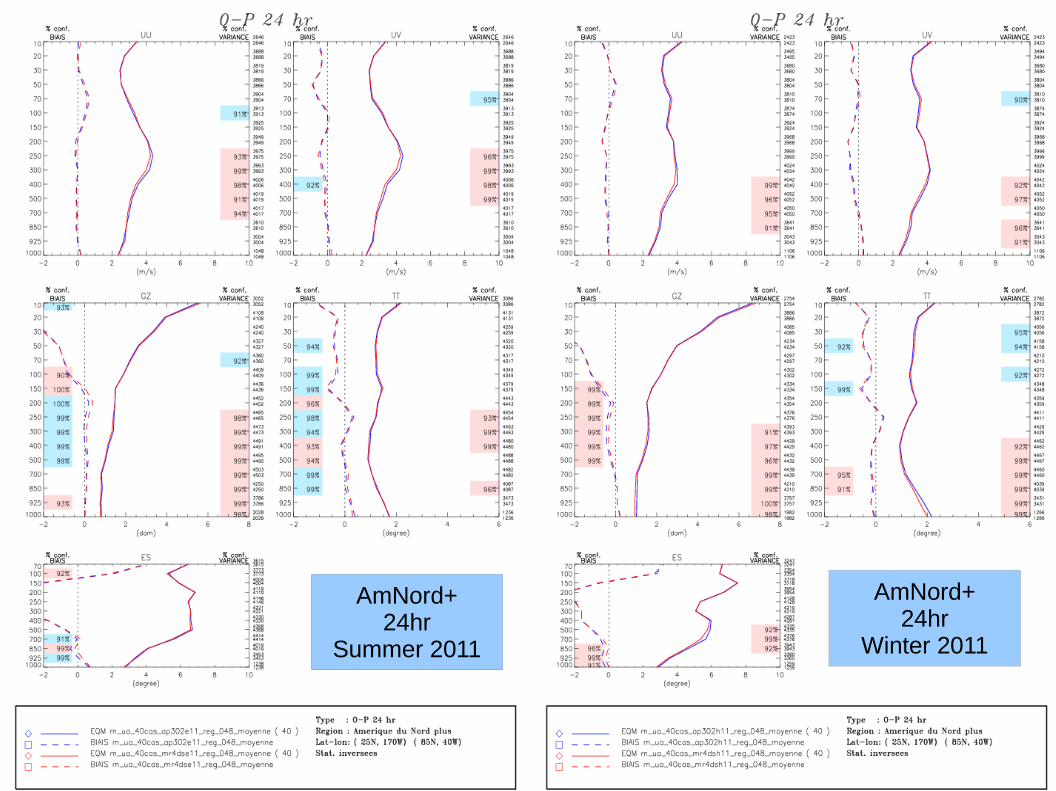
AmNord+24hr
Summer 2011
AmNord+24hr
Winter 2011
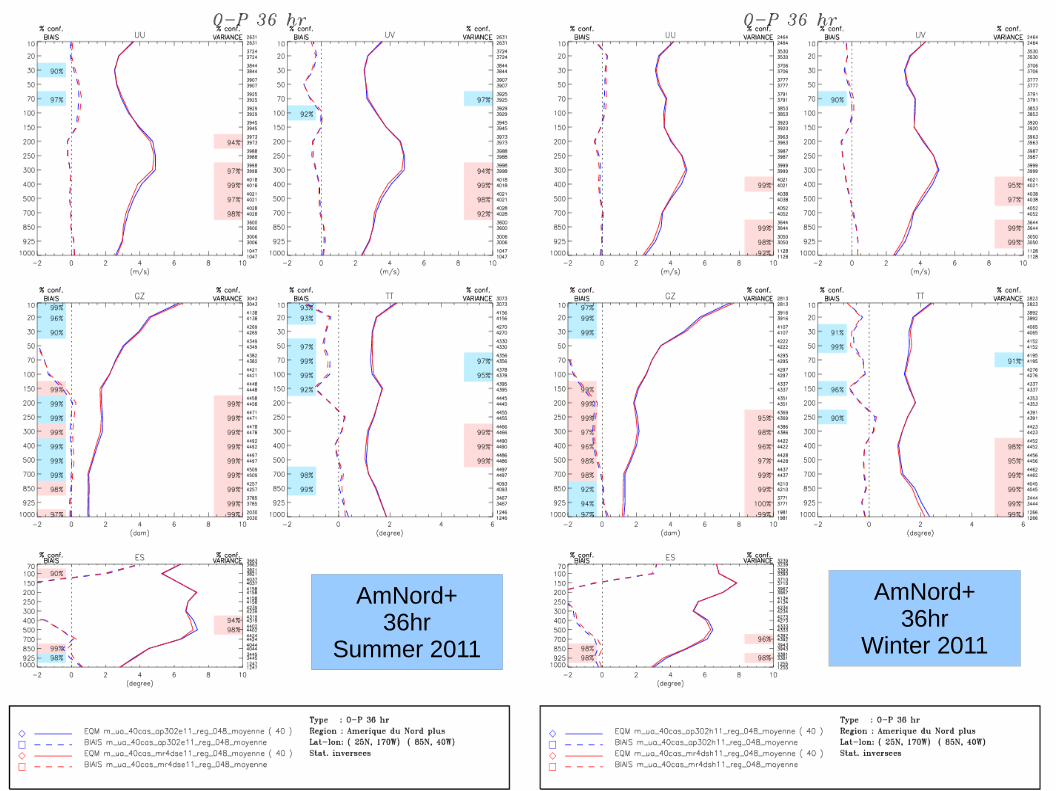
AmNord+36hr
Summer 2011
AmNord+36hr
Winter 2011
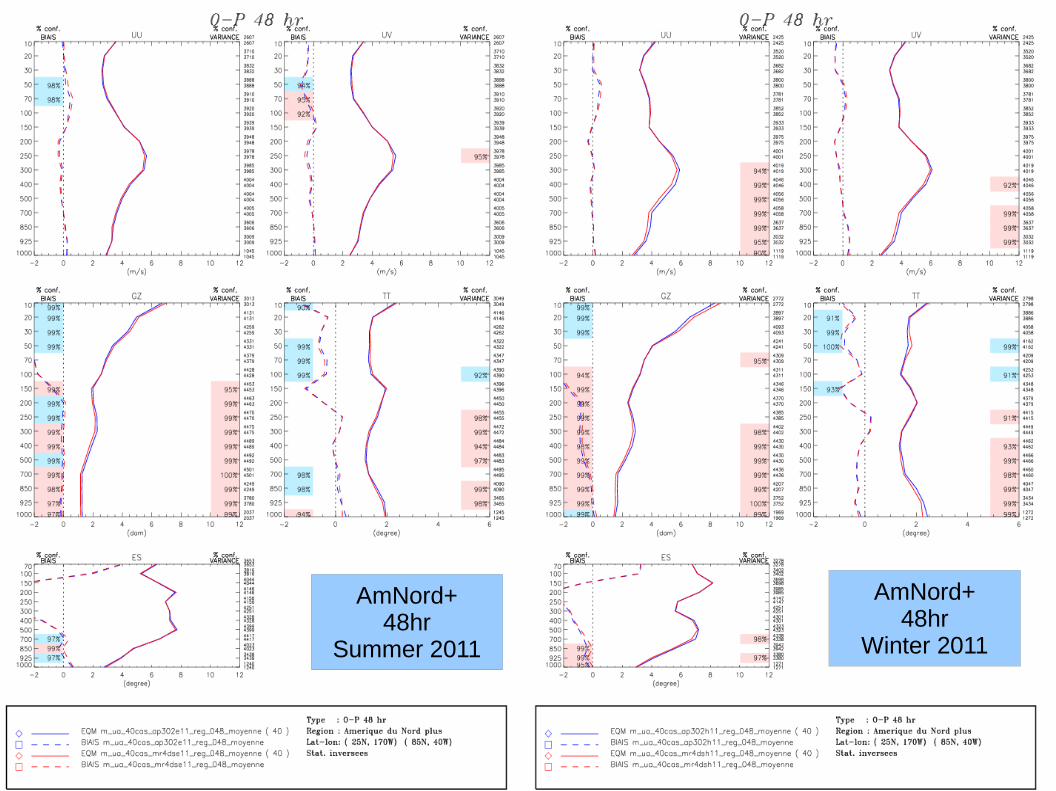
AmNord+48hr
Summer 2011
AmNord+48hr
Winter 2011
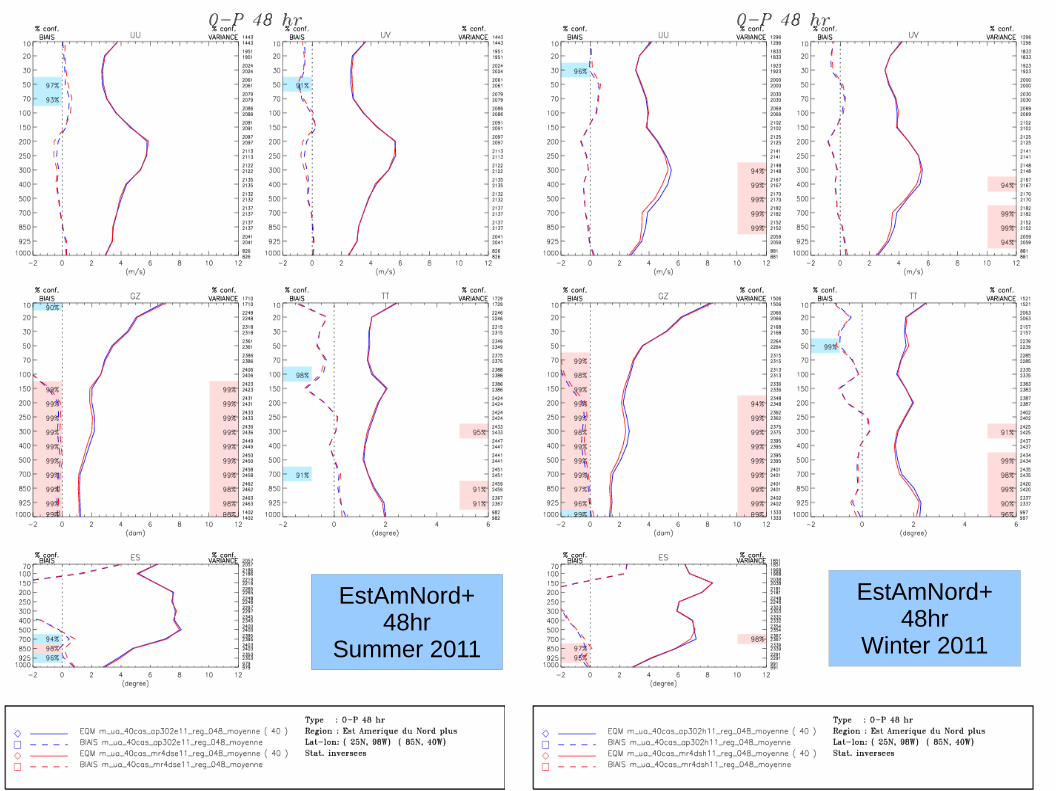
EstAmNord+48hr
Summer 2011
EstAmNord+48hr
Winter 2011
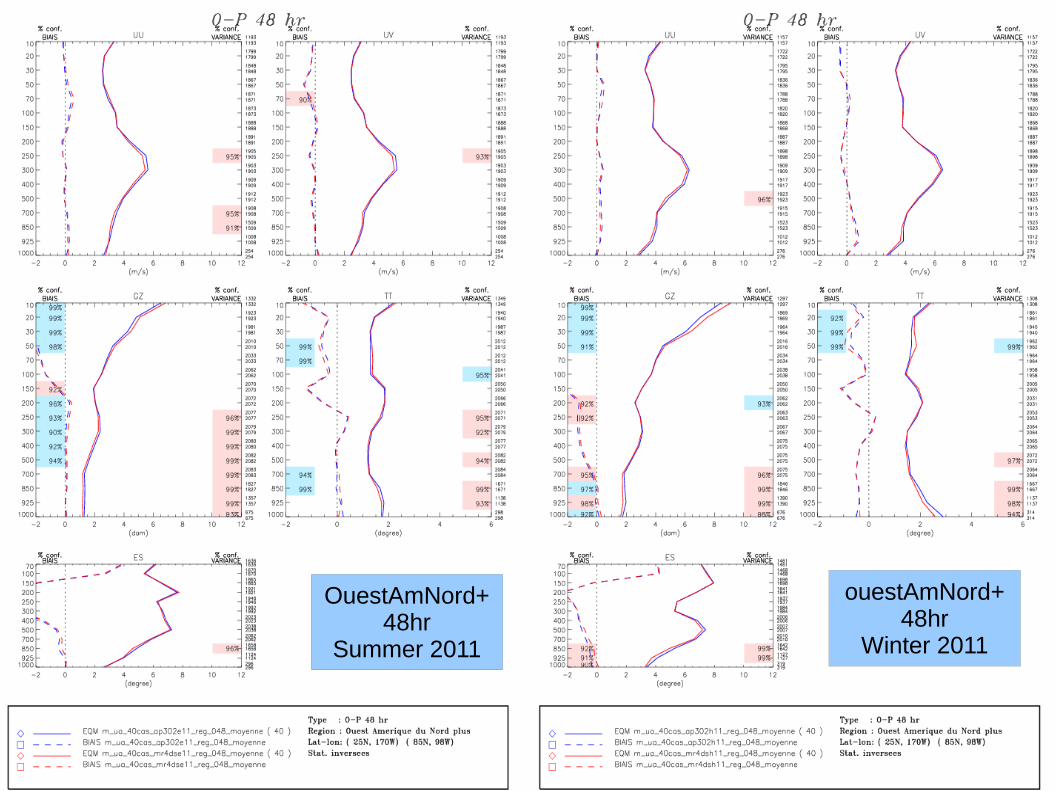
OuestAmNord+48hr
Summer 2011
ouestAmNord+48hr
Winter 2011
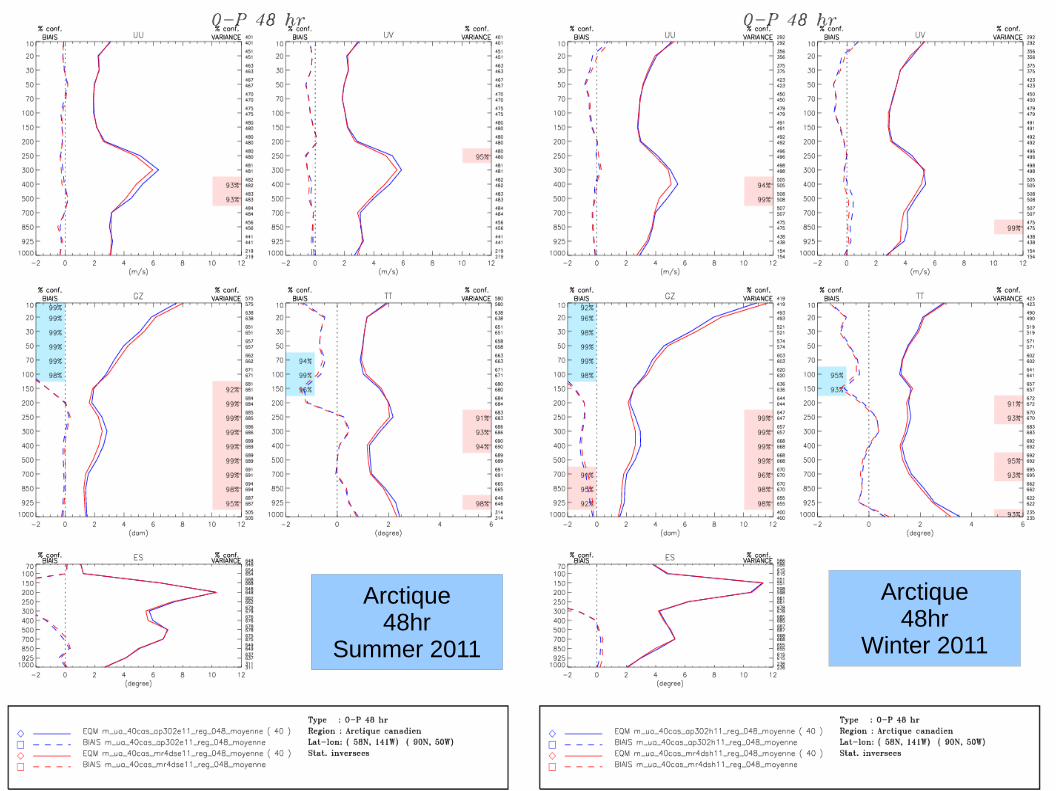
Arctique48hr
Summer 2011
Arctique48hr
Winter 2011
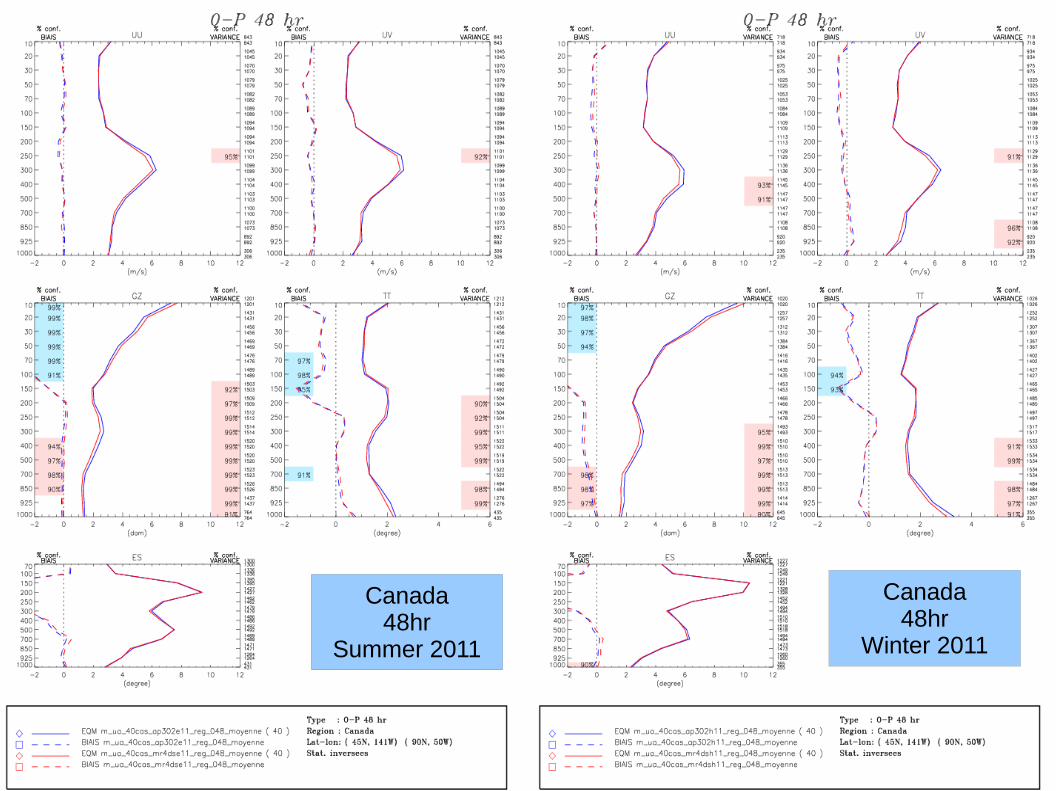
Canada48hr
Summer 2011
Canada48hr
Winter 2011
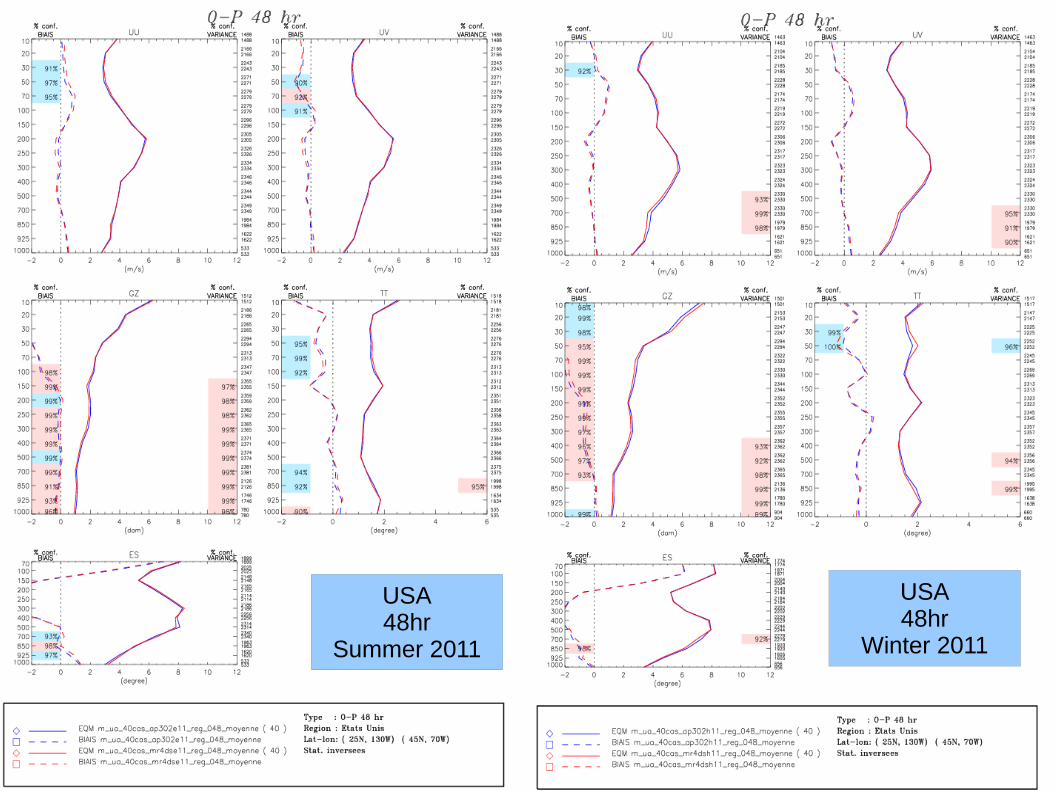
USA48hr
Summer 2011
USA48hr
Winter 2011
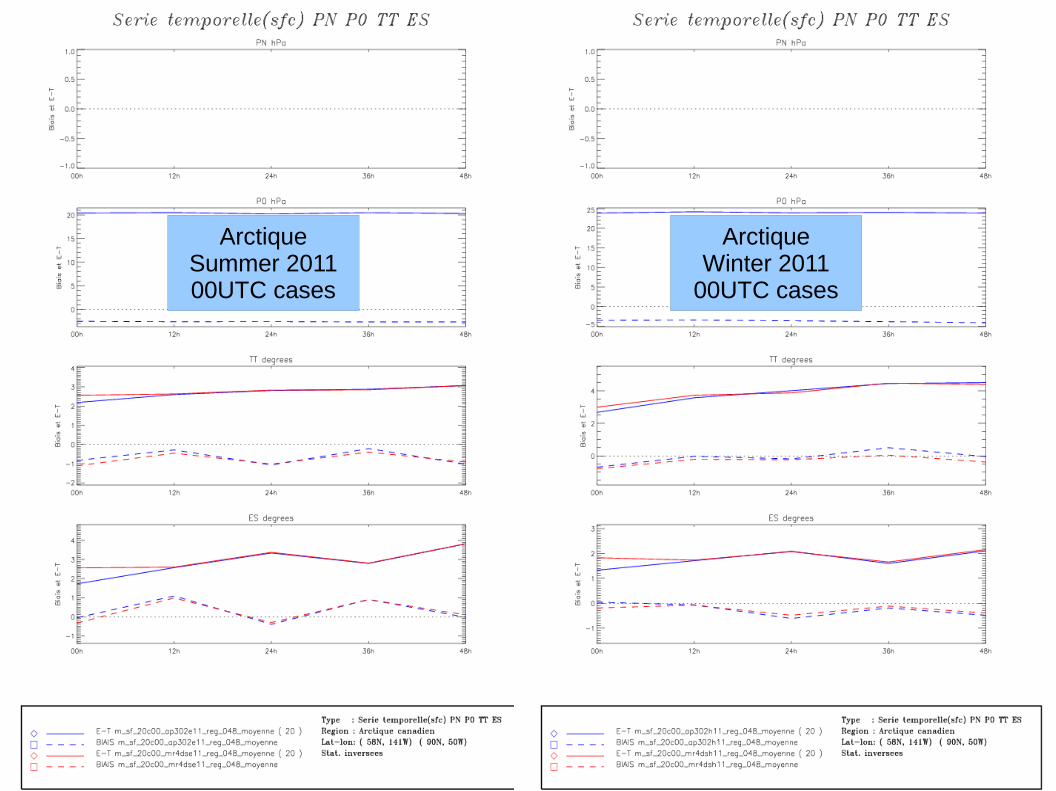
ArctiqueSummer 201100UTC cases
ArctiqueWinter 2011
00UTC cases
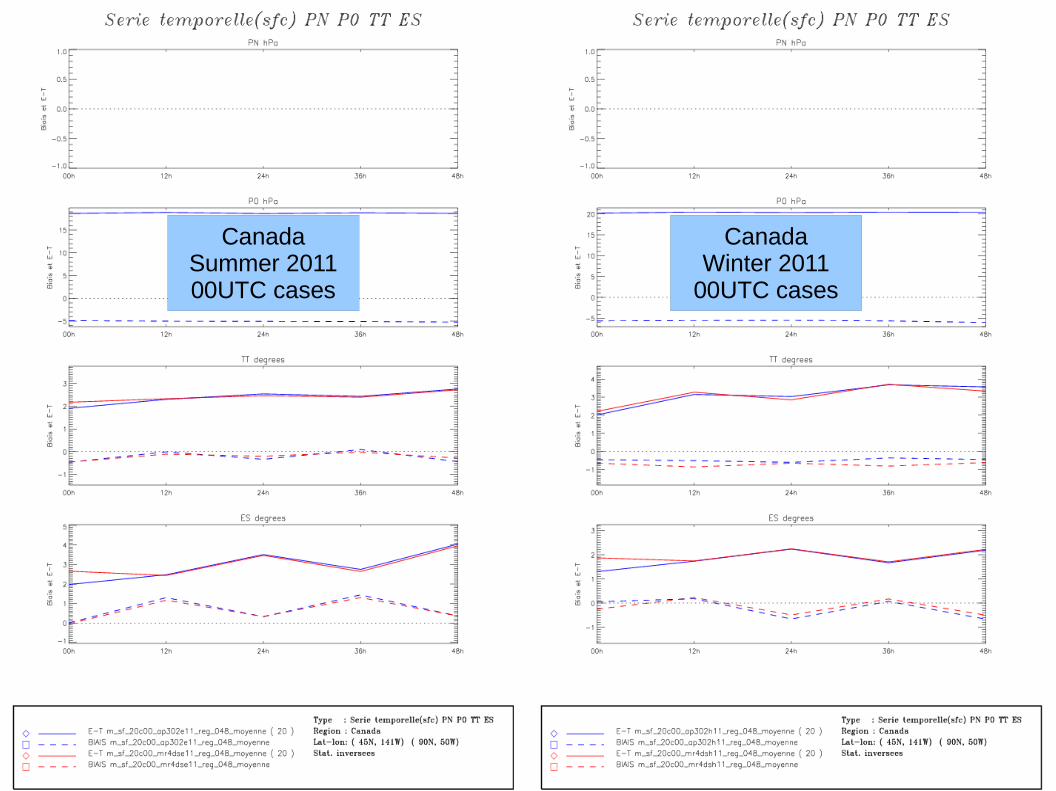
CanadaSummer 201100UTC cases
CanadaWinter 2011
00UTC cases
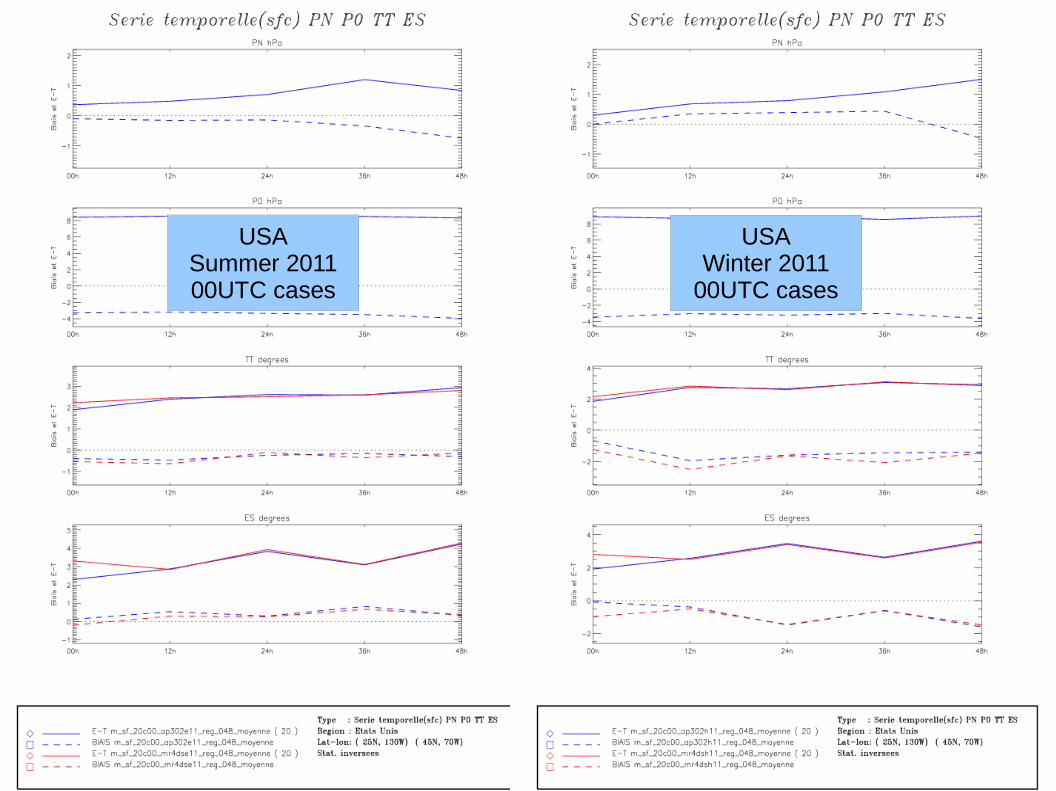
USASummer 201100UTC cases
USAWinter 2011
00UTC cases
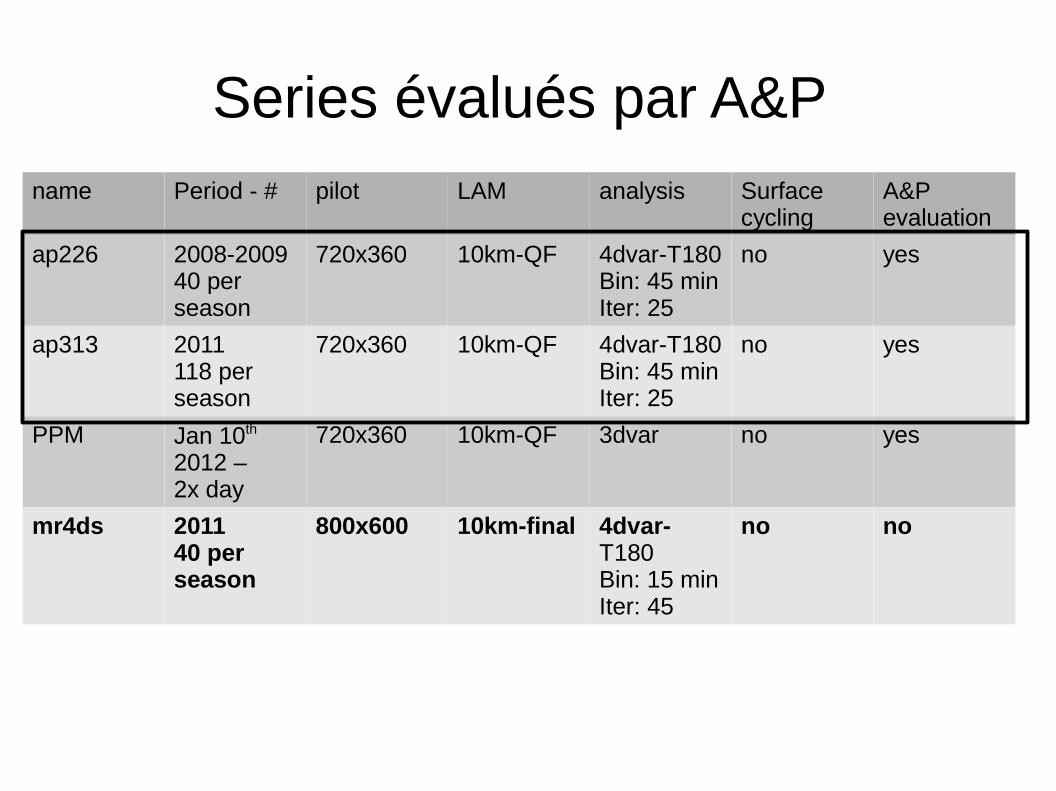
Series évalués par A&P name Period - # pilot LAM analysis Surface
cyclingA&P evaluation
ap226 2008-200940 per season
720x360 10km-QF 4dvar-T180Bin: 45 minIter: 25
no yes
ap313 2011118 per season
720x360 10km-QF 4dvar-T180Bin: 45 minIter: 25
no yes
PPM Jan 10th 2012 –2x day
720x360 10km-QF 3dvar no yes
mr4ds 201140 per season
800x600 10km-final 4dvar-T180Bin: 15 minIter: 45
no no
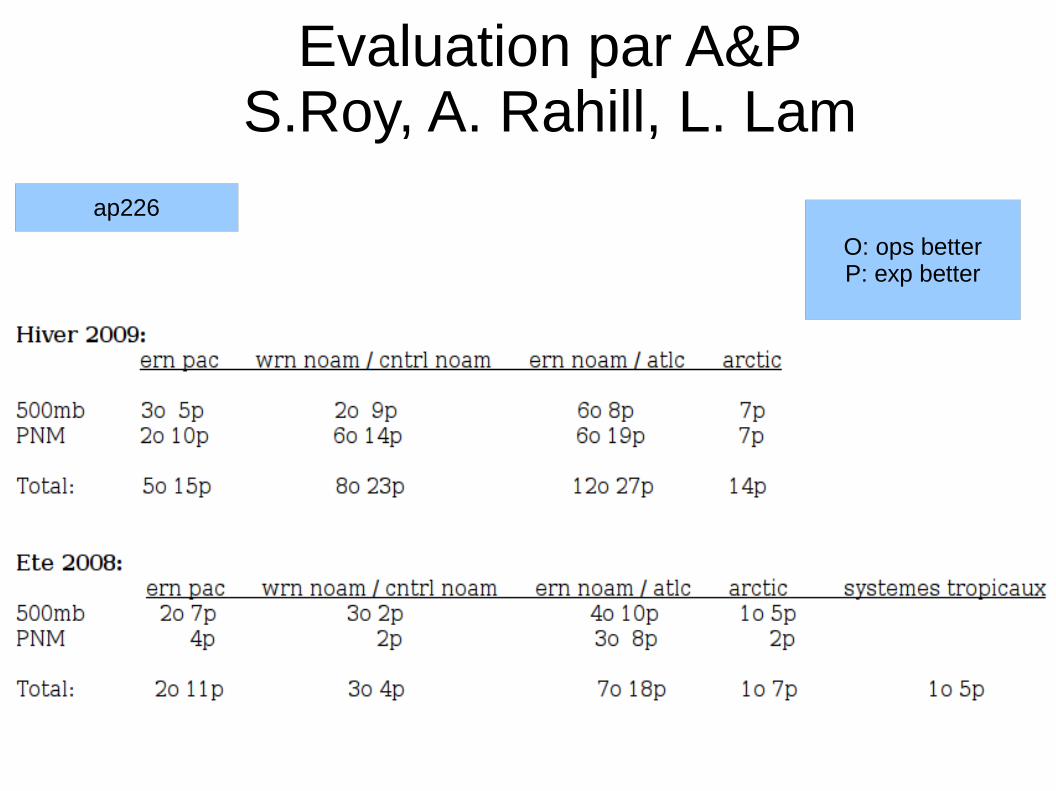
Evaluation par A&PS.Roy, A. Rahill, L. Lam
O: ops betterP: exp better
ap226
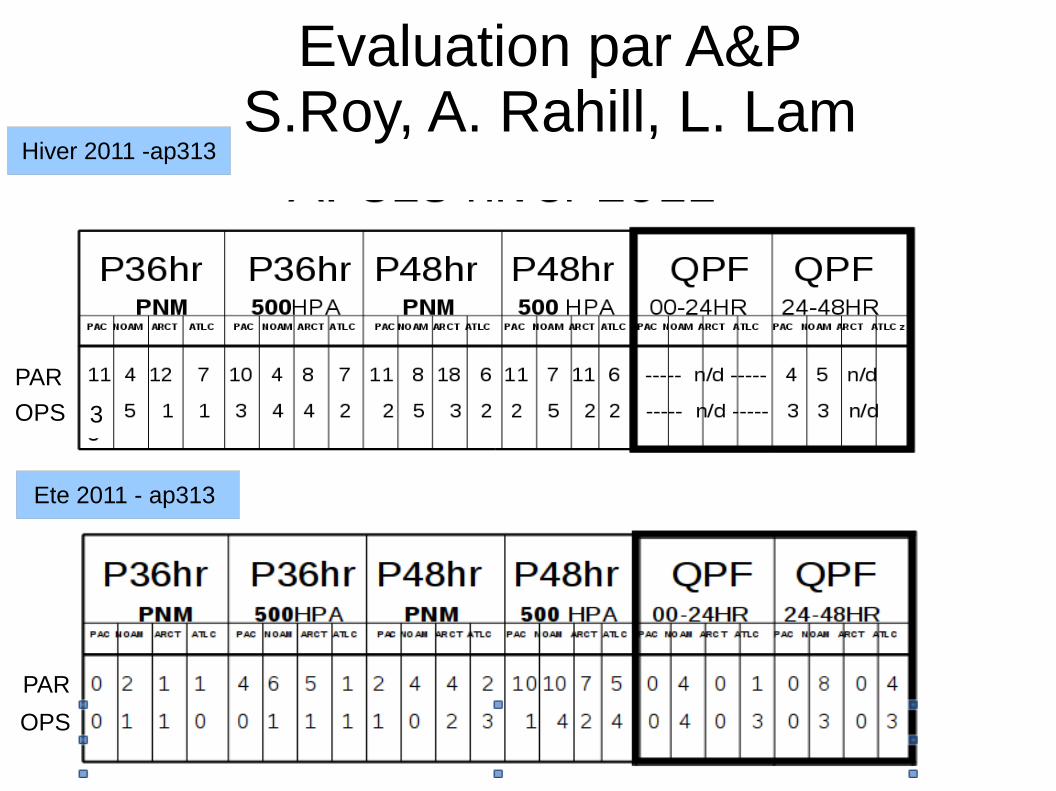
Evaluation par A&PS.Roy, A. Rahill, L. Lam
OPS
PAR
Ete 2011 - ap313
Hiver 2011 -ap313
PAR
OPS 3
Changements au modèle
● Liste des changements● Justifications des changements● Description et impact des changements
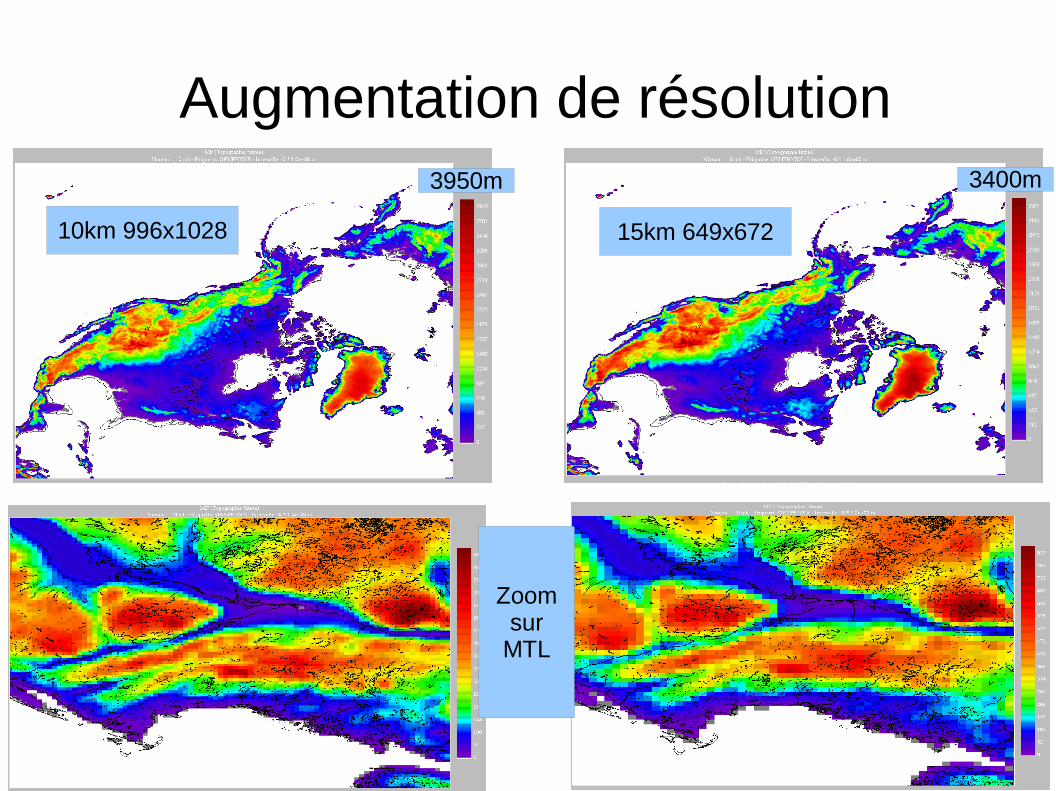
Augmentation de résolution
10km 996x1028 15km 649x672
Zoomsur
MTL
3950m 3400m
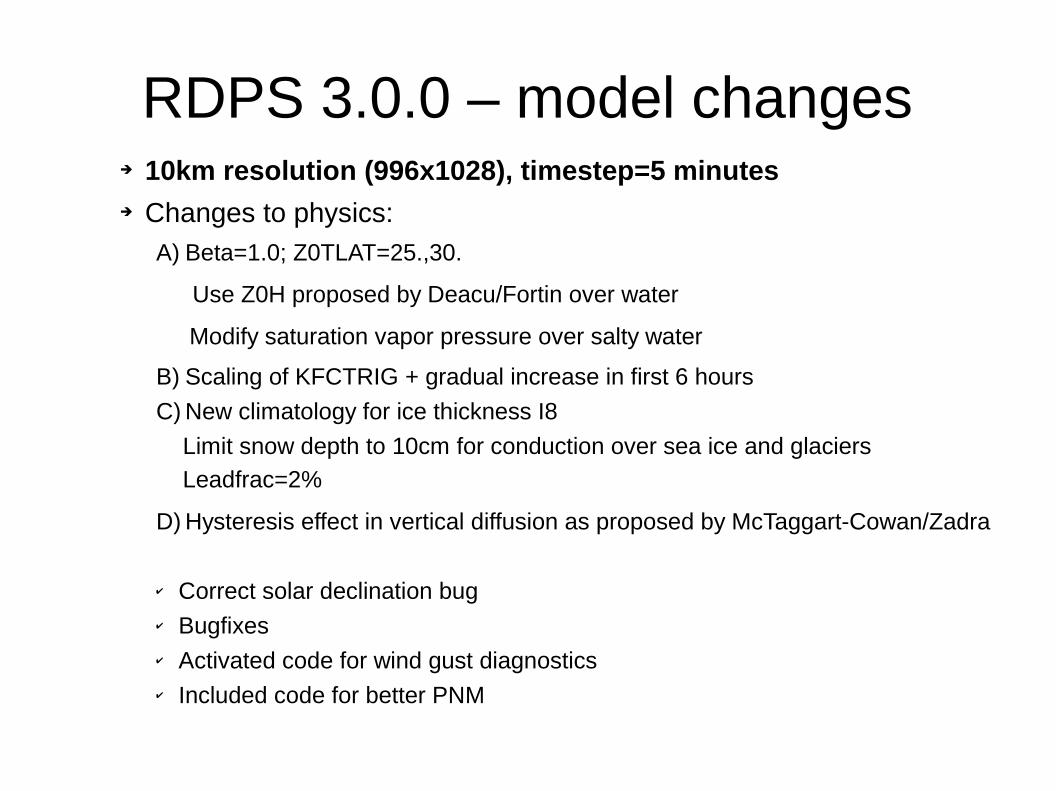
RDPS 3.0.0 – model changes➔ 10km resolution (996x1028), timestep=5 minutes➔ Changes to physics:
A) Beta=1.0; Z0TLAT=25.,30.
Use Z0H proposed by Deacu/Fortin over water
Modify saturation vapor pressure over salty water
B) Scaling of KFCTRIG + gradual increase in first 6 hours
C) New climatology for ice thickness I8
Limit snow depth to 10cm for conduction over sea ice and glaciers
Leadfrac=2% D) Hysteresis effect in vertical diffusion as proposed by McTaggart-Cowan/Zadra
✔ Correct solar declination bug✔ Bugfixes✔ Activated code for wind gust diagnostics✔ Included code for better PNM
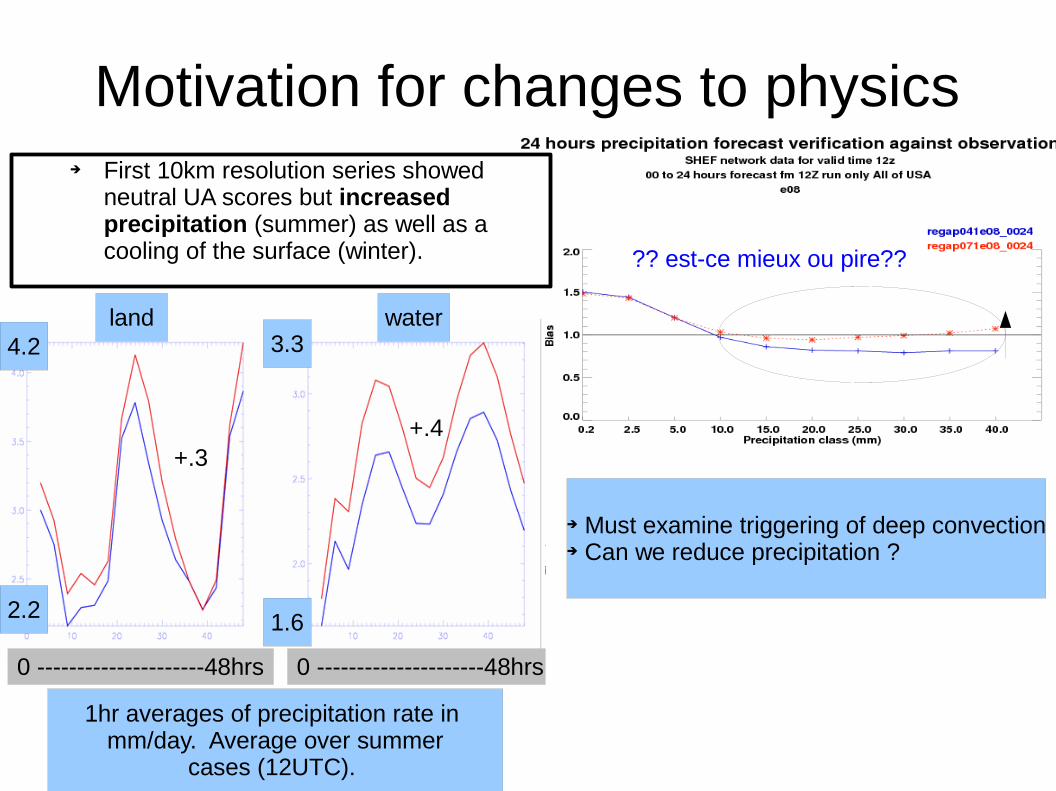
Motivation for changes to physics➔ First 10km resolution series showed
neutral UA scores but increased precipitation (summer) as well as a cooling of the surface (winter).
land water
0 ---------------------48hrs0 ---------------------48hrs
1hr averages of precipitation rate in mm/day. Average over summer
cases (12UTC).
2.2
4.2
1.6
3.3
+.3+.4
?? est-ce mieux ou pire??
➔ Must examine triggering of deep convection➔ Can we reduce precipitation ?
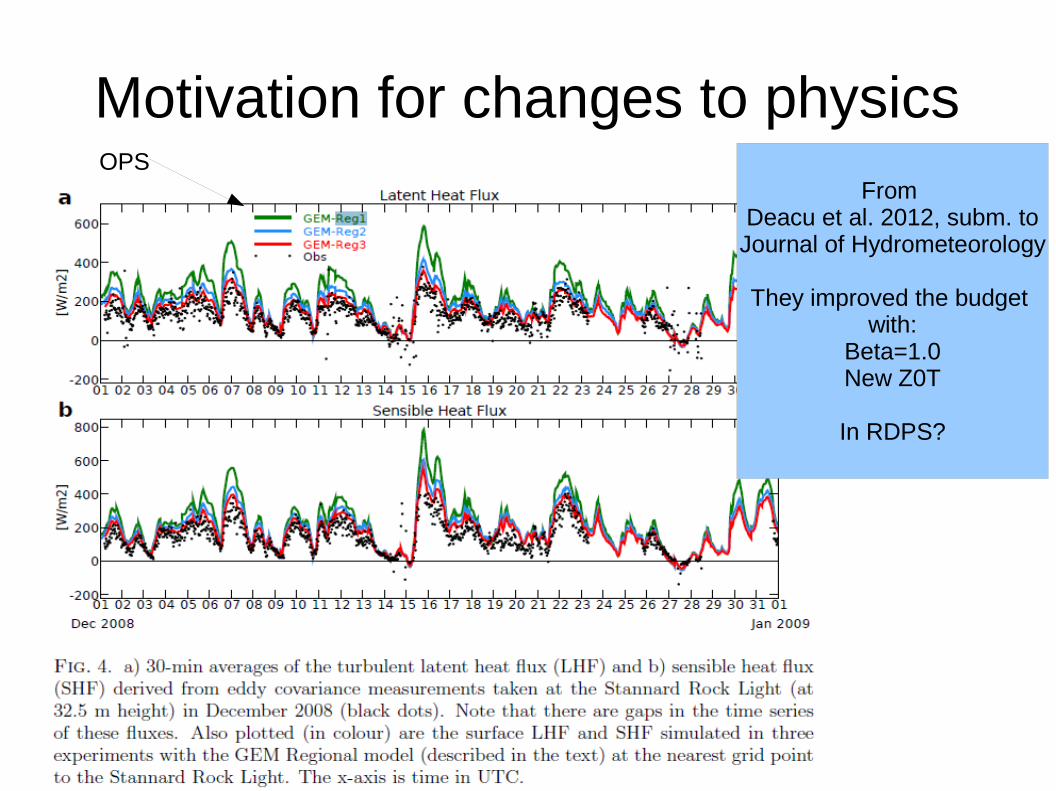
Motivation for changes to physicsFrom
Deacu et al. 2012, subm. toJournal of Hydrometeorology
They improved the budget with:
Beta=1.0New Z0T
In RDPS?
OPS
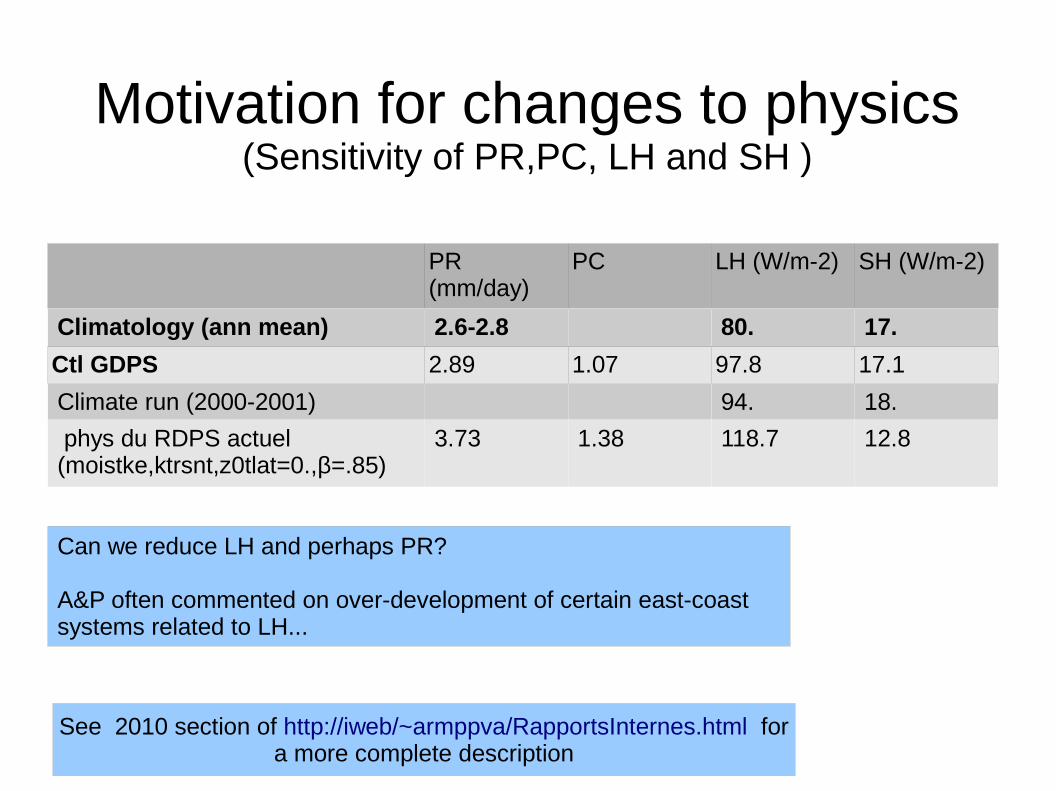
PR (mm/day)
PC LH (W/m-2) SH (W/m-2)
Climatology (ann mean) 2.6-2.8 80. 17.
Ctl GDPS 2.89 1.07 97.8 17.1
Climate run (2000-2001) 94. 18.
phys du RDPS actuel(moistke,ktrsnt,z0tlat=0.,β=.85)
3.73 1.38 118.7 12.8
Motivation for changes to physics(Sensitivity of PR,PC, LH and SH )
See 2010 section of http://iweb/~armppva/RapportsInternes.html fora more complete description
Can we reduce LH and perhaps PR?
A&P often commented on over-development of certain east-coast systems related to LH...
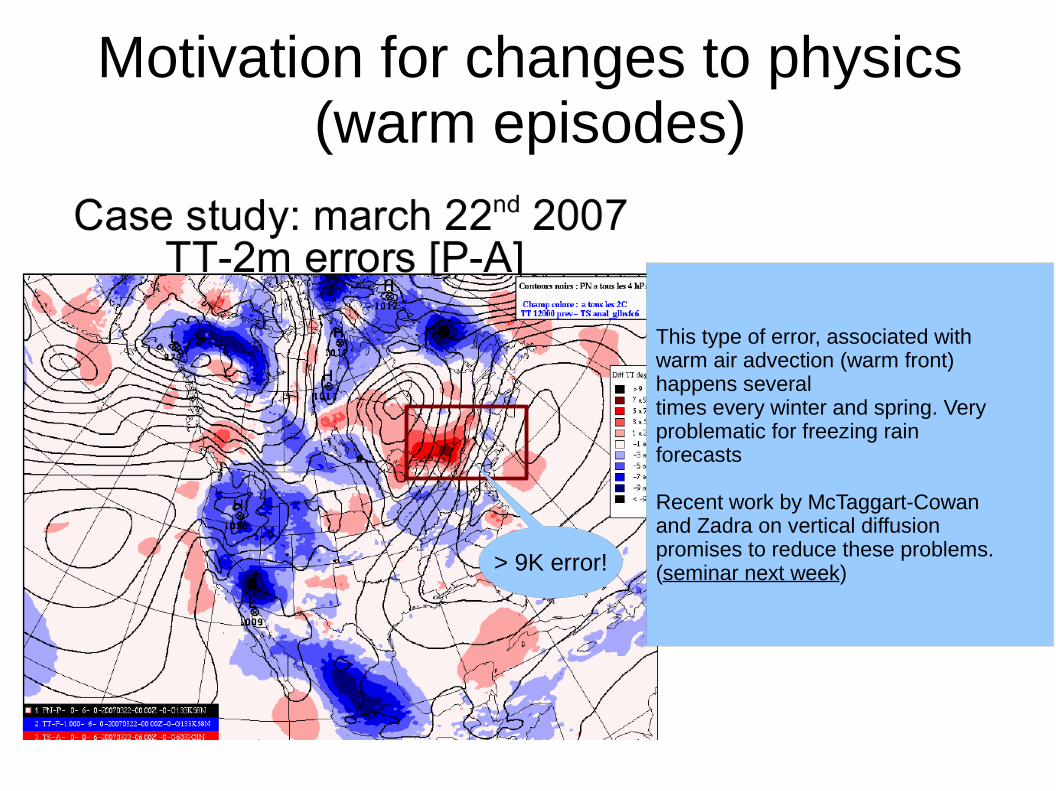
Motivation for changes to physics(warm episodes)
This type of error, associated with warm air advection (warm front)happens severaltimes every winter and spring. Very problematic for freezing rain forecasts
Recent work by McTaggart-Cowan and Zadra on vertical diffusion promises to reduce these problems.(seminar next week)> 9K error!
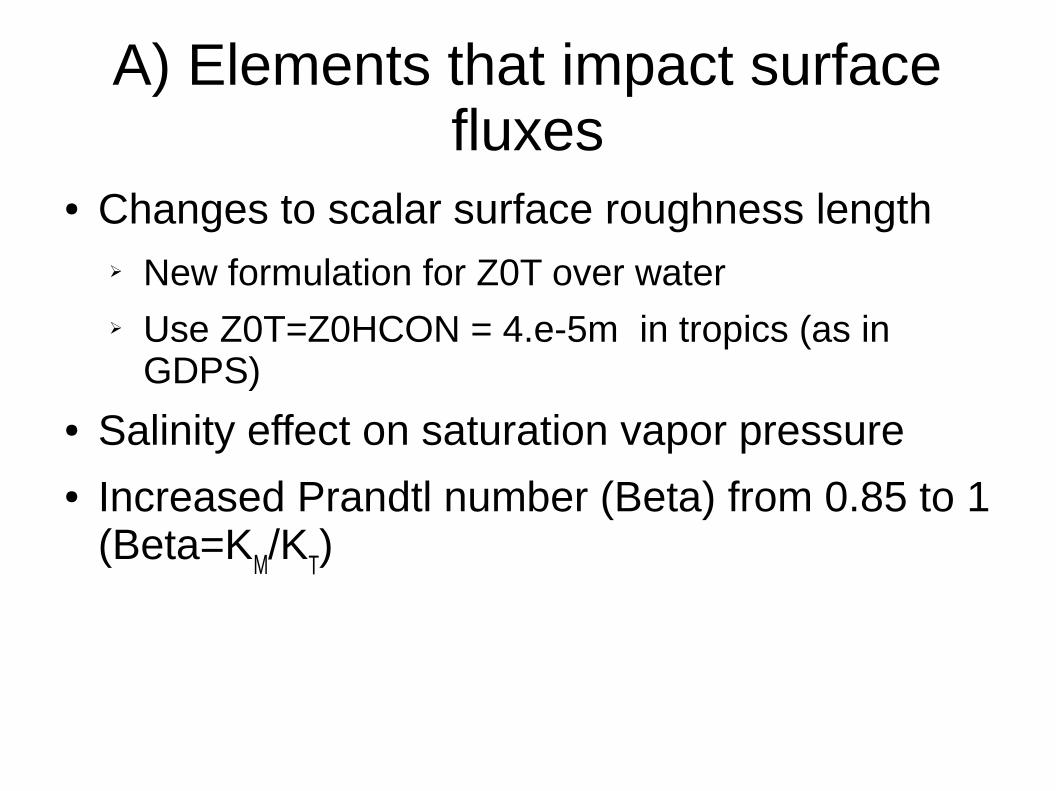
A) Elements that impact surface fluxes
● Changes to scalar surface roughness length➢ New formulation for Z0T over water➢ Use Z0T=Z0HCON = 4.e-5m in tropics (as in
GDPS)
● Salinity effect on saturation vapor pressure● Increased Prandtl number (Beta) from 0.85 to 1
(Beta=KM/KT)
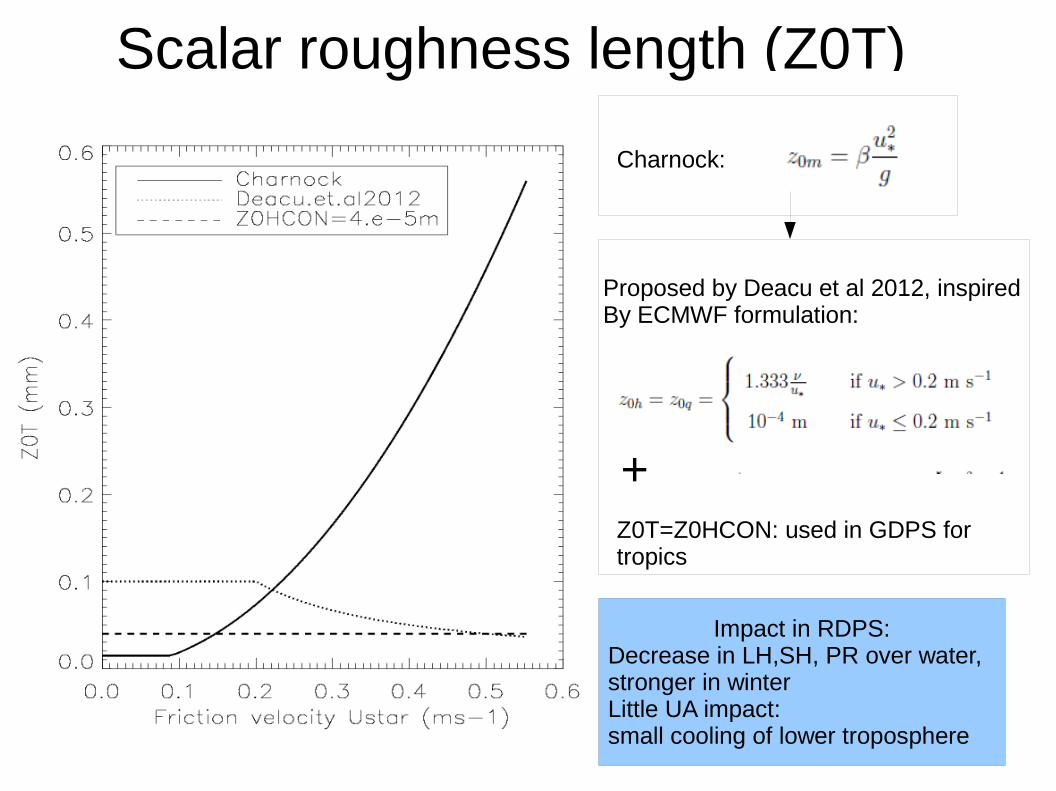
Scalar roughness length (Z0T)
Charnock:
Proposed by Deacu et al 2012, inspired By ECMWF formulation:
Z0T=Z0HCON: used in GDPS for tropics
Impact in RDPS:Decrease in LH,SH, PR over water,stronger in winterLittle UA impact:small cooling of lower troposphere
+
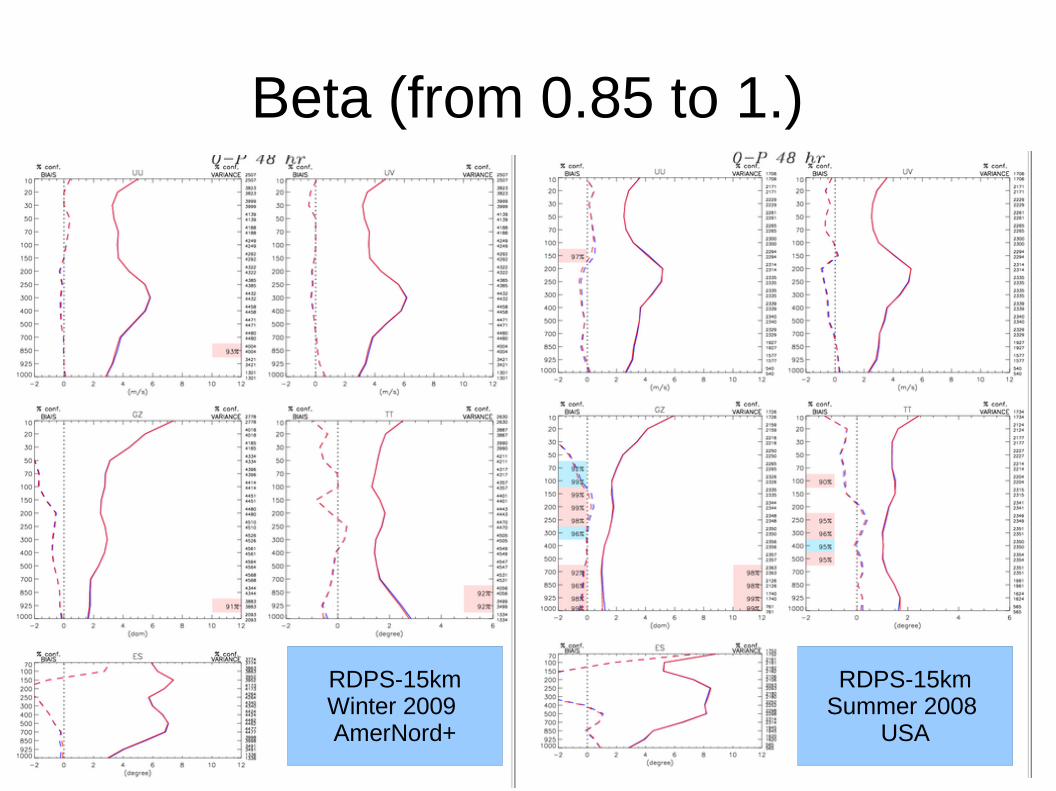
Beta (from 0.85 to 1.)
RDPS-15kmWinter 2009 AmerNord+
RDPS-15kmSummer 2008
USA
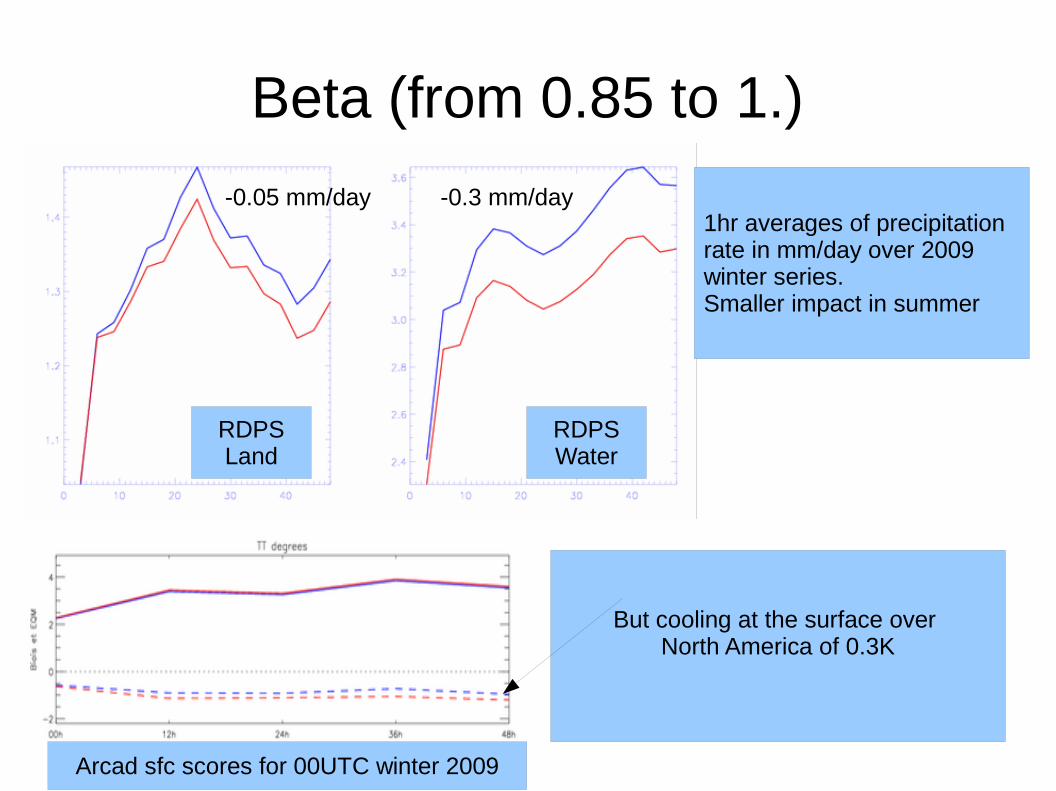
Beta (from 0.85 to 1.)
RDPSLand
RDPSWater
1hr averages of precipitation rate in mm/day over 2009 winter series.Smaller impact in summer
-0.05 mm/day -0.3 mm/day
But cooling at the surface over North America of 0.3K
Arcad sfc scores for 00UTC winter 2009
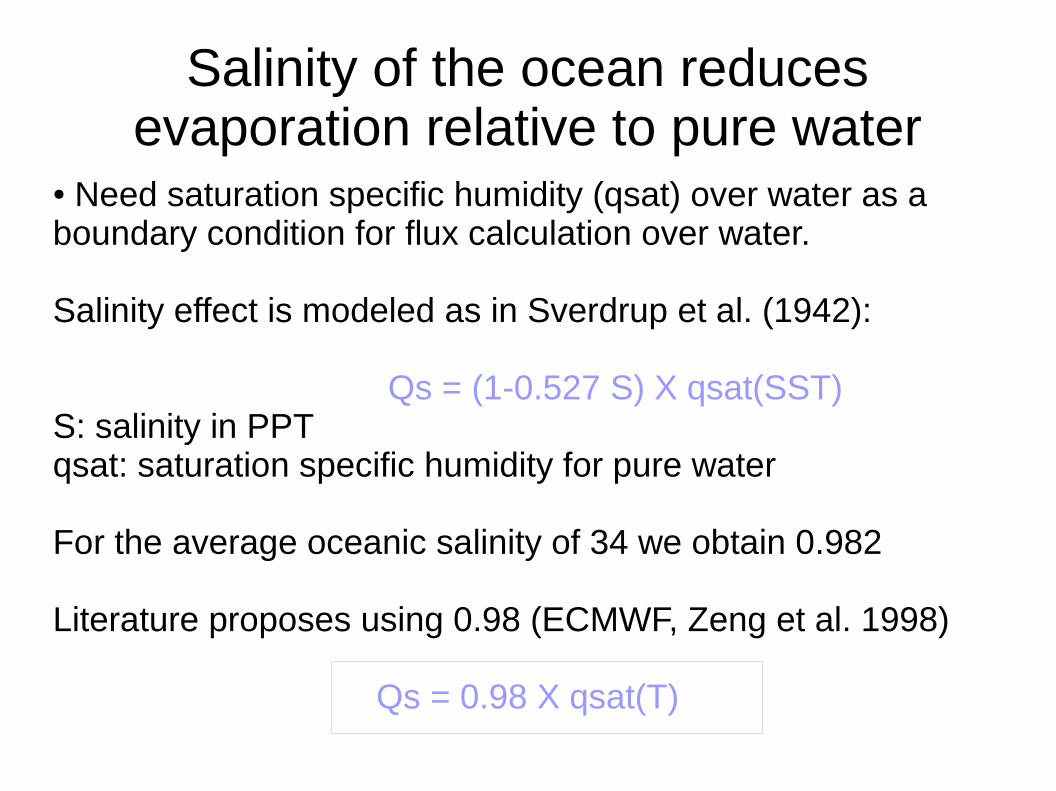
Salinity of the ocean reduces evaporation relative to pure water
● Need saturation specific humidity (qsat) over water as a boundary condition for flux calculation over water.
Salinity effect is modeled as in Sverdrup et al. (1942):
Qs = (1-0.527 S) X qsat(SST) S: salinity in PPT qsat: saturation specific humidity for pure water
For the average oceanic salinity of 34 we obtain 0.982
Literature proposes using 0.98 (ECMWF, Zeng et al. 1998)
Qs = 0.98 X qsat(T)
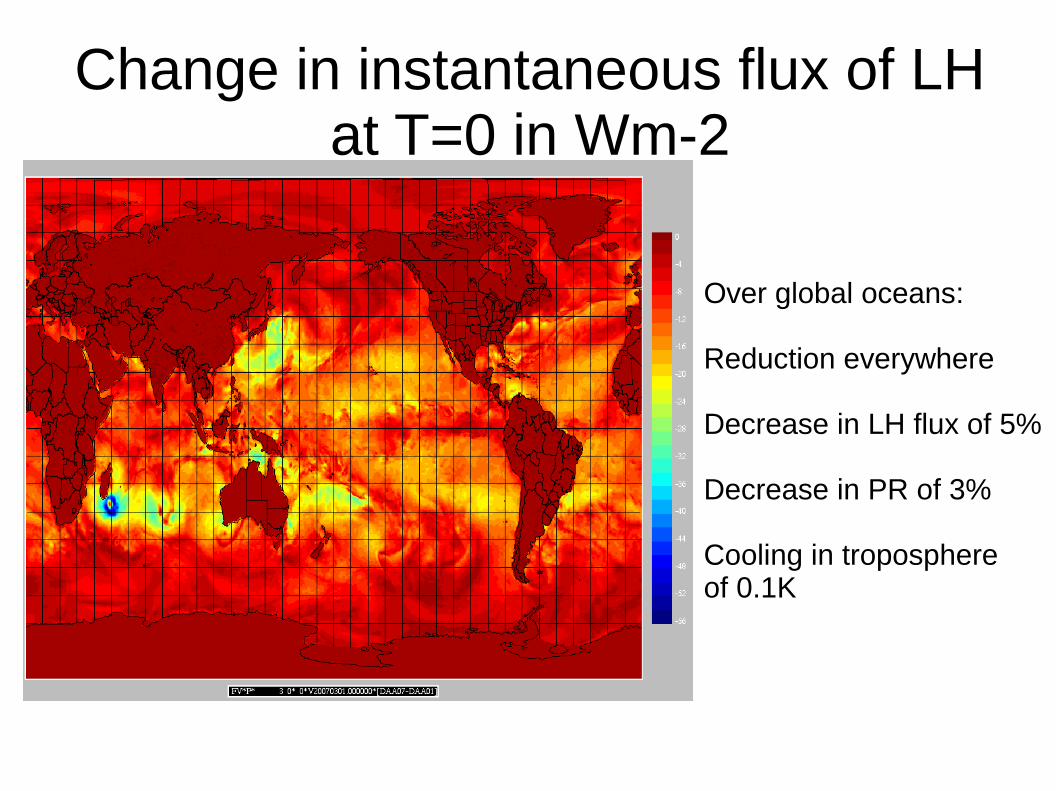
Change in instantaneous flux of LH at T=0 in Wm-2
Over global oceans:
Reduction everywhere
Decrease in LH flux of 5% Decrease in PR of 3%
Cooling in troposphere of 0.1K
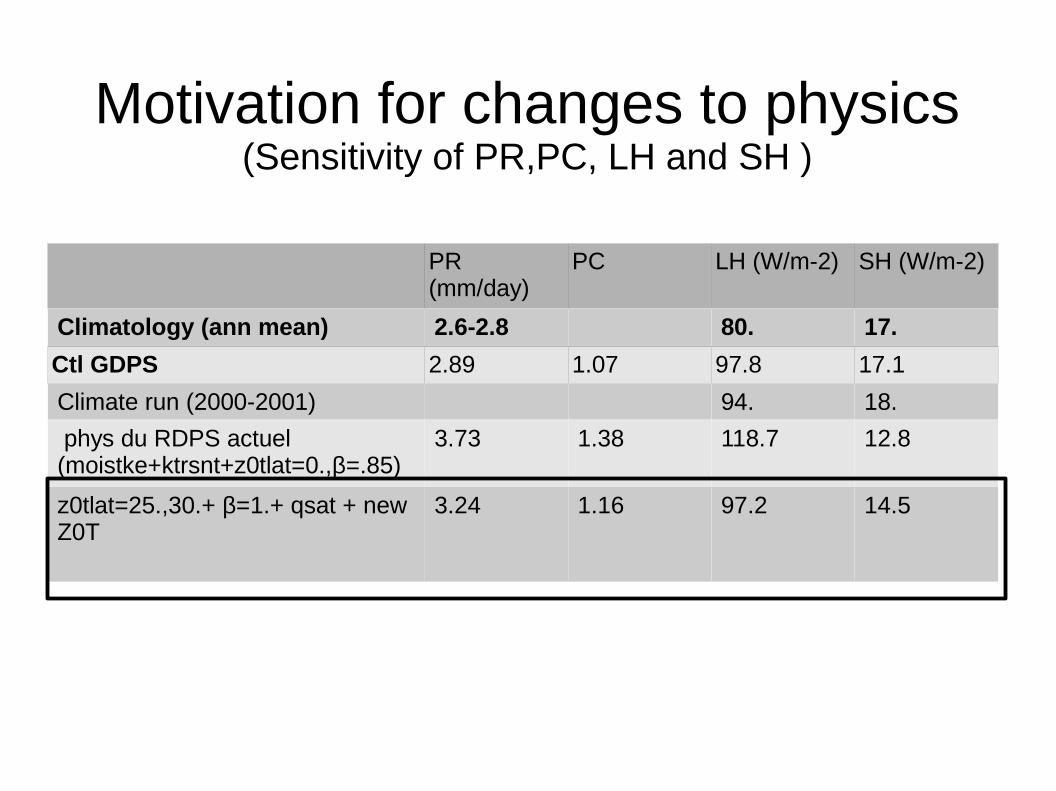
PR (mm/day)
PC LH (W/m-2) SH (W/m-2)
Climatology (ann mean) 2.6-2.8 80. 17.
Ctl GDPS 2.89 1.07 97.8 17.1
Climate run (2000-2001) 94. 18.
phys du RDPS actuel(moistke+ktrsnt+z0tlat=0.,β=.85)
3.73 1.38 118.7 12.8
z0tlat=25.,30.+ β=1.+ qsat + new Z0T
3.24 1.16 97.2 14.5
Motivation for changes to physics(Sensitivity of PR,PC, LH and SH )
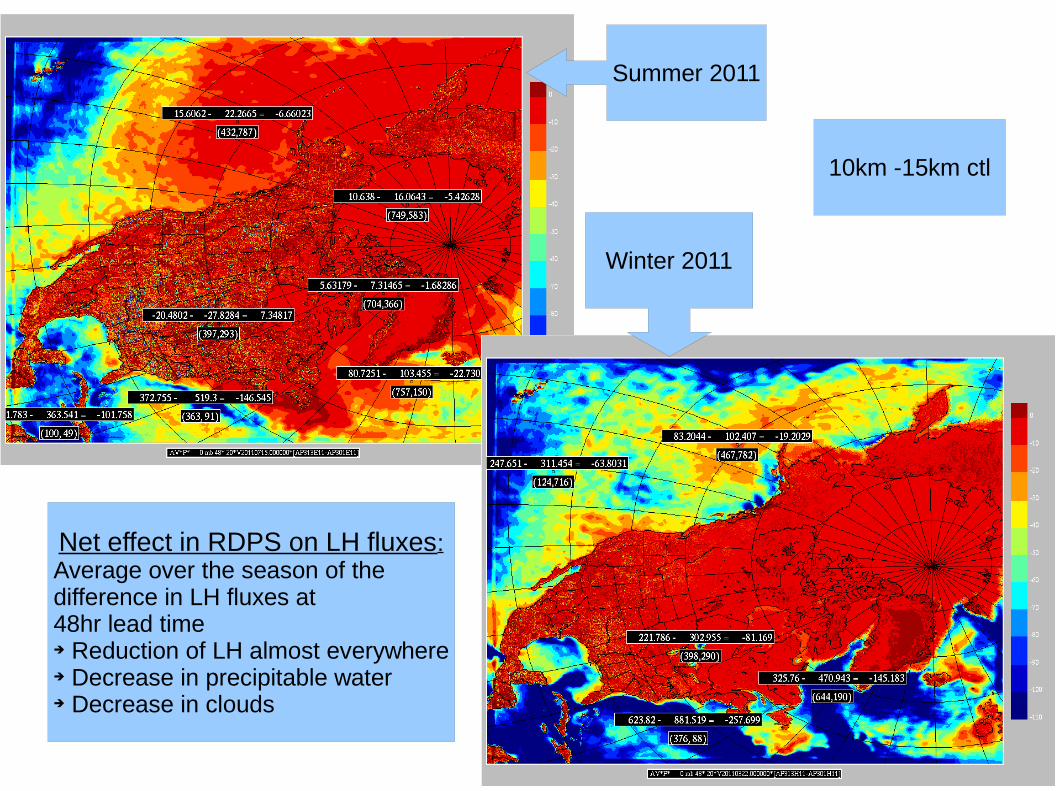
Net effect in RDPS on LH fluxes:Average over the season of the difference in LH fluxes at 48hr lead time ➔ Reduction of LH almost everywhere➔ Decrease in precipitable water➔ Decrease in clouds
Winter 2011
Summer 2011
10km -15km ctl
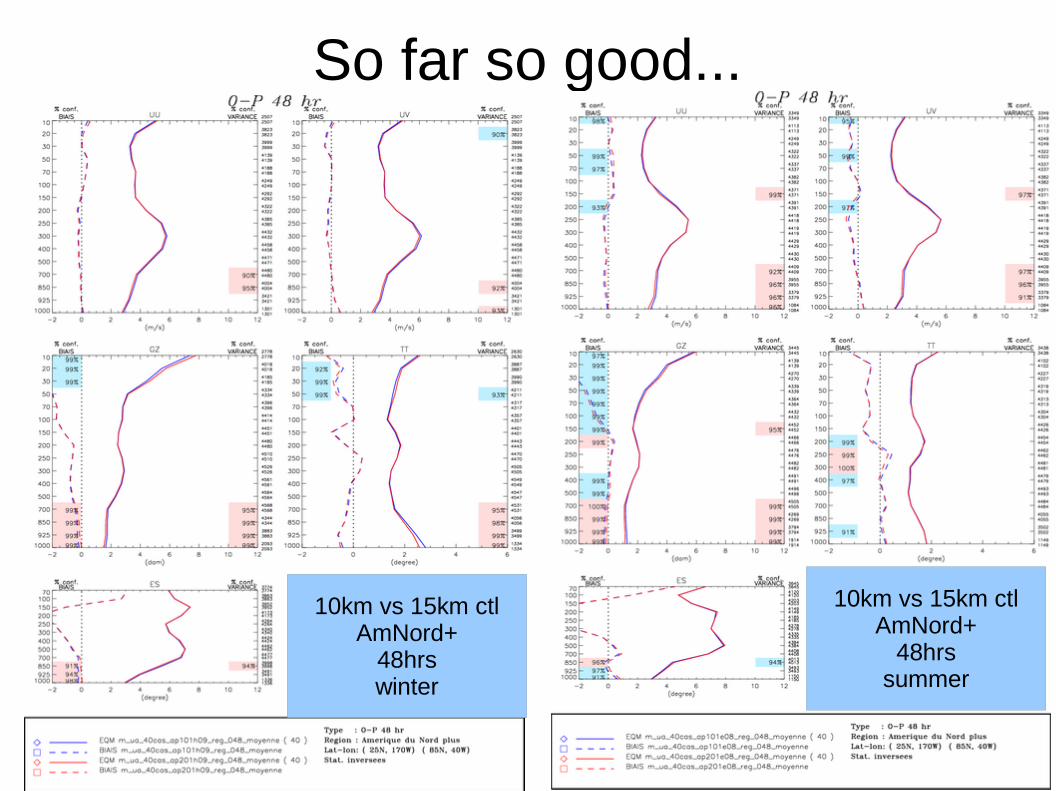
So far so good...
10km vs 15km ctlAmNord+
48hrswinter
10km vs 15km ctlAmNord+
48hrssummer
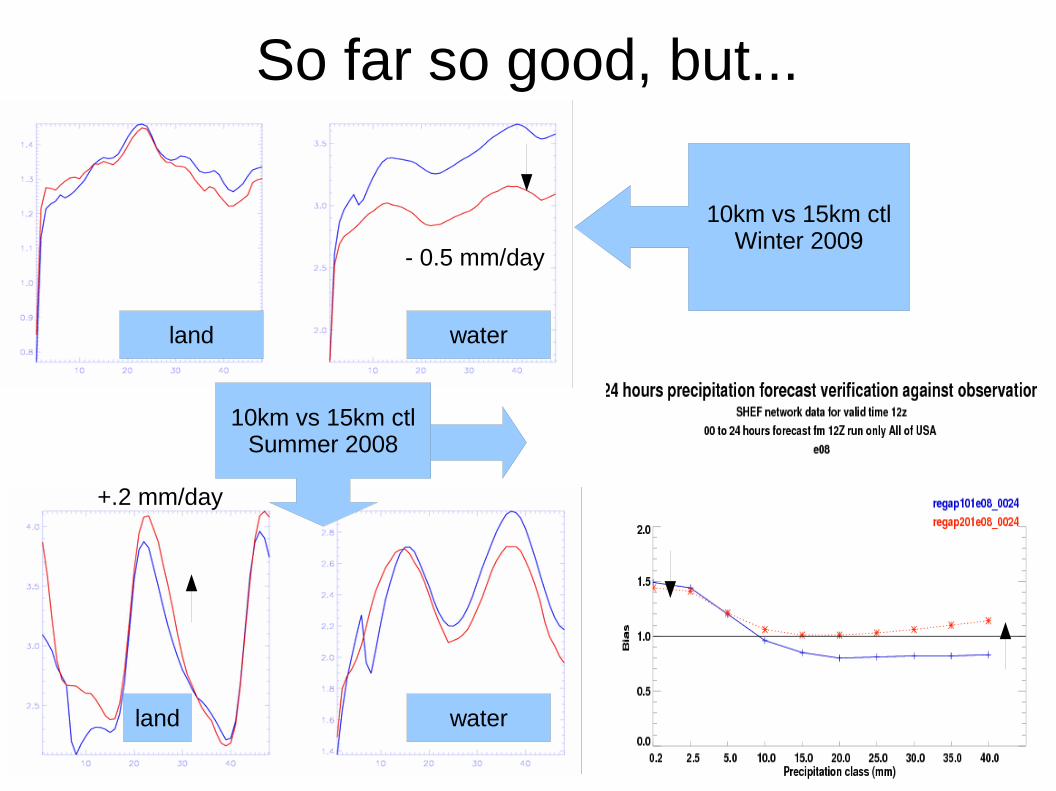
So far so good, but...
10km vs 15km ctlWinter 2009
10km vs 15km ctlSummer 2008
land water
land water
- 0.5 mm/day
+.2 mm/day
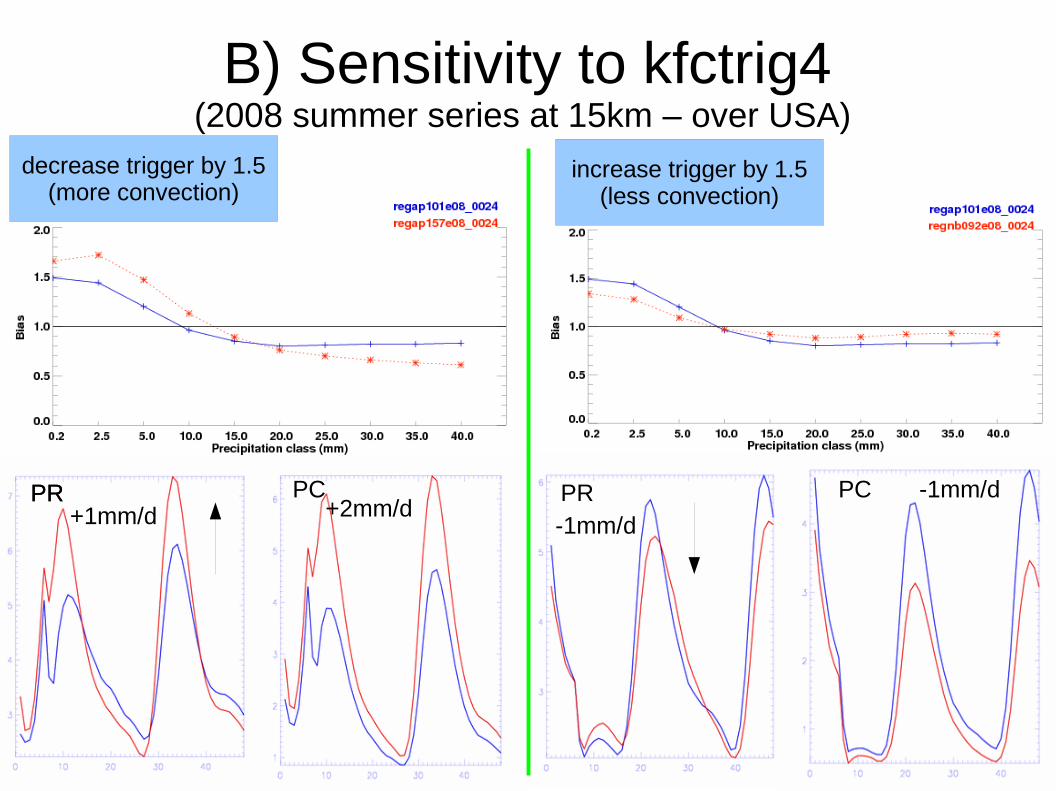
B) Sensitivity to kfctrig4(2008 summer series at 15km – over USA)
decrease trigger by 1.5(more convection)
increase trigger by 1.5(less convection)
PRPR PCPRPC+1mm/d
-1mm/d
-1mm/d+2mm/d
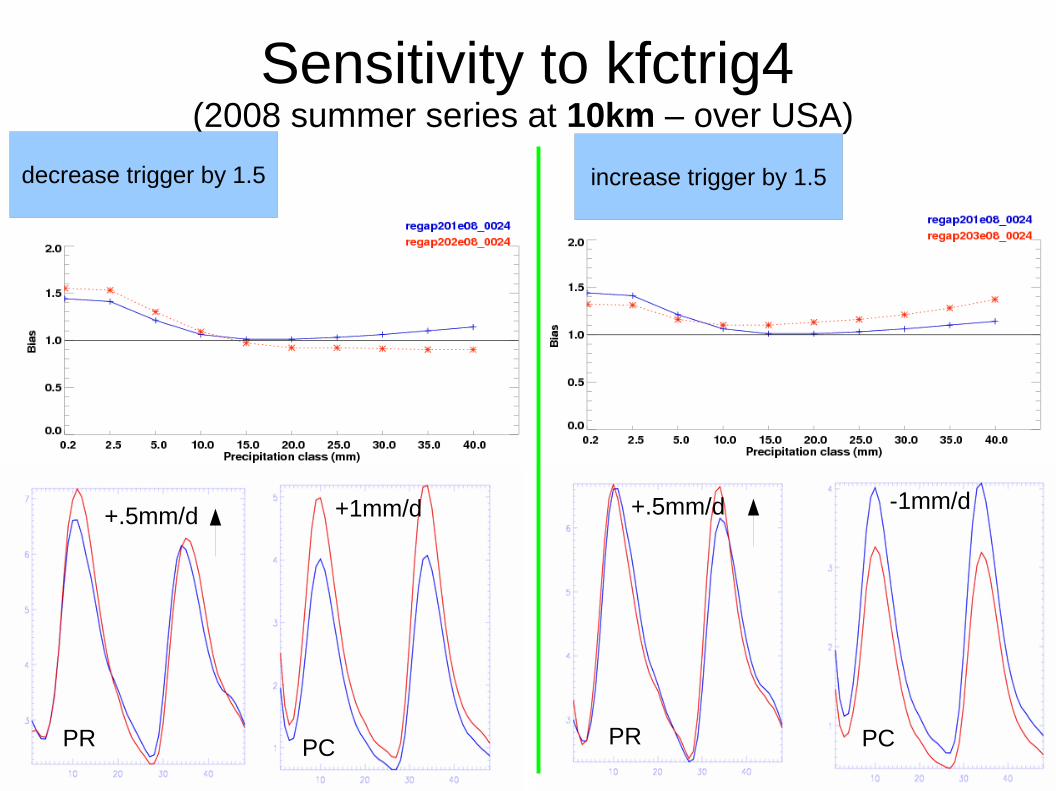
Sensitivity to kfctrig4(2008 summer series at 10km – over USA)
decrease trigger by 1.5 increase trigger by 1.5
PR PCPRPC
+.5mm/d +1mm/d -1mm/d+.5mm/d
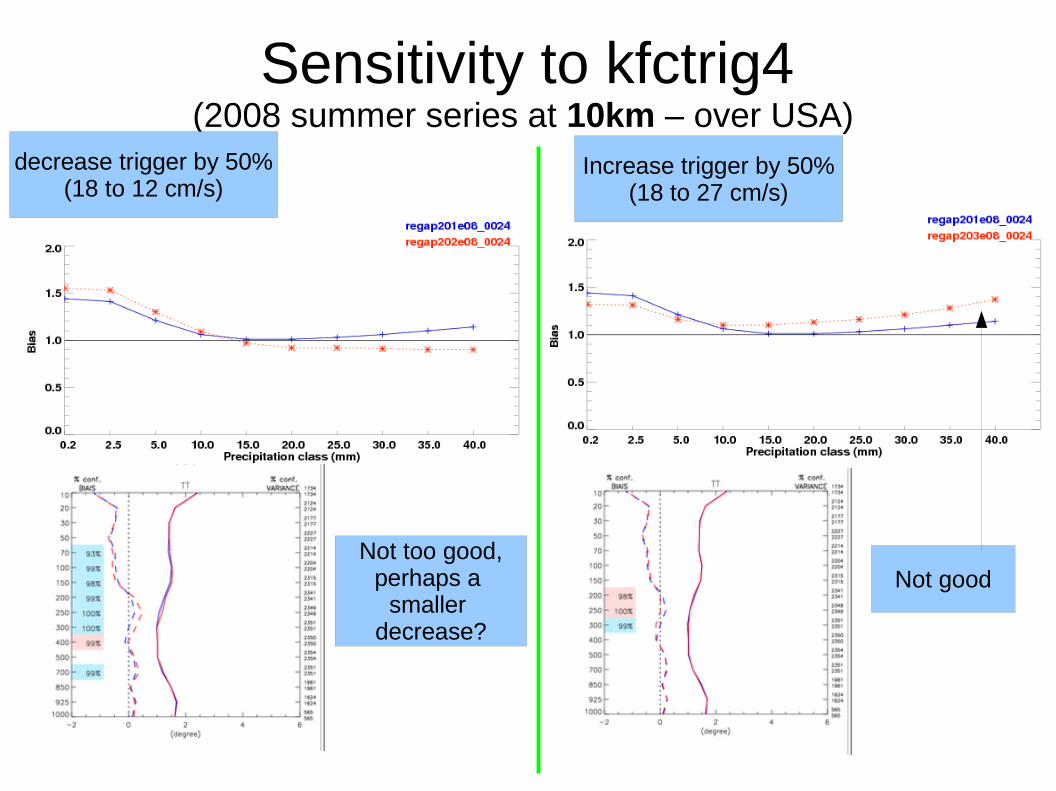
Sensitivity to kfctrig4(2008 summer series at 10km – over USA)
decrease trigger by 50%(18 to 12 cm/s)
Increase trigger by 50%(18 to 27 cm/s)
Not too good,perhaps a
smaller decrease?
Not good
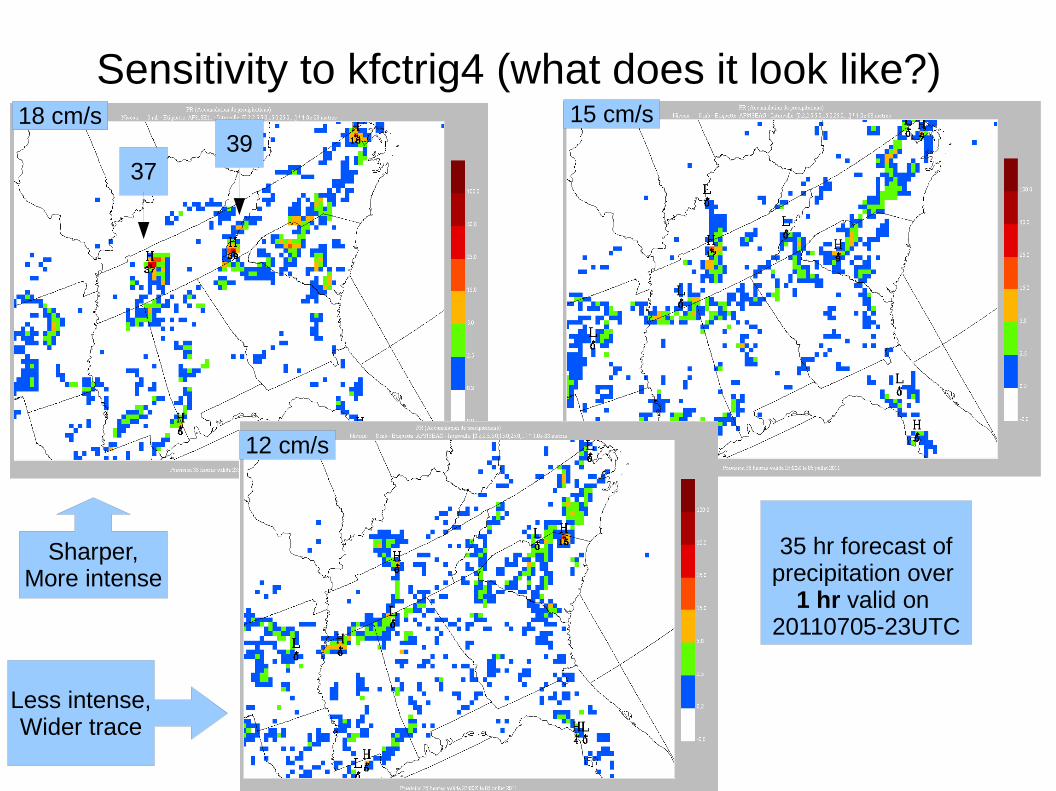
Sensitivity to kfctrig4 (what does it look like?) 18 cm/s 15 cm/s
12 cm/s
35 hr forecast ofprecipitation over
1 hr valid on 20110705-23UTC
Sharper,More intense
Less intense,Wider trace
3739
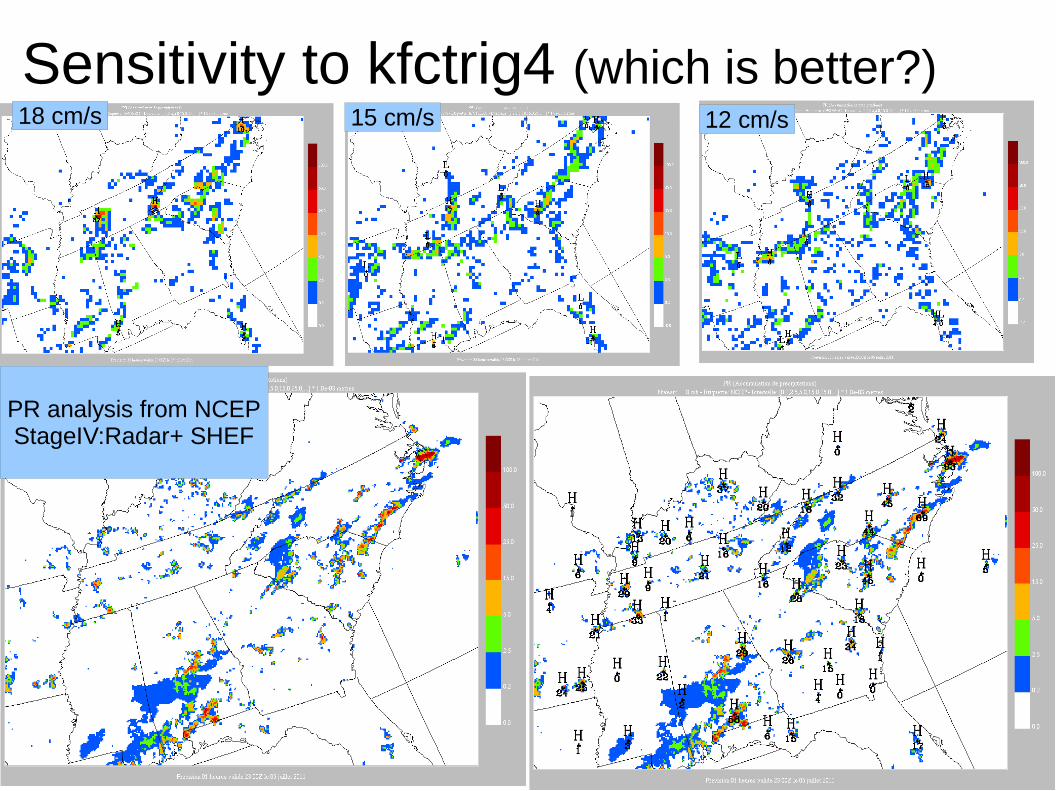
Sensitivity to kfctrig4 (which is better?) 18 cm/s 15 cm/s 12 cm/s
PR analysis from NCEPStageIV:Radar+ SHEF
Conclusions to sensitivity to kfctrig4
Results (UA and PR) are less sensitive at higher resolution Smaller impact on total precipitation, but... Still an impact on PDF of precipitation:
➔ Higher thresholds increases the intensity➔ Lower thresholds increases the trace
A somewhat subjective choice must be made between improving the trace and minimizing the number of very intense events. A threshold of kfctrig=15cm/s is used for final series . All other series use 18cm/s
C) Nouvelle climatologie d’épaisseur de glace de mer (I8) + limsnodp=10cm +leadfrac=2%
Nouveau I8 est une combinaison de:Nouveau I8 est une combinaison de:
● réanalyses Glorys1v1* 2002-2008 (points de mer)réanalyses Glorys1v1* 2002-2008 (points de mer)
● climatologie actuelle I8 (points de terre et eau douce)climatologie actuelle I8 (points de terre et eau douce)
● Sur le Golfe du St-Laurent: climatologie 2006-2011 Sur le Golfe du St-Laurent: climatologie 2006-2011
provenant du cycle de la pseudo-analyse provenant du cycle de la pseudo-analyse
Glorys1v1: Global Ocean Reanalysis and Simulations ProjectGlobal Ocean Reanalysis and Simulations Project Voir seminaire RPN de L. Parent du 4 decembre 2008
J.-F. LemieuxG. SmithF.Roy,F. Dupont
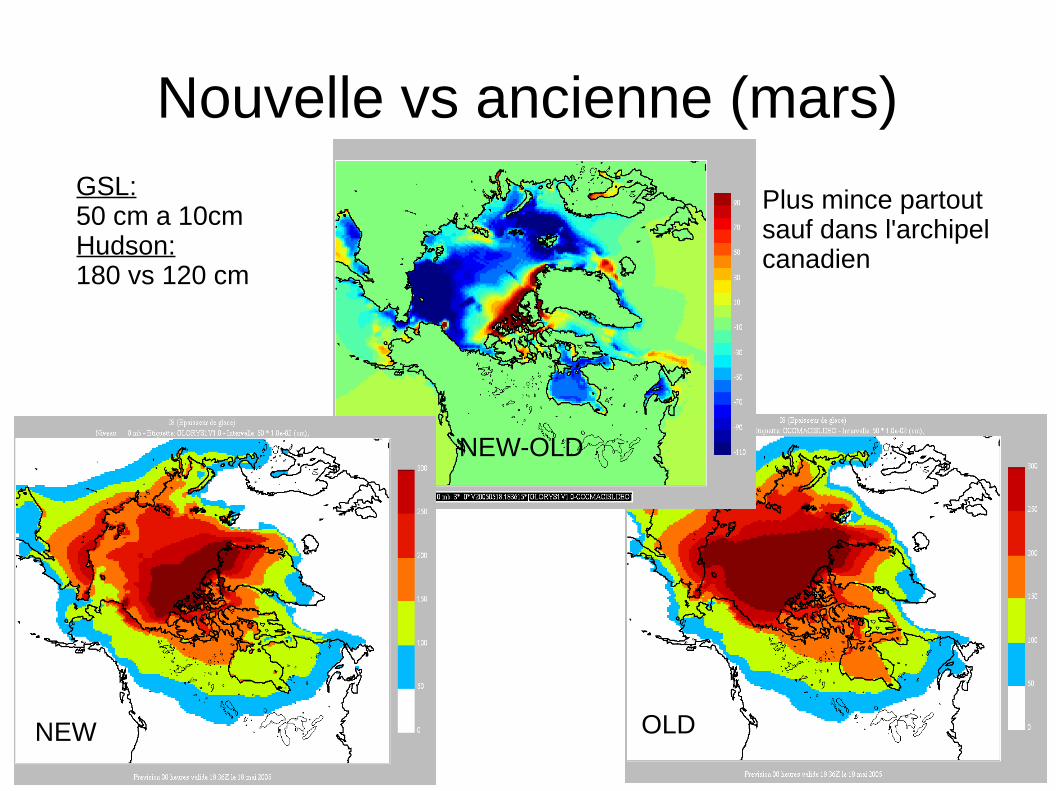
Nouvelle vs ancienne (mars)
NEW OLD
NEW-OLD
Plus mince partoutsauf dans l'archipelcanadien
GSL: 50 cm a 10cmHudson: 180 vs 120 cm
D) Proposed Changes to Vertical Diffusion in the RDPS/GDPS
Ron McTaggart-Cowan, Ayrton Zadra
Modified the criteria for the transition from production toDestruction (and vice-versa) of TKE Becomes a function of the history of the flow.
These changes will be described in detail in Ron and Ayrton's seminars in the next weeks.
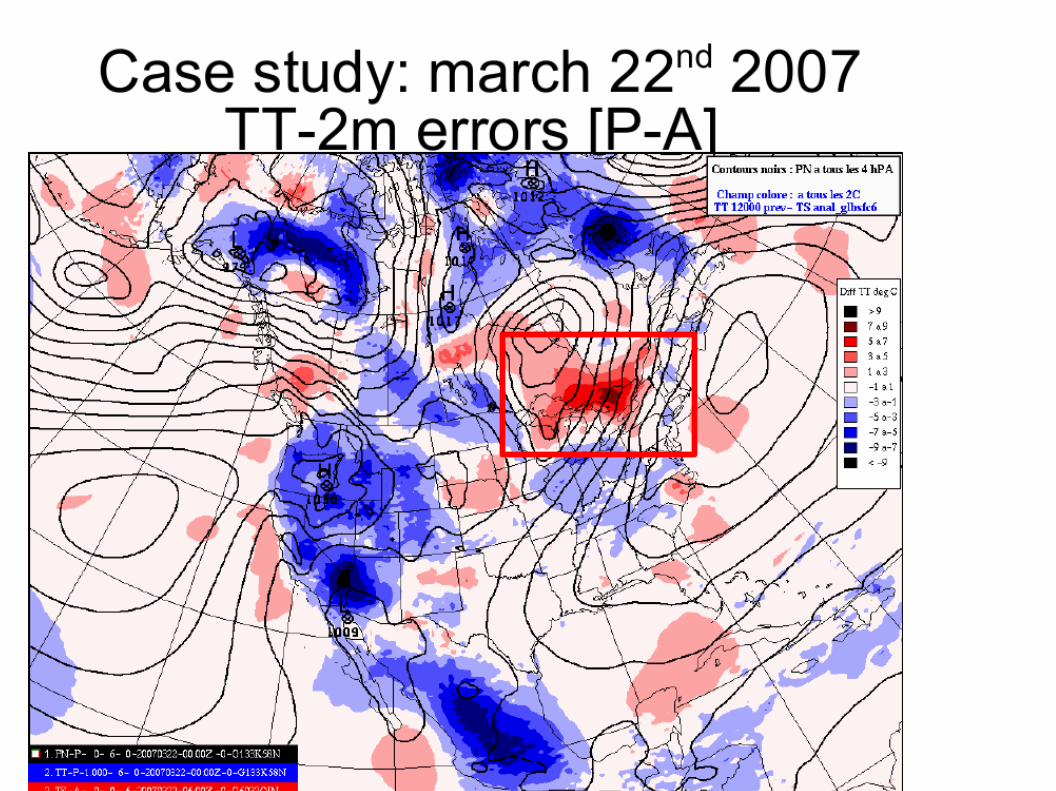
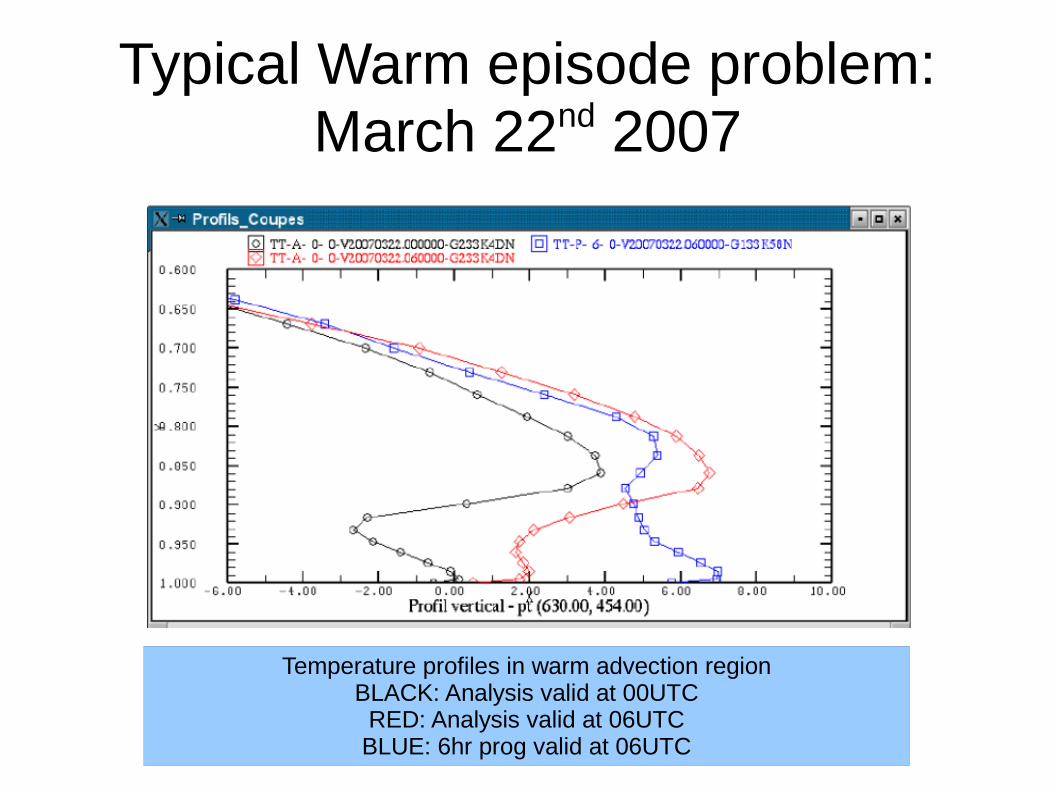
Typical Warm episode problem:March 22nd 2007
Temperature profiles in warm advection regionBLACK: Analysis valid at 00UTC
RED: Analysis valid at 06UTCBLUE: 6hr prog valid at 06UTC
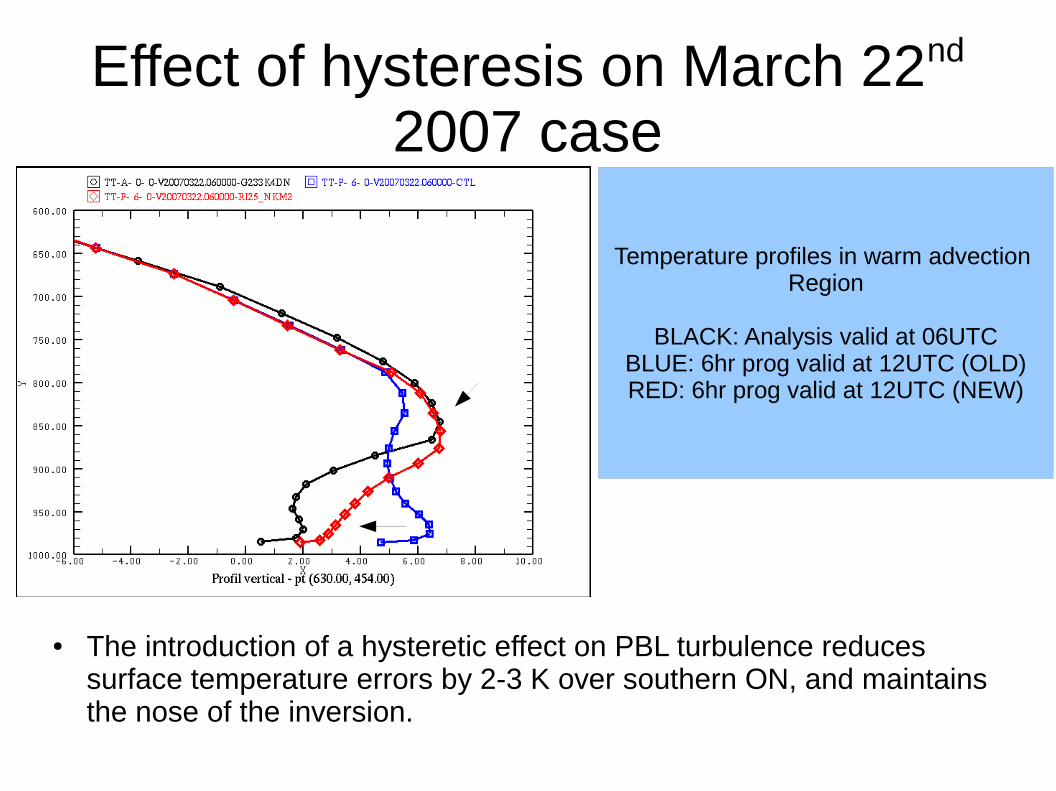
Effect of hysteresis on March 22nd 2007 case
● The introduction of a hysteretic effect on PBL turbulence reduces surface temperature errors by 2-3 K over southern ON, and maintains the nose of the inversion.
Temperature profiles in warm advection Region
BLACK: Analysis valid at 06UTCBLUE: 6hr prog valid at 12UTC (OLD)RED: 6hr prog valid at 12UTC (NEW)
Evaluation of hysteresis effect
● Winter and summer RDPS series show little UA impact, but a small cooling of surface in winter. More impact in medium range forecasts of GDPS.
● Alain P. runs the new 10km model (3dvar) with the hysteresis code on a daily basis since Jan. 10 2012.
● A&P have written more than 10 GFX on cases of warm episodes or freezing rain or... underlining significant differences (generally improvements) with OPS
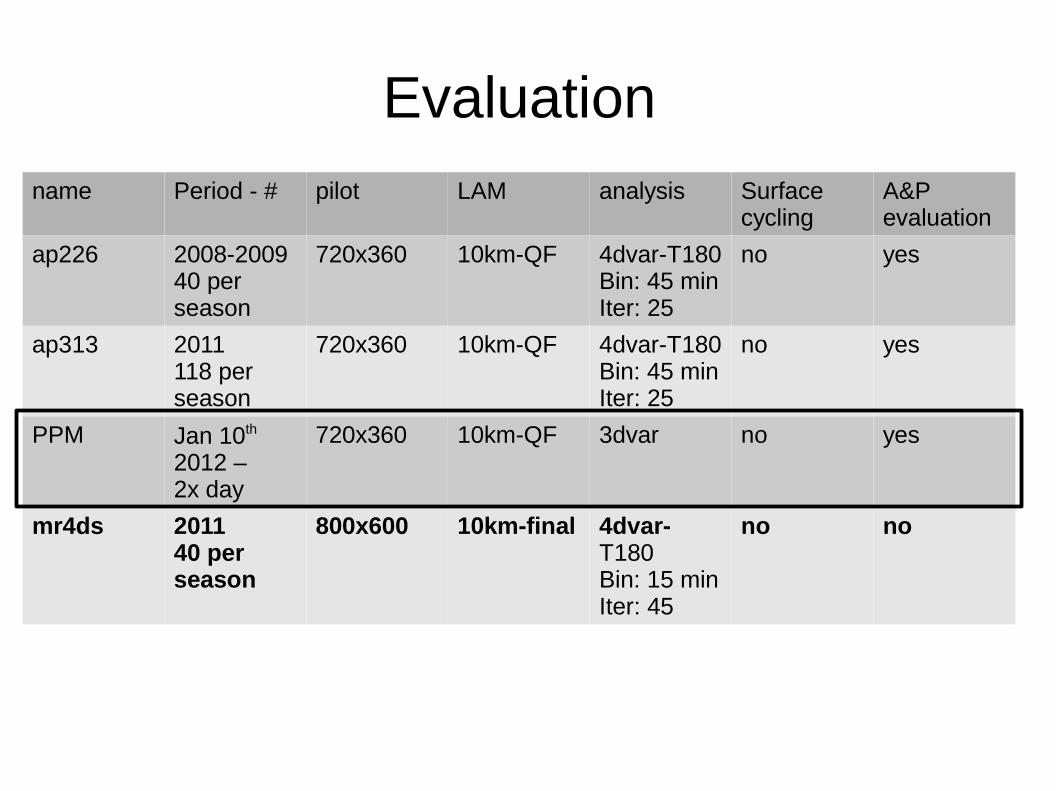
Evaluation name Period - # pilot LAM analysis Surface
cyclingA&P evaluation
ap226 2008-200940 per season
720x360 10km-QF 4dvar-T180Bin: 45 minIter: 25
no yes
ap313 2011118 per season
720x360 10km-QF 4dvar-T180Bin: 45 minIter: 25
no yes
PPM Jan 10th 2012 –2x day
720x360 10km-QF 3dvar no yes
mr4ds 201140 per season
800x600 10km-final 4dvar-T180Bin: 15 minIter: 45
no no
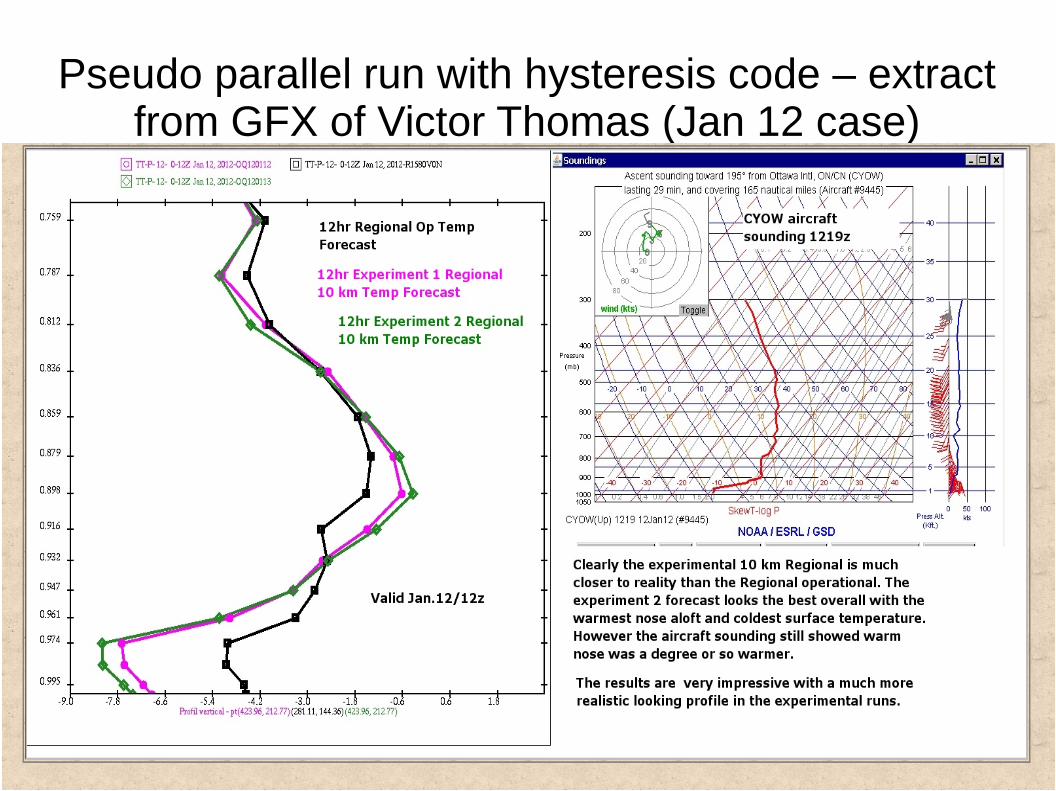
Pseudo parallel run with hysteresis code – extract from GFX of Victor Thomas (Jan 12 case)

Pseudo parallel run with hysteresis code – extract from GFX of Victor Thomas (Jan 12 case)
FZRA Cases – PPM03(GFX of Charles Creese)
4 cases of FZRA over Western QC/Eastern ON were examined:
● Jan. 17● Jan. 23● Jan. 27● Feb. 1
(all 2012)
Conclusions from these 4 cases
● PPM03 generally a big improvement over the operational RDPS for low level temperatures ahead of warm fronts, and in some cases solved the problem completely
● Improvement could also be seen on the cold side of a US midwest cold front
● The down side: failed to correct fronts which were forecast too far north (and occasionally made this positioning problem worse)
● Occasionally missed low level inversions over Arctic marine areas and over the MB lakes (see GFX)
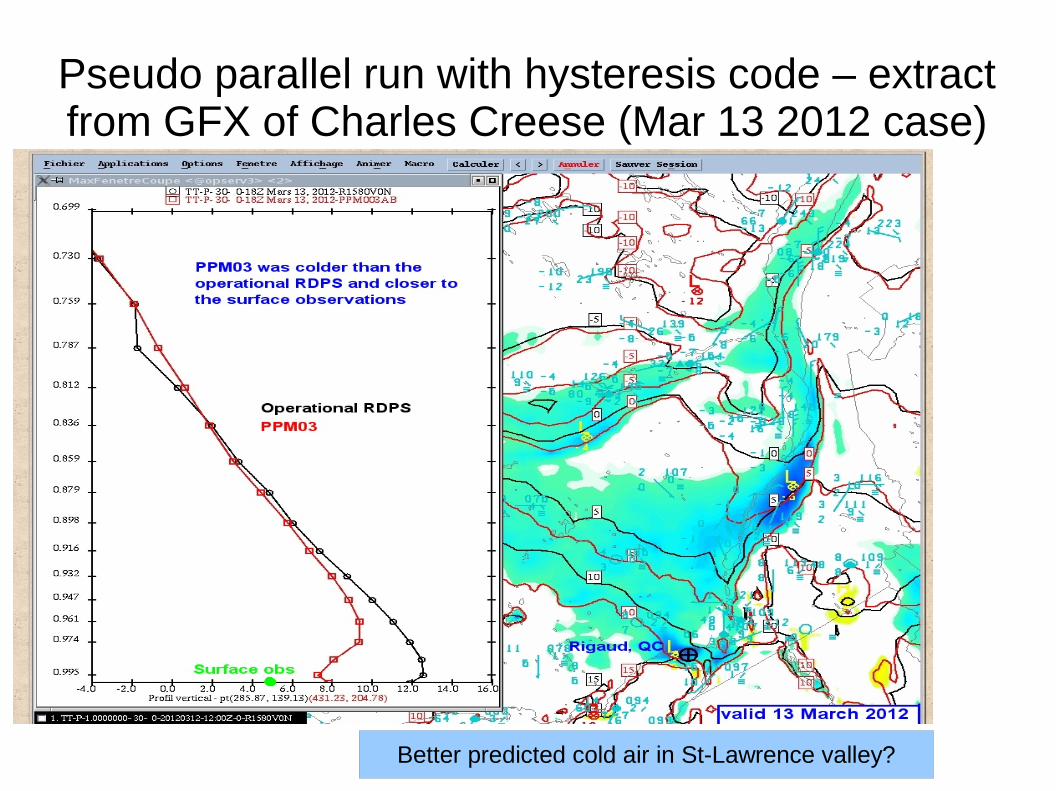
Pseudo parallel run with hysteresis code – extract from GFX of Charles Creese (Mar 13 2012 case)
Better predicted cold air in St-Lawrence valley?
Le système d’analyse Regional- 4D-Var
Luc Fillion1
Monique Tanguay1, Ervig Lapalme1, Mateusz Reszka2 , Judy St-James2 , Manon Lajoie2, Bin He1, Stephen Macpherson1, Paul Vaillancourt1 , Alain Patoine2, Cecilien Charette1
Seminaire InterneSalle des Vents, Dorval, Qc, Can Vendredi 23 Mars 2012, 10h30h-12h.
1 Meteorological Research Division2 Canadian Meteorological Center (Development)
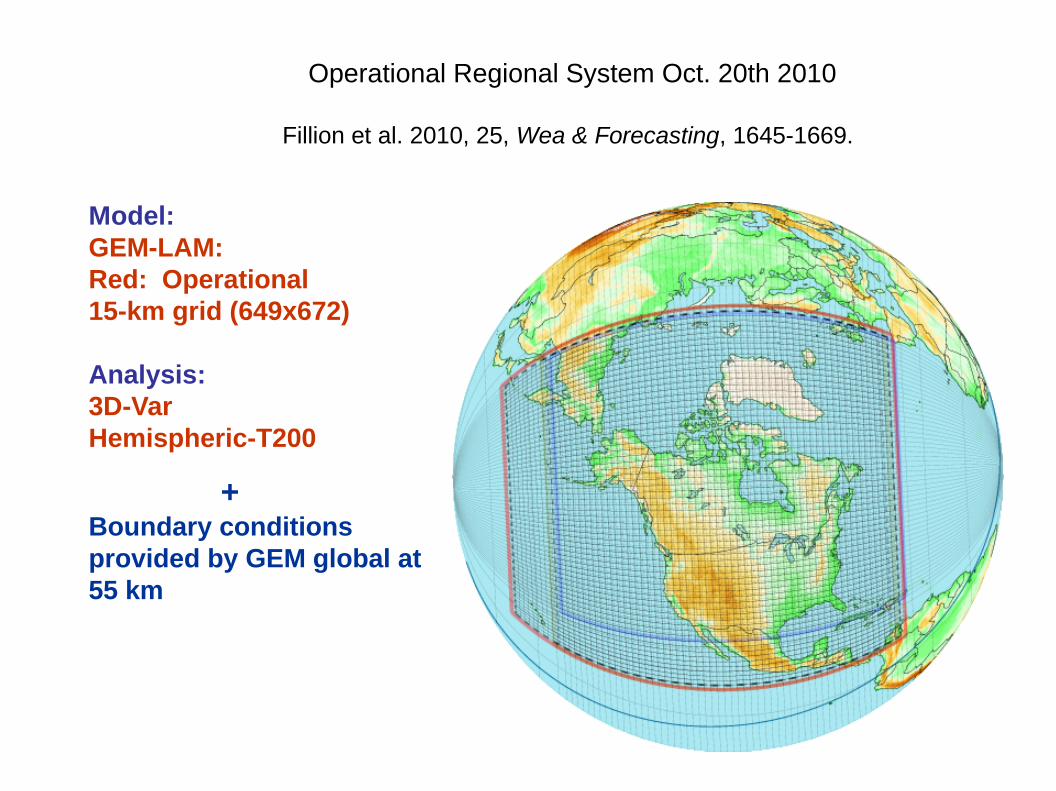
Model: GEM-LAM:Red: Operational 15-km grid (649x672)
Analysis:3D-Var Hemispheric-T200
+ Boundary conditions provided by GEM global at 55 km
Operational Regional System Oct. 20th 2010
Fillion et al. 2010, 25, Wea & Forecasting, 1645-1669.
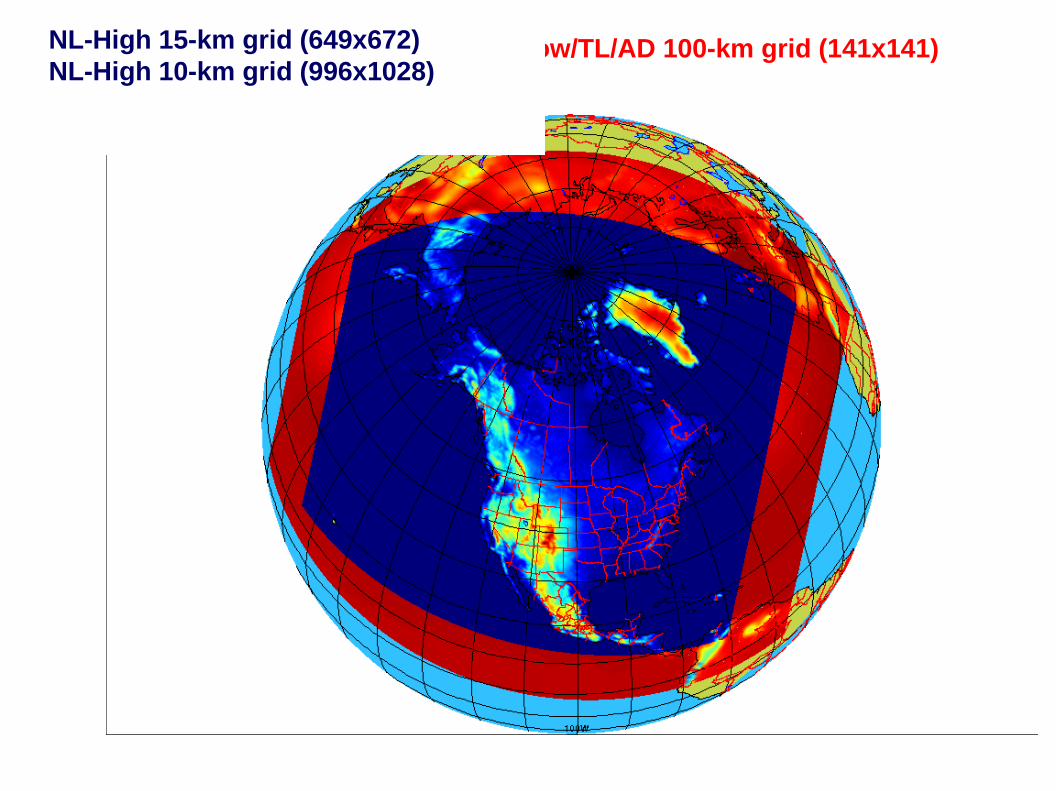
NL-Low/TL/AD 100-km grid (141x141)NL-High 15-km grid (649x672)NL-High 10-km grid (996x1028)
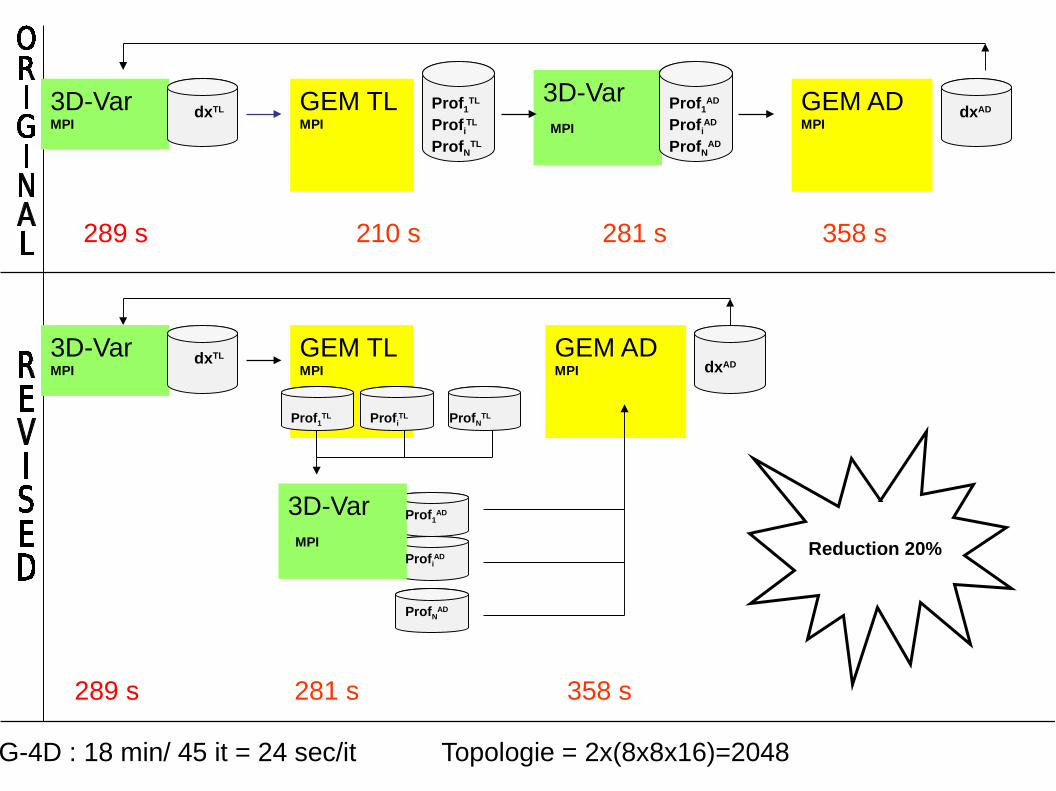
REG-4D : 18 min/ 45 it = 24 sec/it Topologie = 2x(8x8x16)=2048
210 s 358 s289 s 281 s
Reduction 20%
GEM TL MPI
Prof1TL
ProfiTL
ProfNTL
3D-VarMPI
dxTL3D-Var MPI
Prof1AD
ProfiAD
ProfNAD
GEM AD MPI
dxAD
GEM TL MPI
3D-VarMPI
dxTL
3D-Var MPI
GEM AD MPI dxAD
ProfiTL Prof1
TL ProfNTL
Prof1AD
ProfiAD
ProfNAD
289 s 281 s 358 s
Configuration REG-4D
• Mêmes types d’observations que Strato-2Br
• Thinning temporel au 15 min au lieu de 45 min (oper) - 4D pour le LAM - 3D pour le pilote (3D-Var)
• Filtre digital utilise seulement en mode prevision (i.e. pas dans l’analyse).
• Le TL-AD LAM est piloté par le champ d'essai pilote
• 45 itérations (1 boucle)

Observation counts – Winter 2011
2011012012
3D (like ops) 4D (10km final)
amsua 31131 127078 (+308%)
amsub 5252 10846 (+107%)
aircraft 10152 35669 (+251%)
goes 1257 4976 (+296%)
pr 686 4102 (+498%)
sfc 4774 4712
sw 2924 6156 (+111%)
ua 13836 13600
airs 30628 32438 (+6%)
ssmis 1490 1451
sc 2202 2712 (+23%)
gps-ro 2798 2739
iasi 8317 6502 (-22%)
Total 115447 252981 (+119%)
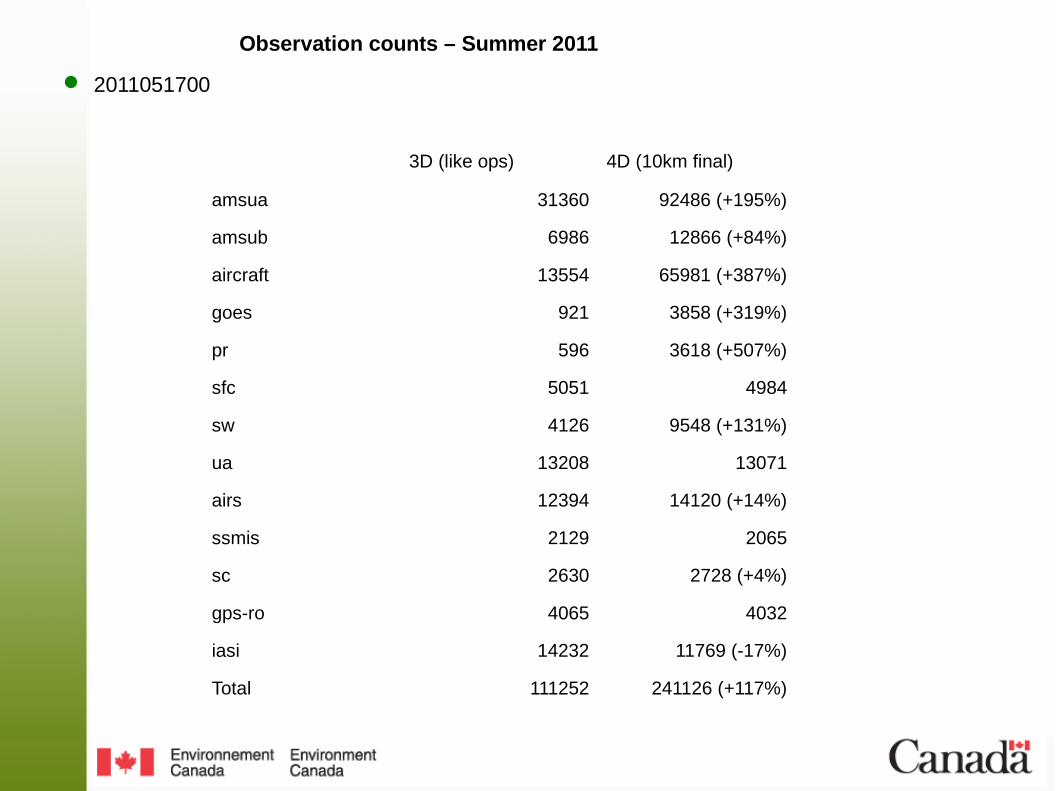
Observation counts – Summer 2011
2011051700
3D (like ops) 4D (10km final)
amsua 31360 92486 (+195%)
amsub 6986 12866 (+84%)
aircraft 13554 65981 (+387%)
goes 921 3858 (+319%)
pr 596 3618 (+507%)
sfc 5051 4984
sw 4126 9548 (+131%)
ua 13208 13071
airs 12394 14120 (+14%)
ssmis 2129 2065
sc 2630 2728 (+4%)
gps-ro 4065 4032
iasi 14232 11769 (-17%)
Total 111252 241126 (+117%)
Expériences 2008-2009
● 118 cas d'hiver▪ du 2009010100 au 2009022812, toutes les 12 heures
● 118 cas d'été
▪ du 2008070100 au 2008082812, toutes les 12 heures
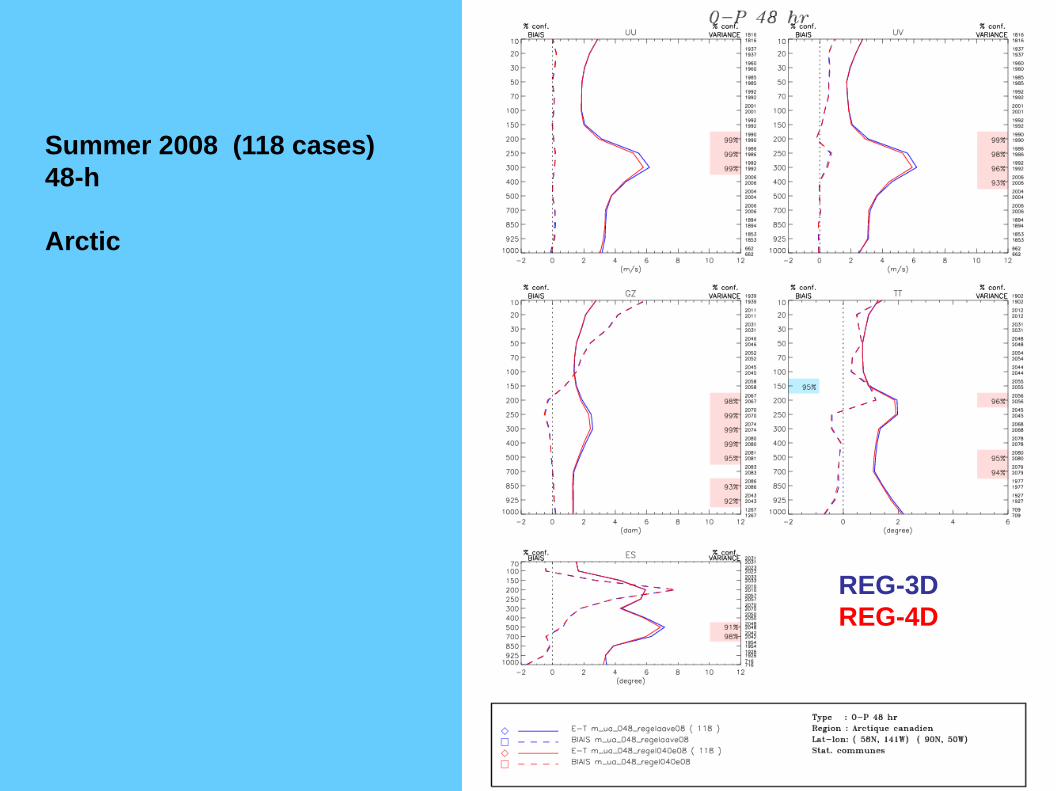
Summer 2008 (118 cases)48-h
Arctic
REG-3DREG-4D
48-h DIFF RMSE (m)GZ-500 hPa
Winter-2009
Blue: 4D-Var is better
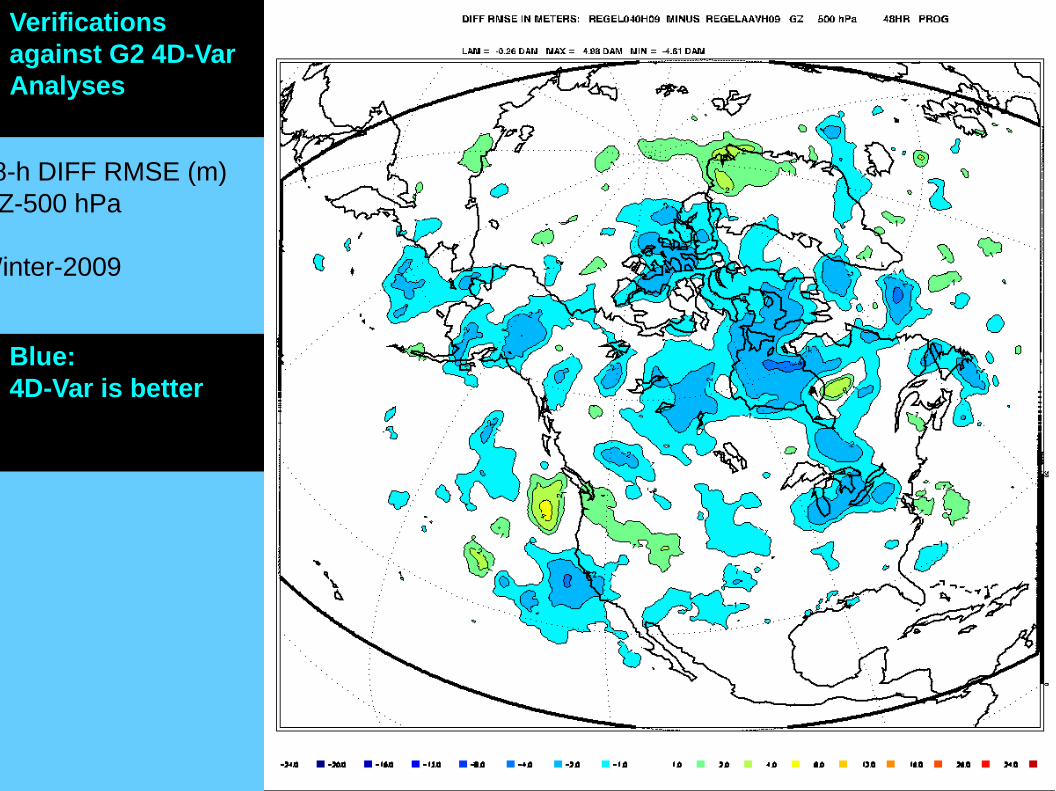
Verifications against G2 4D-Var Analyses
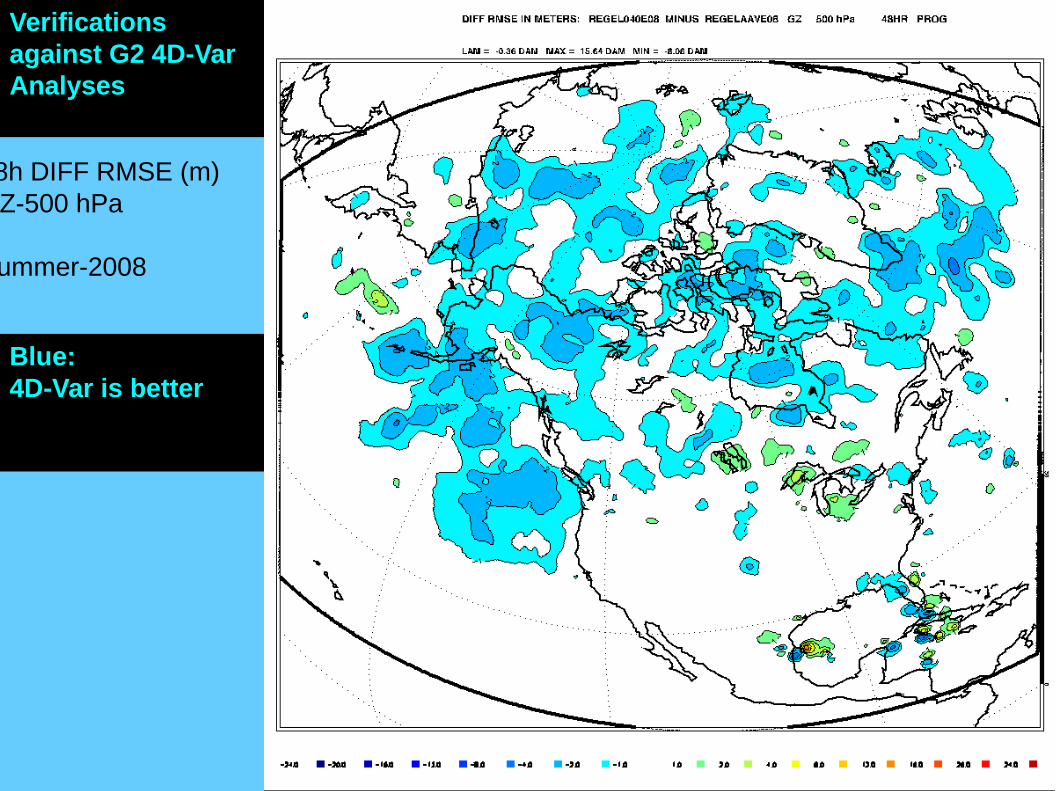
48h DIFF RMSE (m)GZ-500 hPa
Summer-2008
Blue: 4D-Var is better
Verifications against G2 4D-Var Analyses
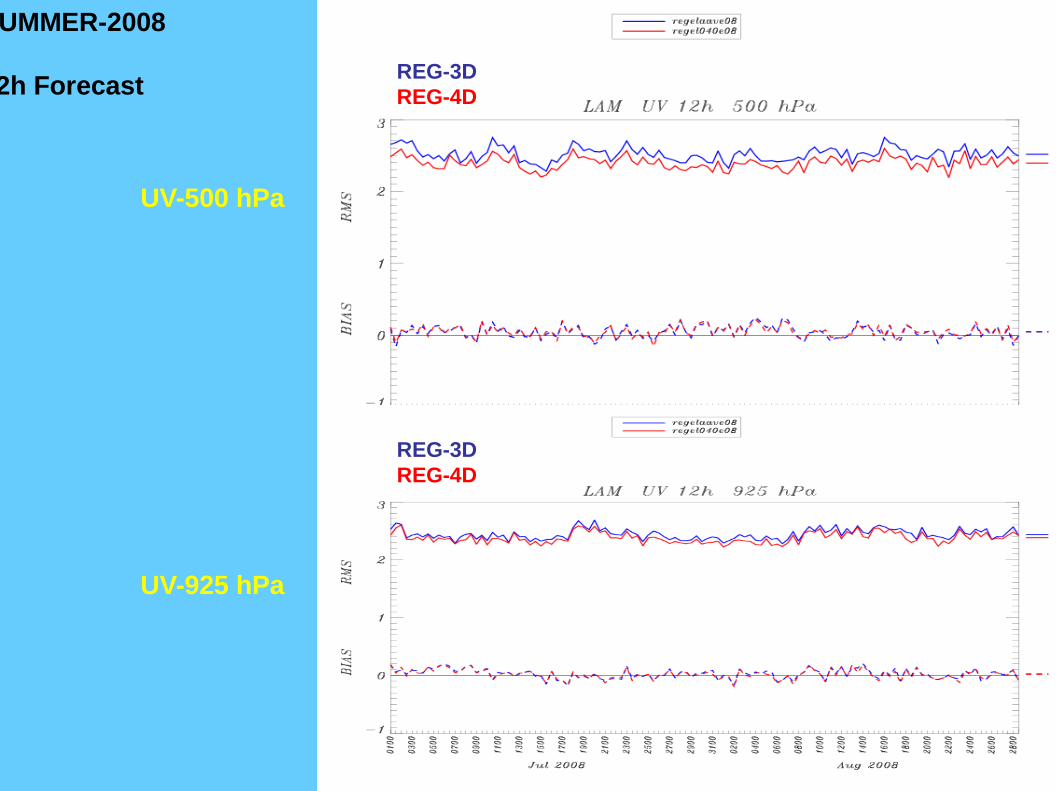
SUMMER-2008
12h Forecast
UV-500 hPa
UV-925 hPa
REG-3DREG-4D
REG-3DREG-4D
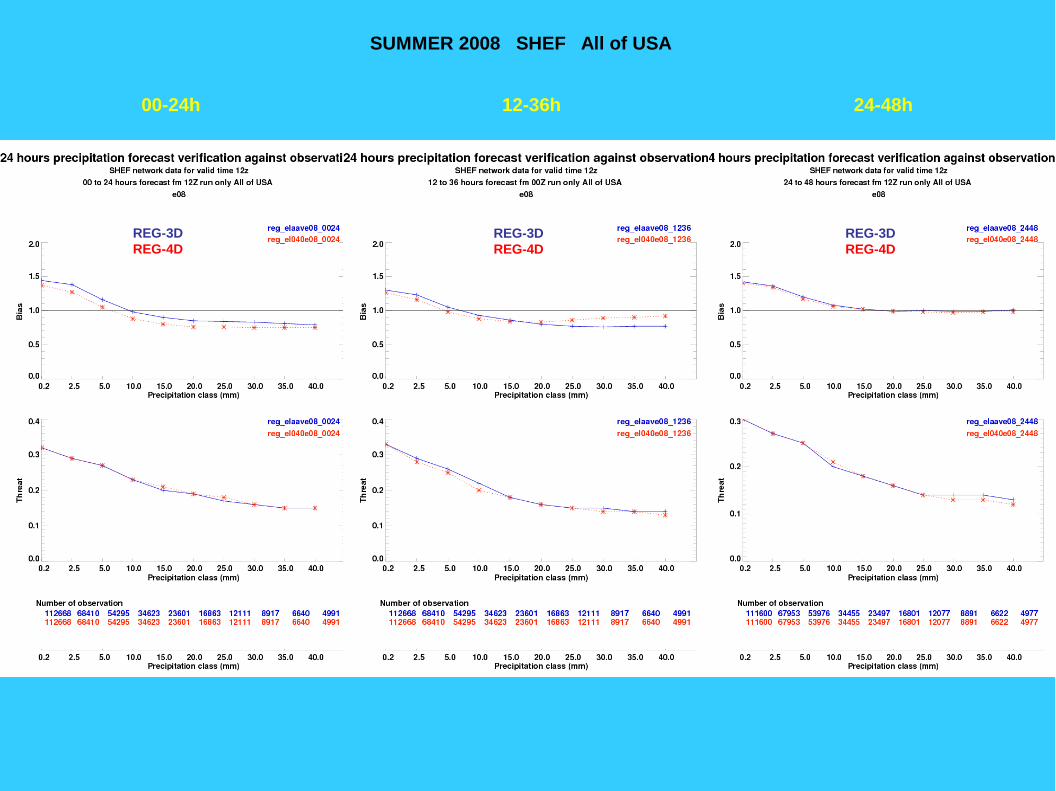
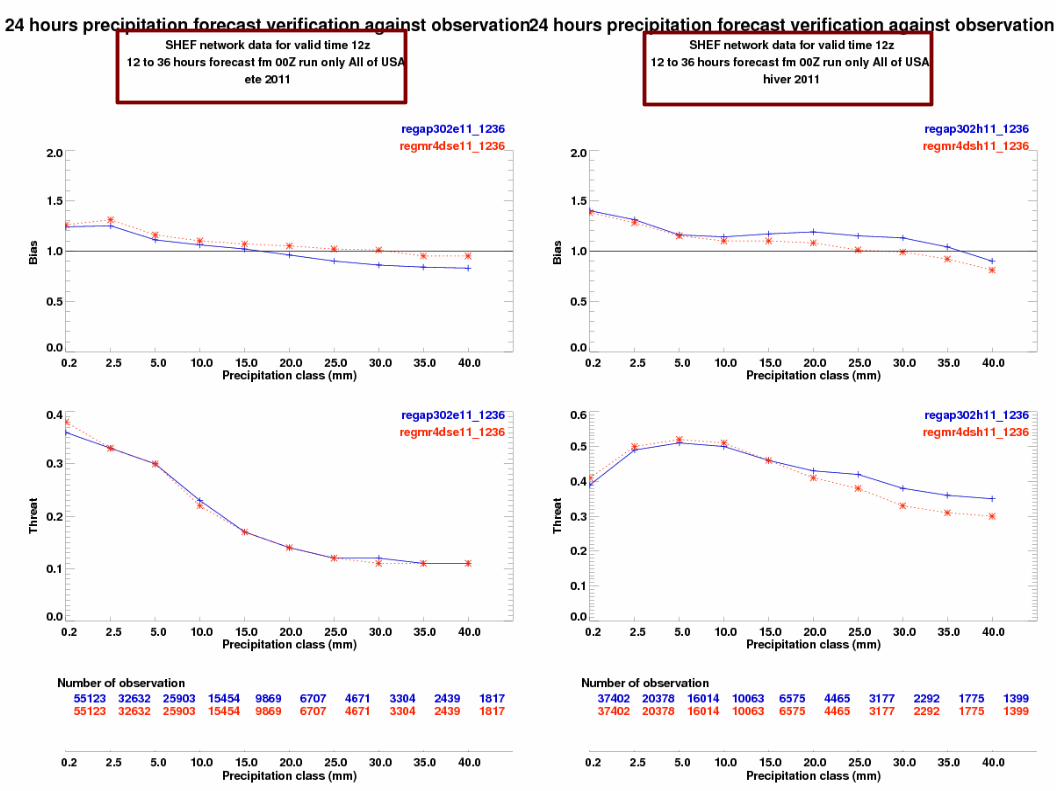
00-24h 24-48h12-36h
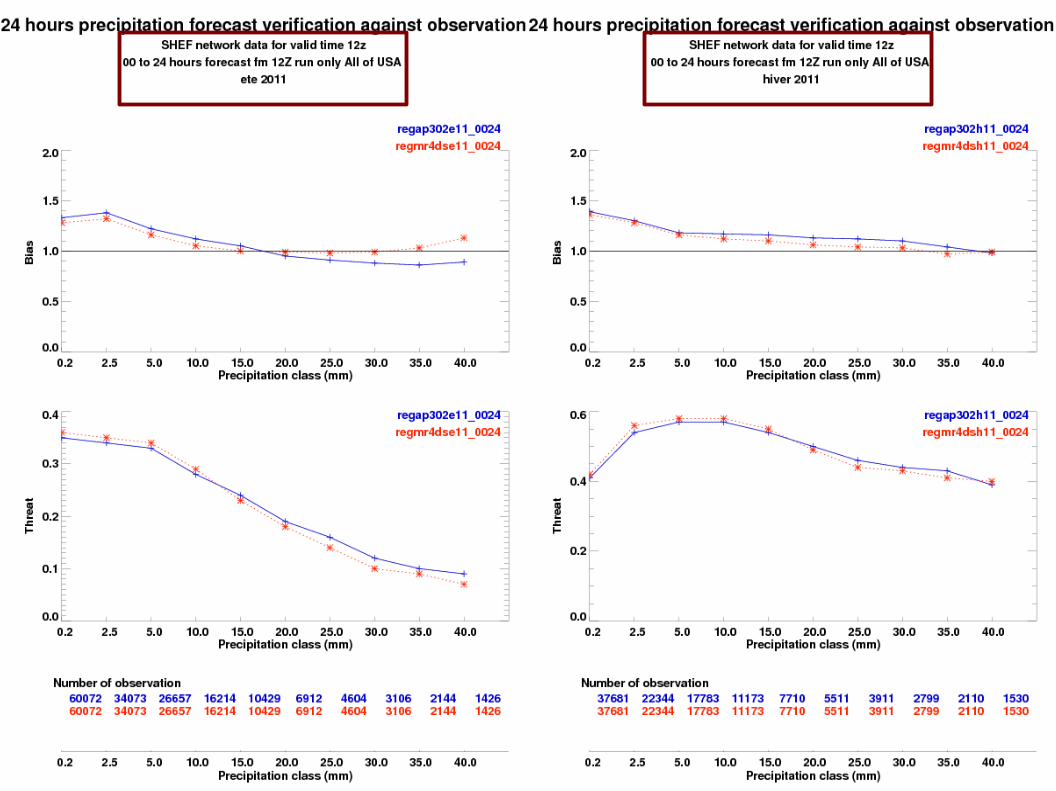
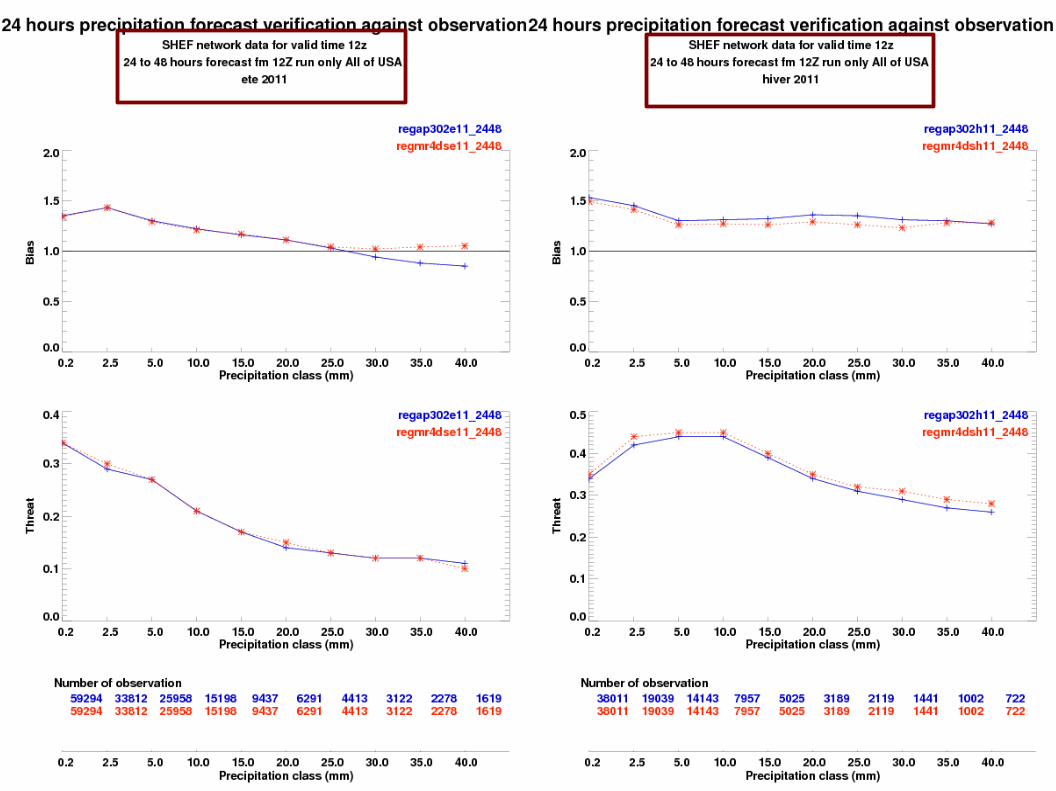
SUMMER 2008 SHEF All of USA
REG-3DREG-4D
REG-3DREG-4D
REG-3DREG-4D
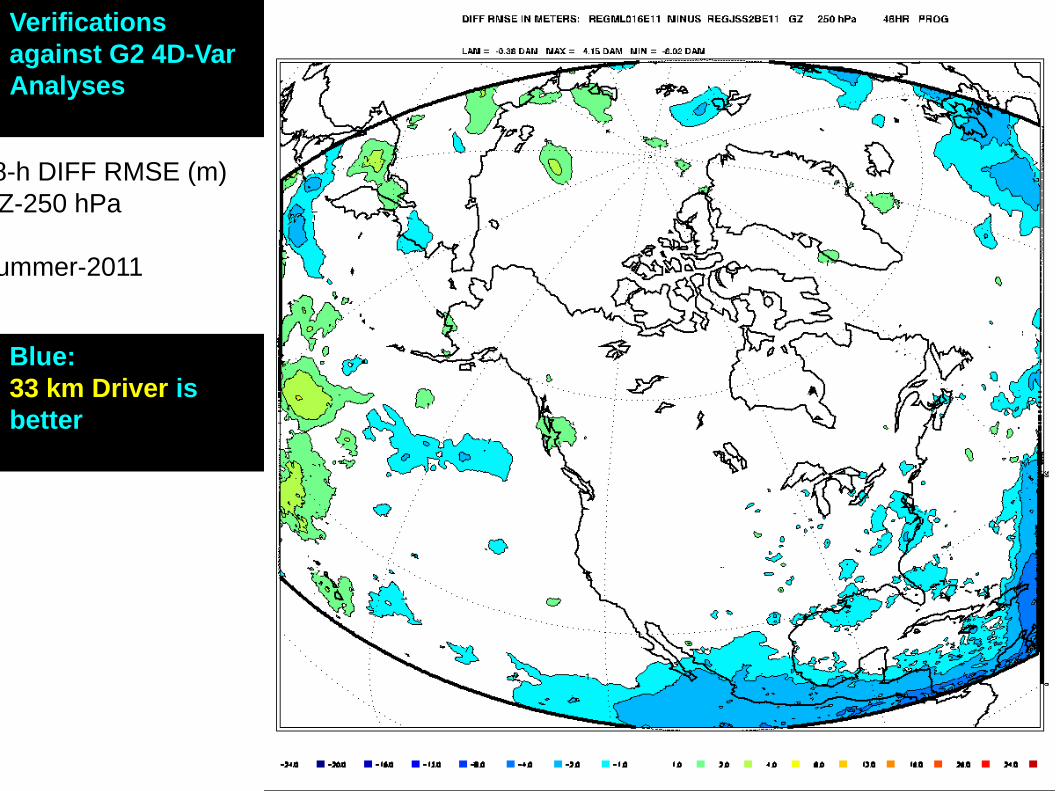
48-h DIFF RMSE (m)GZ-250 hPa
Summer-2011
Blue: 33 km Driver is better
Verifications against G2 4D-Var Analyses
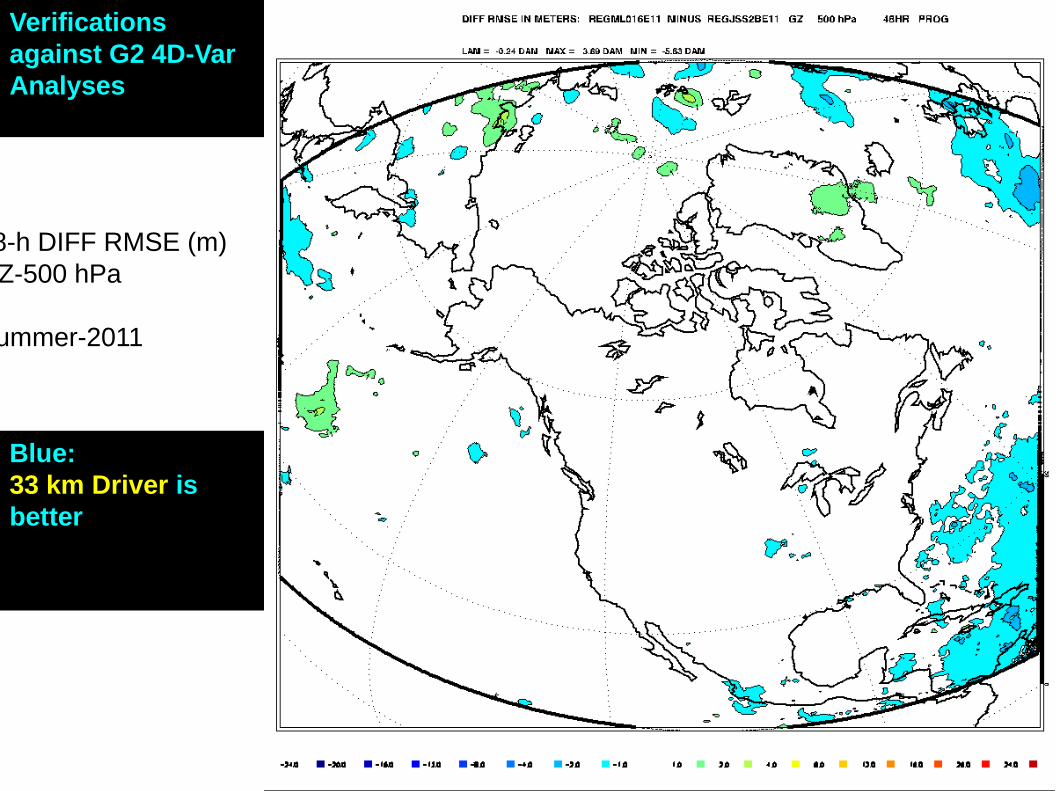
48-h DIFF RMSE (m)GZ-500 hPa
Summer-2011
Blue: 33 km Driver is better
Verifications against G2 4D-Var Analyses
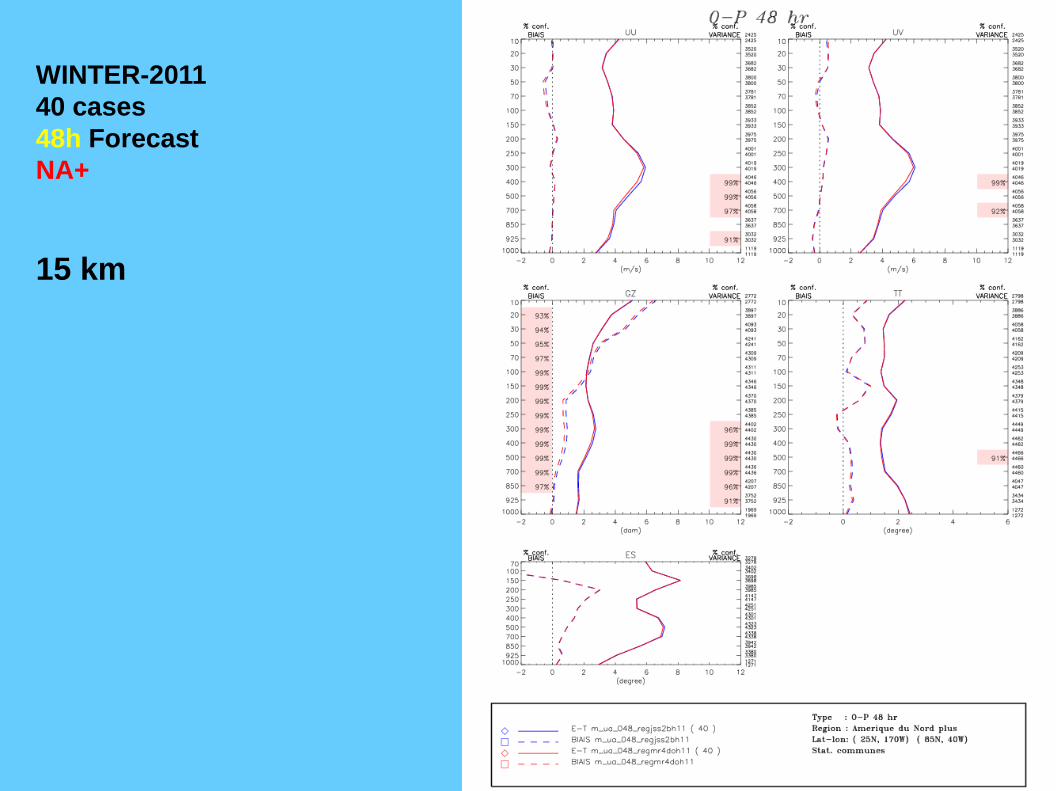
WINTER-2011 40 cases48h ForecastNA+
15 km
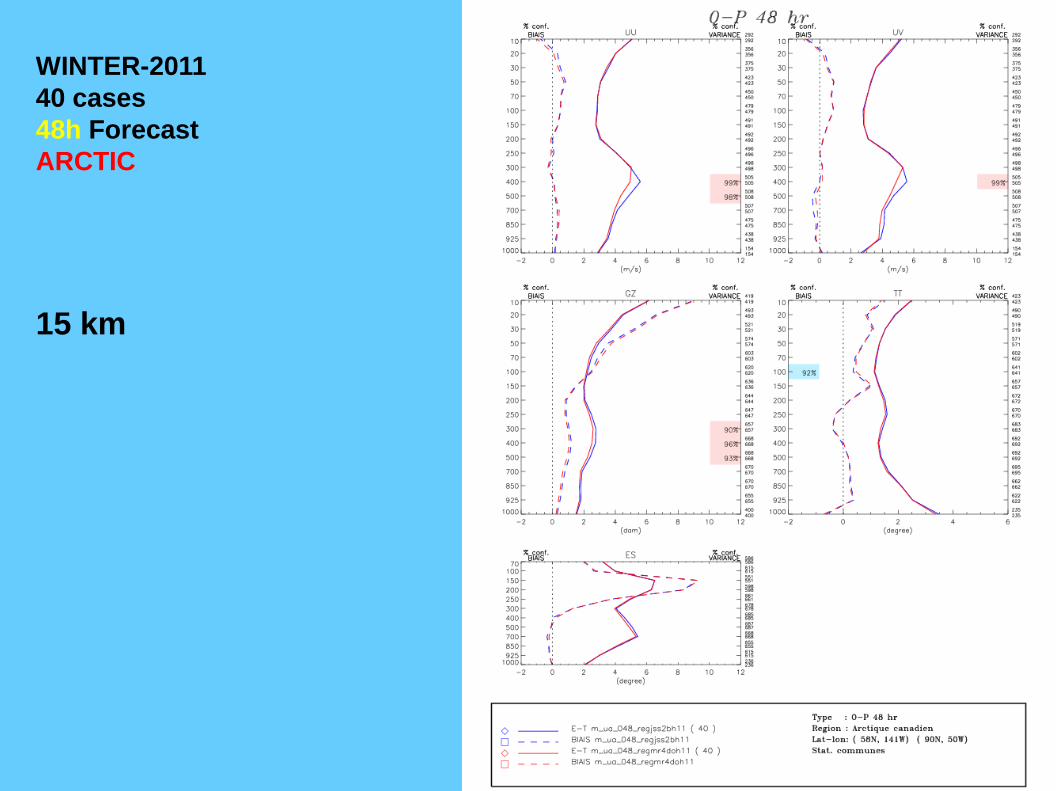
WINTER-2011 40 cases48h ForecastARCTIC
15 km
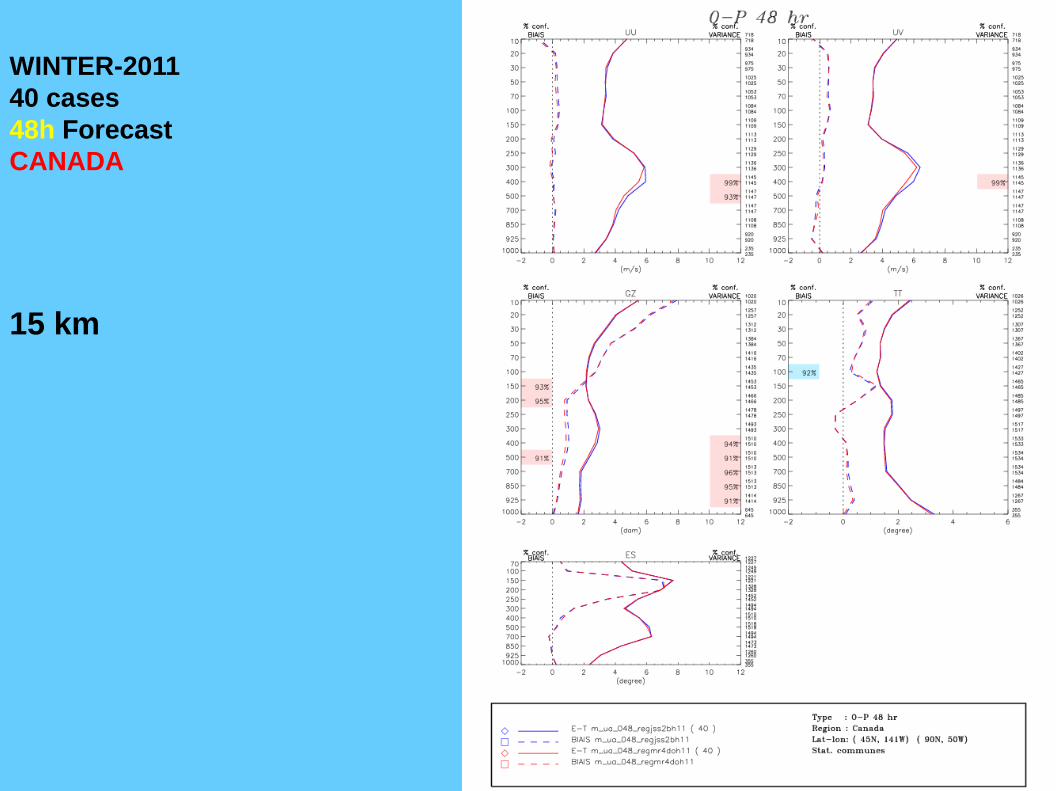
WINTER-2011 40 cases48h ForecastCANADA
15 km
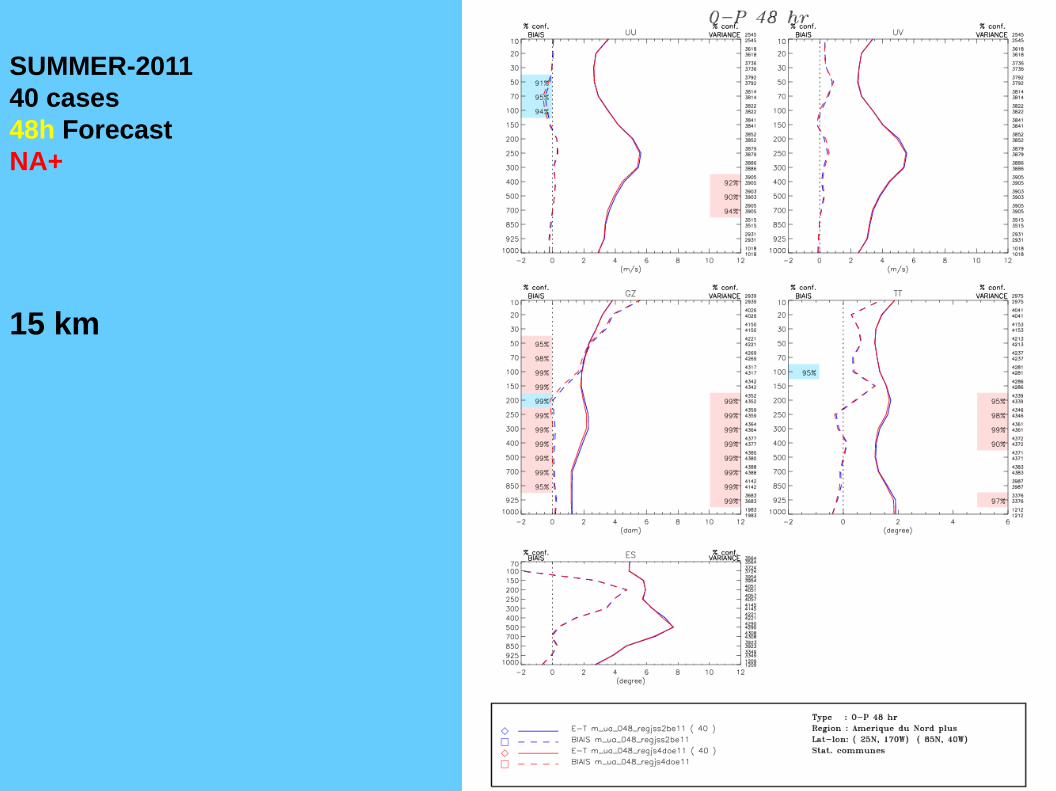
SUMMER-2011 40 cases48h ForecastNA+
15 km
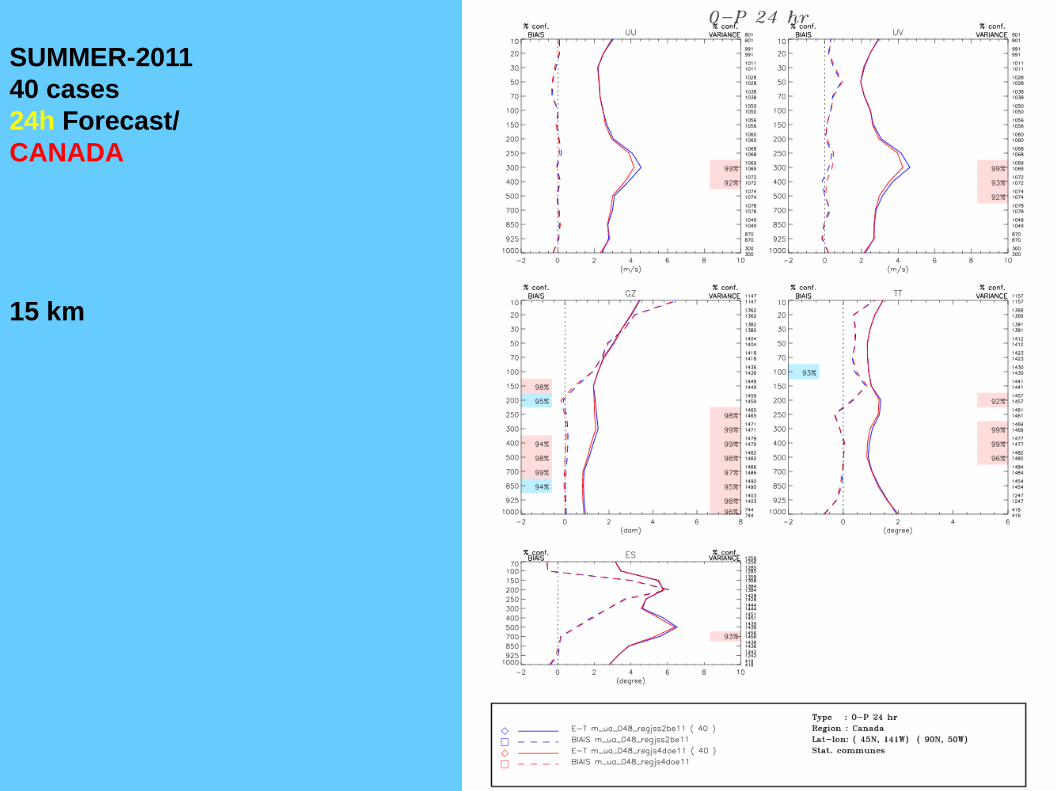
SUMMER-2011 40 cases24h Forecast/CANADA
15 km
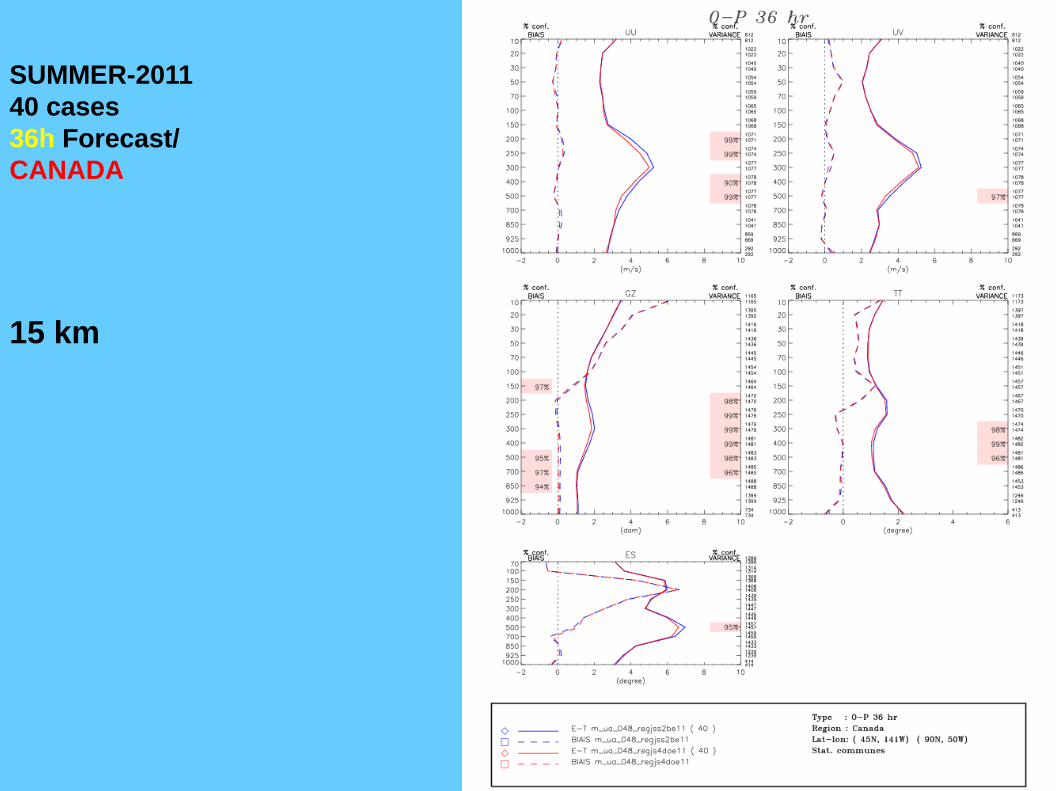
SUMMER-2011 40 cases36h Forecast/CANADA
15 km
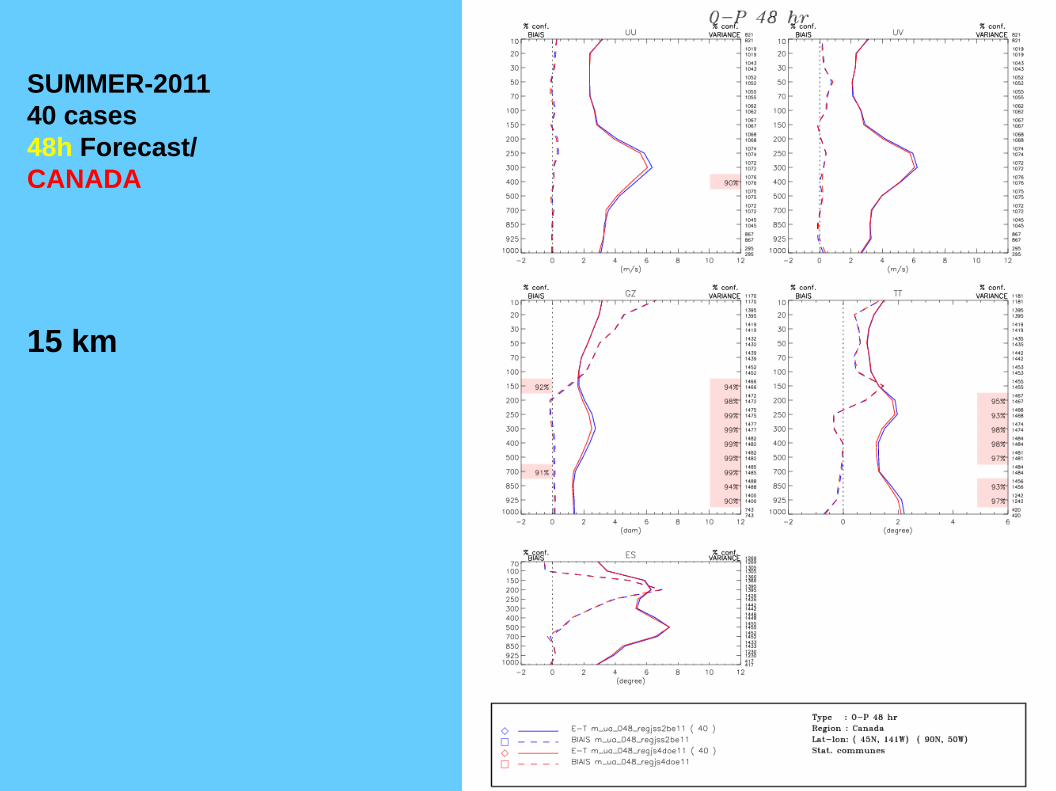
SUMMER-2011 40 cases48h Forecast/CANADA
15 km
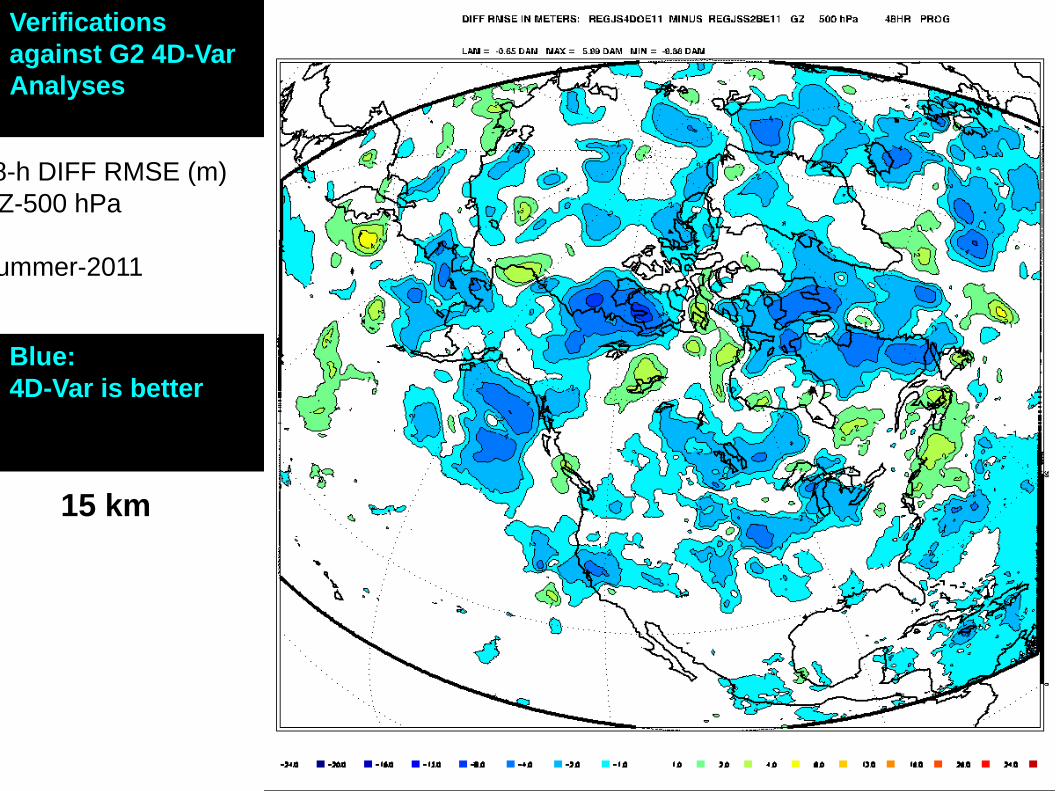
48-h DIFF RMSE (m)GZ-500 hPa
Summer-2011
Blue: 4D-Var is better
Verifications against G2 4D-Var Analyses
15 km
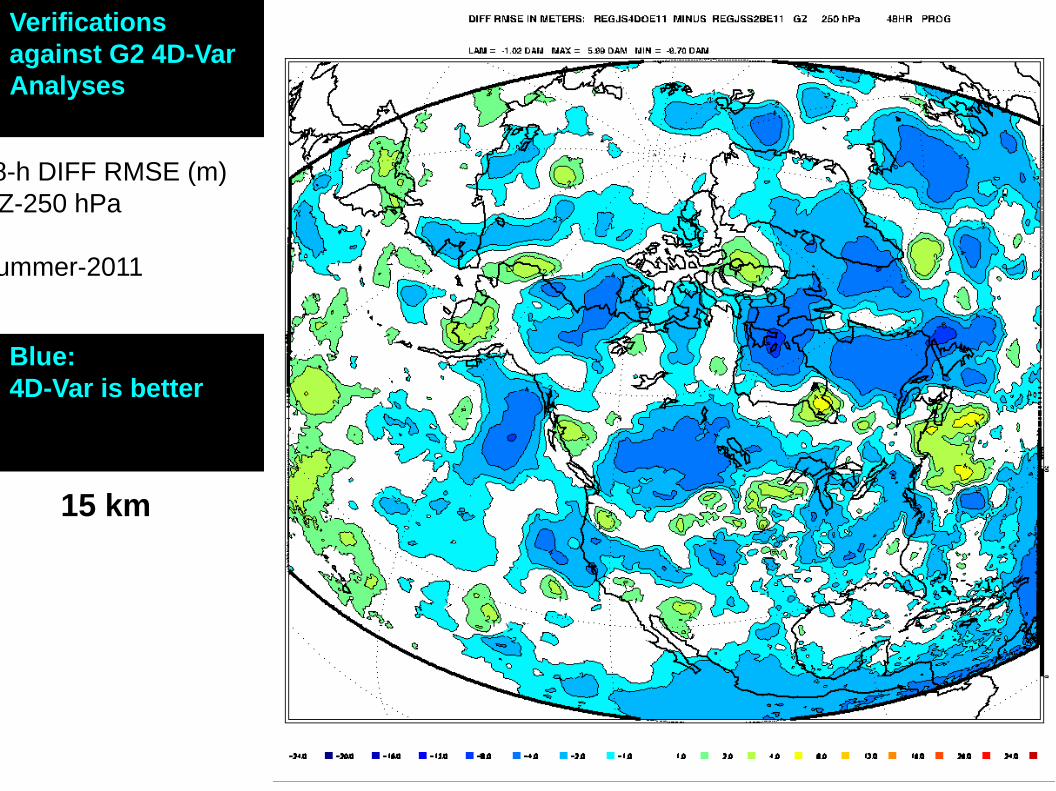
48-h DIFF RMSE (m)GZ-250 hPa
Summer-2011
Blue: 4D-Var is better
Verifications against G2 4D-Var Analyses
15 km
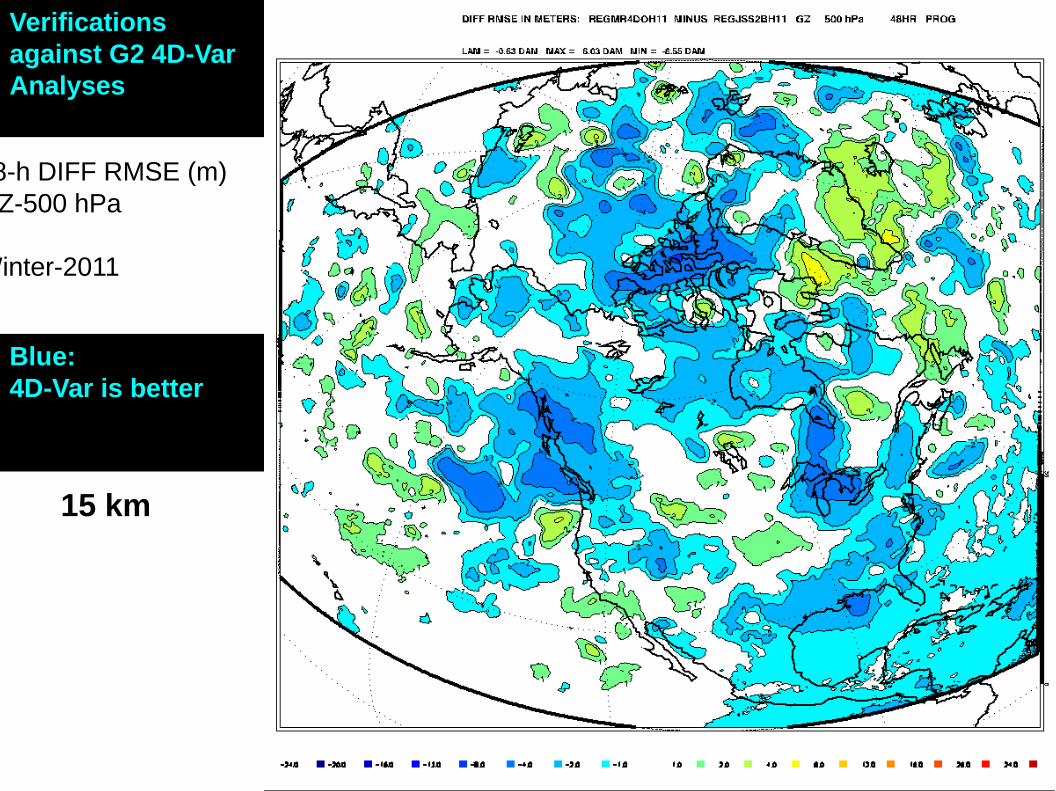
48-h DIFF RMSE (m)GZ-500 hPa
Winter-2011
Blue: 4D-Var is better
Verifications against G2 4D-Var Analyses
15 km
Summary and Conclusions
RDPS3.0.0:
– Clear improvements in UA scores for both seasons in most of troposphere (Major improvements over Canada and the Arctic)
– Cooling of the surface in winter, stronger over USA
– Clear improvements in warm advection situations for winter and spring
– Optimized 4D-Var still can sustain significant increase in Nb. of Observations assimilated without affecting execution time
Proposed changes to Analysis: 4D-Var T180, Binning 15 min, 45 it. driving model: move to exact copy of GDPS 2.2.0 (800x600) except for
grid orientation Model: Resolution increase to 10km+hysteresis effect+reduction of LH...
CPOP proposal on march 27th 2012 Parallel run planned for april-may 2012
Operational Transfer
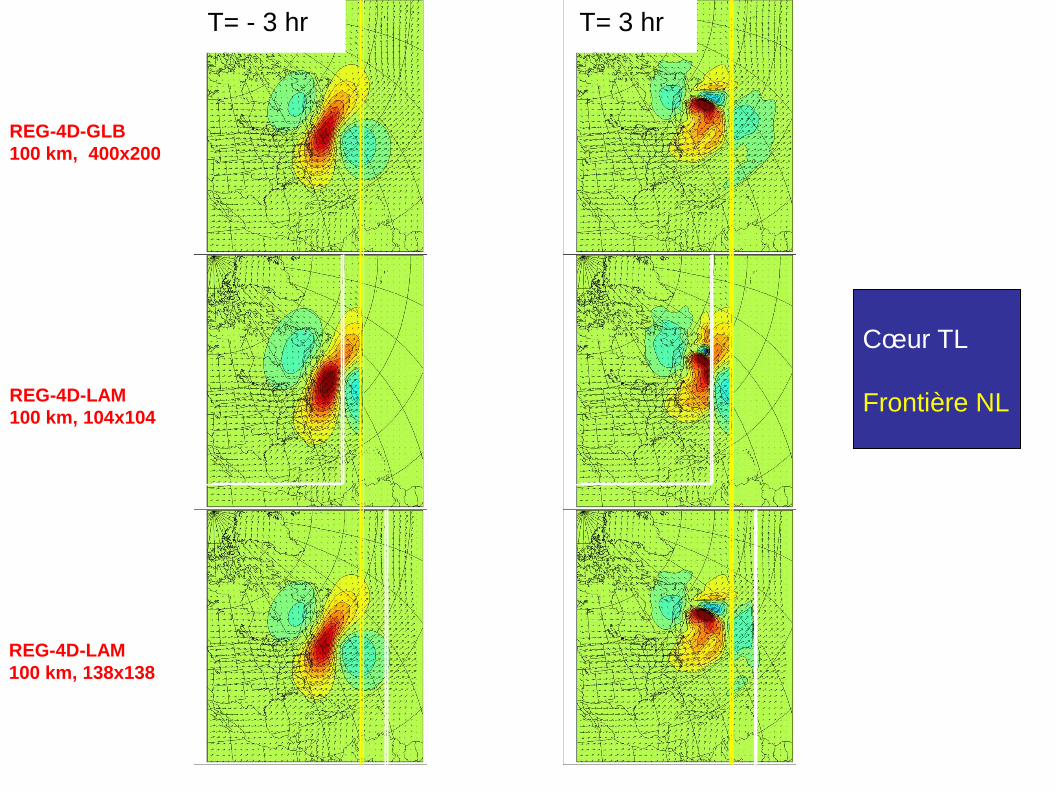
REG-4D-GLB 100 km, 400x200
REG-4D-LAM100 km, 104x104
REG-4D-LAM 100 km, 138x138
T= - 3 hr T= 3 hr
Cœur TL
Frontière NL