
Lac Courte Oreilles Band of Lake Superior Ojibwe
62
Lac Courte Oreilles Band of Lake Superior Ojibwe Lac Courte Oreilles Hydro Dam Assessment March 2015 Final Report Presented to: U.S. Department of Energy Tribal Energy Program Contract # DE-EE0002514 Project Officer: Lizana K. Pierce [email protected] Prepared by: Kiser Hydro, LLC 101 Stephenson Street Norway, MI 49870 Technical Contact: Jason Weaver [email protected]
Transcript of Lac Courte Oreilles Band of Lake Superior Ojibwe

Lac Courte Oreilles Band of Lake Superior Ojibwe
Lac Courte Oreilles Hydro Dam Assessment
March 2015
Final Report
Presented to:
U.S. Department of Energy
Tribal Energy Program
Contract # DE-EE0002514
Project Officer: Lizana K. Pierce
[email protected] Prepared by:
Kiser Hydro, LLC
101 Stephenson Street
Norway, MI 49870
Technical Contact: Jason Weaver

Project Data
Awardee: Lac Courte Oreilles Band of Lake Superior Ojibwe
Location: Town of Winter
Project Title: Hydro-dam Assessment
Type of Award: First Steps Grant
DOE Grant Number: DE-EE002514
Project Amounts: DOE:
Awardee:
Total:
Project Period: Start: June 30, 2010
End: December 31, 2014
Project Officer: Lizana K. Pierce, Manager
U.S.D.O.E. Tribal Energy Program
Phone: (720) 356-1749
Email: [email protected]
Jennifer Luna, Program Specialist II
U.S.D.O.E. Tribal Energy Program
Phone: (720) 356-1273
Email: [email protected]
Tribal Contacts: Technical:
Jason Weaver
Phone: (715) 634-0347
Email: [email protected]
Lac Courte Oreilles Band of Lake Superior Ojibwe
13394W Trepania Rd.
Hayward, WI 54843
Consultant: Project Manager:
Amy (Meyers) Pitcher
Kiser Hydro, LLC
1001 Stephenson Street
Norway, MI 49870
Phone: (906) 563-5265 EXT. 224
Email: [email protected]
TURBINE ANALYSIS FINAL REPORT
For
LAC COURTE OREILLES BAND OF LAKE SUPERIOR CHIPPEWA
Winter, WI
PREPARED BY: Kiser Hydro, LLC
April 2014
EXECUTIVE SUMMARY
Kiser Hydro was contracted by the Lac Courte Oreilles Band of Lake Superior Chippewa to perform a complete Computational Fluid Dynamics (CFD) Analysis for the Winter Dam Hydroelectric plant. The purpose of the study is to observe efficiencies with the existing mechanical equipment and historical Annual Energy Production (AEP) to determine whether a mechanical upgrade would be feasible in terms of cost effectiveness and return on investment.
Swiderski Engineering, Inc was subcontracted by Kiser Hydro to perform the CFD Analysis. It was determined that on average, with the existing mechanical and electrical systems, the annual energy produced between all three units is 10.9 GWh (Gigawatt-hour) with an overall hydraulic efficiency of approximately 84%. The lower efficiency can be contributed to Units #2 and #3 being oversized and not being operable at lower flows, 350 cfs (cubic feet per second) and lower.
Kiser Hydro recommends upgrading one of the large units, either Unit #2 or Unit #3. The upgraded runner would be designed to operate over a wider range of flows, including flows less than 350 cfs. This in turn, would increase the overall efficiency of the plant. The projected annual energy production is 11.7 GWh, an increase of AEP of 7.3% (797,513 kWh)
The rough order of magnitude estimate to complete this proposed upgrade is $700,000. This includes design of a new runner, fabrication of the runner, as well as removal and installation of the existing and new runners respectively.

INTRODUCTION
The following report details the findings of the Computational Fluid Dynamics Analysis performed by Swiderski Engineering, along with recommendations and estimates from Kiser Hydro for future upgrades that would result in increased Annual Energy Production (AEP). The report is organized in chronological order per the original proposal, beginning with a flow duration curve and existing site specifications.
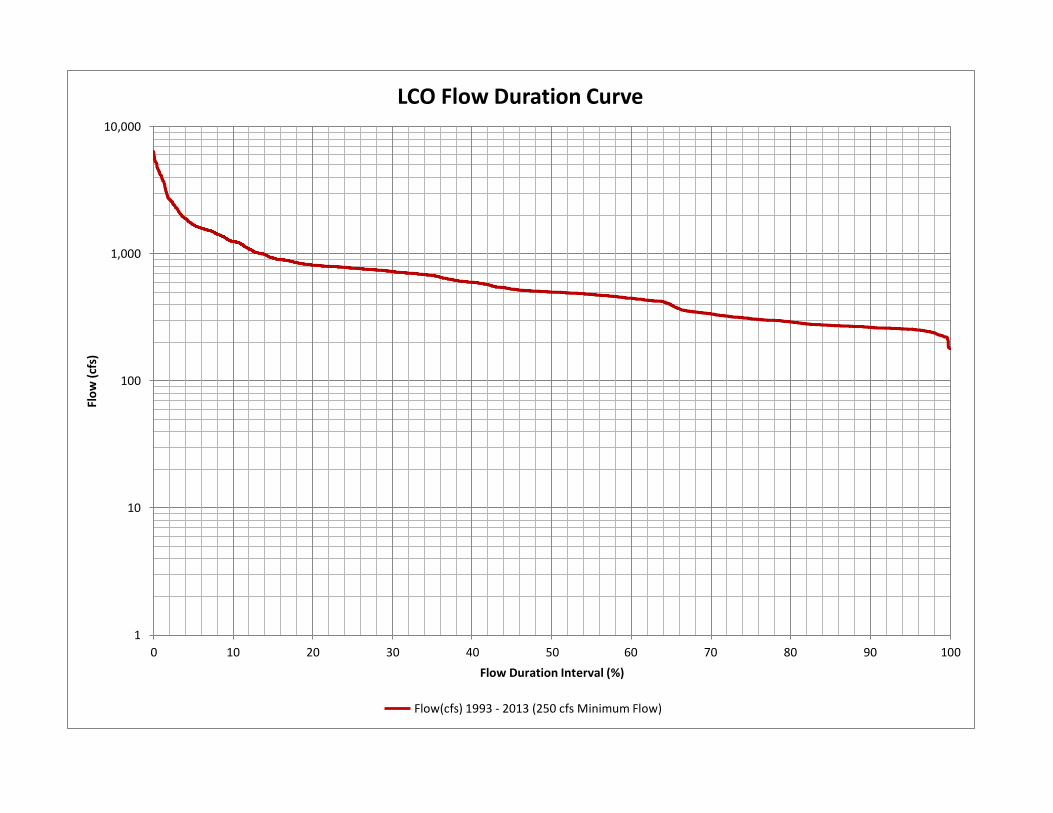
The flow duration curve is based on historical data recorded from 1993 through present time. The flows during these years are the most accurate representation of the flows that the hydroelectric facility currently experiences, given the origin date of the powerhouse as well as the requirement to pass a minimum of 250 cubic feet per second (cfs). The CFD analysis was performed with these historical data points.
Recommendations of a proposed runner upgrade along with the corresponding cost estimate and projected annual energy production conclude this report.
1 – Flow Duration Curve
2 – Site Specifications
3 – Site Inspection Reports
4 – Computational Fluid Dynamics Analysis Report
KISER HYDRO, LLC HYDROELECTRIC SYSTEMS
1001 Stephenson Street
Norway, MI 49870
906-563-5265
5 – Proposed Upgrade Estimates
6 – Proposed Upgrade Summary Table
7 – Final Report
8 – Turbine Analysis Presentation
Flo
w (
cfs)
10,000
LCO Flow Duration Curve
1,000
100
10
1
0 10 20 30 40 50 60 70 80 90 100
Flow Duration Interval (%)
Flow(cfs) 1993 - 2013 (250 cfs Minimum Flow)

CHIPPEWA RESERVOIR
FERC PROJECT: P-8286
CONSTRUCTION & KEY DATES
Owner ………………………..…………….…. Xcel Energy (Dam)
Owner ……………………. Lac Corte Oreilles Band of Lake
Superior Chippewa (Powerhouse)
Date Originally Built ………………………….…. 1923 (Dam)
HYDROLOGIC DATA
River ………………………………………………………..Chippewa
County …..………………………………………………..… Sawyer
Nearest City ………………………………………………….Winter
Drainage Area Square Miles ……………………………. 787
Storage Volume Acre Feet …………………….…. 230,000
Average Flow ……………………………………………. 775 CFS
Minimum Flow …………………………………………. 250 CFS
Flood of Record ………………………………………. 7520 CFS
Probable Maximum Flood ………………….… 72,000 CFS
OPERATIONAL DATA
Normal Headwater Elevation ………………….. 1311.7 FT
Minimum Headwater Elevation …………….... 1295.7 FT
Normal Operating Head …………………………….…….45 FT
Number of Units ………………………………………………..…. 3
Maximum Generating Capacity ………………… 3100 kW
Maximum Turbine Discharge (Total) …………. 1,490 CFS
Hazard Rating ………………………………………………….. High
STRUCTURAL DATA
Dam Type ……………. Spillway Gates w/ Embankments
Overall Length & Height ……………………. 1290’L x 26’H
Penstock ……Two Steel - ø9’ x 300’ Long Siphon-Type
Spillway Description:
…….Three spillway gates … 20’W x 26’H (ea)
PLANT DATA
Turbine Manufacturer …………………….. W.J. Bauer Inc.
Turbine Identification:
Unit #1 ……………………………. 40” Francis Type
Unit #2 ………………………….… 93” Francis Type
Unit #3…………………………..… 93” Francis Type
Turbine CFS @ 100% Gate:
Unit #1 ………………………………………..…. 90 CFS
Unit #2 …………………………………………. 700 CFS
Unit #3……………………………………….…. 700 CFS
Generator Identification:
Unit #1 ……………………………..…. Siemens-Allis
Unit #2 ………………………………... Siemens-Allis
Unit #3 ………………………………… Siemens-Allis
Generator Nameplate Rating kW:
Unit #1……………………………………………250 kW
Unit #2 …………………………….……..….. 1800 kW
Unit #3………………………………………… 1800 kW
Generator Speed RPM:
Unit #1…………………………………….… 1215 RPM
Unit #2 ……………………………………….. 905 RPM
Unit #3………………………………………… 905 RPM
Generator Voltage:
Unit #1 …………………………………….…… 4160 V
Unit #2 …………………………………….….. 4160 V
Unit #3 ……………………………………….… 4160 V
TRIP REPORT
DATE: August 6th, 2013
CUSTOMER : Lac Courte Oreilles Band of Lake Superior Chippewa
13394 West Trepania Road Hayward, WI 54843
PROJECT: Turbine Analysis
JOB NUMBER: 13-33
SUMMARY OF PROJECT
Kiser Hydro has been contracted to evaluate the existing turbines at the Winter Dam Hydro facility. Existing geometry will be used with historical flows and power production to evaluate the efficiency of the plant and its power producing capabilities. Through use of Computational Fluid Dynamics (CFD) Analysis, Kiser Hydro will be better able to determine possible turbine improvements that would benefit overall plant efficiency and annual power production.
FIELD SERVICES
Project Manager, Amy Pitcher, along with Project Engineer Tim Olson performed a site visit on August 6th, 2013. The purpose of the visit was to verify geometry of the units with the prints that were being used to complete the CFD analysis. Aside from visual verification, a few general measurements were documented to confirm that the prints were reflecting the existing geometry.
By entering the shared pit of Units #1 & #2, a visual inspection was completed, verifying that the unit layout and general machine prints correlated to the existing machinery and infrastructure. It was also confirmed that Units #2 & #3 share the same geometry, an inspection was completed on Unit #2 only. Further inspection/verification was documented by recording the following measurements:

Table 1: Unit #1 Inspection
REFERENCE DRAWING
MEASUREMENT & OBSERVATIONS
CH-108
Right Hand Oriented Machine
14 Buckets on Unit
Runner Height … 13-3/4 inches
CH-105
Wicket Gate Height … 13-1/2 inches
16 Wicket Gates
Wicket Gate Opening … Approx. 3 inches (@ 68% Open)
Step from Headcover to Runner Crown … 1/16 inch
Step from Bottom Ring to Runner Skirt … 1/8 inch
Table 2: Unit #2 Inspection
REFERENCE DRAWING
MEASUREMENT & OBSERVATIONS
CH-104
Wicket Gate Height … 35 inches
20 Wicket Gates
Wicket Gate Opening … Approx. 9-1/2 - 9-7/16 inches (@ 100% Open)
ø1-1/2 inch Bars every 2 Gates - Extend Through Gate Casing
Discharge Ring - ID to OD … 11-1/4 inches
No Visible Wear Ring
Step from Headcover to Runner Crown … 1/8 inch
Step from Bottom Ring to Runner Skirt … 3/8 inch
Top, Bottom & Sides of Pit are Flat
CH-107
Right Hand Oriented Machine
15 Buckets on Unit
Runner Height … 59-1/4 inches
Based on the verifications made during this site inspection, Kiser Hydro felt comfortable moving forward by performing the CFD Analysis based on the geometry found on the existing print set.
KISER HYDRO, LLC • HYDROELECTRIC SYSTEMS
1001 Stephenson Street • Norway, Ml 49870 • (906) 563-5265 • Fax (906) 563-9344
TRIP REPORT
DATE: September 24th, 2013
CUSTOMER: Lac Courte Oreilles Band of Lake Superior Chippewa
13394 West Trepania Road
Hayward, WI 54843
PROJECT: Turbine Analysis
JOB NUMBER: 13-33
SUMMARY OF PROJECT
Kiser Hydro has been contracted to evaluate the existing turbines at the Winter Dam Hydro facility.
Existing geometry will be used with historical flows and power production to evaluate the efficiency of
the plant and its power producing capabilities. Through use of Computational Fluid Dynamics (CFD)
Analysis,Kiser Hydro will be better able to determine possible turbine improvements that would benefit
overall plant efficiency and annual power production.
FIELD SERVICES
Project Engineer Tim Olson performed a site visit on September 24th, 2013 to meet and assist GKS
Services with the 3D scanning of blades from Units #1& #2 for use in the CFD Analysis.
Due to the tight space constraints of the accessibility of Unit #1,GKS deemed it impossible to perform
an accurate scan of the blades. Since geometry was previously visually verified in a separate site visit,
and because Unit #1accounts for less than 10% of the power production, Kiser Hydro did not pursue
this issue any further. GKS submitted a written statement to Kiser Hydro explaining why the scan was
not completed (see attached).
A blade from Unit #2 was successfully scanned by GKS. GKS submitted a CAD model of the scan to Kiser
Hydro. This model was used to accurately model Units #2 & #3 for the CFD Analysis.
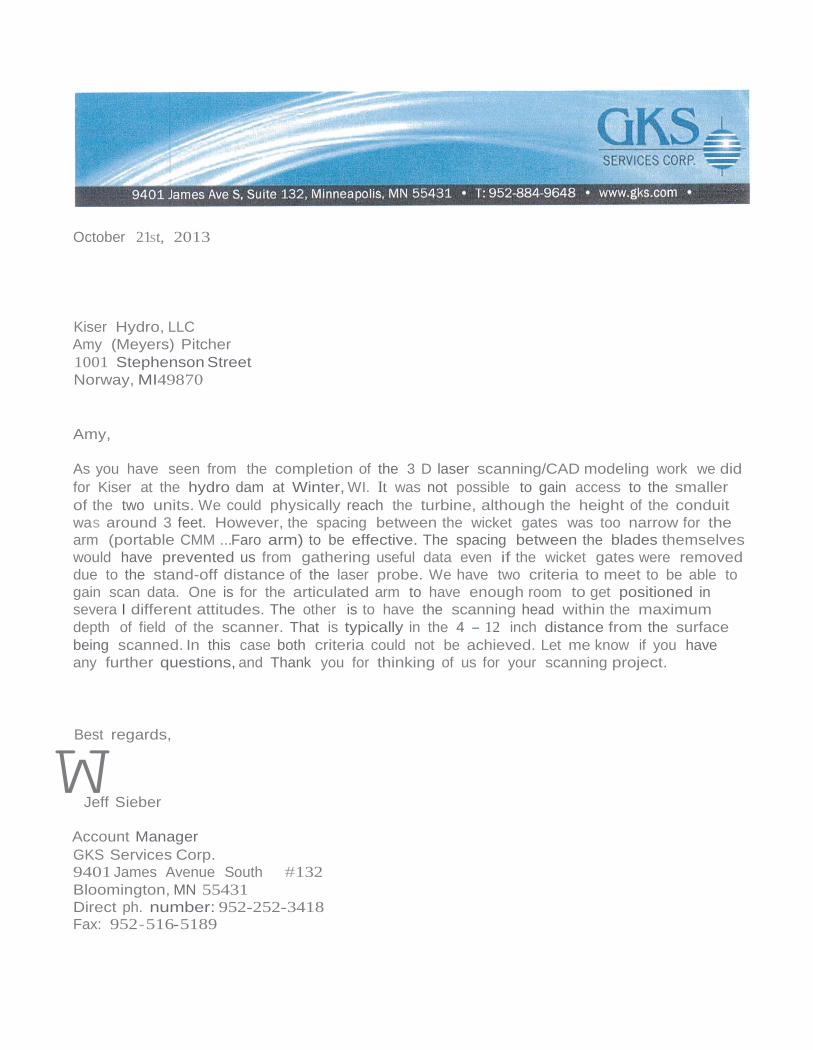
October 21st, 2013
Kiser Hydro, LLC
Amy (Meyers) Pitcher
1001 Stephenson Street
Norway, MI49870
Amy,
As you have seen from the completion of the 3 D laser scanning/CAD modeling work we did
for Kiser at the hydro dam at Winter, WI. It was not possible to gain access to the smaller
of the two units. We could physically reach the turbine, although the height of the conduit
was around 3 feet. However, the spacing between the wicket gates was too narrow for the
arm (portable CMM ...Faro arm) to be effective. The spacing between the blades themselves
would have prevented us from gathering useful data even if the wicket gates were removed
due to the stand-off distance of the laser probe. We have two criteria to meet to be able to
gain scan data. One is for the articulated arm to have enough room to get positioned in
severa l different attitudes. The other is to have the scanning head within the maximum
depth of field of the scanner. That is typically in the 4 - 12 inch distance from the surface
being scanned. In this case both criteria could not be achieved. Let me know if you have
any further questions, and Thank you for thinking of us for your scanning project.
Best regards,
WJeff Sieber
Account Manager
GKS Services Corp.
9401 James Avenue South #132
Bloomington, MN 55431 Direct ph. number: 952-252-3418 Fax: 952 - 516-5189
Lac Courte Oreilles Final Report
FINAL REPORT
SWIDERSKI ENGINEERING INC. for KISER HYDRO LLP Page 1 of 27
Lac Courte Oreilles Project
– CFD-based upgrade analysis
- final report -
Swiderski Engineering Inc.
for
Kiser Hydro LLP
December/2013
Lac Courte Oreilles Final Report
FINAL REPORT
SWIDERSKI ENGINEERING INC. for KISER HYDRO LLP Page 2 of 27
Table of contents Preamble.............................................................................................................................................................. 3
Conclusions and Observations .................................................................................................................... 3
Plant modernization - recommendation summary.............................................................................. 4
Numerical model of units 2&3 – general information ........................................................................ 5
Flow analysis results ....................................................................................................................................... 6
Annual Energy Production........................................................................................................................... 10
Turbine characteristics units 1 and 2, 3............................................................................................ 10
Flow duration curve and Annual Energy Production (AEP) ........................................................ 14
Proposed upgrade .......................................................................................................................................... 20
Proposed partial upgrade: Unit #2 only................................................................................................ 25
Lac Courte Oreilles Final Report
FINAL REPORT
SWIDERSKI ENGINEERING INC. for KISER HYDRO LLP Page 3 of 27
Preamble
This report presents results of work undertaken based on the PO 13-33-2068 issued by Kiser Hydro LLP. Based on information provided on the equipment and the statistical data of the available flows, an analysis was conducted to determine turbine characteristics and their operation under available flows. Final stage of the analysis resulted in a proposed modernization scheme to increase Annual Energy Production (AEP) by the plant.
Conclusions and Observations
Following verified calculation results of the CFD model of existing turbines, consultation
with plant’s operators, inclusion of head losses calculation for the penstock as tuning-up the range of turbines operation the following are major observations and conclusions:
1) Turbines of units #2 and #3 are oversized by approx. 30 to 40%. This is a
reason?: the majority of their operation falls into so-called “part load”, where turbine efficiency is low and operation of the Francis turbine becomes rough. This
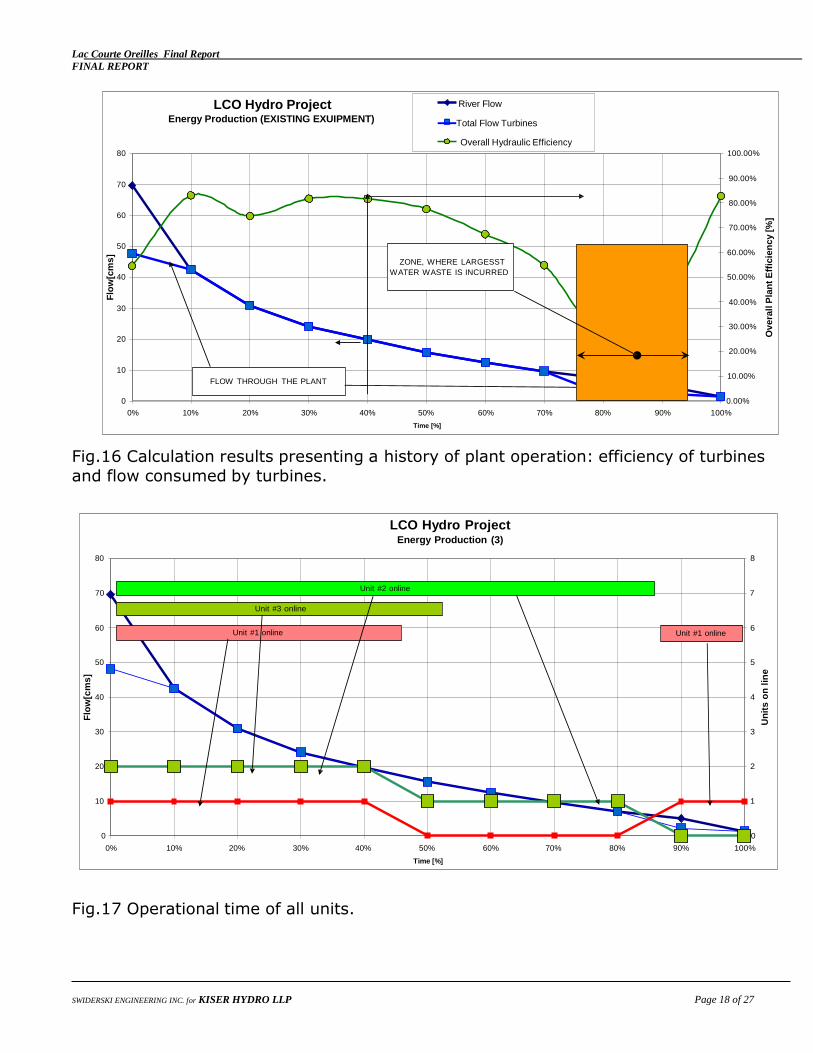
also makes it impossible to operate those turbines at flows below approx. 350 cfs (Fig. 16) causing extra loss generation
2) Due to the fact that turbines of units #2 and #3 are oversized, overall hydraulic
efficiency is low, reaching maximum value of approx. 84%, while normally expected should be 87 – 92%.
3) Unit #1 performances are verified based on general knowledge on this type of
machine, as well as data obtained from the plant’s operators. This unit is undersized, as the gap between lowest flow operating range of large units (2&3) and the maximum flow capacity of unit 1 is too large causing unnecessary spilling of water over the dam (Fig. 6)
4) Generators for units #2 and #3 are sized properly; the only information which should be verified is their achievable output and efficiency characteristic.
5) Generator of Unit #1 is sized accordingly to capacity of the existing turbine, however, if turbine capacity is to be increased, the generators would have to be
rewound or replaced to facilitate higher output

Lac Courte Oreilles Final Report
FINAL REPORT
SWIDERSKI ENGINEERING INC. for KISER HYDRO LLP Page 4 of 27
Plant modernization - recommendation summary
It is possible to increase AEP under existing hydrological circumstances by approx. 8.7% (951,423 kWh) (Table 1 vs. Table 3). In order to achieve this all units
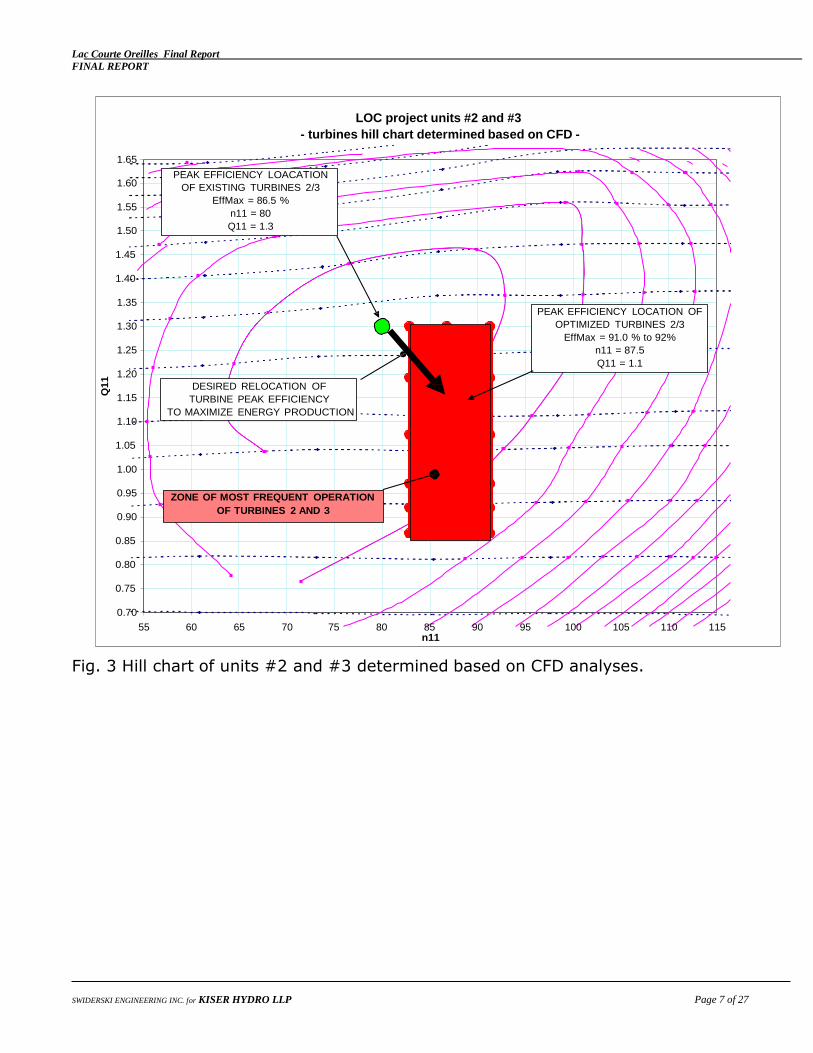
should be upgraded: Units 2 & 3: New, modern design runners shifting peak efficiency of the turbine up by 3% to 5% and
lowering flow at peak efficiency by approx. 12% (Fig. 3. page 7). The turbine will still
have capacity to go up to the limits of existing generators, while extending it’s operating
range down to approx. 250 cfs (turbine aeration system may have to be provided) Unit 1:
New, modern design runner to maximize turbine capacity and increase it’s operating
range to go above 100 cfs (possibly 150 cfs). This will require examination of the
existing generator to determine whether it will be capable of handling higher turbine output: generator rewound, or replacement may be required.
AEP calculations for a partial upgrade scenario (only Unit #2 or #3 upgraded)
show also promising results: calculated incremental revenue is higher by
approx. 7.3% (797,513 kWh).
Lac Courte Oreilles Final Report
FINAL REPORT
SWIDERSKI ENGINEERING INC. for KISER HYDRO LLP Page 5 of 27
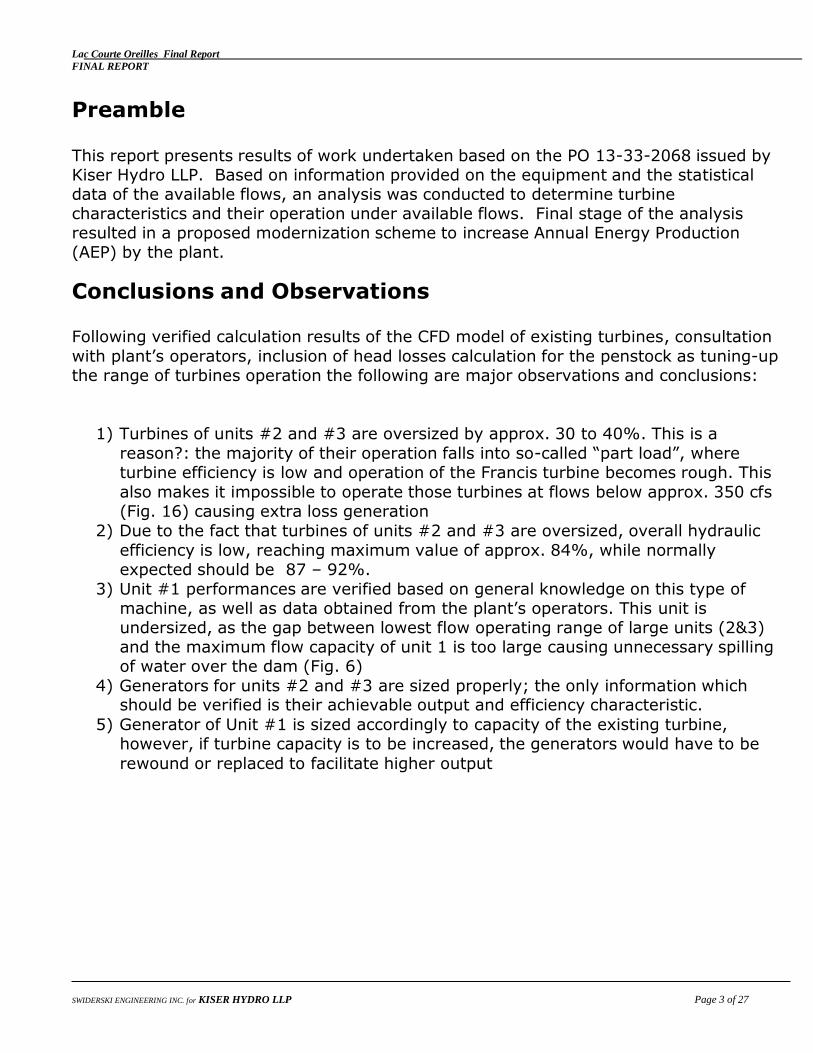
Numerical model of units 2&3 – general information
A numerical model was created using SolidWorks commercial structural analysis software and the Computational Fluid Dynamics (CFD) software called CFX. All flow passages were
modeled based on provided 2D manufacturing drawings of details and 3D scanned shape of the runner blade. The overall similarity to the existing turbine should be within IEC
code recommended manufacturing tolerances. The level of accuracy of the calculation results determining turbine performances should be within +-1.5 to +- 2%, which would
be within site-measurements admissible error.
Fig. 1 General views of the computational domain
Lac Courte Oreilles Final Report
FINAL REPORT
SWIDERSKI ENGINEERING INC. for KISER HYDRO LLP Page 6 of 27
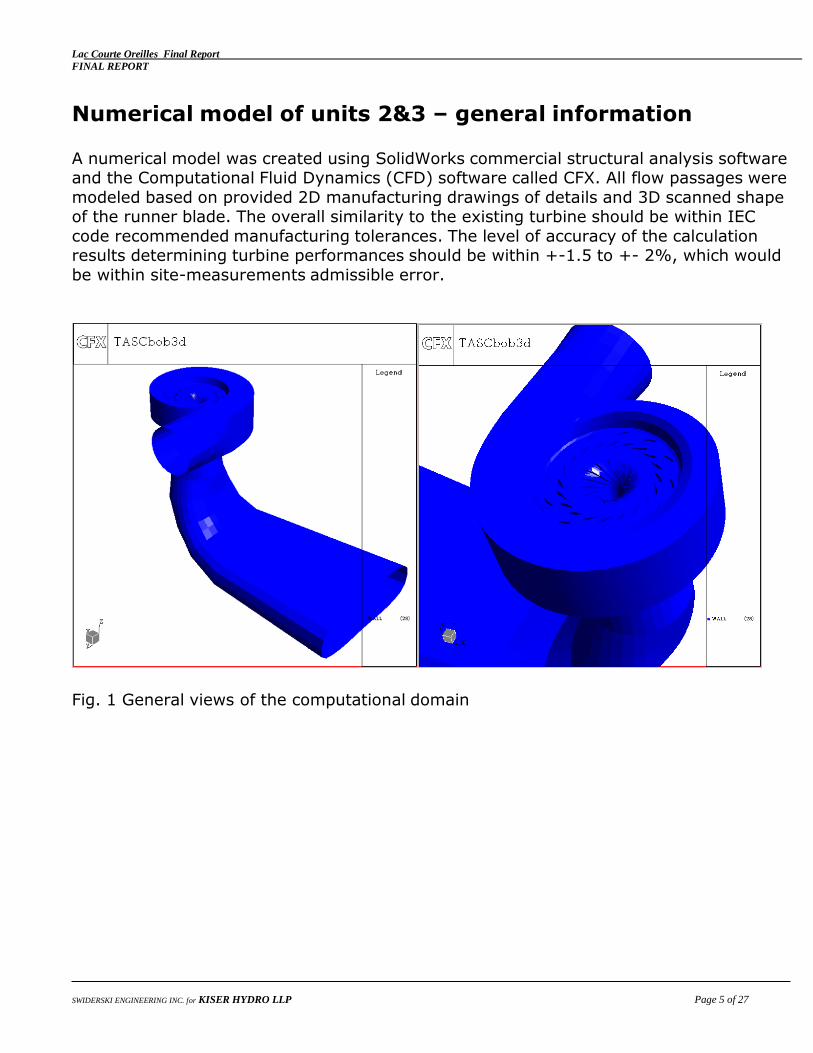
Fig. 2 General views of the computational domain – close-up on the runner and distributor
Flow analysis results
Flow analysis was conducted through the CFX commercial software. All results presented
here were completed for medium-size grids at the preliminary stage and for the fine grid (highest accuracy of flow modeling). Overall conversions of the solver were very good in
the operating range between 350cfs and 900 cfs (beyond practical operating range, but necessary to determine efficiency curve shape). As expected, flow simulations at
operating range below 350cfs – 400 cfs down to 150 cfs were completed with difficulties due to high computational instabilities, which are typical for highly vortexing flows within
the draft tube.
Lac Courte Oreilles Final Report
FINAL REPORT
SWIDERSKI ENGINEERING INC. for KISER HYDRO LLP Page 7 of 27
Q11
LOC project units #2 and #3
- turbines hill chart determined based on CFD -
1.65
1.60
1.55
1.50
PEAK EFFICIENCY LOACATION
OF EXISTING TURBINES 2/3
EffMax = 86.5 %
n11 = 80
Q11 = 1.3
1.45
1.40
1.35
1.30
1.25
1.20
1.15
1.10
DESIRED RELOCATION OF
TURBINE PEAK EFFICIENCY
TO MAXIMIZE ENERGY PRODUCTION
PEAK EFFICIENCY LOCATION OF
OPTIMIZED TURBINES 2/3
EffMax = 91.0 % to 92%
n11 = 87.5
Q11 = 1.1
1.05
1.00
0.95
0.90
ZONE OF MOST FREQUENT OPERATION
OF TURBINES 2 AND 3
0.85
0.80
0.75
0.70 55 60 65 70 75 80 85 90 95 100 105 110 115
n11
Fig. 3 Hill chart of units #2 and #3 determined based on CFD analyses.
Lac Courte Oreilles Final Report
FINAL REPORT
SWIDERSKI ENGINEERING INC. for KISER HYDRO LLP Page 8 of 27
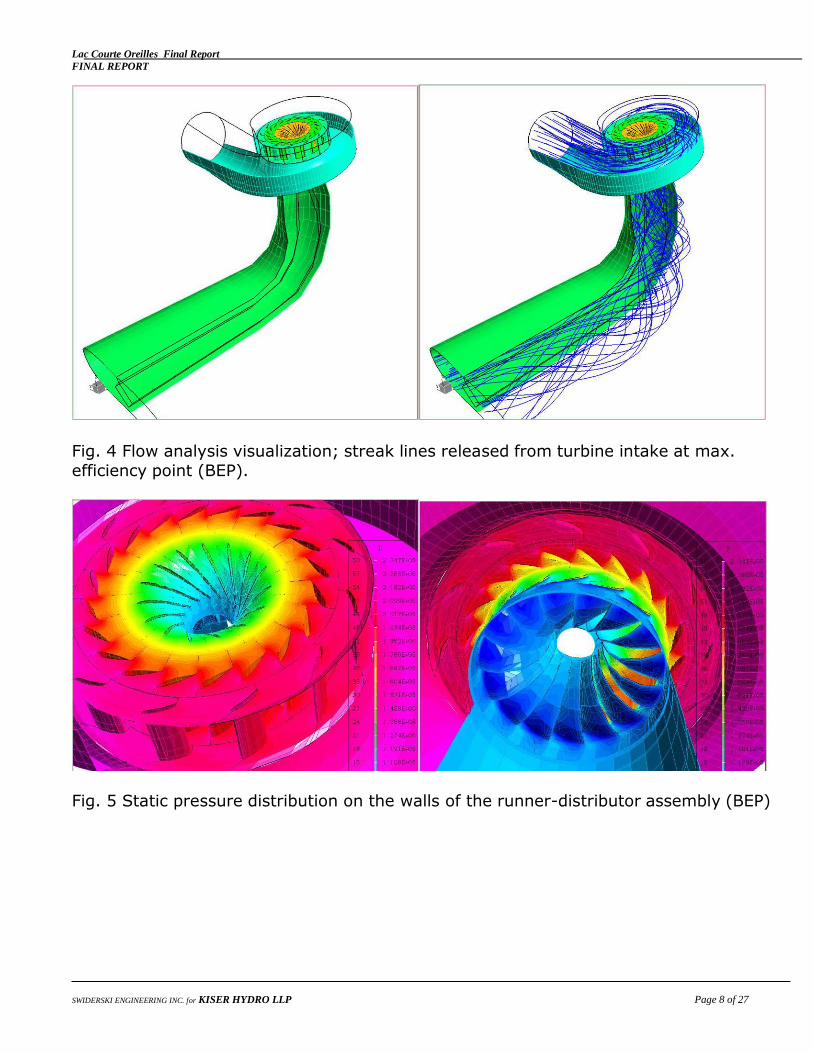
Fig. 4 Flow analysis visualization; streak lines released from turbine intake at max.
efficiency point (BEP).
Fig. 5 Static pressure distribution on the walls of the runner-distributor assembly (BEP)

Lac Courte Oreilles Final Report
FINAL REPORT
SWIDERSKI ENGINEERING INC. for KISER HYDRO LLP Page 9 of 27
Fig. 6 Static pressure distribution on the walls of the runner (BEP).
Fig. 7 Static pressure distribution on the single runner blade (BEP)
Lac Courte Oreilles Final Report
FINAL REPORT
SWIDERSKI ENGINEERING INC. for KISER HYDRO LLP Page 10 of 27
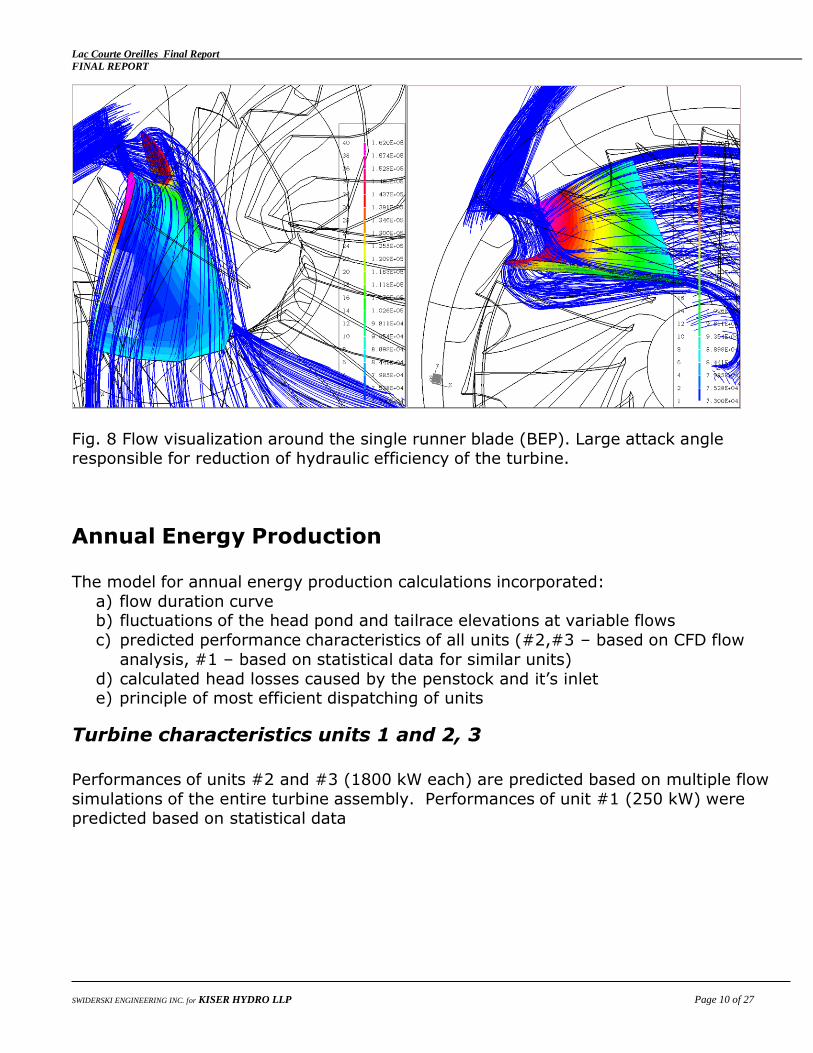
Fig. 8 Flow visualization around the single runner blade (BEP). Large attack angle responsible for reduction of hydraulic efficiency of the turbine.
Annual Energy Production
The model for annual energy production calculations incorporated:
a) flow duration curve
b) fluctuations of the head pond and tailrace elevations at variable flows
c) predicted performance characteristics of all units (#2,#3 – based on CFD flow
analysis, #1 – based on statistical data for similar units)
d) calculated head losses caused by the penstock and it’s inlet
e) principle of most efficient dispatching of units
Turbine characteristics units 1 and 2, 3
Performances of units #2 and #3 (1800 kW each) are predicted based on multiple flow
simulations of the entire turbine assembly. Performances of unit #1 (250 kW) were predicted based on statistical data

Lac Courte Oreilles Final Report
FINAL REPORT
SWIDERSKI ENGINEERING INC. for KISER HYDRO LLP Page 11 of 27
TUR
PRELIMIANRY
PROPOSAL ONLY
Tu
rbin
e E
ffic
ien
cy [
%]
RO
UG
H Z
ON
E
Tu
rbin
e S
haft
Po
we
r O
utp
ut
[kW
]
LCO units 2&3 EXISTING
Turbine Performances based on CFD
Turbine Efficiency
Turbine Shaft Power
90
80
70
60
50
40
30
20
BINE OPERATION RANGE AS IMPOSED BY THE SITE
CONDITIONS
3200 3100 3000 2900 2800 2700 2600 2500 2400 2300 2200 2100 2000 1900 1800 1700 1600 1500 1400 1300 1200 1100 1000 900 800 700 600 500 400 300 200
150 200 250 300 350 400 450 500 550 600 650 700 750 800 850 900 950
Flow [cfs]
Fig.9 Performances of units #2 and #3 as determined through the CFD analyses.
Lac Courte Oreilles Final Report
FINAL REPORT
SWIDERSKI ENGINEERING INC. for KISER HYDRO LLP Page 12 of 27
PRELIMINARY
PROPOSAL ONLY
Tu
rbin
e E
ffic
ien
cy [
%]
MO
ST
FR
EQ
UE
NT
OP
ER
AT
ION
D
UE
TO
SIT
E
CO
ND
ITIO
NS
Tu
rbin
e S
haft
Po
we
r O
utp
ut
[kW
]
LCO Unit 1 EXISTING
estimated performances
90 Turbine Efficiency
Turbine Shaft Power
500
450
88
400
86
350
84 300
250
82
200
80
150
78 100
50 55 60 65 70 75 80 85 90 95 100
Flow [cfs]
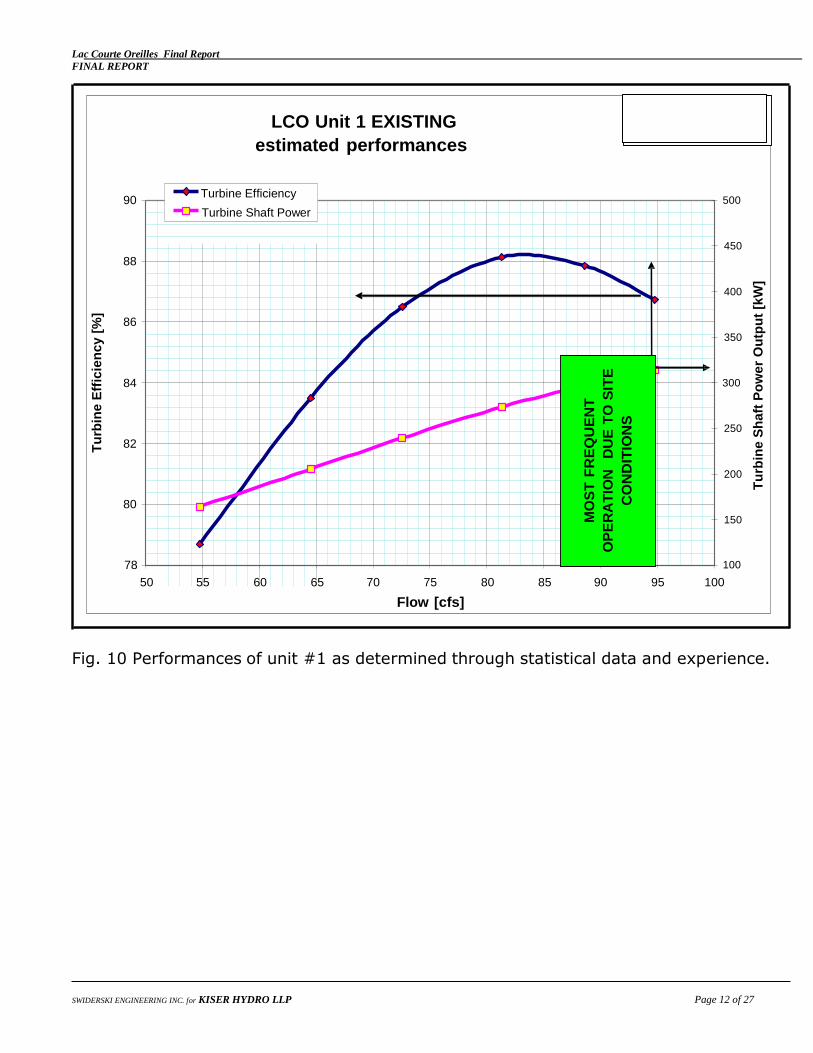
Fig. 10 Performances of unit #1 as determined through statistical data and experience.

Lac Courte Oreilles Final Report
FINAL REPORT
SWIDERSKI ENGINEERING INC. for KISER HYDRO LLP Page 13 of 27
Q
Eff [
%]
Eff [
%]
95%
Turbine performances Units 2 and 3
OPERATIONAL RANGE
85%
75%
65%
55%
45%
35%
25%
Anticipated
rough turbine
operation
15%
0.5 0.6 0.7 0.8 0.9 1.0 1.1 1.2 1.3 1.4 1.5 1.6 1.7 1.8
11
Fig.11 Practical operating range of turbines #2 and #3 determined through the analysis of the hydraulic conditions at the site (Q11 = Q/sqrt(H)/D^2)
95%
Turbine performances Unit 1
OPERATIONAL RANGE
90%
85%
80%
75%
70%
65%
60%
0.4 0.5 0.5 0.6 0.6 0.7 0.7 0.8 0.8
Q11
Fig.12 Practical operating range of turbine #1 determined through the analysis of the
hydraulic conditions at the site

Lac Courte Oreilles Final Report
FINAL REPORT
SWIDERSKI ENGINEERING INC. for KISER HYDRO LLP Page 14 of 27
Flo
w [
cfs
]
Gro
ss H
ea
d [
ft]
Flow duration curve and Annual Energy Production (AEP)
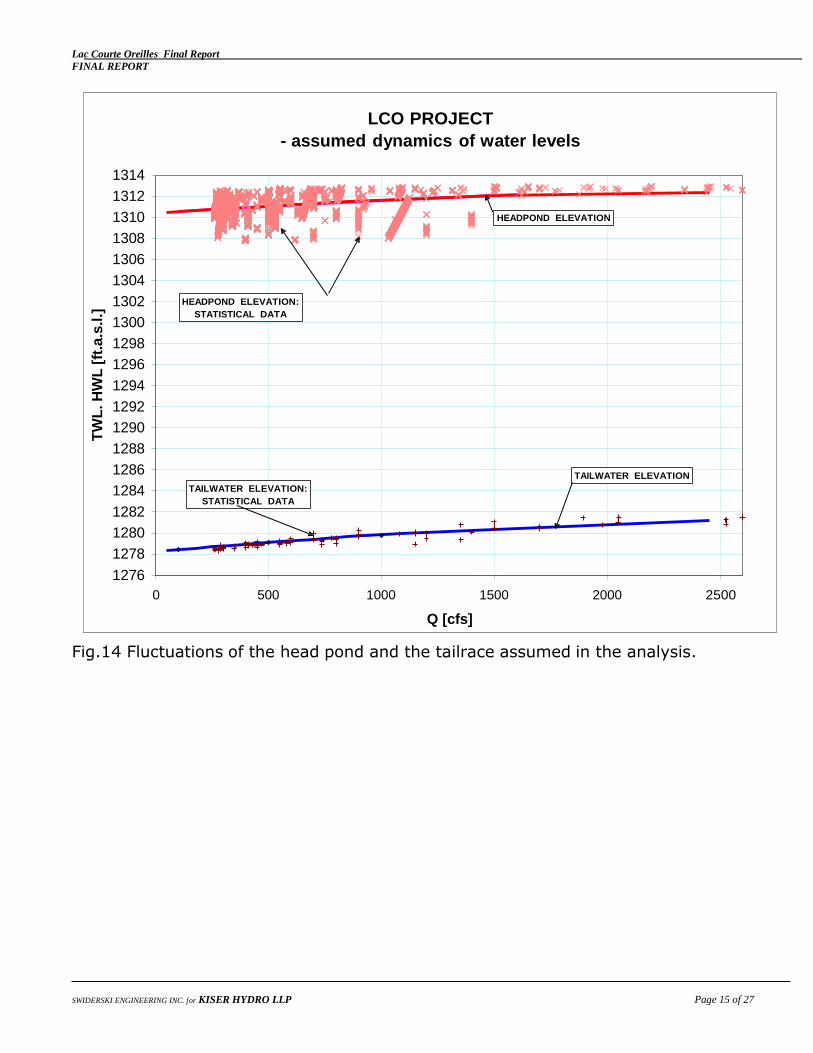
Flow duration curve and the dynamics of the head pond and the tailrace, which establish an input into the annual energy production calculations were supplied by the owner of
the LCO project. The curve representing Head was determined based on based on given Head pond and Tailrace levels changes based on the flow (Fig. 14)
2500
LCO HYDRO PROJECT
flow and averaged gross head duration curves
32.20
2250 32.10
2000
1750
1500
Gross Head
32.00
31.90
31.80
31.70
1250 31.60
1000 31.50
750
500
250
Flow
31.40
31.30
31.20
31.10
0 31.00
0% 10% 20% 30% 40% 50% 60% 70% 80% 90% 100%
Time [%]
Fig.13 Flow and gross head duration curves
Lac Courte Oreilles Final Report
FINAL REPORT
SWIDERSKI ENGINEERING INC. for KISER HYDRO LLP Page 15 of 27
TW
L. H
WL
[ft
.a.s
.l.]
LCO PROJECT
- assumed dynamics of water levels
1314
1312
1310
1308
1306
1304
1302
1300
1298
1296
1294
1292
1290
1288
1286
1284
1282
1280
1278
1276
HEADPOND ELEVATION:
STATISTICAL DATA
TAILWATER ELEVATION:
STATISTICAL DATA
HEADPOND ELEVATION
TAILWATER ELEVATION
0 500 1000 1500 2000 2500
Q [cfs]
Fig.14 Fluctuations of the head pond and the tailrace assumed in the analysis.

Lac Courte Oreilles Final Report
FINAL REPORT
SWIDERSKI ENGINEERING INC. for KISER HYDRO LLP Page 16 of 27
Hea
dlo
sse
s (
inclu
din
g p
en
scto
ck i
nle
t [f
t]
4.5
LCO HYDRO PROJECT
Calculated penstock losses
4.0
3.5
3.0
2.5
2.0
1.5
1.0
0.5
0.0
0 100 200 300 400 500 600 700 800 900 1000
Penstock flow [cfs]
Fig.15 Calculated penstock losses. Penstock losses were calculated based on losses coefficient published in hydraulic textbooks for the following components:
a) sudden contraction (penstock inlet)
b) cross-sectional change (square-to-round transition)
c) sharp bent
d) penstock surface roughness (steel, average rusted surface)
The resulting loss coefficient was at the end tuned-up based on information on
achievable maximum generator outputs.

Lac Courte Oreilles Final Report
FINAL REPORT
SWIDERSKI ENGINEERING INC. for KISER HYDRO LLP Page 17 of 27
Gen
era
tor
eff
icie
nc
y [
-]
LCO Hydro Project
Generator performances - assumed -
97.0%
96.0%
95.0%
94.0%
93.0%
92.0%
91.0% 0.0 0.2 0.4 0.6 0.8 1.0 1.2
Load [-]
Fig.15a Calculated generator efficiency. Typical efficiency curve for the synchronous
generator, which was assumed to determine efficiencies of each generator depending on portion of rated load they are exposed to.
Lac Courte Oreilles Final Report
FINAL REPORT
SWIDERSKI ENGINEERING INC. for KISER HYDRO LLP Page 18 of 27
-
Flo
w[c
ms
]
Flo
w[c
ms
]
Un
its o
n l
ine
O
vera
ll P
lan
t E
ffic
ien
cy
[%
]
LCO Hydro Project River Flow
Energy Production (EXISTING EXUIPMENT) Total Flow Turbines
Overall Hydraulic Efficiency 80
100.00%
90.00%
70
80.00%
60
70.00%
50
ZONE, WHERE LARGESST
40 WATER WASTE IS INCURRED
60.00%
50.00%
40.00%
30
30.00%
20
20.00%
10
FLOW THROUGH THE PLANT
10.00%
0 0.00%
0% 10% 20% 30% 40% 50% 60% 70% 80% 90% 100%
Time [%]
Fig.16 Calculation results presenting a history of plant operation: efficiency of turbines
and flow consumed by turbines.
LCO Hydro Project Energy Production (3)
80 8
70
Unit #3 online
Unit #2 online 7
60
Unit #1 online Unit #1 online 6
50 5
40 4
30 3
20 2
10 1
0 0
0% 10% 20% 30% 40% 50% 60% 70% 80% 90% 100%
Time [%]
Fig.17 Operational time of all units.
Lac Courte Oreilles Final Report
FINAL REPORT
SWIDERSKI ENGINEERING INC. for KISER HYDRO LLP Page 19 of 27
SUMMARY
Time
River Flow
TWL
HWL
Gross
Head
Hlos
Hnet
Spilling
Total Flow
Turbines
Energy Production
Overall
Hydraulic
Efficiency
[cfs] [ft.a.s.l.] [ft.a.s.l.] [ft] [ft] [ft] [cfs] [cfs] [kWh] [%]
0% 2454 1281.2 1312.3 31.1 4.08 27.07 773 1681 54.6%
10% 1500 1280.4 1312.0 31.7 3.29 28.40 0 1500 2,657,356 83.0%
20% 1091 1279.9 1311.7 31.8 1.80 29.98 0 1091 2,217,852 74.7%
30% 851 1279.6 1311.4 31.8 3.82 28.02 0 851 1,629,181 81.7%
40% 700 1279.4 1311.3 31.9 2.58 29.29 0 700 1,344,386 81.7%
50% 550 1279.2 1311.1 31.9 1.60 30.32 0 550 1,101,352 77.6%
60% 440 1279.0 1311.0 31.9 1.02 30.93 0 440 819,575 67.2%
70% 340 1278.8 1310.8 32.0 0.61 31.38 0 340 556,332 54.7%
80% 252 1278.7 1310.7 32.0 0.03 31.99 172 80 295,439 26.3%
90% 179 1278.5 1310.6 32.1 0.03 32.02 99 80 157,843 37.2%
100% 49 1278.3 1310.4 32.1 0.01 32.12 0 49 127,427 82.7%
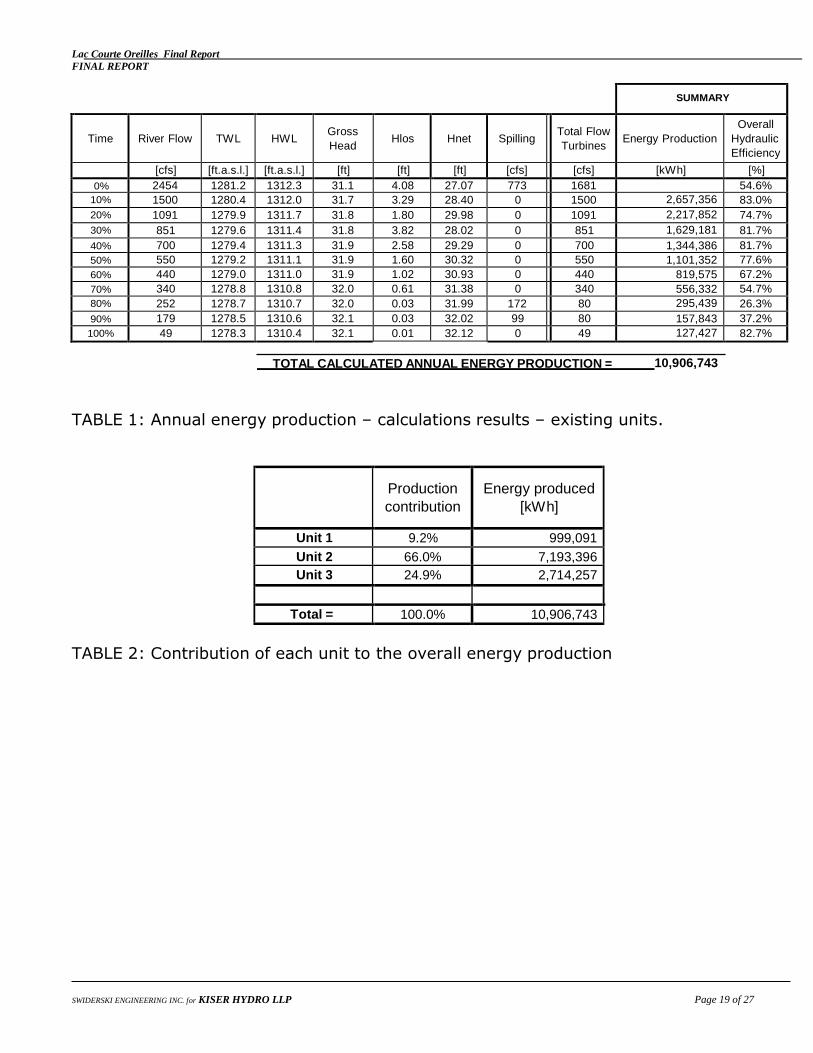
TOTAL CALCULATED ANNUAL ENERGY PRODUCTION = 10,906,743
TABLE 1: Annual energy production – calculations results – existing units.
Production
contribution
Energy produced
[kWh]
Unit 1 9.2% 999,091
Unit 2 66.0% 7,193,396
Unit 3 24.9% 2,714,257
Total = 100.0% 10,906,743
TABLE 2: Contribution of each unit to the overall energy production
Lac Courte Oreilles Final Report
FINAL REPORT
SWIDERSKI ENGINEERING INC. for KISER HYDRO LLP Page 20 of 27
Proposed upgrade
The proposed upgrade is based on a set goal of achieving maximal increase in the AEP,
while incurring the smallest capital investment and the lowest possible technical risk.
Simulations of AEP based on existing turbines characteristics (Units 2&3 – based on CFD analysis of the existing unit, Unit 1 – formed on experience-based anticipation) shows
that units 2 and 3 work on the so-called “part-load” portions of their characteristics. Maximum power of the generator is reached even before the turbine gets to its peak
efficiency, which means that both units (2&3) have oversized capacities Taking into account the fact that appropriate capacity of this plant should be approximately 40 to 42
cms (1400 cfs – 1500 cfs), size of generators 2&3 is appropriate. The reduction of turbines capacities (2&3), while increasing their hydraulic efficiency is
achievable by replacing turbine runner with a modern lower capacity, design, , which
will shift turbine characteristic so the machine will be capable of operating between 250cfs and 650 cfs, having best performances at approximately 450 to 550 cfs depending on the Net Head.
As the small units contributes to the AEP during the very high flow times (some 10 –
15% of the time) and at the minimal flows (below 250cfs, which happens some 25% of the time), it would be desired to increase unit 1 capacity above the existing 90 cfs. Having limited dimensional data about this unit, it was safely assumed that a higher capacity newly designed runner should bring capacity of this turbine to 100 cfs.
Lac Courte Oreilles Final Report
FINAL REPORT
SWIDERSKI ENGINEERING INC. for KISER HYDRO LLP Page 21 of 27
PRELIMIANRY
PROPOSAL ONLY
Tu
rbin
e E
ffic
ien
cy [
%]
EX
PE
CT
ED
RO
UG
H Z
ON
E -
DR
AF
T T
UB
E
AE
RA
TIO
N M
AY
BE
RE
QU
IRE
D
Tu
rbin
e S
haft
Po
wer
Ou
tpu
t [k
W]
LCO units 2&3 NEW PROPOSED
Turbine Performances based on CFD
Turbine Efficiency
Turbine Shaft Power
90
80
70
60
50
40
30
TURBINE OPERATION RANGE AS IMPOSED BY THE SITE
CONDITIONS
20
3200 3100 3000 2900 2800 2700 2600 2500 2400 2300 2200 2100 2000 1900 1800 1700 1600 1500 1400 1300 1200 1100 1000 900 800 700 600 500 400 300 200
150 200 250 300 350 400 450 500 550 600 650 700 750 800 850 900 950
Flow [cms]
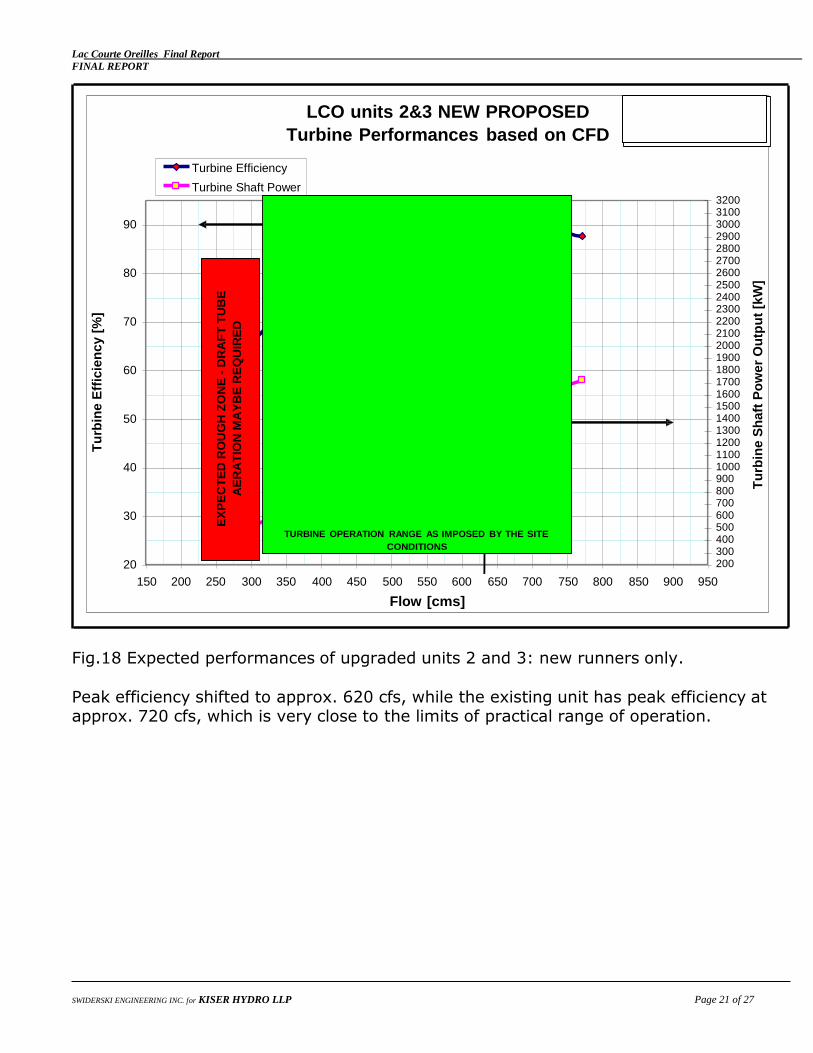
Fig.18 Expected performances of upgraded units 2 and 3: new runners only.
Peak efficiency shifted to approx. 620 cfs, while the existing unit has peak efficiency at approx. 720 cfs, which is very close to the limits of practical range of operation.
Lac Courte Oreilles Final Report
FINAL REPORT
SWIDERSKI ENGINEERING INC. for KISER HYDRO LLP Page 22 of 27
PRELIMINARY
PROPOSAL ONLY
Tu
rbin
e E
ffic
ien
cy
[%
]
MO
ST
FR
EQ
UE
NT
OP
ER
AT
ION
D
UE
TO
SIT
E C
ON
DIT
ION
S
Tu
rbin
e S
haft
Po
we
r O
utp
ut
[kW
]
LCO Unit 1 NEW PROPOSED
estimated performances
90 Turbine Efficiency
Turbine Shaft Power
500
450
88
400
86
350
84 300
250
82
200
80
150
78 100
50.0 60.0 70.0 80.0 90.0 100.0 110.0
Flow [cfs]
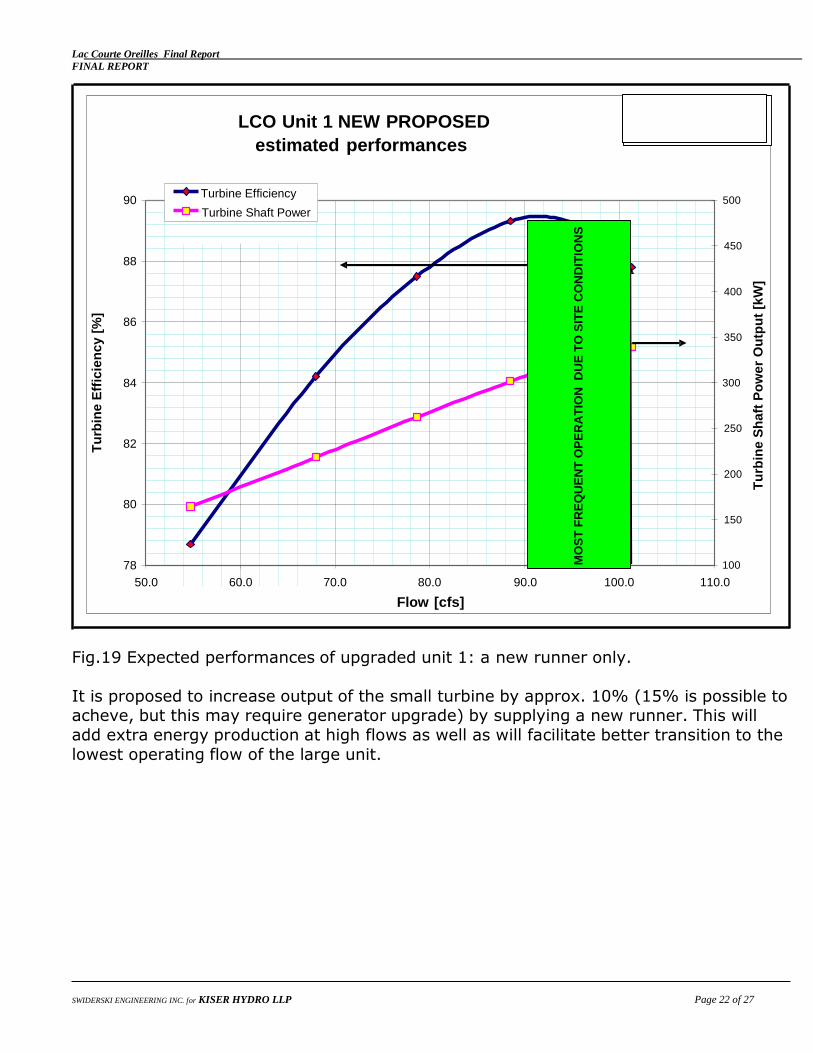
Fig.19 Expected performances of upgraded unit 1: a new runner only. It is proposed to increase output of the small turbine by approx. 10% (15% is possible to acheve, but this may require generator upgrade) by supplying a new runner. This will
add extra energy production at high flows as well as will facilitate better transition to the
lowest operating flow of the large unit.
Lac Courte Oreilles Final Report
FINAL REPORT
SWIDERSKI ENGINEERING INC. for KISER HYDRO LLP Page 23 of 27
-
Flo
w[c
ms
]
Flo
w[c
ms
]
Ov
era
ll P
lan
t E
ffic
ien
cy [
%]
Un
its
on
lin
e
LCO Hydro Project Energy Production (MODERNIZED TURBINES)
80
River Flow
Total Flow Turbines
Overall Hydraulic Efficiency
EXISTING EQUIPMENT EFFICIENCY
100.00%
90.00%
70
80.00%
60
70.00%
50 60.00%
40 50.00%
30 ZONE, WHERE DRAFT TUBE
AERATION OF UNIT #2
MAYBE REQUIRED 20
40.00%
30.00%
20.00%
10
FLOW THROUGH THE PLANT
10.00%
0 0.00%
0% 10% 20% 30% 40% 50% 60% 70% 80% 90% 100%
Time [%]
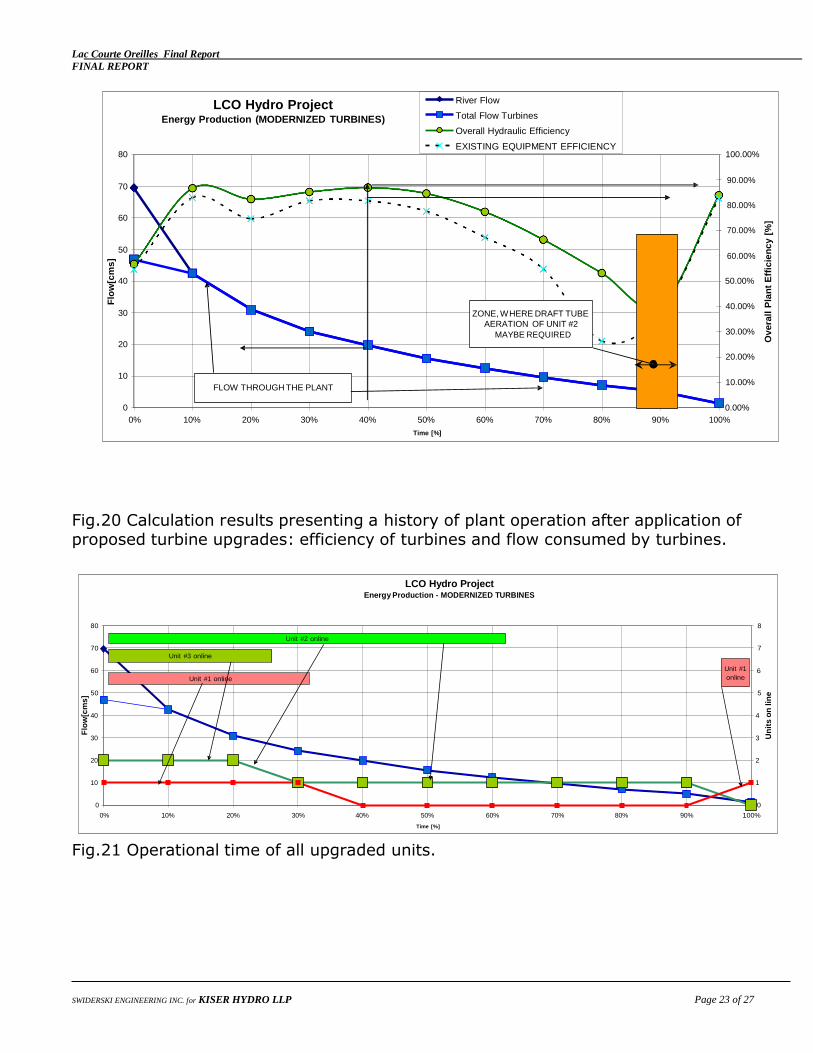
Fig.20 Calculation results presenting a history of plant operation after application of proposed turbine upgrades: efficiency of turbines and flow consumed by turbines.
LCO Hydro Project Energy Production - MODERNIZED TURBINES
80
70
Unit #3 online
60
Unit #1 online
50
Unit #2 online
8
7
Unit #1 6 online
5
40 4
30 3
20 2
10 1
0 0
0% 10% 20% 30% 40% 50% 60% 70% 80% 90% 100%
Time [%]
Fig.21 Operational time of all upgraded units.
Lac Courte Oreilles Final Report
FINAL REPORT
SWIDERSKI ENGINEERING INC. for KISER HYDRO LLP Page 24 of 27
SUMMARY
Time
River Flow
TWL
HWL
Gross
Head
Hlos
Hnet
Spilling
Total Flow
Turbines
Energy
Production
Overall
Hydraulic
Efficiency
[cfs] [ft.a.s.l.] [ft.a.s.l.] [ft] [ft] [ft] [cfs] [cfs] [kWh] [%]
0% 2454 1281.2 1312.3 31.1 3.99 27.16 798 1656 56.8%
10% 1500 1280.4 1312.0 31.7 3.31 28.38 0 1500 2,772,757 86.7%
20% 1091 1279.9 1311.7 31.8 1.82 29.96 0 1091 2,367,831 82.4%
30% 851 1279.6 1311.4 31.8 3.82 28.02 0 851 1,752,838 85.2%
40% 700 1279.4 1311.3 31.9 2.58 29.29 0 700 1,415,154 86.9%
50% 550 1279.2 1311.1 31.9 1.59 30.32 0 550 1,184,826 84.6%
60% 440 1279.0 1311.0 31.9 1.02 30.93 0 440 914,292 77.4%
70% 340 1278.8 1310.8 32.0 0.61 31.38 0 340 653,511 66.4%
80% 252 1278.7 1310.7 32.0 0.33 31.69 0 252 420,351 53.2%
90% 179 1278.5 1310.6 32.1 0.17 31.89 0 179 242,593 40.1%
100% 49 1278.3 1310.4 32.1 0.01 32.12 0 49 134,014 83.9%
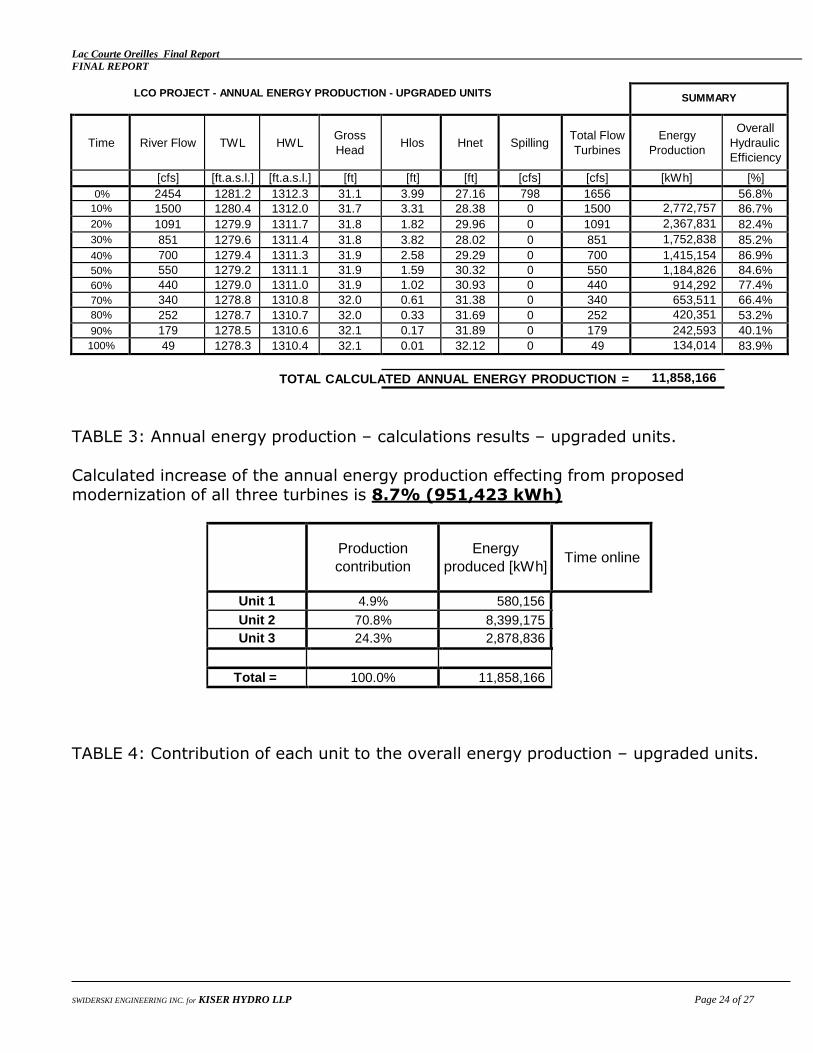
LCO PROJECT - ANNUAL ENERGY PRODUCTION - UPGRADED UNITS
TOTAL CALCULATED ANNUAL ENERGY PRODUCTION = 11,858,166
TABLE 3: Annual energy production – calculations results – upgraded units.
Calculated increase of the annual energy production effecting from proposed modernization of all three turbines is 8.7% (951,423 kWh)
Production
contribution
Energy
produced [kWh]
Time online
Unit 1 4.9% 580,156 Unit 2 70.8% 8,399,175
Unit 3 24.3% 2,878,836
Total = 100.0% 11,858,166
TABLE 4: Contribution of each unit to the overall energy production – upgraded units.

Lac Courte Oreilles Final Report
FINAL REPORT
SWIDERSKI ENGINEERING INC. for KISER HYDRO LLP Page 25 of 27
100.00%
Flo
w[c
ms
]
Ov
era
ll P
lan
t E
ffic
ien
cy [
%]
Proposed partial upgrade: Unit #2 only
Scenario of a partial plant upgrade was analyzed after consultations with Kiser Hydro
LLP. Energy production calculations and the turbine dispatching schedule was conducted
for three various units: Unit #1 – as is
Unit #2 – upgraded (new runner and possibly draft tube aeration system to facilitate turbine operation at lowest loads)
Unit #3 – as is.
Calculated incremental revenue is 7.3% (797,513 kWh) higher than for the plant equipped with all existing units.
LCO Hydro Project Energy Production (PARTIAL UPGRADE: ONLY UNIT 2 WITH NEW RUNNER)
River Flow Total Flow Turbines
Overall Hydraulic Efficiency
80
EXISTING EQUIPMENT EFFICIENCY
90.00% 70
80.00%
60
70.00%
50 60.00%
40
ZONE, WHERE DRAFT TUBE
AERATION OF UNIT #2 30 MAYBE REQUIRED
20
50.00%
40.00%
30.00%
20.00%
10
FLOW THROUGH THE PLANT
10.00%
0 0.00%
0% 10% 20% 30% 40% 50% 60% 70% 80% 90% 100%
Time [%]
Fig.22 Calculation results presenting a history of plant operation after application of
proposed partial upgrade (unit #2 only): efficiency of turbines and flow consumed by turbines.
Lac Courte Oreilles Final Report
FINAL REPORT
SWIDERSKI ENGINEERING INC. for KISER HYDRO LLP Page 26 of 27
-
SUMMARY
Time
River Flow
TWL
HWL
Gross
Head
Hlos
Hnet
Spilling
Total Flow
Turbines
Energy
Production
Overall
Hydraulic
Efficiency
[cfs] [ft.a.s.l.] [ft.a.s.l.] [ft] [ft] [ft] [cfs] [cfs] [kWh] [%]
0% 2454 1281.2 1312.3 31.1 4.84 26.31 628 1826 53.4%
10% 1500 1280.4 1312.0 31.7 2.91 28.77 0 1500 2,634,856 84.6%
20% 1091 1279.9 1311.7 31.8 1.34 30.44 0 1091 2,346,375 80.4%
30% 851 1279.6 1311.4 31.8 3.26 28.57 0 851 1,753,466 84.4%
40% 700 1279.4 1311.3 31.9 2.58 29.29 0 700 1,423,650 87.0%
50% 550 1279.2 1311.1 31.9 1.59 30.32 0 550 1,185,007 84.6%
60% 440 1279.0 1311.0 31.9 1.02 30.93 0 440 913,268 77.2%
70% 340 1278.8 1310.8 32.0 0.61 31.38 0 340 652,140 66.2%
80% 252 1278.7 1310.7 32.0 0.33 31.69 0 252 419,690 53.1%
90% 179 1278.5 1310.6 32.1 0.17 31.89 0 179 242,099 39.9%
100% 49 1278.3 1310.4 32.1 0.01 32.12 0 49 133,704 84.1%
Flo
w[c
ms
]
Un
its o
n l
ine
LCO Hydro Project
Energy Production (PARTIAL UPGRADE: UNIT 2 ONLY)
80 8
70
Unit #3 online
60
Unit #1 online
50
Unit #1
Unit #2 online
7
6
Unit #1
5
40 4
30 3
20 2
10 1
0 0
0% 10% 20% 30% 40% 50% 60% 70% 80% 90% 100%
Time [%]
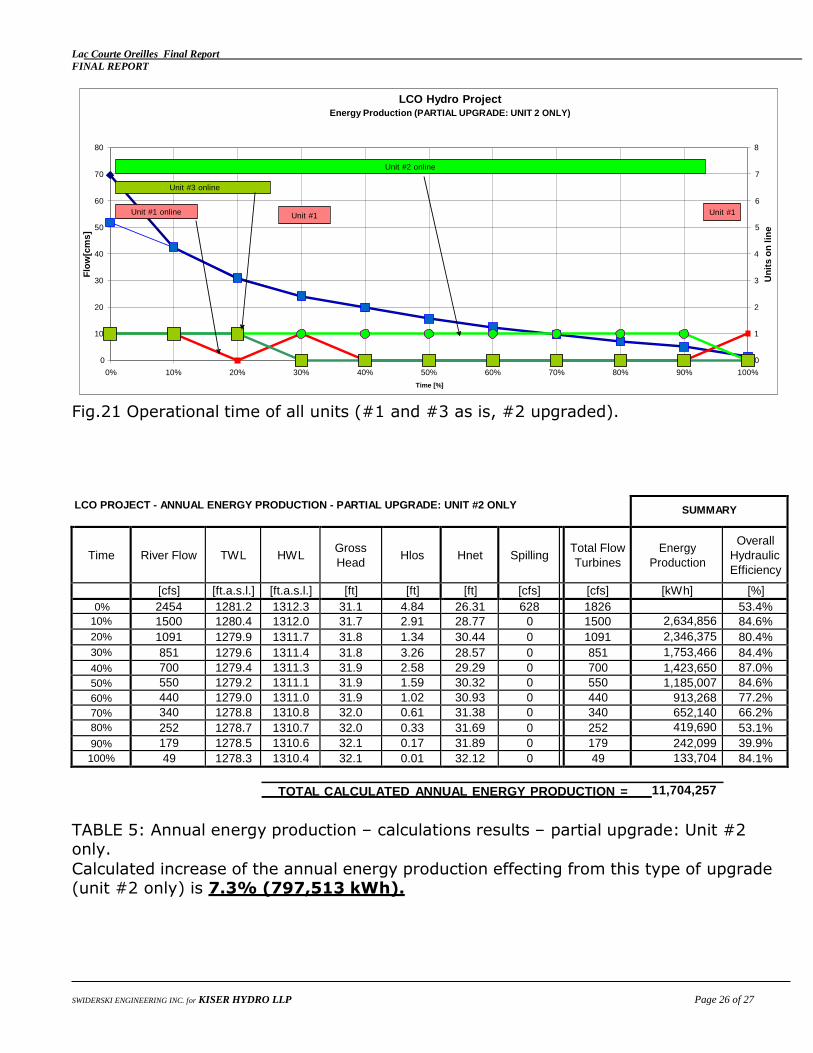
Fig.21 Operational time of all units (#1 and #3 as is, #2 upgraded).
LCO PROJECT - ANNUAL ENERGY PRODUCTION - PARTIAL UPGRADE: UNIT #2 ONLY
TOTAL CALCULATED ANNUAL ENERGY PRODUCTION = 11,704,257
TABLE 5: Annual energy production – calculations results – partial upgrade: Unit #2 only.
Calculated increase of the annual energy production effecting from this type of upgrade
(unit #2 only) is 7.3% (797,513 kWh).
Lac Courte Oreilles Final Report
FINAL REPORT
SWIDERSKI ENGINEERING INC. for KISER HYDRO LLP Page 27 of 27
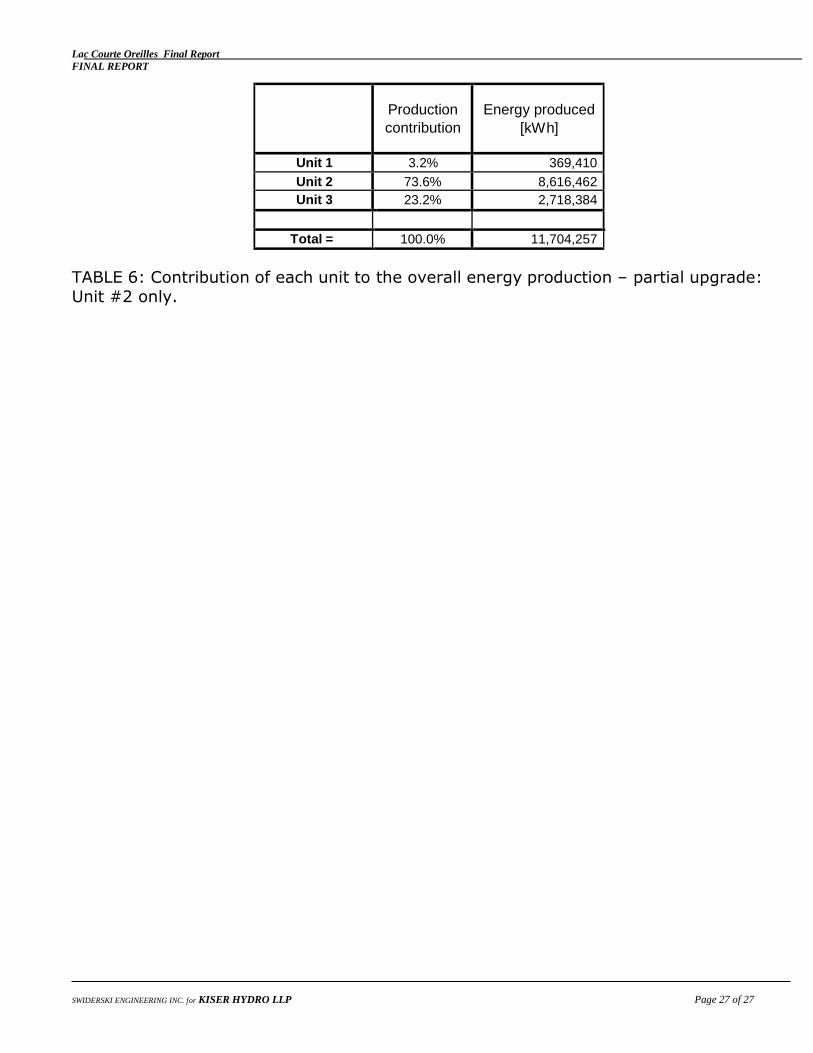
Production
contribution
Energy produced
[kWh]
Unit 1 3.2% 369,410
Unit 2 73.6% 8,616,462
Unit 3 23.2% 2,718,384
Total = 100.0% 11,704,257
TABLE 6: Contribution of each unit to the overall energy production – partial upgrade: Unit #2 only.

UPGRADE ESTIMATES
SUMMARY OF UPGRADE PROPOSAL #1
After analysis of the existing units and available flows it is being proposed to upgrade all three of the existing units to operate more efficiently as well as over a wider range of flows. Unit #1 would be upgraded to operate with higher flows. Because of the higher flows and larger overall capacity, the correlating generator may also have to be replaced or rewound to accommodate the higher outputs. Units #2 and #3 would be upgraded to operate under a wider range of flows. The generators for both of these units are sized appropriately, since the overall output would not be increasing.
ESTIMATE
U
NIT
#1
Design & Fabrication
$175,000
Removal & Installation
$200,000
Generator Upgrade
$50,000
UN
IT #
2
Design & Fabrication
$375,000
Removal & Installation
$250,000
UN
IT #
3
Design & Fabrication
$375,000
Removal & Installation
$250,000
TOTAL
$1,675,000
SUMMARY OF UPGRADE PROPOSAL #2
After analysis of the existing units and available flows a second, less aggressive upgrade is being proposed. This proposal includes an upgrade to Unit #2 to be operable under a wider range of flows, to go as low as the minimum flow of 250 cfs. A draft tube aeration system may be necessary to operate smoothly at lower flows. Because the need for an aeration system will not be known until further design is completed the estimate for the upgrade does not include costs associated with this.
ESTIMATE
Design & Fabrication
$450,000
Removal & Installation
$250,000
TOTAL
$700,000

UP
GR
AD
E
SUMMARY TABLE OF PROPOSED UPGRADES
The table below was developed to illustrate a direct comparison of the existing equipment in operation
with the two proposed upgrade scenarios. The projected Annual Energy Production (AEP) was taken from
the CFD Based Upgrade Analysis Final Report prepared by Swiderski Engineering Inc. The Estimated Cost
of Upgrades are Rough Order of Magnitude (ROM) prices based on limited design. These estimates do
include removal of the existing units as well as installation of the new designs.
Table 1: Relative Cost & Annual Energy Production Comparison
CONTRIBUTION
ENERGY
PRODUCED
(kWh)
ANNUAL
ENERGY
PRODUCTION
(kWh)
ESTIMATED COST OF
UPGRADE
EXIS
TIN
G
EQU
IPM
ENT
Unit 1
9.2%
999,091
10,906,744
NA
Unit 2
66.0%
7,193,396
Unit 3
24.9%
2,714,257
UN
ITS
#1
, #2
& #
3
UP
GR
AD
E
Unit 1
4.9%
580,156
11,858,167
$375,000
$1,625,000
Unit 2
70.8%
8,399,175
$625,000
Unit 3
24.3%
2,878,836
$625,000
UN
IT #
2
Unit 1
3.2%
369,410
11,704,256
NA
$700,000
Unit 2
73.6%
8,616,462
$700,000
Unit 3
23.2%
2,718,384
NA
FINAL REPORT
DATE: April 3, 2014
CUSTOMER: Lac Courte Oreilles Band of Lake Superior Chippewa 13394 West Trepania Road Hayward, WI 54843
PROJECT: Turbine Analysis
JOB NUMBER: 13-33
SUMMARY OF PROJECT
Kiser Hydro has been contracted to evaluate the existing turbines at the Winter Dam Hydro facility. Existing geometry will be used in conjunction with historical flows and power production to evaluate the efficiency of the plant and its power producing capabilities. Through use of Computational Fluid Dynamics (CFD) Analysis, Kiser Hydro will be better able to determine possible turbine improvements that would benefit overall plant efficiency and annual power production.
FIELD SERVICES
Kiser Hydro performed two site visits to verify infrastructure of the units involved in the analysis. Overall measurements and orientation were confirmed with the prints that were made available to Kiser Engineering.
GKS Services was brought on site to perform a 3D laser scan of the turbine blades. By scanning the existing blades a Computer Aided Design (CAD) model was created and used in the CFD analysis. Due to the constricting geometry of Unit #1, it was not feasible to scan the existing blades. For the analysis, the scan and 3D model of the blades from Unit #2 were used to represent both Units #2 and #3, and were then scaled down and used for Unit #1.
ENGINEERING SERVICES
Kiser Hydro contracted Swiderski Engineering, Inc to perform the CFD analysis of the existing turbines. The analysis was performed using verified prints of the existing equipment and historical data of available flows. After completing analysis of the existing equipment, Swiderski Engineering analyzed two possible upgrade scenarios and summarized the findings.
Upgrade Scenario #1 included upgrades of all three units, which resulted in an increase of annual energy production of 8.7%. Upgrade Scenario #2 consisted of a partial upgrade, in upgrading only one of the large units, Unit #2 or Unit #3. The expected increase in annual energy production is 7.3%. These upgrades would allow for the large units (Units #2 and/or #3) to be operated over a wider range of flows. This results in greater efficiencies and less “lost” water.
RECOMMENDATIONS
Given the cost comparisons of the two proposed upgrade scenarios combined with their respective expected increases in annual energy production, Kiser Hydro recommends performing a partial upgrade in upgrading Unit #2 or Unit #3. This upgrade is the most fiscally reasonable given the costs associated with upgrading one unit compared to the costs associated with upgrading all three units.


UNIT #1 • WJ Bauer Ø40 Inch Francis Runner • 14 Blades • Shares Penstock with Unit #2 • Operating Flows: 86.5-95 cfs • Duration of Annual Operation : ~46% • Average Annual Energy Production (AEP): 1 MWh,
9.1% of Plant Total
UNIT #2 & #3 • WJ Bauer Ø93 Inch Francis Runner • 15 Blades • Operating Flows: 325-760 cfs • Duration of Annual Operation Unit #2: ~86% • Duration of Annual Operation Unit #3: ~52% • Average AEP Unit #2: 7.2 MWh, 66% of Plant Total • Average AEP Unit #3: 2.7 MWh, 24.9% of Plant
Total
Unit #2 Runner
Unit #2 Wicket Gates

A scan of existing runner geometry was completed for use in the Computation Fluid
Dynamic (CFD) analysis.
A 3D model was created with the information gathered
from the scan.


Tu
rbin
e E
ffic
ien
cy [
%]
MO
ST
FR
EQ
UE
NT
OP
ER
AT
ION
D
UE
TO
SIT
E
CO
ND
ITIO
NS
Tu
rbin
e S
haft
Po
we
r O
utp
ut
[kW
]
LCO Unit 1 EXISTING
estimated performances
PRELIMINARY
PROPOSAL ONLY
90 Turbine Efficiency
Turbine Shaft Power
88
86
84
82
500
450
400
350
300
250
200
MAX EFFICIENCY: ~88.3%
MAX POWER: ~312 kW
EFFICIENCY @ MAX POWER:
~86.8%
80
150
78 100
50 55 60 65 70 75 80 85 90 95 100
Flow [cfs]
TUR
Tu
rbin
e E
ffic
ien
cy [
%]
RO
UG
H Z
ON
E
Tu
rbin
e S
haft
Po
we
r O
utp
ut
[kW
]
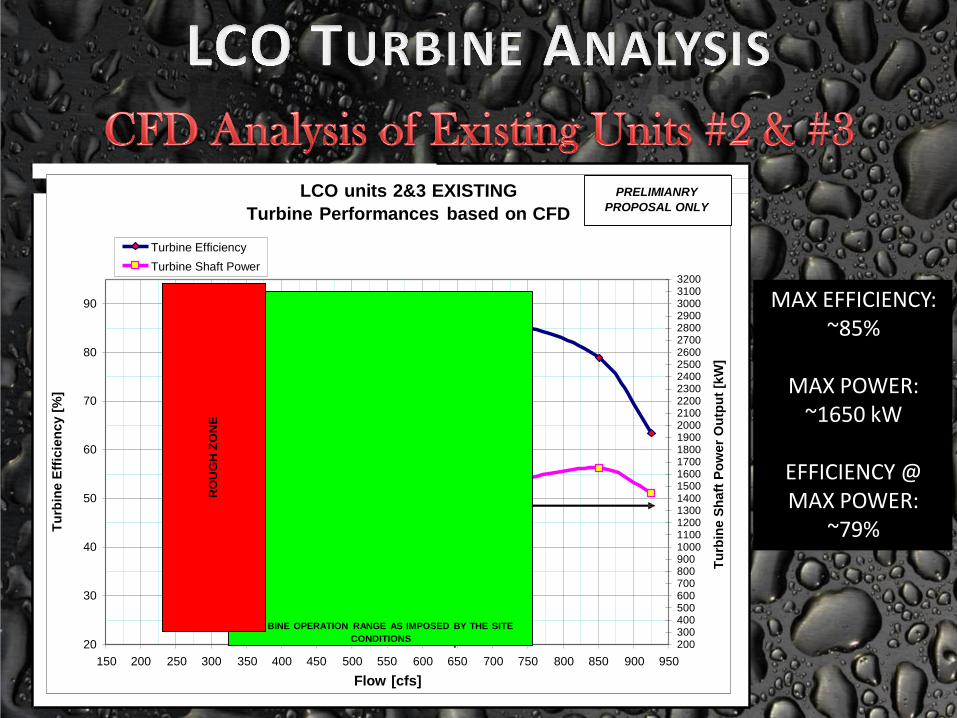
LCO units 2&3 EXISTING
Turbine Performances based on CFD
PRELIMIANRY
PROPOSAL ONLY
Turbine Efficiency
Turbine Shaft Power
90
80
70
60
50
40
30
20
BINE OPERATION RANGE AS IMPOSED BY THE SITE
CONDITIONS
3200 3100 3000 2900 2800 2700 2600 2500 2400 2300 2200 2100 2000 1900 1800 1700 1600 1500 1400 1300 1200 1100 1000 900 800 700 600 500 400 300 200
MAX EFFICIENCY: ~85%
MAX POWER: ~1650 kW
EFFICIENCY @ MAX POWER:
~79%
150 200 250 300 350 400 450 500 550 600 650 700 750 800 850 900 950
Flow [cfs]

(EXISTING EQUIPMENT) (EXISTING EXUIPMENT)
Flo
w[c
ms
]
Ov
era
ll P
lan
t E
ffic
ien
cy
[%
]
LCO Hydro Project River Flow
Energy Production (EXISTING EQUIPMENT)
Total Flow Turbines
Overall Hydraulic Efficiency 80
100.00%
90.00%
70
80.00%
60
70.00%
50
ZONE, WHERE LARGESST
40 WATER WASTE IS INCURRED
60.00%
50.00%
40.00%
30
30.00%
20
20.00%
10
FLOW THROUGH THE PLANT
10.00%
0 0.00%
0% 10% 20% 30% 40% 50% 60% 70% 80% 90% 100%
Time [%]
Units Are Not Properly Sized For Available Flows Resulting in Large Amounts of Bypassing Water 75-85% of the Time
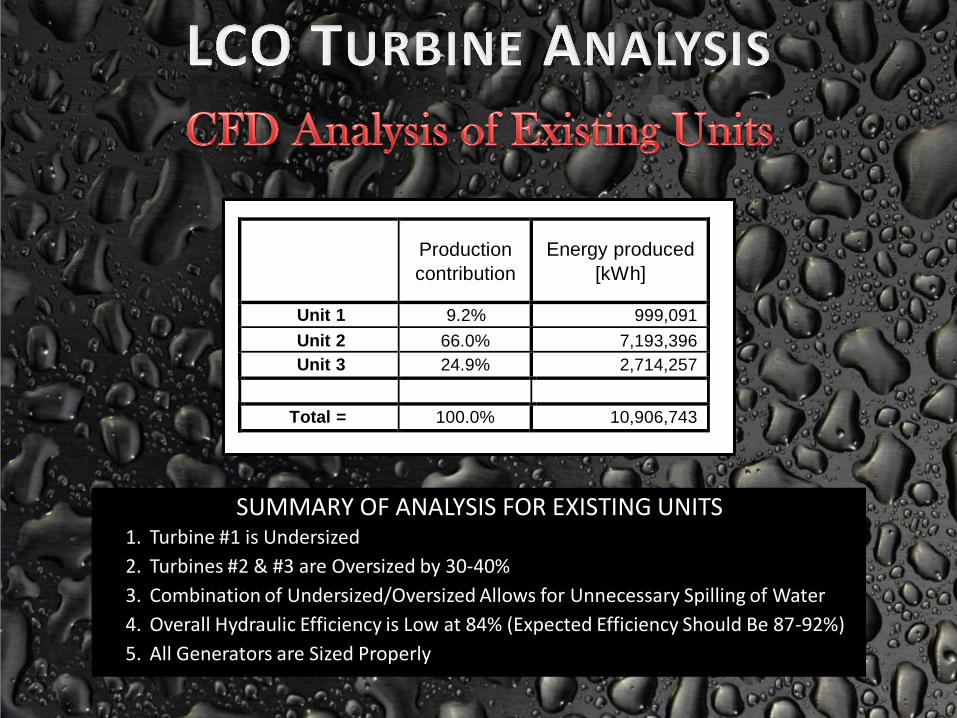
Production
contribution
Energy produced
[kWh]
Unit 1 9.2% 999,091
Unit 2 66.0% 7,193,396
Unit 3 24.9% 2,714,257
Total = 100.0% 10,906,743
SUMMARY OF ANALYSIS FOR EXISTING UNITS 1. Turbine #1 is Undersized
2. Turbines #2 & #3 are Oversized by 30-40%
3. Combination of Undersized/Oversized Allows for Unnecessary Spilling of Water
4. Overall Hydraulic Efficiency is Low at 84% (Expected Efficiency Should Be 87-92%)
5. All Generators are Sized Properly

PROPOSAL #1 UPGRADE UNITS #1, #2, & #3
1. Design & fabricate new turbines for all three existing units
2. Unit #1 would be designed to operate up to 100-150 cfs. This would increase the unit’s capacity which will also result in adjusting the capacity
allowed by the existing generator.
3. Units #2 & #3 would be designed to operate at 250 -650 cfs.
4. Expected increase in Annual Energy Production of Approximately 8.7%

Tu
rbin
e E
ffic
ien
cy [
%]
MO
ST
FR
EQ
UE
NT
OP
ER
AT
ION
D
UE
TO
SIT
E C
ON
DIT
ION
S
Tu
rbin
e S
haft
Po
we
r O
utp
ut
[kW
]
LCO Unit 1 NEW PROPOSED
estimated performances
PRELIMINARY
PROPOSAL ONLY
90 Turbine Efficiency
Turbine Shaft Power
88
86
84
82
500
450
400
350
300
250
200
MAX EFFICIENCY: ~89.5%
MAX POWER: ~337 kW
EFFICIENCY @ MAX POWER:
~87.8%
80
150
78 100
50.0 60.0 70.0 80.0 90.0 100.0 110.0
Flow [cfs]

Tu
rbin
e E
ffic
ien
cy [
%]
EX
PE
CT
ED
RO
UG
H Z
ON
E -
DR
AF
T T
UB
E
AE
RA
TIO
N M
AY
BE
RE
QU
IRE
D
Tu
rbin
e S
haft
Po
wer
Ou
tpu
t [k
W]
LCO units 2&3 NEW PROPOSED
Turbine Performances based on CFD
PRELIMIANRY
PROPOSAL ONLY
Turbine Efficiency
Turbine Shaft Power
90
80
70
60
50
40
30
TURBINE OPERATION RANGE AS IMPOSED BY THE SITE
CONDITIONS
20
3200 3100 3000 2900 2800 2700 2600 2500 2400 2300 2200 2100 2000 1900 1800 1700 1600 1500 1400 1300 1200 1100 1000 900 800 700 600 500 400 300 200
MAX EFFICIENCY: ~91%
MAX POWER: ~1750 kW
EFFICIENCY @ MAX POWER:
~88%
150 200 250 300 350 400 450 500 550 600 650 700 750 800 850 900 950
Flow [cms]

Flo
w[c
ms
]
Ov
era
ll P
lan
t E
ffic
ien
cy [
%]
LCO Hydro Project Energy Production (MODERNIZED TURBINES)
80
River Flow
Total Flow Turbines
Overall Hydraulic Efficiency
EXISTING EQUIPMENT EFFICIENCY
100.00%
90.00%
70
80.00%
60
70.00%
50 60.00%
40 50.00%
30 ZONE, WHERE DRAFT TUBE
AERATION OF UNIT #2
MAYBE REQUIRED 20
40.00%
30.00%
20.00%
10
FLOW THROUGH THE PLANT
10.00%
0 0.00%
0% 10% 20% 30% 40% 50% 60% 70% 80% 90% 100%
Time [%]
Properly Sized Units Result in Higher Hydraulic Efficiency Amount of Spilled Water is Significantly Decreased

Production
contribution
Energy
produced [kWh] Time online
Unit 1 4.9% 580,156
Unit 2 70.8% 8,399,175
Unit 3 24.3% 2,878,836
Total = 100.0% 11,858,166
SUMMARY OF PROPOSAL #1 BENEFITS: 1. Increase in Annual Energy Production by Approximately 8.7% (951,423 kWh)
2. Unit #1 Will Have Increased Operating Range (Up to 100-150 cfs)
3. Units #2 & #3 Will Have Extended Operating Range (Down to 250 cfs)
4. Larger Operating Range Allows for High Overall Hydraulic Efficiencies

PROPOSAL #2 UPGRADE UNITS #2 OR #3 ONLY
1. Design & fabricate a new turbines for either Unit #2 or #3
3. Runner would be designed to operate at 250 -650 cfs.
4. Optimal operating flows would range from 450-550 cfs.
4. Expected increase in Annual Energy Production of Approximately 7.3%
5. Draft tube may require aeration system to allow stable operation at low
flows
100.00%
Flo
w[c
ms
]
Ov
era
ll P
lan
t E
ffic
ien
cy [
%]
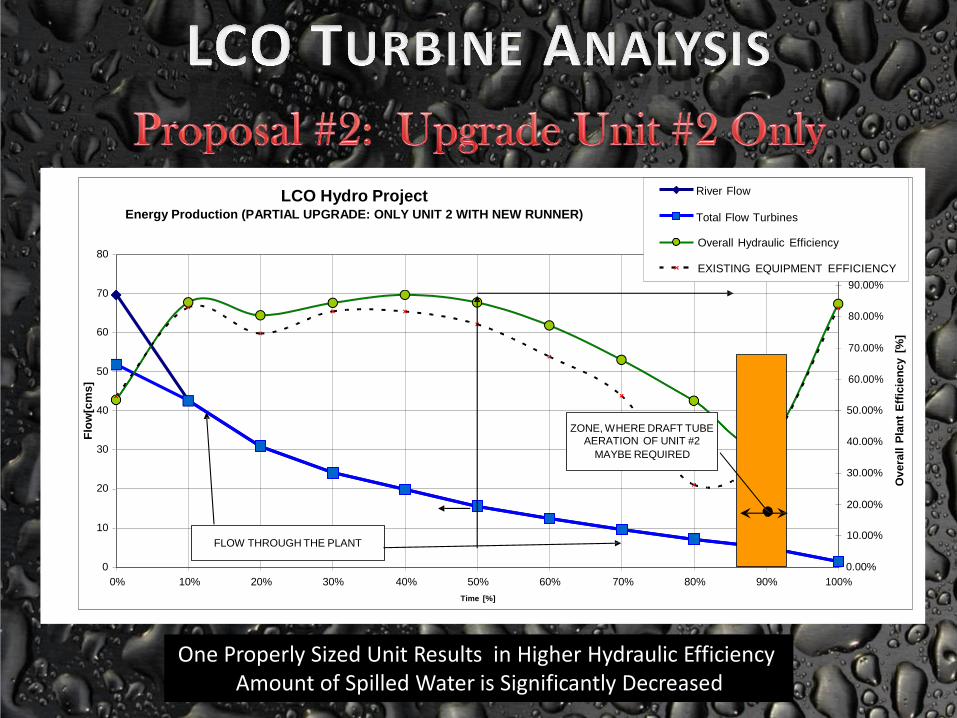
LCO Hydro Project Energy Production (PARTIAL UPGRADE: ONLY UNIT 2 WITH NEW RUNNER)
River Flow Total Flow Turbines
Overall Hydraulic Efficiency 80
EXISTING EQUIPMENT EFFICIENCY
90.00% 70
80.00%
60
70.00%
50 60.00%
40
ZONE, WHERE DRAFT TUBE
AERATION OF UNIT #2 30
MAYBE REQUIRED
20
50.00%
40.00%
30.00%
20.00%
10
FLOW THROUGH THE PLANT
10.00%
0 0.00%
0% 10% 20% 30% 40% 50% 60% 70% 80% 90% 100%
Time [%]
One Properly Sized Unit Results in Higher Hydraulic Efficiency Amount of Spilled Water is Significantly Decreased
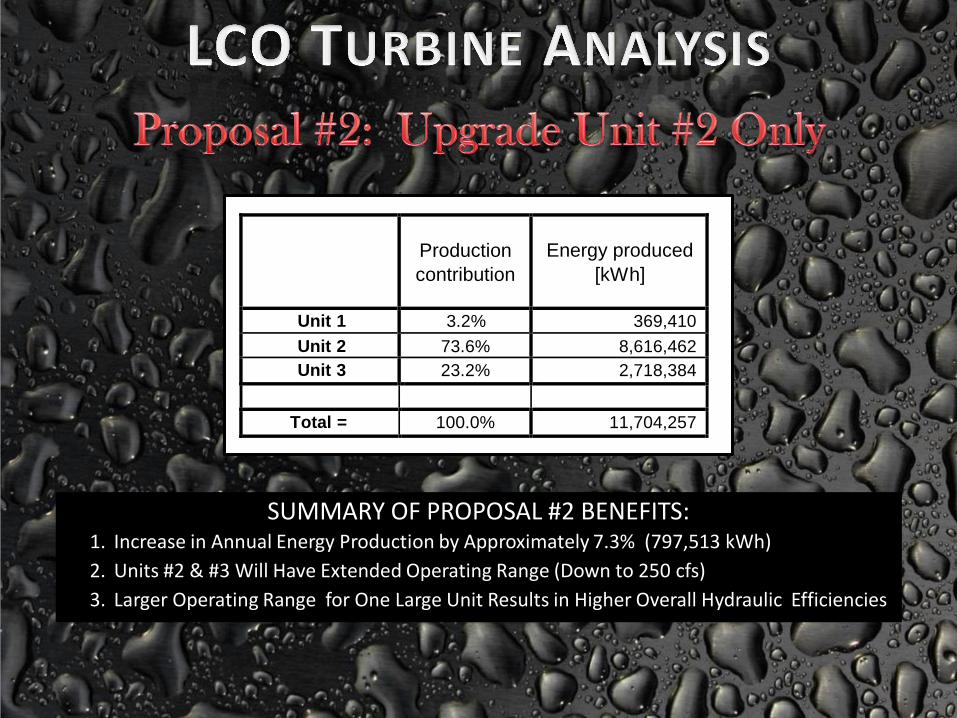
Production
contribution
Energy produced
[kWh]
Unit 1 3.2% 369,410
Unit 2 73.6% 8,616,462
Unit 3 23.2% 2,718,384
Total = 100.0% 11,704,257
SUMMARY OF PROPOSAL #2 BENEFITS: 1. Increase in Annual Energy Production by Approximately 7.3% (797,513 kWh)
2. Units #2 & #3 Will Have Extended Operating Range (Down to 250 cfs)
3. Larger Operating Range for One Large Unit Results in Higher Overall Hydraulic Efficiencies

KISER HYDRO RECOMMENDATION
1. Proposal #2 Upgrade Runner of Unit #2 2. Economically Feasible to Upgrade One Unit While Increasing AEP of 7.3% 3. Upgrade to Include:
• Removal of Existing Runner • Design & Fabrication of New Runner • Installation of New Runner into Existing Gate Casing
ESTIMATE OF UPGRADE COSTS
Design & Fabrication $450,000
Removal & Installation $250,000
$700,000
Lessons Learned
The Lac Courte Oreilles Tribe has learned a few very important lessons from owning and
operating the hydro-dam and the information provided in this technical study.
1. We need to maintain our infrastructure to reduce repair cost and maintain daily electrical production quotas.
2. Our employees need to continue to receive training in order to identify issues, problems
and know their personal limitations.
3. Third party inspections by engineering companies should be conducted on a frequent Scheduled basis.
4. Contracting a management company provides extended networking capabilities,
technical support, training and optimum operational conditions.
Conclusion
While the tribe has owned and operated the Hydro-dam for over 20 years we are still learning the processes with this highly technical, mechanical and environmentally sensitive infrastructure. The Lac Courte Oreilles Tribal Governing Board has signed a multi-year agreement with Renewable World Energies to begin as a contract management company. Renewable world energies will provide ongoing training, inspection and oversight to ensure the productivity and profitability of the tribal investment. They will continually monitor for chances to start negotiations between transmission companies and negotiate power purchase agreements as often as the situation presents itself.
The tribe has started to see improved energy production since the contract started which reduces the loan principal and increases tribal revenue. Continued upgrades and improved maintenance will continue to benefit the Hydro dam. With returns increasing, the option to move on the various recommendations from Kiser Hydro, LLC seem worth the tribes’ financial investment. A great investment into our infrastructure and our future alternative electrical production.