
L- ixati cu drivi - Helsinki
22
1 Look-ahead fixations in curve driving Lehtonen, Esko a, b , Lappi, Otto a, b , Kotkanen, Henri a, b , Summala, Heikki a a Traffic Research Unit, Institute of Behavioural Sciences, University of Helsinki, Finland b Cognitive Science, Institute of Behavioural Sciences, University of Helsinki, FIN-00014, Finland This is an Author's Accepted Manuscript of an article published as: Esko Lehtonen, Otto Lappi, Henri Kotkanen & Heikki Summala (2013) Look-ahead fixations in curve driving.Ergonomics 56(1), 34–44. doi: 10.1080/00140139.2012.739205 Available online at: http://www.tandfonline.com/10.1080/00140139.2012.739205 Corresponding author: Esko Lehtonen, [email protected] Traffic Research Unit (Box 9) Institute of Behavioural Sciences FIN-00014 University of Helsinki Finland
Transcript of L- ixati cu drivi - Helsinki

1
Look-ahead fixations in curve driving
Lehtonen, Esko a, b, Lappi, Otto a, b, Kotkanen, Henri a, b, Summala, Heikki a
a Traffic Research Unit, Institute of Behavioural Sciences, University of Helsinki,
Finland
b Cognitive Science, Institute of Behavioural Sciences, University of Helsinki,
FIN-00014, Finland
This is an Author's Accepted Manuscript of an article published as:
Esko Lehtonen, Otto Lappi, Henri Kotkanen & Heikki Summala (2013) Look-ahead fixations in curve driving.Ergonomics 56(1), 34–44. doi: 10.1080/00140139.2012.739205
Available online at: http://www.tandfonline.com/10.1080/00140139.2012.739205
Corresponding author:
Esko Lehtonen, [email protected]
Traffic Research Unit (Box 9) Institute of Behavioural Sciences FIN-00014 University of Helsinki Finland

2
Look-ahead fixations in curve driving
Two functionally distinct types of fixation, guiding fixations and look-ahead-fixations, have been identified in naturalistic tasks based on their temporal relationship to the task execution. In car driving, steering through a curve is guided by fixations toward a region located 1 – 2 s in the future, but drivers also make fixations further along the road. We recorded drivers' eye movements while they drove an instrumented vehicle on curved rural roads, and developed a method to quantify lead time and distance of look-ahead fixations. We also investigated the effect of cognitive load on look-ahead fixations. The look-ahead fixations appear to have a pattern which is connected to the sequential structure of a curve. This suggests that they have a role both in advance planning of the driving line and in the anticipation of oncoming vehicles. Cognitive load led to a shorter look-ahead lead time and distance.
Keywords: car driving; anticipation; look-ahead fixation; occlusion point; cognitive load
Practitioner Summary:
We developed a method to quantify lead time and distance of look-ahead fixations in curve driving from on-road eye movement data. The results are relevant for driver modelling and development of anticipation training programs for novice drivers.

3
1. Introduction
In naturalistic tasks, patterns of gaze are spatially and temporally highly constrained by the task, and stereotypical across individuals (for review, see Tatler, Hayhoe, Land & Ballard, 2011). Targets to be foveated are selected based on their relevance to the task and gaze seldom deviates to task irrelevant objects (e.g. Yarbus 1967; Land, Mennie & Rusted, 1999; Pelz & Canosa, 2001; Tatler et al., 2011).
Recently, two functionally distinct types of fixations, guiding fixations and look-ahead-fixations, have been identified based on their temporal relationship to the task execution. Guiding fixations (Mennie, Hayhoe, & Sullivan, 2007) or "just-in-time fixations" (Ballard, Hayhoe & Pelz, 1995) are temporally coupled to the ongoing subtask. They target an object to be manipulated, or the location where an operation is about to be performed, leading action by about 1 second, and disengaging before completion of the operation (see also Land, 2006). This pattern of gaze-action coupling has been observed in a variety of naturalistic tasks such as sandwich making (Hayhoe, Shrivastava, Mruczek & Pelz, 2003), piano playing (Land & Furneaux, 1997) and tea making (Land, Mennie & Rusted, 1999), as well as block copying tasks in the laboratory (Ballard et al., 1995; Mennie et al., 2007).
However, in all the aforementioned tasks, fixations are also made in a more anticipatory fashion. For example, in a hand washing experiment (Pelz & Canosa, 2001) participants fixated the soap while still opening the tap returning their gaze to the tap before they actually switched their gaze to the soap and reached for it. These look-ahead fixations (LAFs) (Pelz & Canosa 2001; Hayhoe et al., 2003; Mennie et al., 2007) are targeted to objects or locations relevant to future, but not immediate, actions. Pelz and Canosa (2001) suggest that look-ahead fixations may simplify and optimize performance by providing information for planning ahead. Spatial and temporal information from these fixations is retained in short-term memory, and influences motor actions (Mennie et al., 2007).
In curve driving, various guiding fixation locations relevant for steering have been identified (e.g. the tangent point (Land & Lee, 1994), the near and the far point (Salvucci & Gray, 2004) and the future path in the active gaze theory (Wann & Swapp, 2000) (for a review of the theoretical models of the guiding fixations in curve driving, see Steen, Damveld, Happee, van Paassen & Mulder, 2011). Common to them is that drivers look towards the direction of travel with a lead time of 1 – 2 s. While it is recognized that drivers also look further up the road, through the curve (Land & Horwood, 1996; Underwood, Chapman, Crundall, Cooper & Wallén, 1999; Kandil, Rotter, Lappe, 2010; Lehtonen, Lappi & Summala, 2012), relatively little quantitative research has been done on this behaviour.
We suggest that this visual behaviour can be understood as look-ahead fixations: the fixations are functional and serve planning of future actions in driving through a curve, providing information on the geometry of the curve and helping to anticipate oncoming vehicles (cf. Underwood et al, 1999; Lehtonen et al., 2012).
In the present study, we report a method for identifying look-ahead fixations in curve driving, and quantifying their lead distance and time. We will examine where the look-ahead fixations occur and what parts of the road they target, and how cognitive load affects them. Especially, we examine whether drivers look as far along the road as they can see, to the occlusion point of a curve (the nearest point where the view of the
4
road is occluded, and where the oncoming vehicle would first emerge from: Lehtonen et al., 2012), or whether they select some other point on the visible road. Finally, we discuss how the concepts of guiding and look-ahead fixations can be applied to other driving situations than curve driving.
2. Materials and methods 2.1. Road segments
We analysed eye movements on three segments (Figures 3a, 4a, 5a) of a low-standard rural road where we expected look-ahead fixations through a curve to be identifiable. In the first two segments, the width of the road was 6.5 m and it had painted centre and edge lines. In the third segment, the width of the road was 5.0 m and it had no lane markings. The speed limit on the first and second segment was 60 km/h and on the third 50 km/h. The road was surrounded by open fields and patches of forest.
Five curves with an open view through the curve were analysed within the segments. They were divided into phases using average yaw rate, as computed over the participants and runs. Each curve begins with an entry phase where the yaw rate increases. After the local maximum yaw rate point (the steepest point of the curve), follows an unwinding phase where the yaw rate decreases. In consecutive curves, a boundary between two curves can be set to the local minimum of the yaw rate.
In the first segment (Fig. 3a), consisting of a right curve (R1) and a left curve (L2), look-ahead fixations were identified from the preceding approach phase (A) until the entry of L2 (E2).
In the second segment (Fig. 4a), look-ahead fixations were identified in the left curve (L3) from the unwinding phase of the preceding right curve (U1) until the unwinding phase of L3 (U2). (There was no possibility to detect look-ahead fixations in the right curve, because the road was surrounded by the forest.)
In the third segment (Fig. 5a), consisting of a left (L4) and a right (R5) curve, the look-ahead fixations were identified from the entry of L4 (E1) until the end of the entry of R5 (E2).
2.2. Participants
Twelve drivers participated in the experiment (7 male, 5 female, age 23-46 years, M=30, SD=6 years). Participants gave informed consent to take part in the study. Conditions for inclusion in the experiment were normal uncorrected vision and sufficient driving experience. All had held a valid driving license for at least 5 years and reported life-time driving experience of more than 20 000 km.
Runs through a curve with oncoming vehicles or clearly insufficient recording quality (valid gaze tracking less than 60 % time: the final data with M=89 % , SD=10 %). were excluded from the results. If the driver did not have at least one run in both experimental conditions (see below) within the same curve, the driver's data from that curve was excluded, because lack of a control condition could have biased the analysis. This procedure left two drivers without data, so the final number of drivers used in the analysis was 10. Curves R1, L3 and L4 had data from 8 drivers, R2 from 7 and R5 from 9. 7 drivers had data in all curves.

5
2.3. Equipment
The instrumented car was a Toyota Corolla compact sedan with a manual transmission (model year 2007). The car was equipped with a two-camera Smart Eye Pro 5.1 eye tracker (Smart Eye AB, Göteborg, Sweden, www.smarteye.se) operating at 60 Hz, a forward looking video camera and a GPS receiver. Yaw rate was recorded from CAN bus. The passenger side was equipped with a brake pedal and extra mirrors.
2.4. Procedure
The participants drove the car to the area located 40 km from the campus, giving them time to familiarize themselves with the car as well as to practice in the secondary task (see below). During the experiment, the participant was accompanied by a safety supervisor on the front seat and by one of the researchers (HK) sitting behind the driver. In the experiment participants drove a 6.8 km route twice in the free condition and twice in the load condition. In the load condition, drivers performed a secondary task. The order of runs in free and load conditions was balanced between participants. The route formed a loop, and was always driven in the same direction. Participants were instructed to drive at their own pace, but to observe traffic laws and safety.
Each test run began and ended at a bus stop in the beginning of the test route. A test run was started when the driver was ready and there were no other vehicles visible. The safety supervisor gave route directions, but other interaction was avoided during the runs.
Before starting the first run, the instrument panel was occluded in order to minimize distraction. Participants did not express discomfort at having to drive without a speedometer. The safety supervisor had a brake pedal and access to the vehicle speed through a separate display, in case the driver would not have been able to maintain a safe and legal level of speed. The safety supervisor did not have to intervene in driving at any point.
2.5. The secondary task SPASAT
As the cognitive secondary task we used a self-paced variant of the PASAT task (Sampson, 1956; Gronwall, 1977), SPASAT (Self Paced Serial Addition Task) (Lamble, Kauranen, Laakso & Summala, 1999), in which a participant has to add the two last numbers continuously in a series of random integers. The task is demanding because it requires maintaining the previously given number in working memory during mental arithmetic and a verbal report of the sum. In the current study, the numbers were presented via headphones using a stimulus presentation software running on a laptop. Immediately after the driver gave an answer, the researcher prompted the system to generate a new number by pressing a keypad, which was then read aloud from the synthesizer after a random lag between 0 – 2 s. The lag made it harder to anticipate the presentation of a new number.
6
3. Analysis 3.1. Guiding fixation referencing
In curves, gaze leads steering (Land, 2006). Therefore, most of the time guiding fixations are not straight ahead relative to the vehicle centre line, but turned towards the direction of the curve. This must be taken into account when identifying look-ahead fixations on curved roads. Our solution was to create a reference direction by identifying the median of the gaze eccentricity distribution for each location along the road, which estimates the direction of guiding fixations in steering.
All data was resampled to a common distance along the road, with a 0.5 meter interval, using GPS interpolated locations along the road. The median of gaze measures at each location was taken, and the resulting signal was smoothed with a third order Savitzky-Golay filter with a 30 m window. Deviation between the raw and the filtered signal had SD = 0.47 °. The filtered signal was used as the guiding fixation reference (see Fig. 1a).

7
Fig. 1. (a) Scatter of raw gaze eccentricities with the guiding fixations reference (solid line with 6 ° dashed boundaries) on curve R1. (b) Raw gaze data from a single run (dots) with 6 ° boundaries (dashed). A look-ahead fixation (solid line) is identified from raw gaze as the data points are outside 6 ° boundaries and their eccentricity indicate that their line-of-sights cross the roadway.

8
3.2. Identifying where drivers look
For detection of look-ahead fixations, we calculated what part of the road ahead the driver is looking at. First the road was modelled by calculating the driving line in 2D using speed and yaw rate data. Then looking locations on the road were estimated as the crossing of lines-of-sights and the road. The line-of-sight was modelled as a vector originating from the location where the raw gaze data point was recorded, and extending towards its measured eccentricity relative to the vehicle centre line. Occluding vegetation was modelled as shielding vectors which prevented the lines-of-sight crossings from being registered.
Pitch information of the gaze was not used because on a relatively flat terrain, bumps and tremor of the car makes it practically ineffective for distinguishing between targets which lie within a few degrees in vertical direction, like the road far ahead. For this reason, the method can address only look-ahead fixations which are at some eccentricity from the guiding fixation reference in relatively flat terrain. Also, in curve L4, the crossing estimate is ambiguous because the unwinding of L4 and the next curve are in the same heading. Therefore, look-ahead fixations to the left in L4 were not included to the statistical analysis.
3.3. Look-ahead fixation detection
The look-ahead fixation detection was based on the area of interest method (see Salvucci & Goldberg, 2000), but the area of interest was determined dynamically: a raw gaze data point was assigned to the look-ahead area if it had eccentricity of more than 6 ° from the guiding fixation reference and if its line-of-sight crossed the future driving line. A threshold of 6 ° relative to the guiding fixation reference was used because visualization of the gaze data (see Fig. 1a) suggested that this 12 ° sector captures the gaze following the road curvature. We do not want to suggest that look-ahead fixations are not possible within that sector, but distinguishing them from guiding fixations would need more precise modelling of the road environment.
The fixation detection algorithm had a tolerance for maximum of 100 ms of missing or non-crossing data points within a detected fixation. Also, all fixations were required to last at least 100 ms.
The current definition of a fixation is more liberal than usually used in on-screen laboratory measurements, but more robust. There is more noise in eye tracking data from video cameras fixed to the car than from wearable or laboratory equipment. Also, fixations in driving are rarely stable relative to the car centre line, often resembling smooth pursuit movements.
3.4. Landing location, lead distance and time of look-ahead fixations
The landing location of a look-ahead fixation was calculated as the average of crossing locations of its lines-of-sights and the road ahead. Lead distance is the distance between the fixation origin and landing locations along the road (see Fig. 2). Lead time is the time the car travelled between these two locations. The look-ahead fixation lead time

9
and distance were calculated as the mean of the values calculated for lines-of-sights belonging to the fixation.
Look-ahead fixations which had a lead time less than 2.5 s were excluded, because they deviated more than 6 ° from the guiding fixation reference due to individual variation in driving line, rather than being genuine look-aheads. Also, three look-ahead fixations were excluded based on inspection of eye tracking visualization videos, because they were not targeting the road ahead but some other object.
Fig. 2. The look-ahead fixation identified in Fig. 1b visualized over the terrain. Look-ahead fixation is done at the origin location, and it is directed to the landing location on the road. ahead. Lead distance is the distance from the origin location to the landing location along the road. Aerial photograph from the National Land Survey of Finland Topographic Database 07/2012, © National Land Survey open data licence - version 1.0 - 1 May 2012 (http://www.maanmittauslaitos.fi/en/NLS_open_data_licence_version1_20120501)

10
4. Results
Table 1 shows the percentage of raw gaze spent within 6 ° of guiding fixations reference and in look-ahead fixations. Average look-ahead fixation rate (number of look-ahead fixations per total measured gaze time for each run through the curve in seconds) is also displayed. The rest of the time the gaze has been outside both areas.
4.1. Origin and landing locations of look-ahead fixations
Figures 3b-5b show the spatial distribution of the look-ahead fixation origin and landing locations in the curves studied. Look-ahead fixations occur both in the entry and the unwinding phases of the curves. There are look-ahead fixations which originate from the entry phase and land on the unwinding phase of the curve (L2: from E2 to U2; L3: from E2 to U2; R5: from E2 to U2). However, look-ahead fixations may already begin during the unwinding phase of the previous curve (R1: during U1; L3: during U1 and U2; R5: during U1) or on a straight approach before a curve (R1: during A) and they may also target the entry phase of the next curve as well. This is especially visible in L3 (from U1 and E2 to U2 and E3). This suggests that look-ahead fixations target the curve phases after the next maximum yaw rate point (the steepest part of a curve): In entry phases this is the maximum yaw rate point of the current curve, while in unwinding phases it is the maximum yaw rate point of the next curve. There were no cases where the look-ahead fixations would have gone over two curves (two maximum yaw rate points), even though this was geometrically possible in L3 (from U1 and E1 to U3).
In R1 the forest near the entry (E2) of the left curve L2 occluded the road ahead when approaching the right curve in approach phase A. Similarly, a hilltop at the end of the curve R5 (at the end of U2) limited the otherwise open visibility over the s-curve sequence. In other words, both R1 and R5 had occlusion points. In L2 and L3 the next occlusion point was so far or highly eccentric that looking toward it would have been difficult. In both curves with an occlusion point, the look-ahead fixations did not get concentrated specifically toward the occlusion point. While the pattern of look-ahead fixation landing locations in R1 (Fig. 4) is suggestive, it can be interpreted to reflect the fact that there was a long approach and the visible stretch of road was actually quite short.
Interestingly, the entry of R1 is virtually without look-ahead fixations. We interpret that in this curve the gaze is engaged to the guiding fixations particularly strongly . The other curves did not have similar zones completely free of look-ahead fixations. The explanation may be that the other entry phases are not as steep or are located as parts of s-curve sequences.

11
Table 1. Percentage of gaze within 6 ° of guiding fixation reference, percentage in look-ahead fixations, and look-ahead fixation rate (number of look-ahead fixations per measured gaze time by curve), separately for free and cognitively loaded conditions (SD in parenthesis).
Guiding fixations (%) Look-ahead fixations (%) LAF rate (N/s)
Curve Free Loaded Free Loaded Free Loaded
R1 83 (5) 87 (7) 11 (6) 11 (8) 0.21 (0.12) 0.20 (0.14) L2 83 (9) 77 (15) 8 (10) 10 (11) 0.21 (0.21) 0.30 (0.26) L3 77 (12) 83 (10) 18 (13) 13 (13) 0.46 (0.34) 0.37 (0.37) L4 68 (16) 65 (20) 25 (16) 33 (24) 0.65 (0.47) 0.78 (0.53) R5 86 (8) 87 (12) 12 (8) 10 (12) 0.32 (0.21) 0.21 (0.21)

12

13
Fig. 3. Look ahead fixations in curves R1 and L2. (a) Aerial photograph with curve phases and their boundary locations from the beginning of the segment. Segment symbols are the following: A = approach, E = Entry, U = unwinding. Phases E1 and U1 belong to curve R1 and phases E2 and U2 to L2. When approaching the right curve R1 along phase A, the forest occludes visibility along the road creating an occlusion point.Aerial photograph from the National Land Survey of Finland Topographic Database 07/2012, © National Land Survey open data licence - version 1.0 - 1 May 2012, http://www.maanmittauslaitos.fi/en/NLS_open_data_licence_version1_20120501 (b) Origin and landing locations of look-ahead fixations. Look-ahead fixations done under different experimental conditions (free and loaded) are marked with different colours, and different symbols are used to denote over which curve the look-ahead fixation is done. Look-ahead fixations were identified from phases A, E1, U1, and E2.

14
Fig. 4. Look ahead fixations in curve L3. (a) Aerial photograph with curve phases and their boundary locations from the beginning of the segment. Segment symbols are the following: E = Entry, U = unwinding. Phases E2 and U2 belong to the left curve L3. Aerial photograph from the National Land Survey of Finland Topographic Database 07/2012, © National Land Survey open data licence - version 1.0 - 1 May 2012, http://www.maanmittauslaitos.fi/en/NLS_open_data_licence_version1_20120501 (b) Origin and landing locations of look-ahead fixations. Look-ahead fixations done under different experimental conditions (free and loaded) are marked with different colours, and different symbols are used to denote over which curve the look-ahead fixation is done. Look-ahead fixations were identified from phases U1, E2 and U2.

15
Fig. 5. Look ahead fixations in curves L4 and R5. (a) Aerial photograph with curve phases and their boundary locations from the beginning of the segment. Segment symbols are the following: A = approach, E = Entry, U = unwinding. Phases E1 and U1 belong to left curve L4, phase E2 and U2 to right curve R5. A hilltop occludes visibility, creating an occlusion point when driving on curves. Aerial photograph from the National Land Survey of Finland Topographic Database 07/2012, © National Land Survey open data licence - version 1.0 - 1 May 2012, http://www.maanmittauslaitos.fi/en/NLS_open_data_licence_version1_20120501 (b) Origin and landing locations of look-ahead fixations. Look-ahead fixations done under different experimental conditions (free and loaded) are marked with different colours, and different symbols are used to denote over which curve the look-ahead fixation is done. Look-ahead fixations were identified from phases E1 to E2.
16
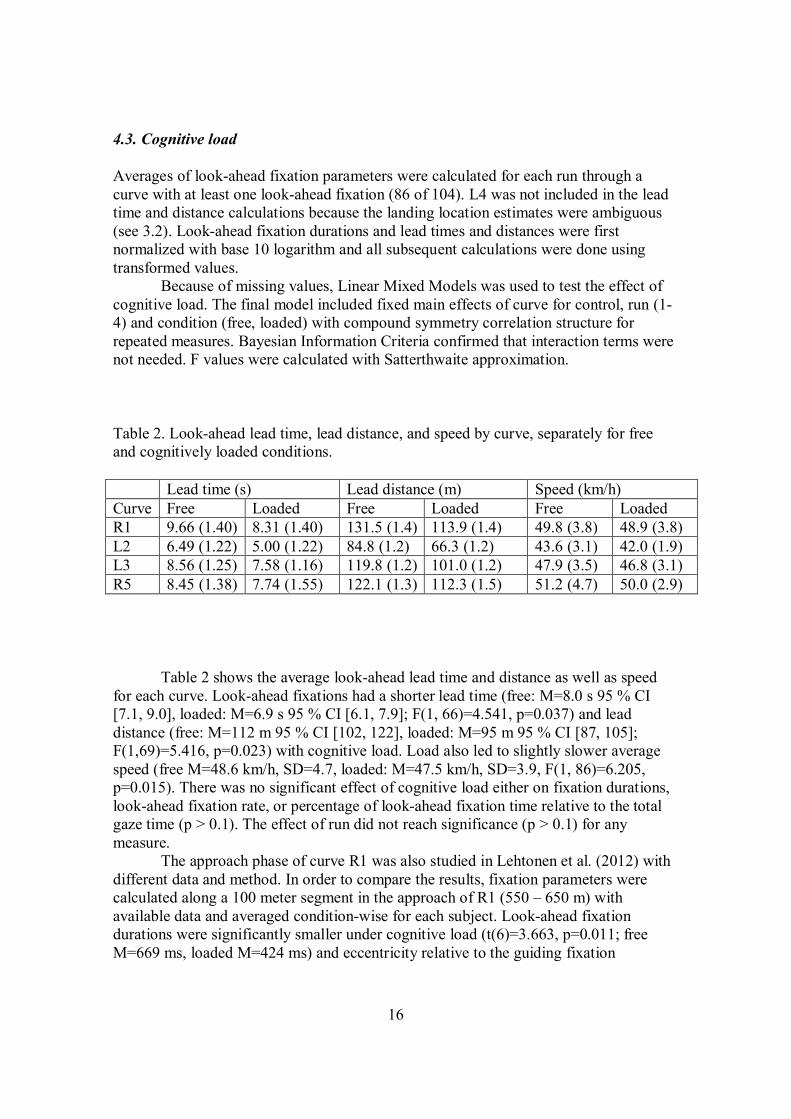
4.3. Cognitive load
Averages of look-ahead fixation parameters were calculated for each run through a curve with at least one look-ahead fixation (86 of 104). L4 was not included in the lead time and distance calculations because the landing location estimates were ambiguous (see 3.2). Look-ahead fixation durations and lead times and distances were first normalized with base 10 logarithm and all subsequent calculations were done using transformed values.
Because of missing values, Linear Mixed Models was used to test the effect of cognitive load. The final model included fixed main effects of curve for control, run (1-4) and condition (free, loaded) with compound symmetry correlation structure for repeated measures. Bayesian Information Criteria confirmed that interaction terms were not needed. F values were calculated with Satterthwaite approximation.
Table 2. Look-ahead lead time, lead distance, and speed by curve, separately for free and cognitively loaded conditions.
Lead time (s) Lead distance (m) Speed (km/h) Curve Free Loaded Free Loaded Free Loaded R1 9.66 (1.40) 8.31 (1.40) 131.5 (1.4) 113.9 (1.4) 49.8 (3.8) 48.9 (3.8) L2 6.49 (1.22) 5.00 (1.22) 84.8 (1.2) 66.3 (1.2) 43.6 (3.1) 42.0 (1.9) L3 8.56 (1.25) 7.58 (1.16) 119.8 (1.2) 101.0 (1.2) 47.9 (3.5) 46.8 (3.1) R5 8.45 (1.38) 7.74 (1.55) 122.1 (1.3) 112.3 (1.5) 51.2 (4.7) 50.0 (2.9)
Table 2 shows the average look-ahead lead time and distance as well as speed for each curve. Look-ahead fixations had a shorter lead time (free: M=8.0 s 95 % CI [7.1, 9.0], loaded: M=6.9 s 95 % CI [6.1, 7.9]; F(1, 66)=4.541, p=0.037) and lead distance (free: M=112 m 95 % CI [102, 122], loaded: M=95 m 95 % CI [87, 105]; F(1,69)=5.416, p=0.023) with cognitive load. Load also led to slightly slower average speed (free M=48.6 km/h, SD=4.7, loaded: M=47.5 km/h, SD=3.9, F(1, 86)=6.205, p=0.015). There was no significant effect of cognitive load either on fixation durations, look-ahead fixation rate, or percentage of look-ahead fixation time relative to the total gaze time (p > 0.1). The effect of run did not reach significance (p > 0.1) for any measure.
The approach phase of curve R1 was also studied in Lehtonen et al. (2012) with different data and method. In order to compare the results, fixation parameters were calculated along a 100 meter segment in the approach of R1 (550 – 650 m) with available data and averaged condition-wise for each subject. Look-ahead fixation durations were significantly smaller under cognitive load (t(6)=3.663, p=0.011; free M=669 ms, loaded M=424 ms) and eccentricity relative to the guiding fixation
17
reference marginally smaller (t(6)=2.047, p=0.087; free M=18.3 °, loaded M=14.9 °). Look-ahead fixation rate was not significantly different between conditions (t(6)= -0.738, p=0.488, free: M=0.24 N/s, loaded: M=0.30 N/s).
5. Discussion
In curve driving, drivers look toward an area 1 – 2 s ahead on the road in order to guide the vehicle through the curve (Land & Lee, 1994; Salvucci & Gray, 2004; Wann & Swapp, 2000). However, drivers also make fixations further up the road (Land & Horwood, 1996; Underwood et al., 1999; Kandil et al., 2010; Lehtonen et al., 2012). In curves, such fixations typically require a large eccentric saccade. We created a method to quantify lead time and distance of those look-ahead fixations from on-road data.
We found that look-ahead fixations were frequent in curves. In our data we find that the origin and landing locations of look-ahead fixations appear to have a pattern which is connected to the sequential structure of a curve. Look-ahead fixations typically go beyond the next maximum yaw rate point: in entry phases this is the yaw rate point of the current curve, while in unwinding phases it is the yaw rate point of the next curve. No look-ahead fixations over two curves (two maximum yaw rate points) were observed, even though it would have been possible (in L3). This suggests that driving through a curve have a sequential structure, and one function of the look-ahead fixations in curve driving can be advance planning of the driving line (steering and choice of speed) through the curve.
In our earlier work (Lehtonen et al., 2012) we identified the occlusion point of the curve, that is, the nearest point where the road is blocked by some obstacle, as a potential target of the gaze. We suggested that monitoring the occlusion point could help the drivers spot oncoming traffic as early as possible. However, our present analysis reveals that in curves with open visibility the look-ahead fixation landing locations were not concentrated around occlusion points. This suggests that in open curves drivers do not have a strategy to look as far as possible to the occlusion point. In curves with short visibility, monitoring the occlusion point may be more critical (cf. Underwood et al., 1999).
Analysis of the look-ahead fixations can be possibly utilized both in driver training and driver assistance systems. Swerving off the road is a frequent accident type for young novice male drivers (e.g. Laapotti & Keskinen, 1998). Promising hazard perception training programs (e.g. Underwood, Chapman, Bowden & Crundall, 2002; Pradhan, Pollatsek, Knodler & Fisher, 2009) could be extended to cover the hazards of curves, especially if further studies reveal that the look-ahead fixations depend on driving experience. For driving assistance systems, the analysis of look-ahead fixations could provide better information for estimating the intentions of the driver (cf. Doshi & Trivedi, 2012).
Here we have assumed that fixations through curves are task controlled look-ahead fixations directed by endogenous attention. An opposing interpretation would be that these fixations are directed exogenously to highly salient objects. In the present study runs with oncoming cars were excluded, but saliency was not otherwise controlled. While previous research (for review Tatler et al., 2011, Sakai, Shin, Khama & Uchiyama, 2012) support interpreting the fixations as task controlled, the effect of saliency cannot be completely ruled out in the present study. Distinguishing between
18
endogenous (planning of the driving line, anticipation of oncoming vehicles) and exogenous (saliency) factors will need experiments in more controlled environments with more participants.
5.1. Cognitive load
Cognitive load led to shorter look-ahead lead distances. Also, look-ahead lead time was smaller, which means that drivers did not essentially compensate the cognitive load by reducing their speed slightly under cognitive load. The effect is consistent with the gaze concentration effect of cognitive load (e.g. Recarte & Nunes, 2003; Victor, Harbluk & Engström, 2005).
Look-ahead fixation durations, and consequently the percentage of time spent on look-ahead fixations, tend to shorten under cognitive load, but the effect is prominent only on straight segments (cf. Lehtonen et al., 2012). On a straight road drivers have more time available (in terms time-to-line crossings: Godthelp, Milgram & Blaauw, 1984), which can be invested either in a secondary task (Wikman, Nieminen & Summala, 1998) or in the exploration of the environment in more detail. In curves gaze is more engaged to the guidance of steering, which leaves less time for look-ahead fixations in both conditions.
5.2 Beyond curve driving
The distinction between guiding and look-ahead fixations is based on their different temporal relationship to the task execution: guiding fixations serve the information needs of the ongoing subtask, while look-ahead fixations peek in advance information which is relevant for a following subtask (Pelz & Canosa, 2001; Hayhoe et al., 2003; Mennie et al., 2007). Such conceptualization requires that the task must have a sequential structure. In curve driving, a possible sequential structure is created by entry and unwinding phases.
However, in many other traffic situations, we think look-ahead fixations are used not to anticipate a following subtask, but to change the action plan (cf. Pelz & Canosa, 2001): For example. when approaching an intersection the driver scans for prioritized vehicles or pedestrians with look-ahead fixations. These help to prepare the plan for the intersection in advance – whether to proceed or give way. Also, sometimes the look-ahead fixation may not lead to a discrete change in the action plan, rather it modulates the performance of the ongoing task. For example, in car following, a look-ahead fixations through or over the lead car may reveal that the car in front of the lead car is signalling turning and may slow down. The driver can anticipate the situation by increasing the headway, while no discrete change in the action plan is necessary.
As the examples suggest, guiding and look-ahead fixations in driving could be also understood from perspective where driving is not conceptualized as a sequence of discrete subtasks. Guiding fixations could be defined to monitor visual parameters critical for the immediate control of motion (for example a safety margin (for review, see Summala, 2007) or a point on the future path (Wann & Swapp, 2000)). Look-ahead fixations toward the road further ahead could help to predict how these parameter will behave in the near future, which cannot be reliably done with the guiding fixations alone.

19
Acknowledgements
We thank Jami Pekkanen, who contributed to Python code used for analysis, and Harri Hiltunen, who acted as the safety supervisor during the experiments.

20
References
Ballard, D. H., Hayhoe, M. M., & Pelz, J. B. (1995). Memory representations in natural tasks. Journal of Cognitive Neuroscience, 7(1), 66−80. doi:10.1162/jocn.1995.7.1.66
Doshi, A., & Trivedi, M. M. (2012). Head and eye gaze dynamics during visual attention shifts in complex environments. Journal of Vision, 12(2), 1−16. doi:10.1167/12.2.9
Godthelp, H., Milgram, P., & Blaauw, G. J. (1984). The development of a time-related measure to describe driving strategy. Human Factors, 26(3), 257−268. doi:10.1177/001872088402600302
Gronwall, D. M. (1977). Paced auditory serial-addition task: a measure of recovery from concussion. Perceptual and Motor Skills, 44(2), 367−373.
Hayhoe, M. M., Shrivastava, A., Mruczek, R., & Pelz, J. B. (2003). Visual memory and motor planning in a natural task. Journal of Vision, 3(1), 49−63. doi: 10:1167/3.1.6
Kandil, F. I., Rotter, A., & Lappe, M. (2010). Car drivers attend to different gaze targets when negotiating closed vs. open bends. Journal of Vision, 10(4), 1−11. doi:10.1167/10.4.24
Laapotti, S., & Keskinen, E. (1998). Differences in Fatal Loss-of-control accidents between yound male and female drivers. Accident Analysis & Prevention, 30(4), 435−442.
Lamble, D., Kauranen, T., Laakso, M., & Summala, H. (1999). Cognitive load and detection thresholds in car following situations: safety implications for using mobile (cellular) telephones while driving. Accident Analysis & Prevention, 31(6), 617−623. doi:10.1016/S0001-4575(99)00018-4
Land, M. F., & Furneaux, S. (1997). The knowledge base of the oculomotor system. Philosophical transactions of the Royal Society of London. Series B, Biological sciences, 352(1358), 1231−1239. doi:10.1098/rstb.1997.0105
Land, M. F., & Lee, D. N. (1994). Where we look when we steer. Nature, 369(6483), 742−744. doi:10.1038/369742a0
Land, M. F. (2006). Eye movements and the control of actions in everyday life. Progress in retinal and eye research, 25(3), 296−324. doi:10.1016/j.preteyeres.2006.01.002
Land, M., & Horwood, J. (1996). The relations between head and eye movements during driving. In A.G. Gale, I.D. Brown, C.M. Haslegrave, S.P. Taylor (Eds), Vision in Vehicles V. Amsterdam: Elsevier. 153−160
Land, M., Mennie, N., & Rusted, J. (1999). The roles of vision and eye movements in the control of activities of daily living. Perception, 28(11), 1311-1328. doi:10.1068/p2935
Lehtonen, E., Lappi, O., & Summala, H. (2012). Anticipatory eye movements when approaching a curve on a rural road depend on working memory load. Transportation Research Part F: Psychology and Behaviour, 15(3), 369−377. doi:10.1016/j.trf.2011.08.007
21
Mennie, N., Hayhoe, M., & Sullivan, B. (2007). Look-ahead fixations: anticipatory eye movements in natural tasks. Experimental Brain Research, 179, 427−442. doi:10.1007/s00221-006-0804-0
Pradhan, A. K., Pollatsek, A., Knodler, M., & Fisher, D. L. (2009). Can younger drivers be trained to scan for information that will reduce their risk in roadway traffic scenarios that are hard to identify as hazardous? Ergonomics, 52(6), 657−673. doi:10.1080/00140130802550232
Pelz, J. B., & Canosa, R. (2001). Oculomotor behavior and perceptual strategies in complex tasks. Vision Research, 41(25-26), 3587−3596.
Recarte, M. A., & Nunes, L. M. (2003). Mental workload while driving: effects on visual search, discrimination, and decision making. Journal of Experimental Psychology: Applied, 9(2), 119−137. doi:10.1037/1076-898X.9.2.119
Sakai, H., Shin, D., Kohama, T., & Uchiyama, Y. (2012). Attentional effects on gaze preference for salient loci in traffic scenes. Ergonomics, 55(7), 743−751. doi:10.1080/00140139.2012.668563
Salvucci, D. D., & Goldberg, J. H. (2000). Identifying fixations and saccades in eye-tracking protocols. In: Proceedings of the eye tracking research and applications symposium. New York: ACM Press, 71–78. Available from: http://dl.acm.org/ citation.cfm?id=355028 [Accessed 31 October 2012].
Salvucci, D. D., & Gray, R. (2004). A two-point visual control model of steering. Perception, 33(10), 1233−1248. doi:10.1068/p5343
Sampson, H. (1956). Pacing and performance in a serial addition task. Canadian Journal of Psychology, 10, 219−225. doi:10.1037/h0083679
Steen, J., Damveld, H.J., Happee, R., van Paassen, M.M., & Mulder, M. (2011). A review of visual driver models for system identification purposes. In: 2011 IEEE international conference on systems, man, and cybernetics (SMC). Available from:http://ieeexplore.ieee.org/xpls/abs_all.jsp?arnumber=6083981&tag=1 [Accessed 31 October 2012].
Summala, H. (2007). Towards understanding motivational and emotional factors in driver behaviour: comfort through satisficing. In P. C. Cacciabue (Ed.), Modelling Driver Behaviour in Automotive Environments. London: Springer Verlag, 189−207.
Tatler, B. W, Hayhoe, M. M., Land, M. F., & Ballard, D. H. (2011). Eye guidance in natural vision: reinterpreting salience. Journal of Vision, 11(5), 1−23. doi:10.1167/11.5.5.Introduction
Underwood, G., Chapman, P., Bowden, K., & Crundall, D. (2002). Visual search while driving: skill and awareness during inspection of the scene. Transportation Research Part F: Traffic Psychology and Behaviour, 5(2), 87−97. doi:10.1016/S1369-8478(02)00008-6
Underwood, G., Chapman, P., Crundall, D., Cooper, S., & Wallen, R. (1999). The visual control of steering and driving: where do we look when negotiating curves? In A. G. Gale, I. D. Brown, C. M. Haslegrave, & S. P. Taylor (Eds.), Vision in Vehicles VII. Amsterdam: Elsevier Science, 245−252.
Victor, T., Harbluk, J., & Engström, J. (2005). Sensitivity of eye-movement measures to in-vehicle task difficulty. Transportation Research Part F: Traffic Psychology and Behaviour, 8(2), 167−190. doi:10.1016/j.trf.2005.04.014

22
Wann, J. P., & Swapp, D. K. (2000). Why you should look where you are going. Nature neuroscience, 3(7), 647−648. doi:10.1038/76602
Wikman, A.-S., Nieminen, T., & Summala, H. (1998). Driving experience and time-sharing during in-car tasks on roads of different width. Ergonomics, 41(3), 358−372. doi:10.1080/001401398187080
Yarbus, A. L. (1967). Eye Movements and Vision. New York: Plenum Press.