
Investigation on the Mechanism of Electrocodeposition and ...
125
Investigation on the Mechanism of Electrocodeposition and the Structure-Properties Correlation of Nickel Nanocomposites DISSERTATION zur Erlangung des akademischen Grades Doctor rerum naturalium (Dr. rer. nat.) vorgelegt der Fakultät Mathematik und Naturwissenschaften der Technischen Universität Dresden von Dipl. Chem. Denny Thiemig Dresden 2008
Transcript of Investigation on the Mechanism of Electrocodeposition and ...
Investigation on the Mechanism of Electrocodeposition
and the Structure-Properties Correlation of Nickel
Nanocomposites
DISSERTATION
zur Erlangung des akademischen Grades
Doctor rerum naturalium
(Dr. rer. nat.)
vorgelegt
der Fakultät Mathematik und Naturwissenschaften
der Technischen Universität Dresden
von
Dipl. Chem. Denny Thiemig
Dresden 2008
Investigation on the Mechanism of Electrocodeposition
and the Structure-Properties Correlation of Nickel
Nanocomposites
DISSERTATION
zur Erlangung des akademischen Grades
Doctor rerum naturalium
(Dr. rer. nat.)
vorgelegt
der Fakultät Mathematik und Naturwissenschaften
der Technischen Universität Dresden
von
Dipl. Chem. Denny Thiemig
geboren am 26.10.1980 in Elsterwerda
Gutachter: Prof. Alexander Eychmüller
Prof. Ulrich Guth
Prof. Benedetto Bozzini
Eingereicht am: 27.08.2008
Tag der Verteidigung: 05.02.2009
Acknowledgement
Acknowledgement
This work was carried out in the department of Physical Chemistry, Technische
Universität Dresden, from May 2006 until July 2008. The first thank goes to my
supervisor PD. Dr. rer. nat. habil. Andreas Bund for his faith in my abilities and his
constant encouragement throughout this process. I shall always treasure his guidance,
wise criticism and wholehearted cooperation. He gave me a truly interesting topic to work
in and sparked my interest for the electrochemistry. Besides, I thank him for giving me
the opportunity to participate in many national and international conferences.
Thanks also to the other committee members, including Prof. Alexander Eychmüller
(Physical Chemistry, TU Dresden) and Prof. Ulrich Guth (Physical Chemistry, TU
Dresden), and Prof. Benedetto Bozzini (University of Lecce, Italy).
I am also thankful to Prof. Jan B. Talbot (University of California San Diego, USA), Prof.
Benedetto Bozzini (University of Lecce, Italy), Prof. Pier Luigi Bonora (University of
Trento, Italy), and Prof. Geta Carac (University of Galati, Romania) for their hospitality
and of course the interesting and helpful discussions.
I am grateful to Ronny Lange and Clemens Kubeil for the assistance with some
measurements. Many thanks are addressed to Ellen Kern (Physical Chemistry, TU
Dresden) and Evelyn York (Scripps Institution of Oceanography, University of California
San Diego) for the SEM and EDX measurements and to Anja Bensch (Inorganic
Chemistry, TU Dresden) for the XRD measurements. Moreover, I would like to thank Dr.
Manfred Baumgärtner and Harald Merz (Research Institute Precious Metals & Metals
Chemistry, Schwäbisch Gmünd) for the GD-OES measurements and the useful
discussion. I also thank Susann Schachschal (Macromolecular Chemistry, TU Dresden) for
assisting with the stability measurements. I would like to thank Dr. Christian P. Gräf
(Department of Engineering Physics, Saarland University) for the synthesis of the Co
nanoparticles and realization of the VSM measurements.
Finally, I would like to thank Matthias Gestrich who build most of my experimental cells
and Wilfried Otte who build the electronic contacts of the cells.
This work was financially supported by the “Deutsche Forschungsgemeinschaft” within
the Grant BU 1200/10-1 and the Collaborative Research Centre (SFB) 609 “Electro-
magnetic Flow Control in Metallurgy, Crystal-Growth and Electrochemistry”. The travel
grant of the “Gesellschaft von Freunden und Förderern der TU Dresden e.V.” for the
research stay at the University of California San Diego is greatly appreciated.
I thank my family and closer friends for their constant belief in my abilities. And last, but
certainly not least, I thank my girlfriend Christin who was always there when I needed
her and who was a great support throughout this process.
Table of Contents
I
TABLE OF CONTENTS.............................................................................................I
LIST OF ORIGINAL PUBLICATIONS.........................................................................IV
LIST OF FIGURES................................................................................................VI
LIST OF TABLES..................................................................................................XI
LIST OF ABBREVIATIONS AND SYMBOLS ...............................................................XII
0 Introduction and Motivation......................................................................... 1 1 Theoretical Background................................................................................ 4
1.1 Electrocodeposition of Composites.............................................................. 4 1.2 Colloidal Dispersions................................................................................. 6
1.2.1 Electrical Double Layer ......................................................................... 6 1.2.2 Dispersion Stability .............................................................................. 8
1.3 Electrocodeposition Mechanisms and Models .............................................. 10 1.3.1 Model of Guglielmi ............................................................................. 10 1.3.2 Model of Celis et al............................................................................. 11 1.3.3 Trajectory Model of Fransaer et al. ....................................................... 13 1.3.4 Kinetic Model of Vereecken et al........................................................... 14 1.3.5 Model of Lee and Talbot ...................................................................... 15 1.3.6 Summary ......................................................................................... 15
1.4 Process Variables ................................................................................... 16 1.4.1 Electrochemical Cell Configuration and Electrode Orientation.................... 16 1.4.2 Hydrodynamics, Magneto-hydrodynamics.............................................. 17 1.4.3 Bath Properties.................................................................................. 18
1.4.3.1 Electrolyte Composition................................................................ 19 1.4.3.2 Particle Characteristics ................................................................. 19
1.4.4 Current Density and Current Modulation................................................ 20 1.5 Structure and Properties of Metal Matrix Nanocomposites ............................ 21
2 Experimental .............................................................................................. 22 2.1 Deposition Procedures ............................................................................ 22
2.1.1 Electrolyte Composition and Working Conditions..................................... 22 2.1.2 Nanoparticles .................................................................................... 23
2.1.2.1 Commercial Ceramic Nanoparticles ................................................ 23 2.1.2.2 Synthesis of Magnetic Nanoparticles............................................... 24
2.1.3 Experimental Set-up .......................................................................... 25 2.1.3.1 Parallel Plate Electrode (PPE) ........................................................ 25 2.1.3.2 Impinging Jet Electrode (IJE) ........................................................ 26 2.1.3.3 Electrocodeposition in a Magnetic Field ........................................... 28 2.1.3.4 Electrochemical Quartz Crystal Microbalance (EQCM)........................ 29
2.1.4 Substrate Preparation......................................................................... 30
Table of Contents
II
2.2 Particle-Characterization ......................................................................... 31 2.2.1 Zeta Potential Measurement ................................................................ 31 2.2.2 Photon Correlation Spectroscopy.......................................................... 32 2.2.3 Dispersion Stability ............................................................................ 34
2.3 Layer-Characterization............................................................................ 35 2.3.1 Particle Incorporation Analysis ............................................................. 35
2.3.1.1 Electrogravimetric Analysis ........................................................... 35 2.3.1.2 Scanning Electron Microscopy (SEM) and energy-dispersive X-ray
Spectroscopy (EDX)..................................................................... 36 2.3.1.3 Glow Discharge Optical Emission Spectrometry (GD-OES) ................. 37
2.3.2 Transmission Electron Microscopy (TEM) ............................................... 38 2.3.3 X-ray Diffraction (XRD)....................................................................... 38 2.3.4 Vickers Microhardness ........................................................................ 39 2.3.5 Abrasion Resistance ........................................................................... 39 2.3.6 Magnetization Measurements............................................................... 40
3 Results and Discussion............................................................................... 41 3.1 Particle Characterization ......................................................................... 41
3.1.1 Alumina............................................................................................ 41 3.1.2 Titania ............................................................................................. 42 3.1.3 Cobalt nanoparticles........................................................................... 45 3.1.4 Magnetite nanoparticles ...................................................................... 46
3.2 Alumina Particle Adsorption on the Nickel Electrode .................................... 48 3.3 Electrocodeposition of Ni-Al2O3 and Ni-TiO2 with the Parallel Plate Electrode.... 51
3.3.1 Direct Current Deposition.................................................................... 51 3.3.2 Pulse Plating and Pulse Reverse Plating ................................................. 53
3.4 Electrocodeposition of Ni-Al2O3 with the Impinging Jet Electrode ................... 57 3.5 Electrocodeposition of Nickel Matrix Nanocomposites in a Magnetic Field ........ 62 3.6 Structure and Properties ......................................................................... 65
3.6.1 Surface Morphology ........................................................................... 65 3.6.2 Microstructure ................................................................................... 67 3.6.3 Particle Incorporation Behavior ............................................................ 71 3.6.4 Mechanical Properties ......................................................................... 79
3.6.4.1 Vickers Microhardness.................................................................. 79 3.6.4.2 Abrasion Resistance..................................................................... 80
3.6.5 Magnetic Properties............................................................................ 81 4 Model of Electrocodeposition using an Impinging Jet Electrode ................. 84
4.1 Mathematical Model................................................................................ 84 4.2 Comparison with Experimental Results ...................................................... 91 4.3 Summary.............................................................................................. 94

Table of Contents
III
5 Conclusions and Suggested Future Work.................................................... 95 5.1 Conclusions for the Particle Characterization .............................................. 95 5.2 Conclusions for the Electrocodeposition of Nickel Composite Films................. 95 5.3 Conclusions for the Structure and Properties of Nickel Composite Films.......... 97 5.4 Conclusions for the Modeling of the Electrocodeposition............................... 98 5.5 Suggested Future Work .......................................................................... 98
6 References ............................................................................................... XVI
List of Original Publications
IV
List of Original Publications
This thesis is based on the following publications and presentations, respectively.
A. Bund, D. Thiemig
„Electrodeposition of Cu/alumina and Ni/alumina nanocomposites“
Trans. Electrochem. Soc. 3 (2006) 85-94
A. Bund, D. Thiemig
„Influence of bath composition and pH on the electrocodeposition of alumina
nanoparticles and nickel”
Surf. Coat. Technol. 201 (2007) 7092-7099
D. Thiemig, A. Bund, J.-B. Talbot
„Electrocodeposition of Nickel Nanocomposites using an Impinging Jet Electrode”
J. Electrochem. Soc. 154 (2007) D510-D515
D. Thiemig, R. Lange, A. Bund
„Influence of pulse plating parameters on the electrocodeposition of metal matrix
nanocomposites”
Electrochim. Acta 52 (2007) 7362-7371
D. Thiemig, R. Lange, A. Bund
„Der Einfluss modulierter Ströme auf die Dispersionsabscheidung von Nanokompositen”
Galvanotechnik 106 (2007) 2103-2112
D. Thiemig, A. Bund
„Characterization of electrodeposited Ni-TiO2 nanocomposite coatings”
Surf. Coat. Technol. 202 (2008) 2976-2984
D. Thiemig, A. Bund, J.-B. Talbot
„Influence of Hydrodynamics and Pulse Plating Parameters on the Electrocodeposition of
Nickel Nanocomposite Films”
Electrochim. Acta (accepted)
D. Thiemig, C. Kubeil, C. P. Gräf, A. Bund
„Electrocodeposition of Magnetic Nickel Matrix Nanocomposites in a Static Magnetic Field”
Thin Solid Films (submitted)
List of Original Publications
V
D. Thiemig, A. Bund, J.-B. Talbot
„Model of electrocodeposition using an unsubmerged impinging jet electrode”
J. Electrochem. Soc. (submitted)
D. Thiemig, A. Bund, J.-B. Talbot
„Untersuchungen zur elektrochemischen Herstellung und zu den Struktur-Eigenschafts-
beziehungen von Nickel Dispersionsschichten”
Galvanotechnik (submitted)
D. Thiemig, R. Lange, A. Bund
„Electrodeposition of Cu/alumina and Ni/alumina nanocomposites”
210th Meeting of the Electrochemcial Society, 29.10.-03.11.2006, Cancun, oral
presentation.
D. Thiemig, R. Lange, A. Bund
„Pulse Plating of Metal Matrix Nanocomposites”
58th Annual Meeting of the International Society of Electrochemistry, 9.-14.09.2007,
Banff, oral presentation.
D. Thiemig, R. Lange, A. Bund
„Der Einfluss modulierter Ströme auf die Dispersionsabscheidung von Nanokompositen”
DGO Oberflächentage 2007, 19.-21.09.2007, Garmisch Partenkirchen, oral presentation.
D. Thiemig, A. Bund, J.-B. Talbot
„Influence of Hydrodynamics and Pulse Plating Parameters on the Electrocodeposition of
Nickel Nanocomposite Films”
EuroInterfinish 2007, 18.-19.10.2007, Athens, oral presentation.
D. Thiemig, A. Bund
„Electrocodeposition and Characterization of Nickel Nanocomposite Films”
IX. Symposium of Colloids and Surface Chemistry, 29.–31.05.2008, Galati, oral
presentation.
D. Thiemig, A. Bund, J.-B. Talbot
„Electrocodeposition of Nickel Nanocomposite Films”
Gordon Research Conference - Electrodeposition, 27.07.–01.08.2008, New London,
poster presentation.
The publications are reprinted with the permission of the publishers.
List of Figures
VI
List of Figures
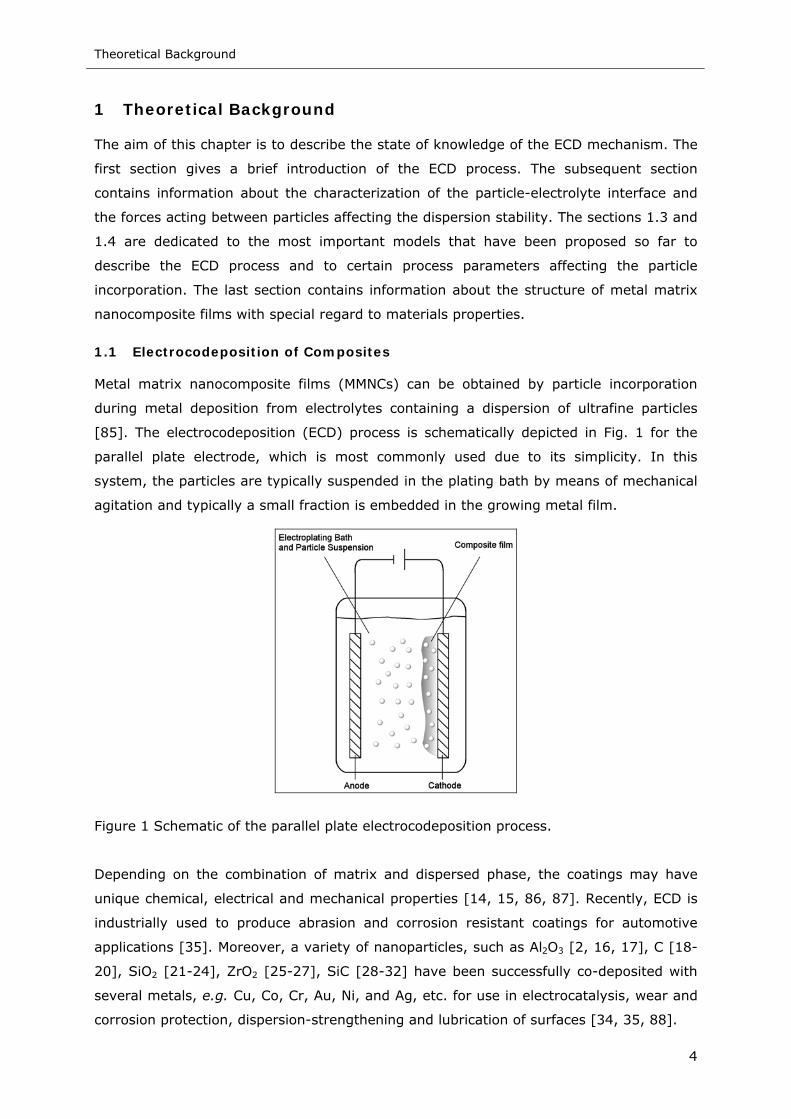
Figure 1 Schematic of the parallel plate electrocodeposition process......................... 4
Figure 2 Schematic representation of the multilayer structure and the potential profile
of the electrical double layer at the particle-solution interface in an aqueous
electrolyte. .......................................................................................... 7
Figure 3 Depiction of Guglielmi’s electrocodeposition model .................................. 10
Figure 4 Depiction of the five-step electrocodeposition mechanism......................... 12
Figure 5 Forces acting on a rigid spherical particle in the vicinity of the electrode ..... 13
Figure 6 Experimental setup of the parallel plate electrode system......................... 25
Figure 7 Experimental of the unsubmerged impinging jet electrode system ............. 26
Figure 8 Schematic of the electroplating cell of the IJE system .............................. 27
Figure 9 Schematic of the experimental setup of the electrocodeposition in a (a)
parallel (x-direction) and (b) perpendicular (z-direction) magnetic field (B
field). WE working electrode, CE counter electrode. The black sphere
represents the particle and j(Ni2+) is the electric current carried by the Ni
deposition. fL and fmp are the Lorentz and magnetophoretic force, respectively28
Figure 10 Schematic of the impinging jet cell used for the EQCM experiments ........... 29
Figure 11 Schematic representation of the principle of the microelectrophoretic
measurement..................................................................................... 31
Figure 12 Schematic representation of the principle of the photon correlation
spectroscopy...................................................................................... 32
Figure 13 Schematic of the measuring principle of the LUMIfuge 114 ....................... 34
Figure 14 Schematic of the measuring principle of the Taber Linear Abraser.............. 39
Figure 15 High-resolution bright field TEM image of the as-received 13 nm Al2O3
particles ............................................................................................ 41
Figure 16 Zeta potential of 13nm Al2O3 nanoparticles (0.2 g l-1) in diluted 10-3 M
electrolytes as a function of pH. ( ) KCl; ( ) sulfamate electrolyte;
( ) pyrophosphate electrolyte.............................................................. 42
Figure 17 High-resolution bright field TEM image of the as-received TiO2 particles...... 42
Figure 18 Zeta potential of TiO2 nanoparticles (0.2 g l-1) in diluted 10-3 M electrolytes as
a function of pH. ( ) KCl; ( ) sulfamate electrolyte; ( ) pyrophosphate
electrolyte ......................................................................................... 43
List of Figures
VII
Figure 19 Zeta potential of TiO2 nanoparticles (0.2 g l-1) in different electrolytes as a
function of pH (all concentrations are 10-3 M). (a): ( ) nickel sulfamate; ( )
nickel chloride; ( ) boric acid; (b): ( ) nickel sulphate; ( ) potassium
pyrophosphate; ( ) citric acid.............................................................. 44
Figure 20 Sedimentation curves of TiO2 nanoparticles (5 g l-1) in different electrolytes at
a rotation speed of 500 rpm. ( ) sulfamate electrolyte; ( ) pyrophosphate
electrolyte ......................................................................................... 45
Figure 21 High-resolution bright field TEM image of the as-prepared Co nanoparticles.
(a) cubes; (b) discoid .......................................................................... 45
Figure 22 High-resolution bright field TEM image of the as-prepared magnetite
nanoparticles ..................................................................................... 46
Figure 23 XRD pattern of Fe3O4 nanoparticles. (▬) measured pattern; (▬) reference
pattern (JCPDS no. 19-0629) ............................................................... 47
Figure 24 Hysteresis loop of the as-prepared Fe3O4 nanoparticles ............................ 47
Figure 25 Zeta potential and hydrodynamic diameter of the Fe3O4 nanoparticles in the
diluted nickel pyrophosphate electrolyte as a function of pH...................... 48
Figure 26 Mass adsorbed onto a freshly nickel coated quartz as a function of
(a) electrolyte flow rate at an electrode potential of -750 mV vs. Ag/AgCl and
(b) electrode potential at a flow rate of 600 ml min-1. Electrolyte composition:
5 g l-1 Al2O3 in 1 M KCl. ( ) pH 4.3; ( ) pH 7.5; (∆) pH 9.5...................... 49
Figure 27 Current density transients during the EQCM adsorption measurements at a
flow rate of 600 ml min-1, a pH of 4.3 and an electrode potential of (▬) 0 or
(▬) -1000 mV vs. Ag/AgCl. Electrolyte composition: 5 g l-1 Al2O3 in 1 M KCl 50
Figure 28 Correlation between the Al2O3 content in the layer and the particle loading of
13 nm Al2O3 particles. ( ) 1; ( ) 5; (∆) 10 A dm-2.................................. 51
Figure 29 Correlation between the TiO2 content in the layer and the concentration of
TiO2 in the electrolyte for different current densities. ( ) 1; ( ) 5;
( ) 10 A dm-2: (a) sulfamate electrolyte; (b) pyrophosphate electrolyte..... 52
Figure 30 Effect of duty cycle (a) and pulse frequency (b) on the alumina content of Ni-
Al2O3 composites. Particle loading: ( ) 1; ( ) 5; ( ) 10 g l-1 of 13 nm Al2O3
particles. The range of incorporation data using DC deposition at various
current densities and particle loadings is indicated by the hatched areas..... 54
Figure 31 Effect of the average current density during PP on the particle incorporation in
nickel for different particle loadings. ( ) 1; ( ) 5; (∆) 10 g l-1 of 13 nm Al2O3
particles ............................................................................................ 55
List of Figures
VIII
Figure 32 Effect of cathodic pulse time during PRP on the particle content of Ni-Al2O3
composites prepared at trev=20 ms from electrolytes containing 10 g l-1 of
13 nm Al2O3 particles. ip=5 A dm-2: ( ) ian=1 A dm-2; ( ) ian=5 A dm-2;
ip=10 A dm-2: ( ) ian=1 A dm-2; ( ) ian=5 A dm-2. The range of incorporation
data using PPE configuration at various current densities and particle loadings
of 13 nm Al2O3 particles is indicated by the hatched area.......................... 56
Figure 33 Correlation between the Al2O3 content in the layer and IJE flow rate for
different particle loadings of the electrolyte at a current density of 10 A dm-2.
( ) 90, ( ) 120 g l-1 50 nm Al2O3 particles............................................. 58
Figure 34 Effect of particle loading of the electrolyte on the particle incorporation at a
current density of 10 A dm-2. ( ) 1; ( ) 2.5; ( ) 6.5 l min-1 .................... 58
Figure 35 Influence of current density on the incorporation of alumina particles in nickel
at particle loading of 90 g l-1 Al2O3. ( ) 1; ( ) 2.5; ( ) 6.5 l min-1 ............ 59
Figure 36 Particle incorporation vs. percentage of limiting current density at a particle
loading of 90 g l-1 of 50 nm Al2O3 particles. ( ) 10; ( ) 15; (∆) 20 A dm-2.. 59
Figure 37 Particle content of the Ni-Al2O3 nanocomposites determined by EDX analysis
as a function of the incorporation results of the electrogravimetric method.. 60
Figure 38 Al2O3 content (determined by means of EDX analysis) in a nickel film
produced via Jet-Plating at a current density of 10 A dm-2 from an acidic
sulfamate electrolyte containing 90 g l-1 50 nm Al2O3 nanoparticles. ( ) 1;
( ) 2.5; ( ) 6.5 l min-1. The inside diagrams indicate the depth profile of the
nanoparticle distribution in the film obtained by GD-OES analyses ............. 61
Figure 39 Comparison of the particle content of Ni- Fe3O4 composites plated at different
current densities from electrolytes containing 10 g l-1 cubic cobalt
nanoparticles. ( ) B = 0 mT; ( ) B = 100 mT, perpendicular to i (x-
direction); (∆) B = 100 mT, parallel to i (z-direction, see Fig. 9b, p. 28)..... 63
Figure 40 SEM surface morphology of pure Ni films plated at 5 A dm-2; (a) sulfamate
bath; (b) pyrophosphate bath............................................................... 65
Figure 41 Surface morphology of Ni and Ni-Al2O3 composites plated at θ = 67 %,
f = 1.67 Hz. 0 g l-1 Al2O3: (a) 10 A dm-2, (c) 5 A dm-2. 10 g l-1 Al2O3:
(b) 10 A dm-2, (d) 5 A dm-2 .................................................................. 66
Figure 42 Cross-sectional SEM images of pure nickel films. (a) DC i =10 A dm-2, (b) PP
θ = 67 %, f = 3.3 Hz, ip = 10 A dm-2, (c) IJE 6.5 l min-1, i =10 A dm-2........ 67
List of Figures
IX
Figure 43 Cross-sectional SEM images of a Ni-Al2O3 composite film plated at 10 A dm-2,
6.5 l min-1 and 60 g l-1 of 50 nm Al2O3 particles in the electrolyte. (with
increasing resolution) .......................................................................... 68
Figure 44 Cross sectional SEM image of pure nickel (a) and a Ni-TiO2 nanocomposite (b)
film deposited from pyrophosphate bath. (a) 10 A dm-2; (b) 5 A dm-2, 10 g l-1
TiO2 in the electrolyte.......................................................................... 68
Figure 45 X-ray diffraction patterns of Ni and Ni-TiO2 films plated at a current density of
1 A dm-2. (a) acidic sulfamate bath, (b) alkaline pyrophosphate bath ......... 69
Figure 46 QBSD image (a) and IPF color coded nickel map (b) of a pure nickel film
deposited from the sulfamate electrolyte by PRP: iP=5 A dm-2, ton=400 ms and
ian=1 A dm-2, trev=20 ms ...................................................................... 73
Figure 47 QBSD image (a) and IPF color coded nickel map (b) as well as detail in image
quality map (c) IPF color coded nickel map (d) and IPF color coded alumina
map (e) of a Ni-Al2O3 film deposited by PRP (same plating conditions as Fig.
46, 10 g l-1 13 nm Al2O3 in the electrolyte). ............................................ 73
Figure 48 QBSD image (a) and IPF color coded nickel map (b) of a Ni-Al2O3 film
deposited from the sulfamate electrolyte containing 10 g l-1 13 nm Al2O3 by
DC: i=10 A dm-2 ................................................................................. 74
Figure 49 Pole figures of composite films plated from electrolyte containing 10 g l-1
13 nm Al2O3. (a) DC: 10 A dm-2; (b) PRP: iP=5 A dm-2, ton=400 ms and
ian=1 A dm-2, trev=20 ms ...................................................................... 74
Figure 50 SE (a, b) and STEM (c, d) dark field images of a Ni-Al2O3 film deposited by
PRP (same plating conditions as Fig. 46, 10 g l-1 13 nm Al2O3 in the
electrolyte) ........................................................................................ 76
Figure 51 TEM image of a Ni-Al2O3 film produced by PRP (same plating conditions as
Fig. 46, 10 g l-1 13 nm Al2O3 in the electrolyte) ....................................... 77
Figure 52 High resolution TEM images of a Ni-Al2O3 film produced by PRP (same plating
conditions as Fig. 46, 10 g l-1 13 nm Al2O3 in the electrolyte) .................... 77
Figure 53 High resolution TEM image of a Ni-Al2O3 film (same plating conditions as
Fig. 46, 10 g l-1 13 nm Al2O3 in the electrolyte) including the subscription of
certain lattice planes of the nickel matrix ............................................... 78
Figure 54 Correlation between the Vickers microhardness and the TiO2 content of the
layer; ( ) 1 A dm-2; ( ) 5 A dm-2; ( ) 10 A dm-2. (a) sulfamate electrolyte;
(b) pyrophosphate electrolyte............................................................... 79
List of Figures
X
Figure 55 Weight loss after bi-directional sliding test as a function of the plating current
density. Sulfamate electrolyte: ( ) 0 g l-1; ( ) 10 g l-1 TiO2; Pyrophosphate
electrolyte ( ) 0 g l-1; ( ) 10 g l-1 TiO2.................................................. 81
Figure 56 Hysteresis loops of pure Ni films deposited at 5 A dm-2. ( ) B = 0 mT;
( ) B = 100 mT (z-direction); ( ) B = 100 mT, (x-direction, Fig. 9, p. 28) 82
Figure 57 Schematic representation of the particle concentration in the impinging region
of the unsubmerged IJE system. cp,b, ci,b are the bulk concentration and
cp,s, ci,s are the concentration at the electrode surface of the particle and
reactive ion, respectively ..................................................................... 84
Figure 58 Particle diffusion boundary layer thickness as a function of the electrolyte
velocity ............................................................................................. 88
Figure 59 Parameter AD (IJE flow rate: ▬ 1 l min-1, ▬ 2.5 l min-1, ▬ 6.5 l min-1) and AG
(▬) in Eq. 24 vs. particle diameter ........................................................ 89
Figure 60 The number of nanoparticles per unit volume of nickel in the film, mp, vs.
particle number density in the solution, nb, for flow rates of 1-6.5 l min-1. The
solid lines are the calculated particle number densities in the film under
diffusion-limiting conditions (IJE flow rate: ( ) 1 l min-1, ( ) 2.5 l min-1,
( ) 6.5 l min-1) and the open squares refer to the experimental results.
(a) 5 A dm-2, (b) 10 A dm-2, (c) 15 A dm-2, (d) 20 A dm-2 ......................... 91
Figure 61 Particle size distribution of the alumina nanoparticles in the acidic nickel
sulfamate electrolyte determined by photon correlation spectroscopy......... 92
Figure 62 The number of nanoparticles per unit volume of nickel in the film, mp, vs.
particle number density in the solution, nb, for IJE flow rates of 1-6.5 l min-1
and a current density of (a) 5 A dm-2 or (b) 20 A dm-2, respectively. The
hatched areas refer to the theoretical particle number densities in the film
taking into account the actual particle size distribution in the electrolyte
(Fig. 61) and the open squares refer to the experimental results ............... 93
List of Tables
XI
List of Tables
Table 1 Electrolyte composition and working conditions ....................................... 22
Table 2 Particle properties as given by the supplier............................................. 23
Table 3 Applied pulse plating current programs. The cathodic peak current density
was 5 and 10 A dm-2, respectively......................................................... 26
Table 4 Particle content of the Ni-Co composites prepared from electrolytes containing
6 g l-1 Co particles of either disk-like or cubically shape. B refers to the
direction of the 100 mT magnetic field during electrodeposition: 0 no field;
x - perpendicular to i; z - parallel to i (see Fig. 9b, p. 28) ......................... 62
Table 5 Relative texture coefficient RTChkl of the pure nickel and Ni-TiO2 composite
films deposited from electrolytes containing 10 g l-1 TiO2 .......................... 70
Table 6 Crystallite size of pure nickel and Ni-TiO2 composites, deposited from
electrolytes containing 10 g l-1 nanoparticles, determined by the Scherrer line
broadening using the (200) reflection of the XRD pattern ......................... 70
Table 7 Grain features of the nickel matrix ........................................................ 72
Table 8 Magnetic properties of pure Ni and Ni-Co composites. Composites have been
prepared from electrolytes containing 6 g l-1 Co particles .......................... 82
Table 9 List of values for physical properties ...................................................... 88
List of Abbreviations and Symbols
XII
List of Abbreviations
CE counter electrode
DC direct current
EBSD electron backscattered diffraction
ECD electrocodeposition
EDX energy dispersive X-ray spectroscopy
EDL electrical double layer
EQCM electrochemical quartz crystal microbalance
EsB elastically scattered back scattered electrons
FHWM full width at half maximum
GD-OES glow discharge optical emission spectrometry
IJE impinging jet electrode
MEMS micro-electromechanical systems
MHD magnetohydrodynamic effect
MMNC metal matrix nanocomposite
OP oxide polish
PCS photon correlation spectroscopy
PP pulse plating
PPE parallel plate electrode
PRP pulse reverse plating
QBSD quadrant backscattered diffraction
RCE rotating cylinder electrode
RDE rotating disk electrode
RE reference electrode
RTC relative texture coefficient
SCE saturated calomel electrode
SE secondary electron
SEM scanning electron microscopy
STEM scanning transmission electron microscopy
TEM transmission electron microscopy
VSM vibrating sample magnetometry
WE working electrode
XRD X-ray diffraction
List of Symbols
AD transport parameter for diffusion flux
AG transport parameter for gravitational flux corrected for the buoyancy
B magnetic field, T
ci,b concentration of ionic species in the bulk electrolyte solution, mol m-3
List of Abbreviations and Symbols
XIII
ci,s concentration of ionic species at the electrode surface, mol m-3
cp,b concentration of particles in the bulk solution, mol m-3
cp,s concentration of particles at the electrode surface, mol m-3
d jet nozzle diameter, m
Dm diffusion coefficient of the reactive metal species, m2 s-1
Dp particle diffusion coefficient, m2 s-1
f friction coefficient (f = 6 π η r)
fL Lorentz force, N
fmp magnetophoretic force, N
fP pulse frequency, s-1
fR,0 resonance frequency of the unloaded quartz, Hz
F Faraday’s constant, 9.64853 x 10⁴ A s mol-1
FDiff diffusion force, N
FGrav gravitation force, N
Ftotal total force acting on the particle, N
g gravitation acceleration rate, m2 s-1
H nozzle-substrate gap distance, m
HC coercivity, Oe
i current density, A dm-2
iave average current density, A dm-2
ian anodic peak current density, A dm-2
iP cathodic peak current density, A dm-2
iL limiting current density, A dm-2
JP mass flux of particles on an electrode surface, mol m-2 s-1
Jm mass flux of deposited metal atoms on an electrode surface, mol m-2 s-1
k average mass transfer coefficient (k = Dm / δ), m s-1
kB Boltzmann’s constant, 1.380658 x 10⁻²³ J K-1
m single particle mass, kg
mp number of particles per unit volume of nickel in the film
nb number density of particles per unit volume of electrolyte solution
nm number of moles of metal atoms in a composite film, mol
np number of moles of particles in a composite film, mol
MS saturation magnetization, m emu
NA Avogadro’s number, 6.022136 x 10²³ mol-1
r particle radius, m
R gas constant, J mol-1K-1
Re Reynolds number
Sc Schmidt number
Sh Sherwood number
List of Abbreviations and Symbols
XIV
ton pulse on-time, s
toff pulse pause, s
trev pulse reverse time, s
T temperature, K
υ jet flow velocity, m s-1
υDr net drift velocity of the particles, m s-1
Vm,M molar volume of the deposited metal, m3 mol-1
Vp single particle volume, m3
xv volume fraction of inert particles incorporated in a composite film, vol-%
z charge number
Greek letters
δ boundary layer thickness for metal ions, m
δ0 viscous sublayer boundary layer thickness, m
δp boundary layer thickness for particles, m
ρf density of the electrolyte solution, kg m-3
ρp density of a particle, kg m-3
∇c concentration gradient
∇µ chemical potential gradient
κ-1 Debye length, m-1
η dynamic viscosity of the electrolyte solution, kg m-1 s-1
ν kinematic viscosity of the electrolyte solution, m2s-1
θ duty cycle, %
ζ zeta potential, mV
Subscripts
b bulk electrolyte solution
m deposited metal species
p particle
s electrode surface
Introduction and Motivation
1
0 Introduction and Motivation
Metal matrix nanocomposites (MMNCs) consisting of ultrafine particles of pure metals,
ceramics and organic materials in a metal matrix have attracted extensive attention from
science and technology since decades [1-3]. Due to their beneficial electrical [4, 5],
optical [4, 6, 7], magnetic [8, 9] and mechanical [10-13] properties, they are promising
candidates for advanced materials [14, 15]. A variety of preparation techniques, such as
thermal and plasma spraying, combination of chemical and physical vapor deposition,
powder metallurgy or stir casting have been investigated for developing MMNCs. Among
those the process of electrocodeposition (ECD), i.e. the process of particle incorporation
during the electrolytic deposition of metal, has the advantages of uniform depositions on
complexly shaped substrates, low cost, good reproducibility, homogenous distribution of
particles, ability of continuous processing, and the reduction of waste [2]. However, there
are also several challenges. Dispersal of the particles in a common plating bath can be
problematic. In most cases agglomeration and sedimentation of the particles occurs
which makes successful codeposition difficult.
A variety of nanosized particles, such as Al2O3 [2, 16, 17], C [18-20], SiO2 [21-24], ZrO2
[25-27], SiC [28-32] have been successfully co-deposited with several metals. The
concentration of particles suspended in the electrolyte has varied from 1 to 200 g l-1,
typically producing composites with 1-10 vol% particles [2, 33, 34]. ECD has found use
in many important industrial sectors, such as automotive, construction, power generation
and aerospace applications [15, 35]. More recently, magnetic micro-electromechanical
systems (MEMS) have gained increasing scientific and industrial interests due to their
high force and long range application, low power consumption and reversibility [36-42].
A great deal of research effort has been dedicated to the field of soft magnetic materials
for sensor implementation [43-45]. However, a higher magnetic moment is required in
the case of MEM actuators which are operated by an external magnetic field [37, 46-48].
Therefore, the application of hard magnetic materials seems promising [41, 42, 48]. The
application of nanocrystalline magnetic particles for such media seems to be
advantageous. Moreover, the incorporation of magnetically hard particles in an
electrodeposited Ni or Ni-alloy matrix was found to significantly increase the coercivity of
the resulting films [41].
The amount and distribution of the incorporated particles depend upon a variety of inter-
related process parameters, including particle characteristics, bath composition,
electrochemical cell configuration and operating conditions, particularly hydrodynamics,
current density and current modulation [2, 49-54]. Several theoretical models have been
proposed to describe the ECD phenomena [1, 49, 51, 55, 56]. However, up to date the
mechanism of particle incorporation is not fully understood. This lack of fundamental
understanding of the ECD process has resulted in a trial and error approach being the
Introduction and Motivation
2
only method of developing parameters for industrial applicable codeposition of composite
films with fairly reproducible particle content. Our group has addressed this issue by
systematically studying the incorporation behavior of alumina and diamond nanoparticles
within a copper, gold and nickel matrix [16, 17, 57]. It has been shown that the surface
charge of the nanoparticles is an important parameter for the ECD process. An
interesting result was that negatively charged particles are more easily
co-deposited compared to positively charged ones. This finding, which is a little bit
counterintuitive at the first glance, was explained by an electrostatic model which takes
into consideration the presence of ionic clouds of particle and electrode [16, 17, 57].
In the ECD process, bath agitation is usually necessary to maintain a dispersed
suspension and to transport the particles to the cathode surface. Most studies on ECD
have focused on a parallel plate electrode configuration because of its simplicity [2, 50].
However, due to the various ways of agitating the suspension, an analysis and a
comparison of hydrodynamics is almost impossible with this configuration. The control of
hydrodynamics can be achieved by using a rotating cylinder (RCE) [58-60] or rotating
disk electrode (RDE) [21, 32, 60]. However, both the RCE and the RDE configurations are
not typically a viable industrial method, because of their limitation of specific cathode
shapes. Another promising way to control hydrodynamics is the impinging jet electrode
(IJE) configuration [61]. The IJE provides the advantages of selective [62] and high-
speed plating [63]. Furthermore, it is an attractive method to electrodeposit gradient
coatings while controlling the volume fraction of particles by changing the jet velocity
[64]. There is little research on the ECD of nickel based composites plated with an IJE
[64-66]. Recently, ECD with an unsubmerged IJE resulted in particle incorporations of up
to 30 vol-% SiC in a nickel matrix [65]. However, no systematic investigation of the
effects of the IJE plating parameters on the ECD of Al2O3 nanoparticles and nickel has
been reported so far.
The properties of MMNCs mainly depend on their composition and structure [11]. Uniform
distribution and high amounts of co-deposited particles within the metal matrix were
found to be crucial to improve the coating properties [16, 67]. In many cases the
enhanced performance of the coatings is mainly caused by a change in the
microstructure of the metal matrix [16, 30] and not so much by the presence of the
particles themselves. The structure of electroplated metal and alloy coatings is specified
by the electrocrystallization process, particularly by the interplay between nucleation and
crystal growth [68]. An attractive way of controlling these two processes is the
application of a periodically changing current [69]. Compared to direct current (DC)
plating, pulse plating (PP) can yield nanocrystalline coatings with improved surface
appearance and properties, such as smoothness, refined grains and enhanced corrosion
resistance [13, 30, 70-73].
Introduction and Motivation
3
Besides the electrocrystallization of the metal matrix, the particle inclusion during MMNCs
plating is affected by pulse plating. It has been observed that PP [53, 54, 74-76] as well
as pulse reverse plating (PRP) [26, 77] could be used to enhance the particle
incorporation. Furthermore, it has been shown in Refs. [78-80] that PP and PRP can be
used for a size-selective incorporation of alumina nanoparticles into copper and nickel
matrices, respectively. There are some reports on the effects of PP and PRP on the ECD
of alumina with nickel from acidic electrolytes [54, 74, 79-81]. Promising improvements
in terms of the amount and the distribution of incorporated alumina particles have been
reported with a pulse length in the order of milliseconds [54, 79, 80]. However, no
extensive investigations on the effect of the several interrelated PP and PRP parameters
can be found in the literature.
The overall objective of this work was to investigate systematically the ECD of nickel
nanocomposites using two kinds of nickel plating baths; an acidic sulfamate and an
alkaline pyrophosphate bath. Nickel was chosen as a sample matrix material, because it
is one of the common industrial coatings used for decorative and functional applications.
The electrodeposition of nickel from sulfamate electrolytes is an industrially important
process [82]. The advantage over other electrolytes, e.g. the Watts bath, include high
current efficiency, low film stress even without the addition of additives and the generally
good mechanical properties of the nickel deposit [83]. Particle reinforcements have
included alumina (Al2O3) and titania (TiO2) since these nanoparticles are readily
industrially available in large quantities with almost constant properties. Hence, an up-
scaling of the ECD process would be feasible. Moreover, Ni-TiO2 composites have been
reported to be advantageous for high temperature [84] and photoelectrochemical
applications [7]. Additionally, the ECD of cobalt (Co) and magnetite (Fe3O4) nanoparticles
with nickel was studied in the presence of a static magnetic field. The motivation for the
application of a magnetic field during deposition was to enhance the particle content of
the composite films. Apart from the well established parallel plate direct current
deposition, nanocomposites were produced by means of pulse-plating and jet-plating.
The effects of the deposition parameters (electrolyte composition, type of current,
current density, pH, hydrodynamics, orientation of magnetic field, etc.) on the
codeposition of nanoparticles with nickel were investigated by evaluating the particle
content, structure as well as the mechanical, i.e. microhardness and abrasion resistance,
and magnetic properties, i.e. saturation magnetization and coercivity, of the composite
films.
Theoretical Background
4
1 Theoretical Background
The aim of this chapter is to describe the state of knowledge of the ECD mechanism. The
first section gives a brief introduction of the ECD process. The subsequent section
contains information about the characterization of the particle-electrolyte interface and
the forces acting between particles affecting the dispersion stability. The sections 1.3 and
1.4 are dedicated to the most important models that have been proposed so far to
describe the ECD process and to certain process parameters affecting the particle
incorporation. The last section contains information about the structure of metal matrix
nanocomposite films with special regard to materials properties.
1.1 Electrocodeposition of Composites
Metal matrix nanocomposite films (MMNCs) can be obtained by particle incorporation
during metal deposition from electrolytes containing a dispersion of ultrafine particles
[85]. The electrocodeposition (ECD) process is schematically depicted in Fig. 1 for the
parallel plate electrode, which is most commonly used due to its simplicity. In this
system, the particles are typically suspended in the plating bath by means of mechanical
agitation and typically a small fraction is embedded in the growing metal film.
Figure 1 Schematic of the parallel plate electrocodeposition process.
Depending on the combination of matrix and dispersed phase, the coatings may have
unique chemical, electrical and mechanical properties [14, 15, 86, 87]. Recently, ECD is
industrially used to produce abrasion and corrosion resistant coatings for automotive
applications [35]. Moreover, a variety of nanoparticles, such as Al2O3 [2, 16, 17], C [18-
20], SiO2 [21-24], ZrO2 [25-27], SiC [28-32] have been successfully co-deposited with
several metals, e.g. Cu, Co, Cr, Au, Ni, and Ag, etc. for use in electrocatalysis, wear and
corrosion protection, dispersion-strengthening and lubrication of surfaces [34, 35, 88].
Theoretical Background
5
Although the origins of ECD lie in the early 1900s [89], most of the applications and
modeling developments have been achieved within the last decades. In the early stages,
particle incorporation occurred unintentionally without recognizing the possible benefits
of the incorporation. As they were considered as impurities degrading the quality of the
plated films, efforts were made to prevent their incorporation [2]. As a result, soluble
anodes were enclosed in a bag and filters to remove undesirable particles were
implemented in the plating cell [2]. Thenceforward the early 1960’s, the benefits of the
ECD process were established and several industrial applications as coatings for gas
turbines used in advanced power generation and aerospace [90], surface coatings for
cutting tools with increased strength [91, 92], lubricated surfaces [93], high thermal
conductive dispersion-strengthening of materials for actively-cooled structures [94], and
high surface area photoelectrodes for electrocatalysis in solar energy conversion [4] have
been developed. While most of the ECD research has focused on maximizing the amount
of particle incorporation or improving a certain property of the resulting composite film,
relatively little effort was dedicated to the fundamental understanding of the ECD
mechanism. Nevertheless, from the research to date the influence of a variety of process
parameters (current modulation, current density, pH, hydrodynamics, electrolyte
composition, etc.) on the ECD process has been determined, typically by evaluating the
change in the amount of particle incorporation when that particular parameter is
adjusted. Even though the process variables affecting the ECD process have been
generally agreed upon, the particular effect of a certain parameter has often been
reported contradictory. Furthermore, it is important to note that these process variables
are not necessarily independent from one another and that their effect is strongly
dependent on the particle-electrolyte combination studied [2, 3]. Detecting the amount
and distribution of the particles incorporated in a metal matrix composite is important in
understanding the influence that the process parameters have on the deposited film.
Several methods have been used for this purpose, including electrogravimetric analysis
[95], gravimetric analysis [96], X-ray fluorescence [97], atomic absorption spectrometry
[95, 98], infrared reflection absorption spectroscopy [99], microscopic analysis using
scanning electron microscopy [100], and energy dispersive X-ray analysis. In general,
the literature lacks a discussion concerning the reproducibility and accuracy of the
reported incorporation data [2]. Hence, an accurate and reproducible analytical method
is needed for verifying the particle incorporation and distribution.
Theoretical Background
6
1.2 Colloidal Dispersions
1.2.1 Electrical Double Layer
The surface of any phase is characterized by a separation of positive and negative charge
components leading to a region of varying electrical potential [101]. When two phases
are placed in contact, in general, a potential difference develops between them [101,
102]. In the case of colloidal dispersions, one of the phases is a continuous medium
(usually an electrolyte solution), and the other phase is the colloidal particle that is
dispersed in the continuous phase. If a charged colloidal particle is placed in contact with
a solution containing both, positive and negative charges, the charges tend to distribute
themselves in a non-uniform way at the particle-electrolyte interface resulting in the
formation of the electrical double layer (EDL) [101, 102].
The structure of the EDL has been described by various models. The first theory for a
quantitative description of the EDL was developed by Helmholtz in 1879 [102]. The
Helmholtz model assumes that a layer of counter ions directly binds to the charges in a
plane, and their charge exactly compensates that of the surface charges [102]. The
electric field generated by the surface charges is accordingly limited to the thickness of
this molecular layer of counter ions. Since, such a structure is equivalent to a parallel-
plate capacitor; Helmholtz was able to interpret measurements of the double layer
capacity. However, although the charge on solids is confined to a surface, the same is
not necessarily true of electrolyte solutions, particularly in the case of low electrolyte
concentrations [102].
Gouy [103] and Chapman [104] went a step further and considered the thermal motion
of the counter ions in the electrolyte. Therefore, this model involves a diffuse layer of
charge in the solution. The highest concentration of excess charges is adjacent to the
surface, as there is a strong electrostatic force attracting these ions. The ion
concentration decreases progressively with increasing distance, since the electric field is
partially screened by the ions that are accumulated closer to the surface [102].
In 1924 Stern united the models of Helmholtz and Gouy and Chapman taking into
consideration the finite dimension of the ions [102]. Finally, the EDL refers to the
electrical potential function and is divided into two layers, one with rapid potential decay
near the surface and the other with a more gradual decay farther from the surface [102]
as shown in Fig. 2. The inner layer, which is called the compact, Helmholtz, or Stern
layer, contains solvent molecules and other species that are specifically absorbed [102].
The locus of the electrical charge centers of these ions is called the inner Helmholtz
plane. The solvated ions can only approach the surface at a distance beyond the inner
Helmholtz plane. The locus of the electrical centers of the closest solvated ions is called
the outer Helmholtz plane. The solvated ions and the surface interact via only long-range
Theoretical Background
7
electrostatic forces, which are independent of the chemical properties of the ions. The
solvated ions are nonspecifically absorbed. Due to thermal agitation, these ions form a
region called the diffuse layer [102]. The ion distribution in the diffuse layer was
described by the Poisson-Boltzmann equation; a combination of the Poisson equation
(electrostatics) and the Boltzmann distribution (statistical mechanics) [103, 104].
Generally, the Poisson equation relates the charge density at a certain place with the
electric potential. Due to the fact that the ions in solution are free to move, their
distribution, and thus the charge distribution in the liquid, is unknown. As a result the
potential cannot be determined by applying solely the Poisson equation. Additionally, the
Boltzmann equation, which describes the probability of finding an ion at some particular
point in the solution, has to be considered. The extension of the double layer, referred to
as the diffuse double layer thickness or the Debye length (κ-1), is inversely proportional
to the ion concentration of the electrolyte and to the square of the valency of the ions
involved. It is customarily defined as the distance from the particle-electrolyte interface
at which the potential has reached the 1/e fraction of its value at the surface [102].
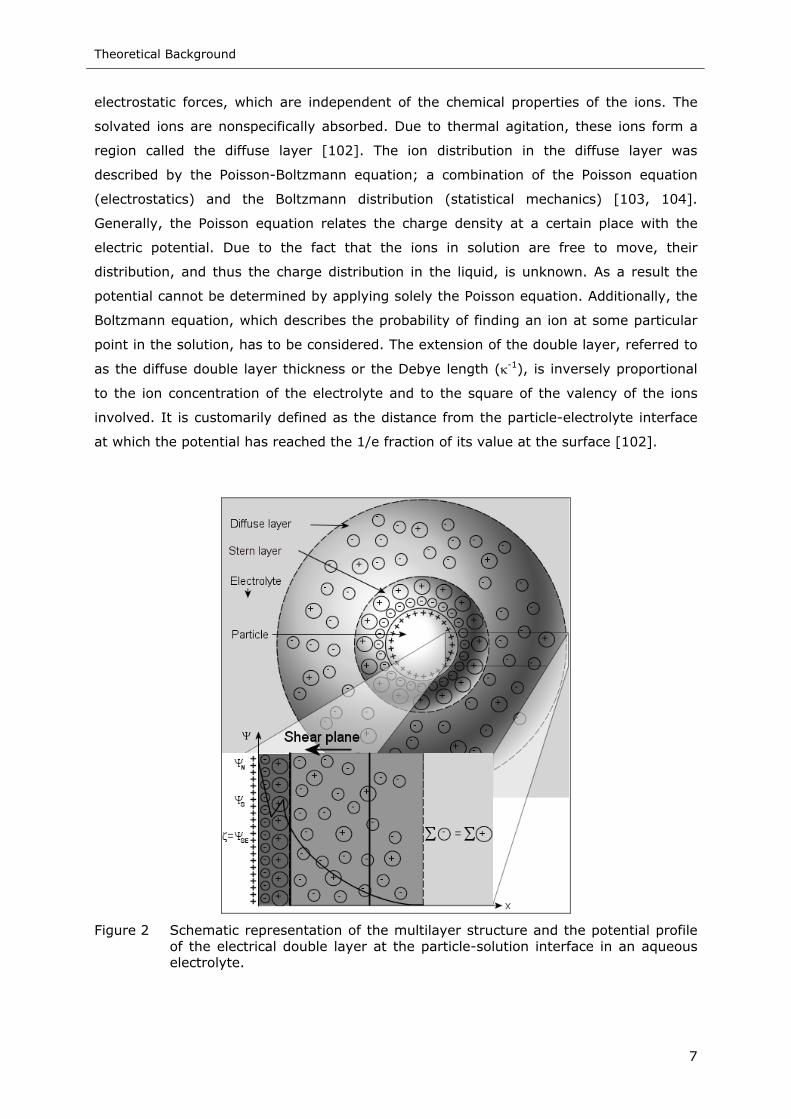
Figure 2 Schematic representation of the multilayer structure and the potential profile of the electrical double layer at the particle-solution interface in an aqueous electrolyte.
Theoretical Background
8
The surface of a colloidal particle dispersed in an electrolyte solution is characterized by
an EDL consisting of a fixed layer and a diffuse layer as shown in Fig. 2. The interface
between the fixed and the diffuse layer is called the shear plane. The zeta potential (ζ) is
defined as the potential difference between the shear plane and the bulk solution (Fig. 2)
[101]. This potential is taken as an approximation of the surface potential of the particle,
since it is not possible to measure the surface potential of the particle itself [101]. The
zeta potential is obtained by measuring charged particles in suspension and observing
their mobility under an electric field gradient (The method will be discussed in more
detail in section 2.2.1.) [101, 105].
The surface charges of colloidal particles can have several origins. The particles might be
charged either as a result of imperfections in the crystal structure near the surface,
adsorption of specific ions on the surface or dissolution of ionic species from the surface
[106]. In the case of metal oxides suspended in an aqueous inert electrolyte, the surface
charges are usually generated by the adsorption and desorption, respectively, of protons
on hydroxyl groups or hydrogen ions in the surface region. For instance in the case of
alumina, the origin for this reaction is based on the incomplete coordination number of
the Al3+ or the O2- ions in the surface region [101, 106-108].
1.2.2 Dispersion Stability
Dispersion stability refers to the kinetic stability of the particles in suspension.
A suspension is considered as stable as long as the individual particles exist separated in
solution and do not form aggregates over a relevant time scale [101]. The relevant time
scale may vary from tenth of seconds to years, depending on the application [106].
The stability is due to the existence of an energy barrier in the total interaction energy
curve preventing the proximity of particles and can be described by the DLVO
(Derjaguin-Landau-Verwey-Overbeek) theory [109, 110]. As two particles approach,
there are at least two types of interaction: the repulsive and the attractive van der Waals
interactions, which make most colloids inherently unstable [101]. The van der Waals
force is defined as the sum of the Keesom, the Debye and the London dispersion
interaction, i.e. all the terms that consider dipole interactions. Usually the London
dispersion term is dominating [101]. Dispersion stability of particles dispersed in an
aqueous solution can be achieved either by electrostatic stabilization (i.e. surface charge)
or steric stabilization (i.e. presence of surfactants or other molecules at the particle
surface), or by a combination of both [101, 106]. In the case of an electrostatic stabilized
colloid, the repulsion energy barrier depends on the extent of the EDL (1.2.1) and on the
magnitude of the surface charge [101]. If the energy barrier is lower for instance at
higher ionic strength of the electrolyte or at lower particle charge, the particles may
Theoretical Background
9
agglomerate irreversibly. An additional important prediction of the DLVO theory is that
under certain conditions, a secondary minimum occurs at larger separation distances,
which is significant for colloidal systems, since this state of agglomeration (i.e.
flocculation) is reversible and thus can be easily turned into the dispersed state by e.g.
mechanical stirring. While the repulsive forces can be tuned via the experimental
conditions (e.g. pH, ionic strength, etc.), the van der Waals force can just be affected by
the type of particle as well as the type of dispersant. If an electrolyte is added to a
colloidal suspension, causing marked compression of the electrical double layer around
the colloidal particles (section 1.2.1), coagulation will occur. It has been proven by
experiments that the DLVO theory is not suitable to describe the stability of all colloidal
systems. Moreover, a so-called structural term has to be included which is either
attractive or repulsive depending on the particle type [101]. Apart from electrostatic
interaction, repulsive interactions can also arise from steric stabilization due to the
adsorption of non-ionic polymers onto the particle surface [101].
In an application where particle size is crucial to the process (such as ECD),
agglomeration of colloidal particles yielding a higher mean particle size in the suspension
can affect the product or process considerably, even if the agglomeration is not enough
to cause significant visible settling. In ECD the stability of the colloid dispersion is
mandatory, since the particles shall be preferentially incorporated in the form of
individual particles in order to improve the film properties [111]. Moreover, the
incorporation behavior of particles obviously dependents on their size as will be discussed
in section 1.4.3.2. Due to the high ionic strength of the plating electrolytes, the diffuse
part of the EDL on the particle will be depressed, leading to a reduced electrostatic
repulsion. As a result a lower energy barrier in the total interaction energy curve can
cause an irreversible agglomeration of the particles. By measuring fundamental
parameters known to affect dispersion stability such as zeta potential (section 2.2.1) and
particle size (section 2.2.2), one can evaluate dispersion stability of the sample [101].
The magnitude of the zeta potential gives an indication of the stability of the colloidal
system. In general, particles with an absolute value of the zeta potential above 30 mV
are usually considered as stable [101].
Theoretical Background
10
1.3 Electrocodeposition Mechanisms and Models
The purpose of this chapter is to give a short summary on the main theories which have
been developed to describe the ECD process. In general, there are three main steps that
must occur during ECD:
(I) Transport of particles from the bulk electrolyte to the electrode surface by means
of various mechanisms, e.g. convection, diffusion and electrophoresis.
(II) Particle adsorption at the electrode surface.
(III) Irreversible entrapment of the particles in the growing metal layer.
In general, the following discussed models differ in the description of these three stages
of the ECD process. A more detailed description of all the models developed for the ECD
process can be found in several review papers which describe models, mechanism,
effects of process parameters, and possible applications [2, 3, 33-35, 50, 85]. While
refined models have been developed during the years, the ECD process is still not
understood completely.
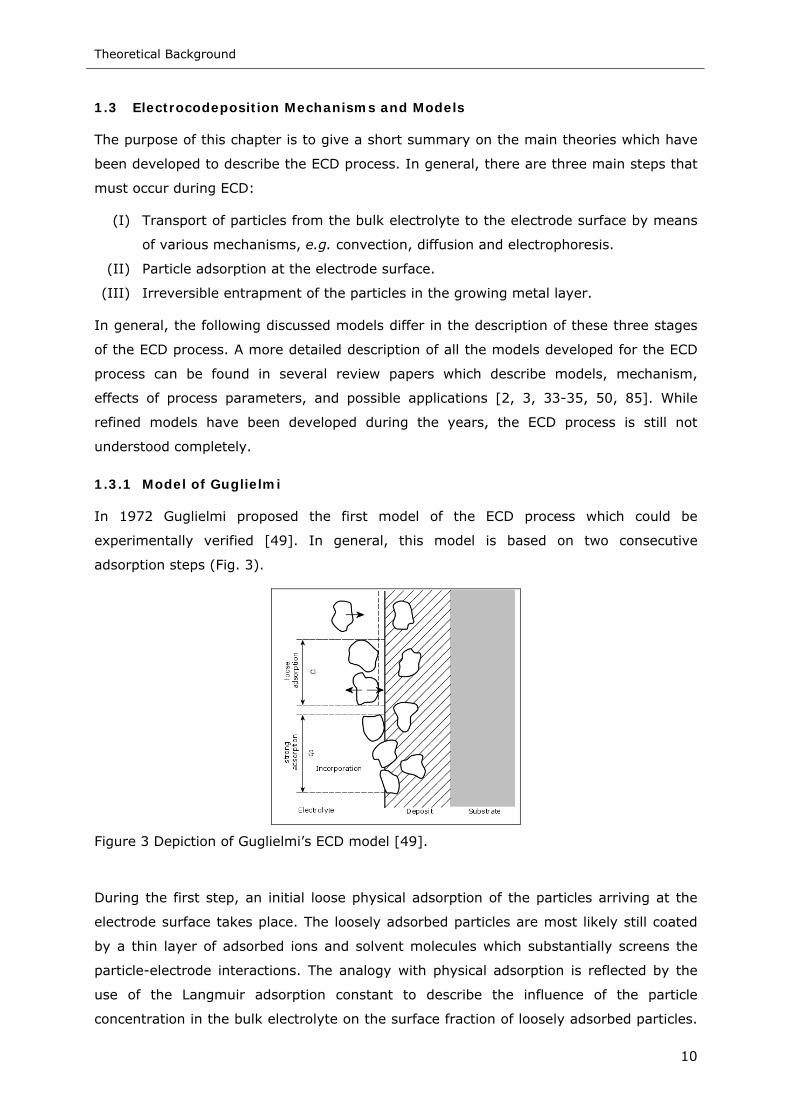
1.3.1 Model of Guglielmi
In 1972 Guglielmi proposed the first model of the ECD process which could be
experimentally verified [49]. In general, this model is based on two consecutive
adsorption steps (Fig. 3).
Figure 3 Depiction of Guglielmi’s ECD model [49].
During the first step, an initial loose physical adsorption of the particles arriving at the
electrode surface takes place. The loosely adsorbed particles are most likely still coated
by a thin layer of adsorbed ions and solvent molecules which substantially screens the
particle-electrode interactions. The analogy with physical adsorption is reflected by the
use of the Langmuir adsorption constant to describe the influence of the particle
concentration in the bulk electrolyte on the surface fraction of loosely adsorbed particles.
Theoretical Background
11
In the second step which is thought to be field-assisted and electrochemical in nature,
the particles become strongly adsorbed onto the electrode due to the applied electrical
field. Finally, the strongly adsorbed particles are incorporated in the growing metal
matrix.
According to Guglielmi, the volume fraction of incorporated particles, α, is given by
bp
bpAB
m
m
ckck
eiMVFz
,
,)(
0
0
11 +⋅⋅=
−− ηρ
αα
(1)
where F is Faraday’s constant, ρm and Mm are the density and molecular mass of the
deposited metal, respectively, cp,b is the particle concentration in the bulk electrolyte, i0 is
the exchange current density, and A is the Tafel constant for the metal reduction
reaction. The constants V0, B and k depend on the particular particle-metal system and
have to be determined from ECD experimental data. Guglielmi’s model was successfully
applied to several ECD systems [49, 112, 113]. However, the model’s success is most
probably related to the adjustable constants (V0, B, k), since important process
parameters such as hydrodynamics, particle type, size and size distribution, pH and
composition of the electrolyte are not explicitly considered in this model.
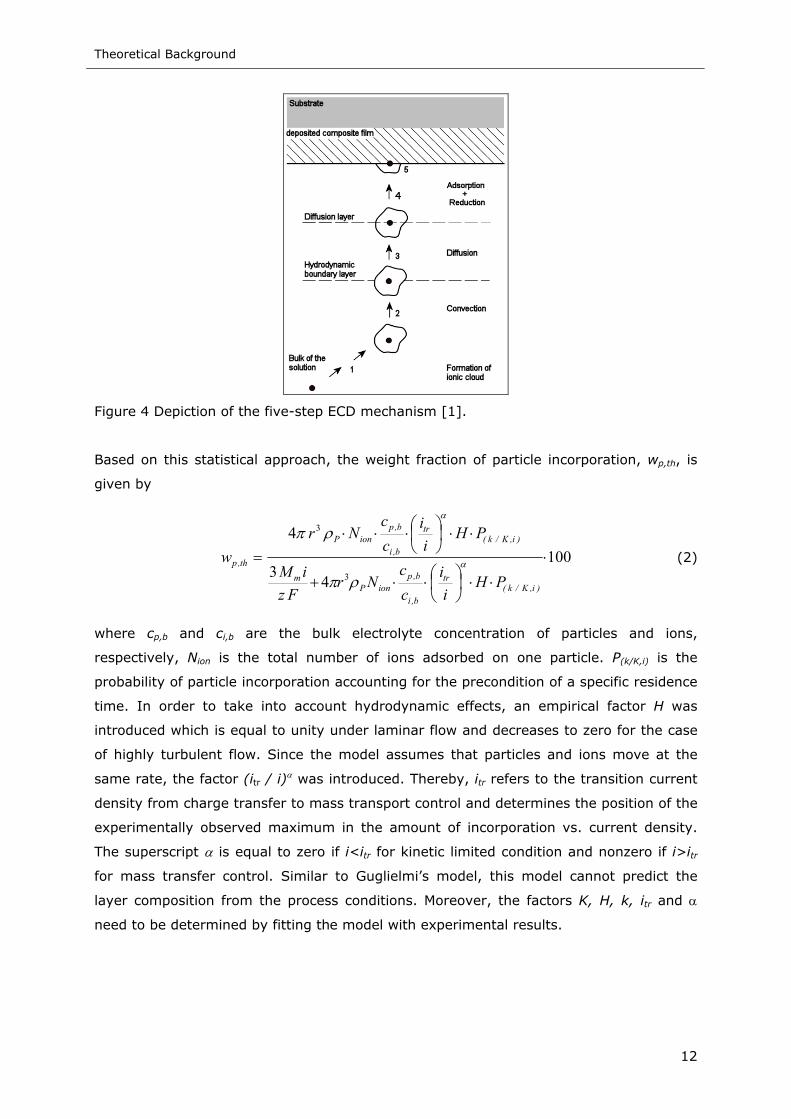
1.3.2 Model of Celis et al.
Another model was presented by Celis et al. in 1987 who attempted to predict the
amount of particle codeposition for a given particle-metal combination by analyzing the
particle transfer from the bulk electrolyte to the electrode surface [1]. They proposed a
five-step process for the codeposition of particles with metals, which is schematically
depicted in Fig. 4. In the first step, the particles in the bulk electrolyte adsorb ions from
the electrolyte inducing the formation of an ionic cloud around each particle. In the
second step, the particles are transported by means of convection to the hydrodynamic
boundary layer. Thence, in the third step, the particles diffuse through the diffusion
boundary layer to the electrode surface. Similar to the model of Guglielmi (section 1.3.1)
the particles are incorporated in the growing metal film in two consecutive steps. In the
fourth step, the particles surrounded by the ionic cloud are adsorbed onto the electrode.
The last step is dedicated to the incorporation of the particles in the metal matrix.
A successful incorporation can be achieved when a specific quantity, k, of the total
quantity of the ions adsorbed on the particle, K, are reduced at the electrode surface.
Hence, a certain residence time of a particle at the electrode surface is a precondition for
the entrapment. The implementation of a specific residence time is in marked contrast to
the basic assumptions of Guglielmi’s model which implies that all particles transported to
the electrode surface become incorporated.
Theoretical Background
12
Figure 4 Depiction of the five-step ECD mechanism [1].
Based on this statistical approach, the weight fraction of particle incorporation, wp,th, is
given by
10043
4
3
3
⋅
⋅⋅⎟⎠⎞
⎜⎝⎛⋅⋅+
⋅⋅⎟⎠⎞
⎜⎝⎛⋅⋅⋅
=
)i,K/k(tr
b,i
b,pionP
m
)i,K/k(tr
b,i
b,pionP
th,p
PHii
cc
NrFz
iM
PHii
cc
Nrw α
α
ρπ
ρπ (2)
where cp,b and ci,b are the bulk electrolyte concentration of particles and ions,
respectively, Nion is the total number of ions adsorbed on one particle. P(k/K,i) is the
probability of particle incorporation accounting for the precondition of a specific residence
time. In order to take into account hydrodynamic effects, an empirical factor H was
introduced which is equal to unity under laminar flow and decreases to zero for the case
of highly turbulent flow. Since the model assumes that particles and ions move at the
same rate, the factor (itr / i)α was introduced. Thereby, itr refers to the transition current
density from charge transfer to mass transport control and determines the position of the
experimentally observed maximum in the amount of incorporation vs. current density.
The superscript α is equal to zero if i<itr for kinetic limited condition and nonzero if i>itr
for mass transfer control. Similar to Guglielmi’s model, this model cannot predict the
layer composition from the process conditions. Moreover, the factors K, H, k, itr and α
need to be determined by fitting the model with experimental results.
Theoretical Background
13
1.3.3 Trajectory Model of Fransaer et al.
The two models described so far have been developed for the ECD of Brownian particles,
i.e. particles with a diameter below 1 µm. Since most industrial processes have utilized
much bigger particles, Fransaer et al. developed a particle trajectory model to describe
the codeposition of non-Brownian particles on a rotating disk electrode [55]. The model
was based on a complete analysis of all forces and torques acting on the particle in
suspension. This includes the forces due to fluid convection and particle motion as well as
the external forces acting on the particle such as gravitational, electrophoretic, and
double layer forces. The particle transport to the electrode was found to be mainly
governed by convection and by the dispersion force, while the impact of the double layer
force as well as electrophoresis can be neglected. The particle volume flux to the
electrode can be determined by calculating the limiting particle trajectory which implies a
separation of the particle trajectory of particles reaching the electrode from those passing
by. However, this model fails close to the electrode surface because it leads to the
“perfect sink” condition, which implies that all particles approaching within a certain
critical distance of the electrode surface become irreversibly and instantaneously
incorporated in the metal matrix. Hence, the authors implemented the particle-electrode
interaction term, introducing a new equation for the probability of particle incorporation.
The probability that a particle that is brought in contact with the electrode co-deposits,
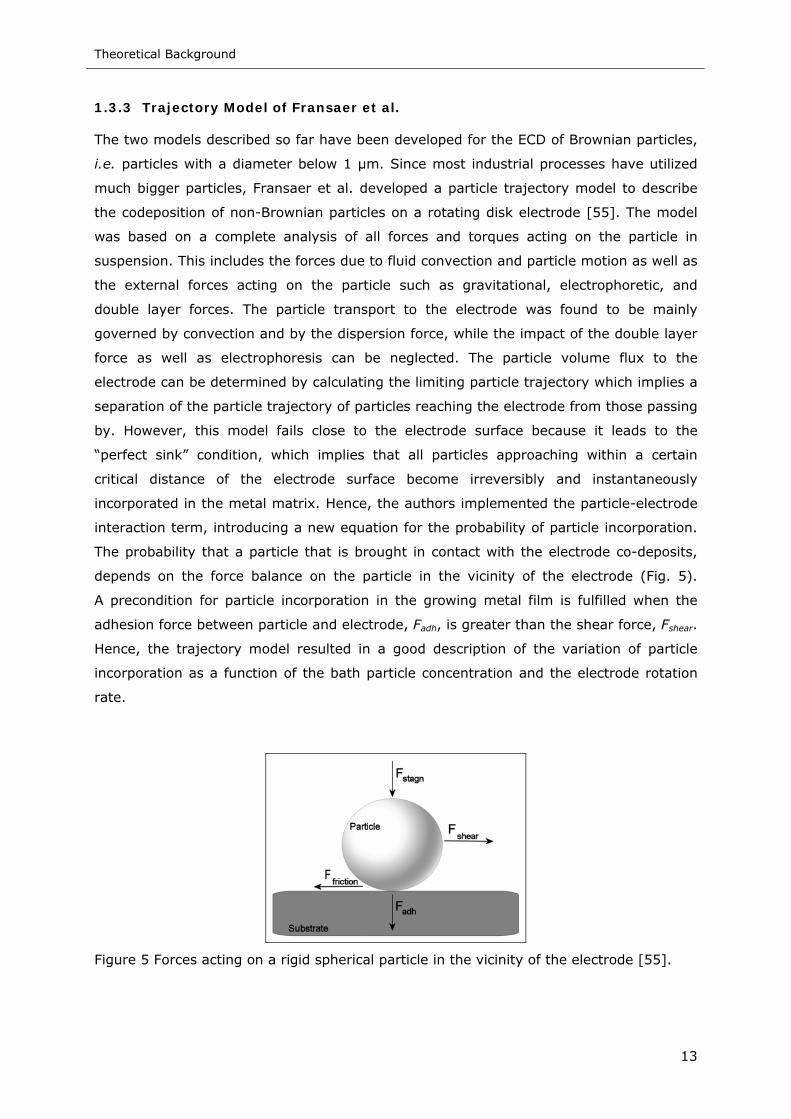
depends on the force balance on the particle in the vicinity of the electrode (Fig. 5).
A precondition for particle incorporation in the growing metal film is fulfilled when the
adhesion force between particle and electrode, Fadh, is greater than the shear force, Fshear.
Hence, the trajectory model resulted in a good description of the variation of particle
incorporation as a function of the bath particle concentration and the electrode rotation
rate.
Figure 5 Forces acting on a rigid spherical particle in the vicinity of the electrode [55].
Theoretical Background
14
In order to describe the maximum in the amount of particle incorporation versus current
density, the structural or hydration force between particle and electrode was introduced.
This force, which is strongly repulsive at short distances, is due to the ordering of solvent
molecules in concentrated electrolytes. The impact of the hydration force was expected
to be highly dependent on the electrode potential and therefore on the applied current
density. Hence, it was assumed that the maximum in the amount of particle
incorporation versus current density curve could be caused by changes in the ordering of
water dipoles at the electrode surface.
From all models discussed so far, the trajectory model possesses the uniqueness that it
does not contain any adjustable parameter. However, the model has also its
shortcomings, since it does not predict a maximum particle concentration with respect to
current density. Additionally, it is not applicable to nanosized particles where Brownian
motion is expected to dominate the particle motion.
1.3.4 Kinetic Model of Vereecken et al.
A model was presented by Vereecken et al. [51, 114] that took into account the kinetics
and residence time of nanoparticles at the electrode surface. Therefore, they analyzed
the nanoparticle flux during ECD via the forces acting on a single particle. Using a
rotating disk electrode a kinetic model was achieved to describe the codeposition of
50 nm as well as 300 nm Al2O3 nanoparticles with nickel from a sulfamate electrolyte.
This model took into account the convective diffusion of particles to the electrode surface
and the effect of particle gravitational force on the particle flux. It was found in
experiments that gravity would have as much as 40% effect on the incorporation of
300 nm particles. However, gravity had a negligible influence on the codeposition of
50 nm particles.
From Fick’s first law and the Nernst diffusion layer model, the number of co-deposited
particles per unit volume in the metallic matrix, dp, was found to be
pp
pMm
p nrg
DiV
Fzd ⋅⎟⎟⎠
⎞⎜⎜⎝
⎛−⋅= −
ηρ
ωυ9
62.02
2/16/13/2
,
(3)
where np is the particle density in the electrolyte, υ is the kinematic viscosity of the
electrolyte, Vm,M is the molar volume of the metal film, r is the particle radius, ω is the
rotational speed of the electrode, η is the viscosity of the solution, Dp is the diffusion
coefficient of the particle in the solution, ρp is the density of the particle, and g is the
acceleration due to gravity. The model only applies for diffusion limited depositions on a
rotating disk electrode (RDE).
Theoretical Background
15
1.3.5 Model of Lee and Talbot
Recently, Lee and Talbot [115] developed a model to describe the experimental results
from the ECD of alumina nanoparticles with copper using a rotating cylinder electrode
(RCE) adapting the models of Celis et al. (section 1.3.2) [1] and Vereecken et al. (section
1.3.4) [51, 114]. In this model the basic approach of Vereecken et al. [51, 114] was
modified by replacing the transport parameters of the RDE by those of the RCE system.
Moreover, the dependency of the flux of particles to the electrode on the current density
was described by the concepts presented by Celis et al. [1], i.e. a distinction between
charge transfer and mass transfer control was implemented. Finally, this model can be
used to predict the amount of particle incorporation in the kinetically as well as in the
mass transfer limited region of the ECD. Nevertheless, a few experimental data points
are essentially to quantify the value of certain fitting parameters.
1.3.6 Summary
The work done over the last two decades has led to an improved understanding of the
macroscopic effects of important process variables such as particle size, particle type,
current density, hydrodynamics, electrolyte composition, etc. However, there is still a
lack of fundamental understanding of the entrapment mechanism. The models proposed
so far are still unable to predict the process conditions necessary to achieve a given film
composition for a given system without an initial set of experiments to find the empirical
fitting parameters used in the model.
Theoretical Background
16
1.4 Process Variables
Based on recent research on ECD, the important process parameters that influence the
composition of the deposit have been identified as, but are certainly not limited to, the
electrode orientation, hydrodynamics, particle characteristics such as size, shape and
type, current density and current modulation, composition, temperature and pH of the
electrolyte, and the particle loading of the electrolyte [2, 3, 33, 50, 52-54, 77, 78, 116,
117]. The influence of a particular variable on the ECD process is typically assessed by
the change in the amount of particle incorporation obtained when that parameter is
varied. It has to be emphasized that the effects of certain process parameters, which are
often interrelated, may vary for different particle-metal combinations [2, 3, 116, 117].
The following section describes the effects of selected process parameters on the ECD
process.
1.4.1 Electrochemical Cell Configuration and Electrode Orientation
In general, there are three main cell geometries that have been used to produce MMNC,
i.e. the parallel plate electrode (PPE), the rotating disk electrode (RDE) and the rotating
cylinder electrode (RCE). Most studies on ECD employ a PPE configuration for reasons of
simplicity [2, 50]. However, due to the various ways of agitating the suspension, an
analysis and comparison of hydrodynamics is rather difficult with this configuration.
Another disadvantage of the PPE design is that the hydrodynamic and concentration
boundary layer thickness are not constant over the electrode surfaces, especially at the
electrode edges. This results in a variation of the concentration of reactants yielding a
possibly non-uniform film composition. A better control of the hydrodynamic conditions
can be achieved using a RCE [58-60] or RDE [21, 32, 60]. A detailed description of the
flow field around these electrodes can be found in Refs. [102, 118, 119]. Disadvantages
of the RDE configuration include a variation of mass transfer and current distribution as a
function of the radial position, except at limiting current density, and of shear [102]. The
benefit of the RDE is that it operates predominantly under laminar flow conditions. In
contrast, the RCE system is characterized by a constant shear rate and a uniform current
density distribution along the cylindrical electrode surface. However, the main
disadvantage of an RCE is that the flow becomes turbulent even for low rotational rates
[118]. In addition, both the RCE and RDE configurations are not typically a viable
industrial method because of their limitation of specific electrode shapes.
Nowadays, the impinging jet electrode (IJE) system becomes more and more important
due to its favorable advantages, viz. selective [62] and high-speed plating [63]. IJEs are
particularly promising since plating rates can be up to 10 times faster compared to
conventional systems [64]. Furthermore, jet plating is an attractive method to
electrodeposit gradient coatings while controlling the volume fraction of particles by
Theoretical Background
17
changing the jet velocity [64]. As long as the nozzle is placed close to the substrate, the
electrodeposition is hydrodynamically limited to an area proportional to the width of the
nozzle [120]. Hence, an IJE can be used to control hydrodynamics during deposition and
increase the mass transfer [121]. Nevertheless, there are also several disadvantages of
the IJE system particularly with regard to the ECD process. Due to the variety of
permutations of the IJE cell geometry and orientation (i.e. nozzle size and shape,
submerged/unsubmerged jet, angle of contact between fluid jet and electrode, etc.)
obviously fewer hydrodynamic and mass transfer correlations are available for a
particular IJE configuration compared to the RDE and RCE setup. First of all, it is
important to distinguish between submerged and unsubmerged jet systems. In the case
of a submerged IJE, the nozzle is placed inside the electrolyte with no air gap between
the nozzle and the substrate. On the other hand, in an unsubmerged system the nozzle
is placed so that there is an air gap between nozzle and substrate [122]. The main
benefit of the unsubmerged system is to avoid the entrainment of the bulk fluid found in
the submerged configuration which is particularly important for ECD to enable nearly
homogenous particle entrainment in the fluid jet [122].
1.4.2 Hydrodynamics, Magneto-hydrodynamics
The previous section was partially related to the subject hydrodynamics. However, the
main focus was directed to the experimental setup of the plating apparatus. The present
section is targeted on a more detailed discussion how the hydrodynamic conditions can
affect the particle transport to the electrode and the process of particle incorporation.
Electrolyte agitation is generally necessary in ECD to maintain the particles in suspension
and to transport the particles to the electrode surface [2]. Hydrodynamics is an
important factor since it controls the rate, direction and force with which the particles
arrive at the electrode. Increased agitation has been found to increase particle
incorporation by keeping the particles suspended in the electrolyte and improving the
particle transport to the electrode [2, 95]. On the other hand, increased agitation also
decreases the residence time of a particle at the electrode and increases shear which
may sweep away loosely adsorbed particles [55, 60]. Hence, the particle-electrode
contact is a necessary (section 1.3) but not at all a sufficient condition for particle
incorporation [55]. Because of these competing tendencies, many ECD systems show
maxima in particle incorporation [33]. Moreover, hydrodynamics can also affect the
limiting current density of the metal deposition by altering the thickness of the diffusion
layer [102].
The effect of the three hydrodynamic flow regimes, i.e. laminar, transitional and
turbulent flow, on the particle incorporation was shown using a RDE system [123]. In the
laminar flow regime, incorporation was found to remain constant regardless of the
Theoretical Background
18
rotational speed. Transitional flow was characterized by a steady decrease in
incorporation followed by a small peak at the transition to turbulent flow. In the turbulent
flow regime, further increases in rotational speed only decreased incorporation [123].
The influence of shear and centrifugal force on ECD was evaluated by comparing
experimental results of a RCE and RDE system under equivalent flow conditions [60].
It has been observed, that while shear may be the main cause of particle detachment,
centrifugal force may influence incorporation by determining whether detached particles
are transported away from the electrode. The impact of the centrifugal force increases
with increasing difference in specific weight of the particles and electrolyte [60].
Furthermore, the presence of a static magnetic field during the codeposition process has
been shown to have an impact on the composition and structure of the plated magnetic
composites [124]. A static magnetic field can affect the ECD of magnetic nanoparticles
with Ni in two different ways. On the one hand it influences the rate of mass transport
via the magnetohydrodynamic (MHD) effect [125, 126]. The MHD effect, which is mainly
caused by the Lorentz force fL, induces fluid motion and thus can enhance the mass
transport [125-127].
Bjf xL = (4)
Furthermore, the magnetic nanoparticles will move in the plating electrolyte towards
regions with higher magnetic flux density, due to the magnetophoretic force (Eq. 5)
[128].
BBf )(0
mp ∇⋅∆
=µχ
(5)
In the above equations j is the current density, B is the magnetic flux density (bold faces
symbolize vector quantities), χ the magnetic susceptibility of the particles and µ0 the
magnetic permeability of free space. Notice that fL acts on fluid elements whereas fmp
acts on the particles themselves. An increased incorporation of magnetic particles is
expected if the working electrode is located normal to the trajectories of the particles.
1.4.3 Bath Properties
Many properties of the bath have been found to influence ECD, including particle
characteristics and loading in solution, electrolyte composition and concentration, pH,
particle-electrolyte interactions, additives, and temperature [2, 3, 21, 33, 129]. These
effects will be discussed in more detail in the two following sections.
Theoretical Background
19
1.4.3.1 Electrolyte Composition
The electrolyte is composed of the metal cation undergoing cathodic deposition, its
counter ion, additives, and either hydroxide ions or hydronium ions, depending on the
working pH of the bath [130, 131]. The two key functions of the electrolyte are to furnish
the ions that are reduced at the cathode and to minimize ohmic resistance across the cell
[130, 131]. A variety of electrolytes have been used for the ECD process to deposit a
metal matrix of Au, Ag, Co, Cu, Fe, Ni, or Cr, or their respective alloys [2]. Electrolytic
deposition of a nickel matrix is typically performed using a Watts' bath which consists of
nickel sulfate, nickel chloride and boric acid, and plating baths based on nickel acetate,
fluoroborate or sulfamate [83, 132]. Nickel films deposited from the sulfamate bath
feature low contents of sulphur and carbon incorporation combined with improved
mechanical properties such as low tensile stress and increased hardness [132, 133].
As mentioned in section 1.3.2, some models for ECD assume that the particles are
incorporated when a certain fraction of the metal ions adsorbed on the particle surface
are reduced. Since adsorption processes are usually described by equations similar to the
Langmuir isotherm, the adsorption of metal ions on the particle surface also depends on
their bulk concentration in the electrolyte [134]. However, once the particle surface
becomes saturated with ions, increasing the bulk ion concentration further should neither
influence the concentration of adsorbed metal ions nor the ECD process. Furthermore,
the adsorption of reactive metal ions onto the particle surface is not a necessary
precondition for incorporation, as hydrophobic particles such as polystyrene [21] as well
as negatively charged particles (due to the adsorption of other bath constituents such as
citrate and pyrophosphate anions) [16, 17] are readily incorporated in a Cu or Ni matrix.
The electrolyte pH is important in determining overall amounts of incorporation [16, 17,
57] by affecting the particle surface charge (section 1.2). An increase in incorporation of
diamond and alumina nanoparticles was found with increasing pH [16, 17, 57]. While
there is no final explanation for this behavior, a tentative electrostatic model was
proposed to explain qualitatively the relation between the surface charge of the particles
and the amount of incorporated particles [16, 17, 57].
1.4.3.2 Particle Characteristics
Particles influence the ECD process via chemical composition, crystallographic phase,
size, density, hydrophobicity, and concentration in the plating electrolyte [2, 3, 21, 33,
129]. Particle composition is extremely important in determining the overall amount of
particle incorporation [2]. For example, approximately three times more TiO2 than Al2O3
have been incorporated into nickel under the same deposition conditions [2]. In
particular, hydrophobic particles such as polystyrene (PS) and SiC typically incorporate
more readily than hydrophilic particles such as metal oxides [129, 135]. The forces
Theoretical Background
20
between either PS or SiO2 particles and the surface of a copper electrode before, during,
and after electrocodeposition have been examined using an atomic force microscope
[135]. The improved incorporation of hydrophobic particles was found to be due to
attractive hydrophobic and van der Waals interactions between the PS particles and the
copper electrode [135]. In contrast, the hydrophilic SiO2 particles were found to be
separated from the electrode by a thin film of electrolyte due to the repulsive hydration
force [135]. ECD is influenced not only by the composition of the particles, but also by
their crystallographic phase. While one phase may readily incorporate into the metal
matrix, another phase with the same chemical composition may only incorporate to a
small extent or not at all [2]. Typically, ECD was studied using particle concentration in
the electrolyte between 1 and 200 g l-1 [2]. In most cases, increasing particle loading
resulted in an increase in particle incorporation [2]. However, particularly at higher
loadings, the increase in incorporation is not proportional to the increase in loading [2].
1.4.4 Current Density and Current Modulation
Current density has an important, but poorly understood, effect on the ECD process [2,
3]. Particle incorporation was found to decrease with increasing current density and then
levels off for the systems Ni-diamond and Ni-Cr [136-139]; but also an additional effect
at lower current densities was observed, where an increase of current density increases
particle incorporation for the systems Ni-TiO2, Cu-Al2O3, Cr-Al2O3 and Co-SiC [1, 2, 58,
81, 95, 140]. An important observation is that the maximum in particle incorporation
depends considerably on both, the current density and the hydrodynamics of the system
due to the effect of hydrodynamics on the current-potential relationship [58, 95, 131].
Interactions between hydrodynamics and current density on the ECD process can be
accounted by normalizing the current density with the limiting current density [58, 95,
138].
A variety of galvanostatic techniques have been utilized for ECD investigations, including
direct current (DC), pulsed plating (PP) and pulsed reverse plating (PRP) [3]. Both, PP
[54, 74-76] and PRP [26, 77] were found to improve particle incorporation and MMNC
film properties. Using PRP, the maximum incorporation of alumina particles in a Cu
matrix was found when the deposit thickness plated per cycle approaches the particle
diameter [77]. In the case of Ni-Al2O3 composites, PP had led to an incorporation of
smaller and less agglomerated nanoparticles [79, 80].
Theoretical Background
21
1.5 Structure and Properties of Metal Matrix Nanocomposites
The effects of particle incorporation on the microstructure and physical properties of
MMNC films have been extensively discussed in the literature. Several studies have found
an obvious increase in hardness compared to the pure nickel film due to the
reinforcement with various particles such as TiO2, Al2O3, and SiC. The properties of
MMNCs mainly depend on their composition and structure [11]. Uniform distribution and
high amounts of incorporated particles within the metal matrix were found to be crucial
to improve the film properties [16, 67]. In many cases the enhanced performance of the
composite film is mainly caused by a change in the growth mode or grain size of the
metal matrix and not so much by the presence of the particles themselves [16, 30].
In general, there are two common mechanism of grain refinement of metal films. The
first method is the particle incorporation in a electrodeposit [3, 15, 76]. In this regard,
grain boundary pinning is generally agreed upon in the literature as the mechanism of
grain refinement [76, 129]. Even though the particles are not coherent with the metal
matrix, they inhibit the movement of dislocations due to the physical interaction between
the particle reinforcement and the dislocations. With small impenetrable particles, a
passing dislocation will bow between particles and finally pass by leaving behind an so-
called Orowan loop [141]. By increasing the density and length of dislocations, the
presence of these small particles tends to improve the mechanical properties of the
material sustainable [141]. On the other hand, pulse plating can be used for further grain
refinement [69]. Enhanced mass transfer during PP can be attributed to the grain
refinement due to creation of nucleation sites at the beginning of each cycle [69].
While mechanical properties and corrosion resistance of composite properties can be
greatly enhanced [142] some material properties, e.g. magnetism and electrical
resistance, are sacrificed in the MMNC film [16, 80].
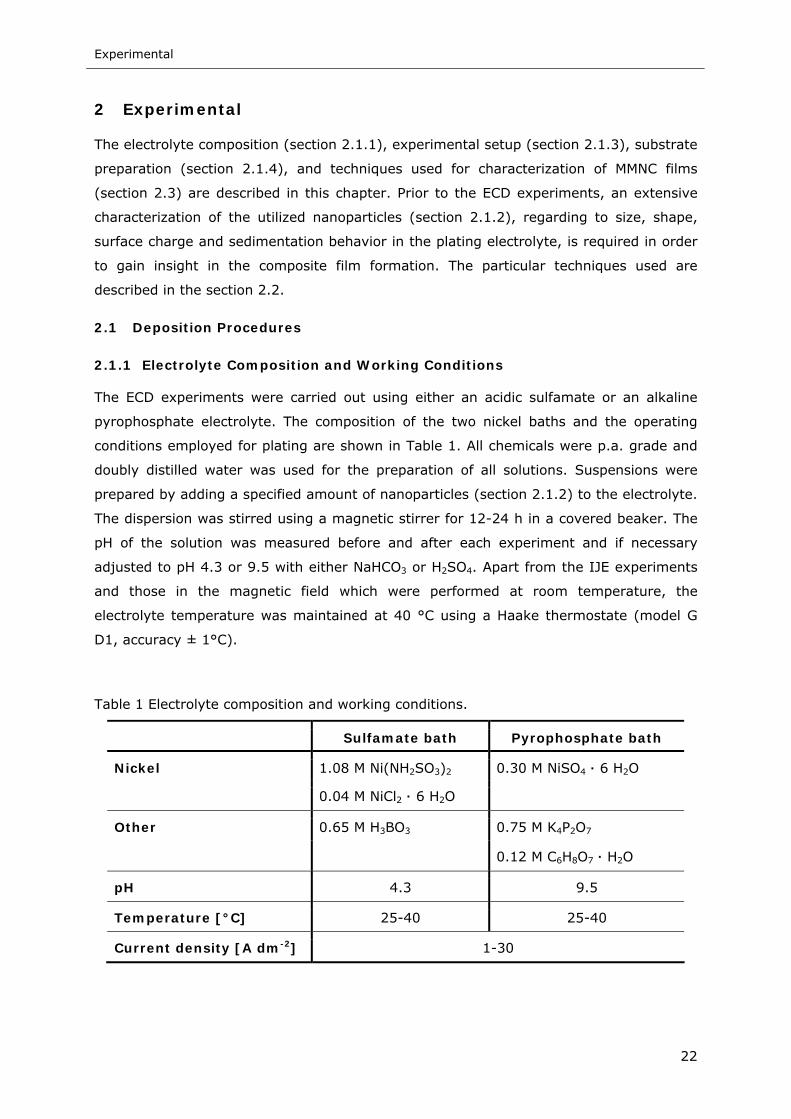
Experimental
22
2 Experimental
The electrolyte composition (section 2.1.1), experimental setup (section 2.1.3), substrate
preparation (section 2.1.4), and techniques used for characterization of MMNC films
(section 2.3) are described in this chapter. Prior to the ECD experiments, an extensive
characterization of the utilized nanoparticles (section 2.1.2), regarding to size, shape,
surface charge and sedimentation behavior in the plating electrolyte, is required in order
to gain insight in the composite film formation. The particular techniques used are
described in the section 2.2.
2.1 Deposition Procedures
2.1.1 Electrolyte Composition and Working Conditions
The ECD experiments were carried out using either an acidic sulfamate or an alkaline
pyrophosphate electrolyte. The composition of the two nickel baths and the operating
conditions employed for plating are shown in Table 1. All chemicals were p.a. grade and
doubly distilled water was used for the preparation of all solutions. Suspensions were
prepared by adding a specified amount of nanoparticles (section 2.1.2) to the electrolyte.
The dispersion was stirred using a magnetic stirrer for 12-24 h in a covered beaker. The
pH of the solution was measured before and after each experiment and if necessary
adjusted to pH 4.3 or 9.5 with either NaHCO3 or H2SO4. Apart from the IJE experiments
and those in the magnetic field which were performed at room temperature, the
electrolyte temperature was maintained at 40 °C using a Haake thermostate (model G
D1, accuracy ± 1°C).
Table 1 Electrolyte composition and working conditions.
Sulfamate bath Pyrophosphate bath
Nickel 1.08 M Ni(NH2SO3)2 0.30 M NiSO4 · 6 H2O
0.04 M NiCl2 · 6 H2O
Other 0.65 M H3BO3 0.75 M K4P2O7
0.12 M C6H8O7 · H2O
pH 4.3 9.5
Temperature [°C] 25-40 25-40
Current density [A dm-2] 1-30
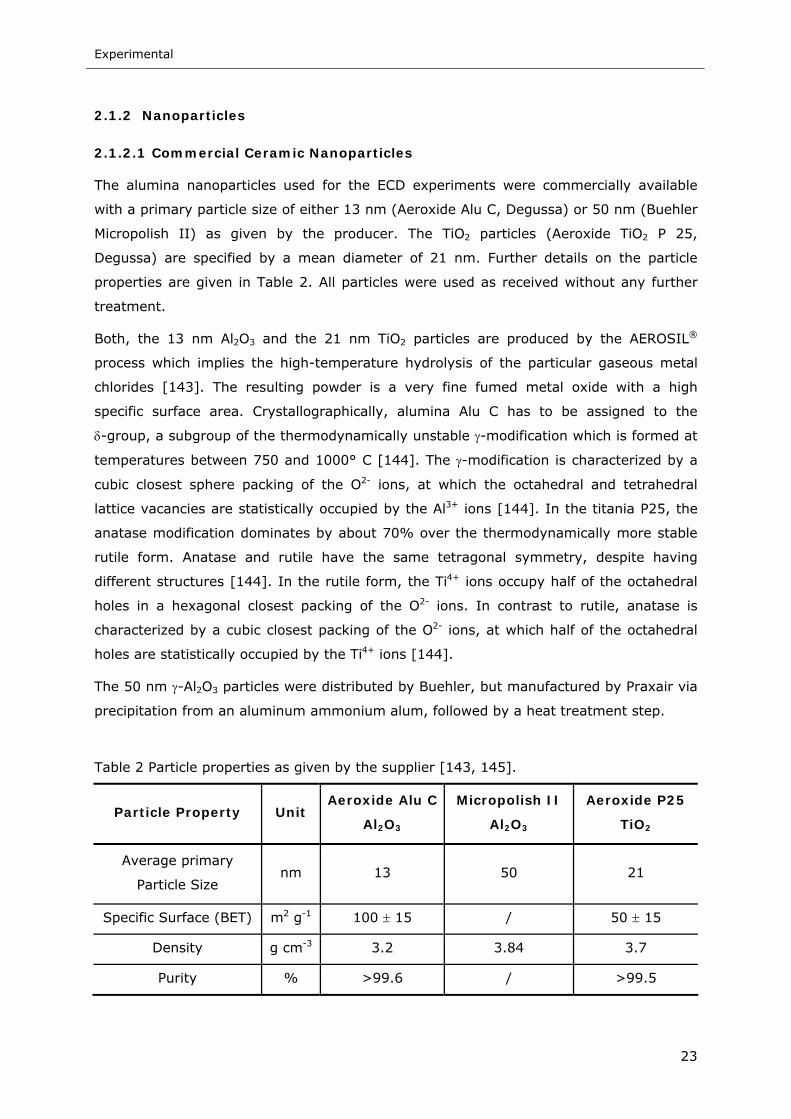
Experimental
23
2.1.2 Nanoparticles
2.1.2.1 Commercial Ceramic Nanoparticles
The alumina nanoparticles used for the ECD experiments were commercially available
with a primary particle size of either 13 nm (Aeroxide Alu C, Degussa) or 50 nm (Buehler
Micropolish II) as given by the producer. The TiO2 particles (Aeroxide TiO2 P 25,
Degussa) are specified by a mean diameter of 21 nm. Further details on the particle
properties are given in Table 2. All particles were used as received without any further
treatment.
Both, the 13 nm Al2O3 and the 21 nm TiO2 particles are produced by the AEROSIL®
process which implies the high-temperature hydrolysis of the particular gaseous metal
chlorides [143]. The resulting powder is a very fine fumed metal oxide with a high
specific surface area. Crystallographically, alumina Alu C has to be assigned to the
δ-group, a subgroup of the thermodynamically unstable γ-modification which is formed at
temperatures between 750 and 1000° C [144]. The γ-modification is characterized by a
cubic closest sphere packing of the O2- ions, at which the octahedral and tetrahedral
lattice vacancies are statistically occupied by the Al3+ ions [144]. In the titania P25, the
anatase modification dominates by about 70% over the thermodynamically more stable
rutile form. Anatase and rutile have the same tetragonal symmetry, despite having
different structures [144]. In the rutile form, the Ti4+ ions occupy half of the octahedral
holes in a hexagonal closest packing of the O2- ions. In contrast to rutile, anatase is
characterized by a cubic closest packing of the O2- ions, at which half of the octahedral
holes are statistically occupied by the Ti4+ ions [144].
The 50 nm γ-Al2O3 particles were distributed by Buehler, but manufactured by Praxair via
precipitation from an aluminum ammonium alum, followed by a heat treatment step.
Table 2 Particle properties as given by the supplier [143, 145].
Particle Property Unit Aeroxide Alu C
Al2O3
Micropolish II
Al2O3
Aeroxide P25
TiO2
Average primary
Particle Size nm 13 50 21
Specific Surface (BET) m2 g-1 100 ± 15 / 50 ± 15
Density g cm-3 3.2 3.84 3.7
Purity % >99.6 / >99.5
Experimental
24
2.1.2.2 Synthesis of Magnetic Nanoparticles
Preparation of cobalt nanoparticles
The acicular Co nanoparticles in the shape of cubes and discs were synthesized by Dr.
Christian P. Gräf (Saarland University, Department of Engineering Physics) by thermal
decomposition of the precursor di-cobalt octa-carbonyl, Co2(CO)8. Due to their
anisometric shape they have a high magnetic hardness. A detailed description of the
synthesis route as well as an extensive characterization of those particles is given in Ref.
[146]. For further use the Co nanoparticles were washed several times with anhydrous
ethanol and hexane.
Preparation of magnetite nanoparticles
Magnetite (Fe3O4) particles were prepared by chemical precipitation from a ferric and
ferrous salt solution upon addition of NaOH according to the procedures described in
Refs. [147-151]. All chemicals (p.a. grade) were purchased from Fluka. In a typical
procedure, 2.35 g anhydrous FeCl3 and 1.43 g FeCl2 · 4H2O were mixed in 40 ml doubly
distilled deoxygenated water, yielding the required molar ratio of 2:1 for Fe3+ and Fe2+.
The resulting pH-value was about 1.2. This mixture was filled in a two necked flask,
equipped with a reflux-cooler and a septum. The deoxygenation was achieved by
bubbling nitrogen through the respective solutions for at least 30 minutes. Under
continued nitrogen bubbling, the mixture was heated to 80°C. While vigorously stirring
the reaction mixture, 50 ml of 1.5 M deoxygenated NaOH was quickly injected through
the septum, which caused an increase of the pH-value to 11. The solution immediately
turned black. After 30 minutes continued heating, 1 g of citric acid dissolved in 2 ml of
1.5 M NaOH was introduced. The pH decreased to 10.3 and another 4 ml of 1.5 M NaOH
were added to reach pH 11 again. After that, the temperature was increased to 95°C,
and stirring continued for another 90 minutes. After cooling the reaction solution to room
temperature, the particles were magnetically sedimented using a permanent magnet,
washed with water and re-suspended by sonication. This cleaning step was repeated two
times.
Direct images of the synthesized cobalt and magnetite nanoparticles were obtained by
transmission electron microscopy (TEM) using a JEOL JEM-2010 microscope at an
acceleration voltage of 200 kV in the bright field image mode. Samples for TEM imaging
were prepared by evaporating a drop of the highly diluted dispersion on a carbon-coated
copper grid.
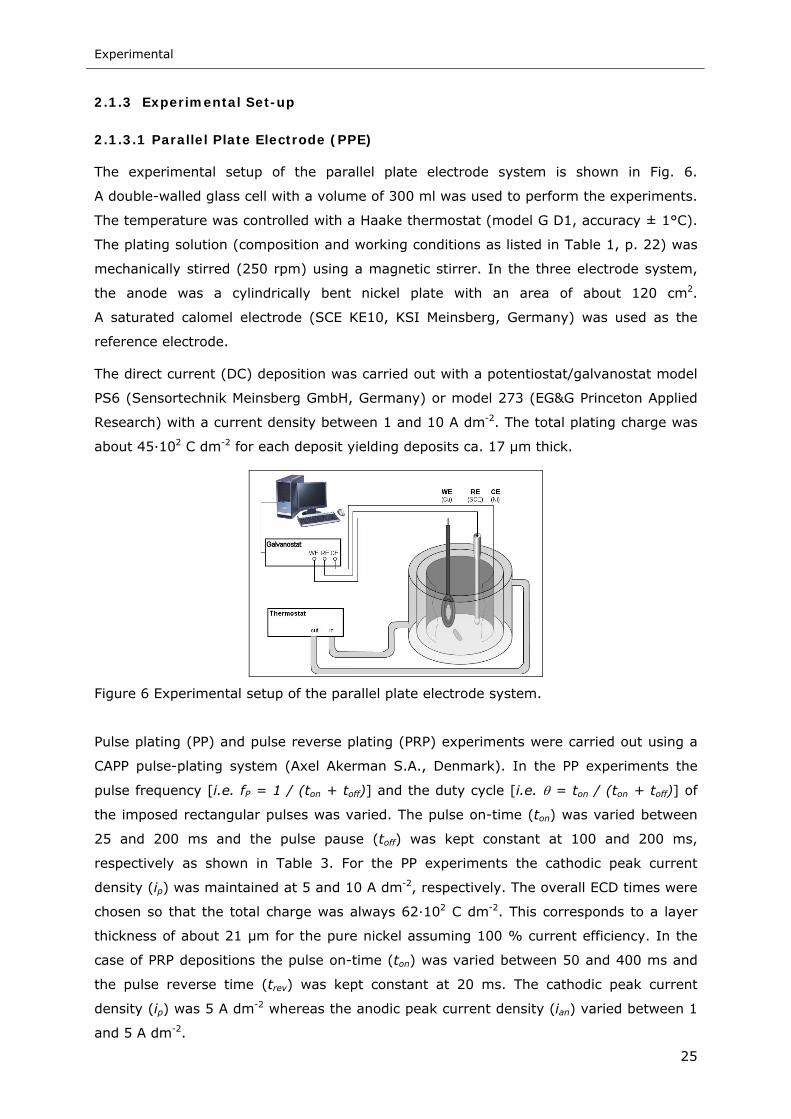
Experimental
25
2.1.3 Experimental Set-up
2.1.3.1 Parallel Plate Electrode (PPE)
The experimental setup of the parallel plate electrode system is shown in Fig. 6.
A double-walled glass cell with a volume of 300 ml was used to perform the experiments.
The temperature was controlled with a Haake thermostat (model G D1, accuracy ± 1°C).
The plating solution (composition and working conditions as listed in Table 1, p. 22) was
mechanically stirred (250 rpm) using a magnetic stirrer. In the three electrode system,
the anode was a cylindrically bent nickel plate with an area of about 120 cm2.
A saturated calomel electrode (SCE KE10, KSI Meinsberg, Germany) was used as the
reference electrode.
The direct current (DC) deposition was carried out with a potentiostat/galvanostat model
PS6 (Sensortechnik Meinsberg GmbH, Germany) or model 273 (EG&G Princeton Applied
Research) with a current density between 1 and 10 A dm-2. The total plating charge was
about 45·102 C dm-2 for each deposit yielding deposits ca. 17 µm thick.
Figure 6 Experimental setup of the parallel plate electrode system.
Pulse plating (PP) and pulse reverse plating (PRP) experiments were carried out using a
CAPP pulse-plating system (Axel Akerman S.A., Denmark). In the PP experiments the
pulse frequency [i.e. fP = 1 / (ton + toff)] and the duty cycle [i.e. θ = ton / (ton + toff)] of
the imposed rectangular pulses was varied. The pulse on-time (ton) was varied between
25 and 200 ms and the pulse pause (toff) was kept constant at 100 and 200 ms,
respectively as shown in Table 3. For the PP experiments the cathodic peak current
density (ip) was maintained at 5 and 10 A dm-2, respectively. The overall ECD times were
chosen so that the total charge was always 62·102 C dm-2. This corresponds to a layer
thickness of about 21 µm for the pure nickel assuming 100 % current efficiency. In the
case of PRP depositions the pulse on-time (ton) was varied between 50 and 400 ms and
the pulse reverse time (trev) was kept constant at 20 ms. The cathodic peak current
density (ip) was 5 A dm-2 whereas the anodic peak current density (ian) varied between 1
and 5 A dm-2.
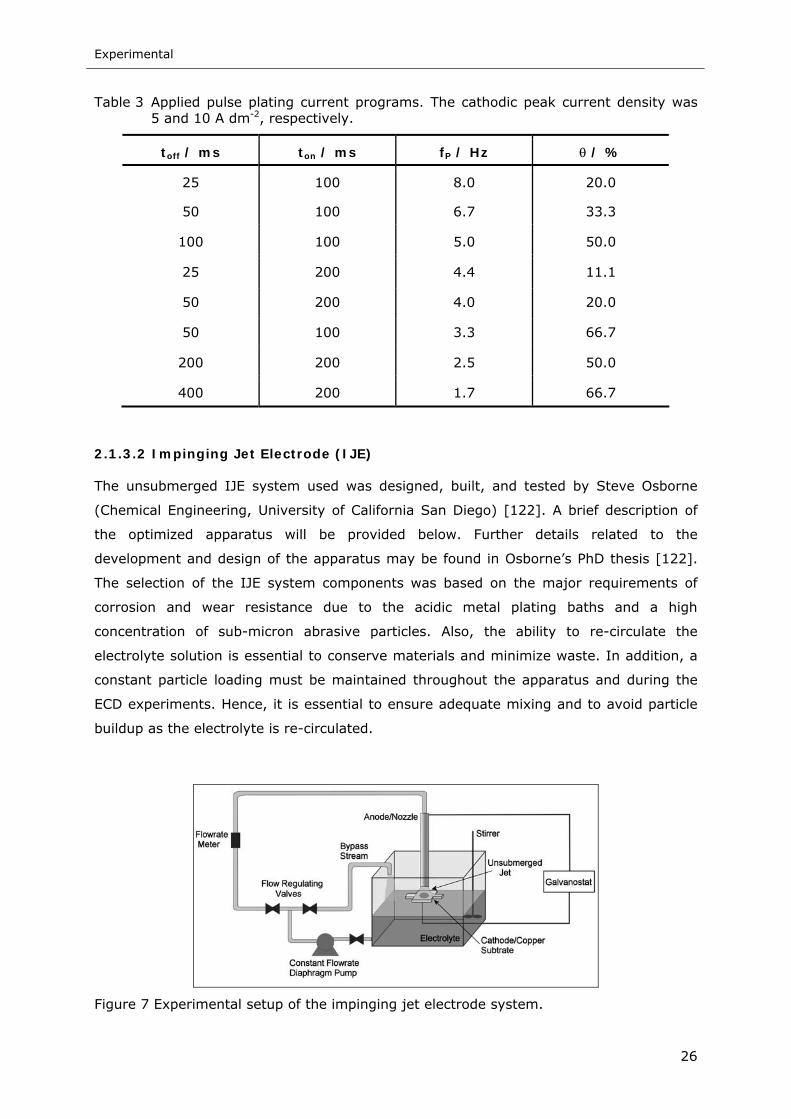
Experimental
26
Table 3 Applied pulse plating current programs. The cathodic peak current density was 5 and 10 A dm-2, respectively.
2.1.3.2 Impinging Jet Electrode (IJE)
The unsubmerged IJE system used was designed, built, and tested by Steve Osborne
(Chemical Engineering, University of California San Diego) [122]. A brief description of
the optimized apparatus will be provided below. Further details related to the
development and design of the apparatus may be found in Osborne’s PhD thesis [122].
The selection of the IJE system components was based on the major requirements of
corrosion and wear resistance due to the acidic metal plating baths and a high
concentration of sub-micron abrasive particles. Also, the ability to re-circulate the
electrolyte solution is essential to conserve materials and minimize waste. In addition, a
constant particle loading must be maintained throughout the apparatus and during the
ECD experiments. Hence, it is essential to ensure adequate mixing and to avoid particle
buildup as the electrolyte is re-circulated.
Figure 7 Experimental setup of the impinging jet electrode system.
toff / ms ton / ms fP / Hz θ / %
25 100 8.0 20.0
50 100 6.7 33.3
100 100 5.0 50.0
25 200 4.4 11.1
50 200 4.0 20.0
50 100 3.3 66.7
200 200 2.5 50.0
400 200 1.7 66.7
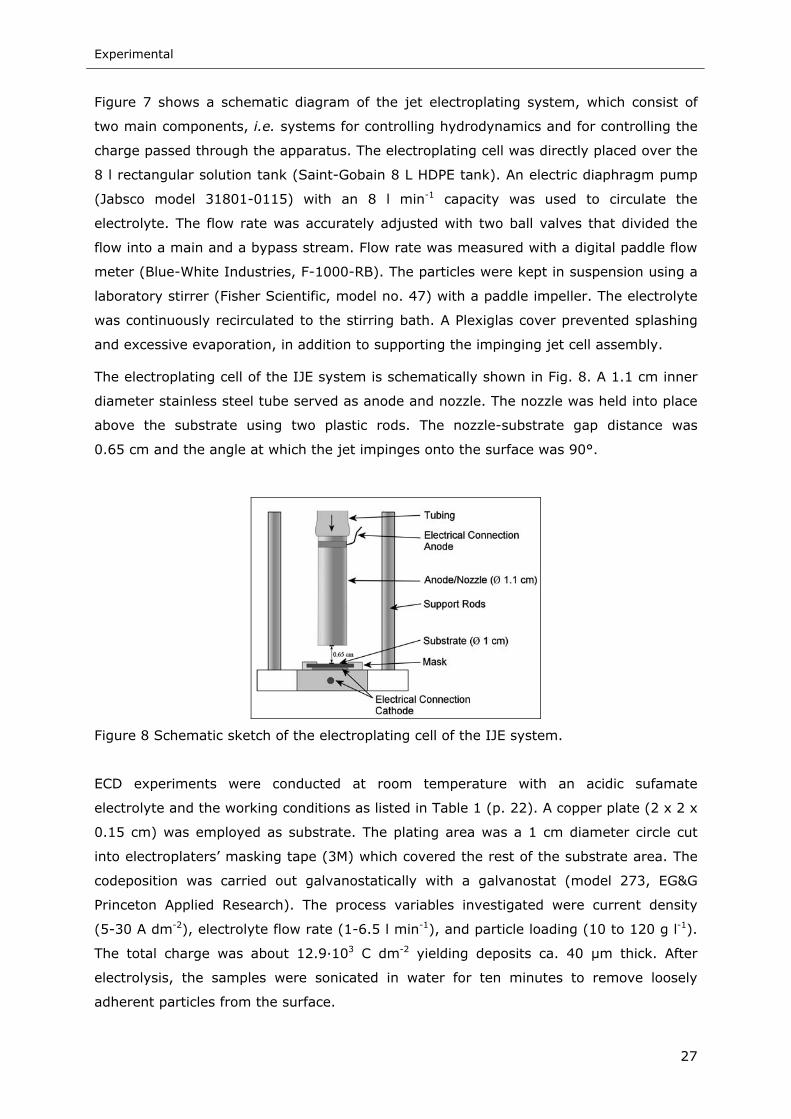
Experimental
27
Figure 7 shows a schematic diagram of the jet electroplating system, which consist of
two main components, i.e. systems for controlling hydrodynamics and for controlling the
charge passed through the apparatus. The electroplating cell was directly placed over the
8 l rectangular solution tank (Saint-Gobain 8 L HDPE tank). An electric diaphragm pump
(Jabsco model 31801-0115) with an 8 l min-1 capacity was used to circulate the
electrolyte. The flow rate was accurately adjusted with two ball valves that divided the
flow into a main and a bypass stream. Flow rate was measured with a digital paddle flow
meter (Blue-White Industries, F-1000-RB). The particles were kept in suspension using a
laboratory stirrer (Fisher Scientific, model no. 47) with a paddle impeller. The electrolyte
was continuously recirculated to the stirring bath. A Plexiglas cover prevented splashing
and excessive evaporation, in addition to supporting the impinging jet cell assembly.
The electroplating cell of the IJE system is schematically shown in Fig. 8. A 1.1 cm inner
diameter stainless steel tube served as anode and nozzle. The nozzle was held into place
above the substrate using two plastic rods. The nozzle-substrate gap distance was
0.65 cm and the angle at which the jet impinges onto the surface was 90°.
Figure 8 Schematic sketch of the electroplating cell of the IJE system.
ECD experiments were conducted at room temperature with an acidic sufamate
electrolyte and the working conditions as listed in Table 1 (p. 22). A copper plate (2 x 2 x
0.15 cm) was employed as substrate. The plating area was a 1 cm diameter circle cut
into electroplaters’ masking tape (3M) which covered the rest of the substrate area. The
codeposition was carried out galvanostatically with a galvanostat (model 273, EG&G
Princeton Applied Research). The process variables investigated were current density
(5-30 A dm-2), electrolyte flow rate (1-6.5 l min-1), and particle loading (10 to 120 g l-1).
The total charge was about 12.9·103 C dm-2 yielding deposits ca. 40 µm thick. After
electrolysis, the samples were sonicated in water for ten minutes to remove loosely
adherent particles from the surface.
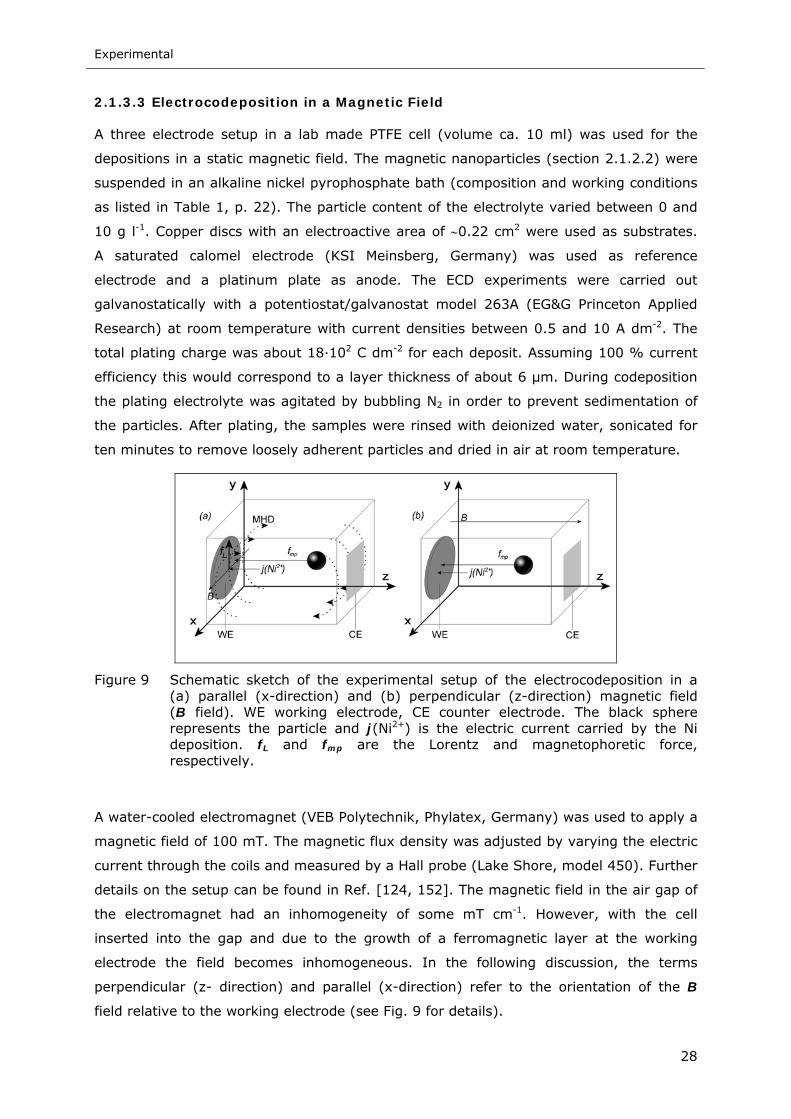
Experimental
28
2.1.3.3 Electrocodeposition in a Magnetic Field
A three electrode setup in a lab made PTFE cell (volume ca. 10 ml) was used for the
depositions in a static magnetic field. The magnetic nanoparticles (section 2.1.2.2) were
suspended in an alkaline nickel pyrophosphate bath (composition and working conditions
as listed in Table 1, p. 22). The particle content of the electrolyte varied between 0 and
10 g l-1. Copper discs with an electroactive area of ∼0.22 cm2 were used as substrates.
A saturated calomel electrode (KSI Meinsberg, Germany) was used as reference
electrode and a platinum plate as anode. The ECD experiments were carried out
galvanostatically with a potentiostat/galvanostat model 263A (EG&G Princeton Applied
Research) at room temperature with current densities between 0.5 and 10 A dm-2. The
total plating charge was about 18·102 C dm-2 for each deposit. Assuming 100 % current
efficiency this would correspond to a layer thickness of about 6 µm. During codeposition
the plating electrolyte was agitated by bubbling N2 in order to prevent sedimentation of
the particles. After plating, the samples were rinsed with deionized water, sonicated for
ten minutes to remove loosely adherent particles and dried in air at room temperature.
Figure 9 Schematic sketch of the experimental setup of the electrocodeposition in a (a) parallel (x-direction) and (b) perpendicular (z-direction) magnetic field (B field). WE working electrode, CE counter electrode. The black sphere represents the particle and j(Ni2+) is the electric current carried by the Ni deposition. fL and fmp are the Lorentz and magnetophoretic force, respectively.
A water-cooled electromagnet (VEB Polytechnik, Phylatex, Germany) was used to apply a
magnetic field of 100 mT. The magnetic flux density was adjusted by varying the electric
current through the coils and measured by a Hall probe (Lake Shore, model 450). Further
details on the setup can be found in Ref. [124, 152]. The magnetic field in the air gap of
the electromagnet had an inhomogeneity of some mT cm-1. However, with the cell
inserted into the gap and due to the growth of a ferromagnetic layer at the working
electrode the field becomes inhomogeneous. In the following discussion, the terms
perpendicular (z- direction) and parallel (x-direction) refer to the orientation of the B
field relative to the working electrode (see Fig. 9 for details).
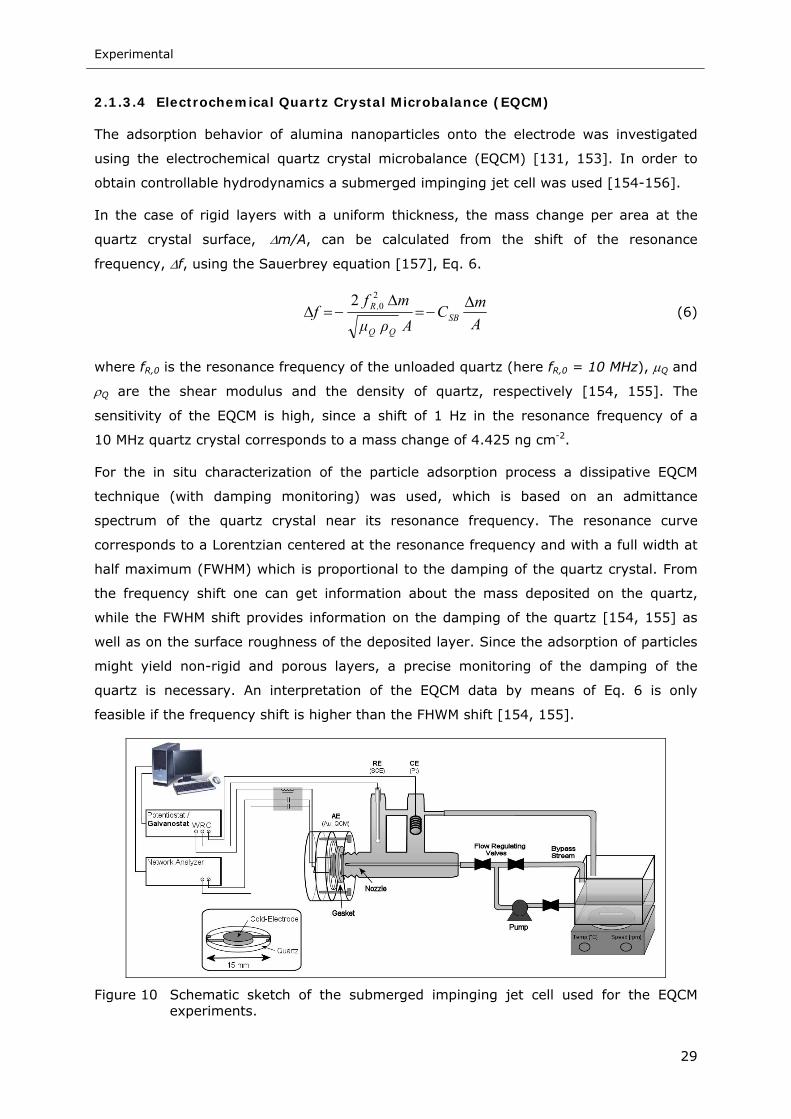
Experimental
29
2.1.3.4 Electrochemical Quartz Crystal Microbalance (EQCM)
The adsorption behavior of alumina nanoparticles onto the electrode was investigated
using the electrochemical quartz crystal microbalance (EQCM) [131, 153]. In order to
obtain controllable hydrodynamics a submerged impinging jet cell was used [154-156].
In the case of rigid layers with a uniform thickness, the mass change per area at the
quartz crystal surface, ∆m/A, can be calculated from the shift of the resonance
frequency, ∆f, using the Sauerbrey equation [157], Eq. 6.
AmC
Aρµmf
f SBQQ
,R ∆−=
∆−=∆
202
(6)
where fR,0 is the resonance frequency of the unloaded quartz (here fR,0 = 10 MHz), µQ and
ρQ are the shear modulus and the density of quartz, respectively [154, 155]. The
sensitivity of the EQCM is high, since a shift of 1 Hz in the resonance frequency of a
10 MHz quartz crystal corresponds to a mass change of 4.425 ng cm-2.
For the in situ characterization of the particle adsorption process a dissipative EQCM
technique (with damping monitoring) was used, which is based on an admittance
spectrum of the quartz crystal near its resonance frequency. The resonance curve
corresponds to a Lorentzian centered at the resonance frequency and with a full width at
half maximum (FWHM) which is proportional to the damping of the quartz crystal. From
the frequency shift one can get information about the mass deposited on the quartz,
while the FWHM shift provides information on the damping of the quartz [154, 155] as
well as on the surface roughness of the deposited layer. Since the adsorption of particles
might yield non-rigid and porous layers, a precise monitoring of the damping of the
quartz is necessary. An interpretation of the EQCM data by means of Eq. 6 is only
feasible if the frequency shift is higher than the FHWM shift [154, 155].
Figure 10 Schematic sketch of the submerged impinging jet cell used for the EQCM experiments.
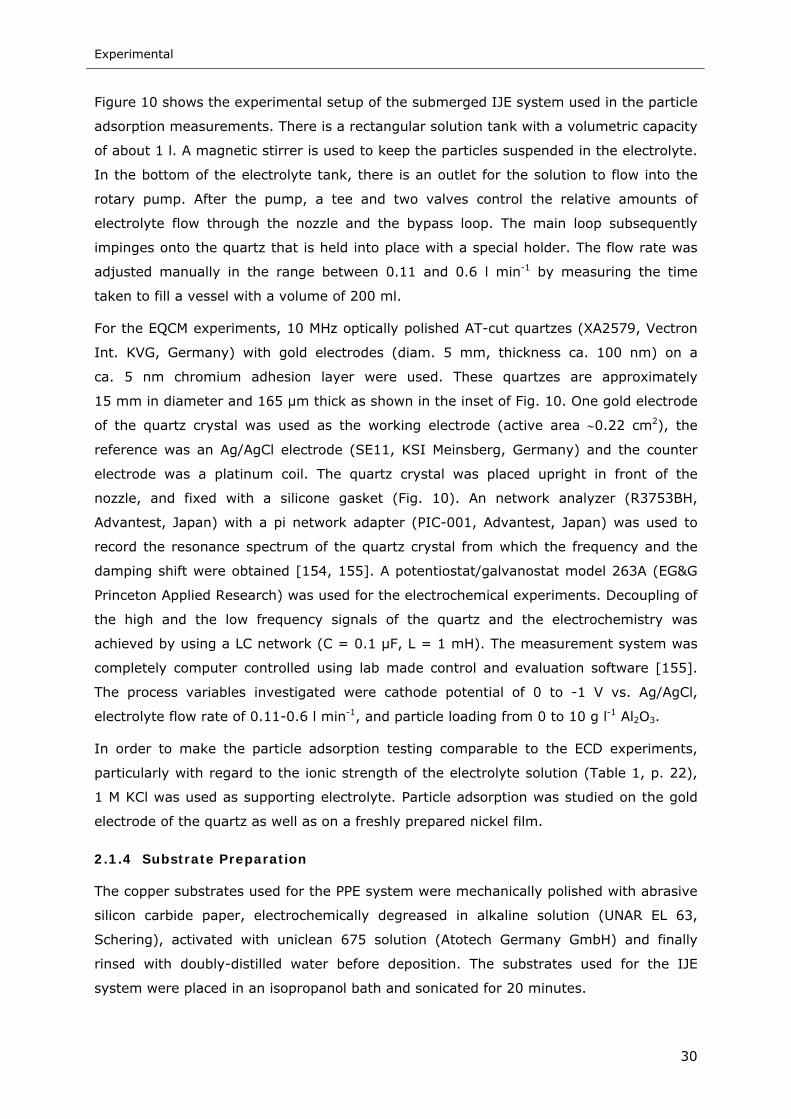
Experimental
30
Figure 10 shows the experimental setup of the submerged IJE system used in the particle
adsorption measurements. There is a rectangular solution tank with a volumetric capacity
of about 1 l. A magnetic stirrer is used to keep the particles suspended in the electrolyte.
In the bottom of the electrolyte tank, there is an outlet for the solution to flow into the
rotary pump. After the pump, a tee and two valves control the relative amounts of
electrolyte flow through the nozzle and the bypass loop. The main loop subsequently
impinges onto the quartz that is held into place with a special holder. The flow rate was
adjusted manually in the range between 0.11 and 0.6 l min-1 by measuring the time
taken to fill a vessel with a volume of 200 ml.
For the EQCM experiments, 10 MHz optically polished AT-cut quartzes (XA2579, Vectron
Int. KVG, Germany) with gold electrodes (diam. 5 mm, thickness ca. 100 nm) on a
ca. 5 nm chromium adhesion layer were used. These quartzes are approximately
15 mm in diameter and 165 µm thick as shown in the inset of Fig. 10. One gold electrode
of the quartz crystal was used as the working electrode (active area ∼0.22 cm2), the
reference was an Ag/AgCl electrode (SE11, KSI Meinsberg, Germany) and the counter
electrode was a platinum coil. The quartz crystal was placed upright in front of the
nozzle, and fixed with a silicone gasket (Fig. 10). An network analyzer (R3753BH,
Advantest, Japan) with a pi network adapter (PIC-001, Advantest, Japan) was used to
record the resonance spectrum of the quartz crystal from which the frequency and the
damping shift were obtained [154, 155]. A potentiostat/galvanostat model 263A (EG&G
Princeton Applied Research) was used for the electrochemical experiments. Decoupling of
the high and the low frequency signals of the quartz and the electrochemistry was
achieved by using a LC network (C = 0.1 µF, L = 1 mH). The measurement system was
completely computer controlled using lab made control and evaluation software [155].
The process variables investigated were cathode potential of 0 to -1 V vs. Ag/AgCl,
electrolyte flow rate of 0.11-0.6 l min-1, and particle loading from 0 to 10 g l-1 Al2O3.
In order to make the particle adsorption testing comparable to the ECD experiments,
particularly with regard to the ionic strength of the electrolyte solution (Table 1, p. 22),
1 M KCl was used as supporting electrolyte. Particle adsorption was studied on the gold
electrode of the quartz as well as on a freshly prepared nickel film.
2.1.4 Substrate Preparation
The copper substrates used for the PPE system were mechanically polished with abrasive
silicon carbide paper, electrochemically degreased in alkaline solution (UNAR EL 63,
Schering), activated with uniclean 675 solution (Atotech Germany GmbH) and finally
rinsed with doubly-distilled water before deposition. The substrates used for the IJE
system were placed in an isopropanol bath and sonicated for 20 minutes.
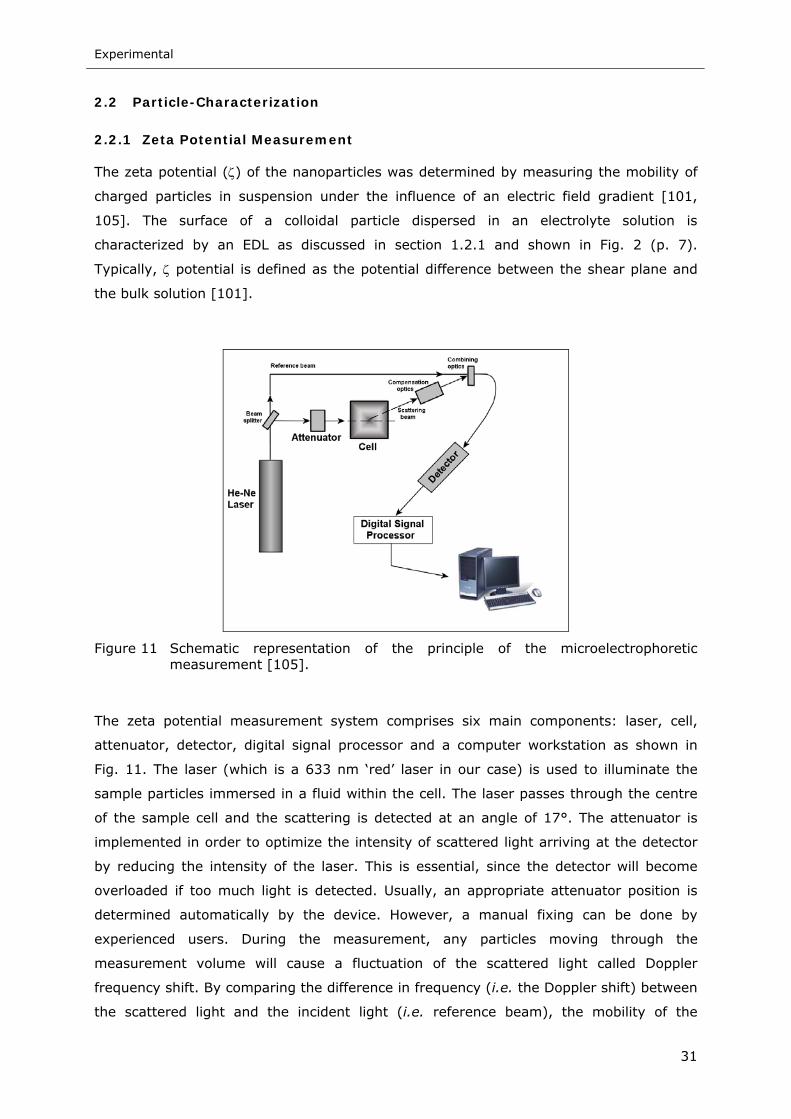
Experimental
31
2.2 Particle-Characterization
2.2.1 Zeta Potential Measurement
The zeta potential (ζ) of the nanoparticles was determined by measuring the mobility of
charged particles in suspension under the influence of an electric field gradient [101,
105]. The surface of a colloidal particle dispersed in an electrolyte solution is
characterized by an EDL as discussed in section 1.2.1 and shown in Fig. 2 (p. 7).
Typically, ζ potential is defined as the potential difference between the shear plane and
the bulk solution [101].
Figure 11 Schematic representation of the principle of the microelectrophoretic measurement [105].
The zeta potential measurement system comprises six main components: laser, cell,
attenuator, detector, digital signal processor and a computer workstation as shown in
Fig. 11. The laser (which is a 633 nm ‘red’ laser in our case) is used to illuminate the
sample particles immersed in a fluid within the cell. The laser passes through the centre
of the sample cell and the scattering is detected at an angle of 17°. The attenuator is
implemented in order to optimize the intensity of scattered light arriving at the detector
by reducing the intensity of the laser. This is essential, since the detector will become
overloaded if too much light is detected. Usually, an appropriate attenuator position is
determined automatically by the device. However, a manual fixing can be done by
experienced users. During the measurement, any particles moving through the
measurement volume will cause a fluctuation of the scattered light called Doppler
frequency shift. By comparing the difference in frequency (i.e. the Doppler shift) between
the scattered light and the incident light (i.e. reference beam), the mobility of the
Experimental
32
particles under the influence of the applied electric field can be determined [101]. In the
case of electrical non-conductive, spherical particles with a thin double layer compared to
the particle diameter, the Smoluchowski formula can be used to calculate the zeta
potential from the measured particle mobility [101].
The zeta potential of the several nanoparticles was determined with a Zetasizer Nano
(Malvern Instruments, Herrenberg) in 10-3 M KCl as well as in the diluted plating
electrolytes with a concentration of 0.2 g l-1 nanoparticles in the pH range 2-11. The pH
was adjusted with HCl or NaOH. The individual electrolyte components (Table 1, p. 22)
were added in concentrations of 10-3 M. Dilute solutions of the electrolytes were prepared
by mixing 0.02-0.1 ml of the corresponding electrolyte with 1 l of 10-3 M KCl. This
dilution procedure is necessary to adjust the ionic strength of the solution to the
requirements of the zeta potential measurement (section 1.2.1). Electrophoretic
mobilities were converted to ζ-potentials using Smoluchowski’s equation [101].
2.2.2 Photon Correlation Spectroscopy
Photon Correlation Spectroscopy (PCS) is used to determine the size of particles
suspended in a solution [101]. The measuring principle is based on the Brownian motion
of the particles which is mainly due to the random collision with the molecules of the
liquid surrounding the particle. According to the Stokes-Einstein equation the speed of
the particle due to Brownian motion is directly related to the particle size [101],
whereupon small particles move more quickly compared to larger ones. Using this
technique, particle sizes in the range from 0.6 nm to 6 µm can be determined [105].
Figure 12 Schematic representation of the principle of the photon correlation spectroscopy [105].
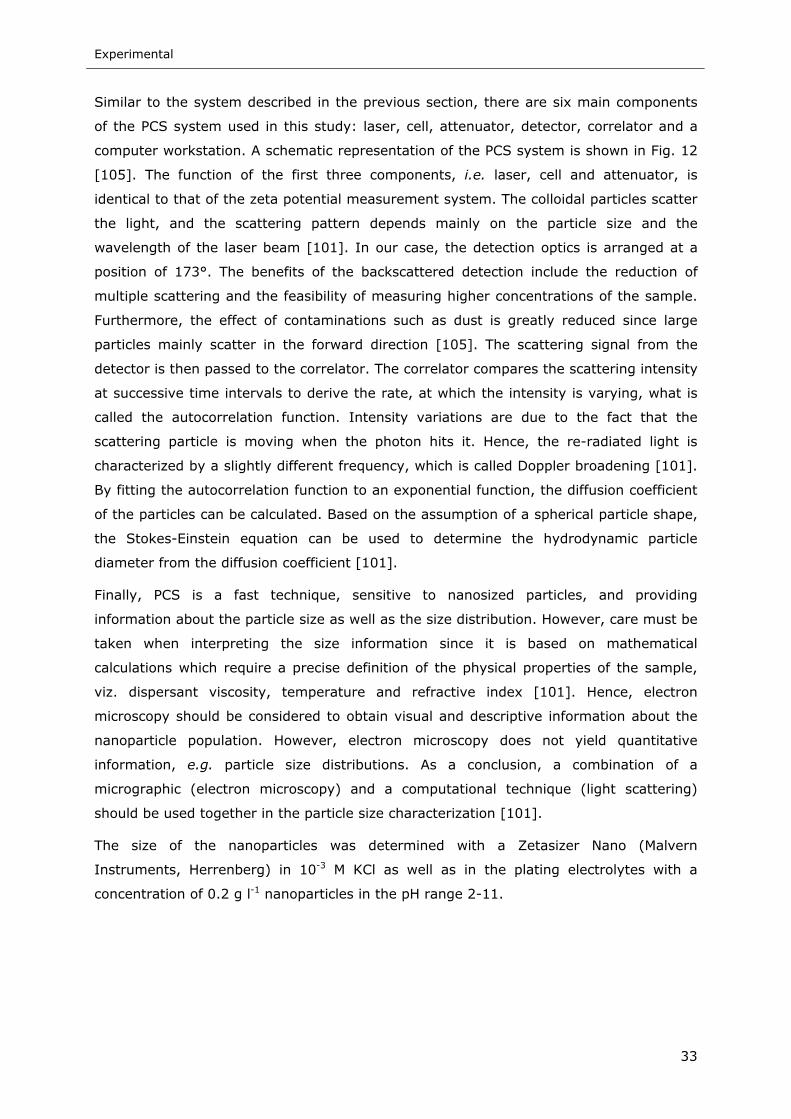
Experimental
33
Similar to the system described in the previous section, there are six main components
of the PCS system used in this study: laser, cell, attenuator, detector, correlator and a
computer workstation. A schematic representation of the PCS system is shown in Fig. 12
[105]. The function of the first three components, i.e. laser, cell and attenuator, is
identical to that of the zeta potential measurement system. The colloidal particles scatter
the light, and the scattering pattern depends mainly on the particle size and the
wavelength of the laser beam [101]. In our case, the detection optics is arranged at a
position of 173°. The benefits of the backscattered detection include the reduction of
multiple scattering and the feasibility of measuring higher concentrations of the sample.
Furthermore, the effect of contaminations such as dust is greatly reduced since large
particles mainly scatter in the forward direction [105]. The scattering signal from the
detector is then passed to the correlator. The correlator compares the scattering intensity
at successive time intervals to derive the rate, at which the intensity is varying, what is
called the autocorrelation function. Intensity variations are due to the fact that the
scattering particle is moving when the photon hits it. Hence, the re-radiated light is
characterized by a slightly different frequency, which is called Doppler broadening [101].
By fitting the autocorrelation function to an exponential function, the diffusion coefficient
of the particles can be calculated. Based on the assumption of a spherical particle shape,
the Stokes-Einstein equation can be used to determine the hydrodynamic particle
diameter from the diffusion coefficient [101].
Finally, PCS is a fast technique, sensitive to nanosized particles, and providing
information about the particle size as well as the size distribution. However, care must be
taken when interpreting the size information since it is based on mathematical
calculations which require a precise definition of the physical properties of the sample,
viz. dispersant viscosity, temperature and refractive index [101]. Hence, electron
microscopy should be considered to obtain visual and descriptive information about the
nanoparticle population. However, electron microscopy does not yield quantitative
information, e.g. particle size distributions. As a conclusion, a combination of a
micrographic (electron microscopy) and a computational technique (light scattering)
should be used together in the particle size characterization [101].
The size of the nanoparticles was determined with a Zetasizer Nano (Malvern
Instruments, Herrenberg) in 10-3 M KCl as well as in the plating electrolytes with a
concentration of 0.2 g l-1 nanoparticles in the pH range 2-11.
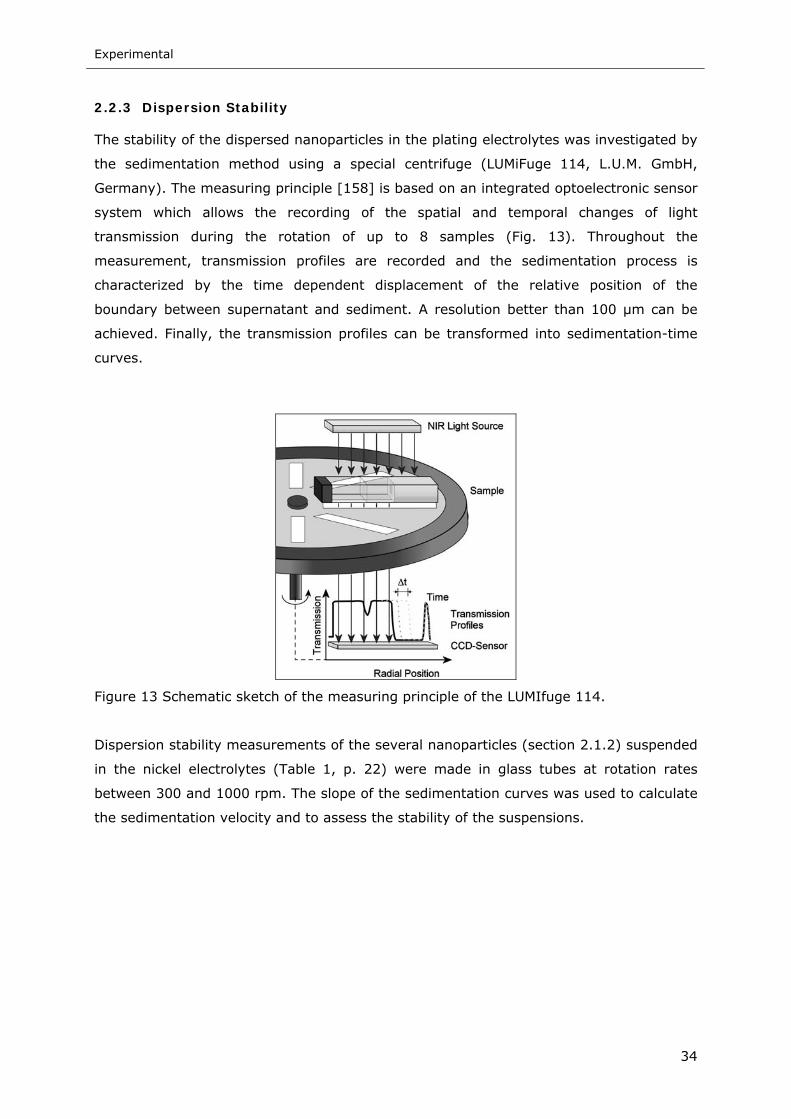
Experimental
34
2.2.3 Dispersion Stability
The stability of the dispersed nanoparticles in the plating electrolytes was investigated by
the sedimentation method using a special centrifuge (LUMiFuge 114, L.U.M. GmbH,
Germany). The measuring principle [158] is based on an integrated optoelectronic sensor
system which allows the recording of the spatial and temporal changes of light
transmission during the rotation of up to 8 samples (Fig. 13). Throughout the
measurement, transmission profiles are recorded and the sedimentation process is
characterized by the time dependent displacement of the relative position of the
boundary between supernatant and sediment. A resolution better than 100 µm can be
achieved. Finally, the transmission profiles can be transformed into sedimentation-time
curves.
Figure 13 Schematic sketch of the measuring principle of the LUMIfuge 114.
Dispersion stability measurements of the several nanoparticles (section 2.1.2) suspended
in the nickel electrolytes (Table 1, p. 22) were made in glass tubes at rotation rates
between 300 and 1000 rpm. The slope of the sedimentation curves was used to calculate
the sedimentation velocity and to assess the stability of the suspensions.
Experimental
35
2.3 Layer-Characterization
Due to the fact that structure and properties are intimately related with the application of
any material, the characterization of these properties is a very relevant issue in MMNC
film development [159]. This chapter is concerned with the structural analysis of the
deposited MMNC films by electron microscopy (sections 2.3.1.2, 2.3.2), X-ray diffraction
(section 2.3.3) and spectroscopic procedures (section 2.3.1.3). While X-ray diffraction
yields information from a large volume of the sample, electron microscopy probes a
rather confined volume. Hence, both methods have to be considered of comparative
importance for a complete characterization of structure and morphology of the deposited
MMNC films. Additionally, the mechanical properties of the MMNC films were studied by
microhardness (section 2.3.4) and abrasion testing (section 2.3.5), whereas the
magnetic properties were examined using vibrating sample magnetometry (section
2.3.6). Further details about procedures for the utilized techniques will be provided in
this section.
2.3.1 Particle Incorporation Analysis
The amount of co-deposited nanoparticles was determined by several techniques,
including the electrogravimetric method (section 2.3.1.1), scanning electron microscopy
(SEM) and energy-dispersive X-ray spectroscopy (EDX) (section 2.3.1.2), and glow
discharge optical emission spectrometry (GD-OES) (section 2.3.1.3). The measuring
principle of the several analyses is discussed in the following sections.
2.3.1.1 Electrogravimetric Analysis
The electrogravimetric analysis was employed to calculate the incorporation of alumina
nanoparticles during nickel plating using the IJE system. The efficiency of pure nickel
deposition from the sulfamate bath was determined within the investigated current
density range. The theoretical mass of deposited nickel was calculated from Faraday’s
law and subsequently compared to the actual plated nickel mass. The current efficiency
was in the range of 87-99 %. Hence, the amount of nickel electrodeposited during ECD
was calculated from the total charge passed, taking into account the current efficiency of
pure nickel plating. The typical weight of the co-deposited films was 0.1 g, resulting in an
accuracy in the particle incorporation of ±0.6 vol-%. The amount of co-deposited
alumina was determined by subtracting the amount of nickel determined from
coulometry from the actual weight gain.
Experimental
36
2.3.1.2 Scanning Electron Microscopy (SEM) and energy-dispersive X-ray
Spectroscopy (EDX)
Scanning electron microscopy (SEM) can be used for qualitative surface morphology
analysis; energy dispersive X-ray spectroscopic (EDX) is a technique to determine the
chemical composition of a material non-destructive [141]. SEM is a type of microscope
that uses an electron-beam rather than light to obtain an image of the sample. The
advantages of SEM include a higher magnification, a larger depth of focus and a greater
resolution in comparison to an optical microscope [141].
SEM micrographs combined with EDX studies were done in a DSM 982 Gemini (Zeiss
Oberkochen, Germany) with an EDX detector model Voyager III 3200 (SUS Pioneer). The
amount of co-deposited nanoparticles in the nickel matrix was evaluated from the
aluminum (Al2O3), cobalt (Co), titanium (TiO2) and iron (Fe3O4) signal, respectively. The
particle concentration of the metal oxides was determined taking into consideration
stoichiometric ratio of oxygen to metal in Al2O3, TiO2 or Fe3O4. Three randomly chosen
points each covering an area of 100 µm2 were analyzed and an average value was
calculated. The accuracy of EDX analysis was approximately ±0.5 vol-%. The EDX area
analyses were performed both on the surface as well as in the cross section at a 10000x
magnification. Surface morphology and microstructure of the deposited composites were
also analyzed with SEM. For the cross section, the samples were embedded in epoxy
resin and cut with a diamond saw. After mechanical grinding with 800 to 4000 grade
silicon carbide paper and polishing with diamond suspension down to 1 µm, the cross-
sections were etched approximately 10 seconds with a solution of 50 ml conc. CH3COOH
and 50 ml conc. HNO3 [16].
A complete and quantitative representation of the sample microstructure can be
established with electron backscattered diffraction (EBSD) [160, 161]. A FESEM
NEON40EsB (Zeiss, Germany) was used at 25 kV with a scanning transmission electron
microscopy (STEM) detector as well as an EBSD camera (EDAX TSL). For backscattered
secondary electron (BSE) imaging, the voltage was lowered to 10 and 5 kV, respectively.
Cross sections were prepared with a final oxide polish (OP). EBSD is a powerful
microstructural-crystallographic technique used to investigate the crystallographic
texture or preferred orientation of any crystalline or polycrystalline materials [161]. For
this purpose an electron beam strikes a tilted sample and the diffracted electrons form a
pattern which can be used to determine the crystal orientation, measure grain boundary
misorientations, discriminate between different materials, and provide information about
local crystalline perfection. The scanning and mapping capabilities of an EBSD system
allow for rapid acquisition of data at sub-micron resolutions revealing the constituent
grain morphology, orientations, and boundaries of the sample [160, 161].
Experimental
37
2.3.1.3 Glow Discharge Optical Emission Spectrometry (GD-OES)
Glow Discharge Optical Emission Spectrometry (GD-OES) is typically defined as an
instrumental technique which uses a low-pressure, obstructed, hollow-anode glow
discharge combined with one or more optical spectrometers [162, 163]. In GD-OES
analysis the sample is applied to a high negative potential of 700 V in a low pressure
argon environment. The electrons and argon atoms interact to form a plasma. The
collision of high-energy electrons with argon atoms causes the generation of Ar+ ions.
The positive argon ions then are driven by the negative bias to collide with the sample
surface where they sputter (or erode) material uniformly [163]. Some of this sputtered
material diffuses into the glow discharge plasma where it is dissociated into atomic
particles and finally excited. The light emitted from these excited state species, as they
collapse back to lower energy levels, is characteristic of the elements composing the
sample. The wavelengths and intensity of the light emission are used to identify and
quantify the composition of the sample. The aim of GD-OES analysis is most often the
determination of the concentration of an element as a function of depth. Therefore, the
initial measured information, i.e. the intensity vs. time relation, has to be converted
properly to depth. The conversion is based on the assumption that the sample material is
removed by the sputtering process layer-by-layer to correlate accurately with the
simultaneously recorded line intensities of the particular elements and the corresponding
depth [163]. However, due to instrumental as well as sputter-induced effects this
precondition is sometimes questionable in practice. As a result a sharp step-like change
in the composition of a sample cannot be displayed with an adequate resolution, resulting
in an apparently widened interface region [163]. An accurate calibration with properly
chosen reference materials is required to achieve reliable depth-profiles of the sample
composition [163].
The depth profile of the MMNC film composition was determined by Dr. Manfred
Baumgärtner and Harald Merz (Research Institute Precious Metals & Metals Chemistry,
Schwäbisch Gmünd) by means of GD-OES using a GDS 750 (Spectruma Analytik GmbH,
Germany). The system was calibrated using standard reference materials, i.e. pure nickel
and nickel alloys (IARM - Analytical Reference Materials International, USA). Finally, the
raw intensity versus time data has been converted to elemental concentrations versus
depth.
Experimental
38
2.3.2 Transmission Electron Microscopy (TEM)
The transmission electron microscopy (TEM) investigations were performed in
collaboration with Dr. Dagmar Dietrich and Dr. Thomas Lampke (Technische Universität
Chemnitz, Institute of Composite Materials and Surface Technology). For TEM the
composite films were separated from the substrate mechanically. Disks of 3 mm
diameter were cut and ion polished by 3kV Ar ions with 6° incidence angle until electron
transparency. The utilized TEM (Hitachi 8110) is equipped with a LaB6 cathode and was
operated at 200 kV which enables imaging in high resolution complemented by diffraction
patterns, bright (BF) and dark field (DF) imaging.
2.3.3 X-ray Diffraction (XRD)
An often observed structural feature of polycrystalline electroplated films is that certain
crystallographic lattice planes can occur with a greater probability than others, which is
called preferred orientation or texture [159]. The occurrence of a texture can be easily
recognized in a X-ray diffraction pattern by a pronounced enhancement of a certain
reflection when compared with a powder pattern of randomly oriented grains. According
to Scherrer, the width of the Bragg reflection increases with decreasing crystallite size
[164]. However, it has to be emphasized that the crystallite size calculated from the XRD
peak profiles refers to the domain sizes that scatter the incoming X-rays coherently.
Hence, these values are generally smaller compared to the crystallite size as obtained by
other techniques such as transmission electron microscopy [159].
X-ray diffraction was utilized to study the texture and crystallite size of the nickel matrix.
Diffractograms were recorded by Ms. Anja Bensch (Inorganic Chemistry, Technische
Universität Dresden) at room temperature on a Siemens D5000 with a scan rate of 0.12°
min-1 for two-theta ranging from 10 to 100°. The size of the nickel crystallites was
determined from the broadening of the (200) and/or (111) reflections according to the
Debye–Scherrer equation [164], after background correction and subtracting the
instrumental line broadening. The preferred crystalline orientation of the nickel films was
evaluated by the relative texture coefficients RTChkl, Eq. (7)
%I/I
I/IRTChklhkl
hklhklhkl 1004
1
0
0
⋅=
∑ (7)
where are the relative intensities of the (hkl) lines measured in the diffractogram of
the nickel films and are the corresponding intensities of a randomly oriented nickel
powder sample (JCPDS no. 4-850). The summation was taken for the 4 lines
visible in the diffraction spectra, i.e. (111), (200), (311) and (222).
0hklI
hklI
∑ hklI
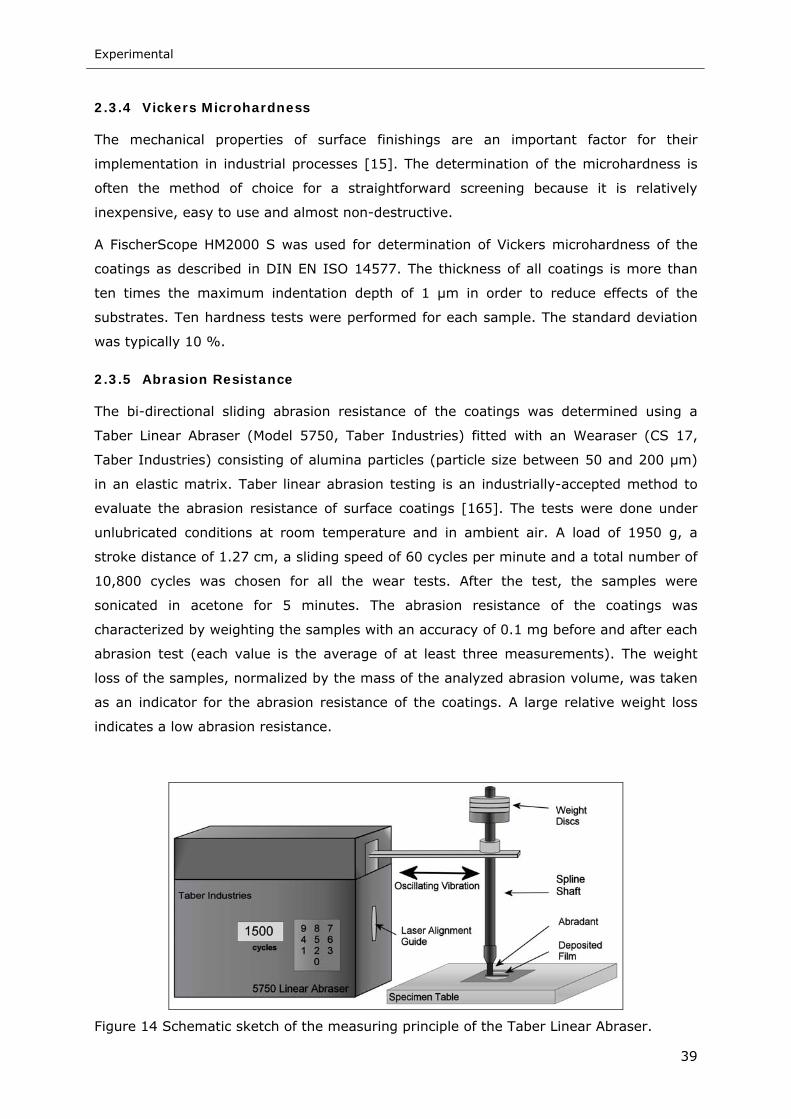
Experimental
39
2.3.4 Vickers Microhardness
The mechanical properties of surface finishings are an important factor for their
implementation in industrial processes [15]. The determination of the microhardness is
often the method of choice for a straightforward screening because it is relatively
inexpensive, easy to use and almost non-destructive.
A FischerScope HM2000 S was used for determination of Vickers microhardness of the
coatings as described in DIN EN ISO 14577. The thickness of all coatings is more than
ten times the maximum indentation depth of 1 µm in order to reduce effects of the
substrates. Ten hardness tests were performed for each sample. The standard deviation
was typically 10 %.
2.3.5 Abrasion Resistance
The bi-directional sliding abrasion resistance of the coatings was determined using a
Taber Linear Abraser (Model 5750, Taber Industries) fitted with an Wearaser (CS 17,
Taber Industries) consisting of alumina particles (particle size between 50 and 200 µm)
in an elastic matrix. Taber linear abrasion testing is an industrially-accepted method to
evaluate the abrasion resistance of surface coatings [165]. The tests were done under
unlubricated conditions at room temperature and in ambient air. A load of 1950 g, a
stroke distance of 1.27 cm, a sliding speed of 60 cycles per minute and a total number of
10,800 cycles was chosen for all the wear tests. After the test, the samples were
sonicated in acetone for 5 minutes. The abrasion resistance of the coatings was
characterized by weighting the samples with an accuracy of 0.1 mg before and after each
abrasion test (each value is the average of at least three measurements). The weight
loss of the samples, normalized by the mass of the analyzed abrasion volume, was taken
as an indicator for the abrasion resistance of the coatings. A large relative weight loss
indicates a low abrasion resistance.
Figure 14 Schematic sketch of the measuring principle of the Taber Linear Abraser.
Experimental
40
2.3.6 Magnetization Measurements
Vibrating Sample Magnetometry (VSM) is used to determine the magnetic properties of
thin layers and small crystals of various nature (magnetic oxides, etc.) [141]. When a
sample of any material is placed within a uniform magnetic field, a magnetic moment is
induced in the sample. If this sample is made to undergo sinusoidal motion (i.e.
mechanically vibrated), the vibration induces a magnetic flux change [141]. This in turn
induces a voltage in the pick-up coils which is proportional to the frequency and
amplitude of the sinusoidal motion, and the total magnetic moment of the sample at the
particular applied magnetic field. In a VSM measurement the strength of the magnetic
field is progressively changed while the magnetic moment of the sample is detected.
Finally, hysteresis loops, i.e. plots of the magnetization (M) as a function of the applied
magnetic field (H), are generated. Using these plots, the saturation magnetization (Ms),
that represents the maximum magnetic moment measured, and the coercivity (Hc), that
is the field required to reduce a saturated sample to zero induction, can be determined.
Hysteresis curves were measured by Dr. Christian P. Gräf (Saarland University,
Department of Engineering Physics) at room temperature in a vibrating sample
magnetometer (VSM, EG&G PARC 4500). In general the magnetization curve of a
material depends on the composition and shape of the sample [166]. As the aspect ratio
(diameter to layer thickness) of our magnetic layers is large no shearing correction is
needed for hysteresis measurements with Hmes in the x-y-direction (Fig. 9, p. 28).
Therefore all VSM measurements were performed in that direction.
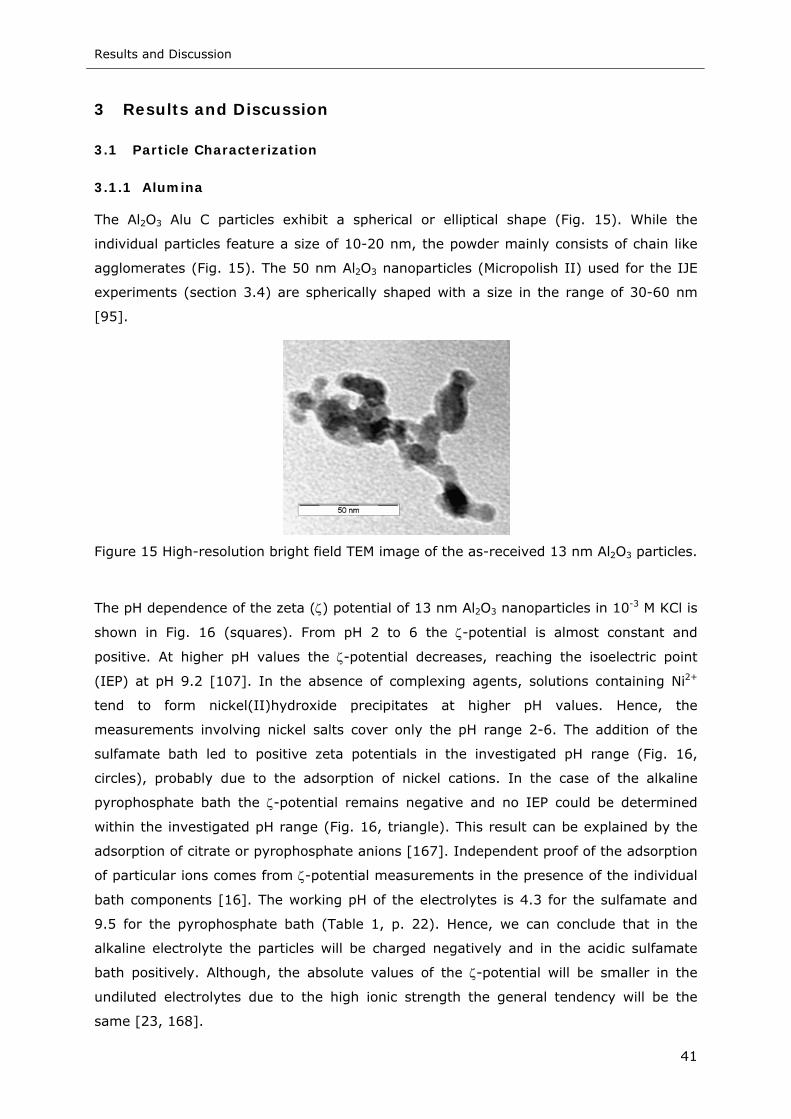
Results and Discussion
41
3 Results and Discussion
3.1 Particle Characterization
3.1.1 Alumina
The Al2O3 Alu C particles exhibit a spherical or elliptical shape (Fig. 15). While the
individual particles feature a size of 10-20 nm, the powder mainly consists of chain like
agglomerates (Fig. 15). The 50 nm Al2O3 nanoparticles (Micropolish II) used for the IJE
experiments (section 3.4) are spherically shaped with a size in the range of 30-60 nm
[95].
Figure 15 High-resolution bright field TEM image of the as-received 13 nm Al2O3 particles.
The pH dependence of the zeta (ζ) potential of 13 nm Al2O3 nanoparticles in 10-3 M KCl is
shown in Fig. 16 (squares). From pH 2 to 6 the ζ-potential is almost constant and
positive. At higher pH values the ζ-potential decreases, reaching the isoelectric point
(IEP) at pH 9.2 [107]. In the absence of complexing agents, solutions containing Ni2+
tend to form nickel(II)hydroxide precipitates at higher pH values. Hence, the
measurements involving nickel salts cover only the pH range 2-6. The addition of the
sulfamate bath led to positive zeta potentials in the investigated pH range (Fig. 16,
circles), probably due to the adsorption of nickel cations. In the case of the alkaline
pyrophosphate bath the ζ-potential remains negative and no IEP could be determined
within the investigated pH range (Fig. 16, triangle). This result can be explained by the
adsorption of citrate or pyrophosphate anions [167]. Independent proof of the adsorption
of particular ions comes from ζ-potential measurements in the presence of the individual
bath components [16]. The working pH of the electrolytes is 4.3 for the sulfamate and
9.5 for the pyrophosphate bath (Table 1, p. 22). Hence, we can conclude that in the
alkaline electrolyte the particles will be charged negatively and in the acidic sulfamate
bath positively. Although, the absolute values of the ζ-potential will be smaller in the
undiluted electrolytes due to the high ionic strength the general tendency will be the
same [23, 168].
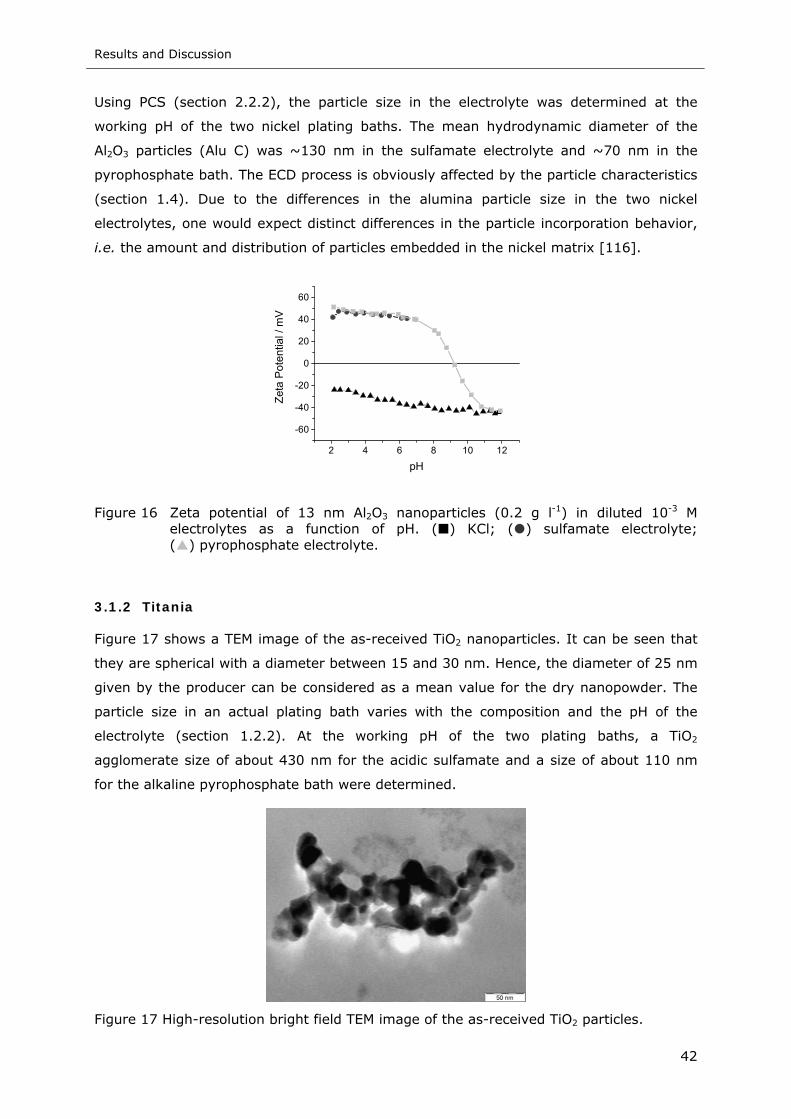
Results and Discussion
42
Using PCS (section 2.2.2), the particle size in the electrolyte was determined at the
working pH of the two nickel plating baths. The mean hydrodynamic diameter of the
Al2O3 particles (Alu C) was ~130 nm in the sulfamate electrolyte and ~70 nm in the
pyrophosphate bath. The ECD process is obviously affected by the particle characteristics
(section 1.4). Due to the differences in the alumina particle size in the two nickel
electrolytes, one would expect distinct differences in the particle incorporation behavior,
i.e. the amount and distribution of particles embedded in the nickel matrix [116].
2 4 6 8 10 12
-60
-40
-20
0
20
40
60
Zeta
Pot
entia
l / m
V
pH
Figure 16 Zeta potential of 13 nm Al2O3 nanoparticles (0.2 g l-1) in diluted 10-3 M electrolytes as a function of pH. ( ) KCl; ( ) sulfamate electrolyte; ( ) pyrophosphate electrolyte.
3.1.2 Titania
Figure 17 shows a TEM image of the as-received TiO2 nanoparticles. It can be seen that
they are spherical with a diameter between 15 and 30 nm. Hence, the diameter of 25 nm
given by the producer can be considered as a mean value for the dry nanopowder. The
particle size in an actual plating bath varies with the composition and the pH of the
electrolyte (section 1.2.2). At the working pH of the two plating baths, a TiO2
agglomerate size of about 430 nm for the acidic sulfamate and a size of about 110 nm
for the alkaline pyrophosphate bath were determined.
Figure 17 High-resolution bright field TEM image of the as-received TiO2 particles.
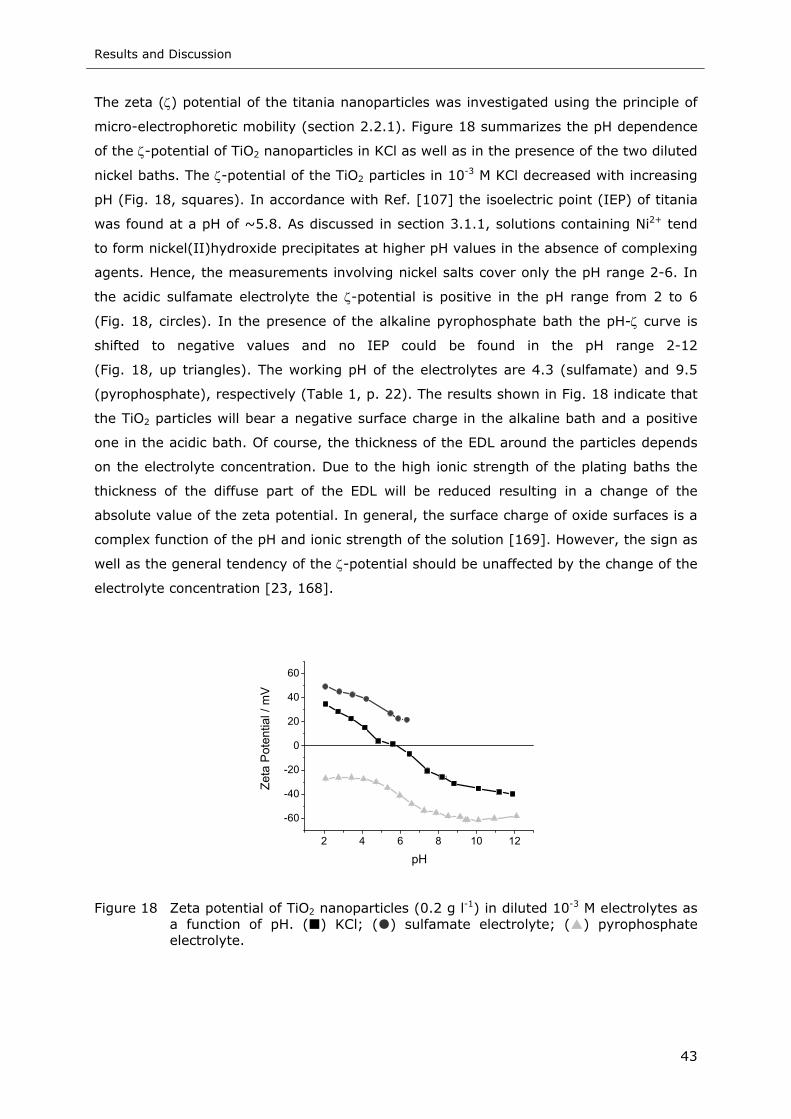
Results and Discussion
43
The zeta (ζ) potential of the titania nanoparticles was investigated using the principle of
micro-electrophoretic mobility (section 2.2.1). Figure 18 summarizes the pH dependence
of the ζ-potential of TiO2 nanoparticles in KCl as well as in the presence of the two diluted
nickel baths. The ζ-potential of the TiO2 particles in 10-3 M KCl decreased with increasing
pH (Fig. 18, squares). In accordance with Ref. [107] the isoelectric point (IEP) of titania
was found at a pH of ~5.8. As discussed in section 3.1.1, solutions containing Ni2+ tend
to form nickel(II)hydroxide precipitates at higher pH values in the absence of complexing
agents. Hence, the measurements involving nickel salts cover only the pH range 2-6. In
the acidic sulfamate electrolyte the ζ-potential is positive in the pH range from 2 to 6
(Fig. 18, circles). In the presence of the alkaline pyrophosphate bath the pH-ζ curve is
shifted to negative values and no IEP could be found in the pH range 2-12
(Fig. 18, up triangles). The working pH of the electrolytes are 4.3 (sulfamate) and 9.5
(pyrophosphate), respectively (Table 1, p. 22). The results shown in Fig. 18 indicate that
the TiO2 particles will bear a negative surface charge in the alkaline bath and a positive
one in the acidic bath. Of course, the thickness of the EDL around the particles depends
on the electrolyte concentration. Due to the high ionic strength of the plating baths the
thickness of the diffuse part of the EDL will be reduced resulting in a change of the
absolute value of the zeta potential. In general, the surface charge of oxide surfaces is a
complex function of the pH and ionic strength of the solution [169]. However, the sign as
well as the general tendency of the ζ-potential should be unaffected by the change of the
electrolyte concentration [23, 168].
2 4 6 8 10 12
-60
-40
-20
0
20
40
60
Zeta
Pot
entia
l / m
V
pH
Figure 18 Zeta potential of TiO2 nanoparticles (0.2 g l-1) in diluted 10-3 M electrolytes as a function of pH. ( ) KCl; ( ) sulfamate electrolyte; ( ) pyrophosphate electrolyte.
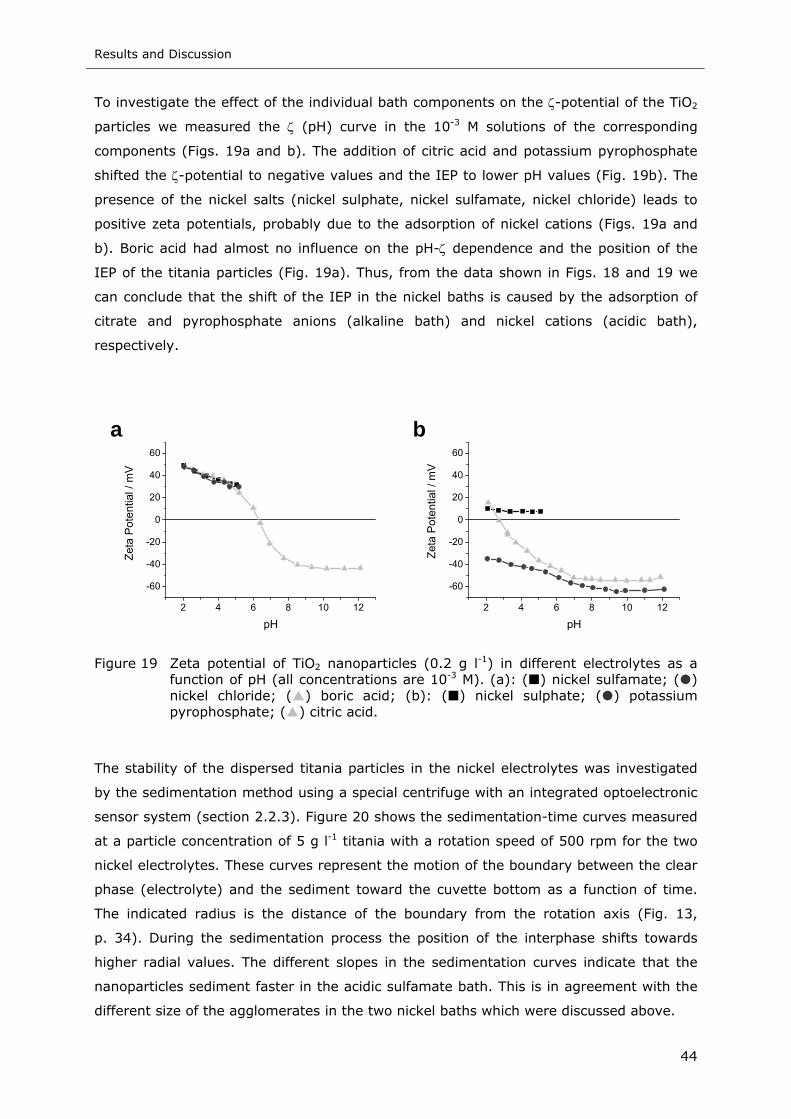
Results and Discussion
44
To investigate the effect of the individual bath components on the ζ-potential of the TiO2
particles we measured the ζ (pH) curve in the 10-3 M solutions of the corresponding
components (Figs. 19a and b). The addition of citric acid and potassium pyrophosphate
shifted the ζ-potential to negative values and the IEP to lower pH values (Fig. 19b). The
presence of the nickel salts (nickel sulphate, nickel sulfamate, nickel chloride) leads to
positive zeta potentials, probably due to the adsorption of nickel cations (Figs. 19a and
b). Boric acid had almost no influence on the pH-ζ dependence and the position of the
IEP of the titania particles (Fig. 19a). Thus, from the data shown in Figs. 18 and 19 we
can conclude that the shift of the IEP in the nickel baths is caused by the adsorption of
citrate and pyrophosphate anions (alkaline bath) and nickel cations (acidic bath),
respectively.
2 4 6 8 10 12
-60
-40
-20
0
20
40
60
a
Zeta
Pot
entia
l / m
V
pH
2 4 6 8 10 12
-60
-40
-20
0
20
40
60
bZe
ta P
oten
tial /
mV
pH
Figure 19 Zeta potential of TiO2 nanoparticles (0.2 g l-1) in different electrolytes as a function of pH (all concentrations are 10-3 M). (a): ( ) nickel sulfamate; ( ) nickel chloride; ( ) boric acid; (b): ( ) nickel sulphate; ( ) potassium pyrophosphate; ( ) citric acid.
The stability of the dispersed titania particles in the nickel electrolytes was investigated
by the sedimentation method using a special centrifuge with an integrated optoelectronic
sensor system (section 2.2.3). Figure 20 shows the sedimentation-time curves measured
at a particle concentration of 5 g l-1 titania with a rotation speed of 500 rpm for the two
nickel electrolytes. These curves represent the motion of the boundary between the clear
phase (electrolyte) and the sediment toward the cuvette bottom as a function of time.
The indicated radius is the distance of the boundary from the rotation axis (Fig. 13,
p. 34). During the sedimentation process the position of the interphase shifts towards
higher radial values. The different slopes in the sedimentation curves indicate that the
nanoparticles sediment faster in the acidic sulfamate bath. This is in agreement with the
different size of the agglomerates in the two nickel baths which were discussed above.
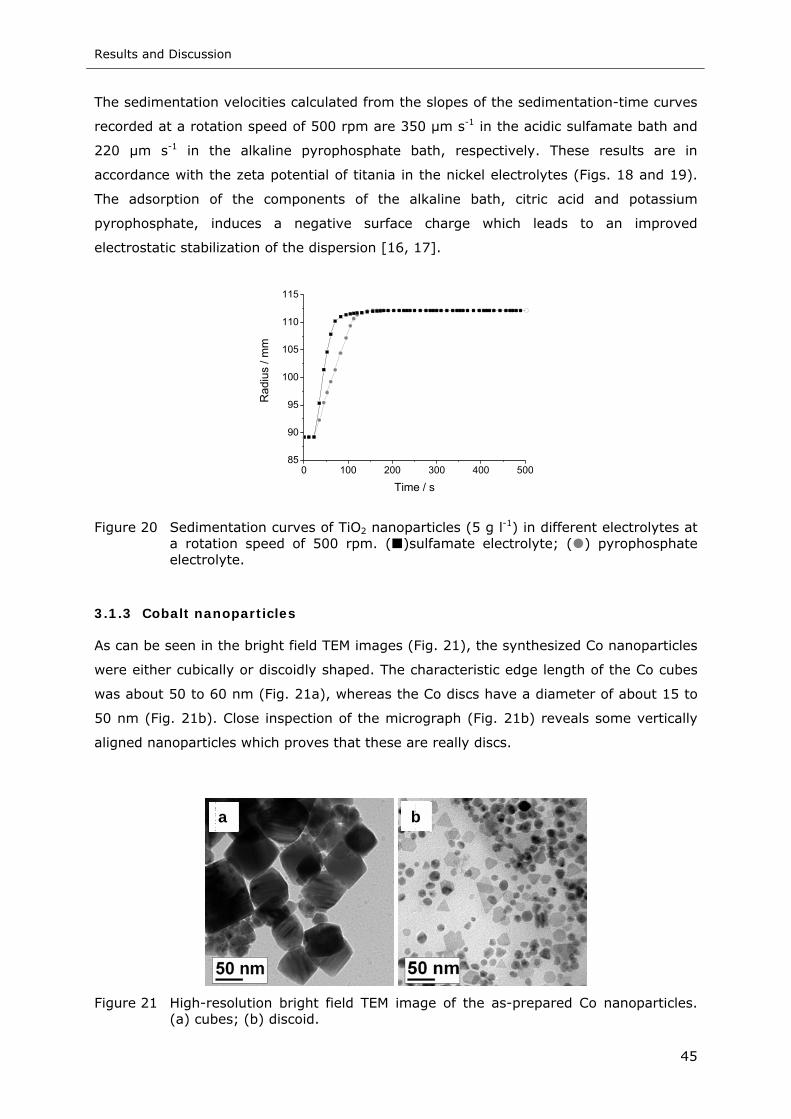
Results and Discussion
45
The sedimentation velocities calculated from the slopes of the sedimentation-time curves
recorded at a rotation speed of 500 rpm are 350 µm s-1 in the acidic sulfamate bath and
220 µm s-1 in the alkaline pyrophosphate bath, respectively. These results are in
accordance with the zeta potential of titania in the nickel electrolytes (Figs. 18 and 19).
The adsorption of the components of the alkaline bath, citric acid and potassium
pyrophosphate, induces a negative surface charge which leads to an improved
electrostatic stabilization of the dispersion [16, 17].
0 100 200 300 400 50085
90
95
100
105
110
115
Rad
ius
/ mm
Time / s
Figure 20 Sedimentation curves of TiO2 nanoparticles (5 g l-1) in different electrolytes at a rotation speed of 500 rpm. ( )sulfamate electrolyte; ( ) pyrophosphate electrolyte.
3.1.3 Cobalt nanoparticles
As can be seen in the bright field TEM images (Fig. 21), the synthesized Co nanoparticles
were either cubically or discoidly shaped. The characteristic edge length of the Co cubes
was about 50 to 60 nm (Fig. 21a), whereas the Co discs have a diameter of about 15 to
50 nm (Fig. 21b). Close inspection of the micrograph (Fig. 21b) reveals some vertically
aligned nanoparticles which proves that these are really discs.
Figure 21 High-resolution bright field TEM image of the as-prepared Co nanoparticles. (a) cubes; (b) discoid.
b a
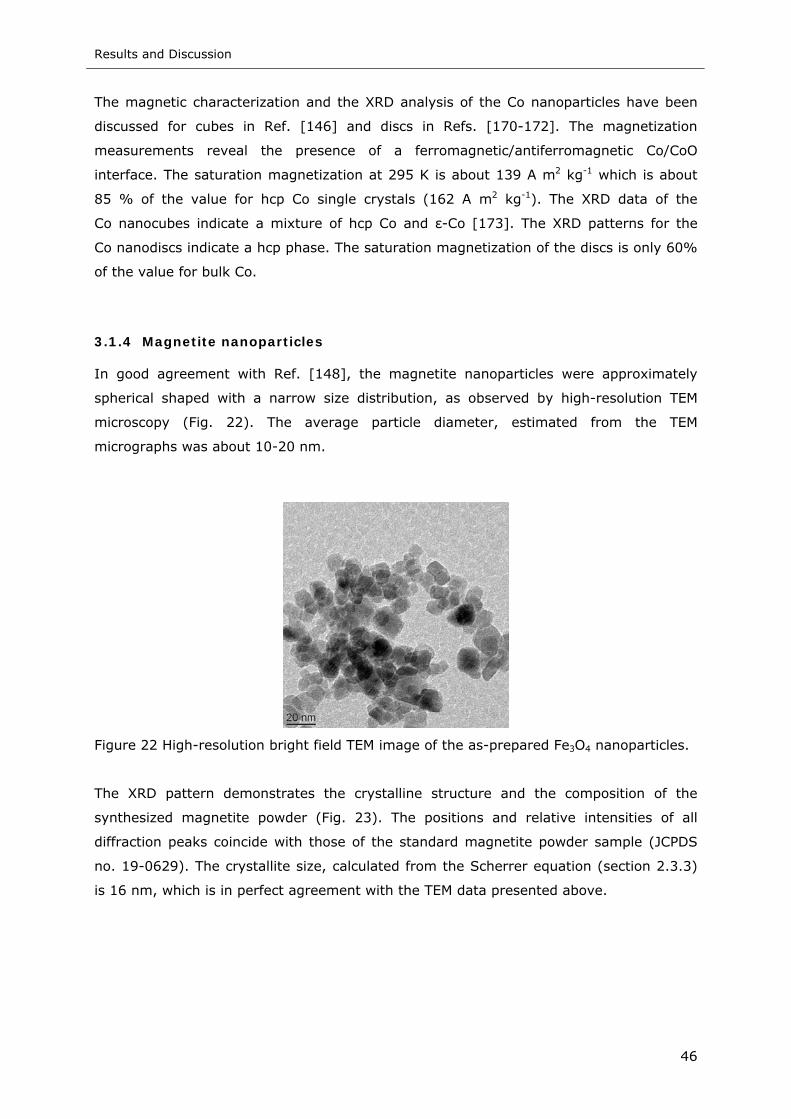
Results and Discussion
46
The magnetic characterization and the XRD analysis of the Co nanoparticles have been
discussed for cubes in Ref. [146] and discs in Refs. [170-172]. The magnetization
measurements reveal the presence of a ferromagnetic/antiferromagnetic Co/CoO
interface. The saturation magnetization at 295 K is about 139 A m2 kg-1 which is about
85 % of the value for hcp Co single crystals (162 A m2 kg-1). The XRD data of the
Co nanocubes indicate a mixture of hcp Co and ε-Co [173]. The XRD patterns for the
Co nanodiscs indicate a hcp phase. The saturation magnetization of the discs is only 60%
of the value for bulk Co.
3.1.4 Magnetite nanoparticles
In good agreement with Ref. [148], the magnetite nanoparticles were approximately
spherical shaped with a narrow size distribution, as observed by high-resolution TEM
microscopy (Fig. 22). The average particle diameter, estimated from the TEM
micrographs was about 10-20 nm.
Figure 22 High-resolution bright field TEM image of the as-prepared Fe3O4 nanoparticles.
The XRD pattern demonstrates the crystalline structure and the composition of the
synthesized magnetite powder (Fig. 23). The positions and relative intensities of all
diffraction peaks coincide with those of the standard magnetite powder sample (JCPDS
no. 19-0629). The crystallite size, calculated from the Scherrer equation (section 2.3.3)
is 16 nm, which is in perfect agreement with the TEM data presented above.
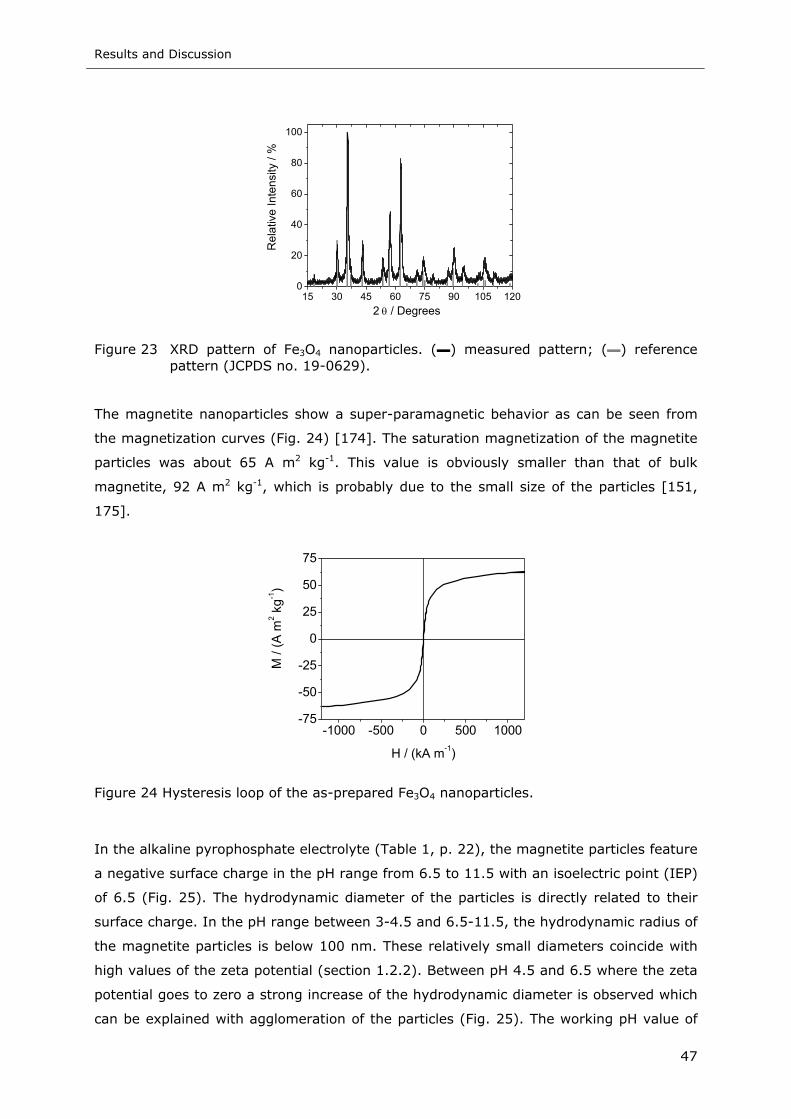
Results and Discussion
47
15 30 45 60 75 90 105 1200
20
40
60
80
100
Rel
ativ
e In
tens
ity /
%
2 θ / Degrees
Figure 23 XRD pattern of Fe3O4 nanoparticles. (▬) measured pattern; (▬) reference pattern (JCPDS no. 19-0629).
The magnetite nanoparticles show a super-paramagnetic behavior as can be seen from
the magnetization curves (Fig. 24) [174]. The saturation magnetization of the magnetite
particles was about 65 A m2 kg-1. This value is obviously smaller than that of bulk
magnetite, 92 A m2 kg-1, which is probably due to the small size of the particles [151,
175].
-1000 -500 0 500 1000-75
-50
-25
0
25
50
75
M /
(A m
2 kg-1
)
H / (kA m-1)
Figure 24 Hysteresis loop of the as-prepared Fe3O4 nanoparticles.
In the alkaline pyrophosphate electrolyte (Table 1, p. 22), the magnetite particles feature
a negative surface charge in the pH range from 6.5 to 11.5 with an isoelectric point (IEP)
of 6.5 (Fig. 25). The hydrodynamic diameter of the particles is directly related to their
surface charge. In the pH range between 3-4.5 and 6.5-11.5, the hydrodynamic radius of
the magnetite particles is below 100 nm. These relatively small diameters coincide with
high values of the zeta potential (section 1.2.2). Between pH 4.5 and 6.5 where the zeta
potential goes to zero a strong increase of the hydrodynamic diameter is observed which
can be explained with agglomeration of the particles (Fig. 25). The working pH value of
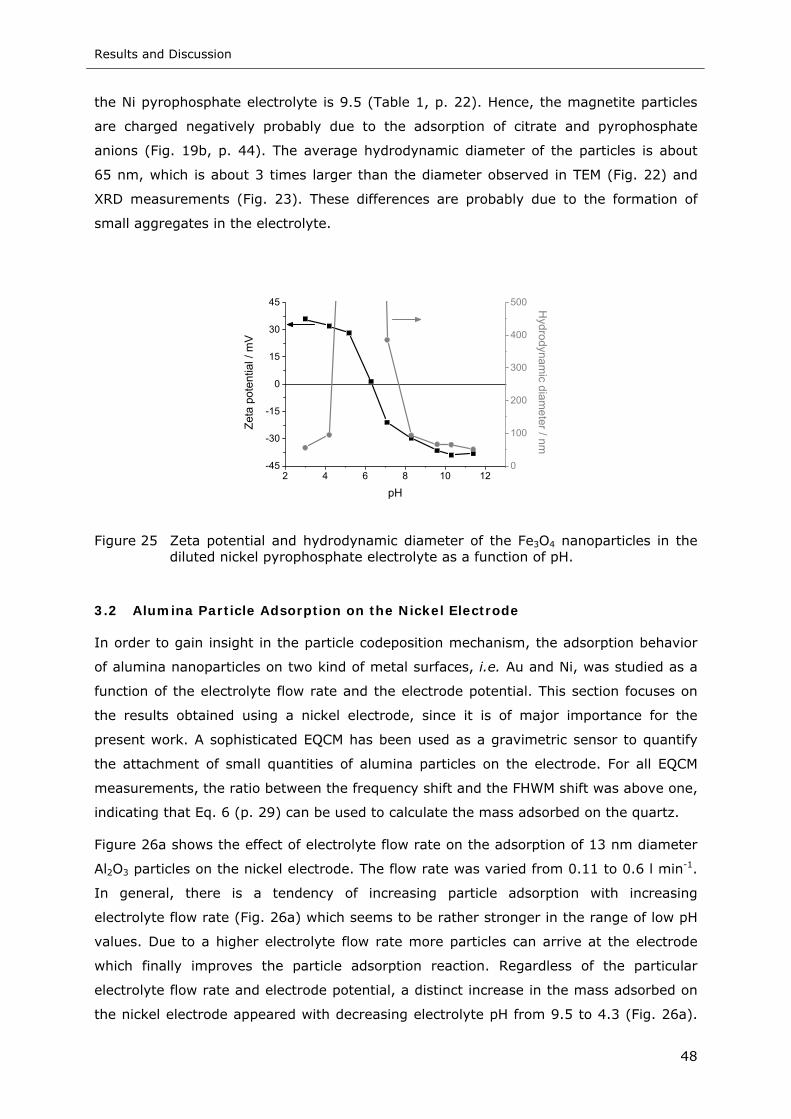
Results and Discussion
48
the Ni pyrophosphate electrolyte is 9.5 (Table 1, p. 22). Hence, the magnetite particles
are charged negatively probably due to the adsorption of citrate and pyrophosphate
anions (Fig. 19b, p. 44). The average hydrodynamic diameter of the particles is about
65 nm, which is about 3 times larger than the diameter observed in TEM (Fig. 22) and
XRD measurements (Fig. 23). These differences are probably due to the formation of
small aggregates in the electrolyte.
2 4 6 8 10 12-45
-30
-15
0
15
30
45
0
100
200
300
400
500 Hydrodynam
ic diameter / nm
Zeta
pot
entia
l / m
V
pH
Figure 25 Zeta potential and hydrodynamic diameter of the Fe3O4 nanoparticles in the diluted nickel pyrophosphate electrolyte as a function of pH.
3.2 Alumina Particle Adsorption on the Nickel Electrode
In order to gain insight in the particle codeposition mechanism, the adsorption behavior
of alumina nanoparticles on two kind of metal surfaces, i.e. Au and Ni, was studied as a
function of the electrolyte flow rate and the electrode potential. This section focuses on
the results obtained using a nickel electrode, since it is of major importance for the
present work. A sophisticated EQCM has been used as a gravimetric sensor to quantify
the attachment of small quantities of alumina particles on the electrode. For all EQCM
measurements, the ratio between the frequency shift and the FHWM shift was above one,
indicating that Eq. 6 (p. 29) can be used to calculate the mass adsorbed on the quartz.
Figure 26a shows the effect of electrolyte flow rate on the adsorption of 13 nm diameter
Al2O3 particles on the nickel electrode. The flow rate was varied from 0.11 to 0.6 l min-1.
In general, there is a tendency of increasing particle adsorption with increasing
electrolyte flow rate (Fig. 26a) which seems to be rather stronger in the range of low pH
values. Due to a higher electrolyte flow rate more particles can arrive at the electrode
which finally improves the particle adsorption reaction. Regardless of the particular
electrolyte flow rate and electrode potential, a distinct increase in the mass adsorbed on
the nickel electrode appeared with decreasing electrolyte pH from 9.5 to 4.3 (Fig. 26a).
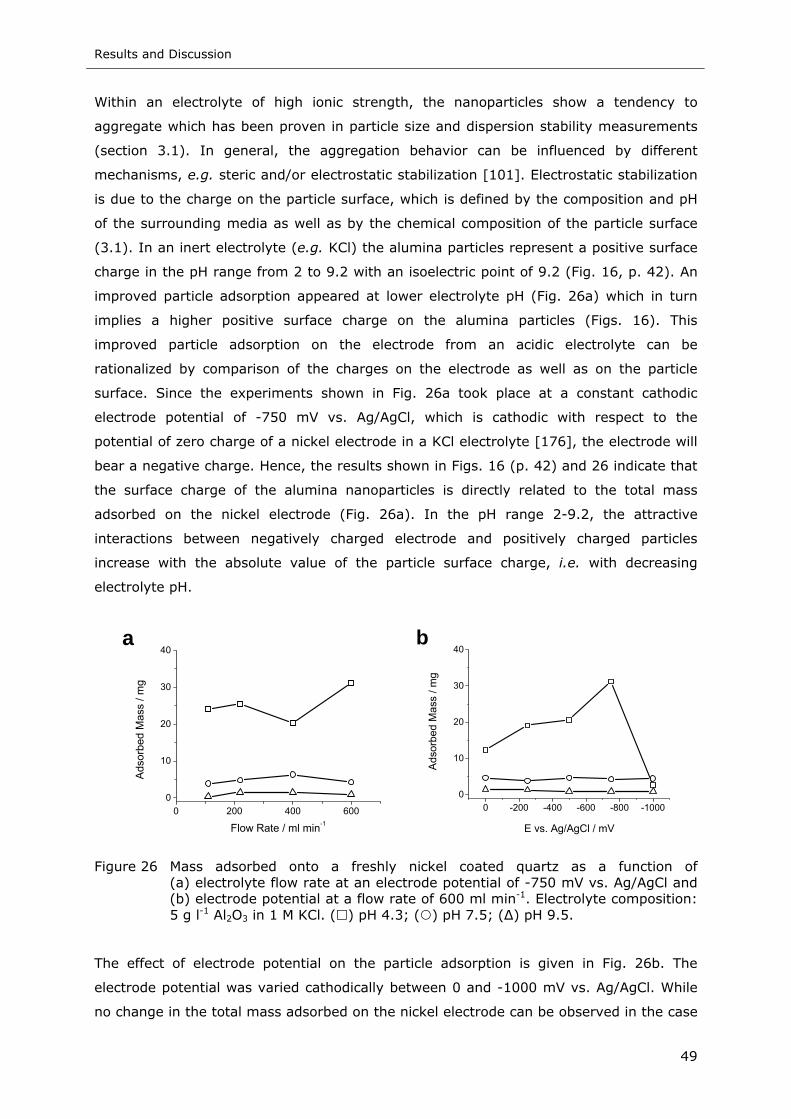
Results and Discussion
49
Within an electrolyte of high ionic strength, the nanoparticles show a tendency to
aggregate which has been proven in particle size and dispersion stability measurements
(section 3.1). In general, the aggregation behavior can be influenced by different
mechanisms, e.g. steric and/or electrostatic stabilization [101]. Electrostatic stabilization
is due to the charge on the particle surface, which is defined by the composition and pH
of the surrounding media as well as by the chemical composition of the particle surface
(3.1). In an inert electrolyte (e.g. KCl) the alumina particles represent a positive surface
charge in the pH range from 2 to 9.2 with an isoelectric point of 9.2 (Fig. 16, p. 42). An
improved particle adsorption appeared at lower electrolyte pH (Fig. 26a) which in turn
implies a higher positive surface charge on the alumina particles (Figs. 16). This
improved particle adsorption on the electrode from an acidic electrolyte can be
rationalized by comparison of the charges on the electrode as well as on the particle
surface. Since the experiments shown in Fig. 26a took place at a constant cathodic
electrode potential of -750 mV vs. Ag/AgCl, which is cathodic with respect to the
potential of zero charge of a nickel electrode in a KCl electrolyte [176], the electrode will
bear a negative charge. Hence, the results shown in Figs. 16 (p. 42) and 26 indicate that
the surface charge of the alumina nanoparticles is directly related to the total mass
adsorbed on the nickel electrode (Fig. 26a). In the pH range 2-9.2, the attractive
interactions between negatively charged electrode and positively charged particles
increase with the absolute value of the particle surface charge, i.e. with decreasing
electrolyte pH.
0 200 400 6000
10
20
30
40a
Ads
orbe
d M
ass
/ mg
Flow Rate / ml min-1
-1000-800-600-400-20000
10
20
30
40b
Ads
orbe
d M
ass
/ mg
E vs. Ag/AgCl / mV
Figure 26 Mass adsorbed onto a freshly nickel coated quartz as a function of (a) electrolyte flow rate at an electrode potential of -750 mV vs. Ag/AgCl and (b) electrode potential at a flow rate of 600 ml min-1. Electrolyte composition: 5 g l-1 Al2O3 in 1 M KCl. ( ) pH 4.3; ( ) pH 7.5; (∆) pH 9.5.
The effect of electrode potential on the particle adsorption is given in Fig. 26b. The
electrode potential was varied cathodically between 0 and -1000 mV vs. Ag/AgCl. While
no change in the total mass adsorbed on the nickel electrode can be observed in the case
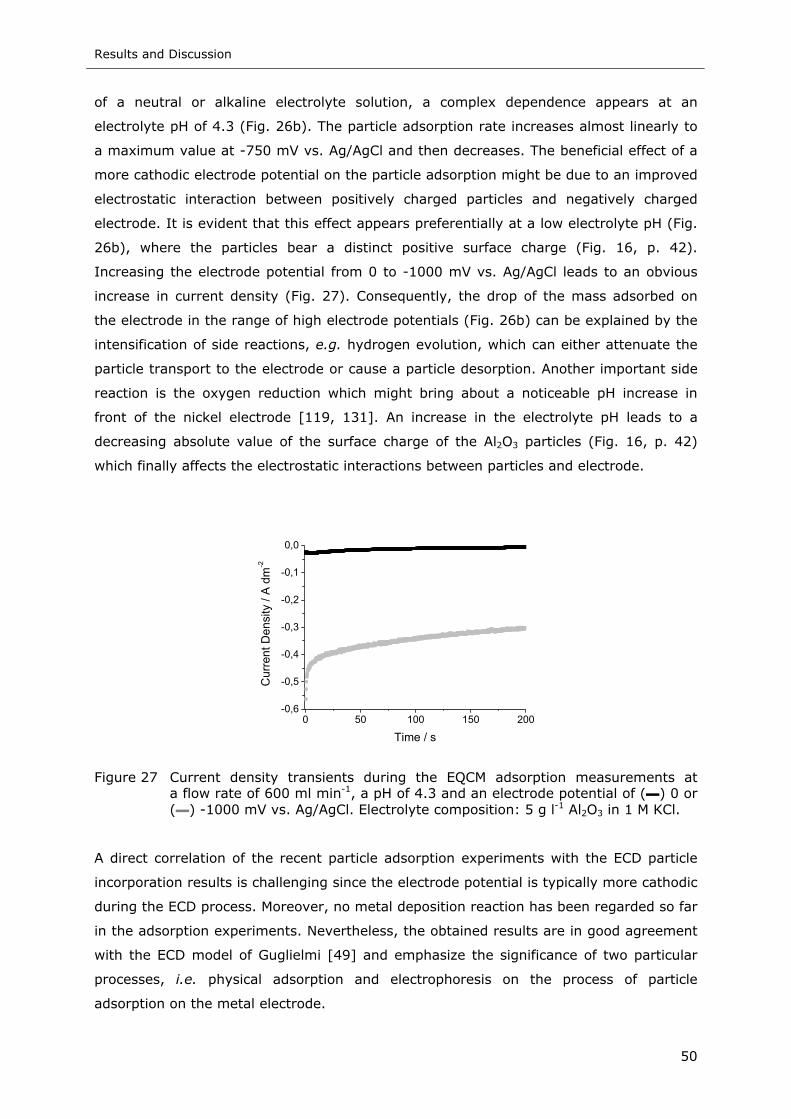
Results and Discussion
50
of a neutral or alkaline electrolyte solution, a complex dependence appears at an
electrolyte pH of 4.3 (Fig. 26b). The particle adsorption rate increases almost linearly to
a maximum value at -750 mV vs. Ag/AgCl and then decreases. The beneficial effect of a
more cathodic electrode potential on the particle adsorption might be due to an improved
electrostatic interaction between positively charged particles and negatively charged
electrode. It is evident that this effect appears preferentially at a low electrolyte pH (Fig.
26b), where the particles bear a distinct positive surface charge (Fig. 16, p. 42).
Increasing the electrode potential from 0 to -1000 mV vs. Ag/AgCl leads to an obvious
increase in current density (Fig. 27). Consequently, the drop of the mass adsorbed on
the electrode in the range of high electrode potentials (Fig. 26b) can be explained by the
intensification of side reactions, e.g. hydrogen evolution, which can either attenuate the
particle transport to the electrode or cause a particle desorption. Another important side
reaction is the oxygen reduction which might bring about a noticeable pH increase in
front of the nickel electrode [119, 131]. An increase in the electrolyte pH leads to a
decreasing absolute value of the surface charge of the Al2O3 particles (Fig. 16, p. 42)
which finally affects the electrostatic interactions between particles and electrode.
0 50 100 150 200-0,6
-0,5
-0,4
-0,3
-0,2
-0,1
0,0
Cur
rent
Den
sity
/ A
dm-2
Time / s
Figure 27 Current density transients during the EQCM adsorption measurements at a flow rate of 600 ml min-1, a pH of 4.3 and an electrode potential of (▬) 0 or (▬) -1000 mV vs. Ag/AgCl. Electrolyte composition: 5 g l-1 Al2O3 in 1 M KCl.
A direct correlation of the recent particle adsorption experiments with the ECD particle
incorporation results is challenging since the electrode potential is typically more cathodic
during the ECD process. Moreover, no metal deposition reaction has been regarded so far
in the adsorption experiments. Nevertheless, the obtained results are in good agreement
with the ECD model of Guglielmi [49] and emphasize the significance of two particular
processes, i.e. physical adsorption and electrophoresis on the process of particle
adsorption on the metal electrode.
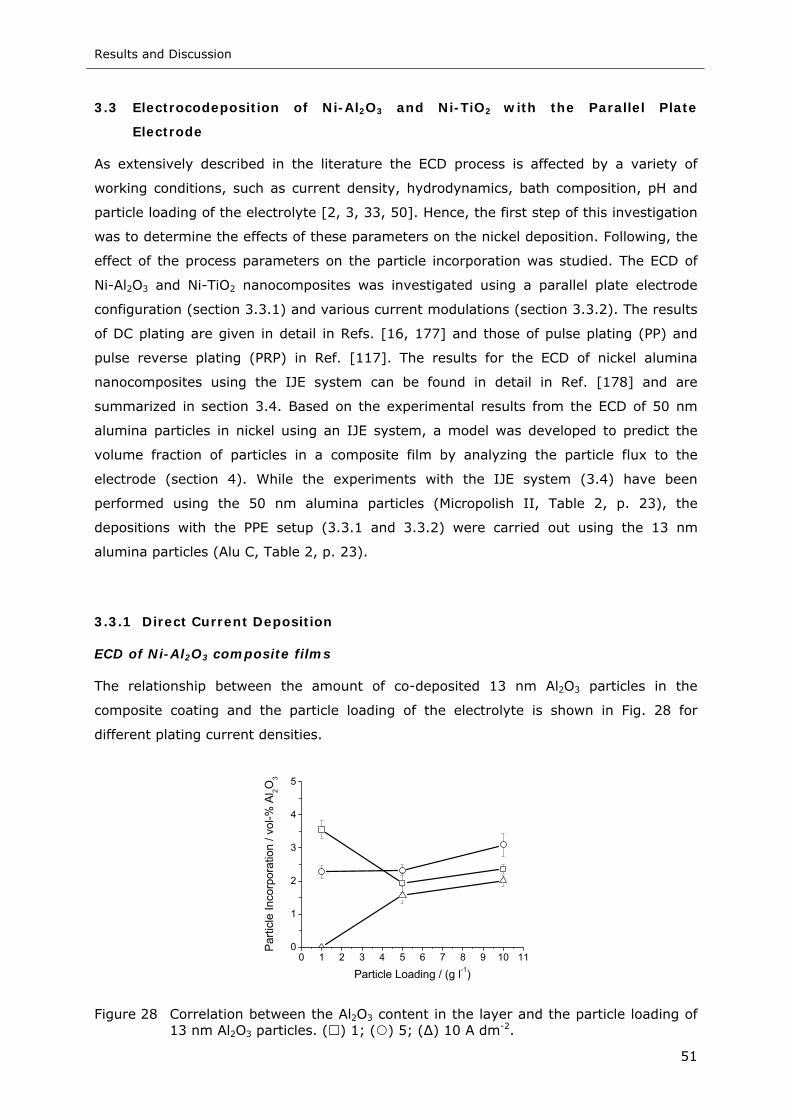
Results and Discussion
51
3.3 Electrocodeposition of Ni-Al2O3 and Ni-TiO2 with the Parallel Plate
Electrode
As extensively described in the literature the ECD process is affected by a variety of
working conditions, such as current density, hydrodynamics, bath composition, pH and
particle loading of the electrolyte [2, 3, 33, 50]. Hence, the first step of this investigation
was to determine the effects of these parameters on the nickel deposition. Following, the
effect of the process parameters on the particle incorporation was studied. The ECD of
Ni-Al2O3 and Ni-TiO2 nanocomposites was investigated using a parallel plate electrode
configuration (section 3.3.1) and various current modulations (section 3.3.2). The results
of DC plating are given in detail in Refs. [16, 177] and those of pulse plating (PP) and
pulse reverse plating (PRP) in Ref. [117]. The results for the ECD of nickel alumina
nanocomposites using the IJE system can be found in detail in Ref. [178] and are
summarized in section 3.4. Based on the experimental results from the ECD of 50 nm
alumina particles in nickel using an IJE system, a model was developed to predict the
volume fraction of particles in a composite film by analyzing the particle flux to the
electrode (section 4). While the experiments with the IJE system (3.4) have been
performed using the 50 nm alumina particles (Micropolish II, Table 2, p. 23), the
depositions with the PPE setup (3.3.1 and 3.3.2) were carried out using the 13 nm
alumina particles (Alu C, Table 2, p. 23).
3.3.1 Direct Current Deposition
ECD of Ni-Al2O3 composite films
The relationship between the amount of co-deposited 13 nm Al2O3 particles in the
composite coating and the particle loading of the electrolyte is shown in Fig. 28 for
different plating current densities.
0 1 2 3 4 5 6 7 8 9 10 110
1
2
3
4
5
Par
ticle
Inco
rpor
atio
n / v
ol-%
Al 2O
3
Particle Loading / (g l-1)
Figure 28 Correlation between the Al2O3 content in the layer and the particle loading of 13 nm Al2O3 particles. ( ) 1; ( ) 5; (∆) 10 A dm-2.
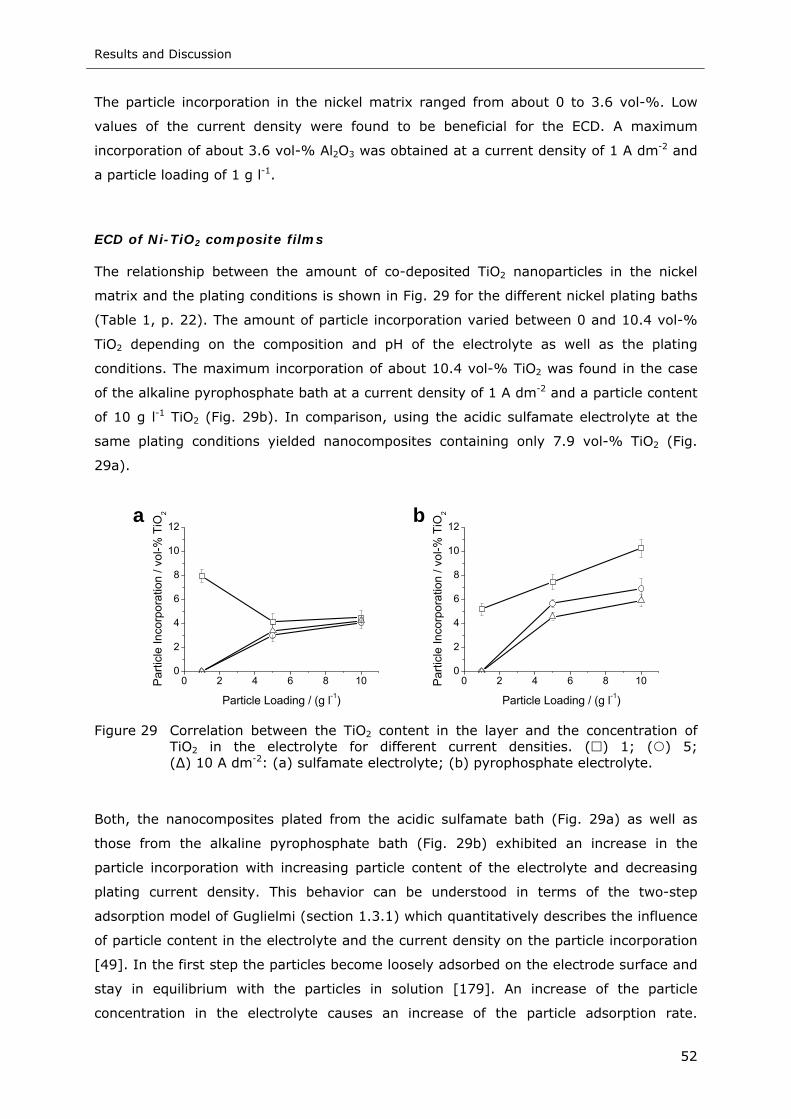
Results and Discussion
52
The particle incorporation in the nickel matrix ranged from about 0 to 3.6 vol-%. Low
values of the current density were found to be beneficial for the ECD. A maximum
incorporation of about 3.6 vol-% Al2O3 was obtained at a current density of 1 A dm-2 and
a particle loading of 1 g l-1.
ECD of Ni-TiO2 composite films
The relationship between the amount of co-deposited TiO2 nanoparticles in the nickel
matrix and the plating conditions is shown in Fig. 29 for the different nickel plating baths
(Table 1, p. 22). The amount of particle incorporation varied between 0 and 10.4 vol-%
TiO2 depending on the composition and pH of the electrolyte as well as the plating
conditions. The maximum incorporation of about 10.4 vol-% TiO2 was found in the case
of the alkaline pyrophosphate bath at a current density of 1 A dm-2 and a particle content
of 10 g l-1 TiO2 (Fig. 29b). In comparison, using the acidic sulfamate electrolyte at the
same plating conditions yielded nanocomposites containing only 7.9 vol-% TiO2 (Fig.
29a).
0 2 4 6 8 100
2
4
6
8
10
12a
Par
ticle
Inco
rpor
atio
n / v
ol-%
TiO
2
Particle Loading / (g l-1)
0 2 4 6 8 100
2
4
6
8
10
12b
Par
ticle
Inco
rpor
atio
n / v
ol-%
TiO
2
Particle Loading / (g l-1)
Figure 29 Correlation between the TiO2 content in the layer and the concentration of TiO2 in the electrolyte for different current densities. ( ) 1; ( ) 5; (∆) 10 A dm-2: (a) sulfamate electrolyte; (b) pyrophosphate electrolyte.
Both, the nanocomposites plated from the acidic sulfamate bath (Fig. 29a) as well as
those from the alkaline pyrophosphate bath (Fig. 29b) exhibited an increase in the
particle incorporation with increasing particle content of the electrolyte and decreasing
plating current density. This behavior can be understood in terms of the two-step
adsorption model of Guglielmi (section 1.3.1) which quantitatively describes the influence
of particle content in the electrolyte and the current density on the particle incorporation
[49]. In the first step the particles become loosely adsorbed on the electrode surface and
stay in equilibrium with the particles in solution [179]. An increase of the particle
concentration in the electrolyte causes an increase of the particle adsorption rate.
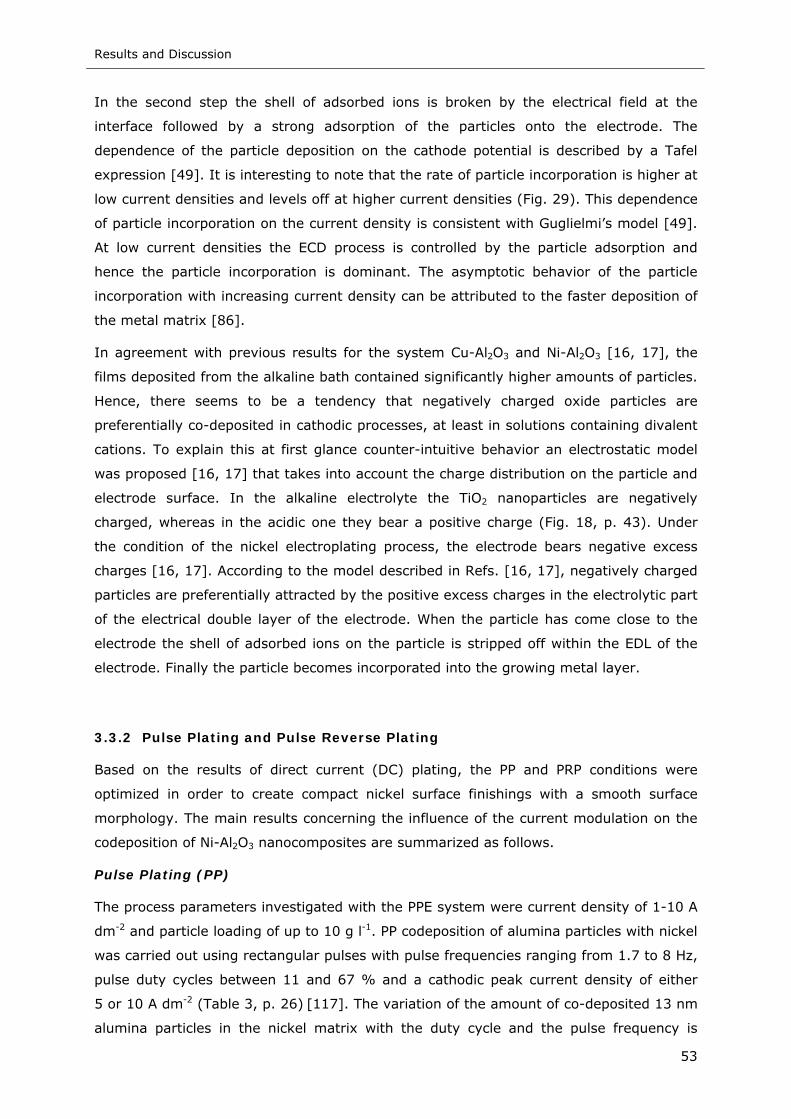
Results and Discussion
53
In the second step the shell of adsorbed ions is broken by the electrical field at the
interface followed by a strong adsorption of the particles onto the electrode. The
dependence of the particle deposition on the cathode potential is described by a Tafel
expression [49]. It is interesting to note that the rate of particle incorporation is higher at
low current densities and levels off at higher current densities (Fig. 29). This dependence
of particle incorporation on the current density is consistent with Guglielmi’s model [49].
At low current densities the ECD process is controlled by the particle adsorption and
hence the particle incorporation is dominant. The asymptotic behavior of the particle
incorporation with increasing current density can be attributed to the faster deposition of
the metal matrix [86].
In agreement with previous results for the system Cu-Al2O3 and Ni-Al2O3 [16, 17], the
films deposited from the alkaline bath contained significantly higher amounts of particles.
Hence, there seems to be a tendency that negatively charged oxide particles are
preferentially co-deposited in cathodic processes, at least in solutions containing divalent
cations. To explain this at first glance counter-intuitive behavior an electrostatic model
was proposed [16, 17] that takes into account the charge distribution on the particle and
electrode surface. In the alkaline electrolyte the TiO2 nanoparticles are negatively
charged, whereas in the acidic one they bear a positive charge (Fig. 18, p. 43). Under
the condition of the nickel electroplating process, the electrode bears negative excess
charges [16, 17]. According to the model described in Refs. [16, 17], negatively charged
particles are preferentially attracted by the positive excess charges in the electrolytic part
of the electrical double layer of the electrode. When the particle has come close to the
electrode the shell of adsorbed ions on the particle is stripped off within the EDL of the
electrode. Finally the particle becomes incorporated into the growing metal layer.
3.3.2 Pulse Plating and Pulse Reverse Plating
Based on the results of direct current (DC) plating, the PP and PRP conditions were
optimized in order to create compact nickel surface finishings with a smooth surface
morphology. The main results concerning the influence of the current modulation on the
codeposition of Ni-Al2O3 nanocomposites are summarized as follows.
Pulse Plating (PP)
The process parameters investigated with the PPE system were current density of 1-10 A
dm-2 and particle loading of up to 10 g l-1. PP codeposition of alumina particles with nickel
was carried out using rectangular pulses with pulse frequencies ranging from 1.7 to 8 Hz,
pulse duty cycles between 11 and 67 % and a cathodic peak current density of either
5 or 10 A dm-2 (Table 3, p. 26) [117]. The variation of the amount of co-deposited 13 nm
alumina particles in the nickel matrix with the duty cycle and the pulse frequency is
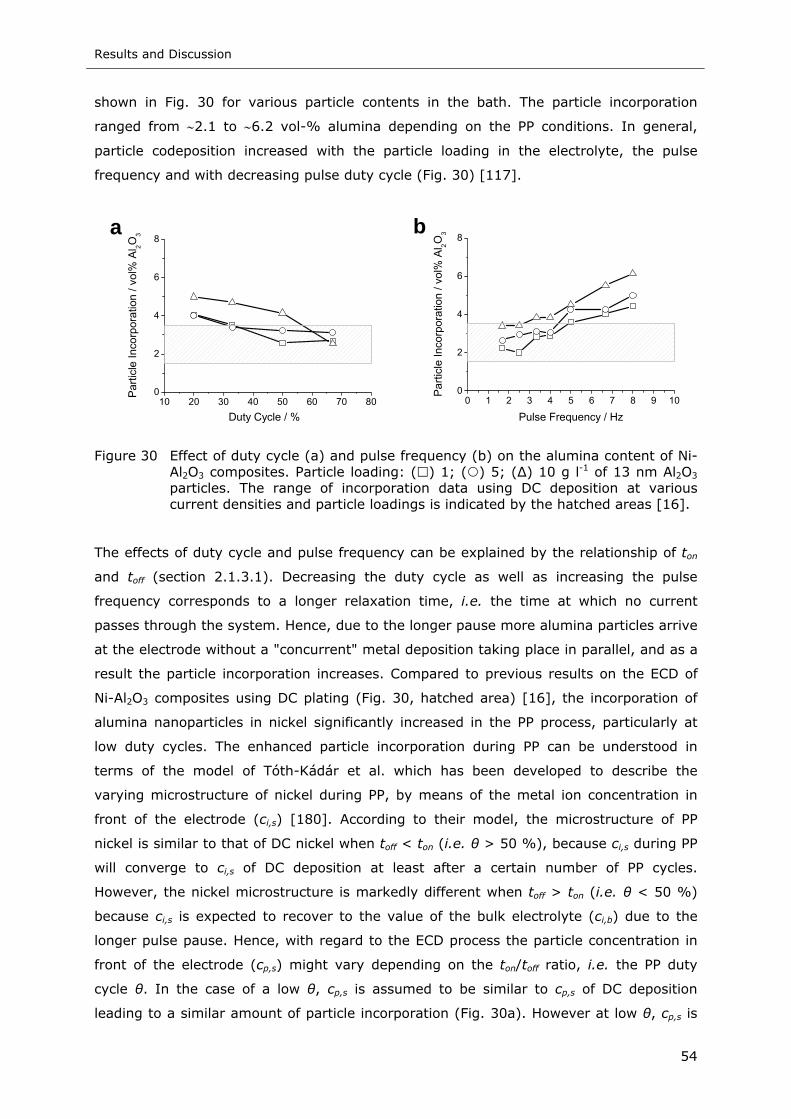
Results and Discussion
54
shown in Fig. 30 for various particle contents in the bath. The particle incorporation
ranged from ∼2.1 to ∼6.2 vol-% alumina depending on the PP conditions. In general,
particle codeposition increased with the particle loading in the electrolyte, the pulse
frequency and with decreasing pulse duty cycle (Fig. 30) [117].
10 20 30 40 50 60 70 800
2
4
6
8a
Par
ticle
Inco
rpor
atio
n / v
ol%
Al 2O
3
Duty Cycle / %
0 1 2 3 4 5 6 7 8 9 100
2
4
6
8b
Par
ticle
Inco
rpor
atio
n / v
ol%
Al 2O
3
Pulse Frequency / Hz
Figure 30 Effect of duty cycle (a) and pulse frequency (b) on the alumina content of Ni-Al2O3 composites. Particle loading: ( ) 1; ( ) 5; (∆) 10 g l-1 of 13 nm Al2O3 particles. The range of incorporation data using DC deposition at various current densities and particle loadings is indicated by the hatched areas [16].
The effects of duty cycle and pulse frequency can be explained by the relationship of ton
and toff (section 2.1.3.1). Decreasing the duty cycle as well as increasing the pulse
frequency corresponds to a longer relaxation time, i.e. the time at which no current
passes through the system. Hence, due to the longer pause more alumina particles arrive
at the electrode without a "concurrent" metal deposition taking place in parallel, and as a
result the particle incorporation increases. Compared to previous results on the ECD of
Ni-Al2O3 composites using DC plating (Fig. 30, hatched area) [16], the incorporation of
alumina nanoparticles in nickel significantly increased in the PP process, particularly at
low duty cycles. The enhanced particle incorporation during PP can be understood in
terms of the model of Tóth-Kádár et al. which has been developed to describe the
varying microstructure of nickel during PP, by means of the metal ion concentration in
front of the electrode (ci,s) [180]. According to their model, the microstructure of PP
nickel is similar to that of DC nickel when toff < ton (i.e. θ > 50 %), because ci,s during PP
will converge to ci,s of DC deposition at least after a certain number of PP cycles.
However, the nickel microstructure is markedly different when toff > ton (i.e. θ < 50 %)
because ci,s is expected to recover to the value of the bulk electrolyte (ci,b) due to the
longer pulse pause. Hence, with regard to the ECD process the particle concentration in
front of the electrode (cp,s) might vary depending on the ton/toff ratio, i.e. the PP duty
cycle θ. In the case of a low θ, cp,s is assumed to be similar to cp,s of DC deposition
leading to a similar amount of particle incorporation (Fig. 30a). However at low θ, cp,s is
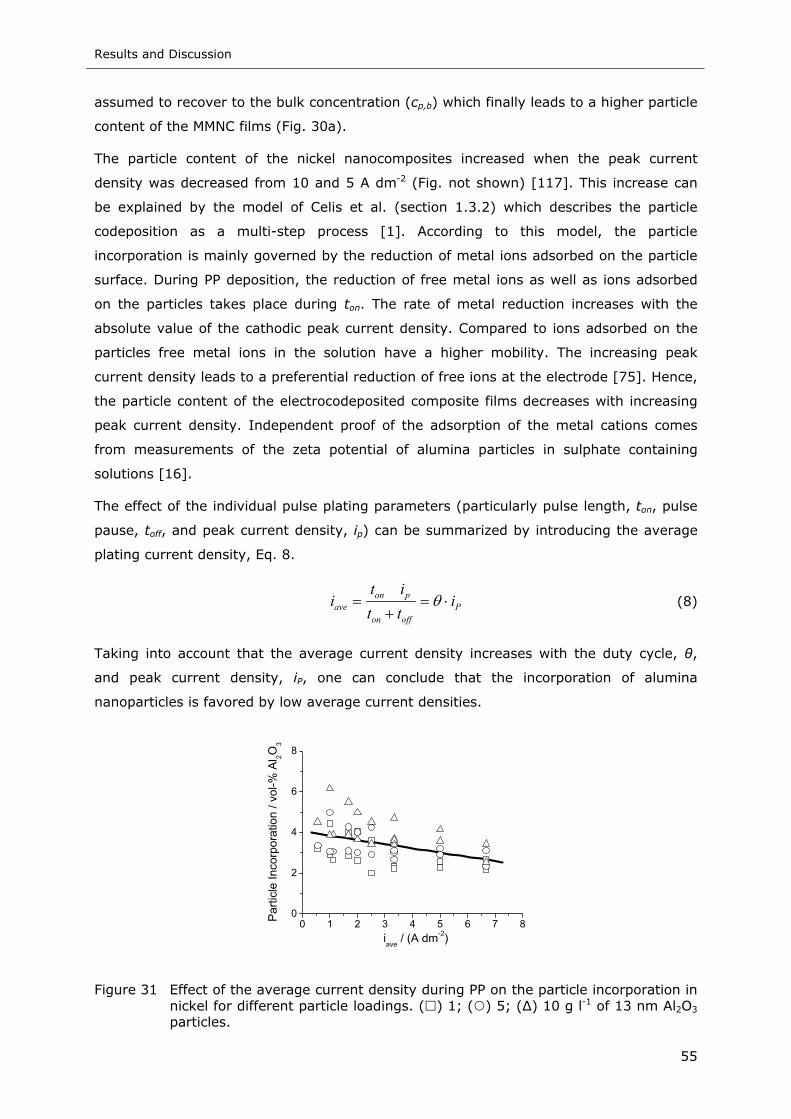
Results and Discussion
55
assumed to recover to the bulk concentration (cp,b) which finally leads to a higher particle
content of the MMNC films (Fig. 30a).
The particle content of the nickel nanocomposites increased when the peak current
density was decreased from 10 and 5 A dm-2 (Fig. not shown) [117]. This increase can
be explained by the model of Celis et al. (section 1.3.2) which describes the particle
codeposition as a multi-step process [1]. According to this model, the particle
incorporation is mainly governed by the reduction of metal ions adsorbed on the particle
surface. During PP deposition, the reduction of free metal ions as well as ions adsorbed
on the particles takes place during ton. The rate of metal reduction increases with the
absolute value of the cathodic peak current density. Compared to ions adsorbed on the
particles free metal ions in the solution have a higher mobility. The increasing peak
current density leads to a preferential reduction of free ions at the electrode [75]. Hence,
the particle content of the electrocodeposited composite films decreases with increasing
peak current density. Independent proof of the adsorption of the metal cations comes
from measurements of the zeta potential of alumina particles in sulphate containing
solutions [16].
The effect of the individual pulse plating parameters (particularly pulse length, ton, pulse
pause, toff, and peak current density, ip) can be summarized by introducing the average
plating current density, Eq. 8.
Poffon
ponave i
ttit
i ⋅=+
= θ (8)
Taking into account that the average current density increases with the duty cycle, θ,
and peak current density, iP, one can conclude that the incorporation of alumina
nanoparticles is favored by low average current densities.
0 1 2 3 4 5 6 7 80
2
4
6
8
Par
ticle
Inco
rpor
atio
n / v
ol-%
Al 2O
3
iave / (A dm-2)
Figure 31 Effect of the average current density during PP on the particle incorporation in nickel for different particle loadings. ( ) 1; ( ) 5; (∆) 10 g l-1 of 13 nm Al2O3 particles.
Results and Discussion
56
Figure 31 illustrates the particle content of the composites prepared by PP from
electrolytes with loadings ranging from 1 to 10 g l-1 of 13 nm γ-Al2O3 particles. Particle
incorporation showed a tendency to increase with decreasing average plating current
density. A maximum incorporation of about 6.2 vol-% Al2O3 was found at an average
current density of ∼1 A dm-2 and a particle loading of 10 g l-1. Similar to the described
behavior, the highest incorporation in the case of DC plating of 3.6 vol-% Al2O3 in nickel
was found at a relatively low current density of 1 A dm-2 [16].
Pulse Reverse Plating (PRP)
As a preliminary test of the PRP experiments, polarization curves of a freshly prepared
composite layer in the acidic sulfamate bath were measured using a platinum RDE [117].
Particularly, the anodic branch was significantly affected by the presence of alumina
nanoparticles; a shift of the anodic dissolution peak to more cathodic potentials and an
obvious increase of the anodic dissolution current density were observed [74, 97, 117].
The magnitude of both, the shift of the peak as well as the increased anodic current
density strongly depends on the alumina concentration in the electrolyte and on the
rotation rate of the electrode. Thus, due to an increasing particle loading from 1 g l-1 to
5 g l-1 Al2O3 the maximum stripping current was found to increase from ∼0.8 A dm-2 to
∼4.9 A dm-2 [117].
The particle content of the nickel based composites plated by PRP is shown in Fig. 32 for
different cathodic pulse lengths between 50 and 400 ms. For comparison, the average
particle incorporation during DC plating is indicated in the figure by the hatched area
[16]. The incorporation of 13 nm Al2O3 particles is obviously enhanced by longer cathodic
pulse times as well as lower anodic peak current densities (Fig. 32).
0 100 200 300 4000
2
4
6
8
10
12
Parti
cle
Inco
rpor
atio
n / v
ol-%
Al 2O
3
ton / ms
Figure 32 Effect of cathodic pulse time during PRP on the particle content of Ni-Al2O3 composites prepared at trev=20 ms from electrolytes containing 10 g l-1 of 13 nm Al2O3 particles. ip=5 A dm-2: ( ) ian=1 A dm-2; ( ) ian=5 A dm-2; ip=10 A dm-2: ( ) ian=1 A dm-2; ( ) ian=5 A dm-2. The range of incorporation data using PPE configuration at various current densities and particle loadings of 13 nm Al2O3 particles is indicated by the hatched area [16].
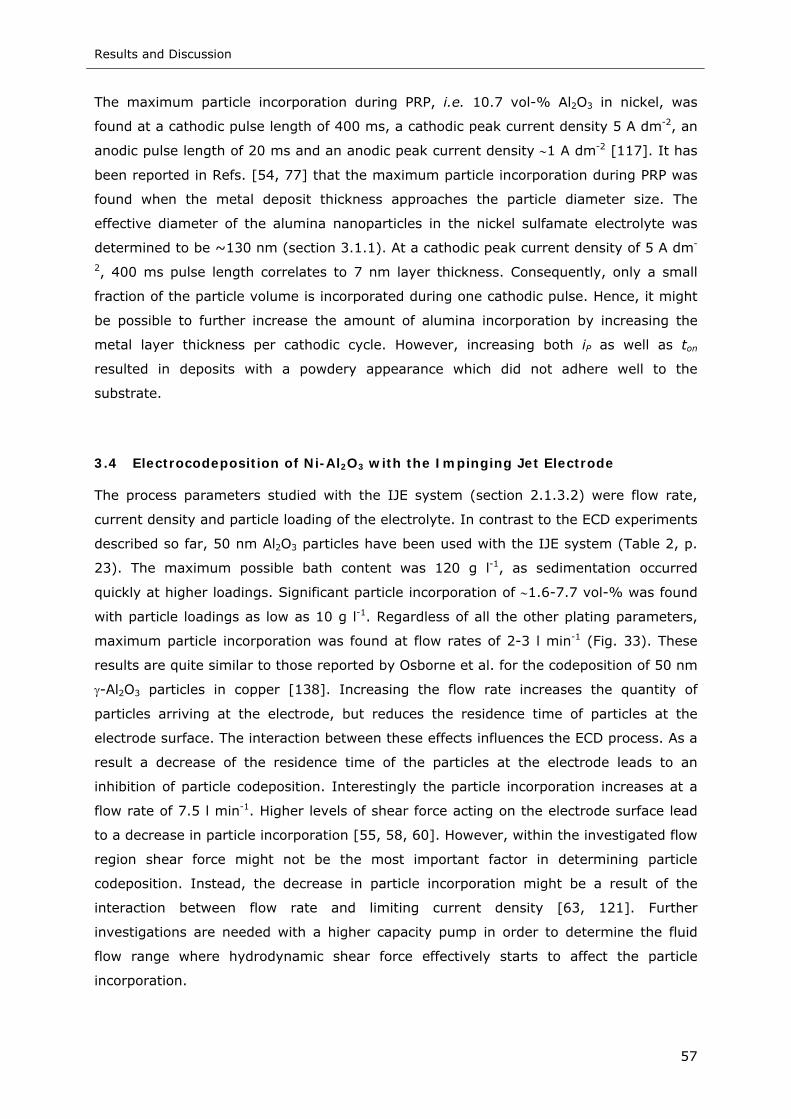
Results and Discussion
57
The maximum particle incorporation during PRP, i.e. 10.7 vol-% Al2O3 in nickel, was
found at a cathodic pulse length of 400 ms, a cathodic peak current density 5 A dm-2, an
anodic pulse length of 20 ms and an anodic peak current density ∼1 A dm-2 [117]. It has
been reported in Refs. [54, 77] that the maximum particle incorporation during PRP was
found when the metal deposit thickness approaches the particle diameter size. The
effective diameter of the alumina nanoparticles in the nickel sulfamate electrolyte was
determined to be ~130 nm (section 3.1.1). At a cathodic peak current density of 5 A dm-
2, 400 ms pulse length correlates to 7 nm layer thickness. Consequently, only a small
fraction of the particle volume is incorporated during one cathodic pulse. Hence, it might
be possible to further increase the amount of alumina incorporation by increasing the
metal layer thickness per cathodic cycle. However, increasing both iP as well as ton
resulted in deposits with a powdery appearance which did not adhere well to the
substrate.
3.4 Electrocodeposition of Ni-Al2O3 with the Impinging Jet Electrode
The process parameters studied with the IJE system (section 2.1.3.2) were flow rate,
current density and particle loading of the electrolyte. In contrast to the ECD experiments
described so far, 50 nm Al2O3 particles have been used with the IJE system (Table 2, p.
23). The maximum possible bath content was 120 g l-1, as sedimentation occurred
quickly at higher loadings. Significant particle incorporation of ∼1.6-7.7 vol-% was found
with particle loadings as low as 10 g l-1. Regardless of all the other plating parameters,
maximum particle incorporation was found at flow rates of 2-3 l min-1 (Fig. 33). These
results are quite similar to those reported by Osborne et al. for the codeposition of 50 nm
γ-Al2O3 particles in copper [138]. Increasing the flow rate increases the quantity of
particles arriving at the electrode, but reduces the residence time of particles at the
electrode surface. The interaction between these effects influences the ECD process. As a
result a decrease of the residence time of the particles at the electrode leads to an
inhibition of particle codeposition. Interestingly the particle incorporation increases at a
flow rate of 7.5 l min-1. Higher levels of shear force acting on the electrode surface lead
to a decrease in particle incorporation [55, 58, 60]. However, within the investigated flow
region shear force might not be the most important factor in determining particle
codeposition. Instead, the decrease in particle incorporation might be a result of the
interaction between flow rate and limiting current density [63, 121]. Further
investigations are needed with a higher capacity pump in order to determine the fluid
flow range where hydrodynamic shear force effectively starts to affect the particle
incorporation.
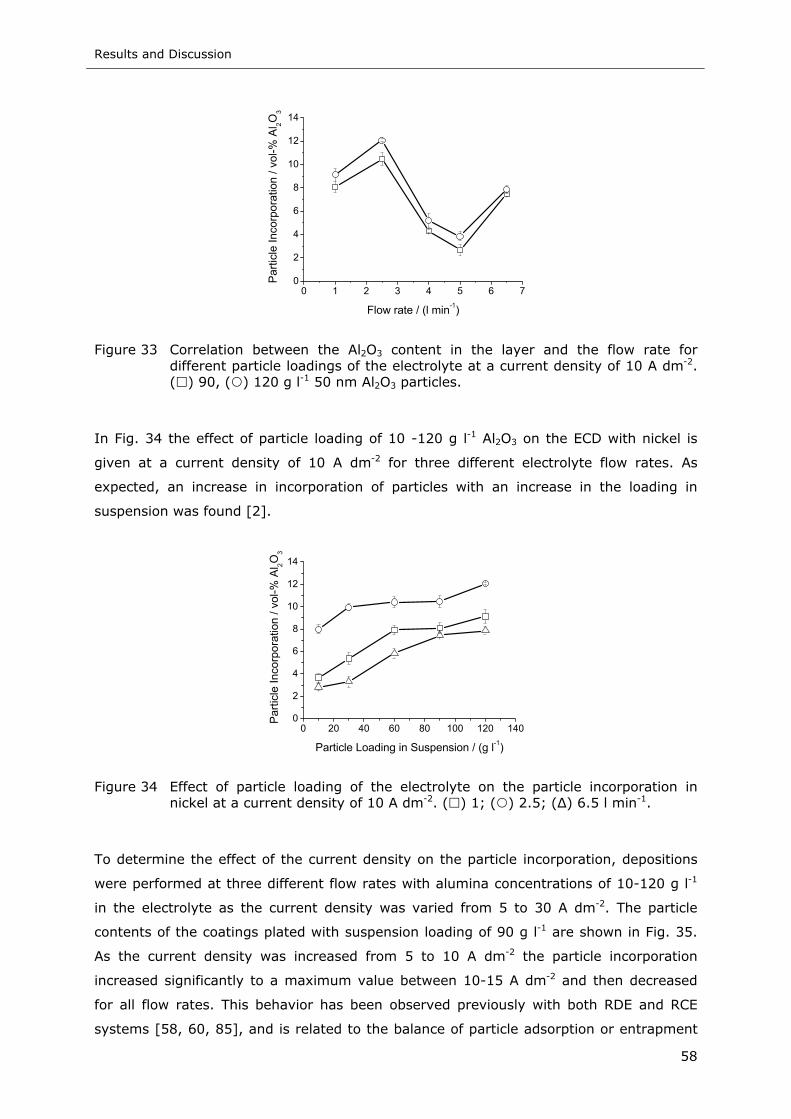
Results and Discussion
58
0 1 2 3 4 5 6 70
2
4
6
8
10
12
14
Parti
cle
Inco
rpor
atio
n / v
ol-%
Al 2O
3
Flow rate / (l min-1)
Figure 33 Correlation between the Al2O3 content in the layer and the flow rate for different particle loadings of the electrolyte at a current density of 10 A dm-2. ( ) 90, ( ) 120 g l-1 50 nm Al2O3 particles.
In Fig. 34 the effect of particle loading of 10 -120 g l-1 Al2O3 on the ECD with nickel is
given at a current density of 10 A dm-2 for three different electrolyte flow rates. As
expected, an increase in incorporation of particles with an increase in the loading in
suspension was found [2].
0 20 40 60 80 100 120 1400
2
4
6
8
10
12
14
Parti
cle
Inco
rpor
atio
n / v
ol-%
Al 2O
3
Particle Loading in Suspension / (g l-1)
Figure 34 Effect of particle loading of the electrolyte on the particle incorporation in nickel at a current density of 10 A dm-2. ( ) 1; ( ) 2.5; (∆) 6.5 l min-1.
To determine the effect of the current density on the particle incorporation, depositions
were performed at three different flow rates with alumina concentrations of 10-120 g l-1
in the electrolyte as the current density was varied from 5 to 30 A dm-2. The particle
contents of the coatings plated with suspension loading of 90 g l-1 are shown in Fig. 35.
As the current density was increased from 5 to 10 A dm-2 the particle incorporation
increased significantly to a maximum value between 10-15 A dm-2 and then decreased
for all flow rates. This behavior has been observed previously with both RDE and RCE
systems [58, 60, 85], and is related to the balance of particle adsorption or entrapment
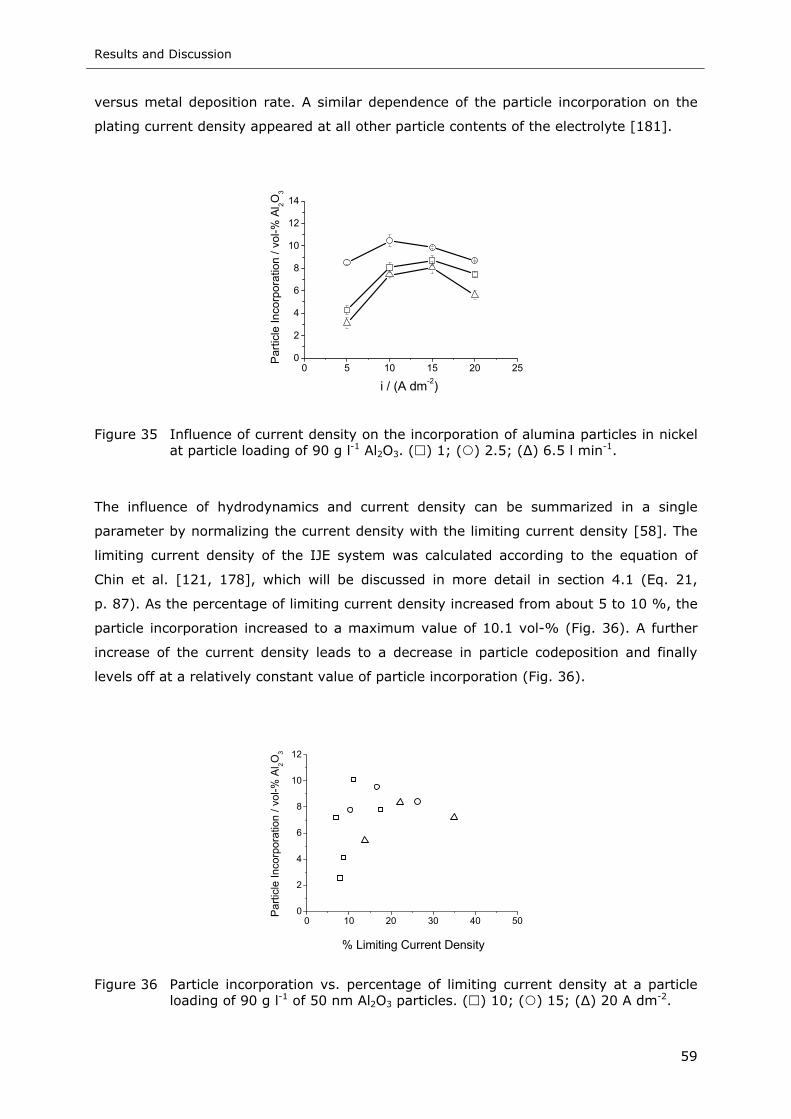
Results and Discussion
59
versus metal deposition rate. A similar dependence of the particle incorporation on the
plating current density appeared at all other particle contents of the electrolyte [181].
0 5 10 15 20 250
2
4
6
8
10
12
14
Par
ticle
Inco
rpor
atio
n / v
ol-%
Al 2O
3
i / (A dm-2)
Figure 35 Influence of current density on the incorporation of alumina particles in nickel at particle loading of 90 g l-1 Al2O3. ( ) 1; ( ) 2.5; (∆) 6.5 l min-1.
The influence of hydrodynamics and current density can be summarized in a single
parameter by normalizing the current density with the limiting current density [58]. The
limiting current density of the IJE system was calculated according to the equation of
Chin et al. [121, 178], which will be discussed in more detail in section 4.1 (Eq. 21,
p. 87). As the percentage of limiting current density increased from about 5 to 10 %, the
particle incorporation increased to a maximum value of 10.1 vol-% (Fig. 36). A further
increase of the current density leads to a decrease in particle codeposition and finally
levels off at a relatively constant value of particle incorporation (Fig. 36).
0 10 20 30 40 500
2
4
6
8
10
12
Parti
cle
Inco
rpor
atio
n / v
ol-%
Al 2O
3
% Limiting Current Density
Figure 36 Particle incorporation vs. percentage of limiting current density at a particle loading of 90 g l-1 of 50 nm Al2O3 particles. ( ) 10; ( ) 15; (∆) 20 A dm-2.
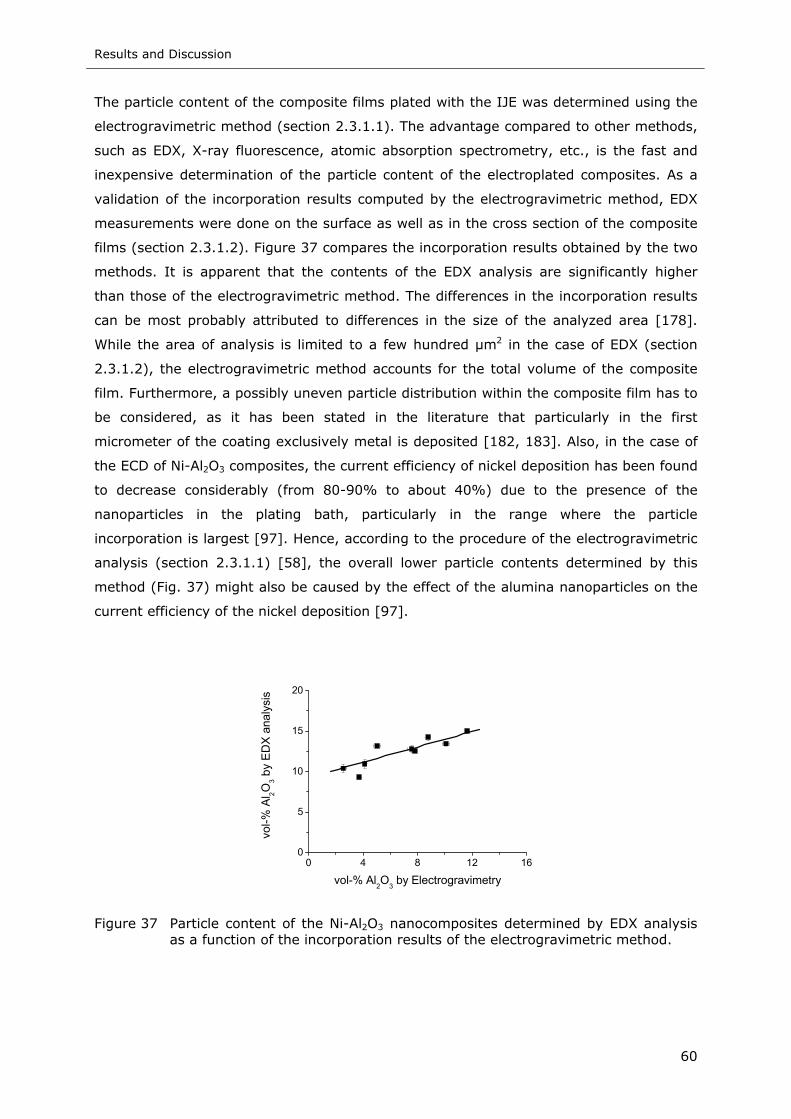
Results and Discussion
60
The particle content of the composite films plated with the IJE was determined using the
electrogravimetric method (section 2.3.1.1). The advantage compared to other methods,
such as EDX, X-ray fluorescence, atomic absorption spectrometry, etc., is the fast and
inexpensive determination of the particle content of the electroplated composites. As a
validation of the incorporation results computed by the electrogravimetric method, EDX
measurements were done on the surface as well as in the cross section of the composite
films (section 2.3.1.2). Figure 37 compares the incorporation results obtained by the two
methods. It is apparent that the contents of the EDX analysis are significantly higher
than those of the electrogravimetric method. The differences in the incorporation results
can be most probably attributed to differences in the size of the analyzed area [178].
While the area of analysis is limited to a few hundred µm2 in the case of EDX (section
2.3.1.2), the electrogravimetric method accounts for the total volume of the composite
film. Furthermore, a possibly uneven particle distribution within the composite film has to
be considered, as it has been stated in the literature that particularly in the first
micrometer of the coating exclusively metal is deposited [182, 183]. Also, in the case of
the ECD of Ni-Al2O3 composites, the current efficiency of nickel deposition has been found
to decrease considerably (from 80-90% to about 40%) due to the presence of the
nanoparticles in the plating bath, particularly in the range where the particle
incorporation is largest [97]. Hence, according to the procedure of the electrogravimetric
analysis (section 2.3.1.1) [58], the overall lower particle contents determined by this
method (Fig. 37) might also be caused by the effect of the alumina nanoparticles on the
current efficiency of the nickel deposition [97].
0 4 8 12 160
5
10
15
20
vol-%
Al 2O
3 by
ED
X a
naly
sis
vol-% Al2O3 by Electrogravimetry
Figure 37 Particle content of the Ni-Al2O3 nanocomposites determined by EDX analysis as a function of the incorporation results of the electrogravimetric method.
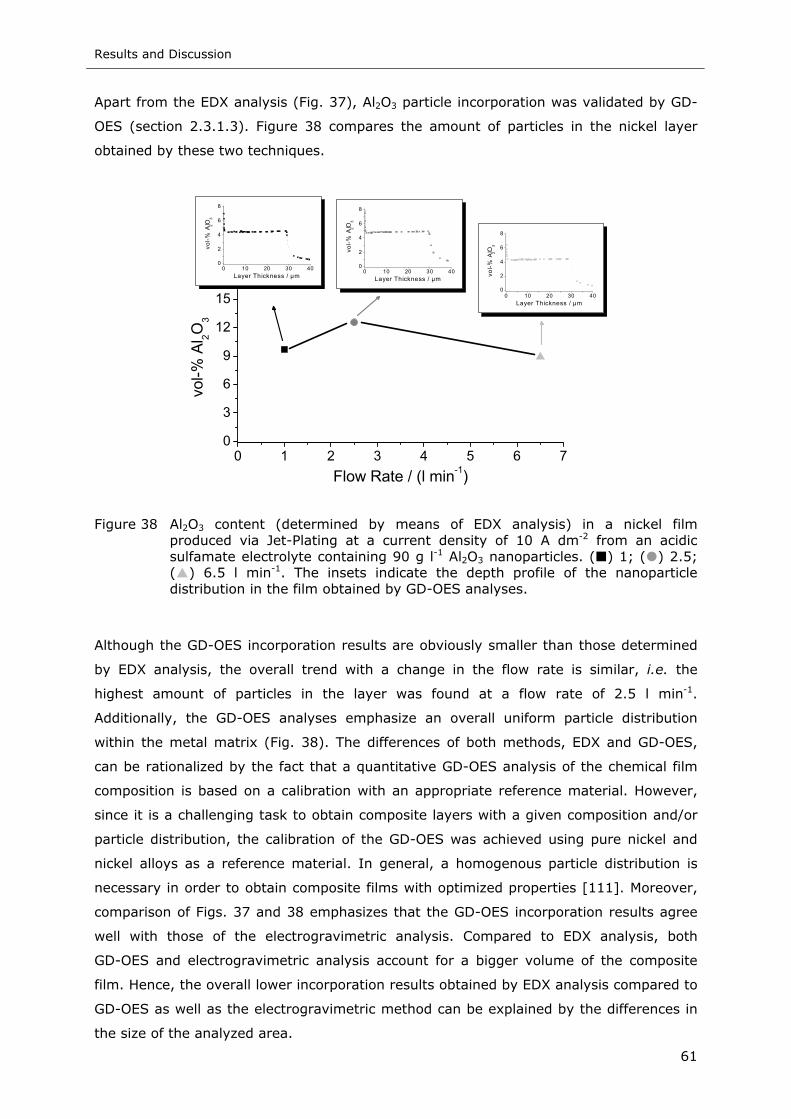
Results and Discussion
61
Apart from the EDX analysis (Fig. 37), Al2O3 particle incorporation was validated by GD-
OES (section 2.3.1.3). Figure 38 compares the amount of particles in the nickel layer
obtained by these two techniques.
0 1 2 3 4 5 6 70
3
6
9
12
15 0 10 20 30 400
2
4
6
8
vol-%
Al 2O
3
Layer Thickness / µm
0 10 20 30 400
2
4
6
8vo
l-% A
l 2O3
Layer Thickness / µm0 10 20 30 40
0
2
4
6
8
vol-%
Al 2O
3
Layer Thickness / µm
vol-%
Al 2O
3
Flow Rate / (l min-1)
Figure 38 Al2O3 content (determined by means of EDX analysis) in a nickel film produced via Jet-Plating at a current density of 10 A dm-2 from an acidic sulfamate electrolyte containing 90 g l-1 Al2O3 nanoparticles. ( ) 1; ( ) 2.5; ( ) 6.5 l min-1. The insets indicate the depth profile of the nanoparticle distribution in the film obtained by GD-OES analyses.
Although the GD-OES incorporation results are obviously smaller than those determined
by EDX analysis, the overall trend with a change in the flow rate is similar, i.e. the
highest amount of particles in the layer was found at a flow rate of 2.5 l min-1.
Additionally, the GD-OES analyses emphasize an overall uniform particle distribution
within the metal matrix (Fig. 38). The differences of both methods, EDX and GD-OES,
can be rationalized by the fact that a quantitative GD-OES analysis of the chemical film
composition is based on a calibration with an appropriate reference material. However,
since it is a challenging task to obtain composite layers with a given composition and/or
particle distribution, the calibration of the GD-OES was achieved using pure nickel and
nickel alloys as a reference material. In general, a homogenous particle distribution is
necessary in order to obtain composite films with optimized properties [111]. Moreover,
comparison of Figs. 37 and 38 emphasizes that the GD-OES incorporation results agree
well with those of the electrogravimetric analysis. Compared to EDX analysis, both
GD-OES and electrogravimetric analysis account for a bigger volume of the composite
film. Hence, the overall lower incorporation results obtained by EDX analysis compared to
GD-OES as well as the electrogravimetric method can be explained by the differences in
the size of the analyzed area.
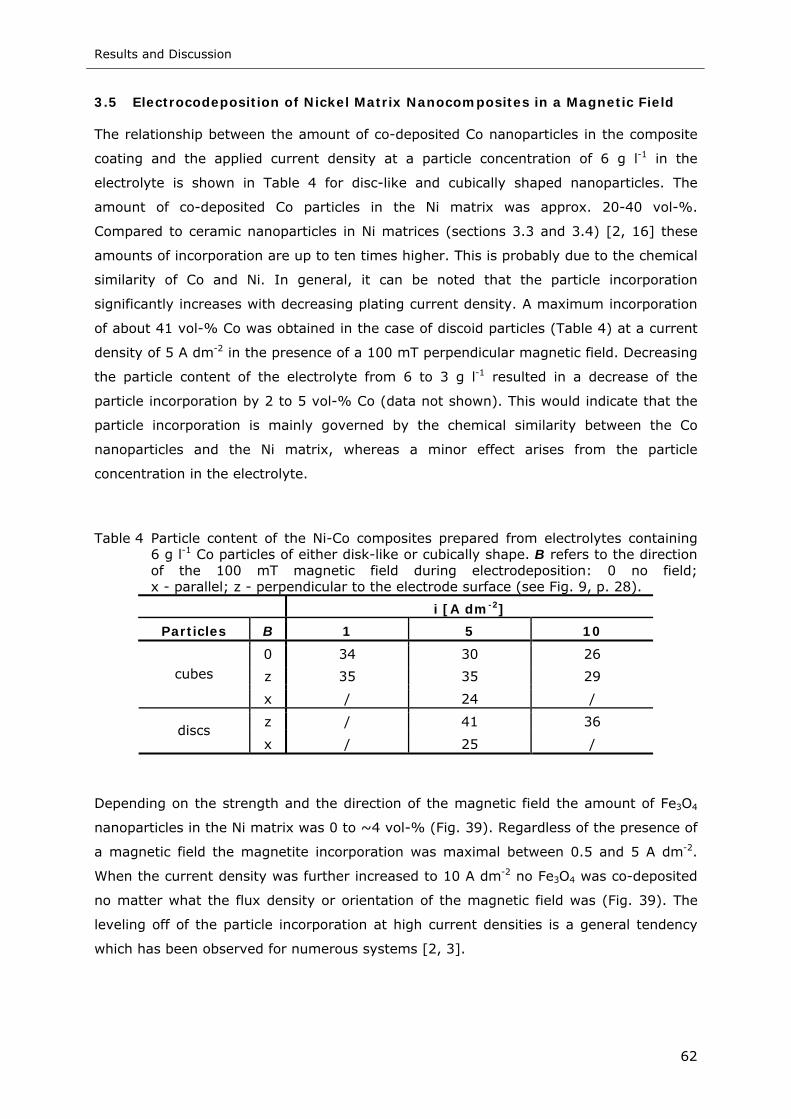
Results and Discussion
62
3.5 Electrocodeposition of Nickel Matrix Nanocomposites in a Magnetic Field
The relationship between the amount of co-deposited Co nanoparticles in the composite
coating and the applied current density at a particle concentration of 6 g l-1 in the
electrolyte is shown in Table 4 for disc-like and cubically shaped nanoparticles. The
amount of co-deposited Co particles in the Ni matrix was approx. 20-40 vol-%.
Compared to ceramic nanoparticles in Ni matrices (sections 3.3 and 3.4) [2, 16] these
amounts of incorporation are up to ten times higher. This is probably due to the chemical
similarity of Co and Ni. In general, it can be noted that the particle incorporation
significantly increases with decreasing plating current density. A maximum incorporation
of about 41 vol-% Co was obtained in the case of discoid particles (Table 4) at a current
density of 5 A dm-2 in the presence of a 100 mT perpendicular magnetic field. Decreasing
the particle content of the electrolyte from 6 to 3 g l-1 resulted in a decrease of the
particle incorporation by 2 to 5 vol-% Co (data not shown). This would indicate that the
particle incorporation is mainly governed by the chemical similarity between the Co
nanoparticles and the Ni matrix, whereas a minor effect arises from the particle
concentration in the electrolyte.
Table 4 Particle content of the Ni-Co composites prepared from electrolytes containing 6 g l-1 Co particles of either disk-like or cubically shape. B refers to the direction of the 100 mT magnetic field during electrodeposition: 0 no field; x - parallel; z - perpendicular to the electrode surface (see Fig. 9, p. 28).
i [A dm-2]
Particles B 1 5 10
0 34 30 26
z 35 35 29 cubes
x / 24 /
z / 41 36 discs
x / 25 /
Depending on the strength and the direction of the magnetic field the amount of Fe3O4
nanoparticles in the Ni matrix was 0 to ~4 vol-% (Fig. 39). Regardless of the presence of
a magnetic field the magnetite incorporation was maximal between 0.5 and 5 A dm-2.
When the current density was further increased to 10 A dm-2 no Fe3O4 was co-deposited
no matter what the flux density or orientation of the magnetic field was (Fig. 39). The
leveling off of the particle incorporation at high current densities is a general tendency
which has been observed for numerous systems [2, 3].
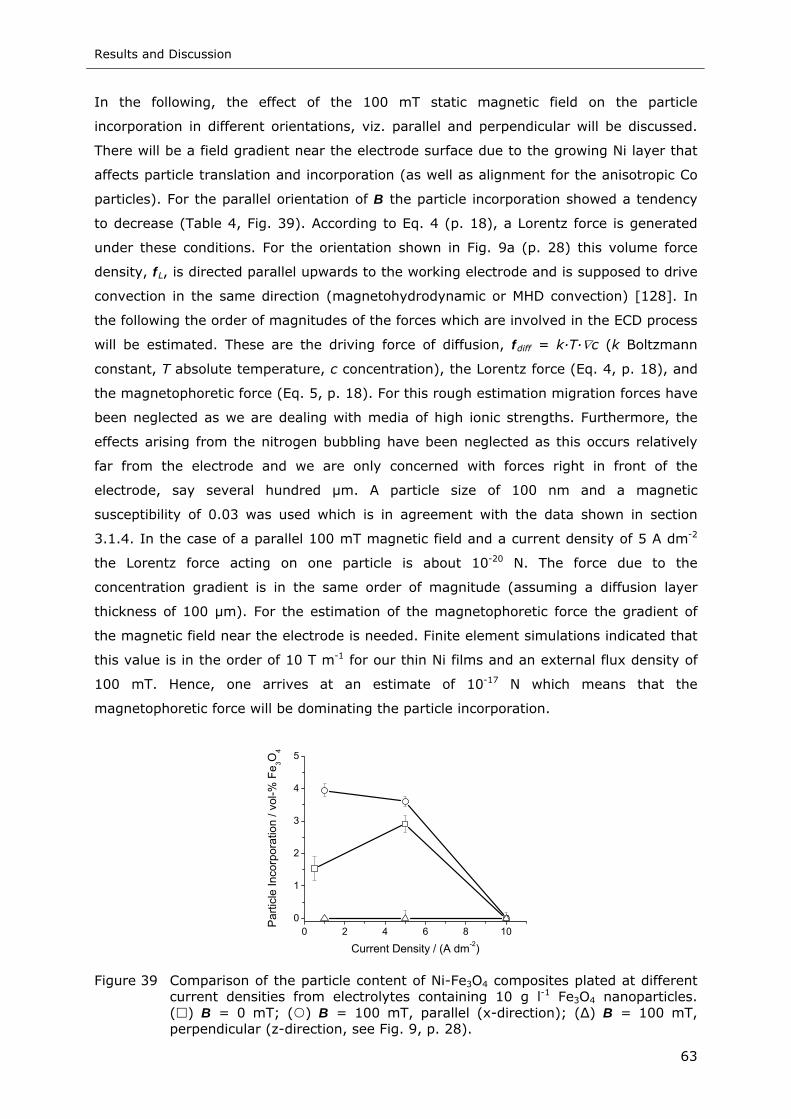
Results and Discussion
63
In the following, the effect of the 100 mT static magnetic field on the particle
incorporation in different orientations, viz. parallel and perpendicular will be discussed.
There will be a field gradient near the electrode surface due to the growing Ni layer that
affects particle translation and incorporation (as well as alignment for the anisotropic Co
particles). For the parallel orientation of B the particle incorporation showed a tendency
to decrease (Table 4, Fig. 39). According to Eq. 4 (p. 18), a Lorentz force is generated
under these conditions. For the orientation shown in Fig. 9a (p. 28) this volume force
density, fL, is directed parallel upwards to the working electrode and is supposed to drive
convection in the same direction (magnetohydrodynamic or MHD convection) [128]. In
the following the order of magnitudes of the forces which are involved in the ECD process
will be estimated. These are the driving force of diffusion, fdiff = k·T·∇c (k Boltzmann
constant, T absolute temperature, c concentration), the Lorentz force (Eq. 4, p. 18), and
the magnetophoretic force (Eq. 5, p. 18). For this rough estimation migration forces have
been neglected as we are dealing with media of high ionic strengths. Furthermore, the
effects arising from the nitrogen bubbling have been neglected as this occurs relatively
far from the electrode and we are only concerned with forces right in front of the
electrode, say several hundred µm. A particle size of 100 nm and a magnetic
susceptibility of 0.03 was used which is in agreement with the data shown in section
3.1.4. In the case of a parallel 100 mT magnetic field and a current density of 5 A dm-2
the Lorentz force acting on one particle is about 10-20 N. The force due to the
concentration gradient is in the same order of magnitude (assuming a diffusion layer
thickness of 100 µm). For the estimation of the magnetophoretic force the gradient of
the magnetic field near the electrode is needed. Finite element simulations indicated that
this value is in the order of 10 T m-1 for our thin Ni films and an external flux density of
100 mT. Hence, one arrives at an estimate of 10-17 N which means that the
magnetophoretic force will be dominating the particle incorporation.
0 2 4 6 8 100
1
2
3
4
5
Parti
cle
Inco
rpor
atio
n / v
ol-%
Fe 3O
4
Current Density / (A dm-2)
Figure 39 Comparison of the particle content of Ni-Fe3O4 composites plated at different
current densities from electrolytes containing 10 g l-1 Fe3O4 nanoparticles. ( ) B = 0 mT; ( ) B = 100 mT, parallel (x-direction); (∆) B = 100 mT, perpendicular (z-direction, see Fig. 9, p. 28).
Results and Discussion
64
Regardless of the particle type and shape, an increase of incorporation was found in the
case of a perpendicular magnetic field (Table 4, Fig. 39). In a perpendicular magnetic
field only weak magnetohydrodynamic electrolyte motion should occur because there is
essentially no Lorentz force (Fig. 9b, p. 28; the cross product in Eq. 4, p. 18, yields
zero). Note, that in a real electrochemical cell there will be always components of the
current which are perpendicular to B (e.g. at the edges of the electrode) and therefore
small contributions from the Lorentz force. However, the main effect should arise from
the magnetic nanoparticles moving along the gradient of the B-field which is directed
towards the working electrode as indicated by the trajectory fmp in Fig. 9b. As a result,
the particle concentration in front of the electrode is expected to increase, leading to
enhanced particle incorporation. These considerations are in perfect agreement with the
above estimations of the order of magnitudes of the forces and the experimental particle
incorporation data (Table 4, Fig. 39). When B is applied in the z-direction (Fig. 9b, p.
28), increased particle incorporation was observed, provided the current density is not
too high.
At a first glance one could expect that this magnetophoretic particle transport should also
be active for the parallel B-field (i.e. aligned in x-direction, Fig. 9a, p. 28) because due to
the presence of the magnetic field the growing Ni layer should be magnetized and thus
attract the magnetic nanoparticles. However, the data in Table 4 and Fig. 39 clearly show
that for this orientation fewer particles are co-deposited, in the case of magnetite none at
all (Fig. 39). For this case the estimation of fmp becomes complicated due to term (B ∇) B
which involves the external and local B fields. Another contribution comes from the
perpendicular electrolyte flow that is induced by the Lorentz force and carries particles
away from the electrode (dotted lines denoted "MHD" in Fig. 9a, p. 28). Additional finite
element simulations of the electrochemical cell will be necessary to estimate the
trajectories of the nanoparticles near the surface for all orientations of B and j.
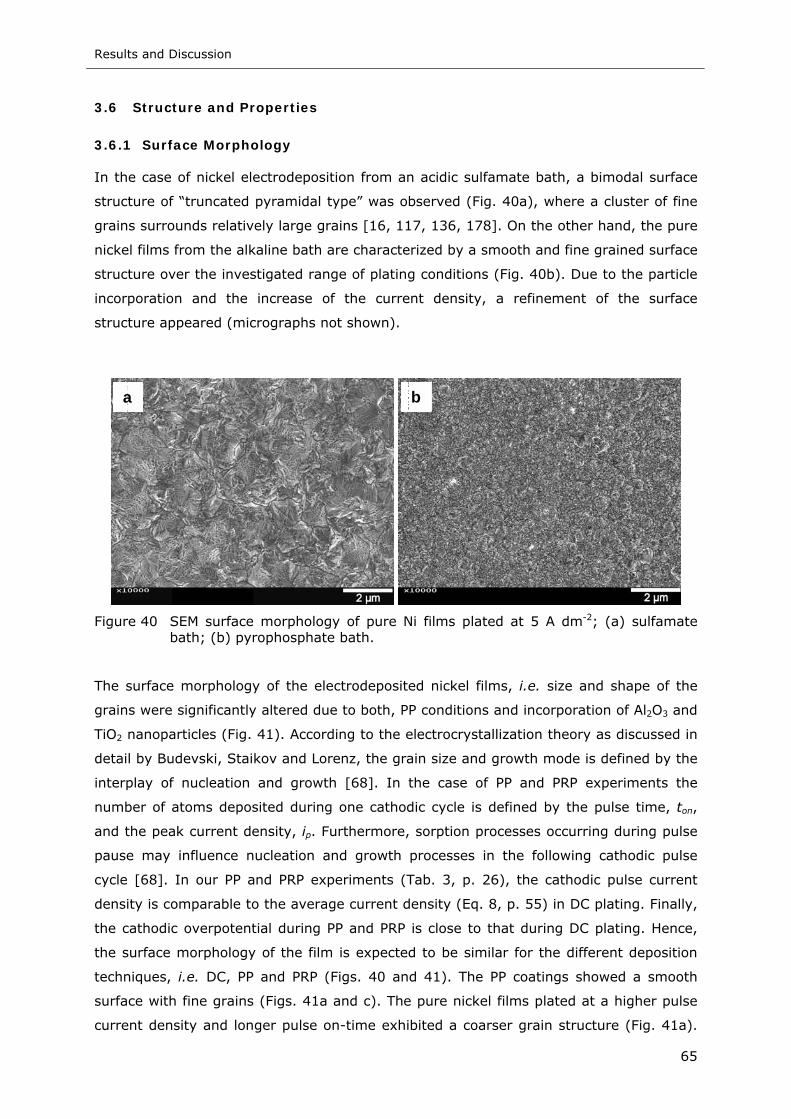
Results and Discussion
65
3.6 Structure and Properties
3.6.1 Surface Morphology
In the case of nickel electrodeposition from an acidic sulfamate bath, a bimodal surface
structure of “truncated pyramidal type” was observed (Fig. 40a), where a cluster of fine
grains surrounds relatively large grains [16, 117, 136, 178]. On the other hand, the pure
nickel films from the alkaline bath are characterized by a smooth and fine grained surface
structure over the investigated range of plating conditions (Fig. 40b). Due to the particle
incorporation and the increase of the current density, a refinement of the surface
structure appeared (micrographs not shown).
Figure 40 SEM surface morphology of pure Ni films plated at 5 A dm-2; (a) sulfamate bath; (b) pyrophosphate bath.
The surface morphology of the electrodeposited nickel films, i.e. size and shape of the
grains were significantly altered due to both, PP conditions and incorporation of Al2O3 and
TiO2 nanoparticles (Fig. 41). According to the electrocrystallization theory as discussed in
detail by Budevski, Staikov and Lorenz, the grain size and growth mode is defined by the
interplay of nucleation and growth [68]. In the case of PP and PRP experiments the
number of atoms deposited during one cathodic cycle is defined by the pulse time, ton,
and the peak current density, ip. Furthermore, sorption processes occurring during pulse
pause may influence nucleation and growth processes in the following cathodic pulse
cycle [68]. In our PP and PRP experiments (Tab. 3, p. 26), the cathodic pulse current
density is comparable to the average current density (Eq. 8, p. 55) in DC plating. Finally,
the cathodic overpotential during PP and PRP is close to that during DC plating. Hence,
the surface morphology of the film is expected to be similar for the different deposition
techniques, i.e. DC, PP and PRP (Figs. 40 and 41). The PP coatings showed a smooth
surface with fine grains (Figs. 41a and c). The pure nickel films plated at a higher pulse
current density and longer pulse on-time exhibited a coarser grain structure (Fig. 41a).
b a
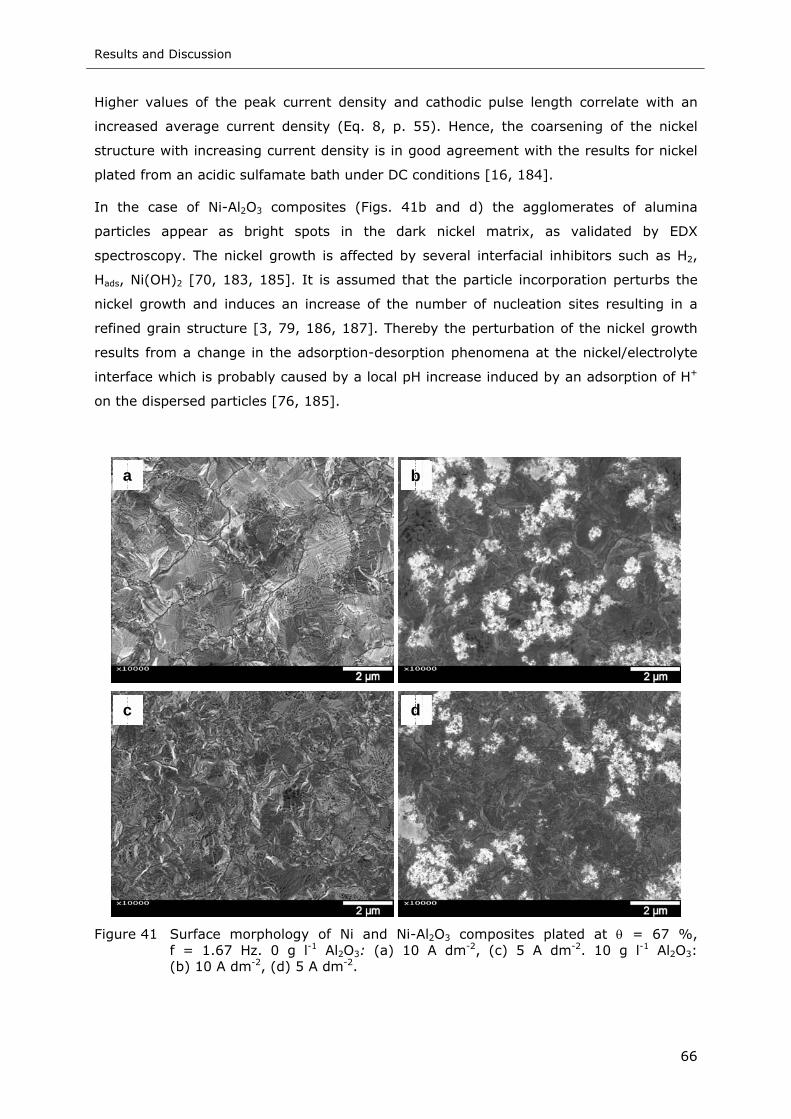
Results and Discussion
66
Higher values of the peak current density and cathodic pulse length correlate with an
increased average current density (Eq. 8, p. 55). Hence, the coarsening of the nickel
structure with increasing current density is in good agreement with the results for nickel
plated from an acidic sulfamate bath under DC conditions [16, 184].
In the case of Ni-Al2O3 composites (Figs. 41b and d) the agglomerates of alumina
particles appear as bright spots in the dark nickel matrix, as validated by EDX
spectroscopy. The nickel growth is affected by several interfacial inhibitors such as H2,
Hads, Ni(OH)2 [70, 183, 185]. It is assumed that the particle incorporation perturbs the
nickel growth and induces an increase of the number of nucleation sites resulting in a
refined grain structure [3, 79, 186, 187]. Thereby the perturbation of the nickel growth
results from a change in the adsorption-desorption phenomena at the nickel/electrolyte
interface which is probably caused by a local pH increase induced by an adsorption of H+
on the dispersed particles [76, 185].
Figure 41 Surface morphology of Ni and Ni-Al2O3 composites plated at θ = 67 %, f = 1.67 Hz. 0 g l-1 Al2O3: (a) 10 A dm-2, (c) 5 A dm-2. 10 g l-1 Al2O3: (b) 10 A dm-2, (d) 5 A dm-2.
b a
d c
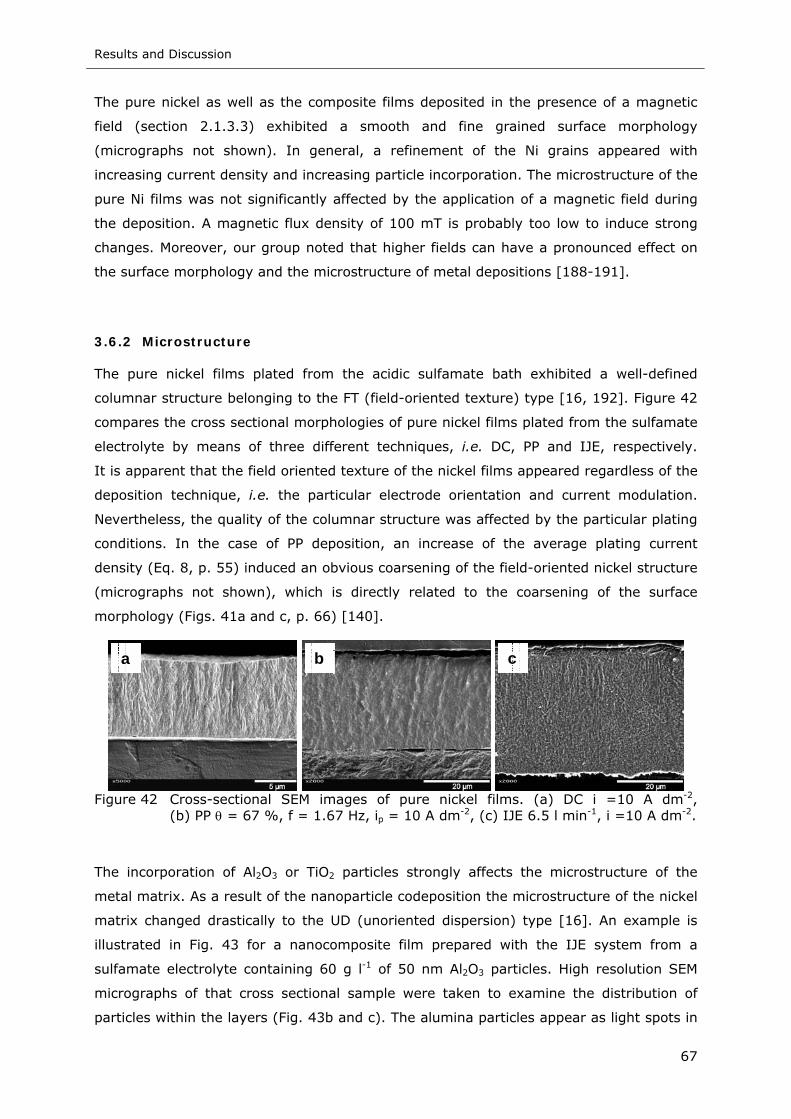
Results and Discussion
67
The pure nickel as well as the composite films deposited in the presence of a magnetic
field (section 2.1.3.3) exhibited a smooth and fine grained surface morphology
(micrographs not shown). In general, a refinement of the Ni grains appeared with
increasing current density and increasing particle incorporation. The microstructure of the
pure Ni films was not significantly affected by the application of a magnetic field during
the deposition. A magnetic flux density of 100 mT is probably too low to induce strong
changes. Moreover, our group noted that higher fields can have a pronounced effect on
the surface morphology and the microstructure of metal depositions [188-191].
3.6.2 Microstructure
The pure nickel films plated from the acidic sulfamate bath exhibited a well-defined
columnar structure belonging to the FT (field-oriented texture) type [16, 192]. Figure 42
compares the cross sectional morphologies of pure nickel films plated from the sulfamate
electrolyte by means of three different techniques, i.e. DC, PP and IJE, respectively.
It is apparent that the field oriented texture of the nickel films appeared regardless of the
deposition technique, i.e. the particular electrode orientation and current modulation.
Nevertheless, the quality of the columnar structure was affected by the particular plating
conditions. In the case of PP deposition, an increase of the average plating current
density (Eq. 8, p. 55) induced an obvious coarsening of the field-oriented nickel structure
(micrographs not shown), which is directly related to the coarsening of the surface
morphology (Figs. 41a and c, p. 66) [140].
Figure 42 Cross-sectional SEM images of pure nickel films. (a) DC i =10 A dm-2,
(b) PP θ = 67 %, f = 1.67 Hz, ip = 10 A dm-2, (c) IJE 6.5 l min-1, i =10 A dm-2.
The incorporation of Al2O3 or TiO2 particles strongly affects the microstructure of the
metal matrix. As a result of the nanoparticle codeposition the microstructure of the nickel
matrix changed drastically to the UD (unoriented dispersion) type [16]. An example is
illustrated in Fig. 43 for a nanocomposite film prepared with the IJE system from a
sulfamate electrolyte containing 60 g l-1 of 50 nm Al2O3 particles. High resolution SEM
micrographs of that cross sectional sample were taken to examine the distribution of
particles within the layers (Fig. 43b and c). The alumina particles appear as light spots in
b a c
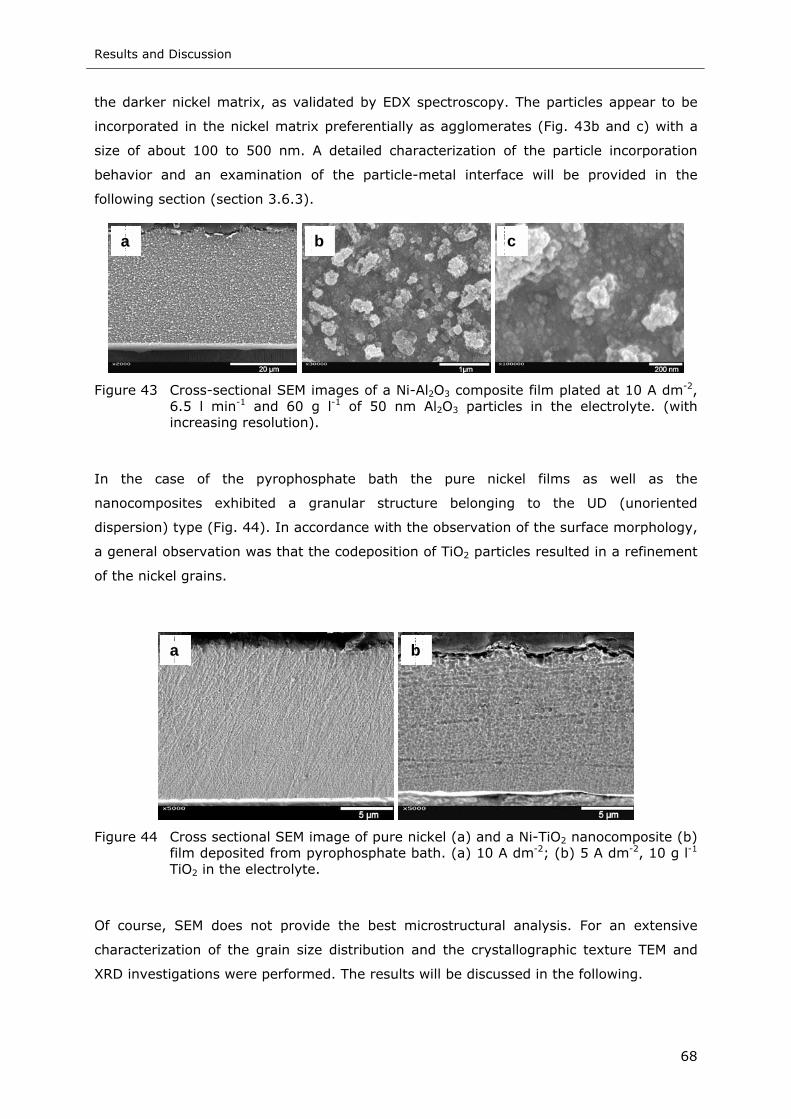
Results and Discussion
68
the darker nickel matrix, as validated by EDX spectroscopy. The particles appear to be
incorporated in the nickel matrix preferentially as agglomerates (Fig. 43b and c) with a
size of about 100 to 500 nm. A detailed characterization of the particle incorporation
behavior and an examination of the particle-metal interface will be provided in the
following section (section 3.6.3).
Figure 43 Cross-sectional SEM images of a Ni-Al2O3 composite film plated at 10 A dm-2, 6.5 l min-1 and 60 g l-1 of 50 nm Al2O3 particles in the electrolyte. (with increasing resolution).
In the case of the pyrophosphate bath the pure nickel films as well as the
nanocomposites exhibited a granular structure belonging to the UD (unoriented
dispersion) type (Fig. 44). In accordance with the observation of the surface morphology,
a general observation was that the codeposition of TiO2 particles resulted in a refinement
of the nickel grains.
Figure 44 Cross sectional SEM image of pure nickel (a) and a Ni-TiO2 nanocomposite (b) film deposited from pyrophosphate bath. (a) 10 A dm-2; (b) 5 A dm-2, 10 g l-1 TiO2 in the electrolyte.
Of course, SEM does not provide the best microstructural analysis. For an extensive
characterization of the grain size distribution and the crystallographic texture TEM and
XRD investigations were performed. The results will be discussed in the following.
b a c
b a
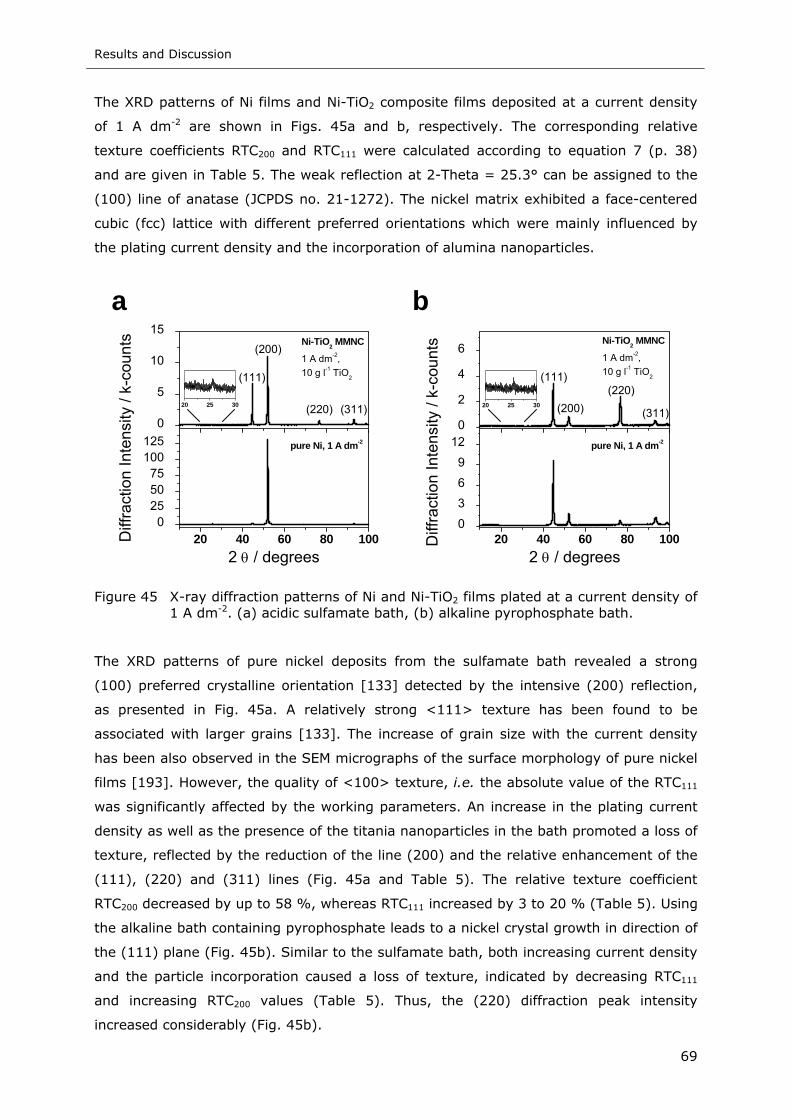
Results and Discussion
69
The XRD patterns of Ni films and Ni-TiO2 composite films deposited at a current density
of 1 A dm-2 are shown in Figs. 45a and b, respectively. The corresponding relative
texture coefficients RTC200 and RTC111 were calculated according to equation 7 (p. 38)
and are given in Table 5. The weak reflection at 2-Theta = 25.3° can be assigned to the
(100) line of anatase (JCPDS no. 21-1272). The nickel matrix exhibited a face-centered
cubic (fcc) lattice with different preferred orientations which were mainly influenced by
the plating current density and the incorporation of alumina nanoparticles.
20 40 60 80 1000
255075
100125
Diff
ract
ion
Inte
nsity
/ k-
coun
ts Ni-TiO2 MMNC
1 A dm-2,10 g l-1 TiO2
2 θ / degrees
pure Ni, 1 A dm-2
0
5
10
15
a
(111)
(200)
(311)(220)
20 40 60 80 1000369
12D
iffra
ctio
n In
tens
ity /
k-co
unts Ni-TiO2 MMNC
1 A dm-2,10 g l-1 TiO2
2 θ / degrees
pure Ni, 1 A dm-2
0
2
4
6
b
(200)
(111)
(311)
(220)
Figure 45 X-ray diffraction patterns of Ni and Ni-TiO2 films plated at a current density of 1 A dm-2. (a) acidic sulfamate bath, (b) alkaline pyrophosphate bath.
The XRD patterns of pure nickel deposits from the sulfamate bath revealed a strong
(100) preferred crystalline orientation [133] detected by the intensive (200) reflection,
as presented in Fig. 45a. A relatively strong <111> texture has been found to be
associated with larger grains [133]. The increase of grain size with the current density
has been also observed in the SEM micrographs of the surface morphology of pure nickel
films [193]. However, the quality of <100> texture, i.e. the absolute value of the RTC111
was significantly affected by the working parameters. An increase in the plating current
density as well as the presence of the titania nanoparticles in the bath promoted a loss of
texture, reflected by the reduction of the line (200) and the relative enhancement of the
(111), (220) and (311) lines (Fig. 45a and Table 5). The relative texture coefficient
RTC200 decreased by up to 58 %, whereas RTC111 increased by 3 to 20 % (Table 5). Using
the alkaline bath containing pyrophosphate leads to a nickel crystal growth in direction of
the (111) plane (Fig. 45b). Similar to the sulfamate bath, both increasing current density
and the particle incorporation caused a loss of texture, indicated by decreasing RTC111
and increasing RTC200 values (Table 5). Thus, the (220) diffraction peak intensity
increased considerably (Fig. 45b).
20 25 30
20 25 30
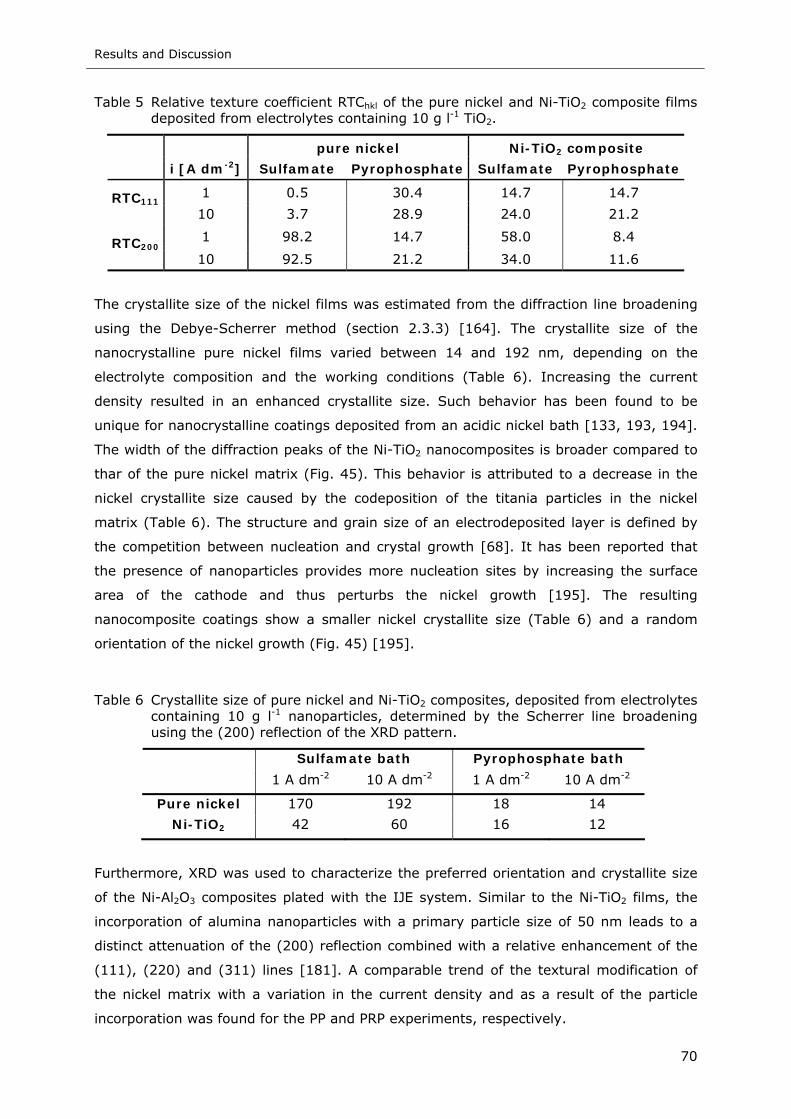
Results and Discussion
70
Table 5 Relative texture coefficient RTChkl of the pure nickel and Ni-TiO2 composite films deposited from electrolytes containing 10 g l-1 TiO2.
pure nickel Ni-TiO2 composite
i [A dm-2] Sulfamate Pyrophosphate Sulfamate Pyrophosphate
1 0.5 30.4 14.7 14.7 RTC111 10 3.7 28.9 24.0 21.2
1 98.2 14.7 58.0 8.4 RTC200 10 92.5 21.2 34.0 11.6
The crystallite size of the nickel films was estimated from the diffraction line broadening
using the Debye-Scherrer method (section 2.3.3) [164]. The crystallite size of the
nanocrystalline pure nickel films varied between 14 and 192 nm, depending on the
electrolyte composition and the working conditions (Table 6). Increasing the current
density resulted in an enhanced crystallite size. Such behavior has been found to be
unique for nanocrystalline coatings deposited from an acidic nickel bath [133, 193, 194].
The width of the diffraction peaks of the Ni-TiO2 nanocomposites is broader compared to
thar of the pure nickel matrix (Fig. 45). This behavior is attributed to a decrease in the
nickel crystallite size caused by the codeposition of the titania particles in the nickel
matrix (Table 6). The structure and grain size of an electrodeposited layer is defined by
the competition between nucleation and crystal growth [68]. It has been reported that
the presence of nanoparticles provides more nucleation sites by increasing the surface
area of the cathode and thus perturbs the nickel growth [195]. The resulting
nanocomposite coatings show a smaller nickel crystallite size (Table 6) and a random
orientation of the nickel growth (Fig. 45) [195].
Table 6 Crystallite size of pure nickel and Ni-TiO2 composites, deposited from electrolytes containing 10 g l-1 nanoparticles, determined by the Scherrer line broadening using the (200) reflection of the XRD pattern.
Sulfamate bath Pyrophosphate bath
1 A dm-2 10 A dm-2 1 A dm-2 10 A dm-2
Pure nickel 170 192 18 14
Ni-TiO2 42 60 16 12
Furthermore, XRD was used to characterize the preferred orientation and crystallite size
of the Ni-Al2O3 composites plated with the IJE system. Similar to the Ni-TiO2 films, the
incorporation of alumina nanoparticles with a primary particle size of 50 nm leads to a
distinct attenuation of the (200) reflection combined with a relative enhancement of the
(111), (220) and (311) lines [181]. A comparable trend of the textural modification of
the nickel matrix with a variation in the current density and as a result of the particle
incorporation was found for the PP and PRP experiments, respectively.
Results and Discussion
71
Using the IJE system, the crystallite size of a pure nickel film deposited at a flow rate of
2.5 l min-1 and a current density of 10 A dm-2 was about 115 nm. In comparison a nickel
alumina composite plated under the same working conditions from an electrolyte
containing 120 g l-1 showed a nickel crystallite size of about 30 nm. These crystallite
sizes are consistent with those determined for the pure nickel films plated with the PPE
system as well as with those of the Ni-TiO2 composite films (Table 6). It is interesting to
note, that high amounts of particle incorporation are not directly correlated with a small
nickel crystallite size. Rather, the crystallite size depends upon a variety of additional
plating parameters particularly the plating current density (Table 6).
3.6.3 Particle Incorporation Behavior
Materials properties of MMNC films depend mainly on particle distribution, their bonding
to the matrix and their influence on the microstructure of the metal matrix (section 1.5)
which has been characterized by TEM (section 2.3.2), STEM, SEM, QBSD and EBSD
(section 2.3.1.2). In this section, the electron microscopy results will be discussed for
two selected composite samples which have been prepared from a sulfamate bath
containing 10 g l-1 13 nm Al2O3 particles using the PPE system and either DC or PRP
(section 2.1.3.1). While the DC sample was prepared at 10 A dm-2, the PRP sample was
produced at iP=5 A dm-2, ton=400 ms and ian=1 A dm-2, trev=20 ms. For comparison, a
pure nickel film plated by PRP (same conditions as described above) was analyzed. The
crystallite size of the nickel films was estimated from the diffraction line broadening using
the Debye-Scherrer method (section 2.3.3) [164] as well as the electron backscattered
diffraction (EBSD) analysis. Typically, EBSD is a technique used for microstructural
characterization in materials science [160, 161]. However, compared to X-ray diffraction
experiments (section 2.3.3) which supplies wide-ranging texture information of the whole
film, EBSD illustrates local details of crystal growth at micron size [196]. Thus, this
technique is advantageous in studying the metal growth at the nickel-substrate interface
as well as around the co-deposited nanoparticles. Hence, the EBSD results have not been
presented in the previous section (section 3.6.2) because of their relevance to the
description of the particle incorporation behavior in the metal matrix which will be
discussed in the present section. EBSD maps were calculated after a minor clean up
excluding grain dilatation but comprising grain confidence index (CI) standardization with
2° tolerance angle and neighbour CI correlation and show the correctly indexed fraction
with CI > 0.1. Mean grain size parameters were derived from EBSD quality maps from
the lower part of the layer near the substrate and at the film surface. Twin boundaries
were considered and excluded for grain size evaluation.
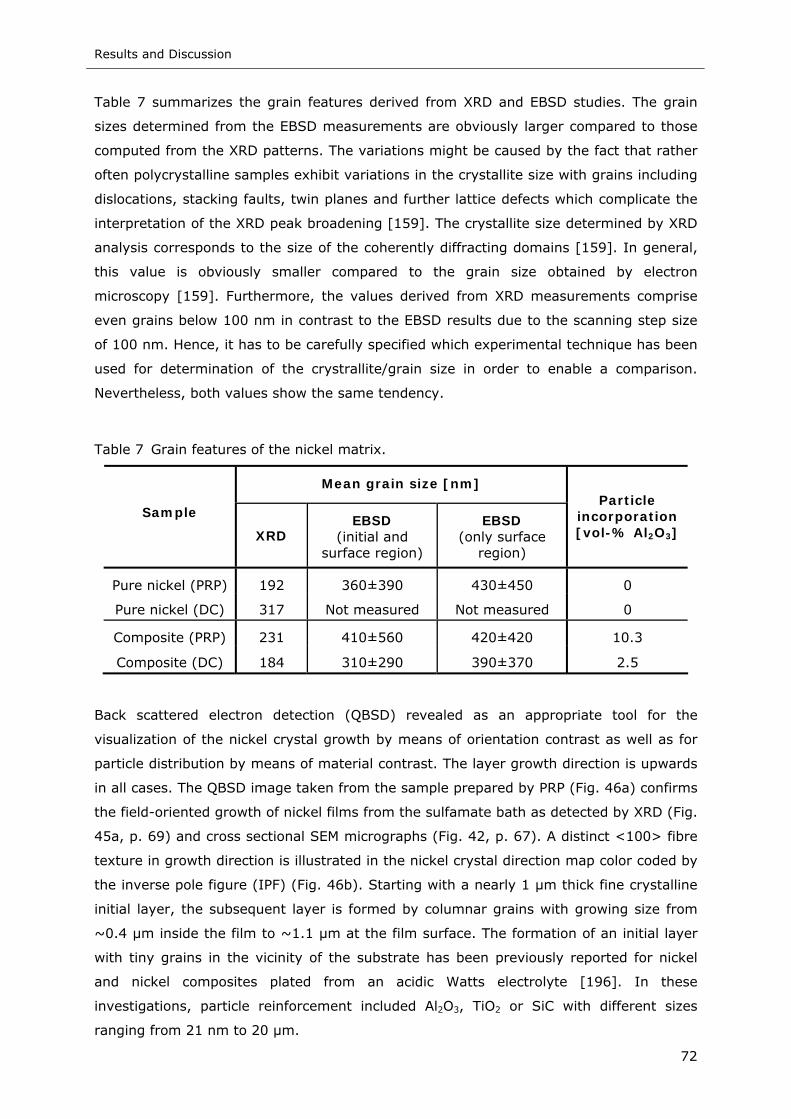
Results and Discussion
72
Table 7 summarizes the grain features derived from XRD and EBSD studies. The grain
sizes determined from the EBSD measurements are obviously larger compared to those
computed from the XRD patterns. The variations might be caused by the fact that rather
often polycrystalline samples exhibit variations in the crystallite size with grains including
dislocations, stacking faults, twin planes and further lattice defects which complicate the
interpretation of the XRD peak broadening [159]. The crystallite size determined by XRD
analysis corresponds to the size of the coherently diffracting domains [159]. In general,
this value is obviously smaller compared to the grain size obtained by electron
microscopy [159]. Furthermore, the values derived from XRD measurements comprise
even grains below 100 nm in contrast to the EBSD results due to the scanning step size
of 100 nm. Hence, it has to be carefully specified which experimental technique has been
used for determination of the crystrallite/grain size in order to enable a comparison.
Nevertheless, both values show the same tendency.
Table 7 Grain features of the nickel matrix.
Mean grain size [nm]
Sample
XRD EBSD
(initial and surface region)
EBSD (only surface
region)
Particle incorporation [vol-% Al2O3]
Pure nickel (PRP) 192 360±390 430±450 0
Pure nickel (DC) 317 Not measured Not measured 0
Composite (PRP) 231 410±560 420±420 10.3
Composite (DC) 184 310±290 390±370 2.5
Back scattered electron detection (QBSD) revealed as an appropriate tool for the
visualization of the nickel crystal growth by means of orientation contrast as well as for
particle distribution by means of material contrast. The layer growth direction is upwards
in all cases. The QBSD image taken from the sample prepared by PRP (Fig. 46a) confirms
the field-oriented growth of nickel films from the sulfamate bath as detected by XRD (Fig.
45a, p. 69) and cross sectional SEM micrographs (Fig. 42, p. 67). A distinct <100> fibre
texture in growth direction is illustrated in the nickel crystal direction map color coded by
the inverse pole figure (IPF) (Fig. 46b). Starting with a nearly 1 µm thick fine crystalline
initial layer, the subsequent layer is formed by columnar grains with growing size from
~0.4 µm inside the film to ~1.1 µm at the film surface. The formation of an initial layer
with tiny grains in the vicinity of the substrate has been previously reported for nickel
and nickel composites plated from an acidic Watts electrolyte [196]. In these
investigations, particle reinforcement included Al2O3, TiO2 or SiC with different sizes
ranging from 21 nm to 20 µm.
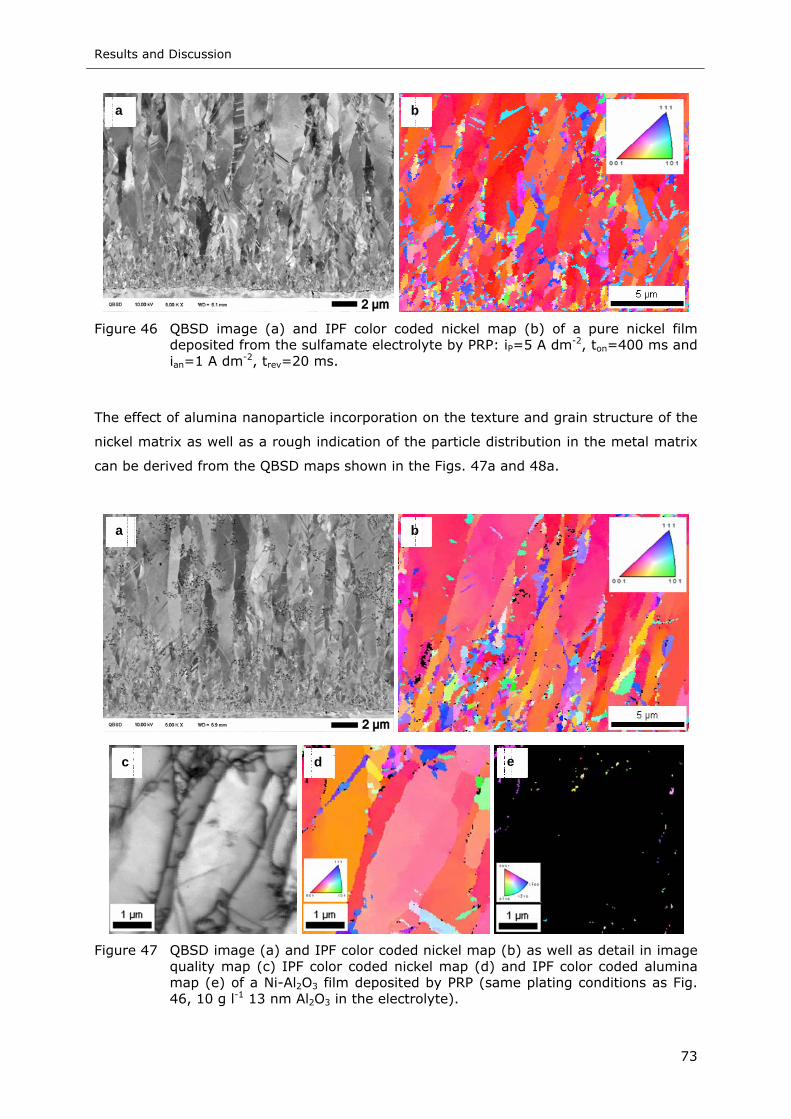
Results and Discussion
73
Figure 46 QBSD image (a) and IPF color coded nickel map (b) of a pure nickel film
deposited from the sulfamate electrolyte by PRP: iP=5 A dm-2, ton=400 ms and ian=1 A dm-2, trev=20 ms.
The effect of alumina nanoparticle incorporation on the texture and grain structure of the
nickel matrix as well as a rough indication of the particle distribution in the metal matrix
can be derived from the QBSD maps shown in the Figs. 47a and 48a.
Figure 47 QBSD image (a) and IPF color coded nickel map (b) as well as detail in image
quality map (c) IPF color coded nickel map (d) and IPF color coded alumina map (e) of a Ni-Al2O3 film deposited by PRP (same plating conditions as Fig. 46, 10 g l-1 13 nm Al2O3 in the electrolyte).
e c d
a b
b a
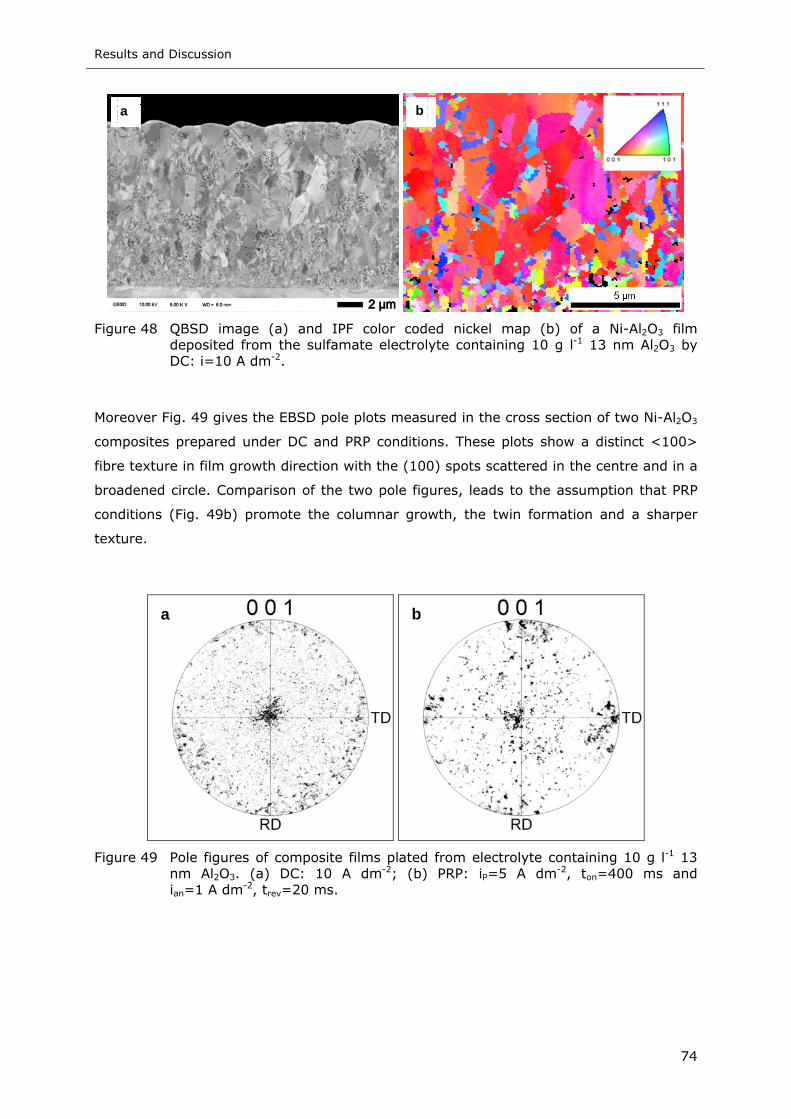
Results and Discussion
74
Figure 48 QBSD image (a) and IPF color coded nickel map (b) of a Ni-Al2O3 film
deposited from the sulfamate electrolyte containing 10 g l-1 13 nm Al2O3 by DC: i=10 A dm-2.
Moreover Fig. 49 gives the EBSD pole plots measured in the cross section of two Ni-Al2O3
composites prepared under DC and PRP conditions. These plots show a distinct <100>
fibre texture in film growth direction with the (100) spots scattered in the centre and in a
broadened circle. Comparison of the two pole figures, leads to the assumption that PRP
conditions (Fig. 49b) promote the columnar growth, the twin formation and a sharper
texture.
Figure 49 Pole figures of composite films plated from electrolyte containing 10 g l-1 13 nm Al2O3. (a) DC: 10 A dm-2; (b) PRP: iP=5 A dm-2, ton=400 ms and ian=1 A dm-2, trev=20 ms.
b a
b a
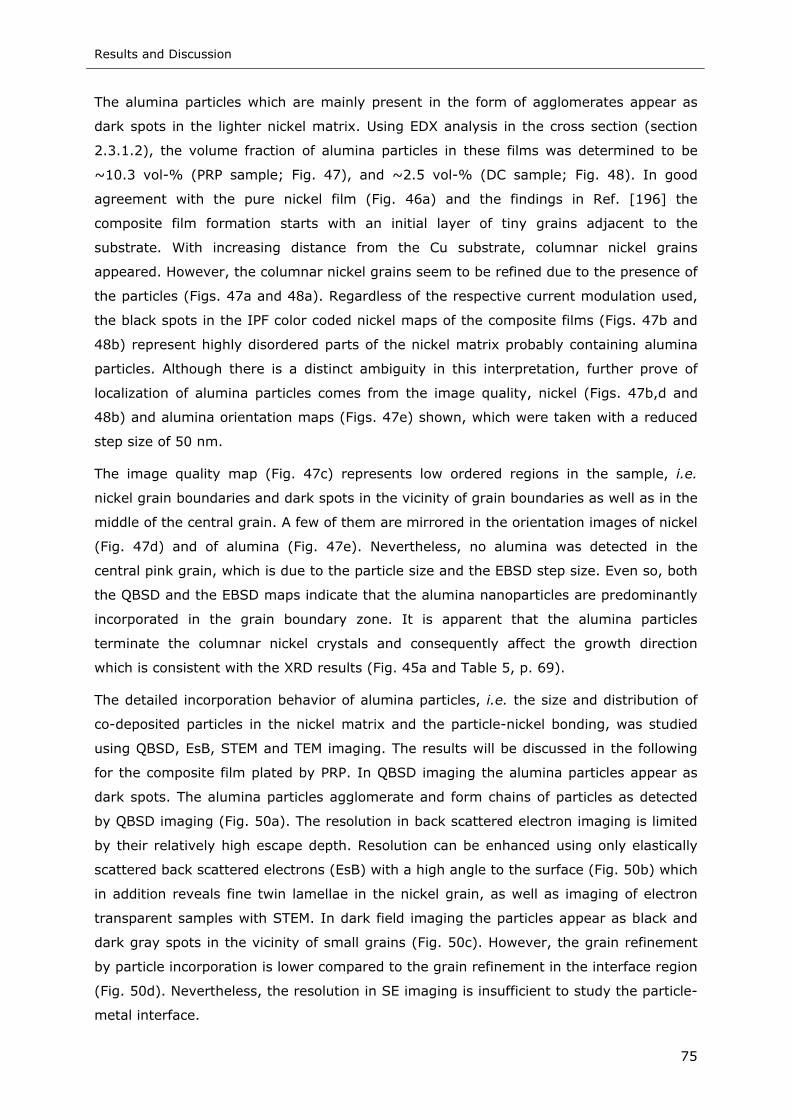
Results and Discussion
75
The alumina particles which are mainly present in the form of agglomerates appear as
dark spots in the lighter nickel matrix. Using EDX analysis in the cross section (section
2.3.1.2), the volume fraction of alumina particles in these films was determined to be
~10.3 vol-% (PRP sample; Fig. 47), and ~2.5 vol-% (DC sample; Fig. 48). In good
agreement with the pure nickel film (Fig. 46a) and the findings in Ref. [196] the
composite film formation starts with an initial layer of tiny grains adjacent to the
substrate. With increasing distance from the Cu substrate, columnar nickel grains
appeared. However, the columnar nickel grains seem to be refined due to the presence of
the particles (Figs. 47a and 48a). Regardless of the respective current modulation used,
the black spots in the IPF color coded nickel maps of the composite films (Figs. 47b and
48b) represent highly disordered parts of the nickel matrix probably containing alumina
particles. Although there is a distinct ambiguity in this interpretation, further prove of
localization of alumina particles comes from the image quality, nickel (Figs. 47b,d and
48b) and alumina orientation maps (Figs. 47e) shown, which were taken with a reduced
step size of 50 nm.
The image quality map (Fig. 47c) represents low ordered regions in the sample, i.e.
nickel grain boundaries and dark spots in the vicinity of grain boundaries as well as in the
middle of the central grain. A few of them are mirrored in the orientation images of nickel
(Fig. 47d) and of alumina (Fig. 47e). Nevertheless, no alumina was detected in the
central pink grain, which is due to the particle size and the EBSD step size. Even so, both
the QBSD and the EBSD maps indicate that the alumina nanoparticles are predominantly
incorporated in the grain boundary zone. It is apparent that the alumina particles
terminate the columnar nickel crystals and consequently affect the growth direction
which is consistent with the XRD results (Fig. 45a and Table 5, p. 69).
The detailed incorporation behavior of alumina particles, i.e. the size and distribution of
co-deposited particles in the nickel matrix and the particle-nickel bonding, was studied
using QBSD, EsB, STEM and TEM imaging. The results will be discussed in the following
for the composite film plated by PRP. In QBSD imaging the alumina particles appear as
dark spots. The alumina particles agglomerate and form chains of particles as detected
by QBSD imaging (Fig. 50a). The resolution in back scattered electron imaging is limited
by their relatively high escape depth. Resolution can be enhanced using only elastically
scattered back scattered electrons (EsB) with a high angle to the surface (Fig. 50b) which
in addition reveals fine twin lamellae in the nickel grain, as well as imaging of electron
transparent samples with STEM. In dark field imaging the particles appear as black and
dark gray spots in the vicinity of small grains (Fig. 50c). However, the grain refinement
by particle incorporation is lower compared to the grain refinement in the interface region
(Fig. 50d). Nevertheless, the resolution in SE imaging is insufficient to study the particle-
metal interface.
Results and Discussion
76
Figure 50 SE (a, b) and STEM (c, d) images of a Ni-Al2O3 film deposited by PRP (same
plating conditions as Fig. 46, 10 g l-1 13 nm Al2O3 in the electrolyte).
Transmission electron microscopy at 200 kV shows numerous chains of agglomerated
alumina particles and sometimes single particles in the polycrystalline nickel matrix as
bright spots in bright field imaging (Fig. 51). These chain-like agglomeration already
originates from the cooling process during particle preparation (section 2.1.2.1) as can
be seen in Fig. 15 (p. 41) and was confirmed by the producer. Compared to SE imaging,
the alumina particles can hardly be distinguished from the matrix in TEM due to the
better transparency of the matrix at higher acceleration voltage. Hence, some of the
incorporated particles are marked in Fig. 51.
b a
c d
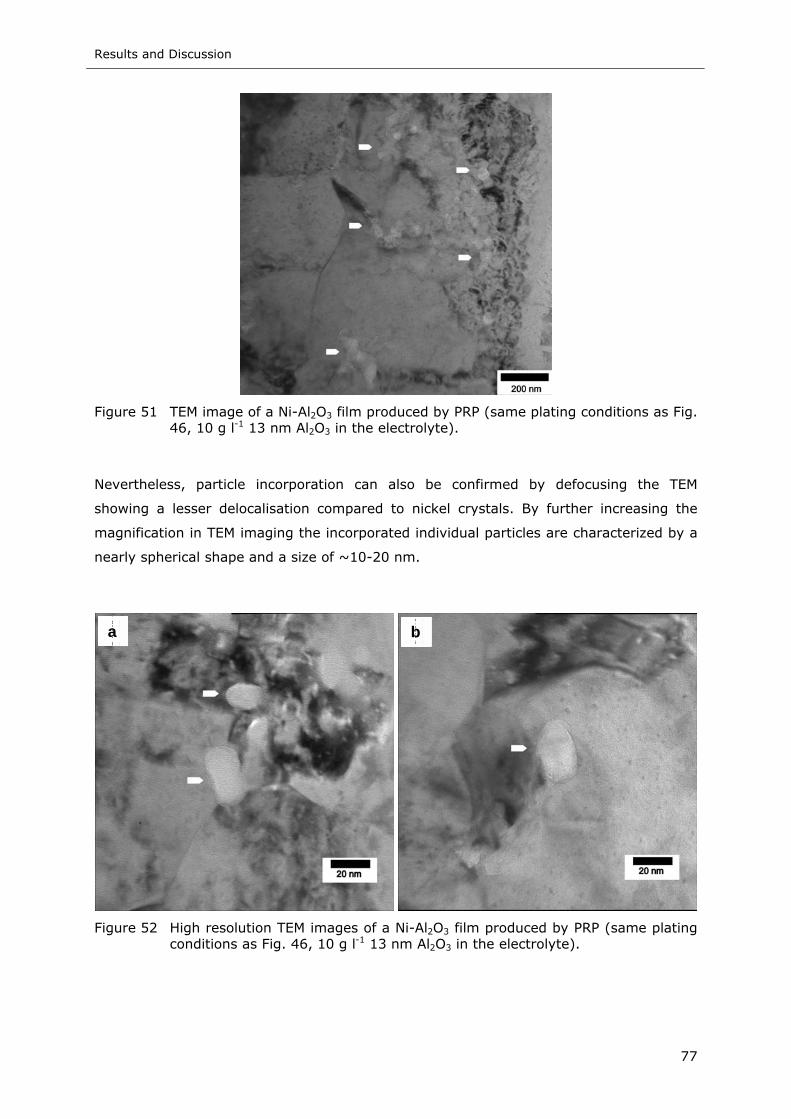
Results and Discussion
77
Figure 51 TEM image of a Ni-Al2O3 film produced by PRP (same plating conditions as Fig. 46, 10 g l-1 13 nm Al2O3 in the electrolyte).
Nevertheless, particle incorporation can also be confirmed by defocusing the TEM
showing a lesser delocalisation compared to nickel crystals. By further increasing the
magnification in TEM imaging the incorporated individual particles are characterized by a
nearly spherical shape and a size of ~10-20 nm.
Figure 52 High resolution TEM images of a Ni-Al2O3 film produced by PRP (same plating conditions as Fig. 46, 10 g l-1 13 nm Al2O3 in the electrolyte).
b a
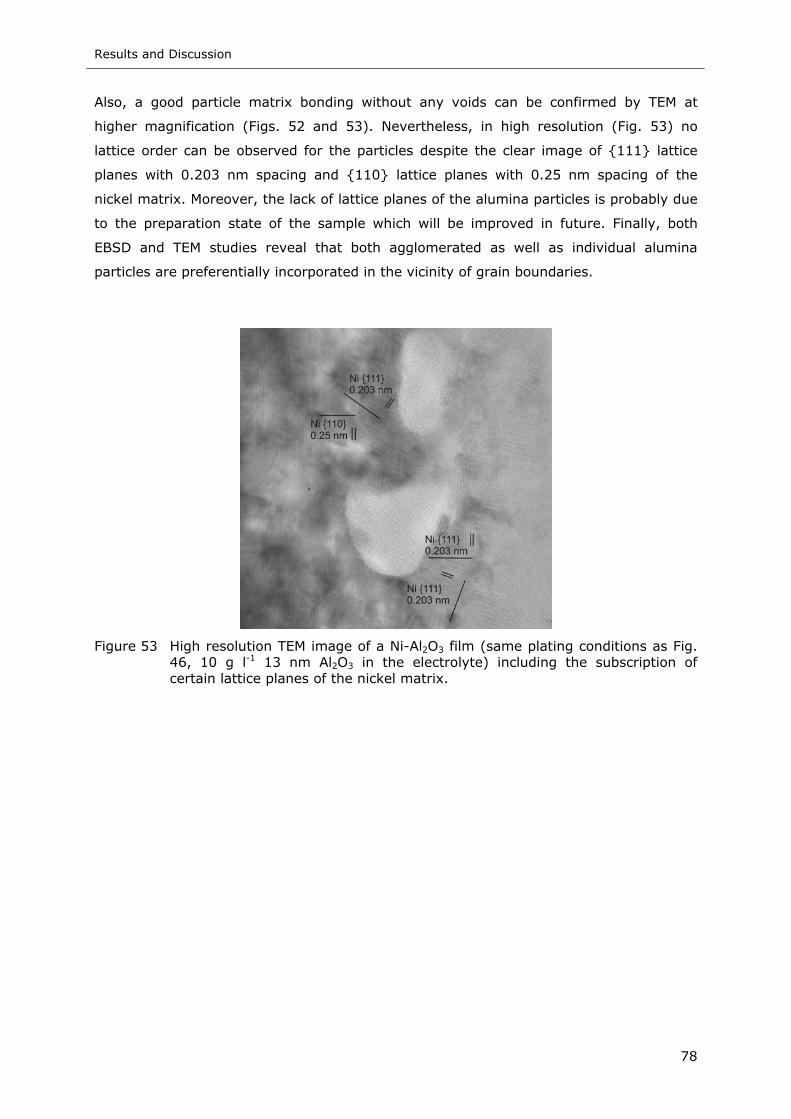
Results and Discussion
78
Also, a good particle matrix bonding without any voids can be confirmed by TEM at
higher magnification (Figs. 52 and 53). Nevertheless, in high resolution (Fig. 53) no
lattice order can be observed for the particles despite the clear image of {111} lattice
planes with 0.203 nm spacing and {110} lattice planes with 0.25 nm spacing of the
nickel matrix. Moreover, the lack of lattice planes of the alumina particles is probably due
to the preparation state of the sample which will be improved in future. Finally, both
EBSD and TEM studies reveal that both agglomerated as well as individual alumina
particles are preferentially incorporated in the vicinity of grain boundaries.
Figure 53 High resolution TEM image of a Ni-Al2O3 film (same plating conditions as Fig. 46, 10 g l-1 13 nm Al2O3 in the electrolyte) including the subscription of certain lattice planes of the nickel matrix.
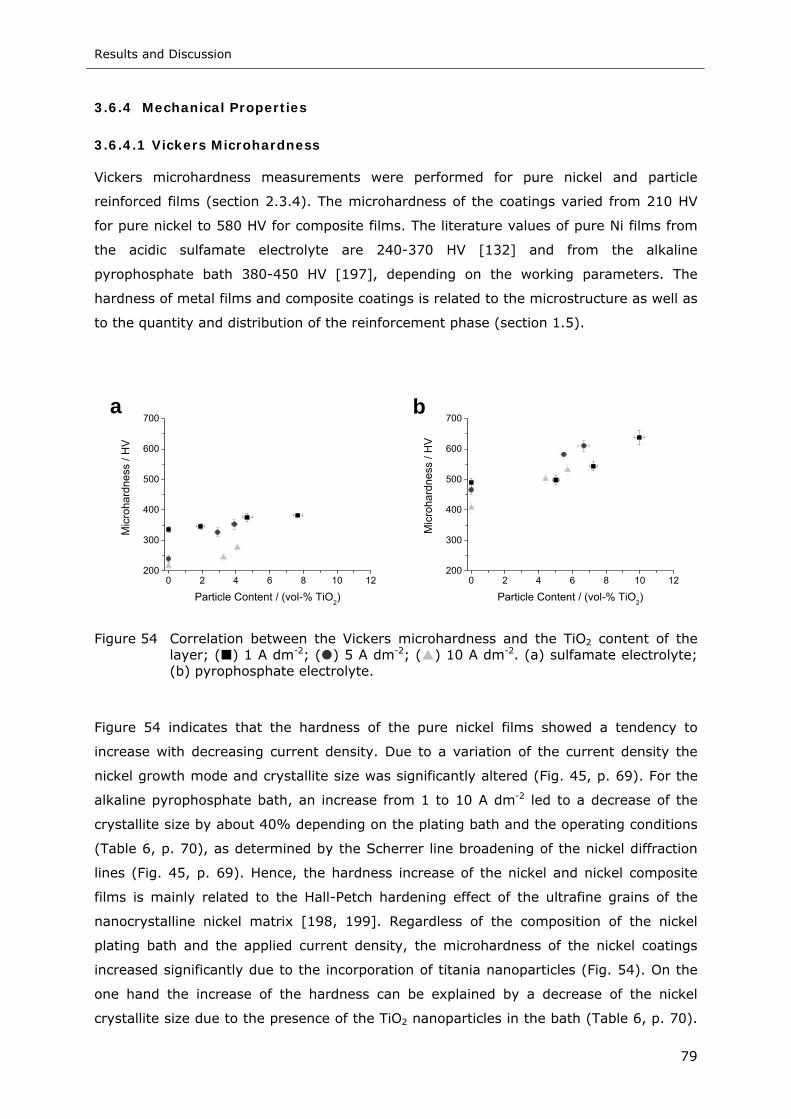
Results and Discussion
79
3.6.4 Mechanical Properties
3.6.4.1 Vickers Microhardness
Vickers microhardness measurements were performed for pure nickel and particle
reinforced films (section 2.3.4). The microhardness of the coatings varied from 210 HV
for pure nickel to 580 HV for composite films. The literature values of pure Ni films from
the acidic sulfamate electrolyte are 240-370 HV [132] and from the alkaline
pyrophosphate bath 380-450 HV [197], depending on the working parameters. The
hardness of metal films and composite coatings is related to the microstructure as well as
to the quantity and distribution of the reinforcement phase (section 1.5).
0 2 4 6 8 10 12200
300
400
500
600
700a
Mic
roha
rdne
ss /
HV
Particle Content / (vol-% TiO2)
0 2 4 6 8 10 12200
300
400
500
600
700b
Mic
roha
rdne
ss /
HV
Particle Content / (vol-% TiO2)
Figure 54 Correlation between the Vickers microhardness and the TiO2 content of the layer; ( ) 1 A dm-2; ( ) 5 A dm-2; ( ) 10 A dm-2. (a) sulfamate electrolyte; (b) pyrophosphate electrolyte.
Figure 54 indicates that the hardness of the pure nickel films showed a tendency to
increase with decreasing current density. Due to a variation of the current density the
nickel growth mode and crystallite size was significantly altered (Fig. 45, p. 69). For the
alkaline pyrophosphate bath, an increase from 1 to 10 A dm-2 led to a decrease of the
crystallite size by about 40% depending on the plating bath and the operating conditions
(Table 6, p. 70), as determined by the Scherrer line broadening of the nickel diffraction
lines (Fig. 45, p. 69). Hence, the hardness increase of the nickel and nickel composite
films is mainly related to the Hall-Petch hardening effect of the ultrafine grains of the
nanocrystalline nickel matrix [198, 199]. Regardless of the composition of the nickel
plating bath and the applied current density, the microhardness of the nickel coatings
increased significantly due to the incorporation of titania nanoparticles (Fig. 54). On the
one hand the increase of the hardness can be explained by a decrease of the nickel
crystallite size due to the presence of the TiO2 nanoparticles in the bath (Table 6, p. 70).
Results and Discussion
80
Furthermore, the enhanced hardness might be caused by the high hardness and strength
of the titania particles. The incorporation of nanoparticles in a nickel matrix is known to
inhibit the plastic flow of the metal (section 1.5) [200].
The microhardness of the nickel coatings plated under PP and PRP conditions varied
between 250 and 520 HV, whereas the hardness values of pure nickel films were
between 250 and 380 HV [117]. Thus, in accordance with Refs. [201, 202] it appears
that both PP and PRP conditions (compared to DC conditions) have only little impact on
the hardness of nickel coatings from the sulfamate bath. In agreement with Ref. [75] the
microhardness of pure nickel films and nanocomposites was found to increase with
decreasing duty cycle [117]. These results are in good agreement with the effects of PP
conditions on the surface morphology of the coatings (Fig. 41, p. 66).
It is well known that the hardness of nickel films plated from the acidic sulfamate bath
under DC conditions increases with decreasing plating current density [83]. In PP
experiments the average plating current density (Eq. 8, p. 55) increases with decreasing
duty cycle and increasing pulse frequency. Hence, the improved hardness of the nickel
films due to a variation of the PP plating parameters can be explained by the change of
the average current density, which is in good agreement with the results of DC plating
[83]. Additionally, a lower duty cycle corresponds to a relatively longer pulse pause that
leads to an enhanced incorporation of alumina particles within the metal matrix (Fig. 30,
p. 54).
Finally, the hardness of the nickel nanocomposites is only slightly affected by the
absolute amount of incorporated alumina particles. The main parameter governing the
hardness of the coatings is the structure of the metal matrix that is mainly influenced by
the plating conditions, viz. average plating current density. As a result of the particle
incorporation, the microstructure of metal films plated from acidic electrolytes changed
from the FT-type (Fig. 42, p. 67) to the UD-type (Figs. 43 and 44, p. 68), which is known
to improve the hardness of the coating considerably [16].
3.6.4.2 Abrasion Resistance
Wear resistance is an important factor governing the industrial application of surface
coatings [203]. The wear performance of electroplated composite films depends on the
microstructure of the metal matrix as well as on the amount of incorporated particles
[204].
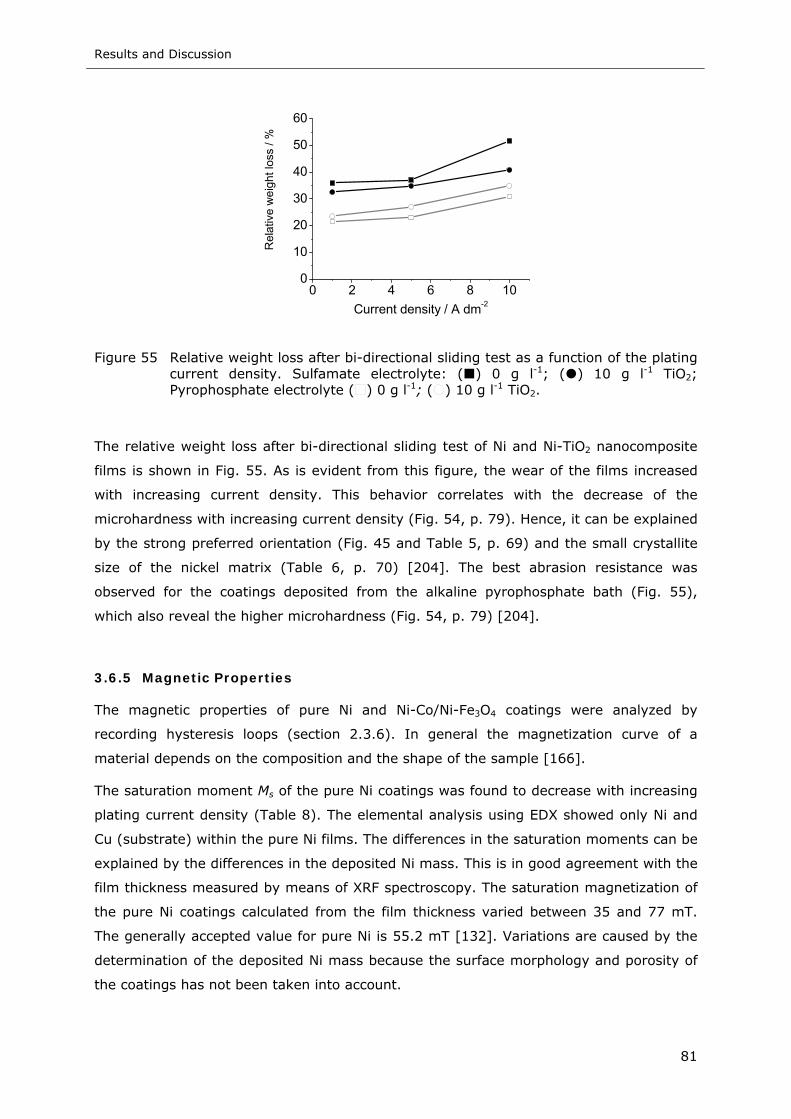
Results and Discussion
81
0 2 4 6 8 100
10
20
30
40
50
60
Rel
ativ
e w
eigh
t los
s / %
Current density / A dm-2
Figure 55 Relative weight loss after bi-directional sliding test as a function of the plating current density. Sulfamate electrolyte: ( ) 0 g l-1; ( ) 10 g l-1 TiO2; Pyrophosphate electrolyte ( ) 0 g l-1; ( ) 10 g l-1 TiO2.
The relative weight loss after bi-directional sliding test of Ni and Ni-TiO2 nanocomposite
films is shown in Fig. 55. As is evident from this figure, the wear of the films increased
with increasing current density. This behavior correlates with the decrease of the
microhardness with increasing current density (Fig. 54, p. 79). Hence, it can be explained
by the strong preferred orientation (Fig. 45 and Table 5, p. 69) and the small crystallite
size of the nickel matrix (Table 6, p. 70) [204]. The best abrasion resistance was
observed for the coatings deposited from the alkaline pyrophosphate bath (Fig. 55),
which also reveal the higher microhardness (Fig. 54, p. 79) [204].
3.6.5 Magnetic Properties
The magnetic properties of pure Ni and Ni-Co/Ni-Fe3O4 coatings were analyzed by
recording hysteresis loops (section 2.3.6). In general the magnetization curve of a
material depends on the composition and the shape of the sample [166].
The saturation moment Ms of the pure Ni coatings was found to decrease with increasing
plating current density (Table 8). The elemental analysis using EDX showed only Ni and
Cu (substrate) within the pure Ni films. The differences in the saturation moments can be
explained by the differences in the deposited Ni mass. This is in good agreement with the
film thickness measured by means of XRF spectroscopy. The saturation magnetization of
the pure Ni coatings calculated from the film thickness varied between 35 and 77 mT.
The generally accepted value for pure Ni is 55.2 mT [132]. Variations are caused by the
determination of the deposited Ni mass because the surface morphology and porosity of
the coatings has not been taken into account.
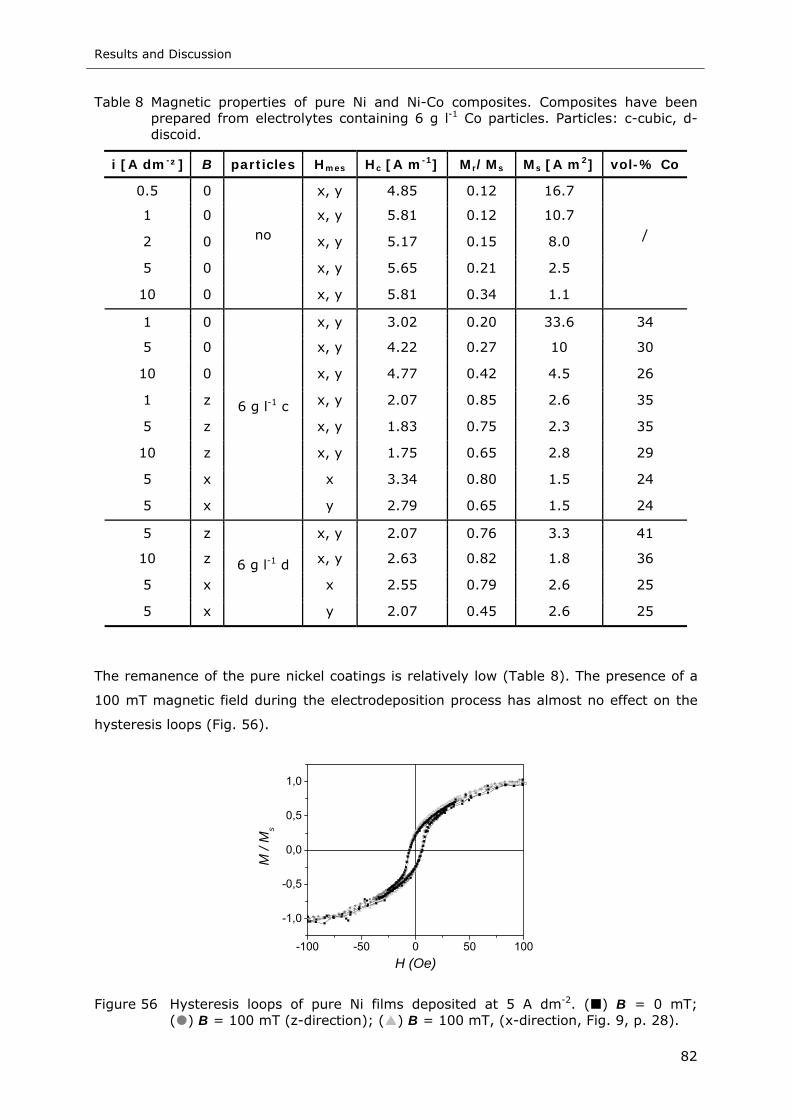
Results and Discussion
82
Table 8 Magnetic properties of pure Ni and Ni-Co composites. Composites have been prepared from electrolytes containing 6 g l-1 Co particles. Particles: c-cubic, d-discoid.
i [A dm-²] B particles Hmes Hc [A m-1] Mr/Ms Ms [A m2] vol-% Co
0.5 0 x, y 4.85 0.12 16.7
1 0 x, y 5.81 0.12 10.7
2 0 x, y 5.17 0.15 8.0
5 0 x, y 5.65 0.21 2.5
10 0
no
x, y 5.81 0.34 1.1
/
1 0 x, y 3.02 0.20 33.6 34
5 0 x, y 4.22 0.27 10 30
10 0 x, y 4.77 0.42 4.5 26
1 z x, y 2.07 0.85 2.6 35
5 z x, y 1.83 0.75 2.3 35
10 z x, y 1.75 0.65 2.8 29
5 x x 3.34 0.80 1.5 24
5 x
6 g l-1 c
y 2.79 0.65 1.5 24
5 z x, y 2.07 0.76 3.3 41
10 z x, y 2.63 0.82 1.8 36
5 x x 2.55 0.79 2.6 25
5 x
6 g l-1 d
y 2.07 0.45 2.6 25
The remanence of the pure nickel coatings is relatively low (Table 8). The presence of a
100 mT magnetic field during the electrodeposition process has almost no effect on the
hysteresis loops (Fig. 56).
-100 -50 0 50 100
-1,0
-0,5
0,0
0,5
1,0
M /
Ms
H (Oe)
Figure 56 Hysteresis loops of pure Ni films deposited at 5 A dm-2. ( ) B = 0 mT; ( ) B = 100 mT (z-direction); ( ) B = 100 mT, (x-direction, Fig. 9, p. 28).
Results and Discussion
83
In marked contrast to the pure Ni films, the remanence of the Ni-Co composite films is
significantly affected by the presence of a static magnetic field during the ECD process
(Table 8). The Co nanoparticles are expected to show a tendency to align parallel with
the magnetic field direction during ECD. Finally, the particles would become fixed in the
deposited nickel matrix. If the orientation of the field is in z-direction, the particles are
most probably orientated with their magnetization in that direction. Hence, there is no
preferential direction for the measurement of hysteresis loops in the x-y-plane. In the
case of a magnetic field oriented in the x-direction during ECD, the Co nanoparticles are
expected to orientate with their magnetization also in x-direction. Thus, there should be
a preferential direction of the hard magnetic particles in the electrodeposited composite
film, which can be proved by differences in the magnetic properties of the coating
depending on the direction of the external magnetic field during VSM measurements.
Hysteresis loops recorded in x-direction show a higher magnetic hardness than in
y-direction (Table 8). The effects found in the magnetization properties of the Ni-Co
composites are almost independent from the shape of the co-deposited Co nanoparticles;
there are small quantitative differences between discoidal and cubic Co particles (Table
8). Furthermore, the orientation and distribution of the Co particles in the Ni matrix has
to be considered. It cannot be expected that the Co nanoparticles are randomly
distributed in the nickel matrix. They might have a tendency to align and stick together.
Likewise to the pure Ni films (Table 8), the Ni-Fe3O4 composites showed a gradual
decrease of the saturation moment with increasing plating current density (data not
shown). The highest values of the saturation moment were found for the Ni-Fe3O4
composites plated in the presence of a magnetic field parallel to the electrical field. The
coercive field for all layers is relatively low, between 1.1 and 5.8 A m-1. For the Ni-Co
composites deposited under the influence of a static magnetic field the coercive field is
lower than for the same deposition without magnetic field (Table 8). An almost opposite
trend was found for the Ni-Fe3O4 composites, where the coercivity was higher due to the
presence of the magnetic field during electrodeposition (data not shown).
Recently, magnetron sputtered rare earth (RE)-Fe-B thin films have been utilized for
magnetic micro-electromechanical system (MEMS) applications [36]. Compared to the
composite layers discussed here the magnetic properties of RE-Fe-B films are superior
with regard to MEMS application [205-208]. However, the preparation of hard magnetic
thin films by means of ECD has several advantages compared to other methods, e.g.
uniformity and simplicity even for complex shapes, low levels of contamination, easy
control of the process and the ability of continuous processing [85]. Future work should
be directed towards the improvement of the magnetic properties of the co-deposited
films. In fact, a variation in the particle size and shape as well as in the composition of
the nanocomposite films might have a deep impact on the magnetic properties.
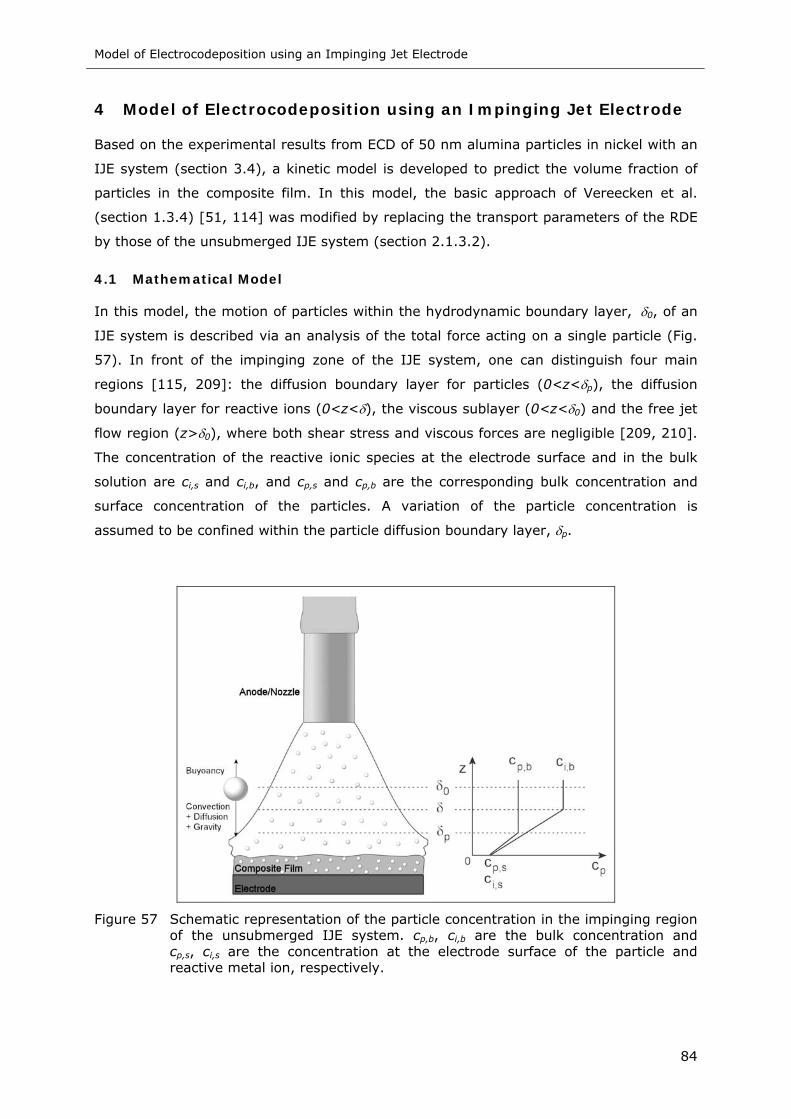
Model of Electrocodeposition using an Impinging Jet Electrode
84
4 Model of Electrocodeposition using an Impinging Jet Electrode
Based on the experimental results from ECD of 50 nm alumina particles in nickel with an
IJE system (section 3.4), a kinetic model is developed to predict the volume fraction of
particles in the composite film. In this model, the basic approach of Vereecken et al.
(section 1.3.4) [51, 114] was modified by replacing the transport parameters of the RDE
by those of the unsubmerged IJE system (section 2.1.3.2).
4.1 Mathematical Model
In this model, the motion of particles within the hydrodynamic boundary layer, δ0, of an
IJE system is described via an analysis of the total force acting on a single particle (Fig.
57). In front of the impinging zone of the IJE system, one can distinguish four main
regions [115, 209]: the diffusion boundary layer for particles (0<z<δp), the diffusion
boundary layer for reactive ions (0<z<δ), the viscous sublayer (0<z<δ0) and the free jet
flow region (z>δ0), where both shear stress and viscous forces are negligible [209, 210].
The concentration of the reactive ionic species at the electrode surface and in the bulk
solution are ci,s and ci,b, and cp,s and cp,b are the corresponding bulk concentration and
surface concentration of the particles. A variation of the particle concentration is
assumed to be confined within the particle diffusion boundary layer, δp.
Figure 57 Schematic representation of the particle concentration in the impinging region of the unsubmerged IJE system. cp,b, ci,b are the bulk concentration and cp,s, ci,s are the concentration at the electrode surface of the particle and reactive metal ion, respectively.
Model of Electrocodeposition using an Impinging Jet Electrode
85
Following the development of the model of Vereecken et al. [51, 114], the total force
acting on a single rigid particle in an unbounded homogenous solvent is given by the
product of the net drift velocity of the particles (υDr) times the friction coefficient (f)
[114].
Drtotal fF υ⋅= (9)
According to Stokes’ law the friction coefficient can be calculated by r6f ηπ= , where η
is the viscosity of the solution and r the particle radius.
The total force on the particle (Ftotal) in an impinging jet is the sum of convectional
diffusion (FDiff) and gravitation (FGrav) (Fig. 57). Of course the gravitational term has to be
corrected for the influence of the buoyancy of the dispersed nanoparticles. Hence, the
total force exerted on a particle in front of the electrode can be written as
GravDifftotal FFF +=− . (10)
The diffusion force is known to be the negative of the chemical potential gradient (∇µ),
which corresponds in an ideal solution to [101]
pb,p
BDiff c
cTkF ∇−=∇−= µ (11)
where kB is Boltzmann’s constant and T is the temperature. The orientation of the driving
force of the diffusion process, the concentration gradient (∇cp), is schematically shown in
Fig. 57. It is characterized by a linear concentration drop within the diffusion layer
thickness, δp.
The second component is due to gravity and is given as [101]
g)(3
r4gmF fp
3
Grav ρρπ−−=−= (12)
where m is the mass of one particle, g is the acceleration due to gravity, r is the particle
radius, ρp and ρf are the density of the particle and the fluid, respectively. From Eq. 12 it
can be seen that the gravitational force is a function of the particle radius.
Substituting Eq. 9, 11 and 12 in Eq. 10, the total force acting on a particle in front of the
electrode can be written as
Drfp
3
pB
total r6g)(3r4c
cTkF υηπρρπ
=−+∇= (13)
Model of Electrocodeposition using an Impinging Jet Electrode
86
The particle flux is defined as Jp = cp·υDr. Hence, substituting for the velocity Eq. 13 can
be rewritten as
p
2fp
pB
p c9
rg)(2c
r6TkJ
ηρρ
ηπ−
+∇= (14)
Comparison to Fick’s first law shows that r6/TkB ηπ is the particle diffusion coefficient
Dp [101].
Following the model of Vereecken et al. [51, 114] we will use the Nernst diffusion layer
model to describe the particle flux to the electrode [102]. The driving force for the
diffusion process is characterized by a linear concentration drop within the diffusion layer
thickness, δp, and is given by
p
s,pb,pp
)cc(c
δ−
=∇ (15)
where cp,b is the bulk particle concentration, cp,s particle concentration at the electrode
surface, and δp the thickness of the diffusion boundary layer for particles.
According to the diffusion theory, the average particle concentration within the diffusion
layer is given by 2/)cc(c s,pb,pp += . Thus, the particle flux (Eq. 14) can be written as
)cc(9
rg)()cc(DJ s,pb,p
2fp
p
s,pb,ppp +
−+
−=
ηρρ
δ (16)
The volume fraction of particles (xV) within the electroplated composite film is given by
M,mmpAp
pApV VnVNn
VNnx
+= (17)
where np and nm are the number of moles of particles and metal atoms in the film, Vp is
the particle volume, Vm,M is the molar volume of the metal matrix, and NA is Avogadro’s
number. The ratio of the number of moles of particles to those of metal atoms np / nm is
equal to the ratio of their fluxes Jp / Jm. During the process of electrocodeposition, both Jp
and Jm are supposed to be positive. Noting that the flux of metal ions to the electrode
surface is given by Fz/iJm = , where i is the applied current density, z is the charge
number of the species and F is Faraday’s constant, Eq. 17 can be written as
ix1
xNFzr4
V3J
V
V
A
M,mp −
= 3π (18)
Combining Eq. 16 and 18 under consideration of )x1(/xV/V VVmp −= gives an
expression for Vp / Vm as a function of the plating parameters
Model of Electrocodeposition using an Impinging Jet Electrode
87
⎟⎟⎠
⎞⎜⎜⎝
⎛+
−+
−⋅= )cc(
9rg)()cc(
DiV3NFzr4
VV
s,pb,p
2fp
p
s,pb,pP
M,m
A3
m
p
ηρρ
δπ
(19)
In the case of a sufficient high metal deposition rate, all particles arriving at the electrode
surface are incorporated in the metal matrix. If the probability of particle entrapment is
unity and the particle incorporation is limited by the particle diffusion, the particle
concentration at the electrode surface is cp,s = 0 and Eq. 19 can be written as
b,pfp
p
p
M,m
A
metal
p crg)(D
iV3NFzr 4
VV
⎟⎟⎠
⎞⎜⎜⎝
⎛ −+⋅=
ηρρ
δπ
9
23
(20)
Chin and Hsueh extensively investigated mass transfer with an unsubmerged IJE system
[121]. Using the Chilton-Colburn analogy [121], which utilizes a similarity between mass
and momentum transfer to a flat plate, they obtained a correlation for the rate of mass
transfer to the impinging region of the IJE system in the form
0.09
//
dHScRe0.9Sh
-3121 ⎟
⎠⎞
⎜⎝⎛= (21)
where the Sherwood number mD/dkSh = is a function of the Reynolds number
νυ /dRe = , which is based on the diameter of the jet nozzle (d) and the exit velocity
from the nozzle (υ), and the Schmidt number mD/Sc ν= , which is a ratio of the
kinematic viscosity (ν) of the electrolyte to the diffusion coefficient of the reactive species
(Dm), and the ratio of the distance between the nozzle and substrate (H) to the diameter
of the jet nozzle (d). By defining the average mass transfer coefficient [102] as
δ/Dk m= and using the Eq. 21, the diffusion layer thickness at an unsubmerged IJE can
be calculated as
21
3161
-3121
/
0.410.09/m
/
0.09// 0.9
dHD
dHScRe0.9
dυ
νδ =
⎟⎠⎞
⎜⎝⎛
= [22]
Due to the small size of the alumina nanoparticles (50 nm), transport by Brownian
diffusion is important. The diffusion coefficient of the alumina nanoparticles in the nickel
sulfamate bath is calculated from the Stokes-Einstein equation [101] to be
Dp = 4.19·10-12 m2s-1 using the values given in Table 9. The diffusivity of the reactive
species, Ni2+ ions, is known to be Dm = 0.661·10-9 m2s-1 [211].
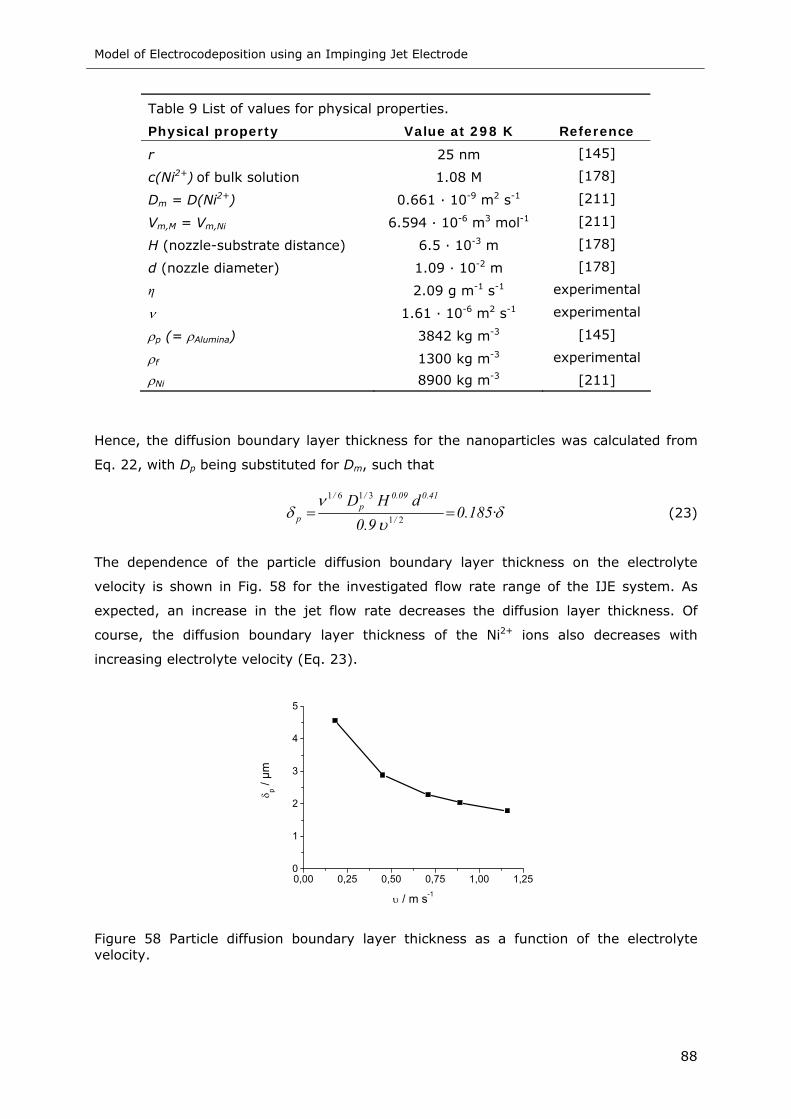
Model of Electrocodeposition using an Impinging Jet Electrode
88
Table 9 List of values for physical properties.
Physical property Value at 298 K Reference
r 25 nm [145]
c(Ni2+) of bulk solution 1.08 M [178]
Dm = D(Ni2+) 0.661 · 10-9 m2 s-1 [211]
Vm,M = Vm,Ni 6.594 · 10-6 m3 mol-1 [211]
H (nozzle-substrate distance) 6.5 · 10-3 m [178]
d (nozzle diameter) 1.09 · 10-2 m [178]
η 2.09 g m-1 s-1 experimental
ν 1.61 · 10-6 m2 s-1 experimental
ρp (= ρAlumina) 3842 kg m-3 [145]
ρf 1300 kg m-3 experimental
ρNi 8900 kg m-3 [211]
Hence, the diffusion boundary layer thickness for the nanoparticles was calculated from
Eq. 22, with Dp being substituted for Dm, such that
δυ
νδ 0.185·
0.9dHD
/
0.410.09/p
/
p == 21
3161
(23)
The dependence of the particle diffusion boundary layer thickness on the electrolyte
velocity is shown in Fig. 58 for the investigated flow rate range of the IJE system. As
expected, an increase in the jet flow rate decreases the diffusion layer thickness. Of
course, the diffusion boundary layer thickness of the Ni2+ ions also decreases with
increasing electrolyte velocity (Eq. 23).
0,00 0,25 0,50 0,75 1,00 1,250
1
2
3
4
5
δ p / µm
υ / m s-1
Figure 58 Particle diffusion boundary layer thickness as a function of the electrolyte velocity.
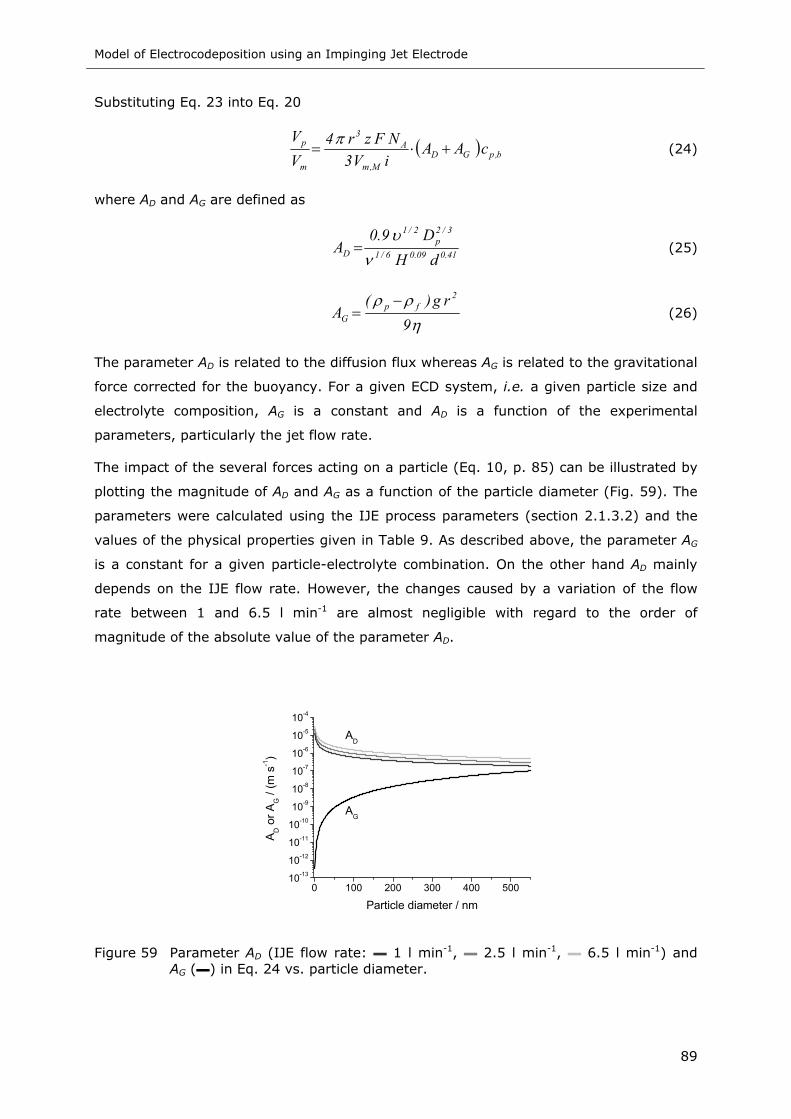
Model of Electrocodeposition using an Impinging Jet Electrode
89
Substituting Eq. 23 into Eq. 20
( ) b,pGDM,m
A3
m
p cAAiV3NFzr4
VV
+⋅=π
(24)
where AD and AG are defined as
0.410.096/1
3/2p
2/1
D dHD0.9
Aν
υ= (25)
η
ρρ9
rg)(A
2fp
G
−= (26)
The parameter AD is related to the diffusion flux whereas AG is related to the gravitational
force corrected for the buoyancy. For a given ECD system, i.e. a given particle size and
electrolyte composition, AG is a constant and AD is a function of the experimental
parameters, particularly the jet flow rate.
The impact of the several forces acting on a particle (Eq. 10, p. 85) can be illustrated by
plotting the magnitude of AD and AG as a function of the particle diameter (Fig. 59). The
parameters were calculated using the IJE process parameters (section 2.1.3.2) and the
values of the physical properties given in Table 9. As described above, the parameter AG
is a constant for a given particle-electrolyte combination. On the other hand AD mainly
depends on the IJE flow rate. However, the changes caused by a variation of the flow
rate between 1 and 6.5 l min-1 are almost negligible with regard to the order of
magnitude of the absolute value of the parameter AD.
0 100 200 300 400 50010-13
10-12
10-11
10-10
10-9
10-8
10-7
10-6
10-5
10-4
AD
AD o
r AG /
(m s
-1)
Particle diameter / nm
AG
Figure 59 Parameter AD (IJE flow rate: ▬ 1 l min-1, ▬ 2.5 l min-1, ▬ 6.5 l min-1) and AG (▬) in Eq. 24 vs. particle diameter.
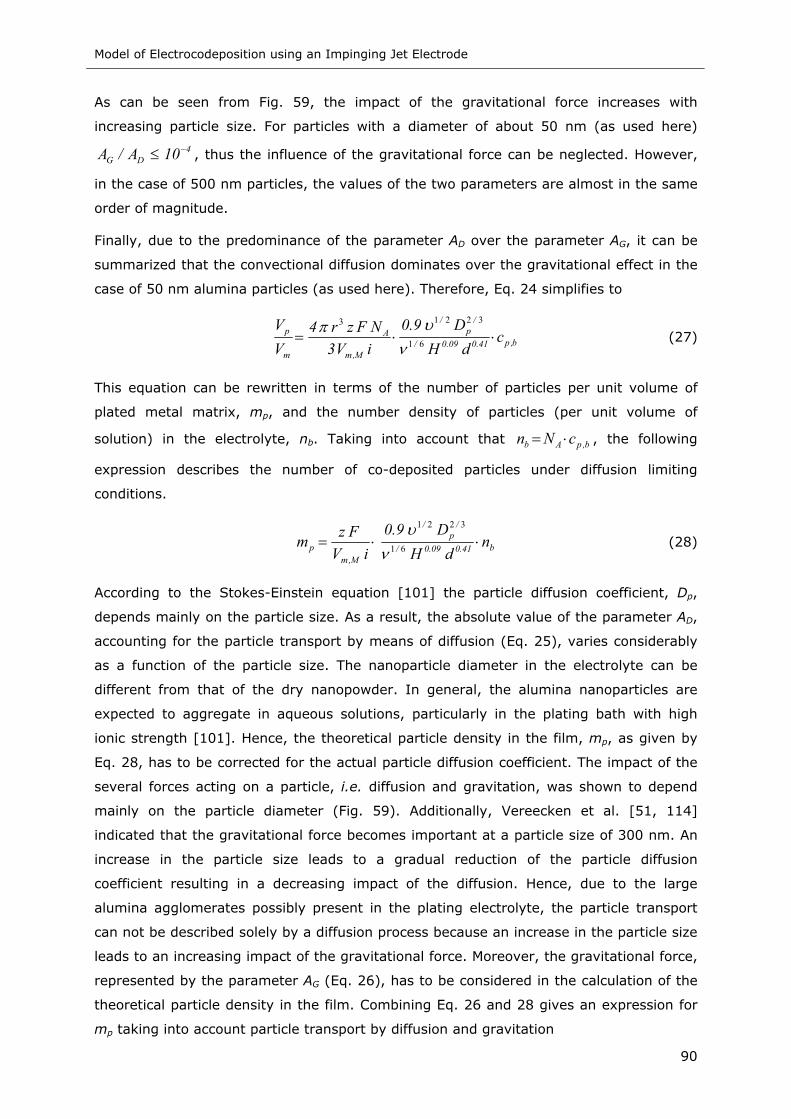
Model of Electrocodeposition using an Impinging Jet Electrode
90
As can be seen from Fig. 59, the impact of the gravitational force increases with
increasing particle size. For particles with a diameter of about 50 nm (as used here)
4DG 10A/A −≤ , thus the influence of the gravitational force can be neglected. However,
in the case of 500 nm particles, the values of the two parameters are almost in the same
order of magnitude.
Finally, due to the predominance of the parameter AD over the parameter AG, it can be
summarized that the convectional diffusion dominates over the gravitational effect in the
case of 50 nm alumina particles (as used here). Therefore, Eq. 24 simplifies to
b,p0.410.09/
/p
/
M,m
A
m
p cdH
D0.9iV3NFzr4
VV
⋅⋅= 61
32213
νυπ
(27)
This equation can be rewritten in terms of the number of particles per unit volume of
plated metal matrix, mp, and the number density of particles (per unit volume of
solution) in the electrolyte, nb. Taking into account that b,pAb cNn ⋅= , the following
expression describes the number of co-deposited particles under diffusion limiting
conditions.
b0.410.09/
/p
/
M,mp n
dHD0.9
iVFzm ⋅⋅= 61
3221
νυ
(28)
According to the Stokes-Einstein equation [101] the particle diffusion coefficient, Dp,
depends mainly on the particle size. As a result, the absolute value of the parameter AD,
accounting for the particle transport by means of diffusion (Eq. 25), varies considerably
as a function of the particle size. The nanoparticle diameter in the electrolyte can be
different from that of the dry nanopowder. In general, the alumina nanoparticles are
expected to aggregate in aqueous solutions, particularly in the plating bath with high
ionic strength [101]. Hence, the theoretical particle density in the film, mp, as given by
Eq. 28, has to be corrected for the actual particle diffusion coefficient. The impact of the
several forces acting on a particle, i.e. diffusion and gravitation, was shown to depend
mainly on the particle diameter (Fig. 59). Additionally, Vereecken et al. [51, 114]
indicated that the gravitational force becomes important at a particle size of 300 nm. An
increase in the particle size leads to a gradual reduction of the particle diffusion
coefficient resulting in a decreasing impact of the diffusion. Hence, due to the large
alumina agglomerates possibly present in the plating electrolyte, the particle transport
can not be described solely by a diffusion process because an increase in the particle size
leads to an increasing impact of the gravitational force. Moreover, the gravitational force,
represented by the parameter AG (Eq. 26), has to be considered in the calculation of the
theoretical particle density in the film. Combining Eq. 26 and 28 gives an expression for
mp taking into account particle transport by diffusion and gravitation
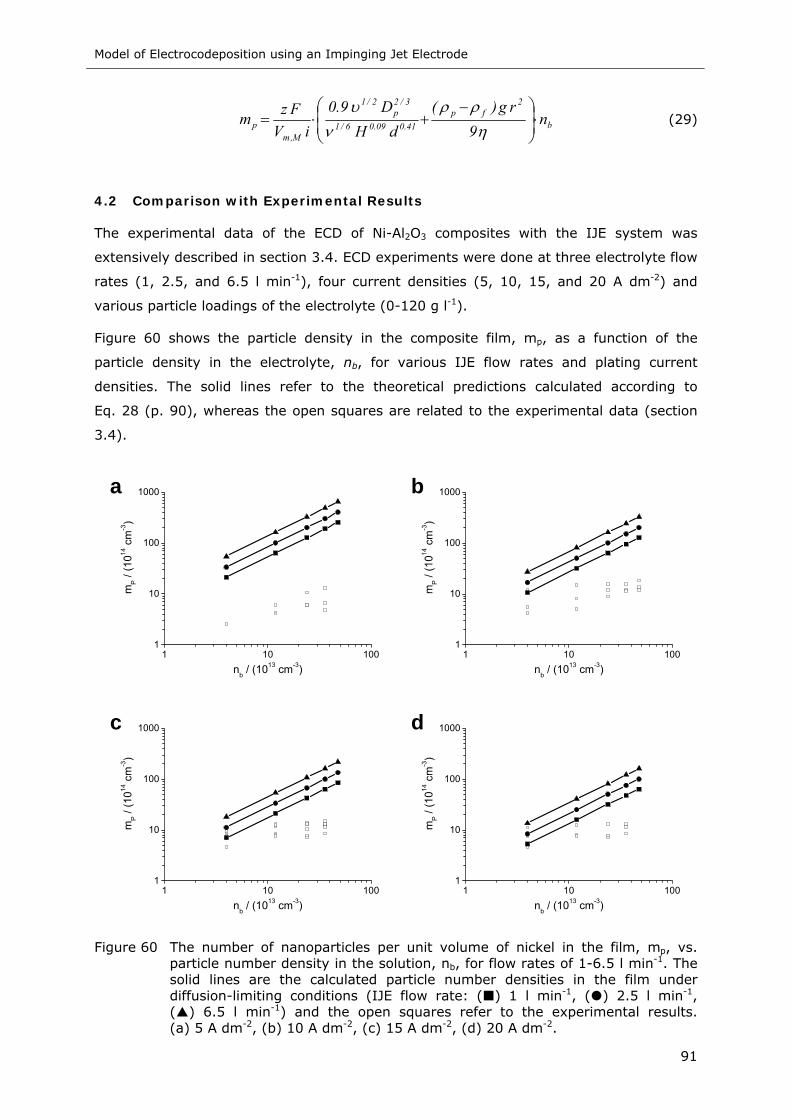
Model of Electrocodeposition using an Impinging Jet Electrode
91
b
2fp
0.410.096/1
3/2p
2/1
M,mp n
9rg)(
dHD0.9
iVFzm ⋅⎟
⎟⎠
⎞⎜⎜⎝
⎛ −+⋅=
ηρρ
νυ
(29)
4.2 Comparison with Experimental Results
The experimental data of the ECD of Ni-Al2O3 composites with the IJE system was
extensively described in section 3.4. ECD experiments were done at three electrolyte flow
rates (1, 2.5, and 6.5 l min-1), four current densities (5, 10, 15, and 20 A dm-2) and
various particle loadings of the electrolyte (0-120 g l-1).
Figure 60 shows the particle density in the composite film, mp, as a function of the
particle density in the electrolyte, nb, for various IJE flow rates and plating current
densities. The solid lines refer to the theoretical predictions calculated according to
Eq. 28 (p. 90), whereas the open squares are related to the experimental data (section
3.4).
1 10 1001
10
100
1000a
mP /
(1014
cm
-3)
nb / (1013 cm-3)1 10 100
1
10
100
1000b
mP /
(1014
cm
-3)
nb / (1013 cm-3)
1 10 1001
10
100
1000c
mP /
(1014
cm
-3)
nb / (1013 cm-3)1 10 100
1
10
100
1000d
mP /
(1014
cm
-3)
nb / (1013 cm-3)
Figure 60 The number of nanoparticles per unit volume of nickel in the film, mp, vs. particle number density in the solution, nb, for flow rates of 1-6.5 l min-1. The solid lines are the calculated particle number densities in the film under diffusion-limiting conditions (IJE flow rate: ( ) 1 l min-1, ( ) 2.5 l min-1, ( ) 6.5 l min-1) and the open squares refer to the experimental results. (a) 5 A dm-2, (b) 10 A dm-2, (c) 15 A dm-2, (d) 20 A dm-2.
Model of Electrocodeposition using an Impinging Jet Electrode
92
The experimental results (Fig. 60, symbols) are significantly smaller compared to the
theoretical predictions (Fig. 60, solid lines). However, the overall results emphasize that
the theoretical and experimental data converge with increasing plating current density
(Fig. 60). The probability of particle incorporation significantly depends on the metal
deposition rate and hence on the applied current density (section 1.4.4).
When the metal growth rate is slow compared to the residence time of particles, the
particles can diffuse from the electrode before becoming incorporated into the composite
film. On the other hand, if the metal growth rate is fast in comparison to the residence
time all particles adsorbed on the electrode become incorporated in the film. Finally, the
probability of particle incorporation is a function of the metal growth rate and hence of
the applied current density. The probability is equal to one when the metal growth rate is
sufficiently high. Furthermore, the variations observed in Fig. 60 might be due to the fact
that the actual particle velocity in the electrolyte is lower, i.e. the particle flux to the
electrode is lower. It has to be emphasized that all the calculations so far depend on the
primary particle diameter as given by the producer. However, the diameter of the
alumina particles will be different depending on the surrounding media. The particle size
was determined in the nickel sulfamate electrolyte by means of photon correlation
spectroscopy (section 2.2.2). Of course, the alumina nanoparticles tend to aggregate in
the nickel bath probably due to the high ionic strength (section 1.2.2). Assuming a
normal distribution these aggregates are characterized by an average size of about
350 nm and a full width at half maximum of 125 nm (Fig. 61). Hence, it is assumed that
the plating electrolyte contains alumina particles with a diameter ranging from 200 to
500 nm.
0 200 400 600 800 10000
5
10
15
20
25
30
35
Num
ber %
Particle diameter / nm
Figure 61 Particle size distribution of the alumina nanoparticles in the acidic nickel sulfamate electrolyte determined by photon correlation spectroscopy.
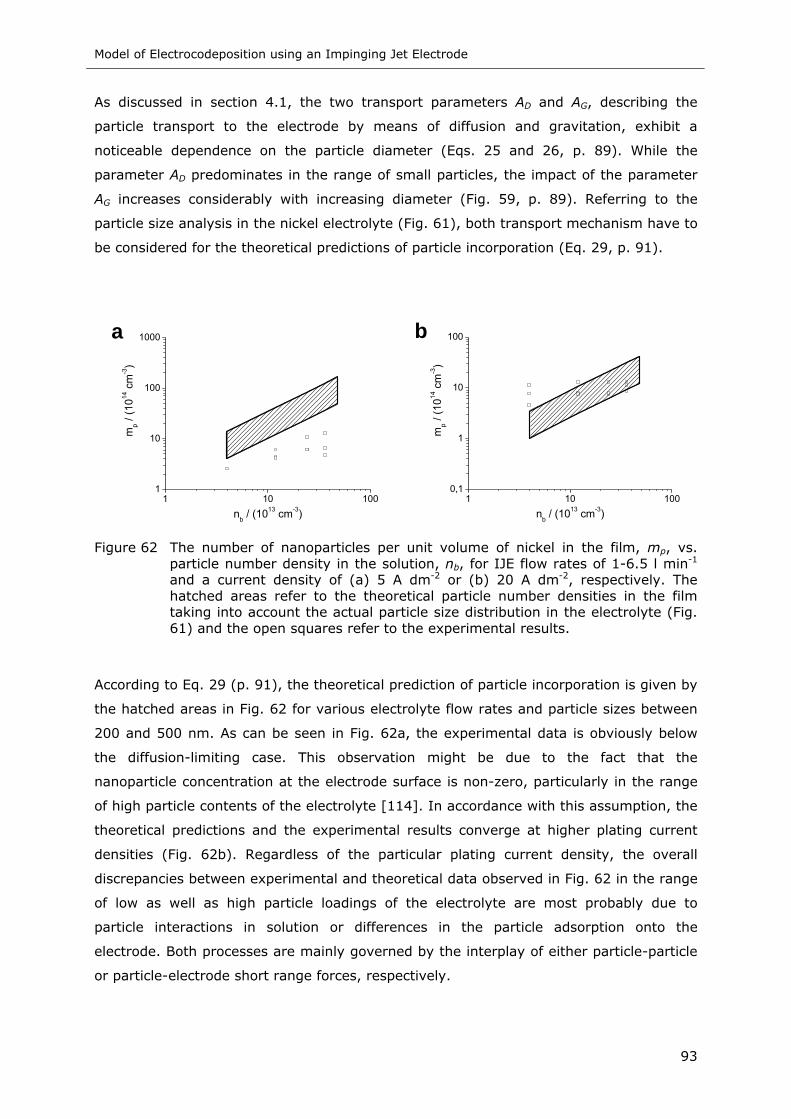
Model of Electrocodeposition using an Impinging Jet Electrode
93
As discussed in section 4.1, the two transport parameters AD and AG, describing the
particle transport to the electrode by means of diffusion and gravitation, exhibit a
noticeable dependence on the particle diameter (Eqs. 25 and 26, p. 89). While the
parameter AD predominates in the range of small particles, the impact of the parameter
AG increases considerably with increasing diameter (Fig. 59, p. 89). Referring to the
particle size analysis in the nickel electrolyte (Fig. 61), both transport mechanism have to
be considered for the theoretical predictions of particle incorporation (Eq. 29, p. 91).
1 10 1001
10
100
1000a
mp /
(1014
cm
-3)
nb / (1013 cm-3)
1 10 1000,1
1
10
100b
mp /
(1014
cm
-3)
nb / (1013 cm-3)
Figure 62 The number of nanoparticles per unit volume of nickel in the film, mp, vs.
particle number density in the solution, nb, for IJE flow rates of 1-6.5 l min-1 and a current density of (a) 5 A dm-2 or (b) 20 A dm-2, respectively. The hatched areas refer to the theoretical particle number densities in the film taking into account the actual particle size distribution in the electrolyte (Fig. 61) and the open squares refer to the experimental results.
According to Eq. 29 (p. 91), the theoretical prediction of particle incorporation is given by
the hatched areas in Fig. 62 for various electrolyte flow rates and particle sizes between
200 and 500 nm. As can be seen in Fig. 62a, the experimental data is obviously below
the diffusion-limiting case. This observation might be due to the fact that the
nanoparticle concentration at the electrode surface is non-zero, particularly in the range
of high particle contents of the electrolyte [114]. In accordance with this assumption, the
theoretical predictions and the experimental results converge at higher plating current
densities (Fig. 62b). Regardless of the particular plating current density, the overall
discrepancies between experimental and theoretical data observed in Fig. 62 in the range
of low as well as high particle loadings of the electrolyte are most probably due to
particle interactions in solution or differences in the particle adsorption onto the
electrode. Both processes are mainly governed by the interplay of either particle-particle
or particle-electrode short range forces, respectively.
Model of Electrocodeposition using an Impinging Jet Electrode
94
4.3 Summary
A kinetic model for ECD with an unsubmerged IJE system was developed to predict the
amount of alumina incorporation in a nickel matrix plated from an acidic sulfamate
electrolyte (section 4.1). The particle flux to the electrode was derived from a detailed
analysis of the total force acting on a rigid spherical particle in an unbounded fluid in
front of the electrode. The forces considered are convectional diffusion, gravity and
buoyancy.
The comparison of the theoretical predictions with the experimental results (Figs. 60,
p. 91 and 62, p. 93) proved a predominant particle transport to the electrode by means
of convectional diffusion. However, it has to be emphasized that the primary particle size
of the alumina nanopowder as given by the producer can not be utilized for the prediction
of the particle content of the plated composite films. In fact, the actual particle size in the
nickel electrolyte has to be determined. Nevertheless, the experimental incorporation
results are still obviously smaller compared to the theoretical predictions in the range of
small current densities and high particle contents in the electrolyte (Fig. 62, p. 93).
Hence, the surface concentration of the nanoparticles on the electrode might not be zero
indicating that either the particle flux might not be under diffusion control or that the
metal plating rate, as defined by the applied current density, is not sufficiently high
compared to the residence time of particles on the electrode surface.
The process of ECD is assumed to proceed in several stages as described in section 1.3.
Apart from the particle transport to the electrode, the probability of particle incorporation
is affected by the particle adsorption onto the electrode. Therefore, the short-range
forces acting between particle and electrode are of prime importance. Colloidal probe
microscopy experiments are particularly promising to gain a better insight in the impact
of these short range forces on the ECD process [135, 212].
Conclusions and Suggested Future Work
95
5 Conclusions and Suggested Future Work
The objectives of this research were to (1) characterize the nanoparticle properties
(section 3.1), (2) systematically investigate the effects of certain process parameters on
the ECD of nano-sized metal or metal oxide particles in a nickel matrix (sections 3.3-
3.5), (3) examine how the particle incorporation affects the structure and properties of
the electrodeposited nickel matrix (section 3.6), and (4) use the knowledge gained from
the codeposition experiments to model the ECD process (section 4).
The key results obtained in this work, which were discussed in detail in the previous
sections (3 and 4) will now be summarized. Suggestions for (possible) future work are
given at the end of this section.
5.1 Conclusions for the Particle Characterization
The hydrodynamic diameter, surface charge and sedimentation behavior of the
nanoparticles, i.e. Al2O3 (section 3.1.1), TiO2 (section 3.1.2), Co (section 3.1.3), Fe3O4
(section 3.1.4), in a nickel electrolyte were characterized as a function of the
composition, the ionic strength and the pH of the electrolyte. The nanoparticles feature a
spherical or cubic shape with a diameter of 10-60 nm. Measurements of the zeta
potential showed that the particles are positively charged in the acidic sulfamate bath
and negatively charged in the alkaline pyrophosphate bath (Fig. 16, p. 42, Fig. 18, p. 43
and Fig. 25, p. 48). The hydrodynamic diameter of the particles in the aqueous
electrolytes is directly related to their surface charge. An increase in the hydrodynamic
diameter was found with decreasing absolute value of the zeta potential (Fig. 25, p. 48).
Regardless of the type of particles, the colloidal stability of the nanoparticle within the
nickel electrolytes was distinctly affected by the dispersant conditions such as pH and
ionic strength (Fig. 20, p. 45).
5.2 Conclusions for the Electrocodeposition of Nickel Composite Films
The ECD was carried out using various current modulations (i.e. DC, PP and PRP) and
electrode configurations (i.e. PPE and IJE). Additionally, the influence of certain
deposition parameters such as pH, composition and particle content of the bath as well
as current density, on the amount and the distribution of incorporated nanoparticles has
been analyzed. The effects of the deposition parameters on the ECD process were
investigated by evaluating the particle content using electrogravimetric analysis, EDX and
GD-OES. A maximum incorporation of 12 vol-% of 50 nm Al2O3 in a nickel matrix was
achieved using an IJE system (section 3.4), while PP and PRP resulted in composites with
particle contents up to 11 vol-% of 13 nm Al2O3 particles (section 3.3.2). In comparison,
DC depositions with the PPE system yielded composites with a maximum particle content
either of ~3.6 vol-% of 13 nm Al2O3 or ~10.4 vol-% of 21 nm TiO2 (section 3.3.1).
Conclusions and Suggested Future Work
96
The effect of the composition and pH of the electrolyte on the ECD of Ni-Al2O3 and
Ni-TiO2 composites (section 3.3) was studied using the PPE configuration and DC
deposition. The volume fraction of alumina (Fig. 28, p. 51) as well as titania (Fig. 29,
p. 52) in the layer showed a tendency to increase with increasing particle content of the
electrolyte and decreasing current density. It has been shown that negatively charged
particles (both Al2O3 as well as TiO2) co-deposit preferentially within the nickel matrix.
This finding, which is a little bit counterintuitive at the first glance, was explained with an
electrostatic model which takes into consideration the presence of ionic clouds around the
particle and on the electrode, respectively.
Furthermore, the effect of PP and PRP on the ECD of Ni-Al2O3 composites was
investigated using a PPE configuration. PP depositions were performed using rectangular
pulses with pulse frequencies ranging from 1.7 to 8 Hz, pulse duty cycles of 11-67 % and
a cathodic peak current density of either 5 or 10 A dm-2. The particle content of the
composite films increased with decreasing duty cycle and increasing pulse frequency (Fig.
30, p. 54). In PRP depositions, the incorporation of 13 nm Al2O3 particles was obviously
improved due to longer cathodic pulse times and lower anodic peak current densities
(Fig. 31, p. 55). High amounts of particle incorporation were found at low values of the
average current density. The amount of co-deposited alumina ranged from 2 to 11 vol-%
Al2O3 depending on the current modulation and the plating parameters (Fig. 31, p. 55).
An impinging jet electrode was used to study the influence of hydrodynamics on the ECD
of Ni-Al2O3 composites from an acidic sulfamate electrolyte. The process parameters
studied with the IJE system were flow rate, current density and particle loading of the
electrolyte. Maximum particle incorporation was found at flow rates of 2-3 l min-1
(Fig. 33, p. 58), at a current density of 10-15 A dm-2 (Fig. 35, p. 59), and at high particle
loadings of the electrolyte (Fig. 34, p. 58).
The effect of an external magnetic field on the codeposition of Co or Fe3O4 nanoparticles
with nickel was studied (section 3.5). It has been shown, that the ECD of these
nanoparticles in a Ni matrix is a versatile technique for the preparation of magnetic thin
films. The amount of particle incorporation ranged between 20 to 41 vol-% Co (Table 4,
p. 62) and 0 to 4 vol-% Fe3O4 (Fig. 39, p. 63). In general, decreasing current density and
increasing particle content of the electrolyte was found to enhance the particle
codeposition. The effect of a magnetic field on the particle incorporation has been shown
using two different orientations of the B field. In a parallel field the particle codeposition
decreased, whereas in a perpendicular field the particle content of the composite films
showed a tendency to increase (Table 4, p. 62). The improved particle codeposition in
the perpendicular orientation is most probably due to the magnetophoretic force, which
leads to an increase in the particle concentration at the electrode surface.
Conclusions and Suggested Future Work
97
5.3 Conclusions for the Structure and Properties of Nickel Composite Films
The structure (sections 3.6.1 and 3.6.2) as well as the mechanical (section 3.6.4) and
magnetic properties (section 3.6.5) of the composite films have been investigated as a
function of the particle content.
Surface morphology (Figs. 40 and 41, p. 65-66) and microstructure (Figs. 42-44, p. 67-
68) of the nickel matrix were significantly altered due to the codeposition of
nanoparticles. The pure nickel films from the sulfamate bath showed a field-oriented
nickel growth (Fig. 42, p. 67). Due to the nanoparticle incorporation the microstructure of
the nickel matrix changed from columnar to granular (Fig. 43, p. 68). In the case of the
pyrophosphate bath the pure nickel films as well as the nanocomposites exhibited a
granular nickel growth (Fig. 44, p. 68).
A strong (100) preferred orientation was found for the pure nickel film deposited from
the sulfamate bath, which has been reduced due to a change in the plating conditions
and the particle incorporation (Fig. 45, p. 69). The nanosized particles were found to
inhibit the nickel growth and thus lead to a smaller crystallite size (Table 6, p. 70)
combined with a distinct loss of texture (Table 5, p. 70). The pyrophosphate bath
promoted a Ni crystal growth in direction of the (111) plane (Fig. 45, p. 69). Both,
increasing current density and the particle incorporation became manifested in a loss of
texture (Table 5, p. 70).
EBSD mapping indicated that the inclusion of alumina nanoparticles preferentially takes
place in the grain boundary region, where the particles somehow terminate the nickel
growth (Fig. 47, p. 73). High-resolution TEM imaging of nanocomposites proved the
incorporation of alumina nanoparticles in the nickel matrix without any voids (Figs. 52
and 53, p. 78). Particle incorporation appeared in the form of single particles as well as
chains of particles (Fig. 51, p. 77). Moreover, the observation of lattice planes of the
polycrystalline nickel matrix gives a relatively clear picture about the interface between
particle and matrix (Fig. 53, p. 78).
The mechanical properties of the composite films were found to be dominated by the
crystallite size (Table 6, p. 70) and structure of the nickel matrix (Fig. 42-44, p. 67-68).
In the case of both nickel baths, the Vickers microhardness showed a tendency to
increase with the amount of particle incorporation and with decreasing current density
(Fig. 54, p. 79). According to the variation of the microhardness, the abrasion resistance
under unlubricated conditions increased with decreasing current density (Fig. 55, p. 81).
Conclusions and Suggested Future Work
98
The embedding of magnetic nanoparticles was found to affect the magnetic response,
i.e. saturation magnetization and coercivity, of the Ni matrix considerably. The magnetic
hardness of the Ni films was strongly increased by the incorporation of Co nanoparticles
(Table 8, p. 82). Moreover, the presence of a static magnetic field during the ECD
influences the amount of nanoparticle incorporation (Table 4, p. 62) which substantially
affects the magnetic hardness of the films (Table 8, p. 82).
5.4 Conclusions for the Modeling of the Electrocodeposition
The experimental results of the ECD of Ni-Al2O3 composites using the impinging jet
electrode system (section 3.4) have been described by a kinetic model based on a
detailed analysis of the particle flux to the electrode (section 4.1). The particle flux was
derived from an analysis of the total force acting on a rigid spherical particle in an
unbounded fluid in front of the electrode of the IJE system (Fig. 57, p. 84). The forces
considered are the convectional diffusion, gravity and buoyancy. The influence of
gravitational and buoyancy force were found to be negligible for 50 nm particles, but
they were identified to be important for bigger agglomerates in the range of 300-500 nm
(Fig. 59, p. 89). Comparison of the theoretical predictions values with the experimental
results (Fig. 62, p. 93) revealed discrepancies in the range of low as well as high particle
loadings of the electrolyte which can be explained with particle interactions in solution or
differences in the particle adsorption behavior. Both processes are mainly governed by
the interplay of either particle-particle or particle-electrode short range forces,
respectively. Moreover, the surface concentration of nanoparticles on the electrode might
not be zero indicating that the particle flux might not be under diffusion control.
5.5 Suggested Future Work
It has been shown in the present work, that both jet plating and pulse plating improved
the incorporation of alumina nanoparticles in a nickel matrix. However, different types of
alumina nanopowder have been used for the IJE and PPE experiments. Further
experiments and analysis with the IJE system are needed using the 13 nm alumina
nanoparticles. Additionally, a combination of both deposition techniques, i.e. jet and
pulse plating, seems promising in terms of an improvement of the amount and
distribution of particles in the composite film.
The kinetic model on ECD developed in this research should be improved or expanded by
further ECD experiments using the IJE system with varying particle types, sizes and
surface properties. Apart from the particle transport, the probability of particle
incorporation is affected by the particle adsorption onto the electrode. Therefore the
short-range forces acting between particle and electrode are of prime importance.
Colloidal probe microscopy experiments can be utilized to gain a better insight in these
short range forces.
Conclusions and Suggested Future Work
99
The recent particle size and the dispersion stability measurements have shown that one
of the most critical aspects of using nanoparticles in plating baths with high ionic
strengths is the difficulty to keep them in suspension and to prevent the agglomeration.
A surface treatment of the particles by grafting of polymer brushes can enable a
combined electrostatic and steric stabilization of the colloidal dispersion. A study utilizing
nanoparticles of the same chemical composition and with the same mean diameter, but
with different surface properties could help to further the understanding of the
mechanism by which particles are entrapped during the ECD process. Furthermore,
additives for the purpose of de-agglomeration of nanoparticles in electrolytes with high
ionic strengths should be explored. It is conceivable that smaller particle sizes in the
electrolyte also have significant effects on grain size and structure of the metal matrix,
which eventually affects the properties of the composite films. Smaller particles would
create more sites at which grain boundary pinning would occur.
Another influential surface property of the nanoparticles is their hydrophilicity, i.e. the
tendency of getting solvated by water. Due to the formation of a hydration layer around
the particles, they remain separated from the electrode by a small gap which
substantially affects the particle embedding by the growing metal matrix. The degree of
hydration, i.e. the thickness of the hydration layer, can be influenced by a proper
selection of the operating conditions such as particle characteristics and electrolyte
composition. Aqueous electrolytes are most commonly used for galvanic applications.
A partial or complete substitution of the water by organic solvents (e.g. methanol,
ethanol, etc.) can affect the state of hydration and therefore influence the interaction
between particle and electrode. Finally, the particle incorporation behavior might change
which can substantially alter the film properties.
Due to the nanoparticle incorporation, the structure and properties of the metal matrix
was found to change considerably. With reference to an industrial application a detailed
characterization of the chemical, electrical, and mechanical film properties is required.
Particularly, the effect of functional nanoparticles, e.g. microcapsules, on the
strengthening and corrosion mechanism of the metal matrix has to be elucidated in view
of an optimization of the film properties.
For the purpose of scaling-up or industrialization of the ECD process, the use of
experimental setups with a practical orientation combined with bigger and complexly
shaped substrates is mandatory. Additionally, a plan of procedures for electrolyte
monitoring, with special regard to a possible aging of the electrolyte dispersions, should
be developed.
Ehrenwörtliche Erklärung
XV
Ehrenwörtliche Erklärung
Hiermit versichere ich, dass ich die vorliegende Arbeit ohne unzulässige Hilfe Dritter und
ohne Benutzung anderer als der angegebenen Hilfsmittel angefertigt habe; die aus
fremden Quellen direkt oder indirekt übernommenen Gedanken sind als solche kenntlich
gemacht. Die Arbeit wurde bisher weder im Inland noch im Ausland in gleicher oder
ähnlicher Form einer anderen Prüfungsbehörde vorgelegt.
Die vorliegende Arbeit wurde am Institut für Physikalische Chemie und Elektrochemie der
Technischen Universität Dresden unter wissenschaftlicher Betreuung von Herrn PD A.
Bund und Herrn Prof. A. Eychmüller angefertigt.
Die Promotionsordnung der Fakultät Mathematik und Naturwissenschaften der
Technischen Universität Dresden vom 16. April 2003 erkenne ich an.
Dresden, 27. August 2008
Denny Thiemig
References
XVI
6 References
[1] J.-P. Celis, J.R. Roos, C. Buelens, J. Electrochem. Soc. 134 (1987) 1402.
[2] J.L. Stojak, J. Fransaer, J.B. Talbot, Review of Electrocodeposition, in: R.C. Alkire,
Kolb, D.M. (Eds.), Adv. Electrochem. Sci. Eng., Wiley-VCH Verlag, Weinheim, 2002.
[3] C.T.J. Low, R.G.A. Wills, F.C. Walsh, Surf. Coat. Technol. 201 (2006) 371.
[4] N.R.d. Tacconi, H. Wenren, K. Rajeshwar, J. Electrochem. Soc. 144 (1997) 3159.
[5] V. Medeliene, V. Stankevic, G. Bikulcius, Surf. Coat. Technol. 168 (2003) 161.
[6] M. Zhou, N.R.d. Tacconi, K. Rajeshwar, J. Electroanal. Chem. 421 (1997) 111.
[7] N.R.d. Tacconi, C.A. Boyles, K. Rajeshwar, Langmuir 16 (2000) 5665
[8] D. Thiemig, C. Kubeil, C.P. Gräf, A. Bund, Thin Solid Films (submitted).
[9] A. Roldan, E. Gómez, S. Pané, E. Vallés, J. Appl. Electrochem. 37 (2007) 575.
[10] S. Veprek, A.S. Argon, Surf. Coat. Technol. 146-147 (2001) 175.
[11] A.F. Zimmerman, G. Palumbo, K.T. Aust, U. Erb, Mater. Sci. Eng. A328 (2002) 137.
[12] Y.-J. Xue, D. Zhu, F. Zhao, J. Mater. Sci. 39 (2004) 4063.
[13] S. Tao, D.Y. Li, Nanotechnol. 17 (2006) 65.
[14] E.W. Brooman, Galvanotechnik (2006) 58.
[15] E. Brooman, Plat. Surf. Finish. 94 (2007) 38.
[16] A. Bund, D. Thiemig, Surf. Coat. Technol. 201 (2007) 7092.
[17] A. Bund, D. Thiemig, J. Appl. Electrochem. 37 (2007) 345.
[18] B. Bozzini, G. Giovannelli, P.L. Cavallotti, J. Microscop. 185 (1997) 283.
[19] L. Wang, Y. Gao, Q. Xue, H. Liu, T. Xu, Mater. Sci. Eng. A390 (2005) 313.
[20] P. Cojocaru, A. Vicenzo, P.L. Cavallotti, J. Solid State Electrochem. 9 (2005) 850–
858.
[21] V. Terzieva, J. Fransaer, J.-P. Celis, J. Electrochem. Soc. 147 (2000) 198.
[22] Y. Zhang, Y. Fan, X. Yang, Z. Chen, J. Zhang, Plat. Surf. Finish. (2004) 39.
[23] G. Vidrich, J.-F. Castagnet, H. Ferkel, J. Electrochem. Soc. 152 (2005) C294.
[24] X. Bin-shi, W. Hai-dou, D. Shi-yun, J. Bin, T. Wei-yi, Electrochem. Comm. 7 (2005)
572.
[25] P.-A. Gay, P. Berçot, J. Pagetti, Surf. Coat. Technol. 140 (2001) 147.
[26] W. Wang, F.Y. Hou, H. Wang, H.T. Guo, Scripta Mater. 53 (2005) 613.
[27] F. Hou, W. Wang, H. Guo, Appl. Surf. Sci. 252 (2006) 3812.
[28] S.W. Watson, J. Electrochem. Soc. 140 (1993) 2235.
[29] P. Nowak, R.P. Socha, M. Kaisheva, J. Fransaer, J.-P. Celis, Z. Stoinov, J. Appl.
Electrochem. 30 (2000) 429.
[30] A.F. Zimmerman, D.G. Clark, K.T. Aust, U. Erb, Mater. Lett. 52 (2002) 85.
[31] F. Hu, K.C. Chan, Appl. Surf. Sci. 233 (2004) 163.
[32] M. Kaisheva, J. Fransaer, J. Electrochem. Soc. 151 (2004) C89.
[33] A. Hovestad, L.J.J. Janssen, J. Appl. Electrochem. 25 (1995) 519.
References
XVII
[34] M. Musiani, Electrochim. Acta 45 (2000) 3397.
[35] J.-P. Celis, J. Fransaer, Galvanotechnik 88 (1997) 2229.
[36] T.-S. Chin, J. Magn. Magn. Mater 209 (2000) 75.
[37] D. Niarchos, Sens. Actuators, A A109 (2003) 166.
[38] M.R.J. Gibbs, E.W. Hill, P.J. Wright, J. Phys. D: Appl. Phys. 37 (2004) R237.
[39] W. Wang, Z. Yao, J.C. Chen, J. Fang, J. Micromech. Microeng. 14 (2004) 1321.
[40] M.R.J. Gibbs, J. Magn. Magn. Mater 290-291 (2005) 1298.
[41] E. Gómez, S. Pané, E. Vallés, Electrochem. Comm. 7 (2005) 1225.
[42] B.Y. Yoo, S.C. Hernandez, D.-Y. Park, N.V. Myung, Electrochim. Acta 51 (2006)
6346.
[43] M. Onoda, K. Shimizu, T. Tsuchiya, T. Watanabe, J. Magn. Magn. Mater 126 (1993)
595.
[44] T. Osaka, M. Takai, K. Hayashi, K. Ohashi, M. Satto, K. Yamada, Nature 392 (1998)
796.
[45] M. Takai, K. Hayashi, M. Aoyagi, T. Osaka, J. Electrochem. Soc. 144 (1997) L203.
[46] J.W. Judy, R.S. Muller, Sens. Actuators, A A53 (1996) 392.
[47] N.V. Myung, D.-Y. Park, B.-Y. Yoo, P.T.A. Sumodjo, J. Magn. Magn. Mater 265
(2003) 189.
[48] Y. Su, H. Wang, G. Ding, F. Cui, W. Zhang, W. Chen, IEEE Trans. Magn. 41 (2005)
4380.
[49] N. Guglielmi, J. Electrochem. Soc. 119 (1972) 1009.
[50] K. Helle, F. Walsh, Trans. Inst. Met. Finish. 75 (1997) 53.
[51] P.M. Vereecken, I. Shao, P.C. Searson, J. Electrochem. Soc. 147 (2000) 2572.
[52] J. Fransaer, J.-P. Celis, Galvanotechnik 92 (2001) 1544.
[53] S.-C. Wang, W.-C.J. Wei, Mater. Chem. Phys. 78 (2003) 574.
[54] P. Xiong-Skiba, D. Engelhaupt, R. Hulguin, B. Ramsey, J. Electrochem. Soc. 152
(2005) C571.
[55] J. Fransaer, J.-P. Celis, J.R. Roos, J. Electrochem. Soc. 139 (1992) 413.
[56] D.L. Wang, J. Li, C.S. Dai, X.G. Hu, J. Appl. Electrochem. 29 (1999) 437.
[57] F. Wünsche, A. Bund, W. Plieth, J. Solid State Electrochem. 3 (2004) 209.
[58] J.L. Stojak, J.B. Talbot, J. Electrochem. Soc. 146 (1999) 4504.
[59] A. Hovestad, R.J.C.H.L. Heesen, L.J.J. Janssen, J. Appl. Electrochem. 29 (1999) 331.
[60] L. Stappers, J. Fransaer, J. Electrochem. Soc. 152 (2005) C392.
[61] C.M.A. Brett, A.M.O. Brett, Electrochemistry Principles, Methods, and Applications,
Oxford University Press, Oxford, New York, Tokyo, 1993.
[62] R.C. Alkire, T.J. Chen, J. Electrochem. Soc. 129 (1982) 2424.
[63] C. Karakus, D.T. Chin, J. Electrochem. Soc. 141 (1994) 691.
[64] M. Okumiya, H. Takeuchi, Y. Tsunekawa, J. Jpn. Inst. Met. 59 (1995) 640.
[65] H. Takeuchi, Y. Tsunekawa, M. Okumiya, Mater. Trans. 38 (1997) 43.
References
XVIII
[66] H. Takeuchi, S. Tamura, Y. Tsunekawa, M. Okumiya, Surf. Eng. 20 (2004) 25.
[67] I. Garcia, A. Conde, G. Langelaan, J. Fransaer, J.-P. Celis, Corr. Sci. 45 (2003)
1173.
[68] E.B. Budevski, G.T. Staikov, W.J. Lorenz, Electrochemical Phase Formation and
Growth. An Introduction to the Initial Stages of Metal Deposition, Wiley-VCH, Weinheim,
1996.
[69] J.C. Puippe, Pulse-Plating, Leuze Verlag, Bad Saulgau, 1986.
[70] C. Kollia, Z. Loizos, N. Spyrellis, Surf. Coat. Technol. 45 (1991) 155.
[71] P.T. Tang, T. Watanabe, J.E.T. Andersen, G. Bech-Nielsen, J. Appl. Electrochem. 25
(1995) 347.
[72] R. Mishra, R. Balasubramaniam, Corr. Sci. 46 (2004) 3019.
[73] C.Y. Dai, Y. Pan, S. Jiang, Y.C. Zhou, Surf. Rev. Lett. 11 (2004) 433.
[74] A.B. Vidrine, E.J. Podlaha, J. Appl. Electrochem. 31 (2001) 461.
[75] M.E. Bahrololoom, R. Sani, Surf. Coat. Technol. (2005) 154.
[76] E.A. Pavlatou, M. Stroumbouli, P. Gyftou, N. Spyrellis, J. Appl. Electrochem. 36
(2006) 385.
[77] E.J. Podlaha, D. Landolt, J. Electrochem. Soc. 144 (1997) L200.
[78] E.J. Podlaha, Nano Lett. 1 (2001) 413.
[79] B. Müller, H. Ferkel, Nanostruct. Mater. 10 (1998) 1285.
[80] J. Steinbach, H. Ferkel, Scripta Mater. 44 (2001) 1813.
[81] A.M.J. Kariapper, J. Foster, Trans. Inst. Met. Finish. 52 (1974) 87.
[82] D. Baudrand, Met. Fin. 94 (1996) 15.
[83] M. Schlesinger, M. Paunovic, Modern Electroplating, John Wiley & Sons, New York,
2000.
[84] C.S. Lin, C.Y. Lee, C.F. Chang, C.H. Chang, Surf. Coat. Technol. 200 (2006) 3690.
[85] J.B. Talbot, Plat. Surf. Finish. 91 (2004) 60.
[86] L. Shi, C. Sun, P. Gao, F. Zhou, W. Liu, Appl. Surf. Sci. 252 (2006) 3812.
[87] N.S. Qu, D. Zhu, K.C. Chan, Scripta Mater. 54 (2006) 1421.
[88] S. Steinhäuser, B. Wielage, Surf. Eng. 13 (1997) 289.
[89] G.C. Fink, J.D. Prince, Trans. Am. Electrochem. Soc. 54 (1928) 315
[90] E.C. Kedward, K.W. Wright, Plat. Surf. Finish. 65 (1978) 38.
[91] V.P. Greco, Plat. Surf. Finish. 76 (1989) 62.
[92] V.P. Greco, Plat. Surf. Finish. 76 (1989) 68.
[93] H. Abi-Akar, C. Riley, Chem. Mater. 8 (1996) 2601
[94] J.R. Groza, J.C. Gibeling, Mater. Sci. Eng. A 171 (1993) 115
[95] J.L. Stojak, An Investigation of Electrocodeposition using a Rotating Cylinder
Electrode, PhD thesis, University of California, San Diego, 1997.
[96] G. Cârâc, A. Bund, D. Thiemig, Surf. Coat. Technol. 202 (2007) 403.
[97] P.R. Webb, N.L. Robertson, J. Electrochem. Soc. 141 (1994) 669.
References
XIX
[98] J.P. Celis, H. Kelchtermans, J.R. Roos, Trans. Inst. Met. Fin. 56 (1978) 41.
[99] Z. Serhal, J. Morvan, M. Rezrazi, P. Berçot, Surf. Coat. Technol. 140 (2001) 166.
[100] J.L. Valdes, Deposition of Colloidal Particles in Electrochemical Systems, PhD
thesis, Columbia University, New York, 1987.
[101] R.J. Hunter, Foundations of Colloid Science, 2nd edition, Oxford University Press,
Oxford, New York, 2001.
[102] A.J. Bard, L.R. Faulkner, Electrochemical methods. Fundamentals and applications,
2nd Edition, John Wiley and Sons, New York, 2001.
[103] G. Gouy, J. Physique 9 (1910) 457.
[104] D.L. Chapman, Phil. Mag. 25 (1913) 475.
[105] Zetasizer Nano Series User Manual, Issue 2.1, Malvern Instruments Ltd.,
Worcestershire, United Kingdom, July 2004.
[106] D. Myers, Surfaces, Interfaces and Colloids - Principles and Applications, 2nd
edition, Wiley-VCH, New York, 1999.
[107] G.A. Parks, Chem. Rev. 65 (1965) 177.
[108] C.R. Evankoa, R.F. Delisioa, D.A. Dzombaka, J. J. W. Novak, Colloids Surf., A 125
(1997) 95.
[109] B.V. Deryagin, L. Landau, Acta Physiochim. U.R.S.S. 14 (1941) 633.
[110] E.J.W. Verwey, J.T.G. Overbeek, Theory of the stability of lyophobic colloids,
Elsevier Publ. Comp., Amsterdam, New York, 1948.
[111] S. Steinhäuser, Galvanotechnik 92 (2001) 940.
[112] J.P. Celis, J.R. Roos, J. Electrochem. Soc. 124 (1977) 1508.
[113] J.W. Graydon, D.W. Kirk, J. Electrochem. Soc. 137 (1990) 2061.
[114] I. Shao, P.M. Vereecken, R.C. Cammarata, P.C. Searson, J. Electrochem. Soc. 149
(2002) C610.
[115] J. Lee, J.B. Talbot, J. Electrochem. Soc. 154 (2007) D70.
[116] A. Bund, D. Thiemig, ECS Trans. 3 (2006) 85.
[117] D. Thiemig, R. Lange, A. Bund, Electrochim. Acta 52 (2007) 7362.
[118] M. Eisenberg, C.W. Tobias, C.R. Wilke, J. Electrochem. Soc. 101 (1954) 306.
[119] J.S. Newman, K.E. Thomas-Alyea, Electrochemical Systems, 3rd edition, John Wiley
& Sons Inc., Hoboken, New Jersey, 2004.
[120] Q. Li, J.D.A. Walker, AIChE J. 42 (1996) 391.
[121] D.-T. Chin, K.-L. Hsueh, Electrochim. Acta 31 (1986) 561.
[122] S.J. Osborne, Electrocodeposition of Nanoparticle Composite Films Using an
Impinging Jet Electrode, PhD thesis, University of California, San Diego, 2005.
[123] C. Buelens, J.P. Celis, J.R. Roos, J. Appl. Electrochem. 13 (1983) 541.
[124] R. Peipmann, J. Thomas, A. Bund, Electrochim. Acta 52 (2007) 5808.
[125] T.Z. Fahidy, J. Electrochem. Soc. 18 (1973) 607.
[126] R.A. Tacken, L.J.J. Janssen, J. Appl. Electrochem. 25 (1995) 1.
References
XX
[127] A. Bund, S. Koehler, H.H. Kuehnlein, W. Plieth, Electrochim. Acta 49 (2003) 147.
[128] G. Hinds, F.E. Spada, J.M.D. Coey, T.R.N. Mhíocháin, M.E.G. Lyons, J. Phys. Chem.
B 105 (2001) 9487.
[129] R.P. Socha, P. Nowak, K. Laajalehto, J. Väyrynen, Colloids Surf., A 235 (2004) 45.
[130] N. Kanani, Electroplating - Basic Principles, Processes and Practice, Elsevier,
Oxford, 2004.
[131] W. Plieth, Electrochemistry for Materials Science, Elsevier, Amsterdam, 2007.
[132] W.H. Safranek, The Properties of Electrodeposited Metals and Alloys: A Handbook,
American Elsevier Publishing Company, New York, 1974.
[133] F. Ebrahimi, G.R. Bourne, M.S. Kelly, T.E. Matthews, Nanostruct. Mater. 11 (1999)
343.
[134] L.W. Bruch, M.W. Cole, E. Zaremba, Physical Adsorption: Froces and Phenomena,
Oxford University Press Inc., New York, 1997.
[135] C. Dedeloudis, J. Fransaer, Langmuir 20 (2004) 11030.
[136] S.W. Banovic, K. Barmak, A.R. Marder, J. Mater. Sci. 33 (1998) 639.
[137] W.S. Sweet, Investigations to Electrocodepsition using an Impinging Jet Electrode,
Master thesis, University of California, San Diego, 2006.
[138] S.J. Osborne, W.S. Sweet, K.S. Vecchio, J.B. Talbot, J. Electrochem. Soc. 154
(2007) D394.
[139] S.J. Osborne, W.S. Sweet, J.B. Talbot, Electroplating Nanocomposite Films with an
Impinging Jet Electrode, AESF Annual International Technical Conference, American
Electroplaters and Surface Finishers Society, La Jolla, 2005, pp. 185.
[140] K. Barmak, S.W. Banovic, C.M. Petronis, D.F. Susan, A.R. Marder, J. Microscop.
185 (1997) 265.
[141] H. Czichos, T. Saito, L. Smith (Eds.), Springer Handbook of Materials Measurement
Methods, 1, Springer Verlag, Berlin, 2006.
[142] R.S. Kottada, A.H. Chokshi, Scripta Mater. 53 (2005) 887.
[143] M. Ettlinger, Highly Dispersed Metallic Oxides Produced by the AEROSIL® Process,
Degussa.
[144] A.F. Holleman, E. Wiberg, Lehrbuch der Anorganischen Chemie, 101. Auflage,
Walter de Gruyter & Co., Berlin, 1995.
[145] Buehler Ltd., Material Safety Data Sheet - Buehler Micropolish II, Lake Bluff, USA,
15.03.2007.
[146] C.P. Gräf, R. Birringer, A. Michels, Phys. Rev. B 73 (2006) 212401.
[147] R. Massart, IEEE Trans. Magn. 17 (1981) 1247.
[148] C. Galindo-Gonzáles, J.d. Vicente, M.M. Ramos-Tejada, M.T. López-López, F.
Gonzáles-Cabarello, J.D.G. Durán, Langmuir 21 (2005) 4410.
[149] Y. Sahoo, A. Goodarzi, M.T. Swihart, T.Y. Ohulchansky, N. Kaur, E.P. Furlani, P.N.
Prasad, J. Phys. Chem. 109 (2005) 3879.
References
XXI
[150] A. Ditsch, P.E. Laibinis, D.I.C. Wang, T.A. Hatton, Langmuir 21 (2005) 6006.
[151] G. Gnanaprakash, S. Mahadevan, T. Jayakumar, P. Kalyanasundaram, J. Philip, B.
Raj, Mater. Chem. Phys. 103 (2007) 168.
[152] A. Bund, H.H. Kuehnlein, J. Phys. Chem. 109 (2005) 19845.
[153] R. Schumacher, Angew. Chem. Int. Ed. 29 (1990) 329.
[154] A. Bund, Die Quarzmikrowaage in Rheologie und Elektrochemie: Fortschritte in der
Signalauswertung durch Netzwerkanalyse, Dissertation, Saarland University,
Saarbrücken, 1999.
[155] A. Bund, G. Schwitzgebel, Electrochim. Acta 45 (2000) 3703.
[156] H.H. Kühnlein, Elektrochemische Legierungsabscheidung zur Herstellung von
Cu2ZnSnS4 Dünnschichtsolarzellen, Dissertation, Technische Universität Dresden, 2007.
[157] G. Sauerbrey, Z. Phys. 155 (1959) 206.
[158] T. Sobisch, D. Lerche, Colloid Polym. Sci. 278 (2000) 369.
[159] M. Birkholz, Thin Film Analysis by X-Ray Scattering, Wiley-VCH, Weinheim, 2006.
[160] A.J. Schwartz, M. Kumar, B.L. Adams (Eds.), Electron Backscatter Diffraction in
Materials Science, Kluwer Academic / Plenum Publishers, New York, 2000.
[161] D. Brandon, W.D. Kaplan, Microstructural Characterization of Materials, John Wiley
& Sons, Chichester, 1999.
[162] D. Grunenberg, D. Sommer, K.H. Koch, Fresenius Z. Anal. Chem. 319 (1984) 665.
[163] R. Payling, D. Jones, A. Bengston (Eds.), Glow Discharge Optical Emission
Spectrometry, John Wiley & Sons, Chichester, 1997.
[164] H.P. Klug, L.E. Alexander, X-Ray Diffraction Procedures, 2. ed., John Wiley & Sons,
New York, 1974.
[165] D.H. Jeong, F. Gonzalez, G. Palumbo, K.T. Aust, U. Erb, Scripta Mater. 44 (2001)
493.
[166] S. Chikazumi, International series of monographs on physics: Physics of
Ferromagnetism, 2nd Edition, Clarendon Press, Oxford, 1997.
[167] P.C. Hidber, T.J. Graule, L.J. Gauckler, J. Am. Ceram. Soc. 79 (1996) 1857.
[168] M. Kosmulski, P. Dahlsten, P. Próchniak, J.B. Rosenholm, Colloids Surf., A 301
(2007) 425.
[169] S.H. Behrens, D.G. Grier, J. Chem. Phys. 115 (2001) 6716.
[170] V.F. Puntes, K.M. Krishnan, A.P. Alivisatos, Science 291 (2001) 2115.
[171] V.F. Puntes, K.M. Krishnan, P. Alivisatos, Appl. Phys. Lett. 78 (2001) 2187.
[172] J. Waddell, S. Inderhees, M.C. Aronson, S.B. Dierker, J. Magn. Magn. Mater 297
(2006) 54.
[173] S. Sun, C.B. Murray, J. Appl. Phys. 85 (1999) 4325.
[174] I. Nedkov, M. Ausloos (Eds.), Nano-Crystalline and Thin Film Magnetic Oxides,
Kluwer Academic Publishers, Dordrecht, 1999.
[175] W. Yu, T. Zhang, J. Zhang, X. Qiao, L. Yang, Y. Liu, Mater. Lett. 60 (2006) 2298.
References
XXII
[176] L. Campanella, J. Electroanal. Chem. 28 (1970) 228.
[177] D. Thiemig, A. Bund, Surf. Coat. Technol. 202 (2008) 2976.
[178] D. Thiemig, A. Bund, J.B. Talbot, J. Electrochem. Soc. 154 (2007) D510.
[179] B.J. Hwang, C.S. Hwang, J. Electrochem. Soc. 140 (1993) 979.
[180] E. Tóth-Kádár, I. Bakonyi, L. Pogány, Á. Cziráki, Surf. Coat. Technol. 88 (1996) 57.
[181] D. Thiemig, A. Bund, J.B. Talbot, Electrochim. Acta (2008) accepted.
[182] F. Erler, C. Jakob, H. Romanus, L. Spiess, B. Wielage, T. Lampke, S. Steinhäuser,
Electrochim. Acta 48 (2003) 3063.
[183] M. Stroumbouli, P. Gyftou, E.A. Pavlatou, N. Spyrellis, Surf. Coat. Technol. 195
(2005) 325.
[184] W.-H. Lee, S.-C. Tang, K.-C. Chung, Surf. Coat. Technol. 120-121 (1999) 607.
[185] C. Kollia, N. Spyrellis, J. Amblard, M. Froment, G. Maurin, J. Appl. Electrochem. 20
(1990) 1025.
[186] V. Medeliene, Surf. Coat. Technol. 154 (2002) 104.
[187] L. Du, B. Xu, S. Dong, H. Yang, Y. Wu, Surf. Coat. Technol. 192 (2005) 311.
[188] H. Matsushima, A. Bund, W. Plieth, S. Kikuchi, Y. Fukunaka, Electrochim. Acta 53
(2007) 161.
[189] H. Matsushima, A. Ispas, A. Bund, W. Plieth, Y. Fukunaka, J. Solid State
Elecrochem. 11 (2007) 737.
[190] A. Bund, A. Ispas, J. Electroanal. Chem. 575 (2005) 221.
[191] A. Ispas, H. Matsushima, W. Plieth, A. Bund, Electrochim. Acta 52 (2007) 2785.
[192] C.S. Lin, P.C. Hsu, L. Chang, C.H. Chen, J. Appl. Electrochem. 31 (2001) 925.
[193] F. Ebrahimi, Z. Ahmed, J. Appl. Electrochem. 33 (2003) 733.
[194] Á. Cziráki, B. Fogarassy, I. Geröcs, E. Tóth-Kádár, I. Bakonyi, J. Mater. Sci. 29
(1994) 4771.
[195] L. Benea, P.L. Bonora, A. Borello, S. Martelli, F. Wenger, P. Ponthiaux, J. Galland,
Solid State Ionics 151 (2002) 89.
[196] T. Lampke, B. Wielage, D. Dietrich, A. Leopold, Appl. Surf. Sci. 253 (2006) 2399.
[197] S.K. Panikkar, T.L.R. Char, J. Electrochem. Soc. 106 (1959) 495.
[198] E.O. Hall, Proc. Phys. Soc. Lond. B64 (1951) 747.
[199] N.J. Petch, J. Iron Steel Inst. 174 (1953) 25.
[200] I. Garcia, J. Fransaer, J.-P. Celis, Surf. Coat. Technol. 148 (2001) 171.
[201] W. Kleinekathöfer, C.J. Raub, Surf. Technol. 7 (1978) 23.
[202] W. Kleinekathöfer, C.J. Raub, E. Raub, Metalloberfläche 36 (1982) 411.
[203] M. Klingenberg, E.W. Brooman, T.A. Naguy, Plat. Surf. Finish. 92 (2005) 42.
[204] L. Chen, L. Wang, Z. Zeng, T. Xu, Surf. Coat. Technol. 201 (2006) 599.
[205] F. Cadieu, T. Cheung, L. Wickramasekara, N. Kamprath, IEEE Trans. Magn. 22
(1986) 752.
[206] L. Castaldi, M.R.J. Gibbs, H.A. Davies, J. Appl. Phys. 96 (2004) 5063.
References
XXIII
[207] S.L. Tang, M.R.J. Gibbs, H.A. Davies, Z.W. Liu, S.C. Lane, N.E. Mateen, J. Appl.
Phys. 101 (2007) 013910/1.
[208] S.L. Tang, M.R.J. Gibbs, H.A. Davies, Z.W. Liu, S.C. Lane, N.E. Mateen, Y.W. Du, J.
Appl. Phys. 101 (2007) 09K501/1.
[209] T.-J. Chen, Selective Jet Plating, PhD Thesis, University of Illinois, Urbana-
Champaign, 1981.
[210] C. Karakus, Metal Thickness Distribution in Jet Plating, Master Thesis, Clarkson
University, 1992.
[211] CRC Handbook of Chemistry and Physics on CD-ROM, Version 2006, CRC Press
LLC., 2006.
[212] L. Stappers, J. Fransaer, J. Electrochem. Soc. 154 (2007) D598.