Infos Prix 1
34
INFOS-PRIX REPUBLIQUE DU CAMEROUN PAIX-TRAVAIL-PATRIE --------------- REPUBLIC OFCAMEROON PEACE-WORK-FATHERLAND ------------------ MINISTERE DE L’AGRICULTUREET DU DEVELOPPEMENT RURAL ----------------- MINISTRY OF AGRICULTUREAND RURAL DEVELOPMENT ----------------- SECRETARIAT GENERAL --------------- SECRETARIAT GENERAL ---------------- DIRECTION DES ENQUETES ET DES STATISTIQUES AGRICOLES -------------------------- DEPARTMENT OF AGRICULTURAL SURVEYS AND STATISTICS ----------------- CELLULE DES INFORMATIONS ET DE L’ALERTE RAPIDE ---------------- INFORMATION & EARLY WARNING UNIT ----------------- N°000 FEVRIER 2009 Direction des Enquêtes et des Statistiques Agricoles Publication semestrielle sur les prix des produits et intrants agricoles
Transcript of Infos Prix 1
INFOS-PRIX
REPUBLIQUE DU CAMEROUN PAIX-TRAVAIL-PATRIE ---------------
REPUBLIC OFCAMEROON
PEACE-WORK-FATHERLAND ------------------
MINISTERE DE L’AGRICULTUREET DU DEVELOPPEMENT RURAL
-----------------
MINISTRY OF AGRICULTUREAND RURAL DEVELOPMENT
-----------------
SECRETARIAT GENERAL ---------------
SECRETARIAT GENERAL ----------------
DIRECTION DES ENQUETES ET DES STATISTIQUES AGRICOLES
--------------------------
DEPARTMENT OF AGRICULTURAL SURVEYS AND STATISTICS
-----------------
CELLULE DES INFORMATIONS ET DE L’ALERTE RAPIDE
----------------
INFORMATION & EARLY WARNING UNIT -----------------
N°000
FEVRIER 2009
Direction des Enquêtes et des Statistiques Agricoles
Publication semestrielle sur les prix
des produits et intrants agricoles
2
PRESENTATION La Direction des Enquêtes et des Statistiques Agricoles est chargée entre autres de la publication et de la diffusion des informations statistiques sur le secteur agricole.
La publication mensuelle de « EARLY WARNING INFORMATION FLASH» entre en droite ligne de cette mission. Elle publie chaque mois des informations sur :
� La campagne agricole en cours ; � Les prévisions des récoltes et des disponibilités alimentaires ; � Les menaces de la sécurité alimentaire ; � Les marchés des produits vivriers.
AGRI STAT, première publication des statistiques agricoles, paraît annuellement. Les décideurs, les organisations professionnelles, les étudiants et les chercheurs peuvent y trouver :
� Des données sur les superficies et les productions des cultures vivrières du secteur traditionnel ; � Les productions du secteur moderne ; � Les consommations intermédiaires des produits agricoles par certaines industries nationales ; � Des données concernant des échanges commerciaux ; � Les facteurs de production.
Pour tous ceux qui désirent élaborer des comptes d’exploitation au bénéfice des entreprises de production et de commercialisations agricoles, ils sont obligés d’attendre 12 mois pour avoir des informations sur l’évolution des prix de facteurs de production et celui des prix sur les 116 marchés suivis par le MINADER.
Aujourd’hui, « INFOS PRIX » vient raccourcir les délais en réactualisant tous les 06 mois les données pour les comptes d’exploitations prévisionnelles.. Il permet à tous les acteurs du développement de garder une bonne lisibilité sur l’évolution des prix des produits vivriers ainsi que ceux des facteurs de production.
Pour ce premier numéro, Infos prix, récapitule les prix sur toute l’année 2008.
Une publication de la DESA Rédaction Centrale: CIAR
Correspondants Régionaux:
Chefs Services Régionaux des Enquêtes et Statistiques Agricoles
3
LISTE DES TABLEAUX Pages
Tableau N°1 : CORRESPONDANCE DES DIFFERENTS UML SUR LE MARCHE DE YABASSI EN 2008 6
Tableau N°2 : EVOLUTION DES PRIX (FCFA/KG) DES PRODUITS VIVRIERS EN 2008 SUR LE MARCHE DE YABASSI 6
Tableau N°3 : CORRESPONDANCE DES DIFFERENTS UML SUR LE MARCHE D'EDEA EN 2008 7
Tableau N°4 : EVOLUTION DES PRIX (FCFA/Kg) DES PRODUITS VIVRIERS EN 2008 SUR LE MARCHE D'EDEA 7
Tableau N°5 : CORRESPONDANCE DES DIFFERENTS UML SUR LE MARCHE DE NEW-DEIDO DOUALA EN 2008 8
Tableau N°6 : EVOLUTION DES PRIX (FCFA/Kg) DES PRODUITS VIVRIERS EN 2008 SUR LE MARCHE DE NEW-DEIDO 8
Tableau N°7 : CORRESPONDANCE DES DIFFERENTS UML SUR LE MARCHE DE BASSA DOUALA EN 2008 8
Tableau N°8 : EVOLUTION DES PRIX (FCFA/Kg) DES PRODUITS VIVRIERS EN 2008 SUR LE MARCHE PK 14 BASSA-
DOUALA 8
Tableau N°9 : CORRESPONDANCE DES DIFFERENTS UML SUR LE MARCHE DE NKONGSAMBA EN 2008 9
Tableau N°10 : EVOLUTION DES PRIX (FCFA/KG) DES PRODUITS VIVRIERS EN 2008 SUR LE MARCHE DE
NKONGSAMBA 9
Tableau N°11 : CORRESPONDANCE DES DIFFERENTS UML SUR LE MARCHE DE BATOURI EN 2008 10
Tableau N°12 : EVOLUTION DES PRIX (FCFA/KG) DES PRODUITS VIVRIERS EN 2008 SUR LE MARCHE DE BATOURI 10
Tableau N°13 : CORRESPONDANCE DES DIFFERENTS UML SUR LE MARCHES D’EBOLOWA EN 2008 11
Tableau N°14 : EVOLUTION DES PRIX (FCFA/Kg) DES PRODUITS VIVRIERS EN 2008 SUR LE MARCHE D’EBOLOWA 12
Tableau N°15 : EVOLUTION DES PRIX (FCFA/KG) DES PRODUITS VIVRIERS EN 2008 SUR LE MARCHE DE
SANGMELIMA 12
Tableau N°16 : CORRESPONDANCE DES DIFFERENTS UML SUR LE MARCHE D’ABANG MINKO EN 2008 13
Tableau N°17 : EVOLUTION DES PRIX (FCFA/KG) DES PRODUITS VIVRIERS AU DEUXIEME SEMESTRE 2008 SUR LE
MARCHE FRONTALIER D'ABANG MINKO 13
Tableau N°18 : EVOLUTION DES PRIX (FCFA/Kg) DES PRODUITS VIVRIERS EN 2008 SUR LE MARCHE DE
NGAOUNDERE 14
Tableau N°19 : CORRESPONDANCE DES DIFFERENTS UML SUR LE MARCHE DE NGAOUNDAL EN 2008 14
Tableau N20° : EVOLUTION DES PRIX (FCFA/Kg) DES PRODUITS VIVRIERS EN 2008 SUR LE MARCHE DE TIBATI 14
Tableau N°21 : EVOLUTION DES PRIX (FCFA/Kg) DES PRODUITS VIVRIERS EN 2008 SUR LE MARCHE DE MBERE 15
Tableau N°22 : EVOLUTION DES PRIX (FCFA/Kg) DES PRODUITS VIVRIERS EN 2008 SUR LE MARCHE DE BANYO 15
Tableau N°23 : EVOLUTION DES PRIX (FCFA/Kg) DES PRODUITS VIVRIERS EN 2008 SUR LE MARCHE DE MAYO-DARLE 15
Tableau N°24 : EVOLUTION DES PRIX (FCFA/Kg) DES PRODUITS VIVRIERS EN 2008 SUR LE MARCHE DE GAROUA 16
Tableau N°25 : EVOLUTION DES PRIX (FCFA/Kg) DES PRODUITS VIVRIERS EN 2008 SUR LE MARCHE DE GUIDER 16
Tableau N°26 : EVOLUTION DES PRIX (FCFA/Kg) DES PRODUITS VIVRIERS EN 2008 SUR LE MARCHE DE POLI 17
Tableau N°27 : EVOLUTION DES PRIX (FCFA/Kg) DES PRODUITS VIVRIERS EN 2008 SUR LE MARCHE DE TCHOLLIRE 17
Tableau N°28 : EVOLUTION DES PRIX (FCFA/KG) DES PRODUITS VIVRIERS EN 2008 SUR LE MARCHE DE KAELE 18
Tableau N°29 : EVOLUTION DES PRIX (FCFA/KG) DES PRODUITS VIVRIERS EN 2008 SUR LE MARCHE DE MAROUA 18
Tableau N°30 : EVOLUTION DES PRIX (FCFA/KG) DES PRODUITS VIVRIERS EN 2008 SUR LE MARCHE DE KOUSSERIE 18
Tableau N°31 : EVOLUTION DES PRIX (FCFA/KG) DES PRODUITS VIVRIERS EN 2008 SUR LE MARCHE DE MORA 19
Tableau N°32 : EVOLUTION DES PRIX (FCFA/KG) DES PRODUITS VIVRIERS EN 2008 SUR LE MARCHE DE MOKOLO 19
Tableau N°33 : EVOLUTION DES PRIX (FCFA/KG) DES PRODUITS VIVRIERS EN 2008 SUR LE MARCHE DE YAGOUA 19
Tableau N°34 : EVOLUTION DES PRIX (FCFA/KG) DES PRODUITS VIVRIERS AU DEUXIEME SEMESTRE 2008 SUR LE
MARCHE DE MUEA 20
Tableau N°35 : EVOLUTION DES PRIX (FCFA/Kg) DES PRODUITS VIVRIERS AU DEUXIEME SEMESTRE EN 2008 SUR LE
MARCHE DE MUYUKA b 20
Tableau N°36 : EVOLUTION DES PRIX (FCFA/Kg) DES PRODUITS VIVRIERS AU DEUXIEME SEMESTRE 2008 SUR LE
MARCHE DE MANFE 21
Tableau N°37 : EVOLUTION DES PRIX (FCFA/Kg) DES PRODUITS VIVRIERS EN 2008* SUR LE MARCHE DE KUMBA 21
Tableau N°38 : EVOLUTION DES PRIX (FCFA/Kg) DES PRODUITS VIVRIERS EN 2008 SUR LE MARCHE DE MILE 20 22
Tableau N°39 : EVOLUTION DES PRIX (FCFA/Kg) DES PRODUITS VIVRIERS AU DEUXIEME SEMESTRE 2008 SUR LE
MARCHE DE NKONGLE 22
Tableau N°40 : EVOLUTION DES PRIX (FCFA/Kg) DES PRODUITS VIVRIERS EN 2008 SUR LE MARCHE DE ALOU 22
Tableau N°41 : EVOLUTION DES PRIX (FCFA/Kg) DES PRODUITS VIVRIERS EN 2008 SUR LE MARCHE D'EKONDO TITI 23
Tableau N°42 : EVOLUTION DES PRIX (FCFA/Kg) DES PRODUITS VIVRIERS EN 2008 SUR LE MARCHE DE MVOG-MBI 23
4
Tableau N°43 : EVOLUTION DES PRIX (FCFA/Kg) DES PRODUITS VIVRIERS EN 2008 SUR LE MARCHE DE MONATELE 23
Tableau N°44 : EVOLUTION DES PRIX (FCFA/Kg) DES PRODUITS VIVRIERS EN 2008 SUR LE MARCHE D'AKONOLINGA 24
Tableau N°45 : EVOLUTION DES PRIX (FCFA/Kg) DES PRODUITS VIVRIERS EN 2008 SUR LE MARCHE D'ESEKA 24
Tableau N°46 : EVOLUTION DES PRIX (FCFA/Kg) DES PRODUITS VIVRIERS EN 2008 SUR LE MARCHE DE LIMBE 25
Tableau N°47 : EVOLUTION DES PRIX (FCFA/Kg) DES PRODUITS VIVRIERS EN 2008 SUR LE MARCHE DE MUDEMBA 26
Tableau N°48 : EVOLUTION DES PRIX (FCFA/Kg) DES PRODUITS VIVRIERS EN 2008 SUR LE MARCHE DE MENJI 27
Tableau N°49 : PRIX MOYEN DU PETIT MATERIEL AGRICOLE EN 2008 DANS LA PROVINCE DU NORD OUEST 29
Tableau N°50 : PRIX MOYEN DES PESTICIDES EN 2008 DANS LA PROVINCE DU NORD OUEST 29
Tableau N°51 : PRIX MOYEN DES ENGRAIS EN 2008 DANS LA PROVINCE DU NORD OUEST 29
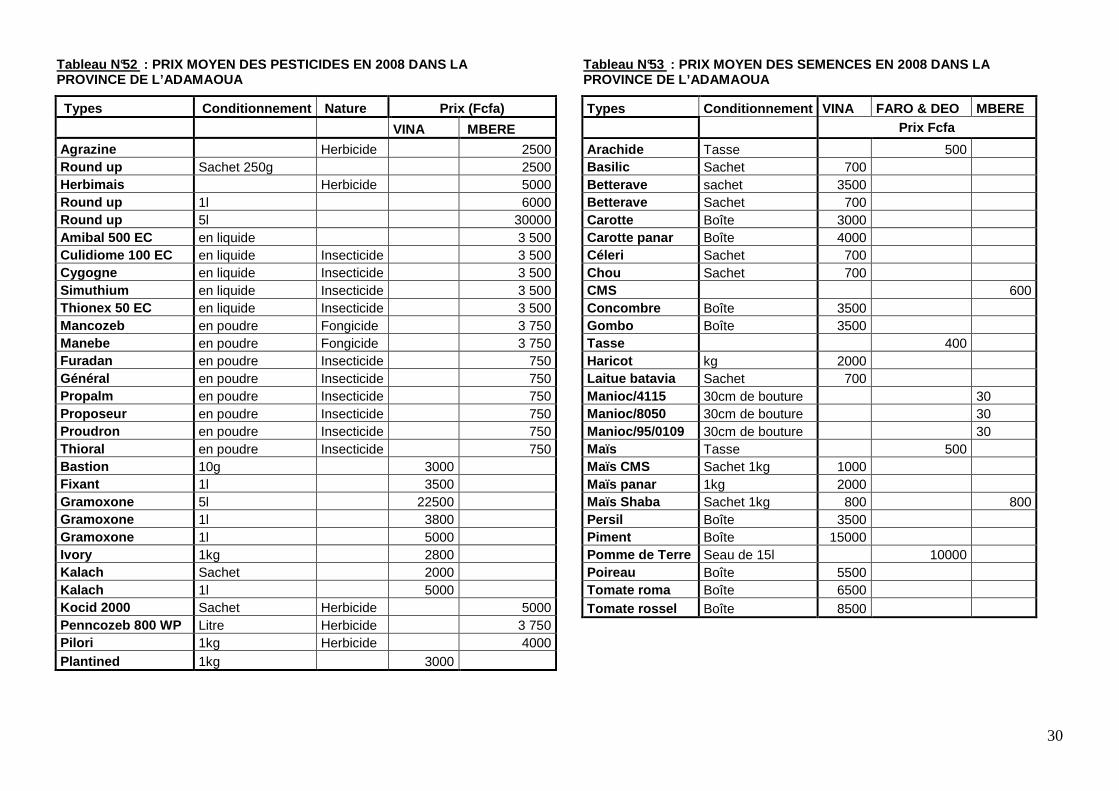
Tableau N°52 : PRIX MOYEN DES PESTICIDES EN 2008 DANS LA PROVINCE DE L’ADAMAOUA 30
Tableau N°53 : PRIX MOYEN DES SEMENCES EN 2008 DANS LA PROVINCE DE L’ADAMAOUA 30
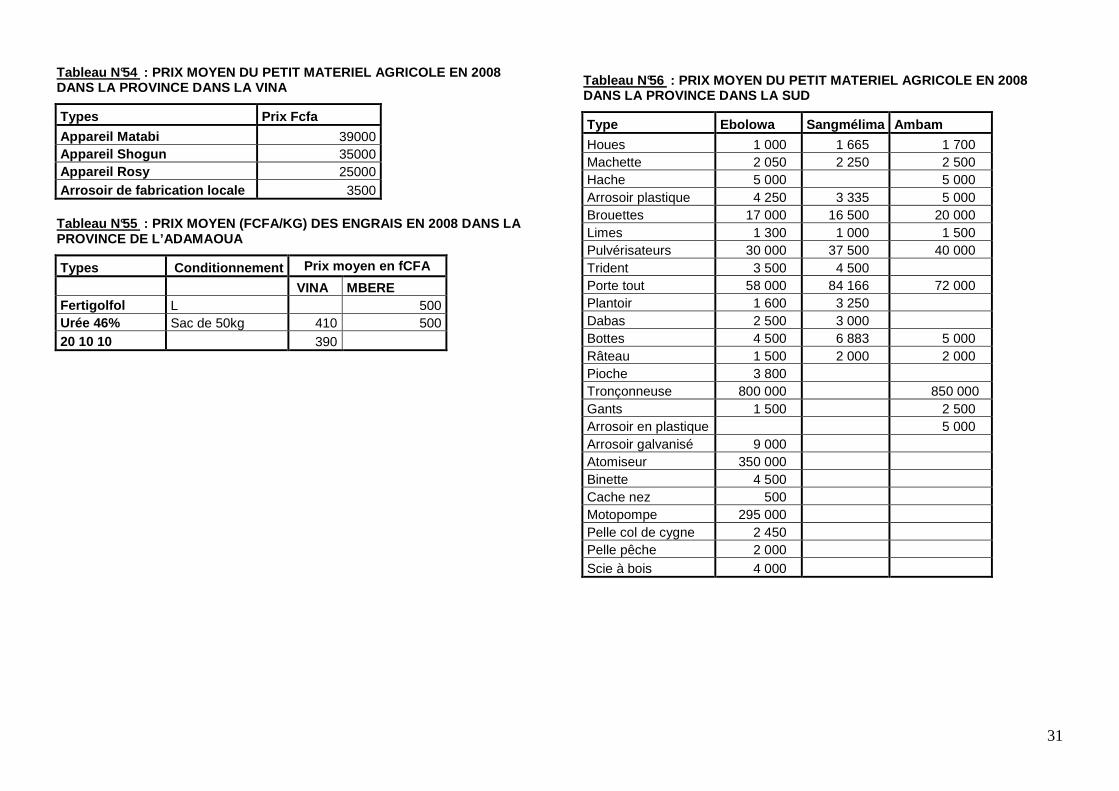
Tableau N°54 : PRIX MOYEN DU PETIT MATERIEL AGRICOLE EN 2008 DANS LA PROVINCE DANS LA VINA 31
Tableau N°55 : PRIX MOYEN (FCFA/KG) DES ENGRAIS EN 2008 DANS LA PROVINCE DE L’ADAMAOUA 31
Tableau N°56 : PRIX MOYEN DU PETIT MATERIEL AGRICOLE EN 2008 DANS LA PROVINCE DANS LA SUD 31
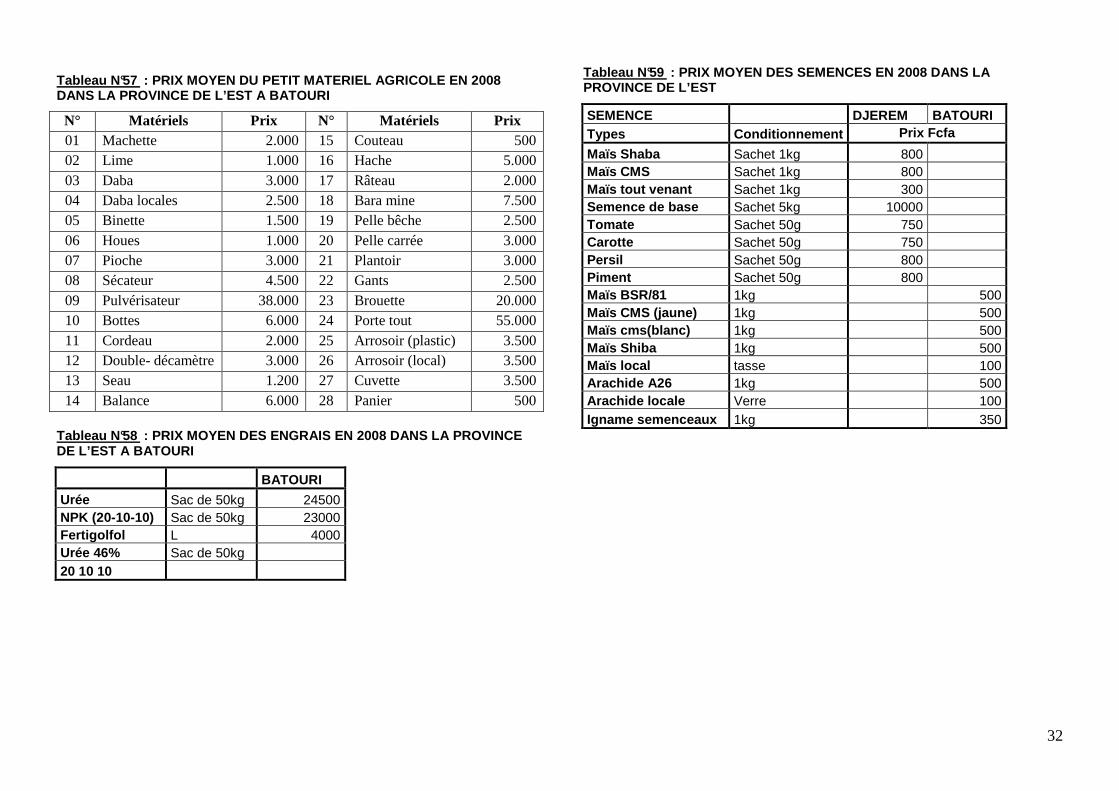
Tableau N°57 : PRIX MOYEN DU PETIT MATERIEL AGRICOLE EN 2008 DANS LA PROVINCE DE L’EST A BATOURI 32
Tableau N°58 : PRIX MOYEN DES ENGRAIS EN 2008 DANS LA PROVINCE DE L’EST A BATOURI 32
Tableau N°59 : PRIX MOYEN DES SEMENCES EN 2008 DANS LA PROVINCE DE L’EST 32
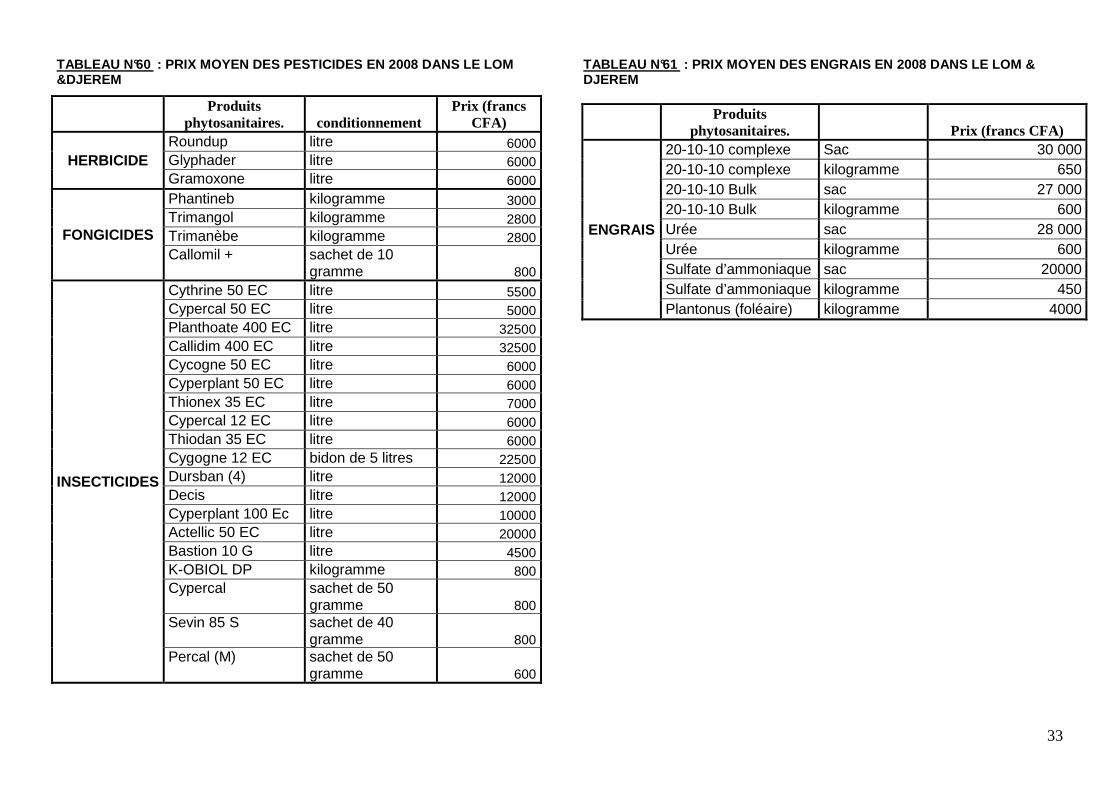
Tableau N°60 : PRIX MOYEN DES PESTICIDES EN 2008 DANS LE LOM & DJEREM 33
Tableau N°61 : PRIX MOYEN DES ENGRAIS EN 2008 DANS LE LOM & DJEREM 33
Tableau N°62 : PRIX DE VENTE DES PESTICIDES, SEMENCES ET PETIT MATERIEL AGRICOLES EN 2008 DANS LE
DEPARTEMENT DU MOUNGO 33
5
EVOLUTION DES PRIX DES PRODUITS VIVRIERS EN 2008
6
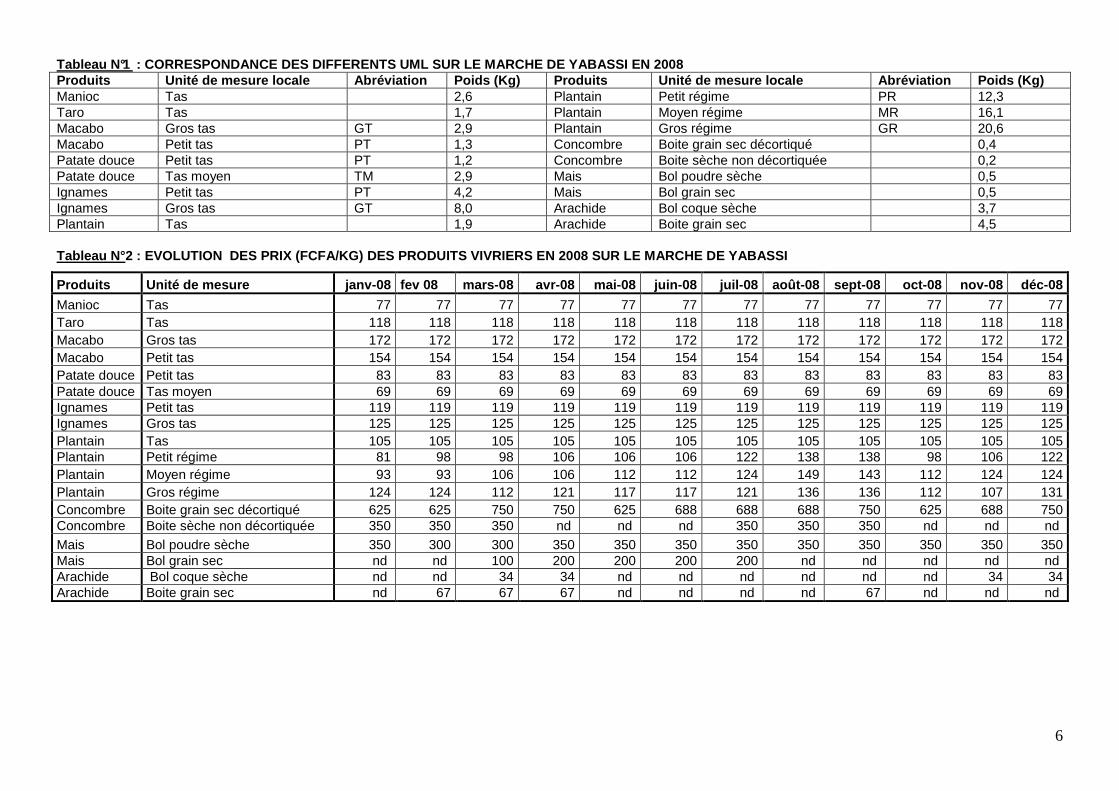
Tableau N°1 : CORRESPONDANCE DES DIFFERENTS UML SUR LE MARCHE DE YABASSI EN 2008 Produits Unité de mesure locale Abréviation Poids (Kg) Produits Unité de mesure locale Abrévia tion Poids (Kg) Manioc Tas 2,6 Plantain Petit régime PR 12,3 Taro Tas 1,7 Plantain Moyen régime MR 16,1 Macabo Gros tas GT 2,9 Plantain Gros régime GR 20,6 Macabo Petit tas PT 1,3 Concombre Boite grain sec décortiqué 0,4 Patate douce Petit tas PT 1,2 Concombre Boite sèche non décortiquée 0,2 Patate douce Tas moyen TM 2,9 Mais Bol poudre sèche 0,5 Ignames Petit tas PT 4,2 Mais Bol grain sec 0,5 Ignames Gros tas GT 8,0 Arachide Bol coque sèche 3,7 Plantain Tas 1,9 Arachide Boite grain sec 4,5
Tableau N° 2 : EVOLUTION DES PRIX (FCFA/KG) DES PRODUITS VIVR IERS EN 2008 SUR LE MARCHE DE YABASSI
Produits Unité de mesure janv-08 fev 08 mars-08 avr-08 mai-08 juin-08 juil-08 août-08 sept-08 oct-08 nov-08 déc-08
Manioc Tas 77 77 77 77 77 77 77 77 77 77 77 77 Taro Tas 118 118 118 118 118 118 118 118 118 118 118 118 Macabo Gros tas 172 172 172 172 172 172 172 172 172 172 172 172 Macabo Petit tas 154 154 154 154 154 154 154 154 154 154 154 154 Patate douce Petit tas 83 83 83 83 83 83 83 83 83 83 83 83 Patate douce Tas moyen 69 69 69 69 69 69 69 69 69 69 69 69 Ignames Petit tas 119 119 119 119 119 119 119 119 119 119 119 119 Ignames Gros tas 125 125 125 125 125 125 125 125 125 125 125 125 Plantain Tas 105 105 105 105 105 105 105 105 105 105 105 105 Plantain Petit régime 81 98 98 106 106 106 122 138 138 98 106 122 Plantain Moyen régime 93 93 106 106 112 112 124 149 143 112 124 124 Plantain Gros régime 124 124 112 121 117 117 121 136 136 112 107 131 Concombre Boite grain sec décortiqué 625 625 750 750 625 688 688 688 750 625 688 750 Concombre Boite sèche non décortiquée 350 350 350 nd nd nd 350 350 350 nd nd nd Mais Bol poudre sèche 350 300 300 350 350 350 350 350 350 350 350 350 Mais Bol grain sec nd nd 100 200 200 200 200 nd nd nd nd nd Arachide Bol coque sèche nd nd 34 34 nd nd nd nd nd nd 34 34 Arachide Boite grain sec nd 67 67 67 nd nd nd nd 67 nd nd nd
7
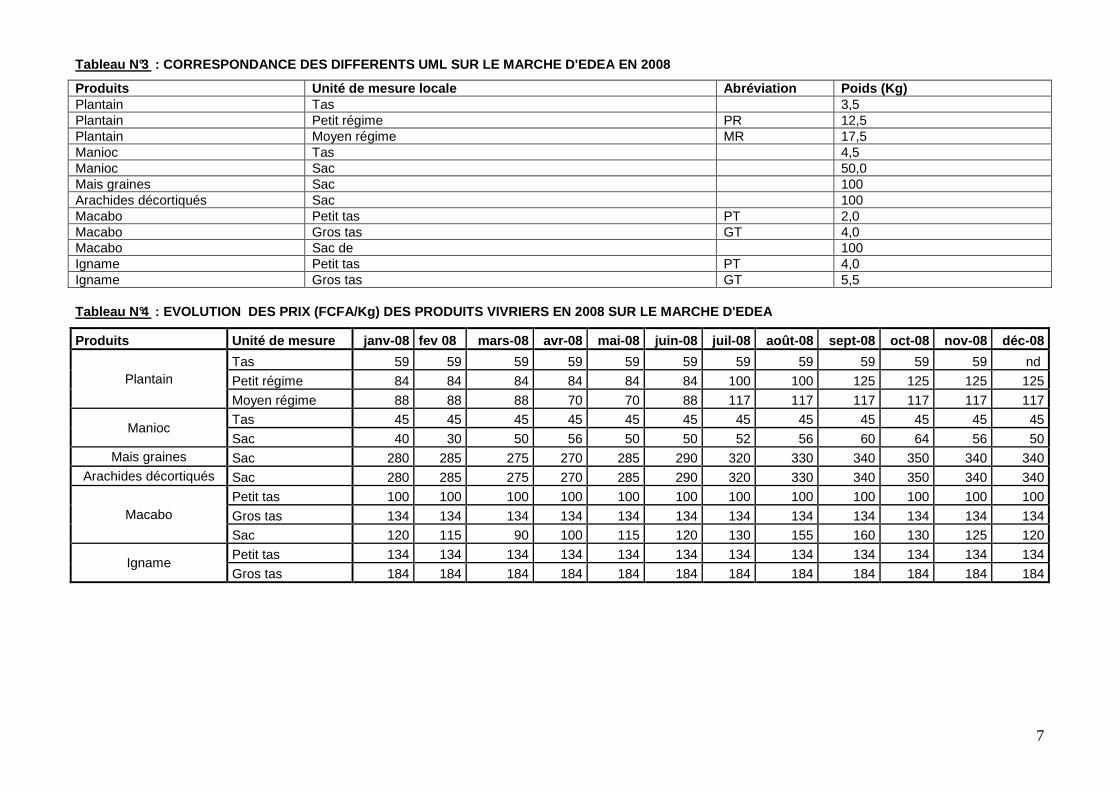
Tableau N°3 : CORRESPONDANCE DES DIFFERENTS UML SUR LE MARCHE D'EDEA EN 2008
Produits Unité de mesure locale Abréviation Poids (Kg) Plantain Tas 3,5 Plantain Petit régime PR 12,5 Plantain Moyen régime MR 17,5 Manioc Tas 4,5 Manioc Sac 50,0 Mais graines Sac 100 Arachides décortiqués Sac 100 Macabo Petit tas PT 2,0 Macabo Gros tas GT 4,0 Macabo Sac de 100 Igname Petit tas PT 4,0 Igname Gros tas GT 5,5
Tableau N°4 : EVOLUTION DES PRIX (FCFA/Kg) DES PRODUITS VIVRI ERS EN 2008 SUR LE MARCHE D'EDEA
Produits Unité de mesure janv-08 fev 08 mars-08 avr-08 mai-08 juin-08 juil-08 août-08 sept-08 oct-08 nov-08 déc-08
Plantain Tas 59 59 59 59 59 59 59 59 59 59 59 nd
Petit régime 84 84 84 84 84 84 100 100 125 125 125 125
Moyen régime 88 88 88 70 70 88 117 117 117 117 117 117
Manioc Tas 45 45 45 45 45 45 45 45 45 45 45 45
Sac 40 30 50 56 50 50 52 56 60 64 56 50 Mais graines Sac 280 285 275 270 285 290 320 330 340 350 340 340
Arachides décortiqués Sac 280 285 275 270 285 290 320 330 340 350 340 340
Macabo Petit tas 100 100 100 100 100 100 100 100 100 100 100 100
Gros tas 134 134 134 134 134 134 134 134 134 134 134 134
Sac 120 115 90 100 115 120 130 155 160 130 125 120
Igname Petit tas 134 134 134 134 134 134 134 134 134 134 134 134
Gros tas 184 184 184 184 184 184 184 184 184 184 184 184
8
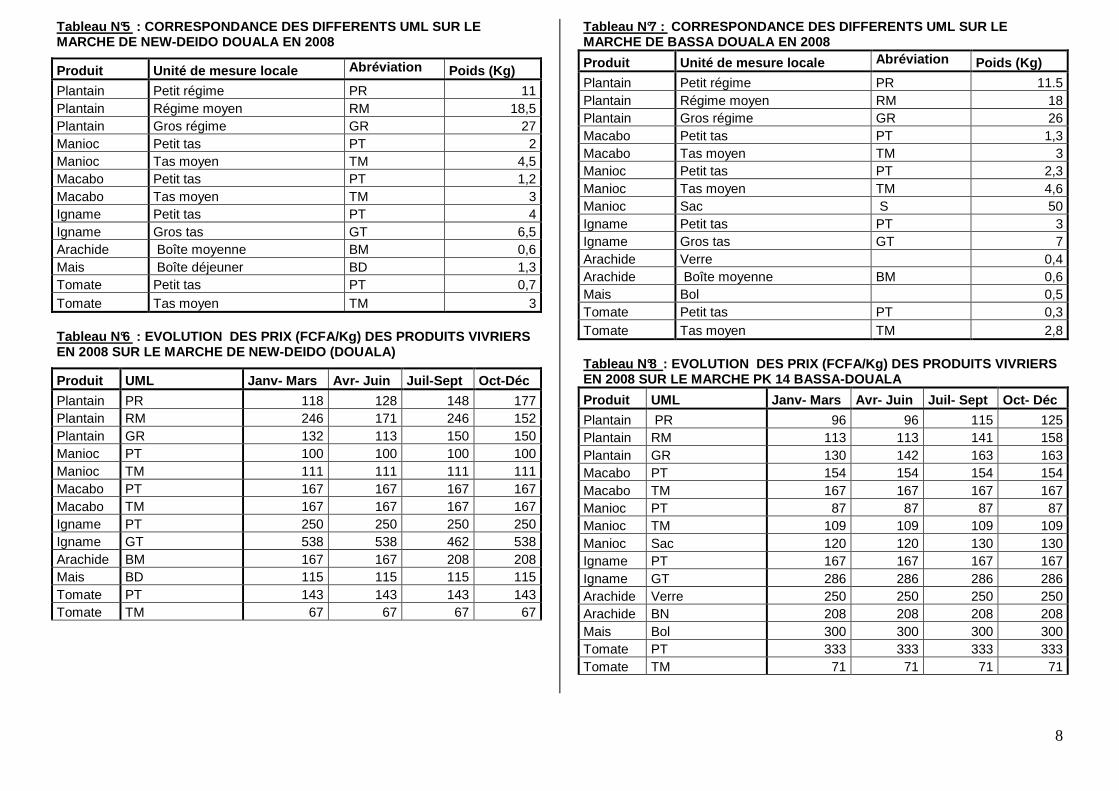
Tableau N°5 : CORRESPONDANCE DES DIFFERENTS UML SUR LE MARCHE DE NEW-DEIDO DOUALA EN 2008
Produit Unité de mesure locale Abréviation Poids (Kg)
Plantain Petit régime PR 11 Plantain Régime moyen RM 18,5 Plantain Gros régime GR 27 Manioc Petit tas PT 2 Manioc Tas moyen TM 4,5 Macabo Petit tas PT 1,2 Macabo Tas moyen TM 3 Igname Petit tas PT 4 Igname Gros tas GT 6,5 Arachide Boîte moyenne BM 0,6 Mais Boîte déjeuner BD 1,3 Tomate Petit tas PT 0,7 Tomate Tas moyen TM 3
Tableau N°6 : EVOLUTION DES PRIX (FCFA/Kg) DES PRODUITS VIVRI ERS EN 2008 SUR LE MARCHE DE NEW-DEIDO (DOUALA)
Produit UML Janv- Mars Avr- Juin Juil-Sept Oct-Déc
Plantain PR 118 128 148 177 Plantain RM 246 171 246 152 Plantain GR 132 113 150 150 Manioc PT 100 100 100 100 Manioc TM 111 111 111 111 Macabo PT 167 167 167 167 Macabo TM 167 167 167 167 Igname PT 250 250 250 250 Igname GT 538 538 462 538 Arachide BM 167 167 208 208 Mais BD 115 115 115 115 Tomate PT 143 143 143 143 Tomate TM 67 67 67 67
Tableau N°7 : CORRESPONDANCE DES DIFFERENTS UML SUR LE MARCHE DE BASSA DOUALA EN 2008
Produit Unité de mesure locale Abréviation Poids (Kg)
Plantain Petit régime PR 11.5 Plantain Régime moyen RM 18 Plantain Gros régime GR 26 Macabo Petit tas PT 1,3 Macabo Tas moyen TM 3 Manioc Petit tas PT 2,3 Manioc Tas moyen TM 4,6 Manioc Sac S 50 Igname Petit tas PT 3 Igname Gros tas GT 7 Arachide Verre 0,4 Arachide Boîte moyenne BM 0,6 Mais Bol 0,5 Tomate Petit tas PT 0,3 Tomate Tas moyen TM 2,8
Tableau N°8 : EVOLUTION DES PRIX (FCFA/Kg) DES PRODUITS VIVRIE RS EN 2008 SUR LE MARCHE PK 14 BASSA-DOUALA
Produit UML Janv- Mars Avr- Juin Juil- Sept Oct- Dé c
Plantain PR 96 96 115 125 Plantain RM 113 113 141 158 Plantain GR 130 142 163 163 Macabo PT 154 154 154 154 Macabo TM 167 167 167 167 Manioc PT 87 87 87 87 Manioc TM 109 109 109 109 Manioc Sac 120 120 130 130 Igname PT 167 167 167 167 Igname GT 286 286 286 286 Arachide Verre 250 250 250 250 Arachide BN 208 208 208 208 Mais Bol 300 300 300 300 Tomate PT 333 333 333 333 Tomate TM 71 71 71 71
9
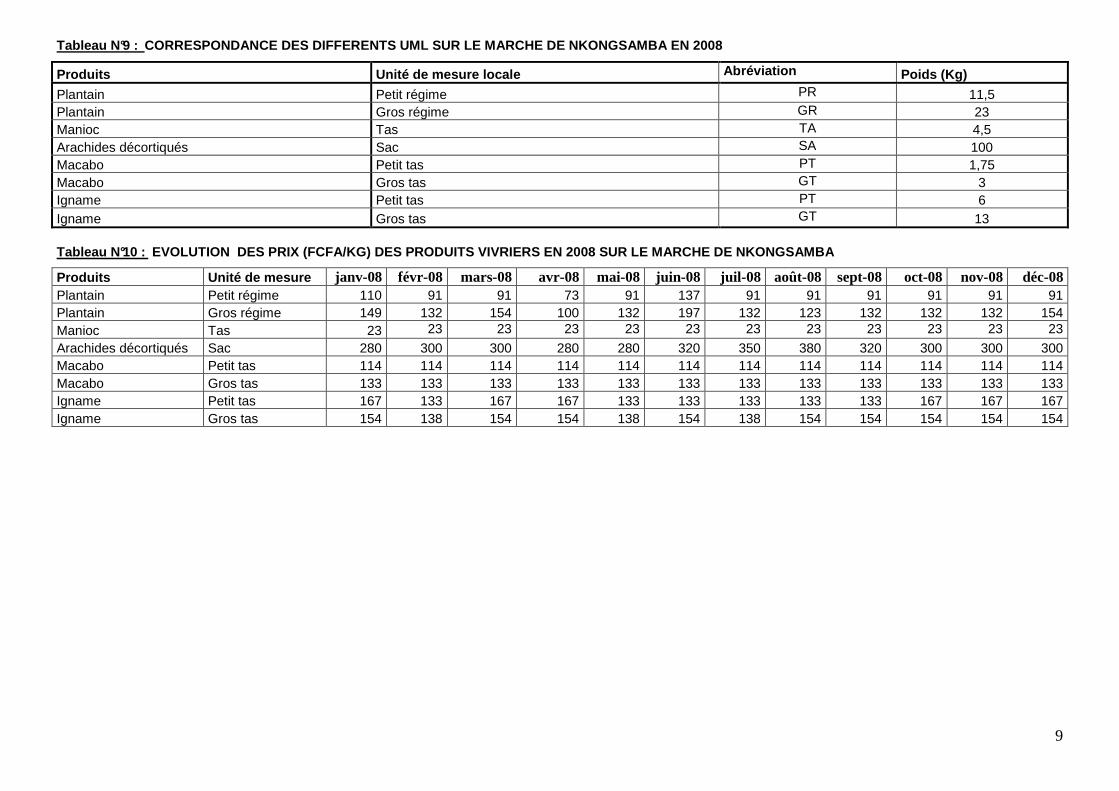
Tableau N°9 : CORRESPONDANCE DES DIFFERENTS UML SUR LE MARCHE DE NKONGSAMBA EN 2008
Produits Unité de mesure locale Abréviation Poids (Kg)
Plantain Petit régime PR 11,5 Plantain Gros régime GR 23 Manioc Tas TA 4,5 Arachides décortiqués Sac SA 100 Macabo Petit tas PT 1,75 Macabo Gros tas GT 3 Igname Petit tas PT 6 Igname Gros tas GT 13
Tableau N°10 : EVOLUTION DES PRIX (FCFA/KG) DES PRODUITS VIVRIER S EN 2008 SUR LE MARCHE DE NKONGSAMBA
Produits Unité de mesure janv-08 févr-08 mars-08 avr-08 mai-08 juin-08 juil-08 août-08 sept-08 oct-08 nov-08 déc-08 Plantain Petit régime 110 91 91 73 91 137 91 91 91 91 91 91 Plantain Gros régime 149 132 154 100 132 197 132 123 132 132 132 154 Manioc Tas 23 23 23 23 23 23 23 23 23 23 23 23 Arachides décortiqués Sac 280 300 300 280 280 320 350 380 320 300 300 300 Macabo Petit tas 114 114 114 114 114 114 114 114 114 114 114 114 Macabo Gros tas 133 133 133 133 133 133 133 133 133 133 133 133 Igname Petit tas 167 133 167 167 133 133 133 133 133 167 167 167 Igname Gros tas 154 138 154 154 138 154 138 154 154 154 154 154
10
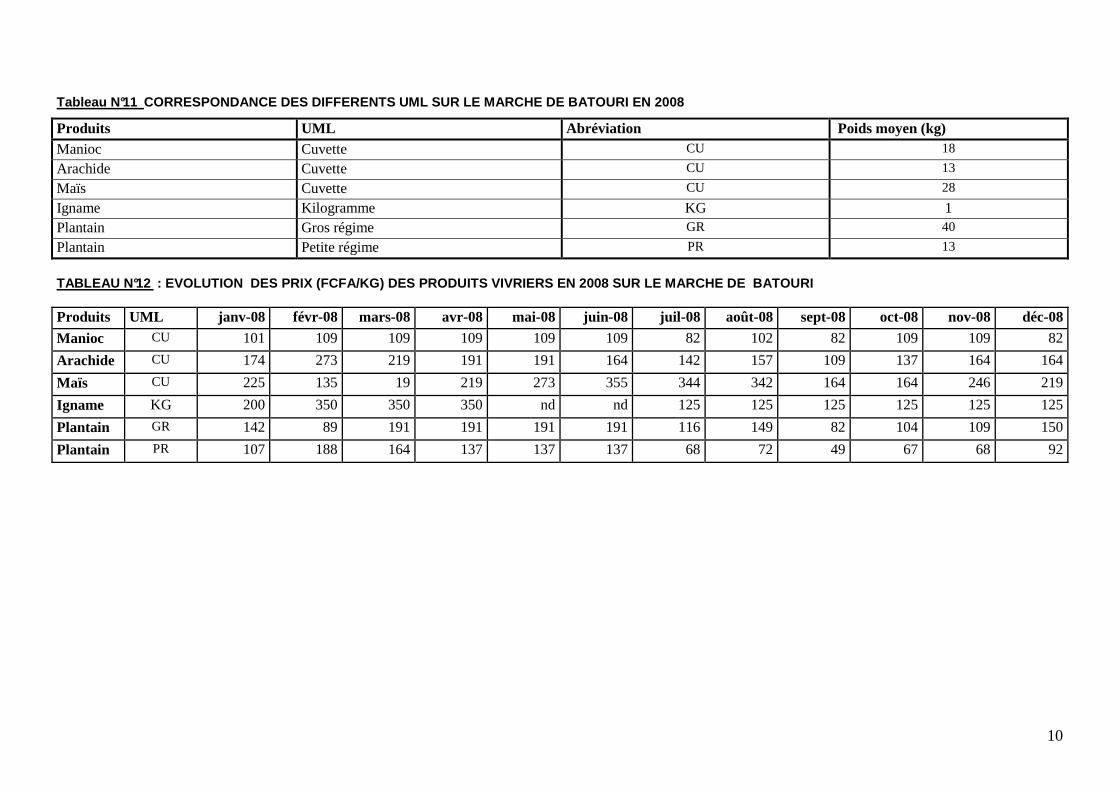
Tableau N°11 CORRESPONDANCE DES DIFFERENTS UML SUR LE MARCHE DE BATOURI EN 2008
Produits UML Abréviation Poids moyen (kg) Manioc Cuvette CU 18
Arachide Cuvette CU 13
Maïs Cuvette CU 28
Igname Kilogramme KG 1 Plantain Gros régime GR 40
Plantain Petite régime PR 13
TABLEAU N°12 : EVOLUTION DES PRIX (FCFA/KG) DES PRODUITS VIVRI ERS EN 2008 SUR LE MARCHE DE BATOURI
Produits UML janv-08 févr-08 mars-08 avr-08 mai-08 juin-08 juil-08 août-08 sept-08 oct-08 nov-08 déc-08
Manioc CU 101 109 109 109 109 109 82 102 82 109 109 82
Arachide CU 174 273 219 191 191 164 142 157 109 137 164 164
Maïs CU 225 135 19 219 273 355 344 342 164 164 246 219
Igname KG 200 350 350 350 nd nd 125 125 125 125 125 125
Plantain GR 142 89 191 191 191 191 116 149 82 104 109 150
Plantain PR 107 188 164 137 137 137 68 72 49 67 68 92
11
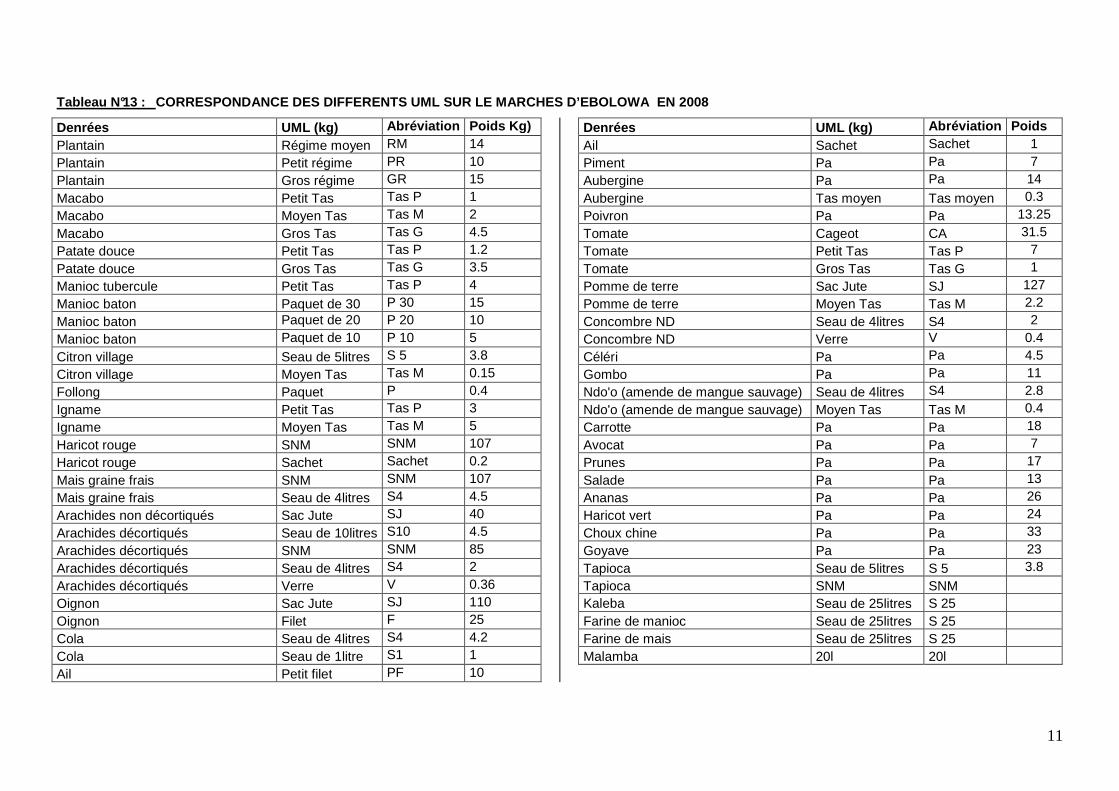
Tableau N°13 : CORRESPONDANCE DES DIFFERENTS UML SUR LE MARCHES D’ EBOLOWA EN 2008
Denrées UML (kg) Abréviation Poids Kg) Plantain Régime moyen RM 14
Plantain Petit régime PR 10
Plantain Gros régime GR 15
Macabo Petit Tas Tas P 1
Macabo Moyen Tas Tas M 2
Macabo Gros Tas Tas G 4.5
Patate douce Petit Tas Tas P 1.2
Patate douce Gros Tas Tas G 3.5
Manioc tubercule Petit Tas Tas P 4
Manioc baton Paquet de 30 P 30 15
Manioc baton Paquet de 20 P 20 10
Manioc baton Paquet de 10 P 10 5
Citron village Seau de 5litres S 5 3.8
Citron village Moyen Tas Tas M 0.15
Follong Paquet P 0.4
Igname Petit Tas Tas P 3
Igname Moyen Tas Tas M 5
Haricot rouge SNM SNM 107
Haricot rouge Sachet Sachet 0.2
Mais graine frais SNM SNM 107
Mais graine frais Seau de 4litres S4 4.5
Arachides non décortiqués Sac Jute SJ 40
Arachides décortiqués Seau de 10litres S10 4.5
Arachides décortiqués SNM SNM 85
Arachides décortiqués Seau de 4litres S4 2
Arachides décortiqués Verre V 0.36
Oignon Sac Jute SJ 110
Oignon Filet F 25
Cola Seau de 4litres S4 4.2
Cola Seau de 1litre S1 1
Ail Petit filet PF 10
Denrées UML (kg) Abréviation Poids Ail Sachet Sachet 1
Piment Pa Pa 7
Aubergine Pa Pa 14
Aubergine Tas moyen Tas moyen 0.3
Poivron Pa Pa 13.25
Tomate Cageot CA 31.5
Tomate Petit Tas Tas P 7
Tomate Gros Tas Tas G 1
Pomme de terre Sac Jute SJ 127
Pomme de terre Moyen Tas Tas M 2.2
Concombre ND Seau de 4litres S4 2
Concombre ND Verre V 0.4
Céléri Pa Pa 4.5
Gombo Pa Pa 11
Ndo'o (amende de mangue sauvage) Seau de 4litres S4 2.8
Ndo'o (amende de mangue sauvage) Moyen Tas Tas M 0.4
Carrotte Pa Pa 18
Avocat Pa Pa 7
Prunes Pa Pa 17
Salade Pa Pa 13
Ananas Pa Pa 26
Haricot vert Pa Pa 24
Choux chine Pa Pa 33
Goyave Pa Pa 23
Tapioca Seau de 5litres S 5 3.8
Tapioca SNM SNM Kaleba Seau de 25litres S 25
Farine de manioc Seau de 25litres S 25
Farine de mais Seau de 25litres S 25
Malamba 20l 20l
12
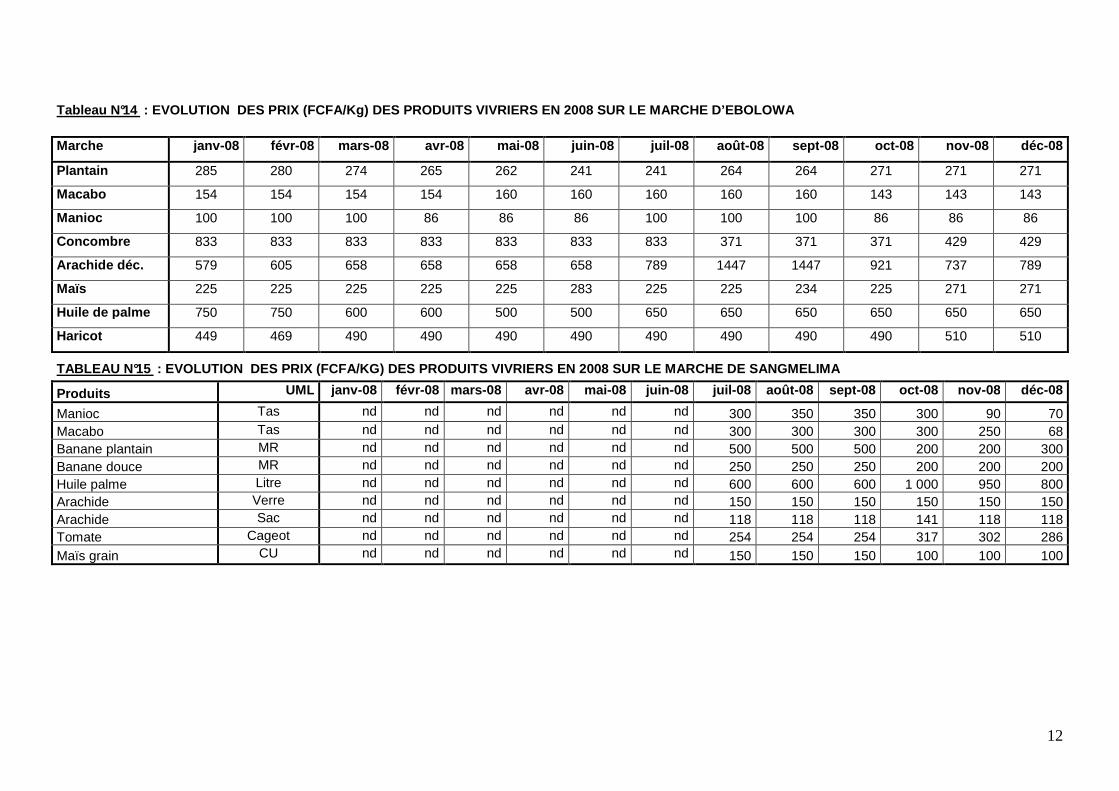
Tableau N°14 : EVOLUTION DES PRIX (FCFA/Kg) DES PRODUITS VIVRI ERS EN 2008 SUR LE MARCHE D’EBOLOWA Marche janv -08 févr -08 mars -08 avr-08 mai -08 juin -08 juil -08 août -08 sept -08 oct -08 nov -08 déc-08
Plantain 285 280 274 265 262 241 241 264 264 271 271 271
Macabo 154 154 154 154 160 160 160 160 160 143 143 143
Manioc 100 100 100 86 86 86 100 100 100 86 86 86
Concombre 833 833 833 833 833 833 833 371 371 371 429 429
Arachide déc. 579 605 658 658 658 658 789 1447 1447 921 737 789
Maïs 225 225 225 225 225 283 225 225 234 225 271 271
Huile de palme 750 750 600 600 500 500 650 650 650 650 650 650
Haricot 449 469 490 490 490 490 490 490 490 490 510 510
TABLEAU N°15 : EVOLUTION DES PRIX (FCFA/KG) DES PRODUITS VIVRI ERS EN 2008 SUR LE MARCHE DE SANGMELIMA
Produits UML janv -08 févr -08 mars -08 avr-08 mai -08 juin -08 juil -08 août -08 sept -08 oct -08 nov -08 déc-08
Manioc Tas nd nd nd nd nd nd 300 350 350 300 90 70 Macabo Tas nd nd nd nd nd nd 300 300 300 300 250 68 Banane plantain MR nd nd nd nd nd nd 500 500 500 200 200 300 Banane douce MR nd nd nd nd nd nd 250 250 250 200 200 200 Huile palme Litre nd nd nd nd nd nd 600 600 600 1 000 950 800 Arachide Verre nd nd nd nd nd nd 150 150 150 150 150 150 Arachide Sac nd nd nd nd nd nd 118 118 118 141 118 118 Tomate Cageot nd nd nd nd nd nd 254 254 254 317 302 286 Maïs grain CU nd nd nd nd nd nd 150 150 150 100 100 100
13
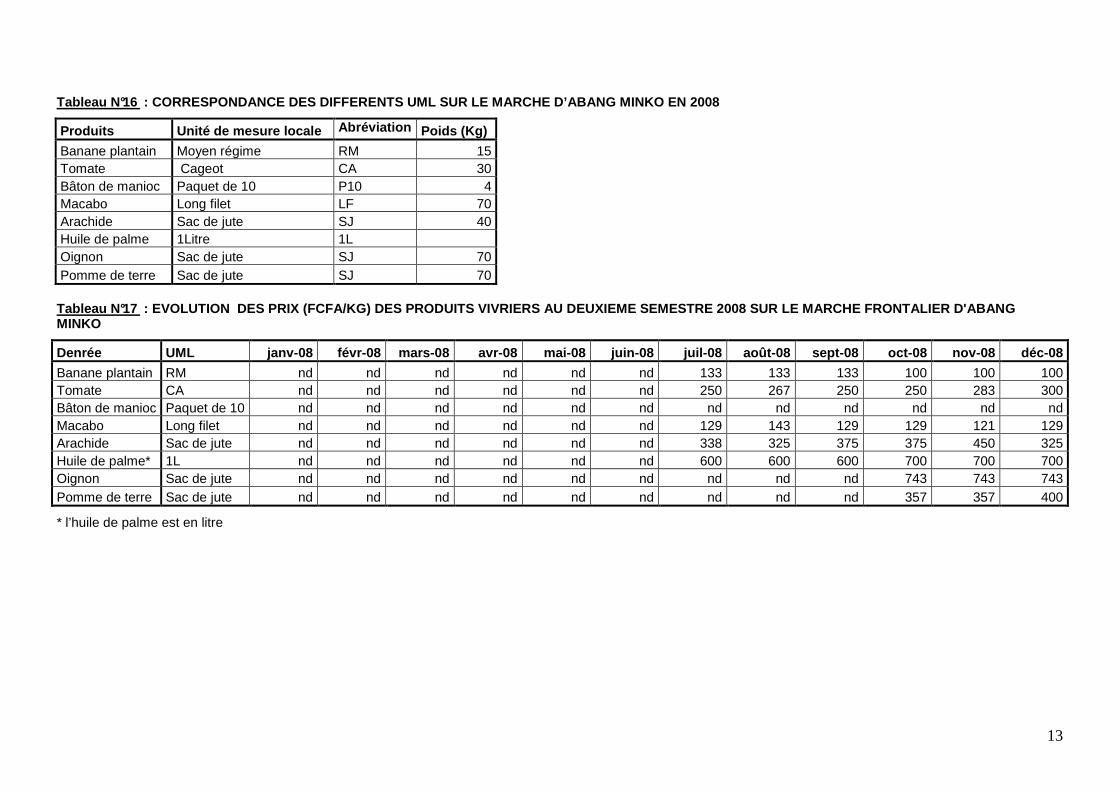
Tableau N°16 : CORRESPONDANCE DES DIFFERENTS UML SUR LE MARCHE D’ABANG MINKO EN 2008
Produits Unité de mesure locale Abréviation Poids (Kg)
Banane plantain Moyen régime RM 15 Tomate Cageot CA 30 Bâton de manioc Paquet de 10 P10 4 Macabo Long filet LF 70 Arachide Sac de jute SJ 40 Huile de palme 1Litre 1L Oignon Sac de jute SJ 70 Pomme de terre Sac de jute SJ 70
Tableau N°17 : EVOLUTION DES PRIX (FCFA/KG) DES PRODUITS VIVRI ERS AU DEUXIEME SEMESTRE 2008 SUR LE MARCHE FRONTAL IER D'ABANG MINKO
Denrée UML janv-08 févr-08 mars-08 avr-08 mai-08 juin-08 juil-08 août-08 sept-08 oct-08 nov-08 déc-08
Banane plantain RM nd nd nd nd nd nd 133 133 133 100 100 100 Tomate CA nd nd nd nd nd nd 250 267 250 250 283 300 Bâton de manioc Paquet de 10 nd nd nd nd nd nd nd nd nd nd nd nd Macabo Long filet nd nd nd nd nd nd 129 143 129 129 121 129 Arachide Sac de jute nd nd nd nd nd nd 338 325 375 375 450 325 Huile de palme* 1L nd nd nd nd nd nd 600 600 600 700 700 700 Oignon Sac de jute nd nd nd nd nd nd nd nd nd 743 743 743 Pomme de terre Sac de jute nd nd nd nd nd nd nd nd nd 357 357 400
* l’huile de palme est en litre
14
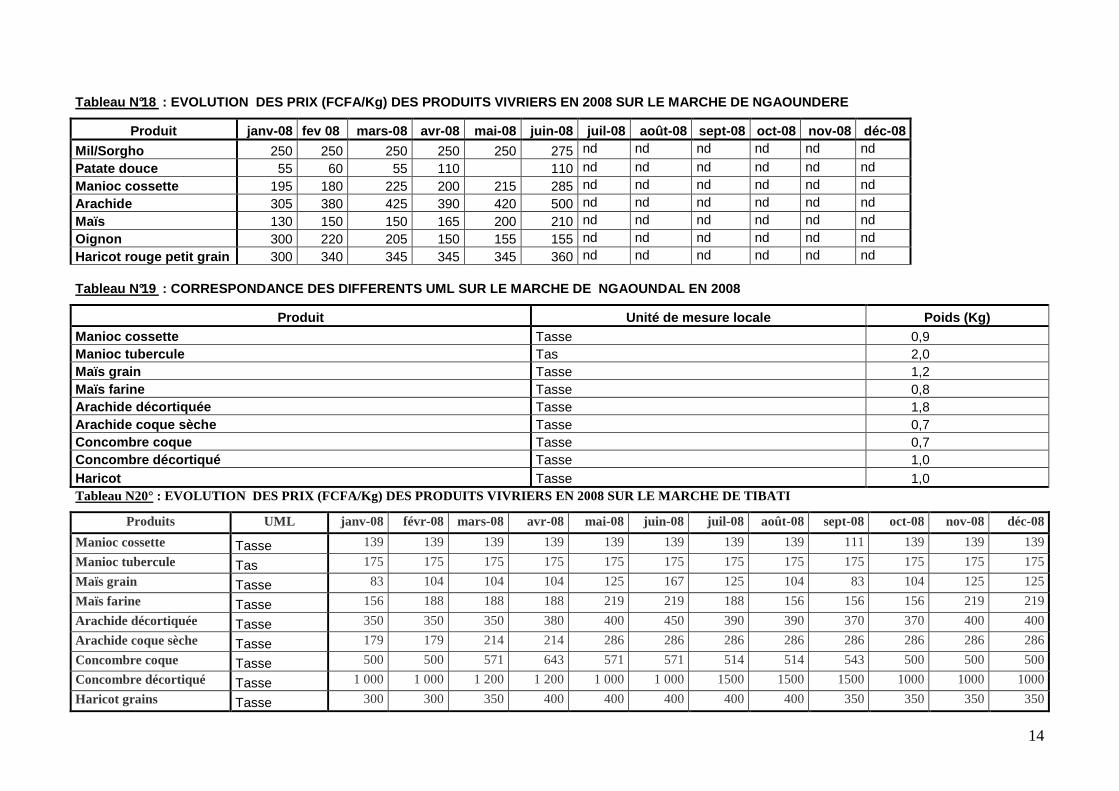
Tableau N°18 : EVOLUTION DES PRIX (FCFA/Kg) DES PRODUITS VIVRI ERS EN 2008 SUR LE MARCHE DE NGAOUNDERE
Produit janv-08 fev 08 mars-08 avr-08 mai-08 juin-08 juil-08 août-08 sept-08 oct-08 nov-08 déc-08
Mil/Sorgho 250 250 250 250 250 275 nd nd nd nd nd nd Patate douce 55 60 55 110 110 nd nd nd nd nd nd Manioc cossette 195 180 225 200 215 285 nd nd nd nd nd nd Arachide 305 380 425 390 420 500 nd nd nd nd nd nd Maïs 130 150 150 165 200 210 nd nd nd nd nd nd Oignon 300 220 205 150 155 155 nd nd nd nd nd nd Haricot rouge petit grain 300 340 345 345 345 360 nd nd nd nd nd nd
Tableau N°19 : CORRESPONDANCE DES DIFFERENTS UML SUR LE MARCHE DE NGAOUNDAL EN 2008
Produit Unité de mesure locale Poids (Kg) Manioc cossette Tasse 0,9 Manioc tubercule Tas 2,0 Maïs grain Tasse 1,2 Maïs farine Tasse 0,8 Arachide décortiquée Tasse 1,8 Arachide coque sèche Tasse 0,7 Concombre coque Tasse 0,7 Concombre décortiqué Tasse 1,0 Haricot Tasse 1,0 Tableau N20° : EVOLUTION DES PRIX (FCFA/Kg) DES PRODUITS VIVRI ERS EN 2008 SUR LE MARCHE DE TIBATI
Produits UML janv-08 févr-08 mars-08 avr-08 mai-08 juin-08 juil-08 août-08 sept-08 oct-08 nov-08 déc-08
Manioc cossette Tasse 139 139 139 139 139 139 139 139 111 139 139 139
Manioc tubercule Tas 175 175 175 175 175 175 175 175 175 175 175 175
Maïs grain Tasse 83 104 104 104 125 167 125 104 83 104 125 125
Maïs farine Tasse 156 188 188 188 219 219 188 156 156 156 219 219
Arachide décortiquée Tasse 350 350 350 380 400 450 390 390 370 370 400 400
Arachide coque sèche Tasse 179 179 214 214 286 286 286 286 286 286 286 286
Concombre coque Tasse 500 500 571 643 571 571 514 514 543 500 500 500
Concombre décortiqué Tasse 1 000 1 000 1 200 1 200 1 000 1 000 1500 1500 1500 1000 1000 1000
Haricot grains Tasse 300 300 350 400 400 400 400 400 350 350 350 350

15
Tableau N°21 : EVOLUTION DES PRIX (FCFA/Kg) DES PRODUITS VIVRI ERS
EN 2008 SUR LE MARCHE DE MBERE
Produit janv-08 fev 08 mars-08 avr-08 mai-08 juin-08
Haricot 500 500 450 500 500 500 Niébé 310 310 375 500 500 500 Arachide en coque 310 310 225 Manioc tubercule 75 80 65 80 65 80 Banane régime 145 Plantain régime 130 Pomme de terre 330 330 330 330 330 330 Macabo 110 100 Taro 50 125 50 Oignon 900 830 250 105 100 175 Graine de courge en coque 600 610 665 720 720 775 Maïs 105 105 105 125 140 185 Manioc cossette 120 130 140 150 165 215 Igname 200 220 125 Tomate 200 200 180 205 225 165 Arachide décortiquée 375 375 500 570 570 855 Patate douce 40 50 65 50 65 50
Tableau N°23 : EVOLUTION DES PRIX (FCFA/Kg) DES PRODUITS VIVRI ERS EN 2008 SUR LE MARCHE DE MAYO-DARLE
Produits janv-08 févr-08 mars-08 avr-08 mai-08 juin-08 juil-08 août-08 sept-08 oct-08 nov-08 déc-08
Maïs 100 100 110 115 120 120 120 120 120 120 120
Haricot 220 230 240 250 250 250 250 250 250 250 250
Manioc cossette 167 167 183 183 200 200 200 200 167 167 167
Concombre 250 250 300 300 300 300 300 300 300 300 300
Arachide coque 143 143 143 157 157 157 157 157 129 143 143
Tableau N°22 : EVOLUTION DES PRIX (FCFA/Kg) DES PRODUITS VIVRIERS EN 2008 SUR LE MARCHE DE BANYO
Produits janv-08
févr-08
mars-08
avr-08
mai-08
juin-08
Maïs 100 100 150 150 150 160 Arachide 350 350 350 400 400 400 Manioc cossette
150 160 160 200 350 225
Haricot 200 250 250 250 250 250 Riz 375 375 375 375 375 375
Huile de palme
875 850 700 600 650 700
Farine de blé 470 470 470 410 410
16
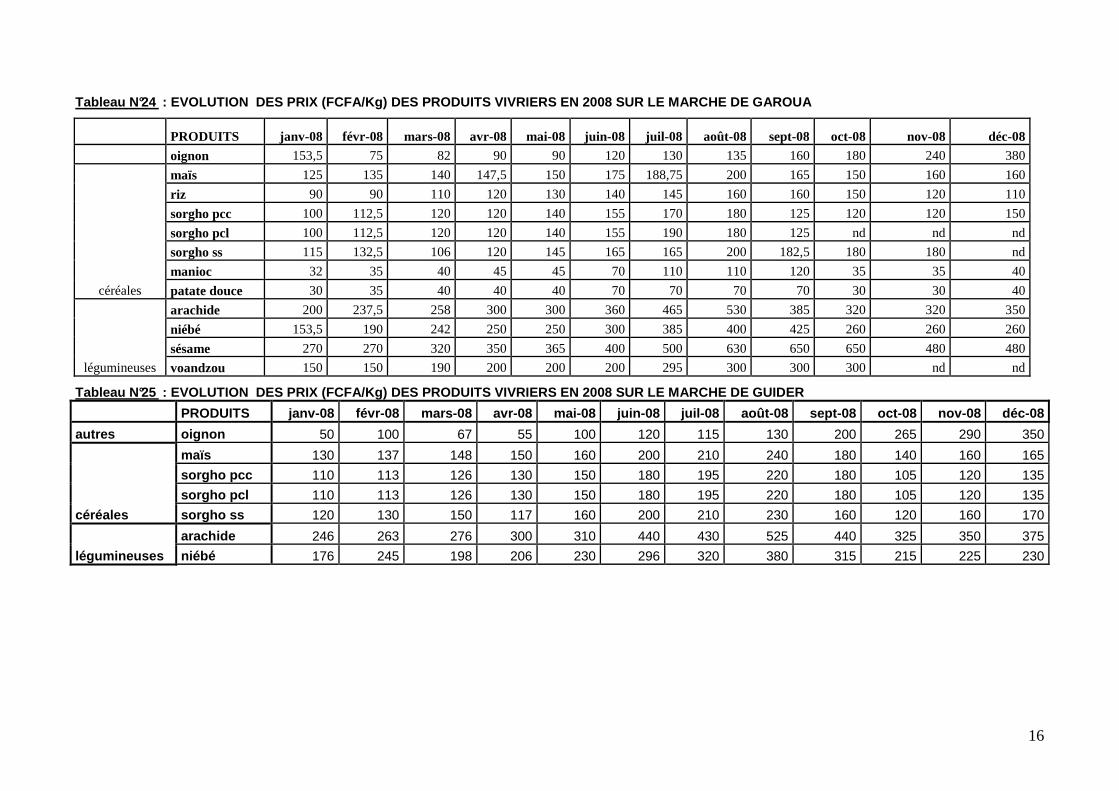
Tableau N°24 : EVOLUTION DES PRIX (FCFA/Kg) DES PRODUITS VIVRI ERS EN 2008 SUR LE MARCHE DE GAROUA
PRODUITS janv-08 févr-08 mars-08 avr-08 mai-08 juin-08 juil-08 août-08 sept-08 oct-08 nov-08 déc-08
oignon 153,5 75 82 90 90 120 130 135 160 180 240 380
céréales
maïs 125 135 140 147,5 150 175 188,75 200 165 150 160 160
riz 90 90 110 120 130 140 145 160 160 150 120 110
sorgho pcc 100 112,5 120 120 140 155 170 180 125 120 120 150
sorgho pcl 100 112,5 120 120 140 155 190 180 125 nd nd nd
sorgho ss 115 132,5 106 120 145 165 165 200 182,5 180 180 nd
manioc 32 35 40 45 45 70 110 110 120 35 35 40
patate douce 30 35 40 40 40 70 70 70 70 30 30 40
légumineuses
arachide 200 237,5 258 300 300 360 465 530 385 320 320 350
niébé 153,5 190 242 250 250 300 385 400 425 260 260 260
sésame 270 270 320 350 365 400 500 630 650 650 480 480
voandzou 150 150 190 200 200 200 295 300 300 300 nd nd
Tableau N°25 : EVOLUTION DES PRIX (FCFA/Kg) DES PRODUITS VIVRI ERS EN 2008 SUR LE MARCHE DE GUIDER
PRODUITS janv-08 févr-08 mars-08 avr-08 mai-08 juin-08 juil-08 août-08 sept-08 oct-08 nov-08 déc-08
autres oignon 50 100 67 55 100 120 115 130 200 265 290 350
céréales
maïs 130 137 148 150 160 200 210 240 180 140 160 165
sorgho pcc 110 113 126 130 150 180 195 220 180 105 120 135
sorgho pcl 110 113 126 130 150 180 195 220 180 105 120 135
sorgho ss 120 130 150 117 160 200 210 230 160 120 160 170
légumineuses
arachide 246 263 276 300 310 440 430 525 440 325 350 375
niébé 176 245 198 206 230 296 320 380 315 215 225 230
17
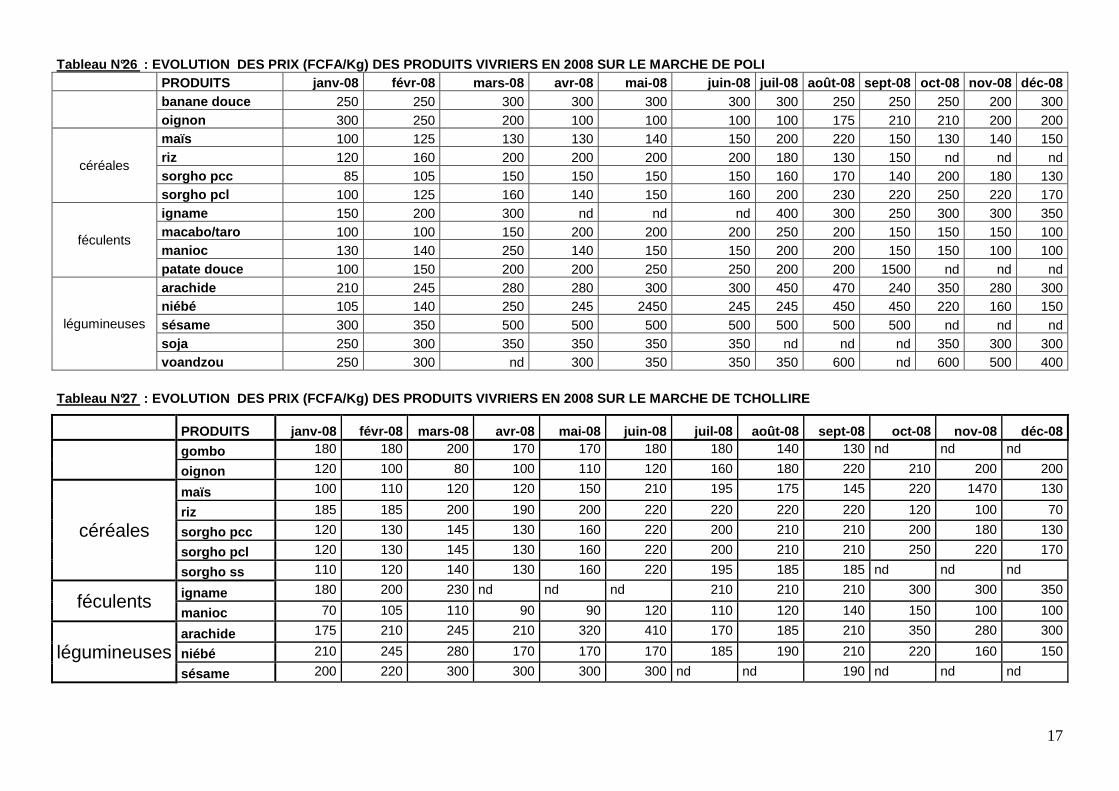
Tableau N°26 : EVOLUTION DES PRIX (FCFA/Kg) DES PRODUITS VIVRI ERS EN 2008 SUR LE MARCHE DE POLI PRODUITS janv-08 févr-08 mars-08 avr-08 mai-08 juin-08 juil-08 août-08 sept-08 oct-08 nov-08 déc-08
banane douce 250 250 300 300 300 300 300 250 250 250 200 300 oignon 300 250 200 100 100 100 100 175 210 210 200 200
céréales
maïs 100 125 130 130 140 150 200 220 150 130 140 150 riz 120 160 200 200 200 200 180 130 150 nd nd nd sorgho pcc 85 105 150 150 150 150 160 170 140 200 180 130 sorgho pcl 100 125 160 140 150 160 200 230 220 250 220 170
féculents
igname 150 200 300 nd nd nd 400 300 250 300 300 350 macabo/taro 100 100 150 200 200 200 250 200 150 150 150 100 manioc 130 140 250 140 150 150 200 200 150 150 100 100 patate douce 100 150 200 200 250 250 200 200 1500 nd nd nd
légumineuses
arachide 210 245 280 280 300 300 450 470 240 350 280 300 niébé 105 140 250 245 2450 245 245 450 450 220 160 150 sésame 300 350 500 500 500 500 500 500 500 nd nd nd soja 250 300 350 350 350 350 nd nd nd 350 300 300 voandzou 250 300 nd 300 350 350 350 600 nd 600 500 400
Tableau N°27 : EVOLUTION DES PRIX (FCFA/Kg) DES PRODUITS VIVRI ERS EN 2008 SUR LE MARCHE DE TCHOLLIRE
PRODUITS janv-08 févr-08 mars-08 avr-08 mai-08 juin-08 juil-08 août-08 sept-08 oct-08 nov-08 déc-08
gombo 180 180 200 170 170 180 180 140 130 nd nd nd
oignon 120 100 80 100 110 120 160 180 220 210 200 200
céréales
maïs 100 110 120 120 150 210 195 175 145 220 1470 130
riz 185 185 200 190 200 220 220 220 220 120 100 70
sorgho pcc 120 130 145 130 160 220 200 210 210 200 180 130
sorgho pcl 120 130 145 130 160 220 200 210 210 250 220 170
sorgho ss 110 120 140 130 160 220 195 185 185 nd nd nd
féculents igname 180 200 230 nd nd nd 210 210 210 300 300 350
manioc 70 105 110 90 90 120 110 120 140 150 100 100
légumineuses arachide 175 210 245 210 320 410 170 185 210 350 280 300
niébé 210 245 280 170 170 170 185 190 210 220 160 150
sésame 200 220 300 300 300 300 nd nd 190 nd nd nd
18
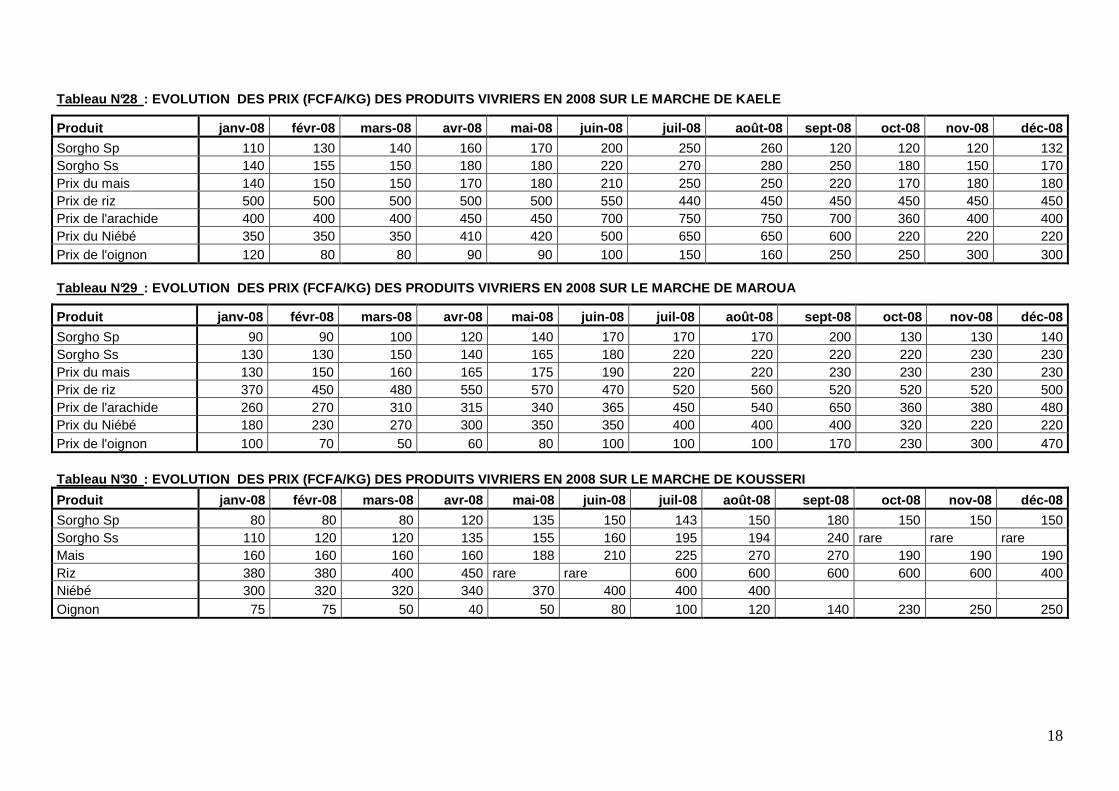
Tableau N°28 : EVOLUTION DES PRIX (FCFA/KG) DES PRODUITS VIVRIE RS EN 2008 SUR LE MARCHE DE KAELE
Produit janv-08 févr-08 mars-08 avr-08 mai-08 juin-08 juil-08 août-08 sept-08 oct-08 nov-08 déc-08
Sorgho Sp 110 130 140 160 170 200 250 260 120 120 120 132 Sorgho Ss 140 155 150 180 180 220 270 280 250 180 150 170 Prix du mais 140 150 150 170 180 210 250 250 220 170 180 180 Prix de riz 500 500 500 500 500 550 440 450 450 450 450 450 Prix de l'arachide 400 400 400 450 450 700 750 750 700 360 400 400 Prix du Niébé 350 350 350 410 420 500 650 650 600 220 220 220 Prix de l'oignon 120 80 80 90 90 100 150 160 250 250 300 300
Tableau N°29 : EVOLUTION DES PRIX (FCFA/KG) DES PRODUITS VIVRIE RS EN 2008 SUR LE MARCHE DE MAROUA
Produit janv-08 févr-08 mars-08 avr-08 mai-08 juin-08 juil-08 août-08 sept-08 oct-08 nov-08 déc-08
Sorgho Sp 90 90 100 120 140 170 170 170 200 130 130 140 Sorgho Ss 130 130 150 140 165 180 220 220 220 220 230 230 Prix du mais 130 150 160 165 175 190 220 220 230 230 230 230 Prix de riz 370 450 480 550 570 470 520 560 520 520 520 500 Prix de l'arachide 260 270 310 315 340 365 450 540 650 360 380 480 Prix du Niébé 180 230 270 300 350 350 400 400 400 320 220 220 Prix de l'oignon 100 70 50 60 80 100 100 100 170 230 300 470
Tableau N°30 : EVOLUTION DES PRIX (FCFA/KG) DES PRODUITS VIVRIE RS EN 2008 SUR LE MARCHE DE KOUSSERI
Produit janv-08 févr-08 mars-08 avr-08 mai-08 juin-08 juil-08 août-08 sept-08 oct-08 nov-08 déc-08
Sorgho Sp 80 80 80 120 135 150 143 150 180 150 150 150 Sorgho Ss 110 120 120 135 155 160 195 194 240 rare rare rare Mais 160 160 160 160 188 210 225 270 270 190 190 190 Riz 380 380 400 450 rare rare 600 600 600 600 600 400 Niébé 300 320 320 340 370 400 400 400 Oignon 75 75 50 40 50 80 100 120 140 230 250 250
19
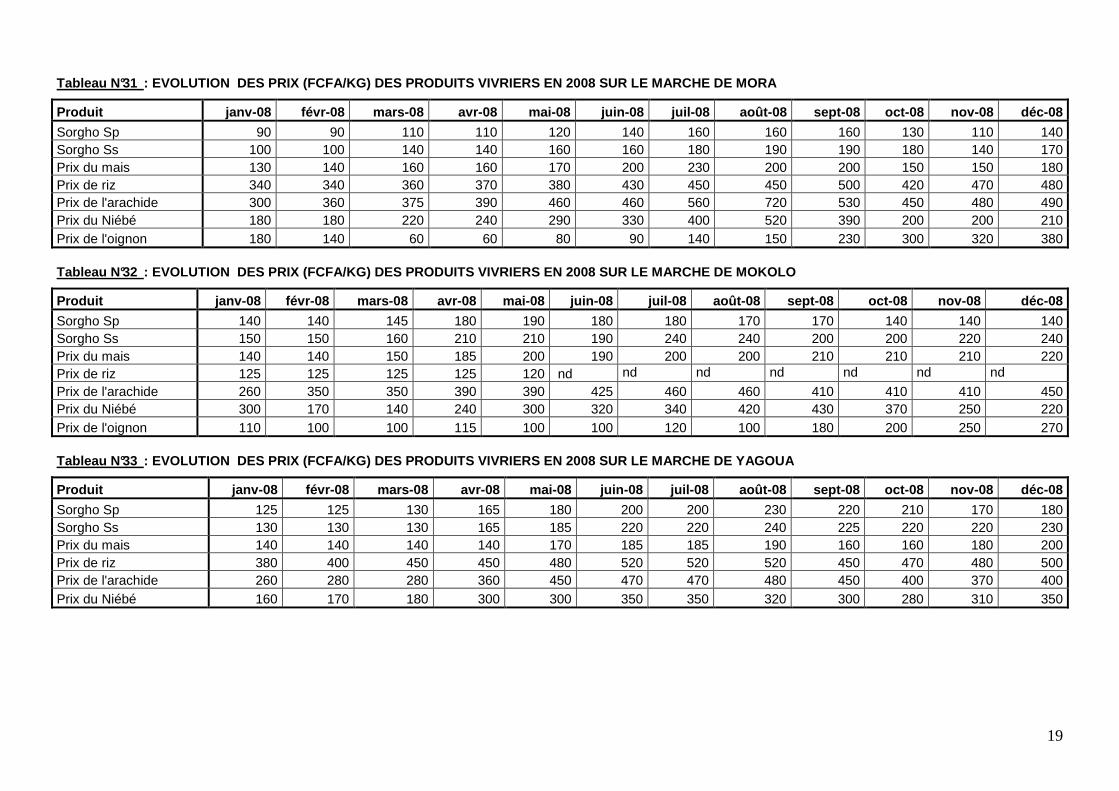
Tableau N°31 : EVOLUTION DES PRIX (FCFA/KG) DES PRODUITS VIVRIE RS EN 2008 SUR LE MARCHE DE MORA
Produit janv-08 févr-08 mars-08 avr-08 mai-08 juin-08 juil-08 août-08 sept-08 oct-08 nov-08 déc-08
Sorgho Sp 90 90 110 110 120 140 160 160 160 130 110 140 Sorgho Ss 100 100 140 140 160 160 180 190 190 180 140 170 Prix du mais 130 140 160 160 170 200 230 200 200 150 150 180 Prix de riz 340 340 360 370 380 430 450 450 500 420 470 480 Prix de l'arachide 300 360 375 390 460 460 560 720 530 450 480 490 Prix du Niébé 180 180 220 240 290 330 400 520 390 200 200 210 Prix de l'oignon 180 140 60 60 80 90 140 150 230 300 320 380
Tableau N°32 : EVOLUTION DES PRIX (FCFA/KG) DES PRODUITS VIVRIE RS EN 2008 SUR LE MARCHE DE MOKOLO
Produit janv-08 févr-08 mars-08 avr-08 mai-08 juin-08 juil-08 août-08 sept-08 oct-08 nov-08 déc-08
Sorgho Sp 140 140 145 180 190 180 180 170 170 140 140 140 Sorgho Ss 150 150 160 210 210 190 240 240 200 200 220 240 Prix du mais 140 140 150 185 200 190 200 200 210 210 210 220 Prix de riz 125 125 125 125 120 nd nd nd nd nd nd nd Prix de l'arachide 260 350 350 390 390 425 460 460 410 410 410 450 Prix du Niébé 300 170 140 240 300 320 340 420 430 370 250 220 Prix de l'oignon 110 100 100 115 100 100 120 100 180 200 250 270
Tableau N°33 : EVOLUTION DES PRIX (FCFA/KG) DES PRODUITS VIVRIE RS EN 2008 SUR LE MARCHE DE YAGOUA
Produit janv-08 févr-08 mars-08 avr-08 mai-08 juin-08 juil-08 août-08 sept-08 oct-08 nov-08 déc-08
Sorgho Sp 125 125 130 165 180 200 200 230 220 210 170 180 Sorgho Ss 130 130 130 165 185 220 220 240 225 220 220 230 Prix du mais 140 140 140 140 170 185 185 190 160 160 180 200 Prix de riz 380 400 450 450 480 520 520 520 450 470 480 500 Prix de l'arachide 260 280 280 360 450 470 470 480 450 400 370 400 Prix du Niébé 160 170 180 300 300 350 350 320 300 280 310 350
20
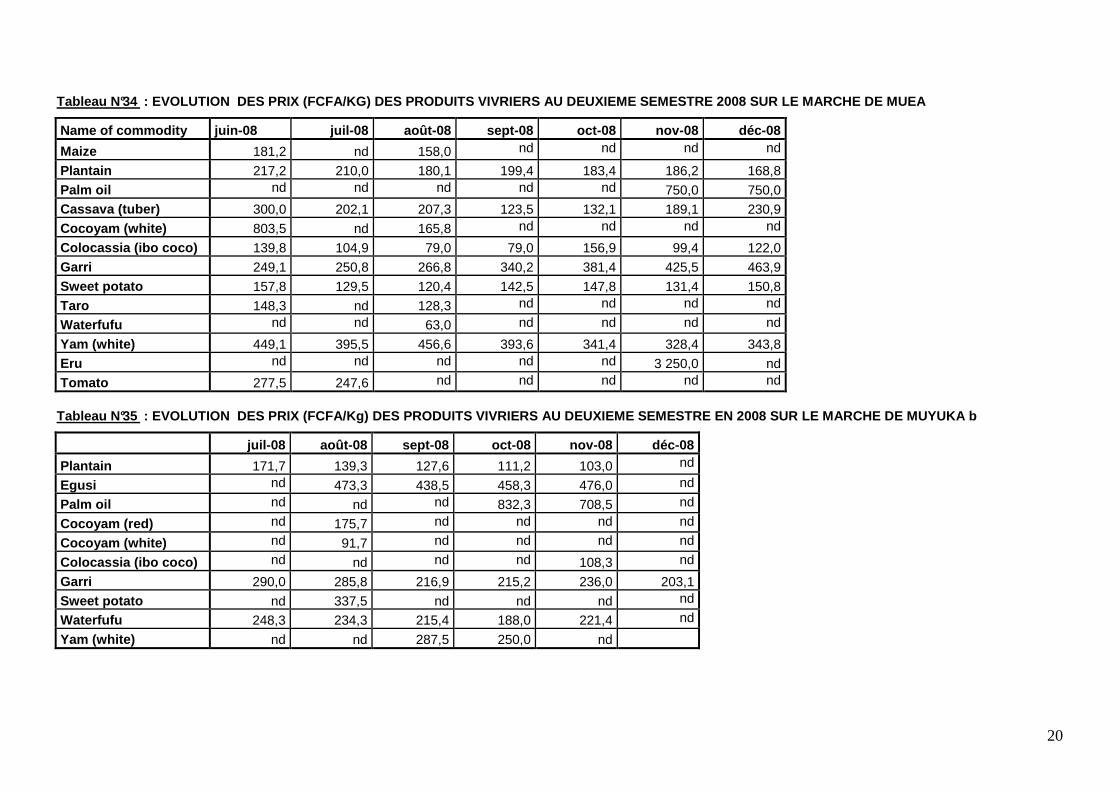
Tableau N°34 : EVOLUTION DES PRIX (FCFA/KG) DES PRODUITS VIVRI ERS AU DEUXIEME SEMESTRE 2008 SUR LE MARCHE DE MUEA
Name of commodity juin-08 juil-08 août-08 sept-08 oct-08 nov-08 déc-08
Maize 181,2 nd 158,0 nd nd nd nd
Plantain 217,2 210,0 180,1 199,4 183,4 186,2 168,8
Palm oil nd nd nd nd nd 750,0 750,0 Cassava (tuber) 300,0 202,1 207,3 123,5 132,1 189,1 230,9
Cocoyam (white) 803,5 nd 165,8 nd nd nd nd
Colocassia (ibo coco) 139,8 104,9 79,0 79,0 156,9 99,4 122,0
Garri 249,1 250,8 266,8 340,2 381,4 425,5 463,9
Sweet potato 157,8 129,5 120,4 142,5 147,8 131,4 150,8
Taro 148,3 nd 128,3 nd nd nd nd
Waterfufu nd nd 63,0 nd nd nd nd
Yam (white) 449,1 395,5 456,6 393,6 341,4 328,4 343,8
Eru nd nd nd nd nd 3 250,0 nd
Tomato 277,5 247,6 nd nd nd nd nd
Tableau N°35 : EVOLUTION DES PRIX (FCFA/Kg) DES PRODUITS VIVRI ERS AU DEUXIEME SEMESTRE EN 2008 SUR LE MARCHE DE M UYUKA b
juil-08 août-08 sept-08 oct-08 nov-08 déc-08
Plantain 171,7 139,3 127,6 111,2 103,0 nd
Egusi nd 473,3 438,5 458,3 476,0 nd
Palm oil nd nd nd 832,3 708,5 nd
Cocoyam (red) nd 175,7 nd nd nd nd
Cocoyam (white) nd 91,7 nd nd nd nd
Colocassia (ibo coco) nd nd nd nd 108,3 nd
Garri 290,0 285,8 216,9 215,2 236,0 203,1
Sweet potato nd 337,5 nd nd nd nd
Waterfufu 248,3 234,3 215,4 188,0 221,4 nd
Yam (white) nd nd 287,5 250,0 nd
21
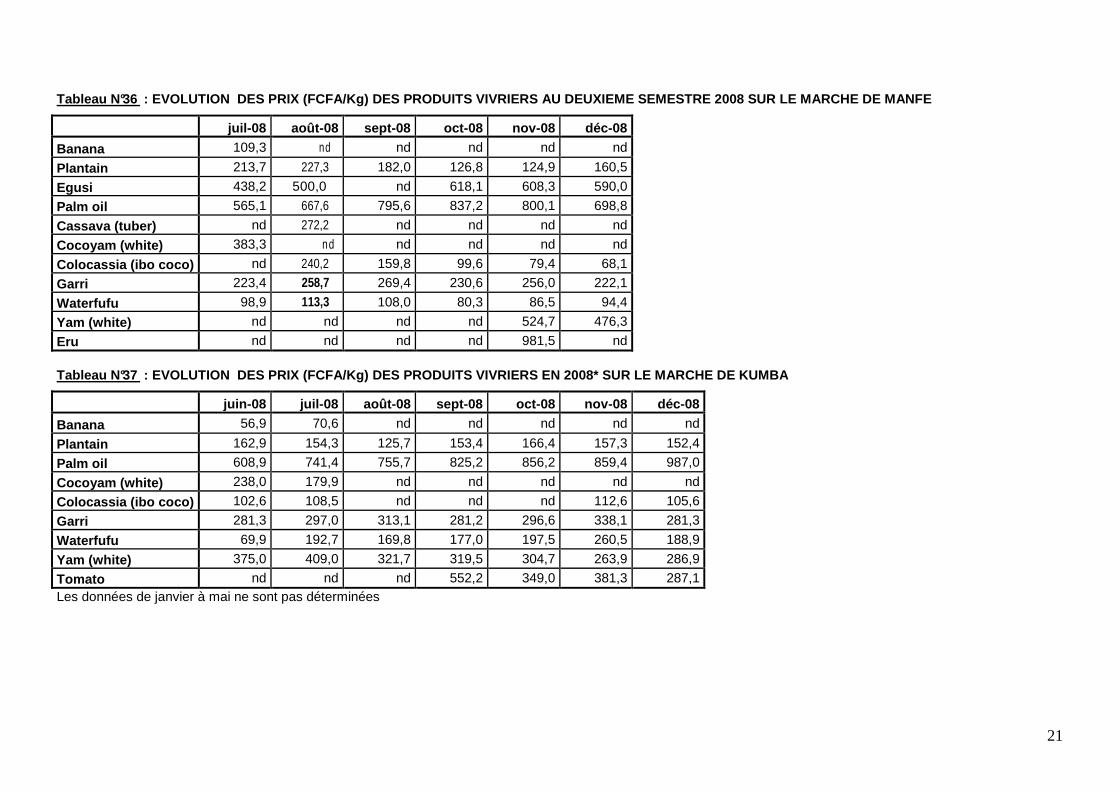
Tableau N°36 : EVOLUTION DES PRIX (FCFA/Kg) DES PRODUITS VIVRI ERS AU DEUXIEME SEMESTRE 2008 SUR LE MARCHE DE MANF E
juil-08 août-08 sept-08 oct-08 nov-08 déc-08
Banana 109,3 nd nd nd nd nd
Plantain 213,7 227,3 182,0 126,8 124,9 160,5
Egusi 438,2 500,0 nd 618,1 608,3 590,0
Palm oil 565,1 667,6 795,6 837,2 800,1 698,8
Cassava (tuber) nd 272,2 nd nd nd nd
Cocoyam (white) 383,3 nd nd nd nd nd
Colocassia (ibo coco) nd 240,2 159,8 99,6 79,4 68,1
Garri 223,4 258,7 269,4 230,6 256,0 222,1
Waterfufu 98,9 113,3 108,0 80,3 86,5 94,4
Yam (white) nd nd nd nd 524,7 476,3
Eru nd nd nd nd 981,5 nd
Tableau N°37 : EVOLUTION DES PRIX (FCFA/Kg) DES PRODUITS VIVRI ERS EN 2008* SUR LE MARCHE DE KUMBA
juin-08 juil-08 août-08 sept-08 oct-08 nov-08 déc-08
Banana 56,9 70,6 nd nd nd nd nd
Plantain 162,9 154,3 125,7 153,4 166,4 157,3 152,4
Palm oil 608,9 741,4 755,7 825,2 856,2 859,4 987,0
Cocoyam (white) 238,0 179,9 nd nd nd nd nd
Colocassia (ibo coco) 102,6 108,5 nd nd nd 112,6 105,6
Garri 281,3 297,0 313,1 281,2 296,6 338,1 281,3
Waterfufu 69,9 192,7 169,8 177,0 197,5 260,5 188,9
Yam (white) 375,0 409,0 321,7 319,5 304,7 263,9 286,9
Tomato nd nd nd 552,2 349,0 381,3 287,1 Les données de janvier à mai ne sont pas déterminées
22
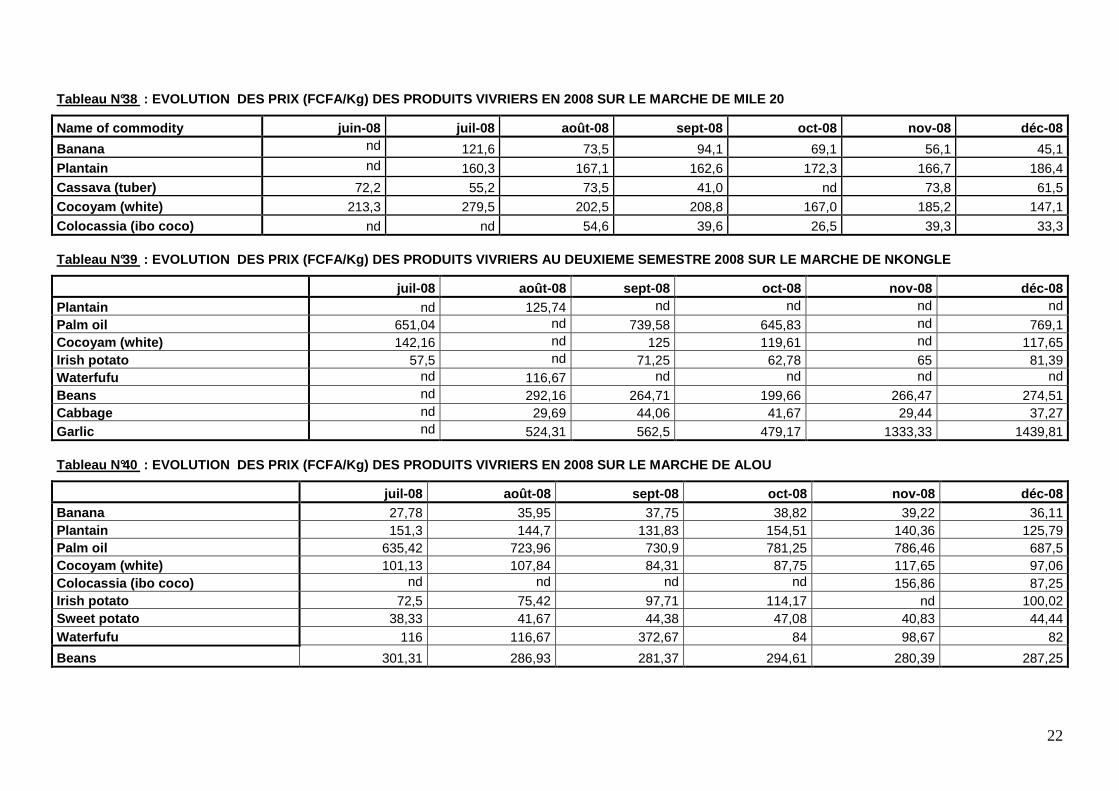
Tableau N°38 : EVOLUTION DES PRIX (FCFA/Kg) DES PRODUITS VIVRI ERS EN 2008 SUR LE MARCHE DE MILE 20
Name of commodity juin-08 juil-08 août-08 sept-08 oct-08 nov-08 déc-08
Banana nd 121,6 73,5 94,1 69,1 56,1 45,1
Plantain nd 160,3 167,1 162,6 172,3 166,7 186,4
Cassava (tuber) 72,2 55,2 73,5 41,0 nd 73,8 61,5 Cocoyam (white) 213,3 279,5 202,5 208,8 167,0 185,2 147,1
Colocassia (ibo coco) nd nd 54,6 39,6 26,5 39,3 33,3
Tableau N°39 : EVOLUTION DES PRIX (FCFA/Kg) DES PRODUITS VIVRI ERS AU DEUXIEME SEMESTRE 2008 SUR LE MARCHE DE NKON GLE
juil-08 août-08 sept-08 oct-08 nov-08 déc-08 Plantain nd 125,74 nd nd nd nd Palm oil 651,04 nd 739,58 645,83 nd 769,1 Cocoyam (white) 142,16 nd 125 119,61 nd 117,65 Irish potato 57,5 nd 71,25 62,78 65 81,39 Waterfufu nd 116,67 nd nd nd nd Beans nd 292,16 264,71 199,66 266,47 274,51 Cabbage nd 29,69 44,06 41,67 29,44 37,27 Garlic nd 524,31 562,5 479,17 1333,33 1439,81
Tableau N°40 : EVOLUTION DES PRIX (FCFA/Kg) DES PRODUITS VIVRI ERS EN 2008 SUR LE MARCHE DE ALOU
juil-08 août-08 sept-08 oct-08 nov-08 déc-08 Banana 27,78 35,95 37,75 38,82 39,22 36,11 Plantain 151,3 144,7 131,83 154,51 140,36 125,79 Palm oil 635,42 723,96 730,9 781,25 786,46 687,5 Cocoyam (white) 101,13 107,84 84,31 87,75 117,65 97,06 Colocassia (ibo coco) nd nd nd nd 156,86 87,25 Irish potato 72,5 75,42 97,71 114,17 nd 100,02 Sweet potato 38,33 41,67 44,38 47,08 40,83 44,44 Waterfufu 116 116,67 372,67 84 98,67 82
Beans 301,31 286,93 281,37 294,61 280,39 287,25
23
Tableau N°41 : EVOLUTION DES PRIX (FCFA/Kg) DES PRODUITS VIVRI ERS EN 2008 SUR LE MARCHE D'EKONDO TITI
juil-08 aout-08 sept-08 oct-08 nov-08 déc-08
Plantain 115,3 132,4 113,4 129,6 148,8 140,3
Egusi 275,7 nd 163,9 294,4 308,3 270,4
Palm oil 655 671,9 849 843,8 810,8 820,3
Cassava (tuber) 67,2 50,1 79,2 66,7 100 85,4
Colocassia (ibo coco) 78 79,2 121,7 102,3 104,8 117,3 Garri nd 254,2 283,3 286,1 nd nd
Waterfufu 83,3 nd nd 80 81,3 80
Yam (white) 322,9 nd nd nd 218,4 291,7
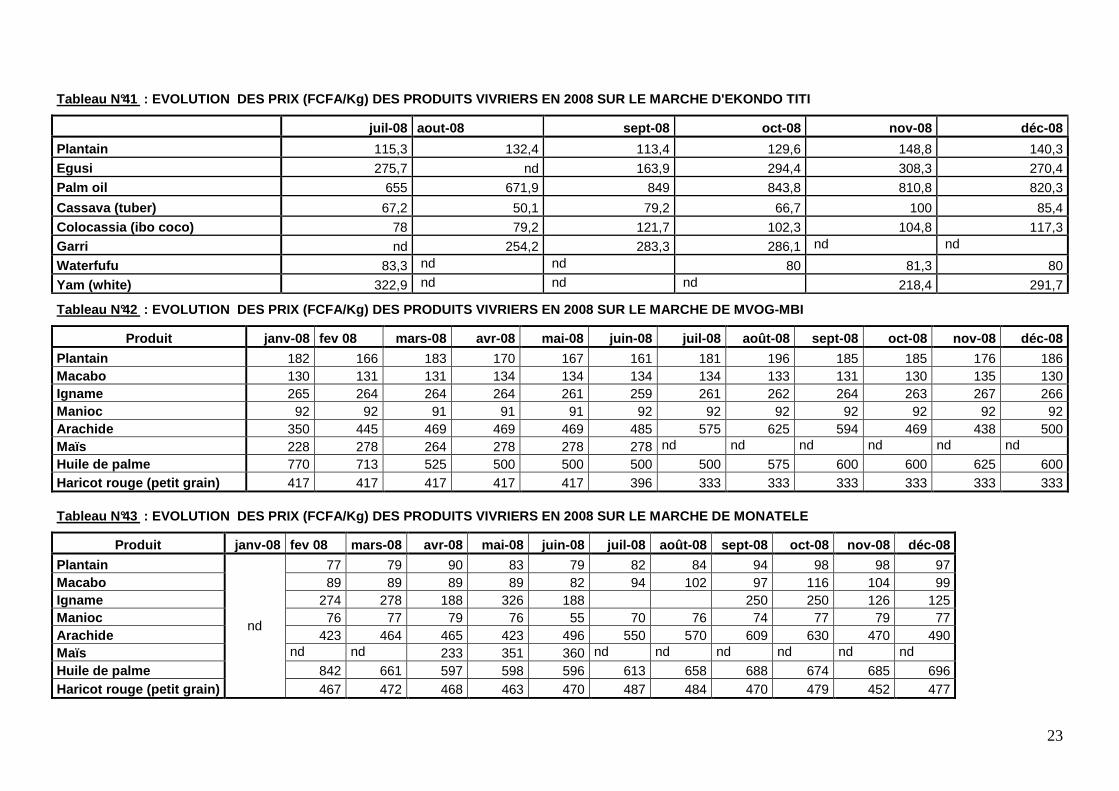
Tableau N°42 : EVOLUTION DES PRIX (FCFA/Kg) DES PRODUITS VIVRI ERS EN 2008 SUR LE MARCHE DE MVOG-MBI
Produit janv-08 fev 08 mars-08 avr-08 mai-08 juin-08 juil-08 août-08 sept-08 oct-08 nov-08 déc-08
Plantain 182 166 183 170 167 161 181 196 185 185 176 186 Macabo 130 131 131 134 134 134 134 133 131 130 135 130 Igname 265 264 264 264 261 259 261 262 264 263 267 266 Manioc 92 92 91 91 91 92 92 92 92 92 92 92 Arachide 350 445 469 469 469 485 575 625 594 469 438 500 Maïs 228 278 264 278 278 278 nd nd nd nd nd nd Huile de palme 770 713 525 500 500 500 500 575 600 600 625 600 Haricot rouge (petit grain) 417 417 417 417 417 396 333 333 333 333 333 333
Tableau N°43 : EVOLUTION DES PRIX (FCFA/Kg) DES PRODUITS VIVRI ERS EN 2008 SUR LE MARCHE DE MONATELE
Produit janv-08 fev 08 mars-08 avr-08 mai-08 juin-08 juil-08 août-08 sept-08 oct-08 nov-08 déc-08
Plantain
nd
77 79 90 83 79 82 84 94 98 98 97 Macabo 89 89 89 89 82 94 102 97 116 104 99 Igname 274 278 188 326 188 250 250 126 125 Manioc 76 77 79 76 55 70 76 74 77 79 77 Arachide 423 464 465 423 496 550 570 609 630 470 490 Maïs nd nd 233 351 360 nd nd nd nd nd nd Huile de palme 842 661 597 598 596 613 658 688 674 685 696 Haricot rouge (petit grain) 467 472 468 463 470 487 484 470 479 452 477
24
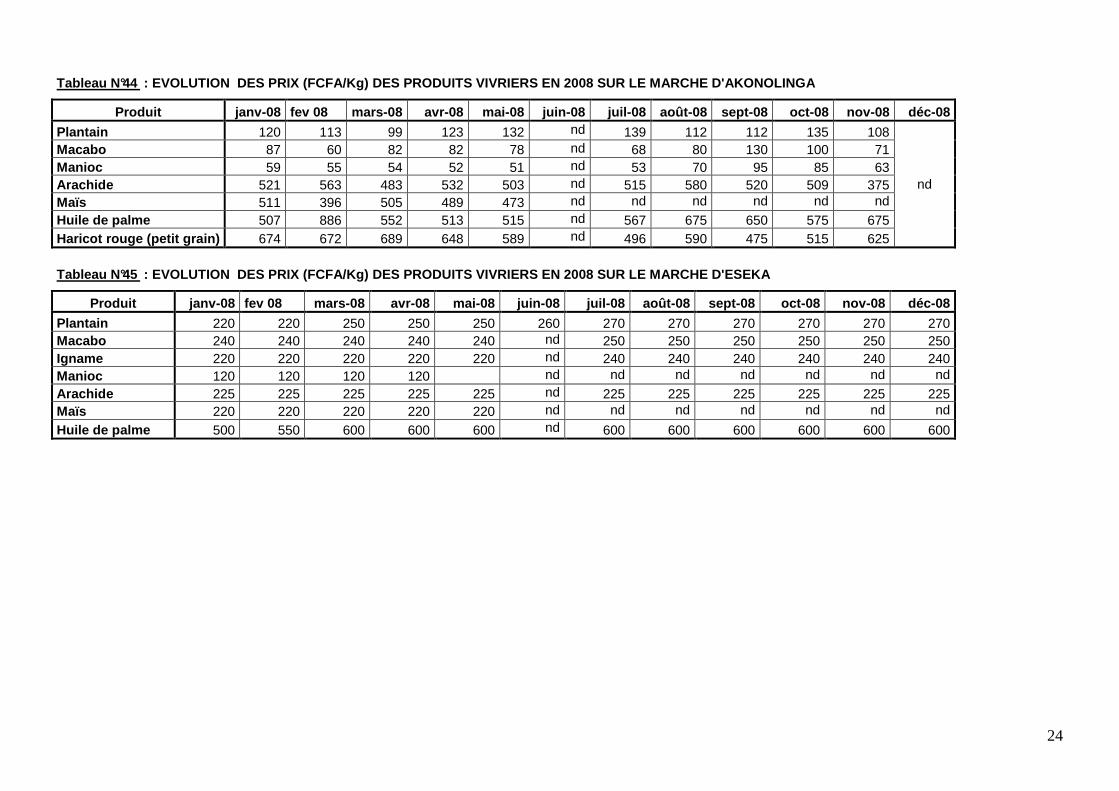
Tableau N°44 : EVOLUTION DES PRIX (FCFA/Kg) DES PRODUITS VIVRI ERS EN 2008 SUR LE MARCHE D'AKONOLINGA
Produit janv-08 fev 08 mars-08 avr-08 mai-08 juin-08 juil-08 août-08 sept-08 oct-08 nov-08 déc-08
Plantain 120 113 99 123 132 nd 139 112 112 135 108
nd
Macabo 87 60 82 82 78 nd 68 80 130 100 71 Manioc 59 55 54 52 51 nd 53 70 95 85 63 Arachide 521 563 483 532 503 nd 515 580 520 509 375 Maïs 511 396 505 489 473 nd nd nd nd nd nd Huile de palme 507 886 552 513 515 nd 567 675 650 575 675 Haricot rouge (petit grain) 674 672 689 648 589 nd 496 590 475 515 625
Tableau N°45 : EVOLUTION DES PRIX (FCFA/Kg) DES PRODUITS VIVRI ERS EN 2008 SUR LE MARCHE D'ESEKA
Produit janv-08 fev 08 mars-08 avr-08 mai-08 juin-08 juil-08 août-08 sept-08 oct-08 nov-08 déc-08
Plantain 220 220 250 250 250 260 270 270 270 270 270 270 Macabo 240 240 240 240 240 nd 250 250 250 250 250 250 Igname 220 220 220 220 220 nd 240 240 240 240 240 240 Manioc 120 120 120 120 nd nd nd nd nd nd nd Arachide 225 225 225 225 225 nd 225 225 225 225 225 225 Maïs 220 220 220 220 220 nd nd nd nd nd nd nd Huile de palme 500 550 600 600 600 nd 600 600 600 600 600 600
25
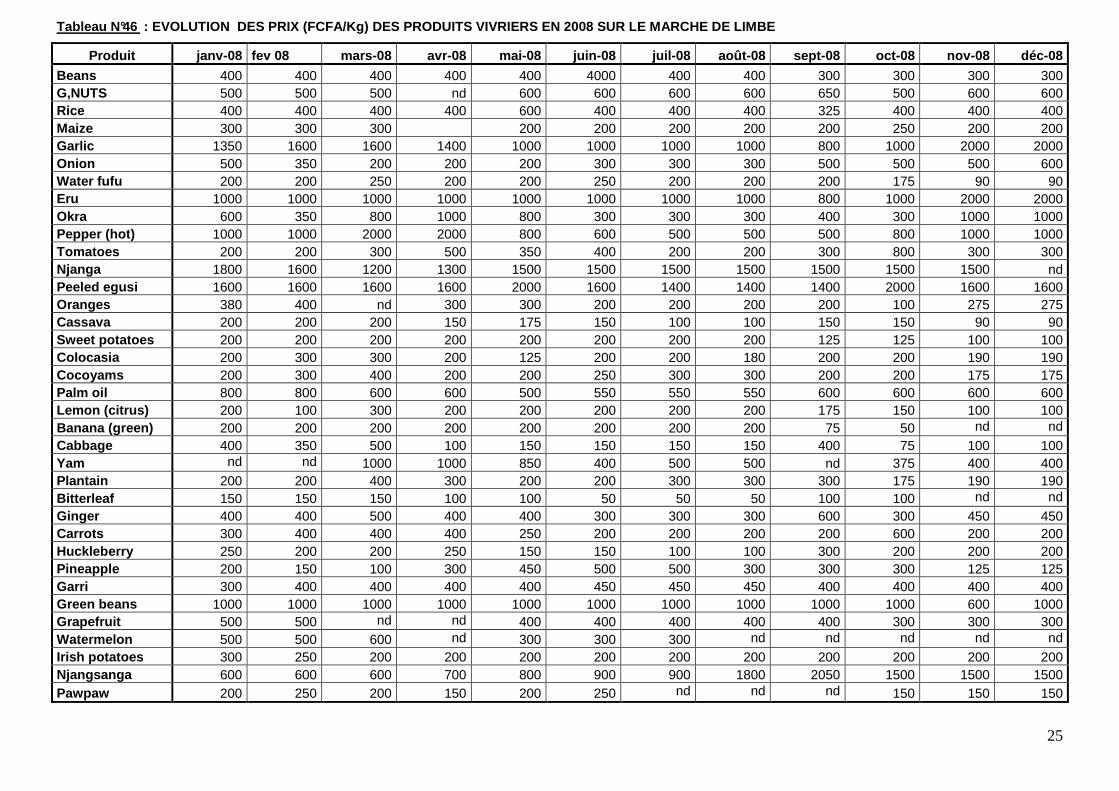
Tableau N°46 : EVOLUTION DES PRIX (FCFA/Kg) DES PRODUITS VIVRI ERS EN 2008 SUR LE MARCHE DE LIMBE
Produit janv-08 fev 08 mars-08 avr-08 mai-08 juin-08 juil-08 août-08 sept-08 oct-08 nov-08 déc-08
Beans 400 400 400 400 400 4000 400 400 300 300 300 300 G,NUTS 500 500 500 nd 600 600 600 600 650 500 600 600 Rice 400 400 400 400 600 400 400 400 325 400 400 400 Maize 300 300 300 200 200 200 200 200 250 200 200 Garlic 1350 1600 1600 1400 1000 1000 1000 1000 800 1000 2000 2000 Onion 500 350 200 200 200 300 300 300 500 500 500 600 Water fufu 200 200 250 200 200 250 200 200 200 175 90 90 Eru 1000 1000 1000 1000 1000 1000 1000 1000 800 1000 2000 2000 Okra 600 350 800 1000 800 300 300 300 400 300 1000 1000 Pepper (hot) 1000 1000 2000 2000 800 600 500 500 500 800 1000 1000 Tomatoes 200 200 300 500 350 400 200 200 300 800 300 300 Njanga 1800 1600 1200 1300 1500 1500 1500 1500 1500 1500 1500 nd Peeled egusi 1600 1600 1600 1600 2000 1600 1400 1400 1400 2000 1600 1600 Oranges 380 400 nd 300 300 200 200 200 200 100 275 275 Cassava 200 200 200 150 175 150 100 100 150 150 90 90 Sweet potatoes 200 200 200 200 200 200 200 200 125 125 100 100 Colocasia 200 300 300 200 125 200 200 180 200 200 190 190 Cocoyams 200 300 400 200 200 250 300 300 200 200 175 175 Palm oil 800 800 600 600 500 550 550 550 600 600 600 600 Lemon (citrus) 200 100 300 200 200 200 200 200 175 150 100 100 Banana (green) 200 200 200 200 200 200 200 200 75 50 nd nd Cabbage 400 350 500 100 150 150 150 150 400 75 100 100 Yam nd nd 1000 1000 850 400 500 500 nd 375 400 400 Plantain 200 200 400 300 200 200 300 300 300 175 190 190 Bitterleaf 150 150 150 100 100 50 50 50 100 100 nd nd Ginger 400 400 500 400 400 300 300 300 600 300 450 450 Carrots 300 400 400 400 250 200 200 200 200 600 200 200 Huckleberry 250 200 200 250 150 150 100 100 300 200 200 200 Pineapple 200 150 100 300 450 500 500 300 300 300 125 125 Garri 300 400 400 400 400 450 450 450 400 400 400 400 Green beans 1000 1000 1000 1000 1000 1000 1000 1000 1000 1000 600 1000 Grapefruit 500 500 nd nd 400 400 400 400 400 300 300 300 Watermelon 500 500 600 nd 300 300 300 nd nd nd nd nd Irish potatoes 300 250 200 200 200 200 200 200 200 200 200 200 Njangsanga 600 600 600 700 800 900 900 1800 2050 1500 1500 1500 Pawpaw 200 250 200 150 200 250 nd nd nd 150 150 150
26
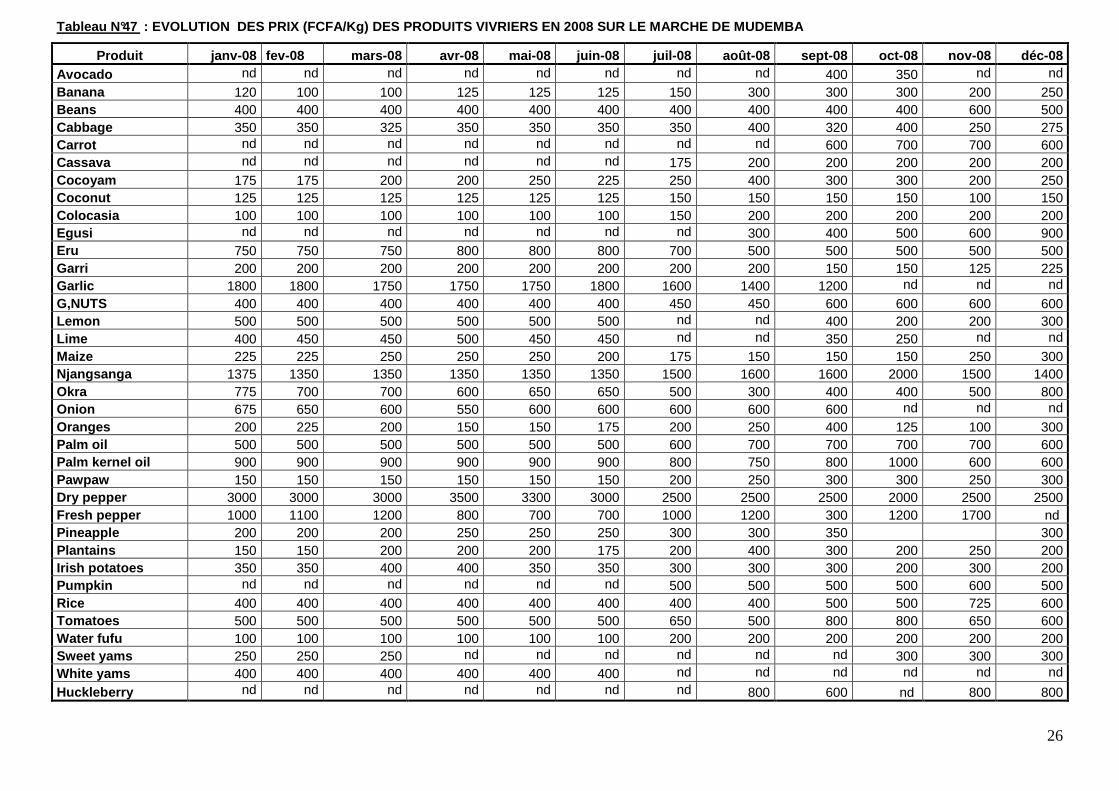
Tableau N°47 : EVOLUTION DES PRIX (FCFA/Kg) DES PRODUITS VIVRI ERS EN 2008 SUR LE MARCHE DE MUDEMBA
Produit janv-08 fev-08 mars-08 avr-08 mai-08 juin-08 juil-08 août-08 sept-08 oct-08 nov-08 déc-08 Avocado nd nd nd nd nd nd nd nd 400 350 nd nd Banana 120 100 100 125 125 125 150 300 300 300 200 250 Beans 400 400 400 400 400 400 400 400 400 400 600 500 Cabbage 350 350 325 350 350 350 350 400 320 400 250 275 Carrot nd nd nd nd nd nd nd nd 600 700 700 600 Cassava nd nd nd nd nd nd 175 200 200 200 200 200 Cocoyam 175 175 200 200 250 225 250 400 300 300 200 250 Coconut 125 125 125 125 125 125 150 150 150 150 100 150 Colocasia 100 100 100 100 100 100 150 200 200 200 200 200 Egusi nd nd nd nd nd nd nd 300 400 500 600 900 Eru 750 750 750 800 800 800 700 500 500 500 500 500 Garri 200 200 200 200 200 200 200 200 150 150 125 225 Garlic 1800 1800 1750 1750 1750 1800 1600 1400 1200 nd nd nd G,NUTS 400 400 400 400 400 400 450 450 600 600 600 600 Lemon 500 500 500 500 500 500 nd nd 400 200 200 300 Lime 400 450 450 500 450 450 nd nd 350 250 nd nd Maize 225 225 250 250 250 200 175 150 150 150 250 300 Njangsanga 1375 1350 1350 1350 1350 1350 1500 1600 1600 2000 1500 1400 Okra 775 700 700 600 650 650 500 300 400 400 500 800 Onion 675 650 600 550 600 600 600 600 600 nd nd nd Oranges 200 225 200 150 150 175 200 250 400 125 100 300 Palm oil 500 500 500 500 500 500 600 700 700 700 700 600 Palm kernel oil 900 900 900 900 900 900 800 750 800 1000 600 600 Pawpaw 150 150 150 150 150 150 200 250 300 300 250 300 Dry pepper 3000 3000 3000 3500 3300 3000 2500 2500 2500 2000 2500 2500 Fresh pepper 1000 1100 1200 800 700 700 1000 1200 300 1200 1700 nd Pineapple 200 200 200 250 250 250 300 300 350 300 Plantains 150 150 200 200 200 175 200 400 300 200 250 200 Irish potatoes 350 350 400 400 350 350 300 300 300 200 300 200 Pumpkin nd nd nd nd nd nd 500 500 500 500 600 500 Rice 400 400 400 400 400 400 400 400 500 500 725 600 Tomatoes 500 500 500 500 500 500 650 500 800 800 650 600 Water fufu 100 100 100 100 100 100 200 200 200 200 200 200 Sweet yams 250 250 250 nd nd nd nd nd nd 300 300 300 White yams 400 400 400 400 400 400 nd nd nd nd nd nd Huckleberry nd nd nd nd nd nd nd 800 600 nd 800 800
27
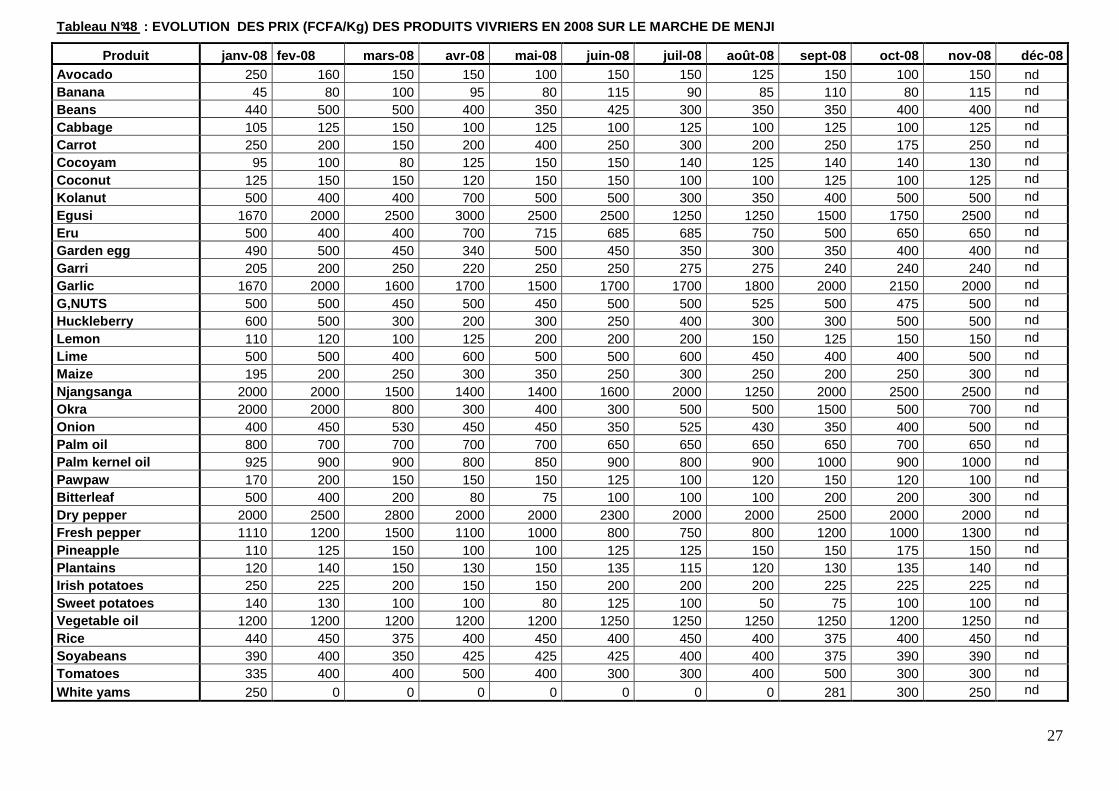
Tableau N°48 : EVOLUTION DES PRIX (FCFA/Kg) DES PRODUITS VIVRI ERS EN 2008 SUR LE MARCHE DE MENJI
Produit janv-08 fev-08 mars-08 avr-08 mai-08 juin-08 juil-08 août-08 sept-08 oct-08 nov-08 déc-08 Avocado 250 160 150 150 100 150 150 125 150 100 150 nd Banana 45 80 100 95 80 115 90 85 110 80 115 nd Beans 440 500 500 400 350 425 300 350 350 400 400 nd Cabbage 105 125 150 100 125 100 125 100 125 100 125 nd Carrot 250 200 150 200 400 250 300 200 250 175 250 nd Cocoyam 95 100 80 125 150 150 140 125 140 140 130 nd Coconut 125 150 150 120 150 150 100 100 125 100 125 nd Kolanut 500 400 400 700 500 500 300 350 400 500 500 nd Egusi 1670 2000 2500 3000 2500 2500 1250 1250 1500 1750 2500 nd Eru 500 400 400 700 715 685 685 750 500 650 650 nd Garden egg 490 500 450 340 500 450 350 300 350 400 400 nd Garri 205 200 250 220 250 250 275 275 240 240 240 nd Garlic 1670 2000 1600 1700 1500 1700 1700 1800 2000 2150 2000 nd G,NUTS 500 500 450 500 450 500 500 525 500 475 500 nd Huckleberry 600 500 300 200 300 250 400 300 300 500 500 nd Lemon 110 120 100 125 200 200 200 150 125 150 150 nd Lime 500 500 400 600 500 500 600 450 400 400 500 nd Maize 195 200 250 300 350 250 300 250 200 250 300 nd Njangsanga 2000 2000 1500 1400 1400 1600 2000 1250 2000 2500 2500 nd Okra 2000 2000 800 300 400 300 500 500 1500 500 700 nd Onion 400 450 530 450 450 350 525 430 350 400 500 nd Palm oil 800 700 700 700 700 650 650 650 650 700 650 nd Palm kernel oil 925 900 900 800 850 900 800 900 1000 900 1000 nd Pawpaw 170 200 150 150 150 125 100 120 150 120 100 nd Bitterleaf 500 400 200 80 75 100 100 100 200 200 300 nd Dry pepper 2000 2500 2800 2000 2000 2300 2000 2000 2500 2000 2000 nd Fresh pepper 1110 1200 1500 1100 1000 800 750 800 1200 1000 1300 nd Pineapple 110 125 150 100 100 125 125 150 150 175 150 nd Plantains 120 140 150 130 150 135 115 120 130 135 140 nd Irish potatoes 250 225 200 150 150 200 200 200 225 225 225 nd Sweet potatoes 140 130 100 100 80 125 100 50 75 100 100 nd Vegetable oil 1200 1200 1200 1200 1200 1250 1250 1250 1250 1200 1250 nd Rice 440 450 375 400 450 400 450 400 375 400 450 nd Soyabeans 390 400 350 425 425 425 400 400 375 390 390 nd Tomatoes 335 400 400 500 400 300 300 400 500 300 300 nd White yams 250 0 0 0 0 0 0 0 281 300 250 nd
28
PRIX DES INTRANTS AGRICOLES EN 2008
29
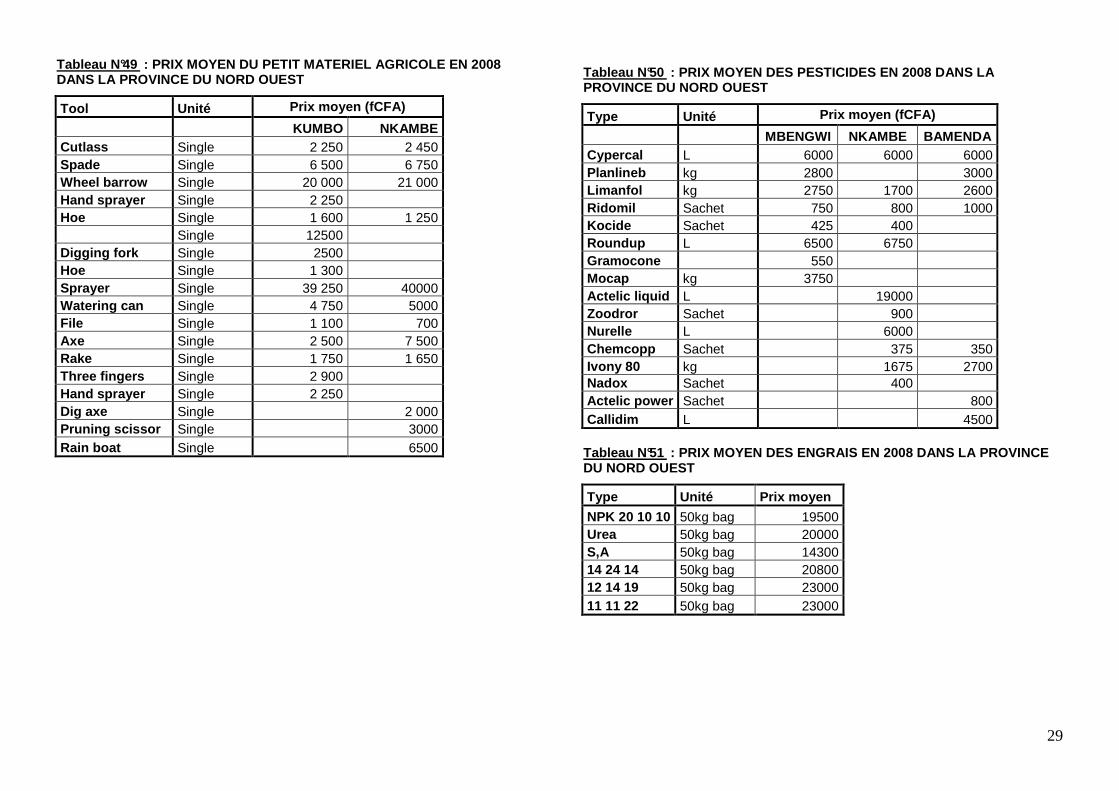
Tableau N°49 : PRIX MOYEN DU PETIT MATERIEL AGRICOLE EN 2008 DANS LA PROVINCE DU NORD OUEST
Tool Unité Prix moyen (fCFA)
KUMBO NKAMBE Cutlass Single 2 250 2 450 Spade Single 6 500 6 750 Wheel barrow Single 20 000 21 000 Hand sprayer Single 2 250 Hoe Single 1 600 1 250 Single 12500 Digging fork Single 2500 Hoe Single 1 300 Sprayer Single 39 250 40000 Watering can Single 4 750 5000 File Single 1 100 700 Axe Single 2 500 7 500 Rake Single 1 750 1 650 Three fingers Single 2 900 Hand sprayer Single 2 250 Dig axe Single 2 000 Pruning scissor Single 3000 Rain boat Single 6500
Tableau N°50 : PRIX MOYEN DES PESTICIDES EN 2008 DANS LA PROVINCE DU NORD OUEST
Type Unité Prix moyen (fCFA)
MBENGWI NKAMBE BAMENDA Cypercal L 6000 6000 6000 Planlineb kg 2800 3000 Limanfol kg 2750 1700 2600 Ridomil Sachet 750 800 1000 Kocide Sachet 425 400 Roundup L 6500 6750 Gramocone 550 Mocap kg 3750 Actelic liquid L 19000 Zoodror Sachet 900 Nurelle L 6000 Chemcopp Sachet 375 350 Ivony 80 kg 1675 2700 Nadox Sachet 400 Actelic power Sachet 800 Callidim L 4500
Tableau N°51 : PRIX MOYEN DES ENGRAIS EN 2008 DANS LA PROVINCE DU NORD OUEST
Type Unité Prix moyen
NPK 20 10 10 50kg bag 19500 Urea 50kg bag 20000 S,A 50kg bag 14300 14 24 14 50kg bag 20800 12 14 19 50kg bag 23000 11 11 22 50kg bag 23000
30
Tableau N°52 : PRIX MOYEN DES PESTICIDES EN 2008 DANS LA PROVINCE DE L’ADAMAOUA
Types Conditionnement Nature Prix (Fcfa)
VINA MBERE
Agrazine Herbicide 2500 Round up Sachet 250g 2500 Herbimais Herbicide 5000 Round up 1l 6000 Round up 5l 30000 Amibal 500 EC en liquide 3 500 Culidiome 100 EC en liquide Insecticide 3 500 Cygogne en liquide Insecticide 3 500 Simuthium en liquide Insecticide 3 500 Thionex 50 EC en liquide Insecticide 3 500 Mancozeb en poudre Fongicide 3 750 Manebe en poudre Fongicide 3 750 Furadan en poudre Insecticide 750 Général en poudre Insecticide 750 Propalm en poudre Insecticide 750 Proposeur en poudre Insecticide 750 Proudron en poudre Insecticide 750 Thioral en poudre Insecticide 750 Bastion 10g 3000 Fixant 1l 3500 Gramoxone 5l 22500 Gramoxone 1l 3800 Gramoxone 1l 5000 Ivory 1kg 2800 Kalach Sachet 2000 Kalach 1l 5000 Kocid 2000 Sachet Herbicide 5000 Penncozeb 800 WP Litre Herbicide 3 750 Pilori 1kg Herbicide 4000 Plantined 1kg 3000
Tableau N°53 : PRIX MOYEN DES SEMENCES EN 2008 DANS LA PROVINCE DE L’ADAMAOUA
Types Conditionnement VINA FARO & DEO MBERE
Prix Fcfa
Arachide Tasse 500 Basilic Sachet 700 Betterave sachet 3500 Betterave Sachet 700 Carotte Boîte 3000 Carotte panar Boîte 4000 Céleri Sachet 700 Chou Sachet 700 CMS 600 Concombre Boîte 3500 Gombo Boîte 3500 Tasse 400 Haricot kg 2000 Laitue batavia Sachet 700 Manioc/4115 30cm de bouture 30 Manioc/8050 30cm de bouture 30 Manioc/95/0109 30cm de bouture 30 Maïs Tasse 500 Maïs CMS Sachet 1kg 1000 Maïs panar 1kg 2000 Maïs Shaba Sachet 1kg 800 800 Persil Boîte 3500 Piment Boîte 15000 Pomme de Terre Seau de 15l 10000 Poireau Boîte 5500 Tomate roma Boîte 6500 Tomate rossel Boîte 8500
31
Tableau N°54 : PRIX MOYEN DU PETIT MATERIEL AGRICOLE EN 2008 DANS LA PROVINCE DANS LA VINA
Types Prix Fcfa
Appareil Matabi 39000 Appareil Shogun 35000 Appareil Rosy 25000 Arrosoir de fabrication locale 3500
Tableau N°55 : PRIX MOYEN (FCFA/KG) DES ENGRAIS EN 2008 DANS LA PROVINCE DE L’ADAMAOUA
Types Conditionnement Prix moyen en fCFA
VINA MBERE Fertigolfol L 500 Urée 46% Sac de 50kg 410 500 20 10 10 390
Tableau N°56 : PRIX MOYEN DU PETIT MATERIEL AGRICOLE EN 2008 DANS LA PROVINCE DANS LA SUD
Type Ebolowa Sangmélima Ambam
Houes 1 000 1 665 1 700 Machette 2 050 2 250 2 500 Hache 5 000 5 000 Arrosoir plastique 4 250 3 335 5 000 Brouettes 17 000 16 500 20 000 Limes 1 300 1 000 1 500 Pulvérisateurs 30 000 37 500 40 000 Trident 3 500 4 500 Porte tout 58 000 84 166 72 000 Plantoir 1 600 3 250 Dabas 2 500 3 000 Bottes 4 500 6 883 5 000 Râteau 1 500 2 000 2 000 Pioche 3 800 Tronçonneuse 800 000 850 000 Gants 1 500 2 500 Arrosoir en plastique 5 000 Arrosoir galvanisé 9 000 Atomiseur 350 000 Binette 4 500 Cache nez 500 Motopompe 295 000 Pelle col de cygne 2 450 Pelle pêche 2 000 Scie à bois 4 000
32
Tableau N°57 : PRIX MOYEN DU PETIT MATERIEL AGRICOLE EN 2008 DANS LA PROVINCE DE L’EST A BATOURI
N° Matériels Prix N° Matériels Prix 01 Machette 2.000 15 Couteau 500 02 Lime 1.000 16 Hache 5.000 03 Daba 3.000 17 Râteau 2.000 04 Daba locales 2.500 18 Bara mine 7.500 05 Binette 1.500 19 Pelle bêche 2.500 06 Houes 1.000 20 Pelle carrée 3.000 07 Pioche 3.000 21 Plantoir 3.000 08 Sécateur 4.500 22 Gants 2.500 09 Pulvérisateur 38.000 23 Brouette 20.000 10 Bottes 6.000 24 Porte tout 55.000 11 Cordeau 2.000 25 Arrosoir (plastic) 3.500 12 Double- décamètre 3.000 26 Arrosoir (local) 3.500 13 Seau 1.200 27 Cuvette 3.500 14 Balance 6.000 28 Panier 500
Tableau N°58 : PRIX MOYEN DES ENGRAIS EN 2008 DANS LA PROVINCE DE L’EST A BATOURI
BATOURI
Urée Sac de 50kg 24500 NPK (20-10-10) Sac de 50kg 23000 Fertigolfol L 4000 Urée 46% Sac de 50kg 20 10 10
Tableau N°59 : PRIX MOYEN DES SEMENCES EN 2008 DANS LA PROVINCE DE L’EST
SEMENCE DJEREM BATOURI Types Conditionnement Prix Fcfa
Maïs Shaba Sachet 1kg 800 Maïs CMS Sachet 1kg 800 Maïs tout venant Sachet 1kg 300 Semence de base Sachet 5kg 10000 Tomate Sachet 50g 750 Carotte Sachet 50g 750 Persil Sachet 50g 800 Piment Sachet 50g 800 Maïs BSR/81 1kg 500 Maïs CMS (jaune) 1kg 500 Maïs cms(blanc) 1kg 500 Maïs Shiba 1kg 500 Maïs local tasse 100 Arachide A26 1kg 500 Arachide locale Verre 100 Igname semenceaux 1kg 350
33
TABLEAU N°60 : PRIX MOYEN DES PESTICIDES EN 2008 DANS LE LOM &DJEREM
Produits
phytosanitaires. conditionnement Prix (francs
CFA)
HERBICIDE Roundup litre 6000 Glyphader litre 6000 Gramoxone litre 6000
FONGICIDES
Phantineb kilogramme 3000 Trimangol kilogramme 2800 Trimanèbe kilogramme 2800 Callomil + sachet de 10
gramme 800
INSECTICIDES
Cythrine 50 EC litre 5500 Cypercal 50 EC litre 5000 Planthoate 400 EC litre 32500 Callidim 400 EC litre 32500 Cycogne 50 EC litre 6000 Cyperplant 50 EC litre 6000 Thionex 35 EC litre 7000 Cypercal 12 EC litre 6000 Thiodan 35 EC litre 6000 Cygogne 12 EC bidon de 5 litres 22500 Dursban (4) litre 12000 Decis litre 12000 Cyperplant 100 Ec litre 10000 Actellic 50 EC litre 20000 Bastion 10 G litre 4500 K-OBIOL DP kilogramme 800 Cypercal sachet de 50
gramme 800 Sevin 85 S sachet de 40
gramme 800 Percal (M) sachet de 50
gramme 600
TABLEAU N°61 : PRIX MOYEN DES ENGRAIS EN 2008 DANS LE LOM & DJEREM
Produits
phytosanitaires. Prix (francs CFA)
ENGRAIS
20-10-10 complexe Sac 30 000 20-10-10 complexe kilogramme 650 20-10-10 Bulk sac 27 000 20-10-10 Bulk kilogramme 600 Urée sac 28 000 Urée kilogramme 600 Sulfate d’ammoniaque sac 20000 Sulfate d’ammoniaque kilogramme 450 Plantonus (foléaire) kilogramme 4000
34
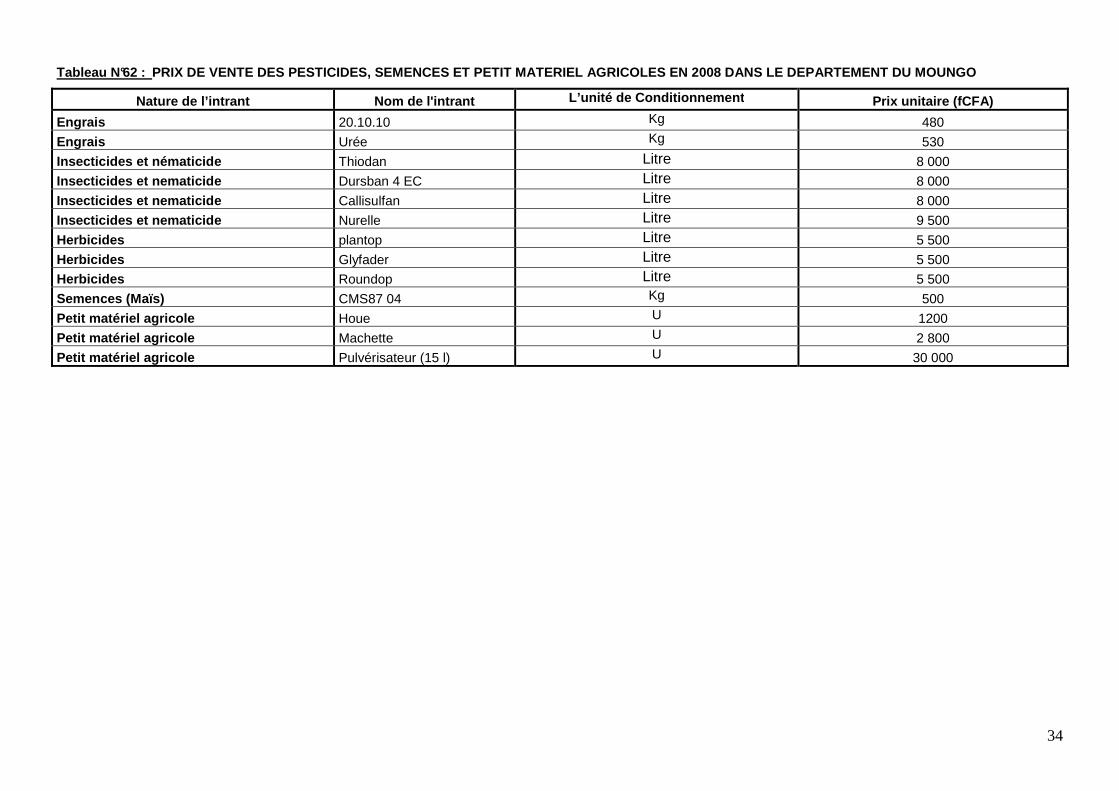
Tableau N°62 : PRIX DE VENTE DES PESTICIDES, SEMENCES ET PETIT MATERIEL AGRICOLES EN 2008 DANS LE DEPARTEMENT DU MOUN GO
Nature de l’intrant Nom de l'intrant L’unité de Conditionnement Prix unitaire (fCFA)
Engrais 20.10.10 Kg 480
Engrais Urée Kg 530
Insecticides et nématicide Thiodan Litre 8 000
Insecticides et nematicide Dursban 4 EC Litre 8 000
Insecticides et nematicide Callisulfan Litre 8 000
Insecticides et nematicide Nurelle Litre 9 500
Herbicides plantop Litre 5 500
Herbicides Glyfader Litre 5 500
Herbicides Roundop Litre 5 500
Semences (Maïs) CMS87 04 Kg 500
Petit matériel agricole Houe U 1200
Petit matériel agricole Machette U 2 800
Petit matériel agricole Pulvérisateur (15 l) U 30 000