Independent divergence of 13- and 17-y life cycles among ...
6
Independent divergence of 13- and 17-y life cycles among three periodical cicada lineages Teiji Sota a,1 , Satoshi Yamamoto b , John R. Cooley c , Kathy B. R. Hill c , Chris Simon c , and Jin Yoshimura d,e,f a Department of Zoology, Graduate School of Science, Kyoto University, Sakyo, Kyoto 606-8502, Japan; b Graduate School of Global Environmental Studies, Kyoto University, Sakyo, Kyoto 606-8501, Japan; c Department of Ecology and Evolutionary Biology, University of Connecticut, Storrs, CT 06268-3043; d Department of Systems Engineering, Shizuoka University, Hamamatsu 432-8561, Japan; e Marine Biosystems Research Center, Chiba University, Kamogawa 299-5502, Chiba, Japan; and f Department of Environmental and Forest Biology, State University of New York College of Environmental Science and Forestry, Syracuse, NY 13210 Edited by Mary Jane West-Eberhard, Smithsonian Tropical Research Institute, Ciudad Universitaria, Costa Rica, and approved February 22, 2013 (received for review November 16, 2012) The evolution of 13- and 17-y periodical cicadas (Magicicada) is enigmatic because at any given location, up to three distinct spe- cies groups (Decim, Cassini, Decula) with synchronized life cycles are involved. Each species group is divided into one 13- and one 17-y species with the exception of the Decim group, which con- tains two 13-y species—13-y species are Magicicada tredecim, Magicicada neotredecim, Magicicada tredecassini, and Magicicada tredecula; and 17-y species are Magicicada septendecim, Magici- cada cassini, and Magicicada septendecula. Here we show that the divergence leading to the present 13- and 17-y populations differs considerably among the species groups despite the fact that each group exhibits strikingly similar phylogeographic patterning. The earliest divergence of extant lineages occurred ∼4 Mya with one branch forming the Decim species group and the other subsequently splitting 2.5 Mya to form the Cassini and Decula species groups. The earliest split of extant lineages into 13- and 17-y life cycles occurred in the Decim lineage 0.5 Mya. All three species groups experienced at least one episode of life cycle divergence since the last glacial maximum. We hypothesize that despite independent origins, the three species groups achieved their current overlap- ping distributions because life-cycle synchronization of invading congeners to a dominant resident population enabled escape from predation and population persistence. The repeated life-cycle diver- gences supported by our data suggest the presence of a common genetic basis for the two life cycles in the three species groups. life-cycle shift | nurse brood | parallel evolution | speciation P eriodical cicadas (Magicicada) in the eastern United States represent one of the most spectacular life history and population phenomena in nature (1–10). These periodical ci- cadas spend most of their lives (13 y in the south, 17 y in the north) as underground juveniles except for a brief 2- to 4-wk period when adults emerge simultaneously in massive num- bers. With few exceptions, at any given location, all of the pe- riodical cicadas share the same life cycle and emerge on the same schedule, forming a single-year class referred to as a “brood.” Surprisingly, each brood consists of multiple species from three species groups (Decim, Cassini, Decula). These three groups were considered to have diverged from each other allopatrically and to have later become sympatric and formed 13- and 17-y life cycles (2). The prolonged, prime- numbered life cycles were hypothesized to have evolved in re- sponse to Pleistocene climatic cooling (9, 11) to avoid the adverse effect of low population density on mating success (9, 12, 13). Another view hypothesized that the long synchronized life cycles evolved in association with the predator avoidance strategy (2, 4, 8) and that this took place before both the glacial periods and the split of the three species groups (10) based on approx- imate genetic distances among species groups (8). To test these hypotheses, phylogenetic information about the relationships of species, broods, and populations is essential. However, phyloge- netic studies of Magicicada have been largely limited to the Decim group (6, 14–18), and only rough divergence times among species have been inferred (8, 10). Thus, a comprehensive molecular phylogeny covering all of the extant broods, their phylogeography, and divergence time has been lacking until now. We conducted molecular phylogenetic and population genetic analyses by using nuclear and mitochondrial DNA markers for samples collected over a 30-y period (1978–2008). These samples represent all 15 extant broods and all known species (Table S1). Results and Discussion Phylogenetic analyses and divergence time estimation based on four nuclear and three mitochondrial genes (Table S2) clearly reveal the monophyly of each of the three species groups (Decim, Cassini, and Decula) and the sister relationship be- tween Cassini and Decula (Fig. 1). A Bayesian relaxed clock analysis shows that the three species groups diverged 3.9 Mya. Initially the Decim group diverged from the ancestor of Cassini + Decula, then Cassini and Decula separated 2.5 Mya (Fig. 1). The mitochondrial gene genealogy further shows divergence associated with regions, and partly with life cycles (Fig. 2, Figs. S1 and S2, and Table S3). We distinguished four mitochondrial haplotype groups in Decim and three each in Cassini and Decula (Fig. 2 A–C). The geographic distributions of mitochondrial haplotype groups within each species group show similar divi- sions among eastern, middle, and western regions (Fig. 2 D–F). In Decim, there is also a major divergence between northern and southern groups corresponding to formally distinguished mito- chondrial lineages A and B, respectively (15). Group A is di- vided into three groups, Ae, Am, and Aw, which occur in the eastern, middle, and western parts of the United States east of the Great Plains, respectively. Populations of Ae and Am exhibit a 17-y cycle (Magicicada septendecim); those of Aw both 17-y (M. septendecim) and 13-y (Magicicada neotredecim) cycles; and those of B show only a 13-y cycle (Magicicada tredecim). At the boundary of Ae and Am, a few populations possess both Ae and Am haplotypes. The Cassini group consists of three haplotype groups, Ce, Cm, and Cw, again occurring in the eastern, middle, and western regions, respectively (Fig. 2). Populations with Ce and Cm show 17-y cycles only (Magicicada cassini ), whereas those of Cw show both 17- and 13-y cycles (M. cassini and Author contributions: T.S. and J.Y. designed research; T.S., S.Y., J.R.C., K.B.R.H., C.S., and J.Y. performed research; T.S. and S.Y. analyzed data; and T.S., J.R.C., and C.S. wrote the paper. The authors declare no conflict of interest. This article is a PNAS Direct Submission. Freely available online through the PNAS open access option. Data deposition: The sequences reported in this paper have been deposited in the DNA Data Bank of Japan (accession nos. AB740543–AB740917). See Commentary on page 6620. 1 To whom correspondence should be addressed. E-mail: [email protected]. This article contains supporting information online at www.pnas.org/lookup/suppl/doi:10. 1073/pnas.1220060110/-/DCSupplemental. www.pnas.org/cgi/doi/10.1073/pnas.1220060110 PNAS | April 23, 2013 | vol. 110 | no. 17 | 6919–6924 EVOLUTION SEE COMMENTARY Downloaded by guest on November 20, 2021
Transcript of Independent divergence of 13- and 17-y life cycles among ...
Independent divergence of 13- and 17-y life cyclesamong three periodical cicada lineagesTeiji Sotaa,1, Satoshi Yamamotob, John R. Cooleyc, Kathy B. R. Hillc, Chris Simonc, and Jin Yoshimurad,e,f
aDepartment of Zoology, Graduate School of Science, Kyoto University, Sakyo, Kyoto 606-8502, Japan; bGraduate School of Global EnvironmentalStudies, Kyoto University, Sakyo, Kyoto 606-8501, Japan; cDepartment of Ecology and Evolutionary Biology, University of Connecticut, Storrs,CT 06268-3043; dDepartment of Systems Engineering, Shizuoka University, Hamamatsu 432-8561, Japan; eMarine Biosystems Research Center,Chiba University, Kamogawa 299-5502, Chiba, Japan; and fDepartment of Environmental and Forest Biology, State University of New YorkCollege of Environmental Science and Forestry, Syracuse, NY 13210
Edited by Mary Jane West-Eberhard, Smithsonian Tropical Research Institute, Ciudad Universitaria, Costa Rica, and approved February 22, 2013 (received forreview November 16, 2012)
The evolution of 13- and 17-y periodical cicadas (Magicicada) isenigmatic because at any given location, up to three distinct spe-cies groups (Decim, Cassini, Decula) with synchronized life cyclesare involved. Each species group is divided into one 13- and one17-y species with the exception of the Decim group, which con-tains two 13-y species—13-y species are Magicicada tredecim,Magicicada neotredecim, Magicicada tredecassini, and Magicicadatredecula; and 17-y species are Magicicada septendecim, Magici-cada cassini, and Magicicada septendecula. Here we show that thedivergence leading to the present 13- and 17-y populations differsconsiderably among the species groups despite the fact that eachgroup exhibits strikingly similar phylogeographic patterning. Theearliest divergence of extant lineages occurred ∼4 Mya with onebranch forming the Decim species group and the other subsequentlysplitting 2.5 Mya to form the Cassini and Decula species groups.The earliest split of extant lineages into 13- and 17-y life cyclesoccurred in the Decim lineage 0.5 Mya. All three species groupsexperienced at least one episode of life cycle divergence since thelast glacial maximum. We hypothesize that despite independentorigins, the three species groups achieved their current overlap-ping distributions because life-cycle synchronization of invadingcongeners to a dominant resident population enabled escape frompredation and population persistence. The repeated life-cycle diver-gences supported by our data suggest the presence of a commongenetic basis for the two life cycles in the three species groups.
life-cycle shift | nurse brood | parallel evolution | speciation
Periodical cicadas (Magicicada) in the eastern United Statesrepresent one of the most spectacular life history and
population phenomena in nature (1–10). These periodical ci-cadas spend most of their lives (13 y in the south, 17 y in thenorth) as underground juveniles except for a brief 2- to 4-wkperiod when adults emerge simultaneously in massive num-bers. With few exceptions, at any given location, all of the pe-riodical cicadas share the same life cycle and emerge on the sameschedule, forming a single-year class referred to as a “brood.”Surprisingly, each brood consists of multiple species from threespecies groups (Decim, Cassini, Decula).These three groups were considered to have diverged from
each other allopatrically and to have later become sympatric andformed 13- and 17-y life cycles (2). The prolonged, prime-numbered life cycles were hypothesized to have evolved in re-sponse to Pleistocene climatic cooling (9, 11) to avoid the adverseeffect of low population density on mating success (9, 12, 13).Another view hypothesized that the long synchronized life cyclesevolved in association with the predator avoidance strategy(2, 4, 8) and that this took place before both the glacial periodsand the split of the three species groups (10) based on approx-imate genetic distances among species groups (8). To test thesehypotheses, phylogenetic information about the relationships ofspecies, broods, and populations is essential. However, phyloge-netic studies of Magicicada have been largely limited to the Decim
group (6, 14–18), and only rough divergence times among specieshave been inferred (8, 10). Thus, a comprehensive molecularphylogeny covering all of the extant broods, their phylogeography,and divergence time has been lacking until now.We conducted molecular phylogenetic and population genetic
analyses by using nuclear and mitochondrial DNA markers forsamples collected over a 30-y period (1978–2008). These samplesrepresent all 15 extant broods and all known species (Table S1).
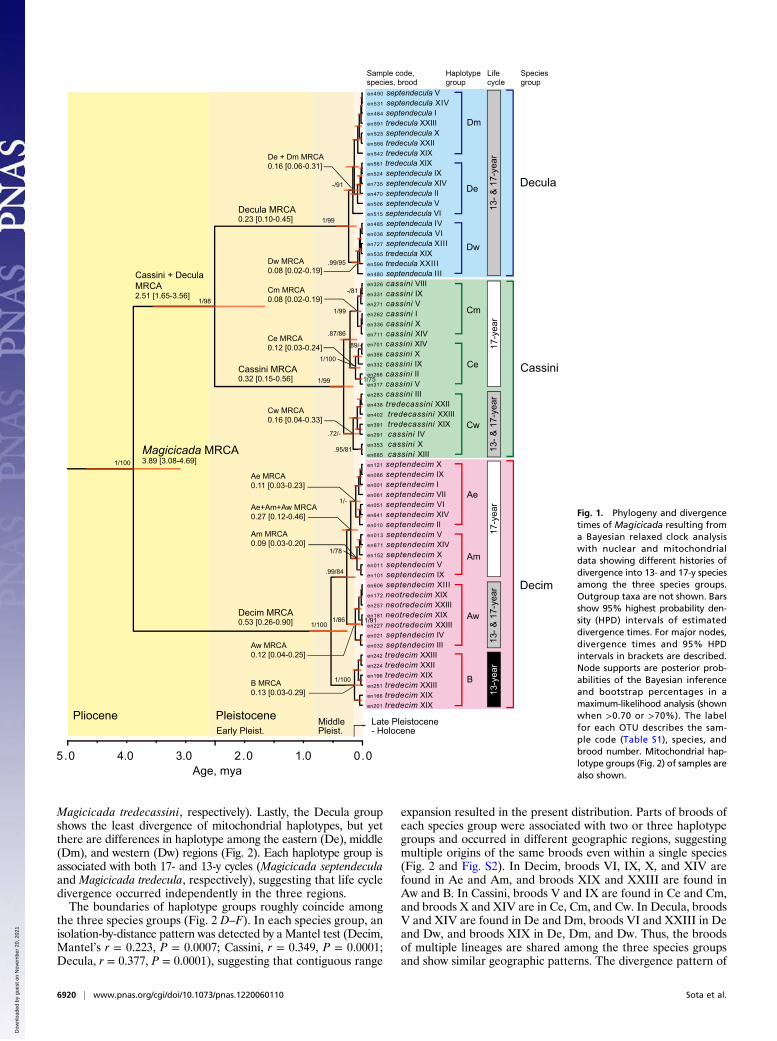
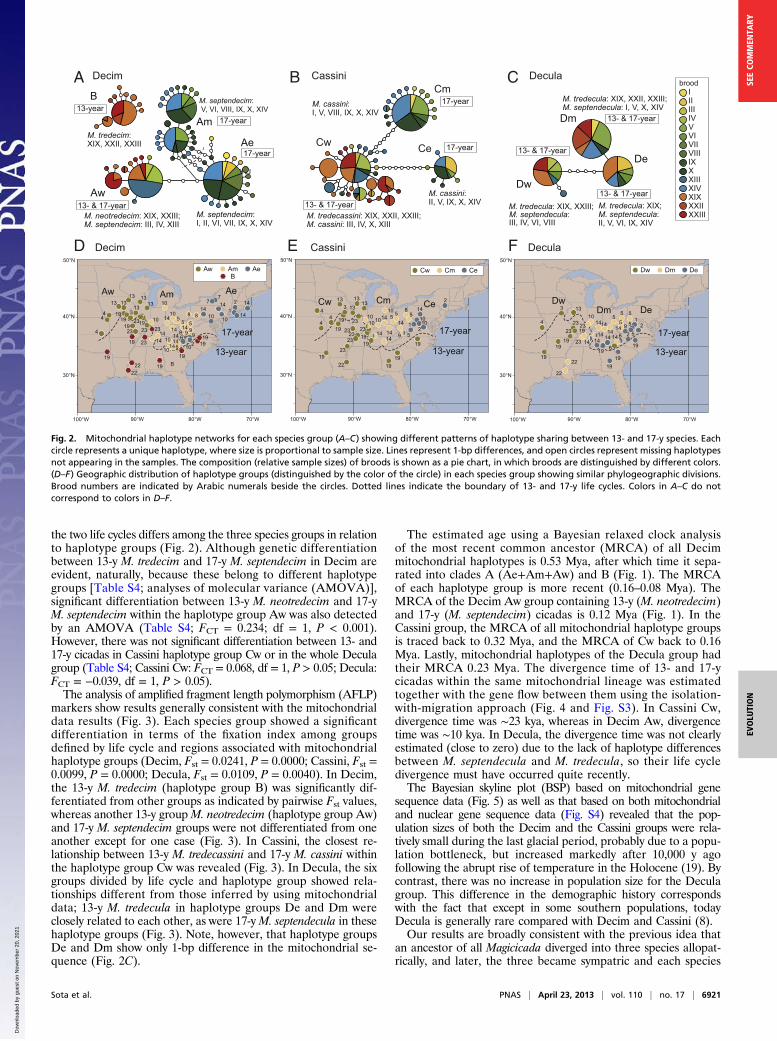
Results and DiscussionPhylogenetic analyses and divergence time estimation based onfour nuclear and three mitochondrial genes (Table S2) clearlyreveal the monophyly of each of the three species groups(Decim, Cassini, and Decula) and the sister relationship be-tween Cassini and Decula (Fig. 1). A Bayesian relaxed clockanalysis shows that the three species groups diverged 3.9 Mya.Initially the Decim group diverged from the ancestor of Cassini +Decula, then Cassini and Decula separated 2.5 Mya (Fig. 1).The mitochondrial gene genealogy further shows divergenceassociated with regions, and partly with life cycles (Fig. 2, Figs.S1 and S2, and Table S3). We distinguished four mitochondrialhaplotype groups in Decim and three each in Cassini and Decula(Fig. 2 A–C). The geographic distributions of mitochondrialhaplotype groups within each species group show similar divi-sions among eastern, middle, and western regions (Fig. 2 D–F).In Decim, there is also a major divergence between northern andsouthern groups corresponding to formally distinguished mito-chondrial lineages A and B, respectively (15). Group A is di-vided into three groups, Ae, Am, and Aw, which occur in theeastern, middle, and western parts of the United States east ofthe Great Plains, respectively. Populations of Ae and Am exhibita 17-y cycle (Magicicada septendecim); those of Aw both 17-y(M. septendecim) and 13-y (Magicicada neotredecim) cycles; andthose of B show only a 13-y cycle (Magicicada tredecim). At theboundary of Ae and Am, a few populations possess both Ae andAm haplotypes. The Cassini group consists of three haplotypegroups, Ce, Cm, and Cw, again occurring in the eastern, middle,and western regions, respectively (Fig. 2). Populations with Ceand Cm show 17-y cycles only (Magicicada cassini), whereasthose of Cw show both 17- and 13-y cycles (M. cassini and
Author contributions: T.S. and J.Y. designed research; T.S., S.Y., J.R.C., K.B.R.H., C.S., and J.Y.performed research; T.S. and S.Y. analyzed data; and T.S., J.R.C., and C.S. wrote the paper.
The authors declare no conflict of interest.
This article is a PNAS Direct Submission.
Freely available online through the PNAS open access option.
Data deposition: The sequences reported in this paper have been deposited in the DNAData Bank of Japan (accession nos. AB740543–AB740917).
See Commentary on page 6620.1To whom correspondence should be addressed. E-mail: [email protected].
This article contains supporting information online at www.pnas.org/lookup/suppl/doi:10.1073/pnas.1220060110/-/DCSupplemental.
www.pnas.org/cgi/doi/10.1073/pnas.1220060110 PNAS | April 23, 2013 | vol. 110 | no. 17 | 6919–6924
EVOLU
TION
SEECO
MMEN
TARY
Dow
nloa
ded
by g
uest
on
Nov
embe
r 20
, 202
1
Magicicada tredecassini, respectively). Lastly, the Decula groupshows the least divergence of mitochondrial haplotypes, but yetthere are differences in haplotype among the eastern (De), middle(Dm), and western (Dw) regions (Fig. 2). Each haplotype group isassociated with both 17- and 13-y cycles (Magicicada septendeculaand Magicicada tredecula, respectively), suggesting that life cycledivergence occurred independently in the three regions.The boundaries of haplotype groups roughly coincide among
the three species groups (Fig. 2 D–F). In each species group, anisolation-by-distance pattern was detected by a Mantel test (Decim,Mantel’s r = 0.223, P = 0.0007; Cassini, r = 0.349, P = 0.0001;Decula, r = 0.377, P = 0.0001), suggesting that contiguous range
expansion resulted in the present distribution. Parts of broods ofeach species group were associated with two or three haplotypegroups and occurred in different geographic regions, suggestingmultiple origins of the same broods even within a single species(Fig. 2 and Fig. S2). In Decim, broods VI, IX, X, and XIV arefound in Ae and Am, and broods XIX and XXIII are found inAw and B. In Cassini, broods V and IX are found in Ce and Cm,and broods X and XIV are in Ce, Cm, and Cw. In Decula, broodsV and XIV are found in De and Dm, broods VI and XXIII in Deand Dw, and broods XIX in De, Dm, and Dw. Thus, the broodsof multiple lineages are shared among the three species groupsand show similar geographic patterns. The divergence pattern of
0.02.05.0
en711 cassini XIV
en525 septendecula X
en172 neotredecim XIX
en061 septendecim VIIen001 septendecim I
en291 cassini IV
en531 septendecula XIV
en735 septendecula XIV
en701 cassini XIV
en402 tredecassini XXIII
en266 cassini II
en641 septendecim XIV
en506 septendecula V
en021 septendecim IV
en490 septendecula V
en262 cassini I
en561 tredecula XIX
en051 septendecim VI
en011 septendecim V
en317 cassini V
en606 septendecim XIII
en566 tredecula XXII
en535 tredecula XIX
en224 tredecim XXII
en464 septendecula I
en196 tredecim XIX
en480 septendecula III
en671 septendecim XIVen152 septendecim X
en251 tredecim XXIII
en032 septendecim III
en013 septendecim V
en121 septendecim X
en727 septendecula XIII
en353 cassini Xen685 cassini XIII
en227 neotredecim XXIII
en485 septendecula IV
en101 septendecim IX
en271 cassini V
en283 cassini III
en332 cassini IX
en257 neotredecim XXIII
en470 septendecula II
en331 cassini IX
en181 neotredecim XIX
en524 septendecula IX
en010 septendecim II
en438 tredecassini XXII
en591 tredecula XXIII
en391 tredecassini XIX
en515 septendecula VI
en086 septendecim IX
en326 cassini VIII
en242 tredecim XXIII
en036 septendecula VI
en336 cassini X
en356 cassini X
en542 tredecula XIX
en166 tredecim XIXen201 tredecim XIX
en596 tredecula XXIII
Magicicada MRCA3.89 [3.08-4.69]
Cassini + DeculaMRCA2.51 [1.65-3.56]
MiddlePleist.
Late Pleistocene- Holocene Early Pleist.
Pliocene Pleistocene
17-y
ear
17-y
ear
13- &
17-
year
13-y
ear
13- &
17-
year
13- &
17-
year
1/100
1/98
1/99
1/99
.99/95
1/100
1/1001/86
.99/84
1/78
1/-
.72/-
1/100
.87/86
1/99
Decim MRCA0.53 [0.26-0.90]
4.0 3.0 1.0
Cassini MRCA0.32 [0.15-0.56]
Decula MRCA0.23 [0.10-0.45]
Decula
Cassini
Decim
Age, mya
-/91
-/81
.95/81
1/75
1/91
.89/-
Dm
De
Dw
Cm
Ce
Cw
Ae
Am
Aw
B
Haplotypegroup
Lifecycle
Speciesgroup
Sample code,species, brood
De + Dm MRCA0.16 [0.06-0.31]
Dw MRCA0.08 [0.02-0.19]
B MRCA0.13 [0.03-0.29]
Aw MRCA0.12 [0.04-0.25]
Ae MRCA0.11 [0.03-0.23]
Am MRCA0.09 [0.03-0.20]
Ae+Am+Aw MRCA0.27 [0.12-0.46]
Ce MRCA0.12 [0.03-0.24]
Cm MRCA0.08 [0.02-0.19]
Cw MRCA0.16 [0.04-0.33]
Fig. 1. Phylogeny and divergencetimes of Magicicada resulting froma Bayesian relaxed clock analysiswith nuclear and mitochondrialdata showing different histories ofdivergence into 13- and 17-y speciesamong the three species groups.Outgroup taxa are not shown. Barsshow 95% highest probability den-sity (HPD) intervals of estimateddivergence times. For major nodes,divergence times and 95% HPDintervals in brackets are described.Node supports are posterior prob-abilities of the Bayesian inferenceand bootstrap percentages in amaximum-likelihood analysis (shownwhen >0.70 or >70%). The labelfor each OTU describes the sam-ple code (Table S1), species, andbrood number. Mitochondrial hap-lotype groups (Fig. 2) of samples arealso shown.
6920 | www.pnas.org/cgi/doi/10.1073/pnas.1220060110 Sota et al.
Dow
nloa
ded
by g
uest
on
Nov
embe
r 20
, 202
1
the two life cycles differs among the three species groups in relationto haplotype groups (Fig. 2). Although genetic differentiationbetween 13-y M. tredecim and 17-y M. septendecim in Decim areevident, naturally, because these belong to different haplotypegroups [Table S4; analyses of molecular variance (AMOVA)],significant differentiation between 13-y M. neotredecim and 17-yM. septendecim within the haplotype group Aw was also detectedby an AMOVA (Table S4; FCT = 0.234; df = 1, P < 0.001).However, there was not significant differentiation between 13- and17-y cicadas in Cassini haplotype group Cw or in the whole Deculagroup (Table S4; Cassini Cw: FCT = 0.068, df = 1, P > 0.05; Decula:FCT = −0.039, df = 1, P > 0.05).The analysis of amplified fragment length polymorphism (AFLP)
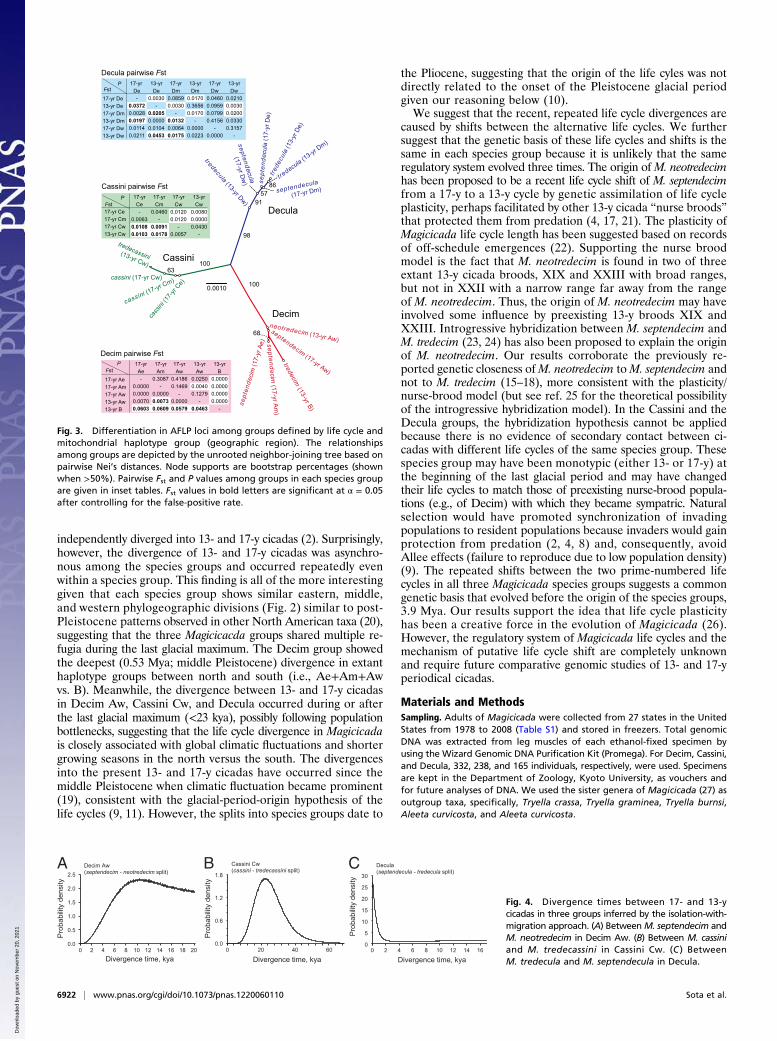
markers show results generally consistent with the mitochondrialdata results (Fig. 3). Each species group showed a significantdifferentiation in terms of the fixation index among groupsdefined by life cycle and regions associated with mitochondrialhaplotype groups (Decim, Fst = 0.0241, P = 0.0000; Cassini, Fst =0.0099, P = 0.0000; Decula, Fst = 0.0109, P = 0.0040). In Decim,the 13-y M. tredecim (haplotype group B) was significantly dif-ferentiated from other groups as indicated by pairwise Fst values,whereas another 13-y groupM. neotredecim (haplotype group Aw)and 17-y M. septendecim groups were not differentiated from oneanother except for one case (Fig. 3). In Cassini, the closest re-lationship between 13-y M. tredecassini and 17-y M. cassini withinthe haplotype group Cw was revealed (Fig. 3). In Decula, the sixgroups divided by life cycle and haplotype group showed rela-tionships different from those inferred by using mitochondrialdata; 13-y M. tredecula in haplotype groups De and Dm wereclosely related to each other, as were 17-yM. septendecula in thesehaplotype groups (Fig. 3). Note, however, that haplotype groupsDe and Dm show only 1-bp difference in the mitochondrial se-quence (Fig. 2C).
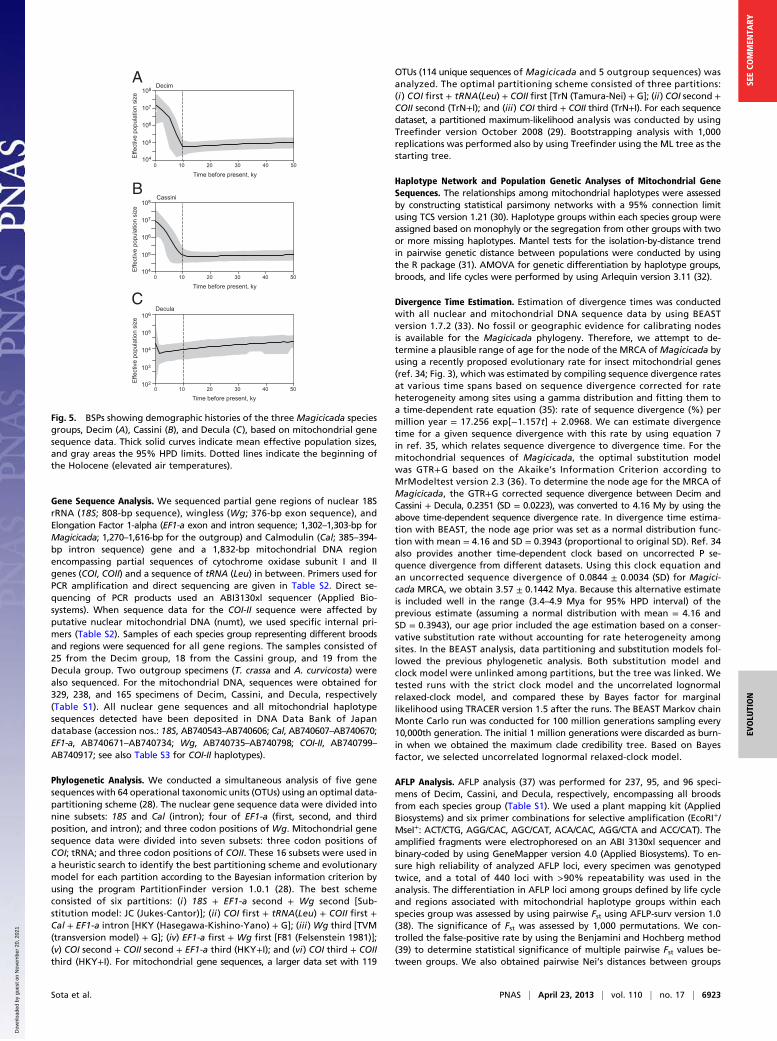
The estimated age using a Bayesian relaxed clock analysisof the most recent common ancestor (MRCA) of all Decimmitochondrial haplotypes is 0.53 Mya, after which time it sepa-rated into clades A (Ae+Am+Aw) and B (Fig. 1). The MRCAof each haplotype group is more recent (0.16–0.08 Mya). TheMRCA of the Decim Aw group containing 13-y (M. neotredecim)and 17-y (M. septendecim) cicadas is 0.12 Mya (Fig. 1). In theCassini group, the MRCA of all mitochondrial haplotype groupsis traced back to 0.32 Mya, and the MRCA of Cw back to 0.16Mya. Lastly, mitochondrial haplotypes of the Decula group hadtheir MRCA 0.23 Mya. The divergence time of 13- and 17-ycicadas within the same mitochondrial lineage was estimatedtogether with the gene flow between them using the isolation-with-migration approach (Fig. 4 and Fig. S3). In Cassini Cw,divergence time was ∼23 kya, whereas in Decim Aw, divergencetime was ∼10 kya. In Decula, the divergence time was not clearlyestimated (close to zero) due to the lack of haplotype differencesbetween M. septendecula and M. tredecula, so their life cycledivergence must have occurred quite recently.The Bayesian skyline plot (BSP) based on mitochondrial gene
sequence data (Fig. 5) as well as that based on both mitochondrialand nuclear gene sequence data (Fig. S4) revealed that the pop-ulation sizes of both the Decim and the Cassini groups were rela-tively small during the last glacial period, probably due to a popu-lation bottleneck, but increased markedly after 10,000 y agofollowing the abrupt rise of temperature in the Holocene (19). Bycontrast, there was no increase in population size for the Deculagroup. This difference in the demographic history correspondswith the fact that except in some southern populations, todayDecula is generally rare compared with Decim and Cassini (8).Our results are broadly consistent with the previous idea that
an ancestor of all Magicicada diverged into three species allopat-rically, and later, the three became sympatric and each species
,
80°W 70°W90°W100°W
50°N
40°N
30°N
,
80°W 70°W90°W100°W
50°N
40°N
30°N
,
80°W 70°W90°W100°W
50°N
40°N
30°N
,
192222
19
19 23
2 14
1414
14
10 10
77
95
14510
10
10514
1414
10 149
88
4
44
13
1923
%,
1919
19
22
23
4
4
13 13
13
23
23
10
10
14
14
14
145 5 5
5
8
2
2
14
10101
19
4
13
1919
23
19
22
22
19
23
141414
55 5
514
19
21
59
14 61414 6 9
B
CeCw CmDe
Dw
14
E CassiniD Decim F Decula
13-year
17-year
13-year
17-year
13-year
17-year
Aw Am AeB
Cw Cm Ce Dw Dm De
19
1923 14
19
19
523
14619
14
23
103
2
1919
1023
1023
3
1941919 3
231923 23
14
1014
9
210
9 1919
AeAw Am13 13
13 1313
6
113
Dm
EN138_10NJ
B
Aw
Ae
AmM. tredecim: XIX, XXII, XXIII
M. neotredecim: XIX, XXIII; M. septendecim: III, IV, XIII
M. septendecim:I, II, VI, VII, IX, X, XIV
M. septendecim: V, VI, VIII, IX, X, XIV
17-year
17-year
13-year
13- & 17-year
CeCw
Cm
M. tredecassini: XIX, XXII, XXIII; M. cassini: III, IV, X, XIII
M. cassini:I, V, VIII, IX, X, XIV
M. cassini:II, V, IX, X, XIV
17-year
13- & 17-year
17-year
IIIIIIIVVVIVIIVIIIIXX XIIIXIVXIXXXIIXXIII
Dw
Dm
De
M. tredecula: XIX, XXII, XXIII;M. septendecula: I, V, X, XIV
M. tredecula: XIX;M. septendecula: II, V, VI, IX, XIV
M. tredecula: XIX, XXIII;M. septendecula:III, IV, VI, VIII
broodA Decim B Cassini C Decula
13- & 17-year
13- & 17-year
13- & 17-year
Fig. 2. Mitochondrial haplotype networks for each species group (A–C) showing different patterns of haplotype sharing between 13- and 17-y species. Eachcircle represents a unique haplotype, where size is proportional to sample size. Lines represent 1-bp differences, and open circles represent missing haplotypesnot appearing in the samples. The composition (relative sample sizes) of broods is shown as a pie chart, in which broods are distinguished by different colors.(D–F) Geographic distribution of haplotype groups (distinguished by the color of the circle) in each species group showing similar phylogeographic divisions.Brood numbers are indicated by Arabic numerals beside the circles. Dotted lines indicate the boundary of 13- and 17-y life cycles. Colors in A–C do notcorrespond to colors in D–F.
Sota et al. PNAS | April 23, 2013 | vol. 110 | no. 17 | 6921
EVOLU
TION
SEECO
MMEN
TARY
Dow
nloa
ded
by g
uest
on
Nov
embe
r 20
, 202
1
independently diverged into 13- and 17-y cicadas (2). Surprisingly,however, the divergence of 13- and 17-y cicadas was asynchro-nous among the species groups and occurred repeatedly evenwithin a species group. This finding is all of the more interestinggiven that each species group shows similar eastern, middle,and western phylogeographic divisions (Fig. 2) similar to post-Pleistocene patterns observed in other North American taxa (20),suggesting that the three Magicicacda groups shared multiple re-fugia during the last glacial maximum. The Decim group showedthe deepest (0.53 Mya; middle Pleistocene) divergence in extanthaplotype groups between north and south (i.e., Ae+Am+Awvs. B). Meanwhile, the divergence between 13- and 17-y cicadasin Decim Aw, Cassini Cw, and Decula occurred during or afterthe last glacial maximum (<23 kya), possibly following populationbottlenecks, suggesting that the life cycle divergence in Magicicadais closely associated with global climatic fluctuations and shortergrowing seasons in the north versus the south. The divergencesinto the present 13- and 17-y cicadas have occurred since themiddle Pleistocene when climatic fluctuation became prominent(19), consistent with the glacial-period-origin hypothesis of thelife cycles (9, 11). However, the splits into species groups date to
the Pliocene, suggesting that the origin of the life cyles was notdirectly related to the onset of the Pleistocene glacial periodgiven our reasoning below (10).We suggest that the recent, repeated life cycle divergences are
caused by shifts between the alternative life cycles. We furthersuggest that the genetic basis of these life cycles and shifts is thesame in each species group because it is unlikely that the sameregulatory system evolved three times. The origin ofM. neotredecimhas been proposed to be a recent life cycle shift of M. septendecimfrom a 17-y to a 13-y cycle by genetic assimilation of life cycleplasticity, perhaps facilitated by other 13-y cicada “nurse broods”that protected them from predation (4, 17, 21). The plasticity ofMagicicada life cycle length has been suggested based on recordsof off-schedule emergences (22). Supporting the nurse broodmodel is the fact that M. neotredecim is found in two of threeextant 13-y cicada broods, XIX and XXIII with broad ranges,but not in XXII with a narrow range far away from the rangeof M. neotredecim. Thus, the origin of M. neotredecim may haveinvolved some influence by preexisting 13-y broods XIX andXXIII. Introgressive hybridization between M. septendecim andM. tredecim (23, 24) has also been proposed to explain the originof M. neotredecim. Our results corroborate the previously re-ported genetic closeness ofM. neotredecim toM. septendecim andnot to M. tredecim (15–18), more consistent with the plasticity/nurse-brood model (but see ref. 25 for the theoretical possibilityof the introgressive hybridization model). In the Cassini and theDecula groups, the hybridization hypothesis cannot be appliedbecause there is no evidence of secondary contact between ci-cadas with different life cycles of the same species group. Thesespecies group may have been monotypic (either 13- or 17-y) atthe beginning of the last glacial period and may have changedtheir life cycles to match those of preexisting nurse-brood popula-tions (e.g., of Decim) with which they became sympatric. Naturalselection would have promoted synchronization of invadingpopulations to resident populations because invaders would gainprotection from predation (2, 4, 8) and, consequently, avoidAllee effects (failure to reproduce due to low population density)(9). The repeated shifts between the two prime-numbered lifecycles in all three Magicicada species groups suggests a commongenetic basis that evolved before the origin of the species groups,3.9 Mya. Our results support the idea that life cycle plasticityhas been a creative force in the evolution of Magicicada (26).However, the regulatory system of Magicicada life cycles and themechanism of putative life cycle shift are completely unknownand require future comparative genomic studies of 13- and 17-yperiodical cicadas.
Materials and MethodsSampling. Adults of Magicicada were collected from 27 states in the UnitedStates from 1978 to 2008 (Table S1) and stored in freezers. Total genomicDNA was extracted from leg muscles of each ethanol-fixed specimen byusing the Wizard Genomic DNA Purification Kit (Promega). For Decim, Cassini,and Decula, 332, 238, and 165 individuals, respectively, were used. Specimensare kept in the Department of Zoology, Kyoto University, as vouchers andfor future analyses of DNA. We used the sister genera of Magicicada (27) asoutgroup taxa, specifically, Tryella crassa, Tryella graminea, Tryella burnsi,Aleeta curvicosta, and Aleeta curvicosta.
neotredecim (13-yr Aw)
sept
ende
cim
(17-
yr A
e)
cassini (17-yr Cw)
septendecim (17-yr Aw)
tredecula (13-yr Dw)
cass
ini (1
7-yr C
e)
septendecula
(17-yr Dw
)
trede
cula
(13-
yr D
e)
sept
ende
cula
(17-
yr D
e)
tredecassini (13-yr Cw)
tredecula (1
3-yr Dm)
cassini (17-yr Cm)
tredecim (13-yr B)
septendecim (17-yr Am
)
septendecula
(17-yr Dm)
100
100
98
68
63
86
9157
Decim
Cassini
Decula
17-yr Ae17-yr Am17-yr Aw13-yr Aw13-yr B
17-yr De-
0.03720.00280.01970.01140.0211
13-yrDe
0.0030-
0.02050.00000.01040.0453
17-yrDm
0.08590.0030
-0.01320.00640.0175
13-yrDm
0.01700.36560.0170
-0.00000.0223
17-yrDw
0.04600.09590.07990.4156
-0.0000
13-yrDw
0.02100.00300.02000.03300.3157
-
17-yr De13-yr De17-yr Dm13-yr Dm17-yr Dw13-yr Dw
FstP
17-yr Ce17-yr Cm17-yr Cw13-yr Cw
17-yrCe-
0.00630.01080.0103
17-yrCm
0.0460-
0.00910.0178
17-yrCw
0.01200.0120
-0.0057
13-yrCw
0.00800.00000.0430
-
FstP
FstP
0.0010
Decim pairwise Fst
Cassini pairwise Fst
Decula pairwise Fst
17-yrAe-
0.00000.00000.00700.0603
17-yrAm
0.3087-
0.00000.00730.0609
17-yrAw
0.41860.1469
-0.00000.0579
13-yrAw
0.02500.00400.1279
-0.0463
13-yrB
0.00000.00000.00000.0000
-
Fig. 3. Differentiation in AFLP loci among groups defined by life cycle andmitochondrial haplotype group (geographic region). The relationshipsamong groups are depicted by the unrooted neighbor-joining tree based onpairwise Nei’s distances. Node supports are bootstrap percentages (shownwhen >50%). Pairwise Fst and P values among groups in each species groupare given in inset tables. Fst values in bold letters are significant at α = 0.05after controlling for the false-positive rate.
2.5
2.0
1.5
1.0
0.5
0.0
Decim Aw (septendecim - neotredecim split) 1.8
0.6
0.0
1.2
Cassini Cw(cassini - tredecassini split)
30
25
20
15
10
5
0
Decula(septendecula - tredecula split)
0 20 40 600 10 20 0 102 4 6 8 12 14 16182 4 6 8 12 14 16Divergence time, kya
A B C
Pro
babi
lity
dens
ity
Divergence time, kya Divergence time, kya
Pro
babi
lity
dens
ity
Pro
babi
lity
dens
ity
Fig. 4. Divergence times between 17- and 13-ycicadas in three groups inferred by the isolation-with-migration approach. (A) BetweenM. septendecim andM. neotredecim in Decim Aw. (B) Between M. cassiniand M. tredecassini in Cassini Cw. (C ) BetweenM. tredecula and M. septendecula in Decula.
6922 | www.pnas.org/cgi/doi/10.1073/pnas.1220060110 Sota et al.
Dow
nloa
ded
by g
uest
on
Nov
embe
r 20
, 202
1
Gene Sequence Analysis. We sequenced partial gene regions of nuclear 18SrRNA (18S; 808-bp sequence), wingless (Wg; 376-bp exon sequence), andElongation Factor 1-alpha (EF1-a exon and intron sequence; 1,302–1,303-bp forMagicicada; 1,270–1,616-bp for the outgroup) and Calmodulin (Cal; 385–394-bp intron sequence) gene and a 1,832-bp mitochondrial DNA regionencompassing partial sequences of cytochrome oxidase subunit I and IIgenes (COI, COII) and a sequence of tRNA (Leu) in between. Primers used forPCR amplification and direct sequencing are given in Table S2. Direct se-quencing of PCR products used an ABI3130xl sequencer (Applied Bio-systems). When sequence data for the COI-II sequence were affected byputative nuclear mitochondrial DNA (numt), we used specific internal pri-mers (Table S2). Samples of each species group representing different broodsand regions were sequenced for all gene regions. The samples consisted of25 from the Decim group, 18 from the Cassini group, and 19 from theDecula group. Two outgroup specimens (T. crassa and A. curvicosta) werealso sequenced. For the mitochondrial DNA, sequences were obtained for329, 238, and 165 specimens of Decim, Cassini, and Decula, respectively(Table S1). All nuclear gene sequences and all mitochondrial haplotypesequences detected have been deposited in DNA Data Bank of Japandatabase (accession nos.: 18S, AB740543–AB740606; Cal, AB740607–AB740670;EF1-a, AB740671–AB740734; Wg, AB740735–AB740798; COI-II, AB740799–AB740917; see also Table S3 for COI-II haplotypes).
Phylogenetic Analysis. We conducted a simultaneous analysis of five genesequences with 64 operational taxonomic units (OTUs) using an optimal data-partitioning scheme (28). The nuclear gene sequence data were divided intonine subsets: 18S and Cal (intron); four of EF1-a (first, second, and thirdposition, and intron); and three codon positions of Wg. Mitochondrial genesequence data were divided into seven subsets: three codon positions ofCOI; tRNA; and three codon positions of COII. These 16 subsets were used ina heuristic search to identify the best partitioning scheme and evolutionarymodel for each partition according to the Bayesian information criterion byusing the program PartitionFinder version 1.0.1 (28). The best schemeconsisted of six partitions: (i ) 18S + EF1-a second + Wg second [Sub-stitution model: JC (Jukes-Cantor)]; (ii ) COI first + tRNA(Leu) + COII first +Cal + EF1-a intron [HKY (Hasegawa-Kishino-Yano) + G]; (iii) Wg third [TVM(transversion model) + G]; (iv) EF1-a first + Wg first [F81 (Felsenstein 1981)];(v) COI second + COII second + EF1-a third (HKY+I); and (vi) COI third + COIIthird (HKY+I). For mitochondrial gene sequences, a larger data set with 119
OTUs (114 unique sequences of Magicicada and 5 outgroup sequences) wasanalyzed. The optimal partitioning scheme consisted of three partitions:(i ) COI first + tRNA(Leu) + COII first [TrN (Tamura-Nei) + G]; (ii) COI second +COII second (TrN+I); and (iii) COI third + COII third (TrN+I). For each sequencedataset, a partitioned maximum-likelihood analysis was conducted by usingTreefinder version October 2008 (29). Bootstrapping analysis with 1,000replications was performed also by using Treefinder using the ML tree as thestarting tree.
Haplotype Network and Population Genetic Analyses of Mitochondrial GeneSequences. The relationships among mitochondrial haplotypes were assessedby constructing statistical parsimony networks with a 95% connection limitusing TCS version 1.21 (30). Haplotype groups within each species group wereassigned based on monophyly or the segregation from other groups with twoor more missing haplotypes. Mantel tests for the isolation-by-distance trendin pairwise genetic distance between populations were conducted by usingthe R package (31). AMOVA for genetic differentiation by haplotype groups,broods, and life cycles were performed by using Arlequin version 3.11 (32).
Divergence Time Estimation. Estimation of divergence times was conductedwith all nuclear and mitochondrial DNA sequence data by using BEASTversion 1.7.2 (33). No fossil or geographic evidence for calibrating nodesis available for the Magicicada phylogeny. Therefore, we attempt to de-termine a plausible range of age for the node of the MRCA ofMagicicada byusing a recently proposed evolutionary rate for insect mitochondrial genes(ref. 34; Fig. 3), which was estimated by compiling sequence divergence ratesat various time spans based on sequence divergence corrected for rateheterogeneity among sites using a gamma distribution and fitting them toa time-dependent rate equation (35): rate of sequence divergence (%) permillion year = 17.256 exp[−1.157t] + 2.0968. We can estimate divergencetime for a given sequence divergence with this rate by using equation 7in ref. 35, which relates sequence divergence to divergence time. For themitochondrial sequences of Magicicada, the optimal substitution modelwas GTR+G based on the Akaike’s Information Criterion according toMrModeltest version 2.3 (36). To determine the node age for the MRCA ofMagicicada, the GTR+G corrected sequence divergence between Decim andCassini + Decula, 0.2351 (SD = 0.0223), was converted to 4.16 My by using theabove time-dependent sequence divergence rate. In divergence time estima-tion with BEAST, the node age prior was set as a normal distribution func-tion with mean = 4.16 and SD = 0.3943 (proportional to original SD). Ref. 34also provides another time-dependent clock based on uncorrected P se-quence divergence from different datasets. Using this clock equation andan uncorrected sequence divergence of 0.0844 ± 0.0034 (SD) for Magici-cada MRCA, we obtain 3.57 ± 0.1442 Mya. Because this alternative estimateis included well in the range (3.4–4.9 Mya for 95% HPD interval) of theprevious estimate (assuming a normal distribution with mean = 4.16 andSD = 0.3943), our age prior included the age estimation based on a conser-vative substitution rate without accounting for rate heterogeneity amongsites. In the BEAST analysis, data partitioning and substitution models fol-lowed the previous phylogenetic analysis. Both substitution model andclock model were unlinked among partitions, but the tree was linked. Wetested runs with the strict clock model and the uncorrelated lognormalrelaxed-clock model, and compared these by Bayes factor for marginallikelihood using TRACER version 1.5 after the runs. The BEAST Markov chainMonte Carlo run was conducted for 100 million generations sampling every10,000th generation. The initial 1 million generations were discarded as burn-in when we obtained the maximum clade credibility tree. Based on Bayesfactor, we selected uncorrelated lognormal relaxed-clock model.
AFLP Analysis. AFLP analysis (37) was performed for 237, 95, and 96 speci-mens of Decim, Cassini, and Decula, respectively, encompassing all broodsfrom each species group (Table S1). We used a plant mapping kit (AppliedBiosystems) and six primer combinations for selective amplification (EcoRI+/MseI+: ACT/CTG, AGG/CAC, AGC/CAT, ACA/CAC, AGG/CTA and ACC/CAT). Theamplified fragments were electrophoresed on an ABI 3130xl sequencer andbinary-coded by using GeneMapper version 4.0 (Applied Biosystems). To en-sure high reliability of analyzed AFLP loci, every specimen was genotypedtwice, and a total of 440 loci with >90% repeatability was used in theanalysis. The differentiation in AFLP loci among groups defined by life cycleand regions associated with mitochondrial haplotype groups within eachspecies group was assessed by using pairwise Fst using AFLP-surv version 1.0(38). The significance of Fst was assessed by 1,000 permutations. We con-trolled the false-positive rate by using the Benjamini and Hochberg method(39) to determine statistical significance of multiple pairwise Fst values be-tween groups. We also obtained pairwise Nei’s distances between groups
104
105
106
107
108
0 5010 20 30 40
Effe
ctiv
e po
pula
tion
size
Time before present, ky
0 5010 20 30 40
Time before present, ky
Effe
ctiv
e po
pula
tion
size
Decim
Cassini
0 5010 20 30 40
Time before present, ky
102
103
104
105
106
Effe
ctiv
e po
pula
tion
size
Decula
A
B
C
104
105
106
107
108
Fig. 5. BSPs showing demographic histories of the three Magicicada speciesgroups, Decim (A), Cassini (B), and Decula (C), based on mitochondrial genesequence data. Thick solid curves indicate mean effective population sizes,and gray areas the 95% HPD limits. Dotted lines indicate the beginning ofthe Holocene (elevated air temperatures).
Sota et al. PNAS | April 23, 2013 | vol. 110 | no. 17 | 6923
EVOLU
TION
SEECO
MMEN
TARY
Dow
nloa
ded
by g
uest
on
Nov
embe
r 20
, 202
1
and 1,000 bootstrap distance matrices by using AFLP-surv. We constructedneighbor-joining trees and a bootstrap consensus tree by using PHYLIPversion 3.69 (40).
Divergence and Gene Flow Between 13- and 17-y Cicadas. We applied theisolation-with-migration approach (41) by using the IMa2 program (42) toexplore the divergence time between 13- and 17-y cicadas within the samemitochondrial lineage, i.e., those in Aw of Decim (M. septendecim andM. neotredecim), those in Cw of Cassini (M. cassini and M. tredecassini), andthose in the whole Decula (M. septendecula and M. tredecula). The wholemitochondrial sequence (1,832 bp) was treated as one locus. For each group,we attempted 7–12 runs to find the appropriate priors of t (time of pop-ulation splitting), q (effective population size), and m (migration rate), with104 or 105 burn-in generations and 104 to 106 post–burn-in generations. Themutation rate of the mitochondrial locus was set to 2.9 × 10⁻⁷ per locus peryear based on the substitution rate 0.016 per site/my estimated in a BEASTanalysis with the entire mitochondrial sequence data (see below).
Demographic History. To explore the demographic history of each speciesgroup, we applied the BSP analysis (43) with the mitochondrial COI-II se-quence data by using programs BEAST version 1.6.2 and TRACER version 1.5.Sequence datasets were prepared for Decim (n = 329), Cassini (n = 238),and Decula (n = 165). The whole mitochondrial sequence (1,832 bp) wastreated as one locus. For each dataset, the BEAST run was conducted for108 generations sampling every 5,000th generation. Substitution modelsselected by MrModeltest version 2.3 were HKY+I for Decim and Cassinidatasets, and HKY for Decula dataset. A strict clock model was used with aclock rate of 0.016, which was estimated in a BEAST analysis for the entiremitochondrial dataset also with a strict clock model and a MagicicadaMRCA node age prior of the normal distribution with mean 4.16 Mya and
SD = 0.3943 Mya (108 generations with sampling every 104-th generation;106 burn-in generations). After the BEAST skyline plot analysis, effectivepopulation size through time was reconstructed by using TRACER version1.5, discarding initial 107 generations as burn-in. We also conducted an ex-tended BSP analysis (44) by using BEAST version 1.7.2 using Cal, EF1-a, andWg for Decim; EF1-a and Wg for Cassini; and Cal and EF1-a for Decula, inaddition to COI-II data, excluding nuclear genes that showed no intraspeciesgroup sequence difference. The number of sequences for each species groupwas 25, 18, and 19 for Decim, Cassini, and Decula, respectively. Because se-quence difference in each nuclear gene was fairly small, nuclear gene treeswere linked, and in Cassini, substitution and clock models were linked be-tween the two nuclear genes. Substitution models selected by MrModeltestversion 2.3 were HKY+G for COI-II, HKY for Cal, and GTR+I for EF1-a andWg.A strict-clock model was used for each gene partition, and the clock rate of0.016 was applied to COI-II gene as in the previous BSP analysis. For eachspecies group, the BEAST run was conducted for 50 million generationssampling every 5,000th generation. Effective population size through timewas reconstructed by using TRACER version 1.5, discarding initial 5 milliongenerations as burn-in.
ACKNOWLEDGMENTS. We thank David Marshall for help with field workand comments on phylogenetic methods. Many other people helped collectMagicicada specimens over the 30-y period and have been acknowledgedin previous C.S. laboratory publications. This study was supported by JapanSociety for Promotion of Science Grants-in-Aid 22255004 and 22370010(to J.Y.), and 23128507 (to T.S.); Ministry of Education, Culture, Sports,Science, and Technology (the Global Center of Excellence program A06),Japan; and National Science Foundation Division of Environmental BiologyGrants 8411083, 8509164, 9196213, 9812779, 9807113, 9982039, 0720664,and 0955849 (to C.S.).
1. Marlatt CL (1907) The periodical cicada. USDA Bureau Entomol Bull 71:1–183.2. Alexander RD, Moore TE (1962) The evolutionary relationships of 17-year and 13-year
cicadas, and three new species (Homoptera, Cicadidae, Magicicada). Misc Pub MusZool Univ Michigan 121:1–59.
3. Lloyd M, Dybas HS (1966) The periodical cicada problem I. Population ecology.Evolution 20(2):133–149.
4. Lloyd M, Dybas HS (1966) The periodical cicada problem. II. Evolution. Evolution 20(4):466–505.
5. May RM (1979) Periodical cicadas. Nature 277:347–349.6. Simon C (1988) Evolution of 13- and 17-year periodical cicadas (Homoptera: Cicadidae:
Magicicada). Bull Entomol Soc Am 34:163–176.7. Heliövaara K, Väisänen R, Simon C (1994) Evolutionary ecology of periodical insects.
Trends Ecol Evol 9(12):475–480.8. Williams KS, Simon C (1995) The ecology, behavior, and evolution of periodical cicadas.
Annu Rev Entomol 40:269–295.9. Yoshimura J (1997) The evolutionary origins of periodical cicadas during ice ages.
Am Nat 149(1):112–124.10. Grant PR (2005) The priming of periodical cicada life cycles. Trends Ecol Evol 20(4):
169–174.11. Cox RT, Carton CE (1988) Pleoclimatic influences in the evolution of periodical cicadas
(Insecta: Homoptera: Cicadidae: Magicicada spp.). Am Midl Nat 120(1):183–193.12. Yoshimura J, Hayashi T, Tanaka Y, Tainaka K, Simon C (2009) Selection for prime-
number intervals in a numerical model of periodical cicada evolution. Evolution 63(1):288–294.
13. Tanaka Y, Yoshimura J, Simon C, Cooley JR, Tainaka K (2009) Allee effect in theselection for prime-numbered cycles in periodical cicadas. Proc Natl Acad Sci USA106(22):8975–8979.
14. Simon C (1979) Evolution of periodical cicadas: Phylogenetic inferences based onallozymic data. Syst Zool 28(1):22–39.
15. Martin AP, Simon C (1988) Anomalous distribution of mitochondrial and nuclear genemarkers in periodical cicadas. Nature 336:247–249.
16. Martin A, Simon C (1990) Differing levels of among-population divergence in themitochondrial DNA of periodical cicadas related to historical biogeography. Evolution44(4):1066–1080.
17. Simon C, et al. (2000) Genetic evidence for assortative mating between 13-yearcicadas and sympatric “17-year cicadas with 13-year life cycles” provides supportfor allochronic speciation. Evolution 54(4):1326–1336.
18. Cooley JR, Simon C, Marshall DC, Slon K, Ehrhardt C (2001) Allochronic speciation,secondary contact, and reproductive character displacement in periodical cicadas(Hemiptera: Magicicada spp.): Genetic, morphological, and behavioural evidence.Mol Ecol 10(3):661–671.
19. Petit JR, et al. (1999) Climate and atmospheric history of the past 420,000 years fromthe Vostok ice core, Antarctica. Nature 399:429–436.
20. Soltis DE, Morris AB, McLachlan JS, Manos PS, Soltis PS (2006) Comparative phylo-geography of unglaciated eastern North America. Mol Ecol 15(14):4261–4293.
21. Marshall DC, Cooley JR (2000) Reproductive character displacement and speciation inperiodical cicadas, with description of new species, 13-year Magicicada neotredecem.Evolution 54(4):1313–1325.
22. Marshall DC, Cooley JR, Hill BR (2011) Developmental plasticity of life-cycle lengthin thirteen-year periodical cicadas (Hemiptera: Cicadidae). Ann Entomol Soc Am104(3):443–450.
23. Cox RT, Carton CE (1991) Evidence for genetic dominance of the 13-year life cycle inperiodical cicadas (Homoptera: Cicadidae: Maigicicada spp.). Am Midl Nat 125(1):63–74.
24. Cox RT, Carlton CE (2003) A comment on gene introgression versus en masse cycleswitching in the evolution of 13-year and 17-year life cycles in periodical cicadas.Evolution 57(2):428–432, discussion 433–437.
25. Nariai Y, et al. (2011) Life cycle replacement by gene introduction under an alleeeffect in periodical cicadas. PLoS ONE 6(4):e18347.
26. West-Eberhard MJ (2003) Developmental Plasticity and Evolution (Oxford UnivPress, New York).
27. Moulds MS (2005) An appraisal of the higher classification of cicadas (Hemiptera:Cicadoidea) with special reference to the Australian fauna. Rec Aust Mus 57:375–446.
28. Lanfear R, Calcott B, Ho SYW, Guindon S (2012) Partitionfinder: Combined selectionof partitioning schemes and substitution models for phylogenetic analyses. Mol BiolEvol 29(6):1695–1701.
29. Jobb G, von Haeseler A, Strimmer K (2004) TREEFINDER: A powerful graphical analysisenvironment for molecular phylogenetics. BMC Evol Biol 4:18.
30. Clement M, Posada D, Crandall KA (2000) TCS: A computer program to estimate genegenealogies. Mol Ecol 9(10):1657–1659.
31. Casgrain P, Legendre P (2004) The R-package for multivariate and spatial analysisv. 4.0 5d-user’s manual (Univ de Montreal, Montreal).
32. Excoffier L, Laval LG, Schneider S (2005) ARLEQUIN v. 3.0: An integrated softwarepackage for population genetics data analysis. Evol Bioinform Online 1:47–50.
33. Drummond AJ, Rambaut A (2007) BEAST: Bayesian evolutionary analysis by samplingtrees. BMC Evol Biol 7:214.
34. Papadopoulou A, Anastasiou I, Vogler AP (2010) Revisiting the insect mitochondrialmolecular clock: The mid-Aegean trench calibration. Mol Biol Evol 27(7):1659–1672.
35. Ho SYW, Phillips MJ, Cooper A, Drummond AJ (2005) Time dependency of molecularrate estimates and systematic overestimation of recent divergence times. Mol BiolEvol 22(7):1561–1568.
36. Nylander JAA (2004) MrModeltest v2 (Uppsala Univ, Uppsala).37. Vos P, et al. (1995) AFLP: A new technique for DNA fingerprinting. Nucleic Acids Res
23(21):4407–4414.38. Vekemans X (2002) AFLP-SURV version 1.0 (Univ Libre de Bruxelles, Brussels).39. Benjamini Y, Hochberg Y (1995) Controlling the false discovery rate: A practical and
powerful approach to multiple testing. J Roy Stat Soc B (Methodol) 57:289–300.40. Felsenstein J (1989) PHYLIP - phylogeny inference package (Version 3.2). Cladistics
5(2):164–166.41. Nielsen R, Wakeley J (2001) Distinguishing migration from isolation: A Markov chain
Monte Carlo approach. Genetics 158(2):885–896.42. Hey J (2011) Documentation for IMa2 (Rutgers Uni, New Brunswick, NJ).43. Drummond AJ, Rambaut A, Shapiro B, Pybus OG (2005) Bayesian coalescent in-
ference of past population dynamics from molecular sequences. Mol Biol Evol22(5):1185–1192.
44. Heled J, Drummond AJ (2008) Bayesian inference of population size history frommultiple loci. BMC Evol Biol 8:289.
6924 | www.pnas.org/cgi/doi/10.1073/pnas.1220060110 Sota et al.
Dow
nloa
ded
by g
uest
on
Nov
embe
r 20
, 202
1