Impacts sur l'environnement du transport de marchandises ... · universitÉ du quÉbec À montreal....
97
UNIVERSITÉ DU QUÉBEC À MONTREAL IMPACTS SUR L'ENVIRONNEMENT DU TRANSPORT DE MARCHANDISES PAR CAMION: ANALYSE QUANTITATIVE DES ÉMISSIONS DE GAZ À EFFET DE SERRE DANS LA PROVINCE DU QUÉBEC MÉMOIRE PRÉSENTÉ COMME EXIGENCE PARTIELLE DE LA MAÎTRISE EN SCIENCE DE L'ENVIRONNEMENT PAR FERNANDO ANTONIO ORTEGA HURTADO FÉVRIER 2008
Transcript of Impacts sur l'environnement du transport de marchandises ... · universitÉ du quÉbec À montreal....
UNIVERSITÉ DU QUÉBEC À MONTREAL
IMPACTS SUR L'ENVIRONNEMENT DU TRANSPORT
DE MARCHANDISES PAR CAMION:
ANALYSE QUANTITATIVE DES ÉMISSIONS DE GAZ À EFFET DE
SERRE DANS LA PROVINCE DU QUÉBEC
MÉMOIRE
PRÉSENTÉ
COMME EXIGENCE PARTIELLE
DE LA MAÎTRISE EN SCIENCE DE L'ENVIRONNEMENT
PAR
FERNANDO ANTONIO ORTEGA HURTADO
FÉVRIER 2008
UNIVERSITÉ DU QUÉBEC À MONTREAL
ENVIRONMENTAL IMPACTS OF TRUCKING FREIGHT
TRANSPORTATION:
QUANTITATIVE ANALYSIS OF GREENHOUSE GAS EMISSIONS IN
THE PROVINCE OF QUEBEC
THESIS SUBMITTED IN PARTIAL FULFILLMENT
OF THE REQUIREMENTS
OF THE DEGREE OF
MASTER IN ENVIRONMENTAL SCIENCE
BY
FERNANDO ANTONIO ORTEGA HURTADO
FEBRUARY 2008
UNIVERSITÉ DU QUÉBEC À MONTRÉAL Service des bibliothèques
Avertissement
La diffusion de ce mémoire se fait dans le respect des droits de son auteur, qui a signé le formulaire Autorisation de reproduire et de diffuser un travail de recherche de cycles supérieurs (SDU-522 - Rév.01-2006). Cette autorisation stipule que «conformément à l'article 11 du Règlement no 8 des études de cycles supérieurs, [l'auteur] concède à l'Université du Québec à Montréal une licence non exclusive d'utilisation et de publication de la totalité ou d'une partie importante de [son] travail de recherche pour des fins pédagogiques et non commerciales. Plus précisément, [l'auteur] autorise l'Université du Québec à Montréal à reproduire, diffuser, prêter, distribuer ou vendre des copies de [son] travail de recherche à des fins non commerciales sur quelque support que ce soit, y compris l'Internet. Cette licence et cette autorisation n'entraînent pas une renonciation de [la] part [de l'auteur] à [ses] droits moraux ni à [ses] droits de propriété intellectuelle. Sauf entente contraire, [l'auteur] conserve la liberté de diffuser et de commercialiser ou non ce travail dont [il] possède un exemplaire.»

ACKNOWLEDGEMENTS
Sincere thanks go to my Director, Professor José Prades for giving me the
opportunity to work with him and for aH his excellent advice. l would also like to
thank my Co-director and Director of the Master program, Patrick Béron. l
appreciate very much their confidence, collaboration and guidance during my
studies.
l am very grateful to my mother and father in Colombia, who reminds me that the
joumey is not over, and my sister Lina for supporting me and being my source of
answers for all my questions. Finally l would like to thank my lovely and patient
wife, Maria Ines for her unconditional help throughout all my projects.
TABLE OF CONTENTS
Table of contents iv
List of figures viii
List of tables .ix
Résumé xi
Abstract xiii
CHAPTERI
INTRODUCTION 1
1.1 Problem statement 1
1.2 Context of the thesis 5
1.3 General objective 6
1.4 Research hypothesis 7
CHAPTER2
LI1'ERATURE REVIEW 9
2.1 The trucking freight activity 9
2.2 Trucking activity within the transport sector.. l0
2.3 Environmental and economic overview of trucking freight transportation 12
2.3.1 Economie importance 13
2.3.2 Environment summary 14
2.3.3 Sustainable development 15
2.4 Strategies to meet sustainable development objectives in trucking freight
transportation 19
2.4.1 Quebec's province perspective solutions 2ü
v
CHAPTER3
GREENHOUSE EMISSIONS FROM TRUCKING FREIGHT
TRANSPORTATION 23
3.1 The greenhouse phenomenon 24
3.2 The balance of greenhouse gases 25
3.3 Greenhouse ernissions and climate change 28
3.3.1 Environmental impacts 28
3.1.1.1 Climate change 28
3.1.1.2 Stratospheric ozone depletion 29
3.1.1.3 Oceans flows 29
3.1.1.4 Urban air pollution 30
3.1.1.5 Land degradation ~ 31
3.1.1.6 Land use and biodiversity 32
3.1.1.7 Agriculture and forestry 32
3.1.1.8 Water resources 32
3.3.2 Social economic impacts 33
3.3.2.1 Poverty 33
3.3.2.2 Health 33
3.3.2.3 Economie growth and development 34
3.3.2.4 Security 34
3.4 United Nations Framework Convention on Climate Change (UNFCCC) 35
3.5 Canadian measures to stop the actual emission trend 36
3.6 Canadian and Quebec emissions 37
3.7 Reduction of Greenhouse gas 38
CHAPTER4
METHODOLOGY 39
4.1 Characterization of the evaluation model 39
Vi
4.2 Evaluation of emissions from road vehic1es 40
4.2.1 Alternatives of evaluation 40
4.2.2 Choice of method of evaluation .41
4.2.3 Methodological framework 42
4.3 Definition of the scenario of evaluation and concepts 43
4.3.1 Description method of evaluation - Tier 2 or 'bottom-up' approach.. 43
4.3.2 Distance trips 45
4.3.3 Origin - Destination matrix and Geographical area of analysis .45
4.3.4 Road corridors 47
4.3.5 Transportation categories and Vehic1e population 49
4.3.6 Fuel and consumption ratios 50
4.3.7 Emission control and technology penetration rates description 51
4.3.S Global warming potential (GWP) 53
4.3.9 Emission factor (EF) 53
4.3.10 Time series 57
CHAPTER5
RESULTS AND DISCUSSIONS 5S
5.1 Results for the Scenario «Q-SO+» (year 1999) 5S
5.2 Quantification of emissions for the Scenario «Q-SO+» from 1999 to 2004 60
5.3 Graphie representation Scenario «Q-SO+» 62
5.4 Comparison and contribution Scenario «Q-SO+» against total Quebec's
province emissions for Heavy DutYDiesel Vehic1es 65
5.5 Comparison and contribution Scenario «Q-SO"'» against total Canada's
emissions for Heavy Duty Diesel Vehic1es 67
VIl
CHAPTER6
CONCLUSIONS AND SUGGESTIONS FOR FURTHER RESEARCH 71
References 75
Annexes 80
LIST OF FIGURES
Figure 3.1 Sectoral Breakdown of Canada's GHG 37
Figure 4.1 Geographical area of study and trips number produced by
administrative area 46
Figure 4.2 Truck (Tl) 49
Figure 4.3 Tractor with semi-trailer (T2) 50
Figure 4.4 Truck with trailer (T3) 50
LIST OF TABLES
Table 2.1 Transportation sector in Canada - Components and comparison (2001) 12
Table 3.1 Greenhouse gas emissions trends and forecast 1990 - 2020 24
Table 3.2 Atmospheric changes in concentration of GHG 27
Table 4.1 Administrative areas of evaluation and cities of reference 47
Table 4.2 Road corridors of study 48
Table 4.3 Trucks composition 49
Table 4.4 Fuel Consumption Ratios (FCR) 51
Table 4.5 Global warming potential.. 53
Table 4.6 Canadian Emission Factors for Energy Mobile Combustion Source 56
Table 4.7 Times series data 57
Table 5.1 Scenario « Q 80+ » Total GHG Emissions year 1999. Detailed result for each
sub category of truck analyzed 59
Table 5.2 Scenario« Q 80+ » Times series data 61
Table 5.3 Coefficient of determination (R2) 63
Table 5.4 Graphie representation Scenario « Q-80+ » 64
Table 5.5 Comparison Scenario «Q 80+ » and Total Québec emission for HDDV 65
Table 5.6 Contribution of emissions Scenario « Q 80+ » to Total Heavy DutY Diesel
Vehicles (HDDV) emission in Québec 66
Table 5.7 Contribution of emissions Scenario « Q 80+ » to Total Québec emission for
HDDV (Heavy DutYDiesel Vehicles) 67
Table 5.8 Comparison Scenario « Q 80+ » and Total Canada emission for HDDV 68
x
Table 5.9 Contribution of emissions Scenario « Q 80+ » to Total Heavy DutY Diesel
Vehicles (HDDV) emission in Canada 69
Table 5.10 Contribution of emissions Scenario « Q 80+ » to Total Canada emission for
HDDV (Heavy DutY Diesel Vehicles) 70
RÉSUMÉ
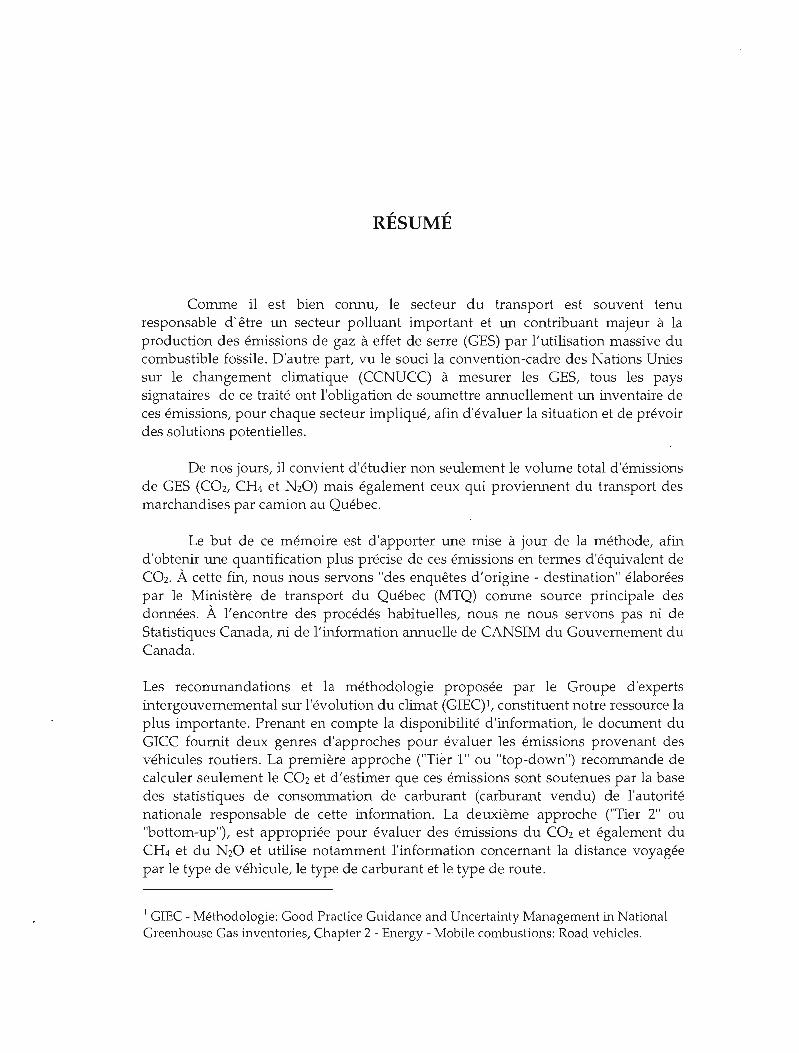
Comme il est bien connu, le secteur du transport est souvent tenu responsable d'être un secteur polluant important et un contribuant majeur à la production des émissions de gaz à effet de serre (GES) par l'utilisation massive du combustible fossile. D'autre part, vu le souci la convention-cadre des Nations Unies sur le changement climatique (CCNUCC) à mesurer les GES, tous les pays signataires de ce traité ont l'obligation de soumettre annuellement un inventaire de ces émissions, pour chaque secteur impliqué, afin d'évaluer la situation et de prévoir des solutions potentielles.
De nos jours, il convient d'étudier non seulement le volume total d'émissions de GES (C02, CH4 et N20) mais également ceux qui proviennent du transport des marchandises par camion au Québec.
Le but de ce mémoire est d'apporter une mise à jour de la méthode, afin d'obtenir une quantification plus précise de ces émissions en termes d'équivalent de CO2. À cette fin, nous nous servons "des enquêtes d'origine - destination" élaborées par le Ministère de transport du Québec (MTQ) comme source principale des données. À l'encontre des procédés habituelles, nous ne nous servons pas ni de Statistiques Canada, ni de l'information annuelle de CAN5IM du Gouvernement du Canada.
Les recommandations et la méthodologie proposée par le Groupe d'experts intergouvernemental sur l'évolution du climat (GIEC)l, constituent notre ressource la plus importante. Prenant en compte la disponibilité d'information, le document du GICC fournit deux genres d'approches pour évaluer les émissions provenant des véhicules routiers. La première approche eTier 1" ou "top-down") recommande de calculer seulement le C02 et d'estimer que ces émissions sont soutenues par la base des statistiques de consommation de carburant (carburant vendu) de l'autorité nationale responsable de cette information. La deuxième approche eTier 2" ou "bottom-up"), est appropriée pour évaluer des émissions du CO2 et également du CH4 et du N20 et utilise notamment l'information concernant la distance voyagée par le type de véhicule, le type de carburant et le type de route.
1 GIEC - Méthodologie: Good Practice Guidance and Uncertainty Management in National Greenhouse Gas inventories, Chapter 2 - Energy - Mobile combustions: Road vehicles.
XlI
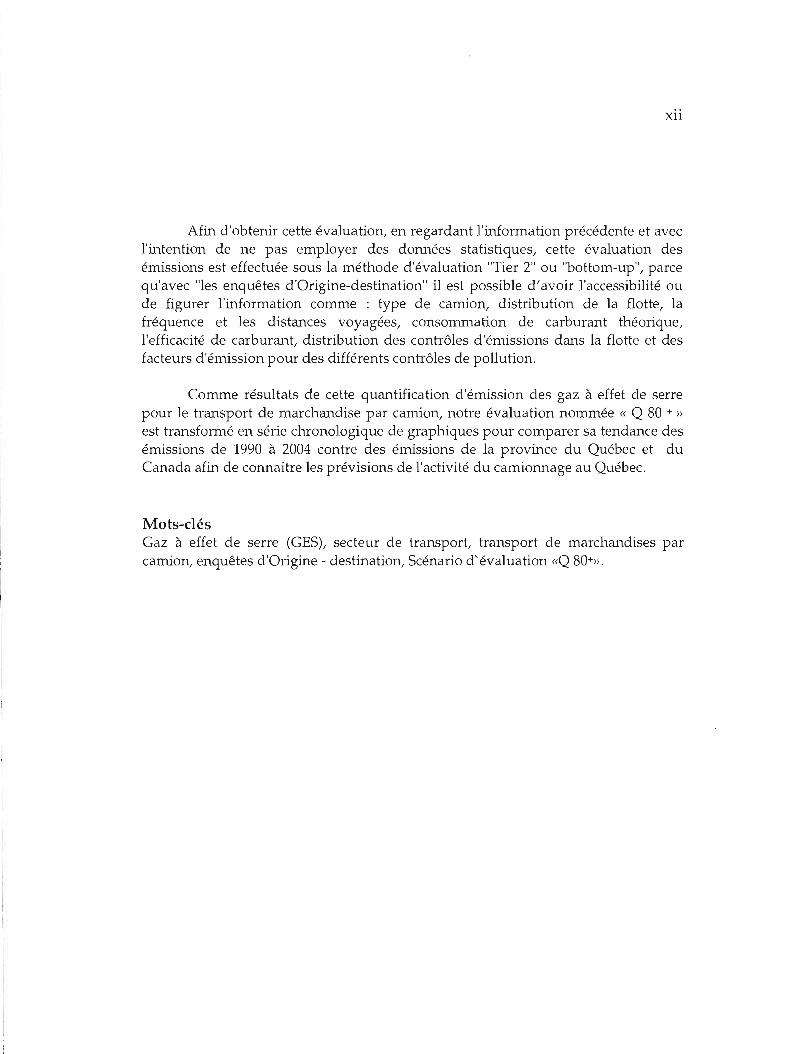
Afin d'obtenir cette évaluation, en regardant l'information précédente et avec l'intention de ne pas employer des données statistiques, cette évaluation des émissions est effectuée sous la méthode d'évaluation "Tier 2" ou "bottom-up", parce qu'avec "les enquêtes d'Origine-destination" il est possible d'avoir l'accessibilité ou de figurer l'information comme : type de camion, distribution de la flotte, la fréquence et les distances voyagées, consommation de carburant théorique, l'efficacité de carburant, distribution des contrôles d'émissions dans la flotte et des facteurs d'émission pour des différents contrôles de pollution.
Comme résultats de cette quantification d'émission des gaz à effet de serre pour le transport de marchandise par camion, notre évaluation nommée « Q 80 + »
est transformé en série chronologique de graphiques pour comparer sa tendance des émissions de 1990 à 2004 contre des émissions de la province du Québec et du Canada afin de connaitre les prévisions de l'activité du camionnage au Québec.
Mots-clés Gaz à effet de serre (GES), secteur de transport, transport de marchandises par camion, enquêtes d'Origine - destination, Scénario d'évaluation «Q 80+».
ABSTRACT
As it is weIl known, the transportation sector is blamed for being a major contributor to the problem of pollution and a main contributor in the production of greenhouse gas emissions (GHG), due to the fossil fuel combustibles employed. On the other hand, considering the concem of the United Nations Framework Convention on Climate Change (UNFCCC) to quantify GHG emissions, nowadays, aIl the cO\.ll1tries signatories of this treaty, must submit an inventory of these emissions on an annual basis for every sector implicated on this matter, in order to evaluate the situation and to provide potential solutions.
Nowadays, it is desirable to investigate not only the total volume of GHG emissions (COz, CH4 and NzO), but also those that proceed as result of trucking freight transportation activity on the road network in Quebec.
The aim of this thesis is to update a method to procure a quantification of these particular emissions in terms of COz equivalent. As a variation to attempt in this analysis in order to find more accuracy on our GHG emissions quantification, we make use of «Origin-destination Matrix surveys» elaborated by the Transportation Ministry of Quebec (MTQ), as the key source of data, and not Statistics Canada nor CANSIM annual information from Canada Govemment, which are usually employed to carry out this type of analysis.
Our most important resource of support are the recorrunendations and methodology proposed by the Intergovemmental Panel on Climate Change (IPCC)2, which considering the availability of infonnation, provides two kinds of recorrunendations or approaches to estimate emission from road vehicles. The first approach, or Tier l"top-down", recorrunended to ca1culate just COz, estimates these emissions supported on the basis of statistics of fuel consumption ( or fuel sold) from the National Authority responsible of this information. The second approach or, Tier 2 "bottom-up", which is appropriate for evaluating COz emissions and also CH4 and N 20, basically uses information such as distance travelled by vehicle type, fuel type and road type.
2 IPCC - Methodology: Good Practice Guidance and Uncertainty Management in National Greenhouse Gas inventories, Chapter 2 - Energy - Mobile combustions: Road vehicles.
xiv
In order to obtain this evaluation, considering the preceding information the aim of this evaluation is to exc1ude the use of statistical data. This estimation of emissions is carried out according to the method of evaluation of Tier 2 or "bottomup", because the «Origin-destination Matrix surveys» allows the possibility of having accessibility or determining information such as: truck type, distribution of the frock fleet, frequency and distances travelled, theoretical fuel consumption, fuel efficiency, distribution of emissions controls in the fleet and Emission factors for different pollution contraIs.
As outcome of this quantification of ermSSlOns for trucking freight transportation, our scenario of evaluation named « Q 80 ... » is transformed into a time series graph to compare the trend of emissions from 1990 to 2004 against the total volume of emissions released in the province of Quebec and Canada, in order to know the forecast of trucking freight activity in Quebec.
Keywords greenhouse gas (GHe's) ermSSlOns, transportation sector, trucking freight transportation, origin-destination Matrix surveys, scenery of evaluation «Q 80 -t ».

CHAPTERI
INTRODUCTION
1.1 Problem statement
Since the introduction of motorized transportation systems, economic growth
and advancing technology have allowed people and goods to travel farther and
faster. However, these modem transportation systems powered by internaI
combustion engines which are fuelled by petroleum have gradually increased the
use of energy and at the same time have produced nearly a third of our nation's
greenhouse gas (GHG's) emissions.
Emissions from the transportation sector in Canada have increased by about
48.8 Mt (32.8%) from 1990 to 2005. This sector represents an increase of 23.2 Mt or
over 109% in emissions from light-duty gasoline trucks, reflecting the growing
popularity of sport utility vehicles. Additionally, emissions from heavy-duty diesel
vehicles have increased by 17.8 Mt over this period, which is indicative of greater
heavy-truck transport. Offsetting these increases were reductions in emissions
attributed to gasoline and alternatively fuelled cars by 6.0 Mt and 1.5 Mt respectively
(Environment Canada, 2006. Canada's Greenhouse Gas Inventory 1990 - 2004).
This rise in GHG concentrations - the most important gas being carbon
dioxide (COz) - has contributed to an increase of approximately OSC in global
average temperature over the past century. Climate modelling studies and climate
trends during the past few decades have indicated that global warming is increasing
2
the frequency and intensity of extreme weather events, droughts and desertification
in currently inhabited areas. Moreover, continued warming can be expected if the
increase in atmospheric concentrations of GHGs - much of which is due to the
burning of fossil fuels and other human activities such as industrial processes, - is
allowed to continue unabated.
Canada's extreme weather conditions, geographical position and constant
increase in greenhouse gas emissions, have all contributed in making Canada one of
the countries most vulnerable to global climate changes. ln Canada's north, for
example, the extent of sea ice can be expected to decline, which will affect northem
travel, wildlife distributions and traditional hunting practices. Therefore, agriculture,
forestry, tourism and recreation could be affected in the future. Climate change is
also expected to have an impact on human health by leading to a rise in the number
of cases of heat stress, respiratory illnesses and transmission of insect and
waterborne diseases, placing additional stresses on the health and social support
systems.
The c1imate change problematic has led several international conventions and
agreements aiming to limit and to stabilize GHG emissions and other harmful
substances. The most recent convention was the result of the Kyoto Protocol in
December 1997, under which Canada agreed to reduce its GHG emissions by 6%
between the years 2008 to 2012. However, since 1990, GHGs emissions in Canada
have risen by approximately 13%.
Since the Kyoto Protocol agreement, there is an implied national
commitment. Canada's Minister of the Environment and Minister of Energy have
not only approved a process to examine the impacts, costs and benefits of
implementing the Kyoto Protocol, but have also developed options for
implementing the Protocol in Canada. This process willlead to the development of a
3
national implementation strategy to curb c1imate change. Covenunent and non
government agencies are part of this process and are working together to identify
and implement initiatives to achieve the objective established in the Kyoto ProtocoI.
In Canada, trucking transportation is an important activity for human
develops due to its flexibility, increase and spread of population and its economic
dynamism. This activity has become an integrated part of production and
distribution process, and considering the rapid restructuring of the global
transportation system, it has brought a profound impact on processes such as
globalization, in the industrialized and in the industrializing world. If Canada makes
significant progress towards meeting the Kyoto commitment (reduction of CHC
emissions to 6% below 1990 levels in the 2008 to 2012 period) transportation
emissions, inc1uding those from trucking freight activity must become a priority,
where the implementation of policies and programs in order to stabilize emissions
will have a direct impact on the energy industry and on investment decisions.
The United Nations Framework Convention on Climate Change (UNFCCC)
has an objective to CHC's concentrations in the atmosphere at a level that would
prevent and reduce dangerous human-induced interference with the c1imate system.
The ability of the international community to achieve this objective is dependent on
an accurate knowledge of CHC emissions trends, and on our collective ability to
alter these trends. For that reason the Intergovernmental Panel on Climate Change
(IPCC) has been established by the World Meteorological Organization (WMO) and
the United Nations Environment Programme (UNEP) to assess scientific, technical
and socio- economic information relevant for the understanding of climate change,
its potential impacts and options for adaptation and mitigation. The IPCC National
Creenhouse Cas Inventories Programme (IPCC-NCCIP) has helped to develop and
to refine an internationally-agreed methodology and software for the ca1culation and
reporting of national CHC emissions and removals; and ta encourage the
4
widespread use of this methodology by countries participating in the IPCC and by
signatories of the United Nations Framework Convention on Climate Change
(UNFCCC).
In accordance with Articles 4 and 12 of the Convention on Climate Change
(UNFCCC), and the relevant decisions of the Conference of the Parties, Parties to the
Convention submit national greenhouse gas inventories to the Clirnate Change
secretariat. These inventory data are provided in the national communications under
the Convention by Annex 1 and non-Annex 1Parties, and in addition Annex 1Parties
submit national greenhouse gas inventories annually. In the case of Canada,
Environment Canada and Statistics Canada are continuously planning and
implementing refinements to the national greenhouse gas emissions inventory that
will improve the accuracy of emission estimates and the quality of the indicator
used. These refinements take into account the results of annual quality assurance
and quality control procedures and reviews and verifications of the inventory,
including an annual external examination of the inventory by an international expert
review team.
ln order to continue with this task to evaluate emissions, our project
«Environmental impacts of trucking freight transportation: quantitative analysis of
greenhouse gas emissions in the province of Quebec» which is included in the
evaluation frame-work of GHG's emissions proposed by the IPCC, it has as a
primarily objective to set a first step on the quantification of gas release making use
of the «Origin - destination matrix» for the trucking activity in Quebec's province.
This variation to evaluate emission will allow exploring new tools in order to
improve, compare and refine future gas inventories.
5
1.2 Context of the thesis
Nowadays, there are many reports, documents, comparisons, and inventories
analyzing the current worldwide freight transportation emission, but after having
analyzed this information and their final results, the outcome does not seem to offer
enough and adequate information.
As matter of fact, considering the role that trucking freight transportation
represents for Canada, even for the Quebec (province), and considering the actual
requirements of such information, it is indispensable to improve a specific approach
to quantify emission releases of carbon dioxide (C02), methane (CH4) and Nitrous
oxide (N20) in terms of C02 - equivalent3 in order to dispose aIl elements necessary
to design potential and futures measures destined to reduce this pollutant trend.
Few things are known about the contribution of trueks vehicles as economic
activity and mobile source of GHG emissions. More specificaIly, it is desirable to
investigate not only the total volume of emissions, but also emissions by link in the
transportation network in Quebec (province).
The specifie problematic around this subject of trucking freight
transportation emissions is led by the following facts:
• There is not a specifie and detailed methodology that evaluates and
quantifies emissions from this sector, considering aIl the factors and
parameters this subject could involve.
3 C02 - equivalent is defined as the amount of carbon dioxide (CO) that would cause the same amount 2
of radiative forcing as a given amount of another greenhouse gas. (IPCC/TEAP. Special report)
6
• The trndersupplied or incomplete information in order to realize these kinds
of evaluations and quantifications.
1.3 General objective
The general objective of this investigation is to bring up to date a method to
evaluate and to quantify Greenhouse gas emissions produced by trucking freight
transportation in Quebec's province, considering the provincial parameters that this
activity involves. In order to achieve this general objective, the following specifie
objectives were pursued:
1. To employ the Trucking freight transportation Origin - Destination Matrix
surveys from the Ministry of transportation of Quebec (MTQ), as the main
data source for this quantification, in order to identifyaand to include in the
evaluation information such as:
• Trucks trips nurnber
• Trucks classification
• Distances
• Roads network (freeways (Autoroutes), highways (Routes) and
Canadian highways)
2. To calculate Trucking freight transportationaemission in terms of «C02 - eq»
from 1990 to 2004 for gasses suchaas:
• Carbon dioxide (C02)
• Methane (CH4)
7
• Nitrous Oxide (N20)
3. To compare the trend obtained from this evaluation of trucking freight
transportation emissions against the information of GHG emission given by
Environment Canada for the province of Quebec and Canada.
4. To make suggestions for furthers evaluation and quantifications of this type.
1.4 Research hypothesis
• Context
Having into account factors as the introduction of new teclmologies used in trucks,
employ of improved combustibles and the application of new environmental options
to develop the trucking freight transportation activity, this research regards to
demonstrate that the trend of gas emission originating from this activity, considering
the actual conditions are increasing.
• General Hypothesis
Each year, from 1990 to 2004, the Greenhouses gas emissions as product of trucking
freight transportation in the Province of Quebec are increasing.
• Specifie Hypothesis
1- Considering the two alternatives proposed by the Guideline of the IPCC to
evaluate Greenhouses gases emission from trucking freight transportation, is the
8
Tier 2, or <bottom-up> approach which present more accuracy in this type of
evaluation and quantification for the trucking freight activity.
2- The use of annual statistics to quantify trucking freight transportation pollution
does not permit to approaeh to a specifie solution, also does not describe the
problem inside Quebec's Province.
3- The use of the Origin - Destination Matrix, is the trustworthy tools whieh will
permit to identify: partieular trends, geographic areas affected and road
infrastructure employ by this activity.
CHAPTER2
LITERATURE REVIEW
Trucks play an important raIe in our society and are essential in maintaining
our standard of living. They are responsible for practically all final deliveries of
everything we buy. The industry and teclmology designed for trucks is often leading
edge: advanced electronic contraIs and diagnostics, driver management systems and
satellite communication are commonplace in large fleets. AlI this has been
introduced not only for operational efficiency, but also to control the engine's
performance and reduce vehide emissions (Environment Canada. 2001).
2.1 The trucking freight activity
Freight transportation activity and communication are vital elements in the
economies of nations, regions, and cities, being the movement of freight a business
factor of develop (Forkenbrock, 2001). However this activity is much more complex
and is not limited to the transport of people or goods. It also involves a concept
about how the consumers satisfy their necessities and develop their activities.
Trucking transportation affects all kind of activities, in fact, most of the things
we use or we eat in our daily lives are brought to us by truck, at least part of the
way. Trucking is a major segment of the economy and is also critical for the
competitiveness of Canadian business, because it is more flexible than other modes
of transportation. Restricted only by the extent of the road network, trucking can
10
provide the quality of service required to satisfy today's increasingly demanding
shippers.
In Canada, trucks and trucking activity are a fundamental component of the
economy because almost anything imaginable is transported by truck at sorne stage
of its production. "If you got it, a truck brought it," is a common phrase (Transports
Canada, 2003).
2.2 Trucking activity within the transport sector
About 90% of trucks in Canada are used to haul freight or equipment via
public roads. The trucking industry in Canada, inc1uding private carriers, couriers,
farm trucks and a wide range of trucks operated by trades, the service sector and
governments are difficult to quantify, because so many different types of
organizations use trucks in many different ways.
Trucking freight transportation is a complex activity, and this complexity
derives from the pluralism of its hardware (infrastructure and vehic1es) and the
people and organizations involved (Forkenbrock, 2001). Its complexity is multiplied
by the existence and roles of different modes, regulatory and legislative bodies,
service providers, builders, financing systems, teclmologies, land-use patterns, and,
most importantly, human behaviour. This mode of transportation basically provides
over-the-road transportation of cargo using motor vehicles, such as trucks and
tractor trailers. This sector is subdivided into general freight trucking and
specialized freight trucking. This distinction reflects differences in equipment used,
type of load carried, scheduling, terminal and other networking services. General
freight transportation establishments hanclle a wide variety of general commodities,
usually palletized and transported in a container or a van trailer. Specialized freight
transportation is the transportation of cargo that requires specialized equipment
11
because of size, weight, shape or other inherent characteristics. Each of these
industry groups is further subdivided based on distance traveled. Local trucking
establishments carry goods primarily within a single metropolitan area and its
adjacent non-urban areas. Long-distance trucking establishments carry goods
between metropolitan areas, but trucks do more than just move freight. Many
trucking companies or those offering trucking services provide what is known as
logistic services, whereby they manage all or a portion of a customer's distribution
system.
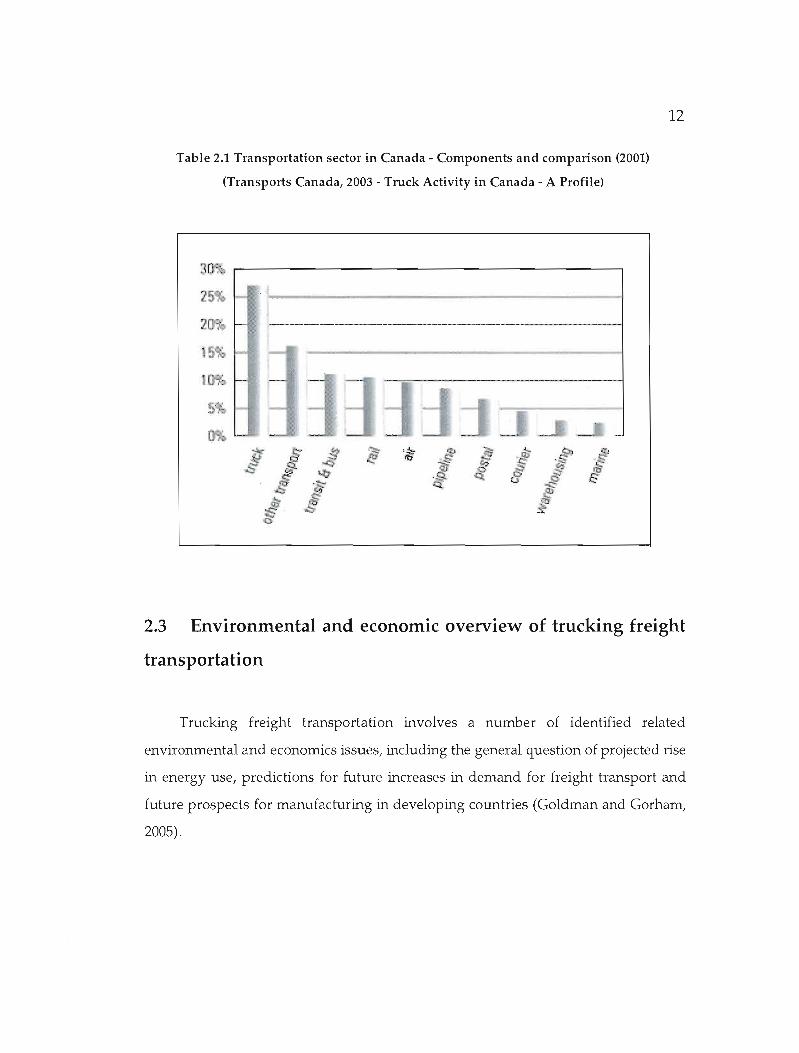
The following figure shows that trucking is the largest component of the
transportation sector. Also, trucking is 2.4 times as large as the rail industry (rail
includes passenger transportation and trucking excludes freight carried by private
trucks, couriers, farm trucks and other truck services).
12
Table 2.1 Transportation sector in Canada - Components and comparison (2001)
(Transports Canada, 2003 - Truck Activity in Canada - A Profile)
,. - ';É;; ....;; ~
~ .Q!J ~ 1'0 If -$ .. ~ st1 7ft '9""."'"" ,;;:: lotJ ,~ q <:..' ~ j§
~ !!r.:t .~ -.;:. QIf'
.$ l;; 00
2.3 Environmental and economic overview of trucking freight
transportation
Trucking freight transportation involves a number of identified related
environmental and economics issues, including the general question of projected rise
in energy use, predictions for future increases in demand for freight transport and
future prospects for manufacturing in developing countries (Goldman and Gorham,
2005).
13
2.3.1 Economie importance
The absence of a common definition for trucking activity makes it difficult to
measure its importance on the economy. Moreover, even when certain definitions
are used, for example "for-hire trucking", the sense of importance changes with the
measure used (tonnes of freight, tonne-kilometres of freight, revenues, employment,
etc.).
In Canada, the economy is measured by its gross domestic product (GDP),
which was in the order of $940 billion in the year 2001 (1997 dollars). Trucking
activity accounted for 1.2%, and this takes into consideration only commercial
activities of for-hire trucks (18% of the total fleet). This 1.2% of the GDP may look
smalt but it is about the same size as the pulp and paper industry and the primary
metal manufacturing industry (aB steel mills and other sources of primary metals).
The trucking industry is one-third larger than arts, entertainment and recreation,
and is almost twice the size of forestry (raw logs).
The rail industry, both passenger and freight, is only 42% as large as the for
hire trucking industry (Transports Canada. 2003). One-quarter of all transportation
related GDP is generated solely by trucking activity. This activity, as commercial
transportation industry represents annual revenues of almost $20 billion, which is
more than 40% of the transportation component of Canada's gross domestic product.
Sorne observers estimate that the value of all this activity to be in the range of $40
billion annually (Minister of Public Works and Govemment Services, 2001).
On the other hand, no one truly knows how much freight trucks haul.
Statistics Canada, as the most common source of information, has estimated the
volume of freight handled by for-hire trucks to be 278 million tonnes for the year
2000 (204 million domestic and 74 million cross-border). But this survey of 1,711
14
motor carriers out' of a population of at least 9/317 includes only firms domiciled in
Canada that eam $1 million or more in revenuel mostly from long-distance hauls (80
kilometres or more).
The trucking freight industry is highly flexible in using Canada/s 9001000
kilometres of highways and roads to bring goods to aU points of the country as weU
as facilitating the trade of large quantities of goods with our NANA (North
American Pree Trade Agreement) neighbours (Statistics Canada l 2004). This activity
has employed around 2701000 Canadians as truck drivers l and another 4001 000
Canadians are employed directly by the trucking industry in the heavy vehicle
industrYI in the areas of manufacturingl sales l support and parts (Environment
Canada 2001).
In the province of Quebec l considering the actual process of
intemationalization of the economy and the distribution of the economic activitYI
(woodl minerals l food and alimentation products)1 the trucking freight activity
represents around 56% of aU truck displacements. Aiso in 19971 the trucking freight
industry was responsible for moving almost 66 million tons of product out of a total
of 225 million tons of product moved in the same year.
2.3.2 Environment summary
Technology designed for trucks is often leading edge: advanced electronic
controls and diagnostics l driver management systems and satellite communication
are commonplace in large fleets. This technology has been introduced not just for
operational efficiencYI but also to control the engine/s performance and reduce
vehicle emissions. Since 19701 trucks have reduced their emissions by over 80%,
decreased their fuel consumption rate by 50% and increased their payload efficiencYI
as measured in litres/tonnes per kilometre (L/t-km)1 by 300% (Environment
15
Canada. 2001). On the other hand, the latest statement from Environment Canada
reports that total emissions in Canada grew in 2004. Emissions from the energy
sector increased 13% between 1990 and 2004. Transportation emissions increased
25% during the same period, with light-duty gasoline trucks and heavy-duty diesel
vehic1es contributing to 53% and 43% of the increase, respectively. These increases
can be attributed to not only the increase in the munber of passenger-kilometres
travelled (more people drove further), but also to the increase of merchandise
kilometres travelled to supply and satisfy all kind of necessities.
Heavy-duty diesel vehic1es (HDDV, large transport trucks), light cars and
trucks consisting of light-duty gasoline vehic1es (LDGV), or automobiles, and light
dutY gasoline trucks (LDGT), or pickup trucks, sport utility vehicles (SUVs), and
sorne vans showed emission increases of 2.6 Mt and 2.1 Mt respectively, between
2003 and 2004. This growth is a continuation of long term trends in road transport.
Emissions from HDDV (large freight trucks) rose by about 20 Mt between 1990 and
2004, an 83% increase. Spurred by free trade and the deregulation of the trucking
industry, the amount of freight shipped grew rapidly over the period. In addition,
the quantity shipped by truck, as opposed to other modes of transport, such as rail,
increased as a result of customer requirements for just-in-time delivery and cross
border freight (EnvirorunentCanada, 2006).
2.3.3 Sustainable development
As is well known, C02 emissions from trucking freight transportation are
supposed to be the one of the largest contributors to the problem of global warming.
It is feared that this warming might lead to a non-sustainable development of the
earth (Kessel, 2000). Nevertheless, in response to this issue, a notion and a number of
measures under the term "Sustainable Mobility" has emerged as the key challenge
for the 21st Century and the future (Downing et al., 2003).
16
When the Sustainable Mobility notion was created, it was defined as "the
ability to meet the needs of society to move freely, gain access, communicate, trade
and establish relationships without sacrificing other essential human or ecological
values today or in the future" (WBCSD, 2001), and it was subsequently modified by
the Brundtland Coffi11Ùssion's definition of sustainability for the planet. A new
definition of sustainable transportation was derived and defined as "the ability to
meet today's transportation needs without comprornising the ability of future
generations to meet their transportation needs" (Black, 1996), (United Nations, 1987)
referenced to econornic, environmentat and social equity sustainability, but in not
many ways is considered a strong connection among: economic growth,
transportation, environments impacts and the future and welfare of the human
being.
The most notorious disconnection conceming the concept of Sustainable
Mobility has been motivated by a lack of vision and an overall view of transport
having as result not only that sustainable development and freight transportation
interact in a circular way (Grubb, 2003) but also these issues are in grand part
responsible for c1imate change.
Among the disconnections of this activity it is possible to mention the following
aspects:
• Truck freight transportation is the main consumer of fossil fuels, which
ecologically is the primary worldwide source of consumed energy inc1uding
oil and natural gas.
• Truck freight transportation has become each of the transportation modes
(air, inland water, ocean, pipeline, rail, and road) and through a technological
17
evolution has functioned separately under a modally based regulatory
structure for most of the 20th century.
• The strong expansion of truck freight transportation is a consequence of
safety and congestion. AIso, constitutes an important disturbing activity, and
in particular freight road transport throughout world is an important source
of congestion and pollution, as wellas a calise of many accidents (DeWitt
and Clinger, 1997).
• Congestion and city traffic are synonymous of slow velocity, associated with
pollution, gas emission, extra fuel consuming, traffic jams, roads congested
and accidents. The congestion is caused not only by the traffic demand
approaches but also by the capacity of the roads system. On the other hand
when there are many users of the infrastructure its capacity is not enough to
support then. Through this concept is easy to understand, that the congestion
can vary significantly fram day to another due to the traffic demand and the
availability of the raad capacity that are in a constant change. However traffic
demand varies significantly by hourI day of week, and also by the season of
the year and they are also subjected to significant fluctuations due to
recreational travet special events, and emergencies (Paniati, 2002).
• Noises, even in rural areas where fewer people live and work, (defined as
unwanted or detrimental sound) is bothersome. Even where noise levels are
generally quite low, intermittent noise can adversely affect people, especially
when they need to concentrate, restor maintain tranquility. While the
psychological effects of noise are very difficult to monetize, noise tends to
have an adverse impact on residential property values (Hokanson et al.,
1981).
18
• Deterioration of road network infrastructure, every time, when a vehicle or
truck, is using or passing on the road (pavement structure), it is producing a
small alteration in the internaI composition of such structure, having as result
deterioration and fatigue of the road system, that is represented on
constantly maintenance and money investing to keep the infrastructure in
normal condition. Also it is important to consider, when road infrastructure
is constructed, a series of alterations are created and associated with the
environment surrounded like changes in vegetation properties, soils and
animal's behaviors.
• Production of waste, as a normal resul't of a regular use of any vehicle or
trucks, a production of oil, tires, auto parts are the consequence of this
process. It is important to consider that sorne of these remaining or waste are
difficult to incorporate to the environment, because its storage or reusability
is complicated or simply because its recycling is complex and expensive.
• In developed and non developed countries, the main air pollution problem
has typically been high levels of smoke and sulphur dioxide arising from the
combustion of sulphur-containing fossil fuels. The major threat to clean air is
now posed by traffic emissions and trucking freight transportation. Freight
transportation petrol and diesel-engined motor vehicles emit a wide variety
of pollutants, principally carbon monoxide (CO), oxides of nitrogen (NOx),
volatile organic compounds (VOCs) and particulates, which have an
escalating impact on urban and rural air quality. In addition, photochemical
reactions resulting from the action of sunlight on nitrogen dioxide (N02) and
VOCs from vehicles leads to the formation of ozone, a secondary long-range
pollutant, which impacts in rural areas often far from the original emission
site.
19
But in contrast, economic, social and environmental situation have been well
responded by the truck freight transportation activity:
• Freight transportation activity has grown with the increase and spread of
population and economic activity and with the increasing interdependence of
economies across the globe, reflecting unprecedented global
interconnectivity.
• Freight transportation has become an integrated part of the production and
distribution system and the rapid restructuring of the global transport system
taking place at present. Therefore is likely to have a profound impact on
processes of globalisation, not only in the industrialised and industrialising
world.
• Freight transportation as an integrated part of the actual changing trends of
mobility also aims to influence forces behind mobility and to pressure the
transport industry.
2.4 Strategies to meet sustainable development objectives ln
trucking freight transportation
Reducing pollution from trucking freight transportation represents a complex
set of poliey choiees. Much effort has focussed on improving the teclmology that is
embedded in vehicles and transportation systems, changing the content of fuels,
or / and developing alternative fuels. A wide range of regulations are in place
governing fuel quality, combustion, and operating practices. Increasing efforts are
being made to change the design of transportation systems, to influence
transportation behaviour, and ta reduce transportation fuel demand.
20
Being identified both positive and negative issues concerning to the truck
freight transportation activity, now it is important to link the c1imate change and
sustainable transportation to create a better and efficient way to frame the mitigation
of c1imate change in order to find a better adaptation to the impacts and its linkages
between population, lifestyles, environment and development (Swart et al., 2003).
2.4.1 Quebec's province perspective solutions
In the activity of trucking transportation in Quebec is important to take into
account many factors and context as: internalization of the economies (international
market), internaI structural changes of the economies in Quebec, distribution
economical activity, legislatives frameworks, and actual freight transportation
situation in order to get a balanced and reasonable solution.
Nowadays, there is many approximations concerning to find an appropriate
and a concrete explanation to the trucking transportation problematic, being possible
to mention three levels of solution to explore:
1. First level
It consist to focus and to work at level of trucks user. The Government on local or
nationallevel has to teach and instructing the population about this problem and its
challenges. It is not possible that everyone blame or makes responsible the vehicIe or
truck as the main source of gas emission, if the vehicle it is just a tool to satisfy
necessities of. the human being, the vehic1e it is an inert instrument that depends on
somebodyelse's manipulation to make a specific task.
21
At this first level, the most important idea is the attitude change regarding to
the vehicle or truck use, and to let everybody know what is going to happen in a
future not too far about our life quality if this tendency continues.
2. second level
It regards to how the local and provincial governments have to support
initiatives against the gas emissions, Reduce pollution and noise; Contribute
reaching the Kyoto targets; Improve living conditions of city inhabitants (Crainic et
al, 2004). These measures consist basically of initiatives to optimize the truck use.
Among the main measures of this initiative is possible to mention:
• Better urban planning and connection between common freight
transportation, reduction of congestion and increasing of mobility (Crainic
et al, 2004).
• Logistic efficiency, with the aim of increasing the load factor, choosing the
optimum vehicle category or optimising the entire transportation chain
from origins to final delivery (Léonardi et Baumgartner, 2004)
• Promotion of freight transportation modes which have lesser negative
effects as rail and waterway, and their intermodal combination with road,
in order to substitute these modes to the use of direct road transports. One
way to achieve this substitution could be to set up a pricing policy that
would include the external effects of each mode (Beuthe M. et al. 2002).
• Driver efficiency, with training or assistance from on-board units used for
measuring components of driving behaviour that influence fuel use
(Léonardi et Baumgartner, 2004).
22
• Route efficiency: information on itinerary, road conditions or traffic can
help to optimise routing (Haughton, 2002).
At this level, the emergent ideas and solution deploys: "creative new
technologies" (fuel and vehic1e technology) and business models to provide
competitive alternatives to the truck vehic1e, also these strategic policies visions
might take different forms if applied in different cities, where local needs, levels of
economic development, cultures, urban forms, economic structures, and
transportation systems must be taken into account (Goldman and Gorham, 2005).
3. Third level
It concerns to the implementation of measures at level of federal govemments
and worldwide industry in developed countries or companies or entities uncharged
to develop new freight vehic1es and fuel technologies, consumption efficiency,
resistance of tires (Côte, 1998).
The main idea of this third type of solution it is to establish truth and real
measures, policies, programmes regarding to new technologies to reduce GHG
emissions, where the central point is the investment decision with ethical, moral and
environmental criteria.
CHAPTER3
GREENHOUSE EMISSIONS FROM TRUCKING FREIGHT
TRANSPORTATION
The rapid growth of world population, strongly increasing energy demand of
emerging economies and the high C02 production in industrialized countries are
issues to aboard rapidly in order to reduce or even stabilize global GHG emissions
(Kessel, 2000). However transportation is the single largest contributor of
greenhouse gas emissions (GHG), accounting for about 25% of Canada's total
emissions.
This sector also accounts for the largest share of the growth of emissions on
the last decade. (Minis ter of Public Works and Government Services, 2001, Chapter
17, page 278.).
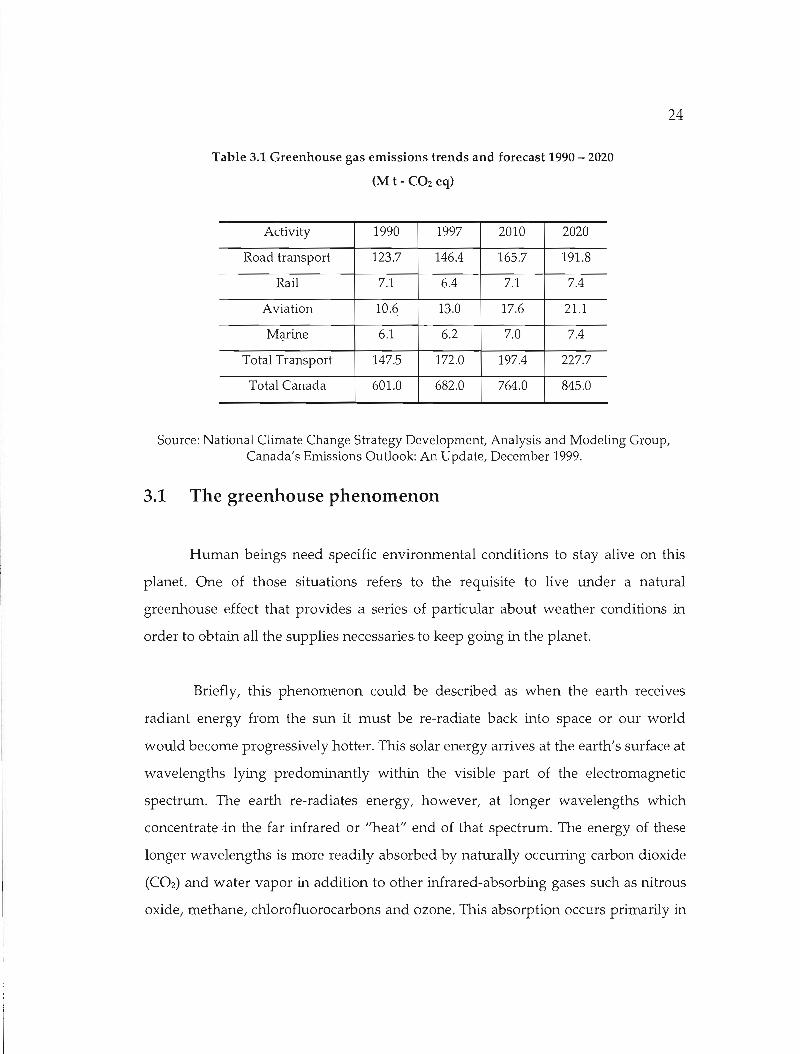
The following Table 2.1 presents the GHGs trends and forecast from 1990 to
2020 according to different transportation activities.
24
Table 3.1 Greenhouse gas emissions trends and forecast 1990 - 2020
(M t - CO2 eq)
Activity 1990 1997 2010 2020
Road transport 123.7 146.4 165.7 191.8
Rail 7.1 6.4 7.1 7.4
Aviation 10.6 13.0 17.6 21.1
M<l.rine 6.1 6.2 7.0 7.4
Total Transport 147.5 172.0 197.4 227.7
Total Canada 601.0 682.0 764.0 845.0
Source: National Climate Change Strategy Development, Analysis and Modeling Group, Canada's Emissions Outlook: An Update, December 1999.
3.1 The greenhouse phenomenon
Human beings need specifie environmental conditions to stay alive on this
planet. One of those situations refers to the requisite to live under a natural
greenhouse effect that provides a series of particular about weather conditions in
order to obtain aU the supplies necessaries to keep going in the planet.
Briefly, this phenomenon could be described as when the earth receives
radiant energy from the sun it must be re-radiate back into space or our world
would become progressively hotter. This solar energy arrives at the earth's surface at
wavelengths lying predominantly within the visible part of the electromagnetic
spectnun. The earth re-radiates energy, however, at longer wavelengths which
concentratein the far infrared or "heat" end of that spectrum. The energy of these
longer wavelengths is more readily absorbed by naturaUy occurring carbon dioxide
(C02) and water vapor in addition to other infrared-absorbing gases such as nitrous
oxide, methane/ chlorofluorocarbons and ozone. This absorption occurs primarily in
25
the troposphere, the region from the earth's surface up to an altitude of 10 to 15 km
(Labelle, 2000). When these molecules absorb energy, they cause general
atmospheric warming, a phenomenon commonly called the "greenhouse effect."
These gases thus act like a "thermal blanket" around the earth, and as their
atmospheric concentration increases, together with the absorption of energy in the
infrared, incoming radiation temporarily exceeds outgoing radiation. The
temperature of the atmosphere rises, and a new radiation balance is established. This
"natural greenhouse effect" is an important phenomenon to biologicallife on Earth.
The average surface temperature is maintained at approximately 15°C because of
this effect. If an the radiant energy were to escape out of the atmosphere, the global
temperature wouId be -18°C, a difference of 33°C (Hobbie et al., 1984). However, any
alteration on this natural greenhouse effect will be represented in an imbalance on
the human being welfare.
3.2 The balance of greenhouse gases
Carbon dioxide (C02) is the vehicle that transports carbon through the carbon
cycle. It is removed from the air by plants during photosynthesis to make solid
organic compounds, and when these compounds are respired, CO2is again released
to the atmosphere. Carbon dioxide dissolves in the oceans as bicarbonate and can be
converted to the solid, calcium carbonate, by shellfish. In the very long term, CO2
can be converted to fossil fuels. This is the role of carbon dioxide in carbon
circulation (a biogeochemical cycle), which consists of both living and nonliving
components (Labelle, 2000).
Over the past half-billion years of our planet's more than 4.5-billion-year
history, a small percentage of the carbon circulating through the earth's surface
environment has been diverted and stored in sedimentary rocks as fossil fuels. In
mankind's recent history there is believed to have been an approximate balance in
26
the exchange of carbon between the atmosphere and the oceans. In the course of a
century or two, however, industrial activity has retumed to the atmosphere a
portion of the carbon that nature had been storing in fossil fuels over many millions
of years.
Worldwide human activity or anthropogenic activities such transportation,
industrial activities, are producing more than 24 billion tonnes of COz every year,
being the direct combustion and non-energy uses of fossil fuels are responsible for
sorne 98% of total carbon dioxide emissions and 78% of total greenhouse gas (CHC)
emissions, producing as result an unbalance due that the system it is not re-radiating
back into space the radiant energy from the sun (IPCC, 1990). Of the six gases
covered by the Kyoto protocot COz is the most significant, counting for sorne 80% of
potential global warming. COz cornes first amo.ng the CHC,s produced (81% of
emissions, or 500 million tones), followed by methane (12%), nitrous oxide (5%), and
perfluorocarbons (1%). The industrial production, transport and consumption of
fossil fuels accollilt for 89% of emissions being the energy industries the main
producers of such emissions (34%), followed by the transportation industry (27%),
other industries (20%), residential sector (10%), the commercial and industrial sector
(5%), and agriculture (5%) (Environment Canada, 2006).
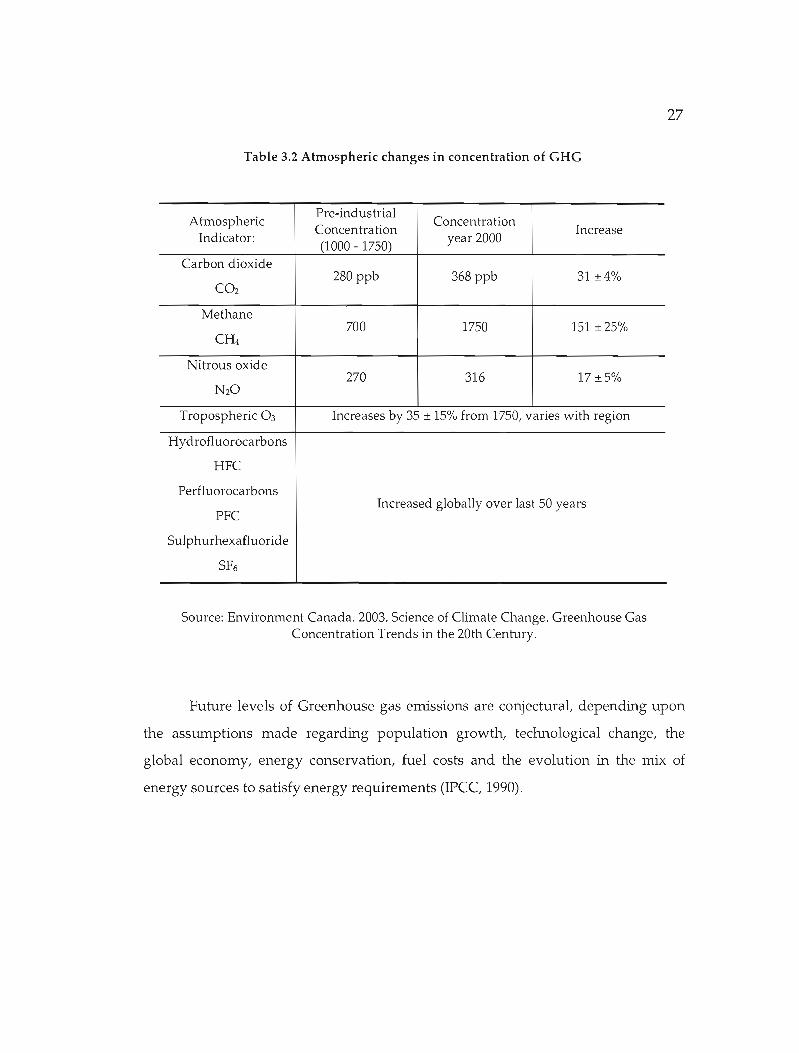
As a result of these human being activities, the atmospheric concentration of
COz has augmented by 31% since 1750 and continues to increase, on average, by 1.5
ppm or 0.4% per year. About 80% of the anthropogenic emissions of COz in the past
20 years are due to fossil fuel buming, cement production and deforestation. 5ince
approximately 1750, the atmospheric concentrations of CH4 and NzO have increased
by 151% and 17%, respectively (Environment Canada, 2003).
27
Table 3.2 Atmospheric changes in concentration of GHG
Ahnospheric Indicator:
Pre-industrial Concen tra tion (1000 - 1750)
Concentra tion year 2000
Increase
Carbon dioxide
CO2
280 ppb 368 ppb 31 ±4%
Methane 700 1750 151 ±25%
CH4
Nitrous oxide 270 316 17 ±5%
N20
Tropospheric 0 3 Increases by 35 ± 15% from 1750, varies with region
Hydrofluorocarbons
HFC
Perfluorocarbons Increased globally over last 50 years
PFC
Sulphurhexafluoride
SF6
Source: Environment Canada. 2003. Science of Climate Change. Greenhouse Gas Concentration Trends in the 20th Century.
Future levels of Greenhouse gas emissions are conjectural, depending upon
the assumptions made regarding population growth, technological change, the
global economy, energy conservation, fuel costs and the evolution in the mix of
energy sources to satisfy energy requirements (IPCC, 1990).
28
3.3 Greenhouse emissions and c1imate change
Climate changes are more than a warming trend. Increasing temperatures
will help to change the weather (wind patterns, the amount and type of precipitation
and the types and frequency of severe weather events that may be expected to
occur). Also greenhouse gasses and c1imatic change are motivating several changes
and impacts into al! three aspects of sustainable development: environmental, social
and economic as human health, ecosystem alterations, forestry, fishery, water
resources affecting the human welfare. (Prades et al., 1998)
3.3.1 Environmental impacts
3.1.1.1 Climate change
The Intergovemmental Panel on Climate Change (IPCC) has predicted an
average global rise in temperature of 1.4°C (2SF) to 5.8 oC (1O.4°F) between 1990
and 2100, but climate changes are more than a warming trend.
The increase in the mean global temperature of the lower atmosphere could
result from a doubling of the current C02 concentration lay between lSC and 4.5
oc. More complex model takes into account predicts maximum global mean annual
surface air warming in the range of 1.9 to 2.5 oC (Hengeveld, 1997).
Environment Canada suggested that in 1997 a doubling of C02 levels would
cause the average global temperature to rise by a minimum of 0.98 oc. Over the past
century, the average global temperature is believed to have increased by
approximately 0.3 to 0.6 oC, and it could continue to increase over the next 100 years.
29
3.1.1.2 Stratospheric ozone depletion
The GHG's from road transportation and mobility processes like Halocarbons
such as chlorofluorocarbons (CFCs) and hydrochlorofluorocarbons (HCFCs) have
led to the reduction of the ozone layer, also as a response to this problematic
Hydrofluorocarbons (HFC's) has been created to substitute CFCs and HCFC's to not
deplete stratospheric ozone, but on the other hand contributing to global warming.
The stratospheric ozone depletion processes leads to a cooling of the
troposphere, thus offsetting climate warming, through decreased downward
infrared radiation, and through increased DVB radiation, which enhances the
oxidation of methane producing sorne climate change that may also change
temperature and wind conditions in the stratosphere, enhancing further ozone
depletion (Noreen et al., 2002).
3.1.1.3 Oceans flows
Oceans are the main heat distribution factor between continents and are
controlled by a massive combination process involving deep ocean currents
displacing enormous quantities of hot and cold water, this process has a direct effect
on coastal air temperature that cornes in contact with it (Oppenheimer, 1998).
A higher greenhouse gas levels and increased temperatures could have an
impressive effect on ocean flows. Scientists estimate that sea levels could rise by an
average of 5 cm per decade over the next 100 years. Sorne estimates suggest that sea
levels could rise by almost a full meter by the year 2100. Now this temperature has
increased only few degrees and it could result in the melting of icecaps, which in
tum supply a considerable quantity of additional, freshwater to the oceans. Seawater
30
density and salinity levels would both decrease, and ocean movement would be
slowed. If the oceans stopped moving completely, coastal regions would be
deprived of a major heat source; as well, sorne continents - notably the western part
of continental Europe - would become cooler. On the other hand, in the absence of
ocean movement, the sea would stop absorbing C02, a phenomenon that currently
takes care of half of the CO2produced in the world. If current consumption patterns
continue, ahnospheric CO2 levels will double with extreme and unforeseeable
climatic consequences.
Canada is the perfect example of this situation; scientists suggest that the
disappearance of cod from the Gulf of St. Lawrence may not only be due to
overfishing, but also to oceanic heat loss. Northern Quebec is now colder and drier
than before, and is currently experiencing greater climatic variation. Tt is thus not
difficult to imagine that with more pronounced climatic change, water levels in
natural reservoirs such as the St. Lawrence River and the Great Lakes would drop
even further. Such a development would particularly affect the hydroelectric and
marine transportation sectors, as has already happened in the past: in 1994, these
two sectors suffered losses of million of dollars a result of the drop in the water
levels of the Great Lakes (Labelle, 2000).
3.1.1.4 Urban air pollution
Fossil fuels used in cities and roads for transportation produces air pollutants
such as particulate matter, sulphur compounds, carbon monoxide, and ozone
precursors such as nitrogen oxide and volatile organic compounds (VOC's) besides
climate changes can also affect the chemical processes involved in urban air
pollution through changes in temperature, cloud coyer, winds, and the impacts of
this pollution on public health (Noreen et al., 2002). Principally this use of fossil fuels
to feed engines is the principal source of air pollution (Environment Canada, 2001).
31
The Internai combustion of these engines is producing the following GHG's:
• Hydrocarbons (HC), which are partially, burned fuel - these are also called
volatile organic compounds (VOC).
• Carbon monoxide (CO), which is a product of an incomplete combustion of
carbon.
• Nitrogen oxides (NOx), which are the product of high-temperature
combustion of nitrogen (present in air).
• Particulates or particulate matter (PM), which are agglomerations of fuel soot
and sulphur particulates caused by incomplete combustion.
• Carbon dioxide (COz), which is the complete combustion product of carbon
in the fuel.
• Sulphur oxides (SOx), which are created by the combustion of the sulphur
contained in fuel, especially diesel fuel.
3.1.1.5 Land degradation
Greenhouse gas emission is the most significant environmental problem in
several regions deteriorating land quality and varying the properties physic and
chemical of the soil (Agriculture and Agri-Food Canada, 1999).
The new weather and c1imatic pattern not always do match with the existing
land, affecting the production of food and other agricultural crops. In many regions,
such as sub-Saharan Africa, the projected changes in temperature and especially
precipitation due to c1imate change would lead to additional stresses on agricultural
productivity. Also food production can also be a cause of global warming by the
appliql.tion of nitrogenous fertilizers for intensive agriculture thus increasing
emissions of the GHG's nitrous oxide (Noreen et al., 2002).
32
3.1.1.6 Land use and biodiversity
Climate change and the release of GHGs to the atmosphere have created a big
impact on vulnerable ecosystems affecting not only the ecosystem composition and
biological diversity (Noreen et al., 2002) but also due to new agricultural or urban
usages by the new c1imatic changes patterns (Agriculture and Agri-Food Canada,
1999).
3.1.1.7 Agriculture and forestry
GHGs and Climatic changes can influence the species distribution and
productivity of forest and agriculture ecosystems, impacting their operations
(Noreen et al., 2002). Day by day forecast prediction it is weaker to use on
agricultural and forestry proceedings, the temperature and precipitation ca1culations
are more difficult to use on planting decisions (Gielen et Yagita, 2002), besides the
probability ta get more dry soil conditions is expected.
3.1.1.8 Water resources
Greenhouse gases and c1imate change have modified precipitation patterns,
snowfal1 and ice cover (inc1uding glaciers) and affecting water supply. High
temperatures have increased and affected water demand for agriculture and water
quality, as weIl as the sources to produce energy form hydropower plants. Therefore
these c1imatic have affected agriculture, industry water users and aquatic ecosystems
like fisheries (Noreen et al., 2002).
33
3.3.2 Social economic impacts
Factors such as human well being, human consumption and social organization
are vulnerable factors on developing countries regarding to extreme weathers events
and c1imatic variability. These variables have produced an economical damage and
enormous pressure on poor economies, making poorest countries more vulnerable
(Monirul et Qader, 2003).
3.3.2.1 Poverty
One of the most worrying aspects of c1imate change impacts it is that they are
projected to fall disproportionally on poverty, increasing the existing development
inequalities.
Poverty often coincides with limited technological development, inadequate
institutions, unequaI access to resources and information, and poor levels of
participation in decision-making. However, it is no surprising that the impacts of
c1imate change can especially affect poor concentrations of human beings, who are
much more vulnerable and have less capacity to adapt to c1imate changes. At the
same time, the poverty contributes to c1imate change as weIl, because of the
conversion of forests and marginal lands by poor farmers and the usage of inefficient
technologies (Noreen et al., 2002). The most vulnerable communities and countries
are those which are already the poorest and least able to adapt to these changes (Adil
et al., 2003).
3.3.2.2 Health
The main problems related to traffic and transportation, GHe's and air pollution
are concentrated in central cities with high density of populations and activities.
34
Respiratory, cardiovascular diseases, asthma, intoxication caused by chemical and
biological contaminants, skin damage and skin cancer, cataracts, disturbed immune
function and premature mortality are the most frequent air pollution consequences
of private car use, having very elevated cost to the health se~tor (RabI et Spadaro,
2000).
3.3.2.3 Economie growth and development
GHG's emission and climatic changes have directly affected the economic
development structure. Countries where their economies depends basically of
activities such as agriculture, fisheries, coastal system, etc or countries with
economies service-oriented with less consumptive lifestyle will suffer more impacts
than countries with economies that depends basically on the energy andamaterial
goods production (Noreen et al., 2002).
3.3.2.4 Security
Greenhouse gases released and c1imate change can also have connection with
security issues such as: political tensions and conflicts between countries by means
of water resource deficiency, also projected reductions in Aretic sea ice eould affect
Arctie security by making high latitude waterways more accessible for longer
periods. Finally the overdependence on fossil fuel resourees (the most important
source of GHe's), eoncentrated in a limited and politieally unstable region (sueh as
oil in the Middle East), has proven to be a source of confliet and military aetivities.
(Noreen et al., 2002).
35
3.4 United Nations Framework Convention on Climate Change
(UNFCCC)
The United Nations Framework Convention on Climate Change (UNFCCC) is
the result of an international environmental treaty or agreement produced at the
United Nations Conference on Environment and Development (UNCED), informally
known as the Earth Summit, held in Rio de Janeiro in 1992. This treaty aimed to
stabilize the emissions of CHC release even its potential reduction in order to
combat global warming.
On June 12, 1992, 154 nations signed the UNFCCC that upon ratification
committed signatories' governments to a voluntary "non-binding aim" to reduce
atmospheric concentrations of greenhouse gases with the goal of "preventing
dangerous anthropogenic interference with Earth's c1imate system." These actions,
as gathering and sharing information on greenhouse gas emissions, national policies
and best practices, cooperating in preparing for adaptation to the impacts of climate
change and cooperate in preparing for adaptation to the impacts of c1imate change,
were aimed primarily at industrialized countries, with the intention of stabilizing
their emissions of greenhouse gases at 1990 levels by the year 2000 and other
responsibilities would be incumbent upon an UNFCCC parties.
The parties agreed in general that they would recognize "common but
differentiated responsibilities," with greater responsibility for reducing greenhouse
gas emissions in the near term on the part of developed/industrialized countries,
which were listed and identified in Annex 1 of the UNFCCC and thereafter referred
to as "Annex 1" countries.
36
The Convention on Climate Change sets an overall framework for
intergovernmental efforts to tackle the challenge posed by c1imate change. It
recognizes that the climate system is a shared resource whose stability can be
affected by industrial and other emissions of carbon dioxide and other greenhouse
gases.
On December 4 of 1992, Canada ratified the United Nations Framework
Convention on Climate Change and in March of 1994, the Convention entered into
force (Government of Canada, 2005).
3.5 Canadian measures to stop the actual emission trend
There is not doubt that awareness of the need to preserve the environment
has grown worldwide during the last decades, though in many parts of the world
this awareness is hidden behind more urgent needs to be satisfied.
As previously mentioned, the world is facing a big environmental challenge
represented by the rapid growth of world population, strongly increasing energy
demand of emerging economies and the slow progress of international
harmonization of CO2-reduction measures that are serious obstacles, in order to
reduce or even stabilize global C02-emissions. But if mankind turns out to be unable
to solve these problems, the actual impacts and the so far undetectable
anthropogenic greenhouse effect may become very real, and it might then be too late
for a lino regret pOlicy".
During the Kyoto Conference, Canada made cornmitments to reduce its
greenhouse gas emissions by 3% from 2008 to 2012 and by a further 5% from 2013 to
2017. AIso, in order to meet these commitments, and from the perspective of
37
sustainable development, Canada has to help developing countries by transferring
technology that encourages both emission reduction and economic growth.
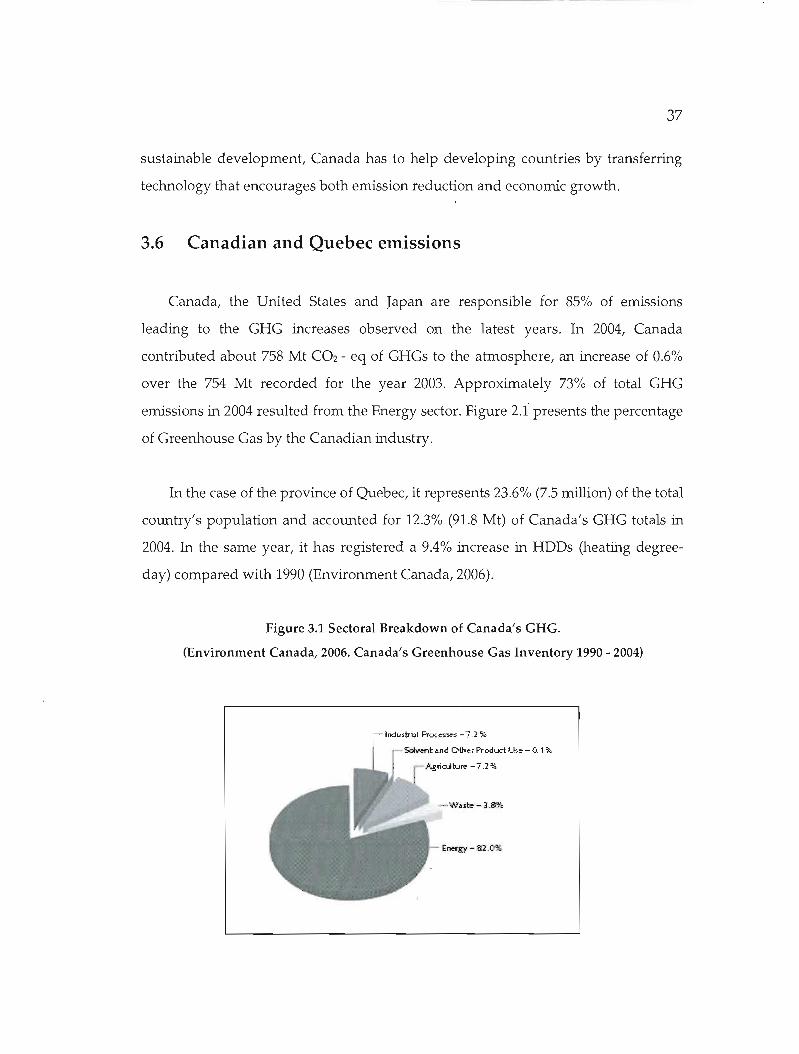
3.6 Canadian and Quebec emissions
Canada, the United States and Japan are responsible for 85% of emissions
leading to the CHC increases observed on the latest years. In 2004, Canada
contributed about 758 Mt C02 - eq of CHCs to the atmosphere, an increase of 0.6%
over the 754 Mt recorded for the year 2003. Approximately 73% of total CHC
emissions in 2004 resulted from the Energy sector. Figure 2.1 presents the percentage
of Creenhouse Cas by the Canadian industry.
In the case of the province of Quebec, it represents 23.6% (7.5 million) of the total
country's population and accounted for 12.3% (91.8 Mt) of Canada's CHC totals in
2004. In the same year, it has registered a 9.4% increase in HDDs (heating degree
day) compared with 1990 (Environment Canada, 2006).
Figure 3.1 Sectoral Breakdown of Canada's GHG.
(Environment Canada, 2006. Canada's Greenhouse Gas Inventory 1990 - 2004)
Sc~''"nt and Other Prod<.>:t I_~ - C\ , %
.~ricUb..J", -7.2">;.
- ·N.,œ - 3.re-•.
38
3.7 Reduction of Greenhouse gas
Measures to reduce greenhouse gas emissions are a major issue for govemments
and industry around the world. All developed countries, and many developing
ones, are actively putting into place policies and prograrrune to reduce emissions.
The implementation of these policies and prograrrunes has a direct impact on the
energyindustry and on investment decisions (World Energy Council (WEC), 2004).
Among the measures and strategies to reduce Greenhouse gas emission in a
nationwide and worldwide perspective, have priority:
• Reduction in processes that involve production of emissions as carbon
dioxide (C02), methane (CH4), nitrous oxide (N20), hydrofluorocarbons
(HFCs), perfluorocarbons (PFCs), and sulphur hexafluoride (SF6).
• Trade in greenhouse gas emission permits
• Substitute C02 - emitting processes by C02 - <<free» ones (renewable energy,
nuclear energy, fuel cells).
• Avoid C02 - emitting processes where possible
• Improve energy efficiency
• Replace C02 - intensive processes by less C02-emitting ones.
CHAPTER4
METHODOLOGY
4.1 Characterization of the eva1uation mode1
For this investigation, the guideline that will be employed to quantify
Greenhouse Gasses of trucking freight transportation in the province of Quebec is
taken from the Recommendations and methodologies for mobile combustion: road
vehicles, from the Intergovemmental Panel on Climate Change (IPCC), as lU1ique
worldwide organization that provides this kind of information.
To evaluate gas ernissions, the Intergovemmental Panel on Climate Change
(IPCC) classifies an the sources of Greenhouse gas including the transportation
sector. In the transportation sector, the IPCC categorize: civil aviation, road
transports, railways, navigation and other transports, therefore, it is possible to
calculate greenhouse gas ernission for an sources of mobile combustion with the
exception of those associated with pipelines and aviation (IPCC, 1997).
The emissions of CO2 for road transports are best calculated on the basis of the
amolU1t and type of fuel combusted and its carbon content. However, CH4 emissions
and N20 are the most complicated to estimate accurately because ernission factors
depend on vehicle technology, fuel and operating characteristics.
40
4.2 Evaluation of emissions from road vehicles
The IPCC Guidelines estimate C02 emission from road vehicles, depending
on the sources of information available, also provides two kinds of
recommendations for this type of evaluations: the first one based on vehicle
kilometres travelled and the second one based on fuel consumption, all the
emissions in terms of CO2- equivalent (C02- eq) as a common unit.
4.2.1 Alternatives of evaluation
The first option - Tier 1, or <top down> approach ca1culates CO2emissions by
estimating fuel consumption in a common energy unit, multiplying by an ernission
factor to compute carbon content, computing the carbon stored, correcting for
unoxidised carbon and finally converting oxidised carbon to C02 emissions (IPCC,
1997). The approach is shown in the next equation:
Emissions= Ii[(EF x Fe) - es j ] x FO x ~~
Where:
EF = Emission factor
Fe =Fuel consumption
es =Carbon stores
FO =Fraction oxidized
j = fuel type
41
The second option - Tier 2, or <bottom-up> approach estimates CO2
emissions in two steps, the first step is to estimate fuel consumed by vehic1e type
and fuel type and the second step is to estimate total C02 emissions by multiplying
fuel consumption by an appropria te emission actor for the fuel type and vehic1e type
(IPCC, 2000). The approach is shown in the next equation:
Emissions =" (EF x Fe ) L...ij 1) 1)
Where:
i =Vehic1e type
j =Fuel type
4.2.2 Choice of method of evaluation
Emission can be estimated from either the fuel consumed (represented by
fuel sold) or the distance travelled by the vehic1e. The first approach (fuel sold) is
recommended for CO2 and the second (distance travelled by vehic1e type and road
type) is appropriate for CH4 and N20, also the IPCC recommends the Tier 1 (top
down) approach to ca1culate emissions on the basis of fuel consumption statistics
from a National Authority responsible of this information. But considering the
objective of this evaluation of GES, to evaluate the Origin - destination Matrix, and
the accessibility to information such distances travelled, theoretical fuel
consumption, distribution of emissions controIs in the fleet and Emission factors for
different pollution contraIs and the intention to avoid the use statistic data, the Tier 2
or "bottom-up" approach will be alternative employed for this quantification of
emissions from trucking freight transportation.
42
4.2.3 Methodological framework
The evaluation of emission for road vehicles proposed by the IPCC depends
on the sources of information available. In order to develop this evaluation and
considering the data sources available for this quantification, the next
methodological framework will be follow:
• Phase 1. To make use of the latest trucking freight transportation
examination for Quebec's province presented by the Ministère des
Transports du Québec (MTQ), which refers to the year 1.999, as our main
source of information. This examination contains the Origin - destination
matrix for this activity in Quebec's province and depicts the number of trucks
traveling between the administrative zones located within Quebec.
• Phase 2. To identify and classifying the roads network also to quantify in
terms of kilometres, each road used by the Quebec's trucking activity having
as reference the 1999 trucking examination. In this phase 2, having as a
reference the checking points used during the process of the 1999 trucking
survey, the geographical limits will be determinate in a form of
administrative areas in order to confines the scenario of evaluation and to
know the different cities implicated in this activity.
• Phase 3. Considering the information obtained from the previously phase,
(distances, trucks classification, type of fuel employed, rates of fuel
conswnption, and Canadian emission factors), aU this data will be evaluated
on the Reconunendations and methodologies for mobile combustion: road
vehicles - Tier 2, or «bottom-up» approach, proposed by the IPCC in order to
obtain result of emissions in terms of C02 eq.
43
• Phase 4. Having the total trucking freight transportation emission for the
year 1999, and considering the necessity to have a forecast of emission for
futures years, the concluding pollution number obtained from this
quantification in the categories implicated, will be affected by the annuals
variations (increasing or decreasing p~rcentages from 1990 - 2004) of
Creenhouse gas emission given by Environment Canada, afterwards by
means of correlations (lineat potentiat exponentiat polynomial and
logarithmical) and considering its Coefficient of Determination (R2), an
equation will be deduced to know the emission time series on the future
years.
4.3 Definition of the scenario of evaluation and concepts
Considering the necessity to name the scenario of evaluation for this
quantification of CHC, it will be referred as scenario « Q 80+ », that denote the
evaluation of emission in Quebec's province (Q) for trucking freight trips of at least
80 km (80+). This scenario « Q 80 + » will represent the emission trend for the
province considering the following features, parameters and variables.
4.3.1 Description method of evaluation - Tier 2 or 'bottom-up' approach
The analysis of quantification willlead on the Tier 2 or 'bottom-up' approach,
guided by the next expression:
Thus:
44
Ecal =the total emissions in a given vehicle category (C02 - eq.)
EFcal = the emission factor for the category (g / L fuel)
FCcal = the amount of fuel consumed in a given category (L/Km)
Thus FCcal
is defined as:
FCCal
= VPx ADT x FCRs
Where:
VP (Vehicle population) = Number of vehicles per category
ADT (Average Distance Traveled (Vkmt's) = Estimates for distances traveled by
each class of vehicle (Km)
FCRs (Fuel Consumption Ratio) = liters of fuel per kilometer (L/km)
To calculate final emissions, a specifie combination of emission factors for
CO2, CH4, and N20 are multiplied by the total fuel in each of the unique
consumption categories.
CH4 and N20 are then adjusted according to their specifie GWP «Global
Waming Potential» to convert their units to C02 - eq. (IPCC, 2000), being the final
expression:
EcaI(ij) = [EFc02 / EFcH4 / EFN20 x [(VP)(DT)(FCR)] x GWF(C02/CH4IN20)
i = Vehicle type (category)
j = Fuel type
45
VP =Vehicle Population
DT=Distance traveled
Emissions= Li L j (EF;j x FCil )
Where:
FCil = (T? x DT x FCR)
i = truck
j = fuel type
TP= Truck population
4.3.2 Distance trips
This analysis of quantification of emission for trucking freight transportation
only considers long distance trips. Considering the definition of long distance trip
given by the document "Le camionnage au Canada" from Statistics Canada, it refers
to a trip with a distance of at least 80 Km.
4.3.3 Origin - Destination matrix and Geographical area of analysis
The geographical area of study is defined by the Origin - Destination matrix,
which is a kind of information that came directly from soundings on the road
network of 17 admmistrative areas of Quebec1 also includes information such of
trucks movements to the United States l Ontario and Maritimes. The Origin
Destination matrix for the year 1.9991 offers as result 240.000 trucks trip were done
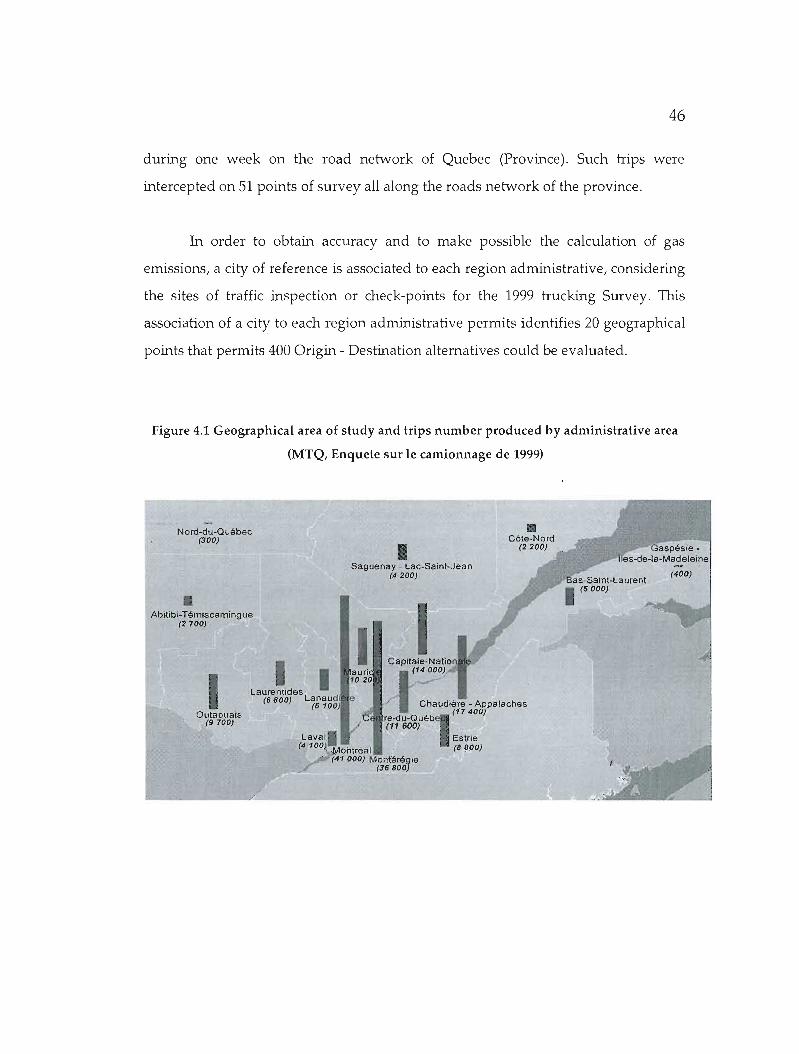
46
during one week on the road network of Quebec (Province). Such trips were
intercepted on 51 points of survey all along the roads network of the province.
In order to obtain accuracy and to make possible the ca1culation of gas
emissions, a city of reference is associated to each region administrative, considering
the sites of traffie inspection or check-points for the 1999 trucking Survey. This
association of a city to each region administrative permits identifies 20 geographieal
points that permits 400 Origin - Destination alternatives could be evaluated.
Figure 4.1 Geographical area of study and trips number produced by administrative area
(MTQ, Enquete sur le camionnage de 1999)
Nord-du-Ouébec (300) Cbte·Nord
(2200) Gaspésie· hes-de-la-Madeleine
Saguenay•- Lac-Saint-Jean
•(4200) (400)
Bas-Saint-Laurent1 (5000)•Abitibi-Témiscarningue (2700)
1 Capitale-Nation
(14000)
..".1 Chaudière - Appalaches (17400)Outaouais
(9 700) re'du-ouébl(11600)
Lallal Estrie (4 100 • ohtrèal' (8 ~!JO)
. (41 000) Montérégie (36800)
"--_~ ---"~~_'~'~iliaIii:/:':""'
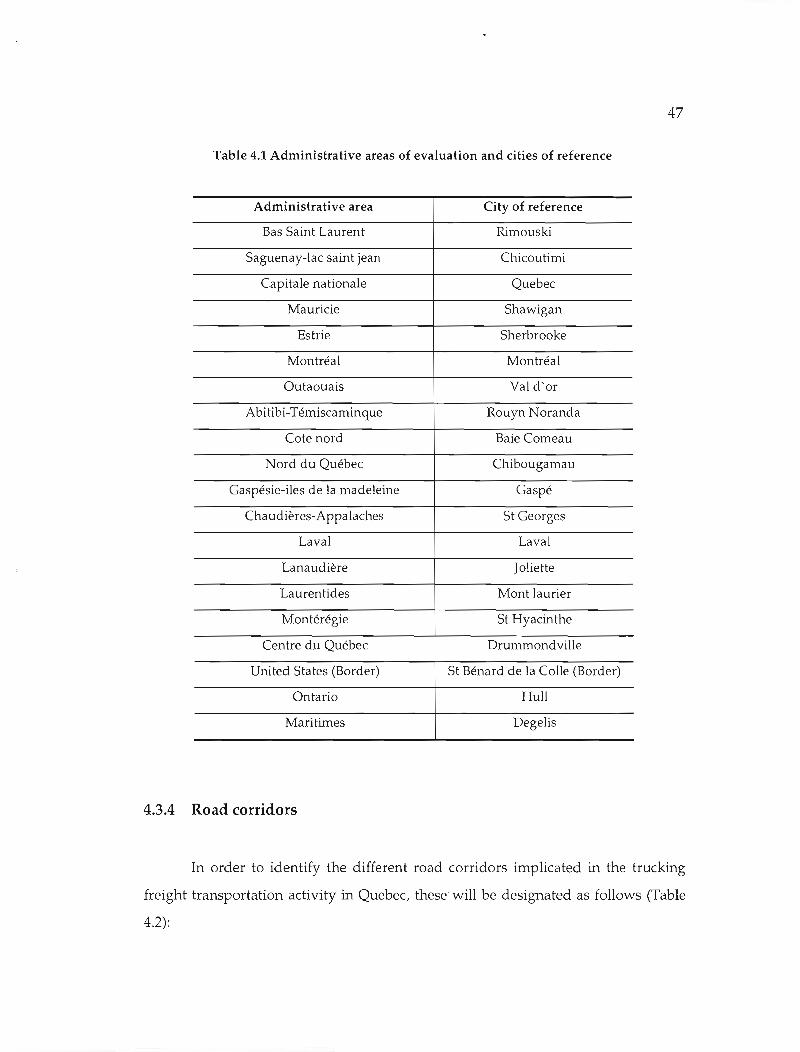
47
Table 4.1 Administrative areas of evaluation and cities of reference
Administrative area
Bas Saint Laurent
Saguenay-lac saint jean
Capitale nationale
Mauricie
Estrie
Montréal
Outaouais
Abitibi-Témiscaminque
Cote nord
Nord du Québec
Gaspésie-iles de la madeleine
Chaudières-Appalaches
Laval
Lanaudière
Laurentides
Montérégie
Centre du Québec
United States (Border)
Ontario
Maritimes
4.3.4 Road corridors
City of reference
Rimouski
Chicoutimi
Quebec
Shawigan
Sherbrooke
Montréal
Val d'or
Rouyn Noranda
Baie Comeau
Chibougamau
Gaspé
St Georges
Laval
Joliette
Mont laurier
St Hyacinthe
Drummondville
St Bénard de la Colle (Border)
Hull
Degelis
In order to identify the different road corridors implicated in the trucking
freight transportation activity in Quebect these will be designated as follows (Table
4.2):
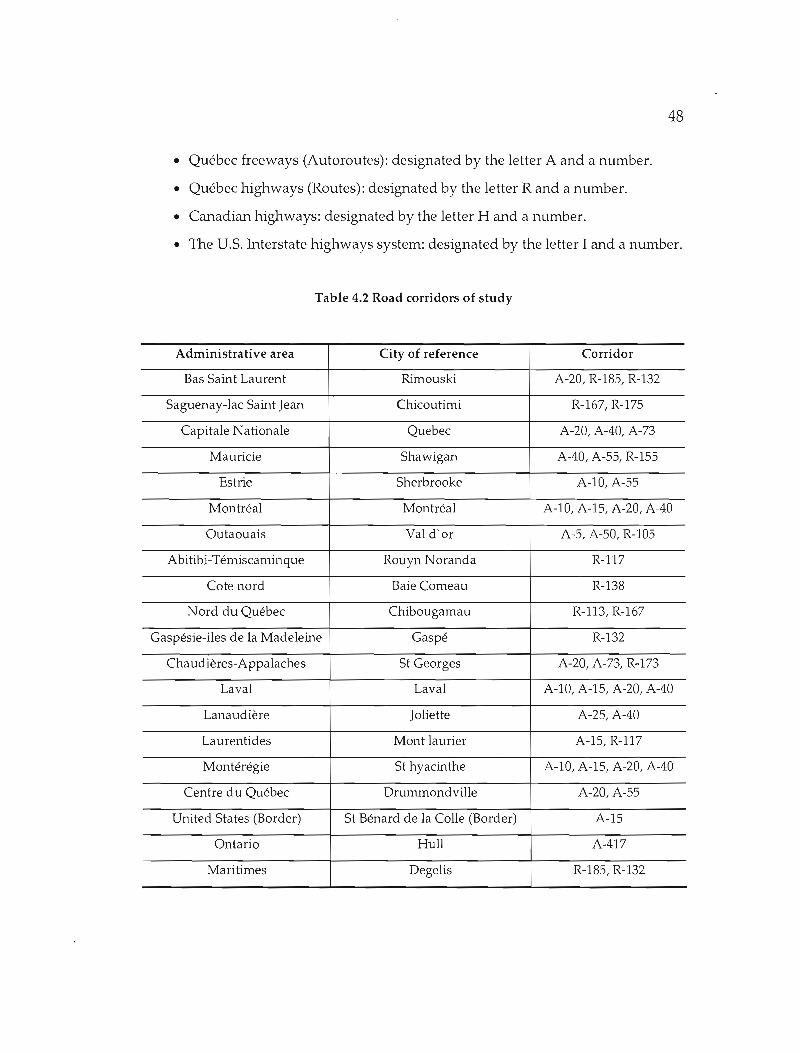
48
• Québec freeways (Autoroutes): designated by the letter A and a number.
• Québec highways (Routes): designated by the letter R and a number.
• Canadian highways: designated by the letter H and a number.
• The US Interstate highways system: designated by the letter 1and a number.
Table 4.2 Road corridors of study
Administrative area City of reference Corridor
Bas Saint Laurent Rimouski A-20, R-185, R-132
Saguenay-lac Saint Jean Chicoutimi R-167, R-175
Capitale Nationale Quebec A-20, A-40, A-73
Mauricie Shawigan A-40, A-55, R-155
Estrie Sherbrooke A-10, A-55
Montréal Montréal A-10, A-15, A-20, A-4O
Outaouais Val d'or A-5, A-50, R-105
Abitibi-Témiscaminque Rouyn Noranda R-117
Cote nord Baie Carneau R-138
Nord du Québec Chibougamau R-113, R-167
Gaspésie-iles de la Madeleine Gaspé R-132
Chaudières-Appalaches St Georges A-20, A-73, R-173
Laval Laval A-10, A-15, A-20, A-4O
Lanaudière Joliette A-25, A-4O
Laurentides Mont laurier A-15, R-117
Montérégie St hyacinthe A-10, A-15, A-20, A-4O
Centre du Québec Drummondville A-20, A-55
United States (Border) St Bénard de la Colle (Border) A-15
Ontario Hull A-4l7
Maritimes Degelis R-185, R-132
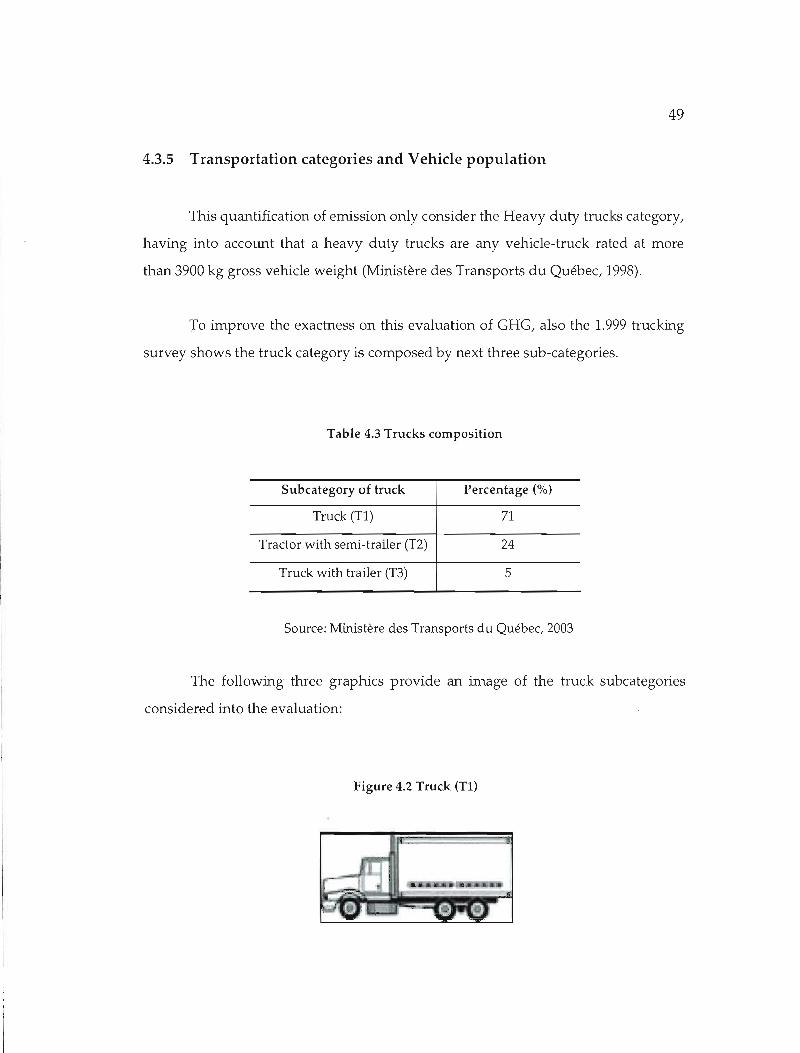
49
4.3.5 Transportation categories and Vehide population
This quantification of emission only consider the Heavy dutYtrucks category,
having into account that a heavy dutY trucks are any vehicle-truck rated at more
than 3900 kg gross vehic1e weight (Ministère des Transports du Québec, 1998).
To improve the exactness on this evaIuation of GHG, aiso the 1.999 trucking
survey shows the truck category is composed by next three sub-categories.
Table 4.3 Trucks composition
Subcategory of truck Percentage (%)
Truck (Tl) 71
Tractar with semi-trailer (T2) 24
Truck with trailer (T3) 5
Source: Ministère des Transports du Québec, 2003
The following three graphics provide an image of the truck subcategories
considered into the evaIuation:
Figure 4.2 Truck (Tl)
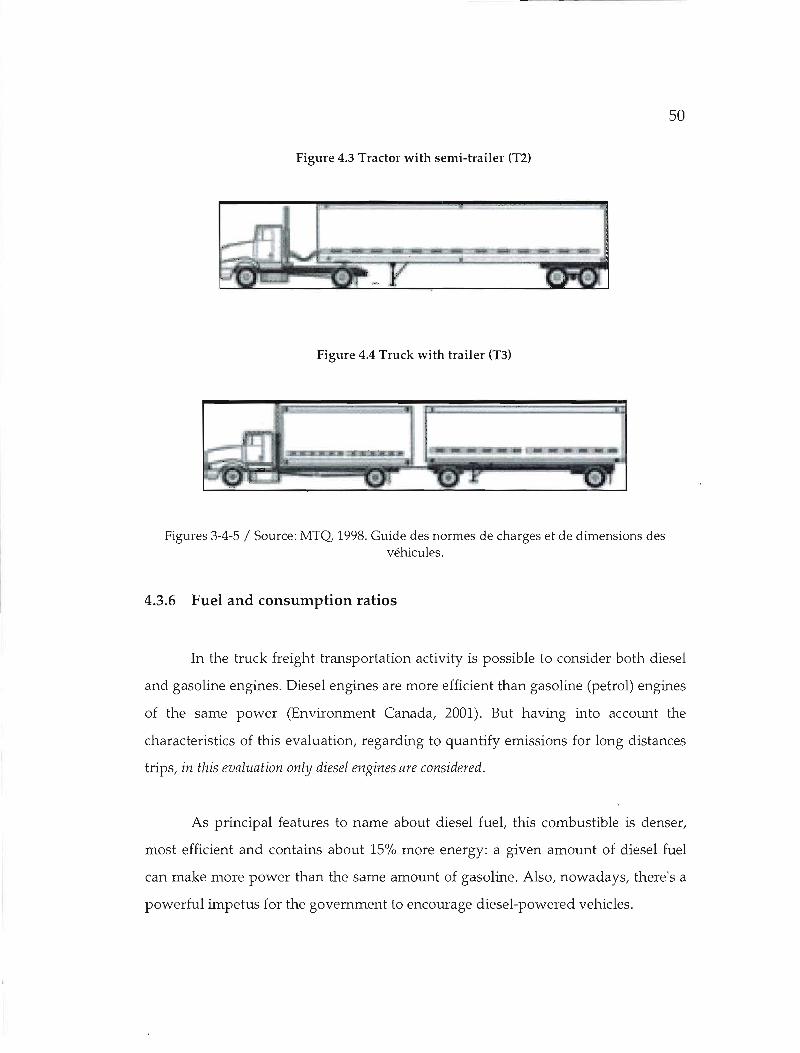
50
Figure 4.3 Tractor with semi-trailer (T2)
Figure 4.4 Truck with trailer (T3)
Figures 3-4-5 / Source: MTQ, 1998. Guide des normes de charges et de dimensions des véhicules.
4.3.6 Fuel and consumption ratios
In the truck freight transportation activity is possible to consider both diesel
and gasoline engines. Diesel engines are more efficient than gasoline (petrol) engines
of the same power (Environment Canada, 2001). But having into account the
characteristics of this evaluation, regarding to quantify emissions for long distances
trips, in this evaluation only diesel engines are considered.
As principal features to name about diesel fuel, this combustible is denser,
most efficient and contains about 15% more energy: a given amount of diesel fuel
can make more power than the same amount of gasoline. AIso, nowadays, there's a
powerful impetus for the govemment ta encourage diesel-powered vehic1es.
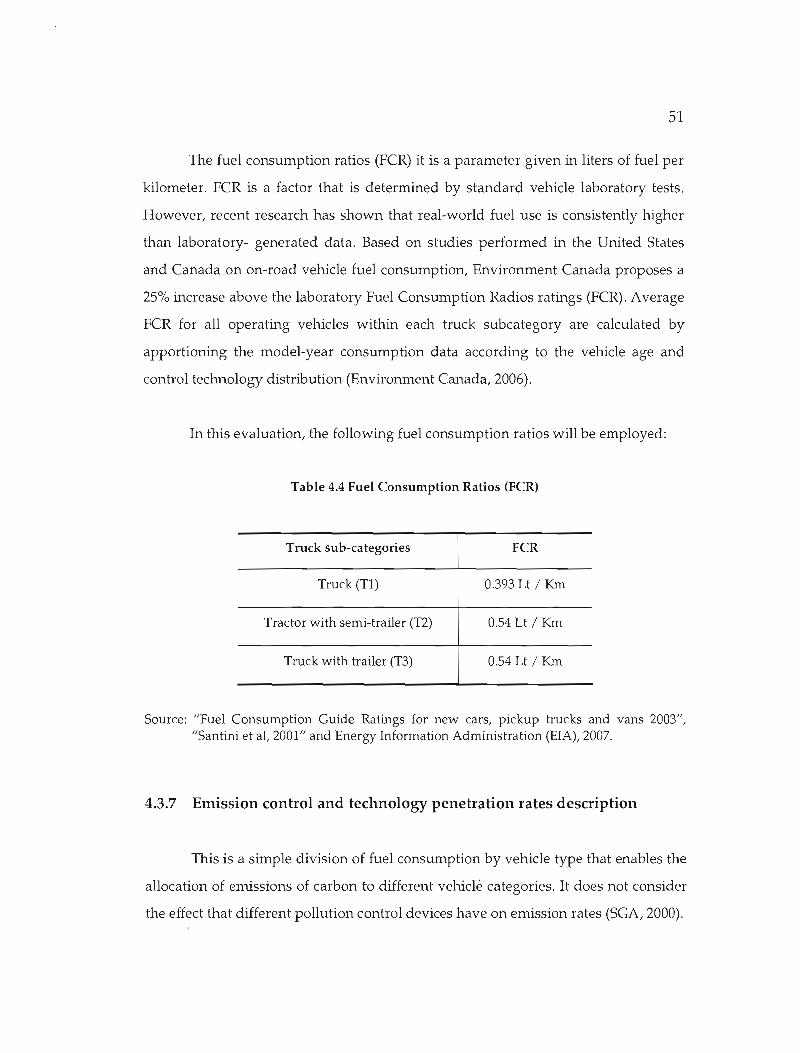
51
The fuel consumption ratios (FCR) it is a parameter given in liters of fuel per
kilometer. FCR is a factor that is determined by standard vehic1e laboratory tests.
However, recent research has shown that real-world fuel use is consistently higher
than laboratory- generated data. Based on studies performed in the United States
and Canada on on-road vehic1e fuel consumption, Environment Canada proposes a
25% increase above the laboratory Fuel Consumption Radios ratings (FCR). Average
FCR for aIl operating vehic1es within each truck subcategory are calculated by
apportioning the model-year consumption data according to the vehic1e age and
control technology distribution (Environment Canada, 2006).
In this evaluation, the following fuel consumption ratios will be employed:
Table 4.4 Fuel Consumption Ratios (FCR)
Truck sub-categories FCR
Truck (Tl) 0.393 Lt / Km
Tractor with semi-trailer (T2) 0.54 Lt / Km
Truck with trailer (T3) 0.54 Lt / Km
Source: "Fuel Consumption Guide Ratings for new cars, pickup trucks and vans 2003", "Santini et al, 2001" and Energy Information Administration (ElA), 2007.
4.3.7 Emission control and technology penetration rates description
This is a simple division of fuel consumption by vehicle type that enables the
allocation of ernissions of carbon to different vehiclé categories. It does not consider
the effect that different pollution control devices have on emission rates (SCA, 2000).
52
To procure accuracy on the input data is important to consider the next
information to select the appropriate emission factor (SGA, 2000):
Trucks without emission controls were the norm in Canada in the 1960s.
Non-catalyst-controlled vehicles were brought into the market in the late 1960s.
Emission control technology on these included modifications to ignition timing and
air-fuel ratios, exhaust gas recirculation, and air injection into the exhaust manifold.
Oxidation (two-way) catalytic converters were first used on Canadian vehicles
introduced in 1975, and their use continued on production vehicles until the 1987
model year. These so-called two-way converters oxidized hydrocarbons.
The three-way (oxidation-reduction) catalytic emission control technology
was introduced in Canada in 1980. Typical ancillary equipment included carburetors
with simple electronic ignition. Later, for the 1984 model year, a portion of the fleet
was equipped with electronic computer-controlled fuel injection, which became an
integral part of the emission control system. By 1990, such computer systems were
standard equipment on aIl gasoline vehicles.
The broad category of control technologies produced from the time three
way catalytic converters were introduced up until 1993 has become known in North
America as Tier 0 emission control. Tier 0 catalytic converter technology is further
subdivided into "new" and "aged" types. The "new" subcategory representing units
less than a year old. Tier l, (a more advanced emission control technology), was
introduced to North American Light DutYGasoline Vehicles in 1994. It consists of an
improved three-way ~atalytic converter under more sophisticated computer control
vehicle. (Environment Canada, 2006).
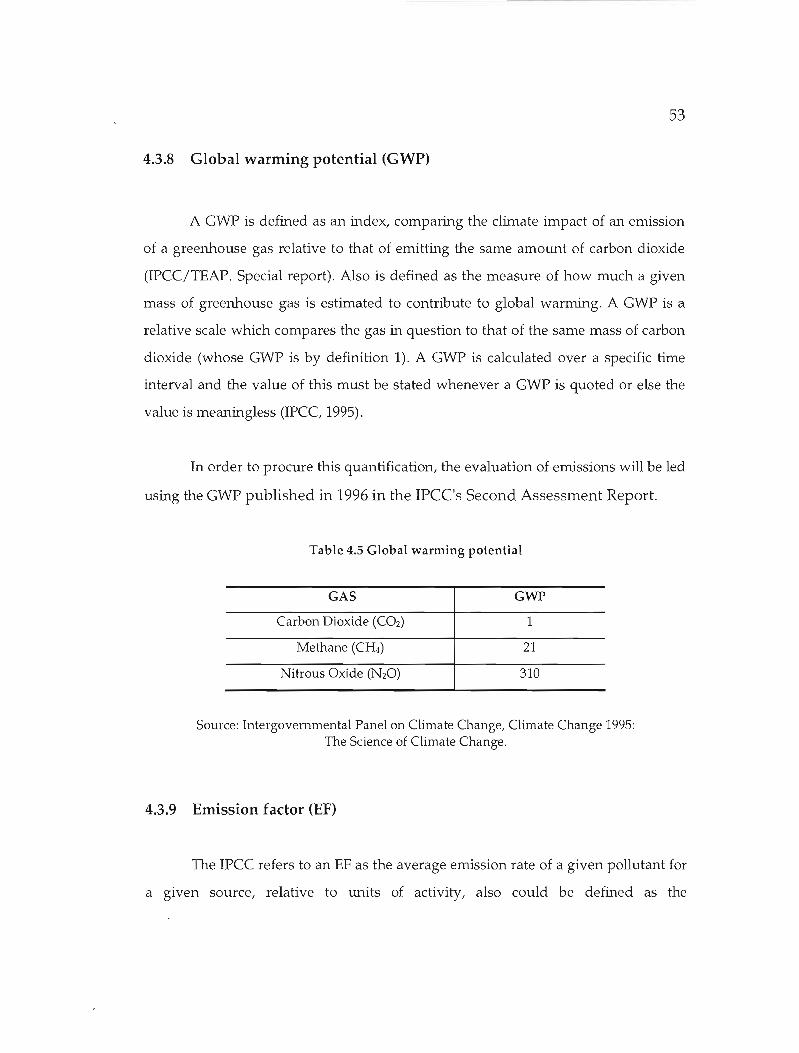
53
4.3.8 Global warming potential (GWP)
A GWP is defined as an index, comparing the climate impact of an emission
of a greenhouse gas relative to that of emitting the same amount of carbon dioxide
(IPCC/TEAP. Special report). Also is dehned as the measure of how much a given
mass of greenhouse gas is estimated to contribute to global warming. A GWP is a
relative scale which compares the gas in question to that of the same mass of carbon
dioxide (whose GWP is by definition 1). A GWP is ca1culated over a specifie time
interval and the value of this must be stated whenever a GWP is quoted or else the
value is meaningless (lPCC, 1995).
In order to procure this quantification, the evaluation of emissions will be led
using the GWP published in 1996 in the IPCC's Second Assessment Report.
Table 4.5 Global warming potential
GAS GWP
Carbon Dioxide (C02) 1
Methane (CfiJ) 21
Nitrous Oxide (N20) 310
Source: Intergovemmental Panel on C1imate Change, C1imate Change 1995: The Science of Climate Change.
4.3.9 Emission factor (EF)
The IPCC refers to an EF as the average emission rate of a given pollutant for
a given source, relative to units of activity, also could be defined as the
54
representative value that attempts to relate the quantity of a pollutant released to the
atmosphere with an activity associated with the release of that pollutant.
The EF can be used to derive estimates of gas emissions based on the amotmt
of fuel. The level of precision of the resulting estimates depends significantly on the
activity in question.
C02 emissions from the combustion of fuel can be" estimated with a high
degree of certainty regardless of how the fuel is used, as these emissions depend
almost exdusively on the carbon content of the fuel, which is generally known with
a high degree of certainty. In contrast, the levels of non-C02 emissions from
combustion depend on the precise nature of the activity in which the fuel is being
combusted. For instance, methane emissions from transport depend on a vehicle's
type, whether the vehicle has been fitted with emissions controls and so on.
Therefore, because of the tmcertainties involved, the estimates of non-C02 emissions
from transport using emission factors are much less precise than estimates of CO2
emissions (SGA, 2000).
The EFs are fuel dependent, whereas CH4 and N20 emission factors are
highly dependent upon the specifie pollution control devices on each vehicle. EF
associated with these gases varies with vehicle type. AIso, fuel combustion CO2
emissions depend upon the amotmt of fuel consumed, the carbon content of the fuel,
and the fraction of the fuel oxidized. The EF employed to estimate GHG emissions
are subdivided by the type of fuel used and technology employed. The methods
used to derive the factors are based on the carbon contents of the fuels and the
typical fraction of carbon oxidized. Both the hydrocarbons and particulate formed
during combustion are accotmted for to some extent, but emissions of CO are
included in the estimates of C02 emissions. It is assumed that CO in the atmosphere
55
undergoes complete oxidation to C02 shortly after combustion (within 5-20 weeks of
its release). (BPAI 1996).
In order to procure the evaluationl the following Emission factors will be
used l considering the truck category and the fuel employed:
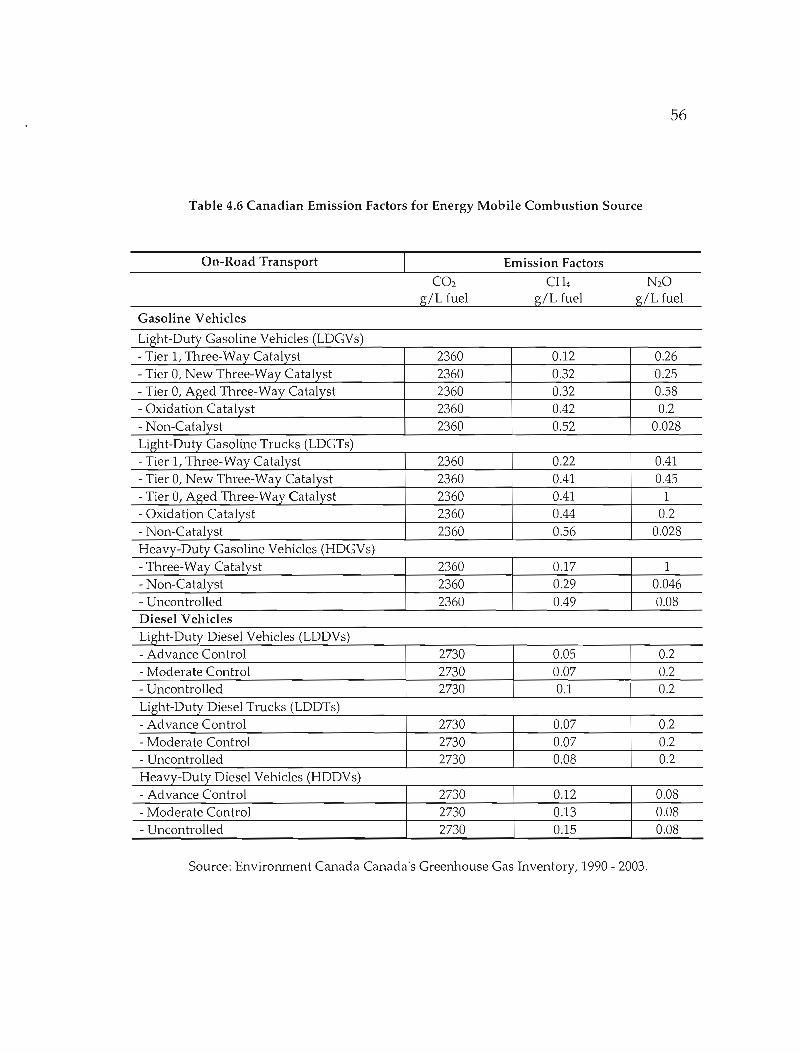
56
Table 4.6 Canadian Emission Factors for Energy Mobile Combustion Source
On-Road Transport
Gasoline Vehicles
Light-Duty Gasaline Vehicles (LDGVs) - Tier l, Three-Way Catalyst - Tier 0, New Three-Way Catalyst - Tier 0, Aged Three-Way Catalyst - Oxidation Catalyst - Non-Catalyst L·IgJh t-DutYGasa1"me Trueks (LDGT)s - Tier l, Three-Way Catalyst - Tier 0, New Three-Way Catalyst - Tier 0, Aged Three-Way Catalyst - Oxidation Catalyst - Non-Catalyst H DutYG 1" e (HDGV)seavy- aso Ille V h· 1 le es - Three-Way Catalyst - Non-Catalyst - Uneontrolled Diesel Vehicles L·19lht- DutYD·lese1V h· 1 e le es (LDDV)s - Advance Control - Moderate Control - Uneontrolled Light-Duty Diesel Trucks (LDDTs) - Advance Control - Moderate Control - Uneontrolled Heavy-Duty Diesel Vehicles (HDDVs) - Advance Control - Moderate Control - Uneontrolled
CO2
g/L fuel
2360 2360 2360 2360 2360
2360 2360 2360 2360 2360
2360 2360 2360
2730 2730 2730
2730 2730 2730
2730 2730 2730
Emission Factors
CH4
g/L fuel
0.12 0.32 0.32 0.42 0.52
0.22 0.41 0.41 0.44 0.56
0.17 0.29 0.49
0.05 0.07 0.1
0.07 0.07 0.08
0.12 0.13 0.15
0.26 0.25 0.58 0.2
0.028
0.41 0.45
1 0.2
0.028
1 0.046 0.08
0.2 0.2 0.2
0.2 0.2 0.2
0.08 0.08 0.08
Source: Environment Canada Canada's Greenhouse Gas Inventory, 1990 - 2003.
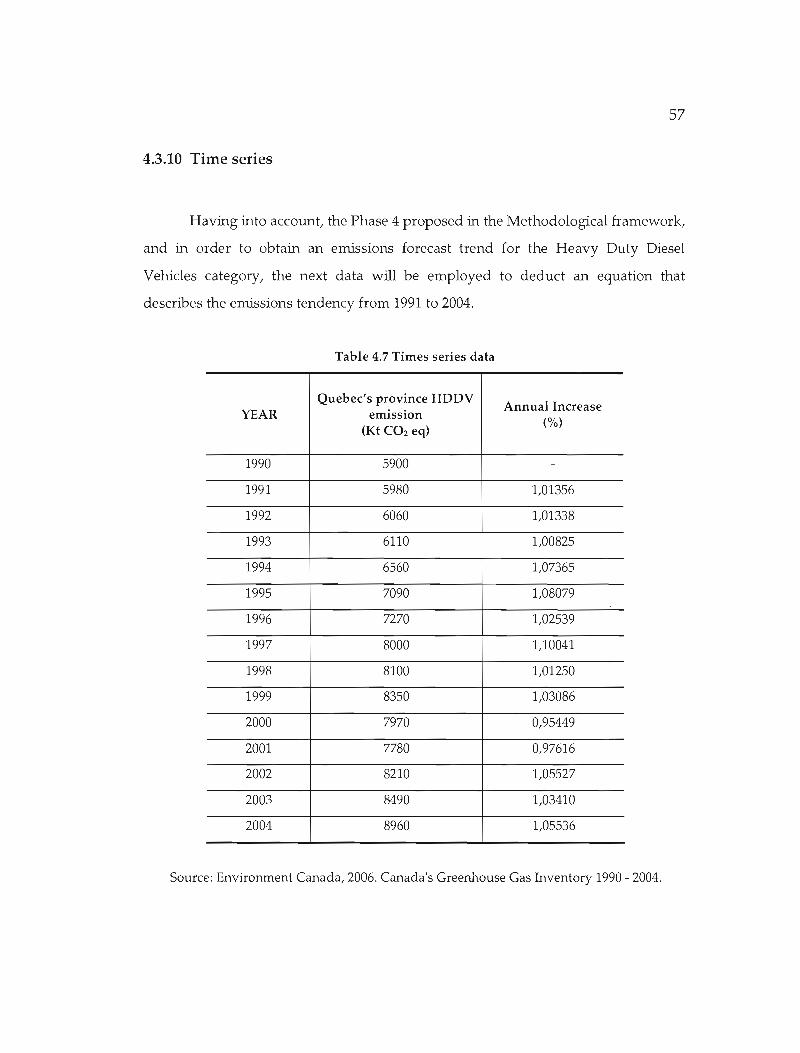
57
4.3.10 Time series
Having into accoW1tl the Phase 4 proposed in the Methodological framework l
and in order to obtain an emissions forecast trend for the Heavy DutY Diesel
Vehicles categorYI the next data will be employed to deduct an equation that
describes the emissions tendency trom 1991 to 2004.
Table 4.7 Times series data
Quebec's province HDDV Annual Increase
YEAR emission (%)(Kt COz eq)
1990 5900
1991 5980 1,01356
1992 6060 1,01338
1993 6110 1,00825
1994 6560 1,07365
1995 7090 1,08079
1996 7270 1,02539
1997 8000 1,10041
1998 8100 1,01250
1999 8350 1/03086
2000 7970 0,95449
2001 7780 0,97616
2002 8210 1,05527
2003 8490 1,03410
2004 8960 1,05536
Source: Environment Canada, 2006. Canada's Greenhouse Gas Inventory 1990 - 2004.
CHAPTERS
RESULTS AND DISCUSSIONS
5.1 Results for the Scenario «Q-80+» (Year 1999)
As result of this evaluation made in order to quantify Greenhouse Gas
emission products of the Truck freight transportation activity in Quebec's province
and considering the methodological framework (section 4.2.3), the parameters and
variables taking into account for the scenario of evaluation «Q-80+» (section 4.3), the
final result of gas emission obtained for the year 1.999 is 4790, 72 Ktn CO2 - eq.
In order to understand the results obtained from this evaluation, the
following tables depict the result of Greenhouse emissions for the scenario «Q-80+»
and the comparisons against the information given by Environment Canada for the
province of Quebec and Canada.
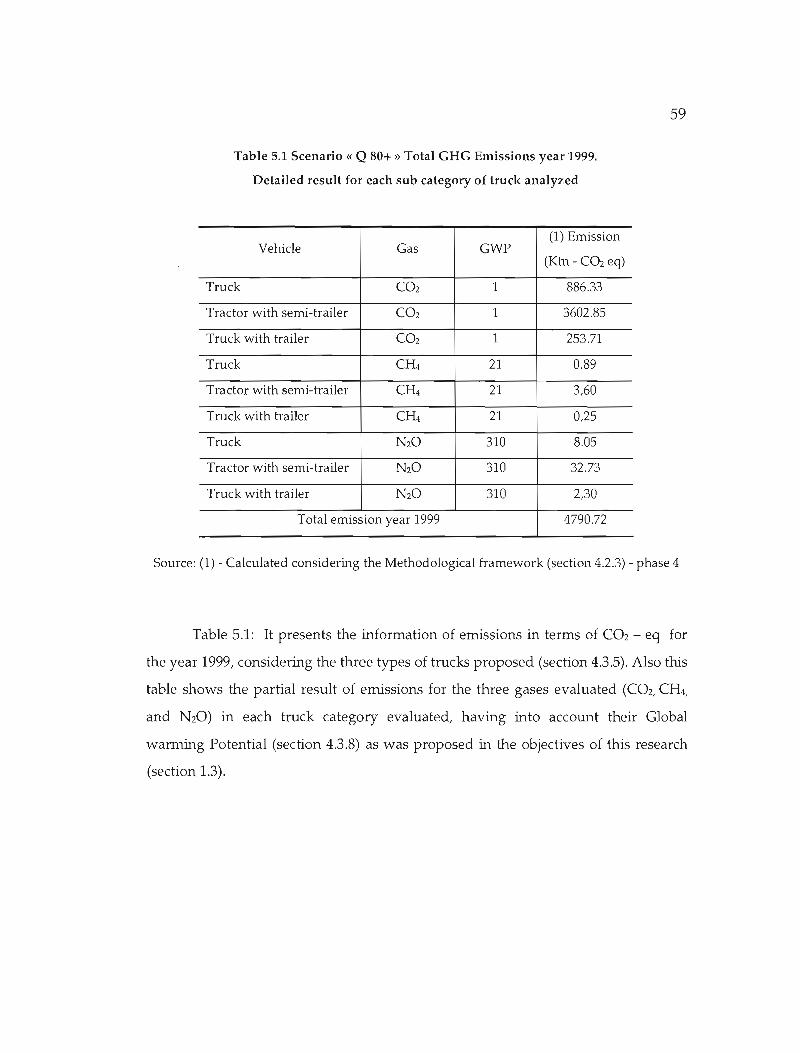
59
Table 5.1 Scenario « Q 80+» Total GHG Emissions year 1999.
Detailed result for each sub category of truck analyzed
(1) Emission Vehicle Gas GWP
(Ktn - C02 eq)
Truck C02 1 886.33
Tractor with semi-trailer C02 1 3602.85
Truck with trailer C02 1 253.71
Truck CH4 21 0.89
Tractor with semi-trailer CH4 21 3,60
Truck with trailer CH4 21 0,25
Truck N20 310 8.05
Tractor with semi-trailer N20 310 32.73
Truck with trailer N20 310 2,30
Total emission year 1999 4790.72
Source: (1) - Calculated considering the Methodological framework (section 4.2.3) - phase 4
Table 5.1: It presents the information of emissions in terms of CO2 - eq for
the year 1999, considering the three types of trucks proposed (section 4.3.5). Also this
table shows the partial result of emissions for the three gases evaluated (C02, CH4,
and N20) in each truck category evaluated, having into accoWLt their Global
warming Potential (section 4.3.8) as was proposed in the objectives of this research
(section 1.3).
60
5.2 Quantification of emissions for the Scenario «Q-80+» from
1999 to 2004
Considering the Phase 4 proposed in the methodological framework (section
4.2.3), the result of GHG emission for the year 1999 (Table 5.1) for the scenario «Q
80+» is affected by the annual percentages of variation (increases and decreases)
calculated from the evaluation made by Environment Canada between 1.990 to 2.004
(Table 4.7) for the Heavy DutY Diesel Vehicles (HDDV) category for the Quebec's
province. This procedure is made in order to obtain a graphie on annual basis of
emission that represents of our scenario of evaluation «Q-80+».
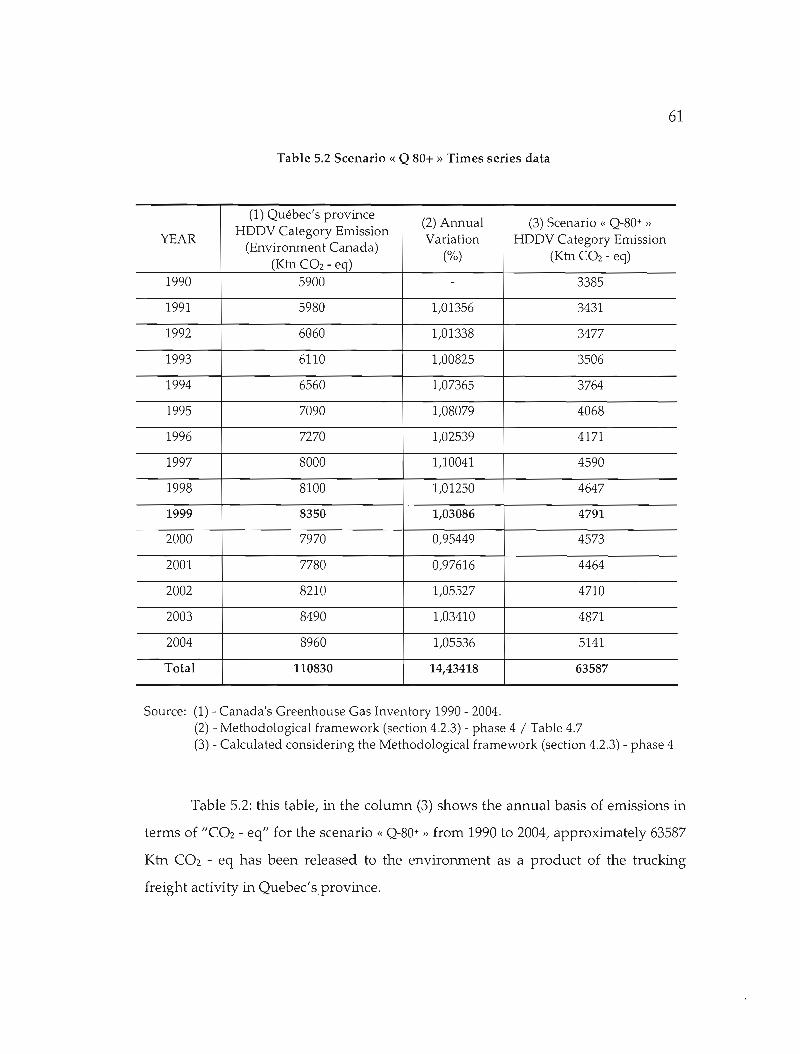
61
Table 5.2 Scenario « Q 80+ » Times series data
(1) Québec's province HDDV Category Emission
YEAR (Environment Canada)
(Ktn C02 - eq) 1990 5900
1991 5980
1992 6060
1993 6110
1994 6560
1995 7090
1996 7270
1997 8000
1998 8100
1999 8350
2000 7970
2001 7780
2002 8210
2003 8490
2004 8960
Total 110830
(2) Annual Variation
(%)
-
1,01356
1,01338
1,00825
1,07365
1,08079
1,02539
1,10041
1,01250
1,03086
0,95449
0,97616
1,05527
1,03410
1,05536
14,43418
(3) Scenario « Q-80+ »
HDDV Category Emission (Ktn CO2- eq)
3385
3431
3477
3506
3764
4068
4171
4590
4647
4791
4573
4464
4710
4871
5141
63587
Source: (1) - Canada's Greenhouse Gas Inventory 1990 - 2004. (2) - Methodological framework (section 4.2.3) - phase 4 / Table 4.7 (3) - Calculated considering the Methodological framework (section 4.2.3) - phase 4
Table 5.2: this table, in the colunm (3) shows the annual basis of emissions in
terms of "C02 - eq" for the scenario « Q-80+ » from 1990 ta 2004, approximately 63587
Ktn CO2 - eq has been released ta the environment as a product of the trucking
freight activity in Quebec'sprovince.
62
AIso, this table in the column (2) shows the anrmal variation in terms of
percentage (%) having an accumulative annual variation in the same horizon (1990
to 2004) of 14, 43% (approximately 1% per year).
5.3 Graphie representation Scenario «Q-8ü+»
Taking into account the annual emissions results deducted for the scenario
«Q-80+» fram 1.990 to 2.004, and considering the phase 4 of the methodological
framework(section 4.2.3) and looking for an equation that not only represents the
emission tendency but also it will depict future emission, five types of correlations
were evaluated (Lineal, Potential, Logarithmical, Polynomial and Exponential).
These equations were analyzed considering its coefficient of determination (R2) in
order to select the equation that represents with more accuracy the emission
tendency.
The Coefficients of Determination (R2) in a regression analysis indicate a
measure of correlation between the dependent and independent variables (year /
emissions). A higher value for this coefficient (whose range is between 0 -1), means
the information analyzed into a specifie correlation got a better fit.
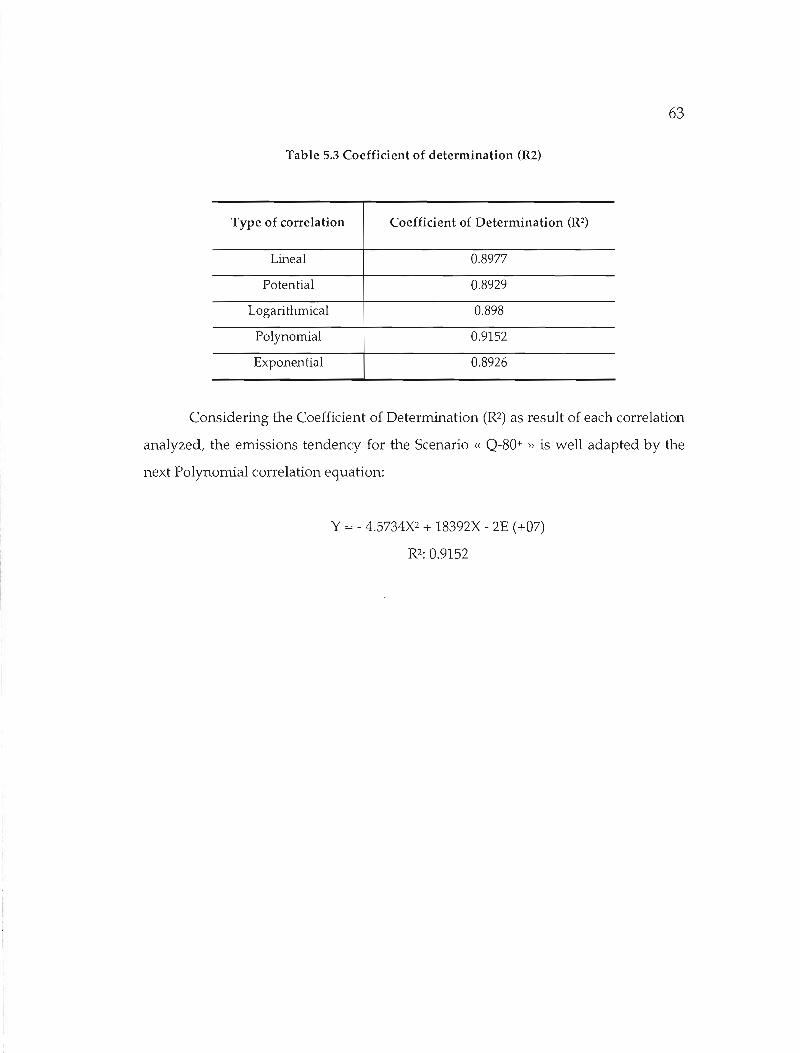
63
Table 5.3 Coefficient of determination (R2)
Type of correlation Coefficient of Determination (R2)
Lineal 0.8977
Potential 0.8929
Logari thmical 0.898
Polynomial 0.9152
Exponen tial 0.8926
Considering the Coefficient of Determination (R2) as result of each correlation
analyzed, the emissions tendency for the Scenario « Q-SO+ » is weIl adapted by the
next Polynomial correlation equation:
y = - 4.5734X2 + 18392X - 2E (+07)
R2: 0.9152
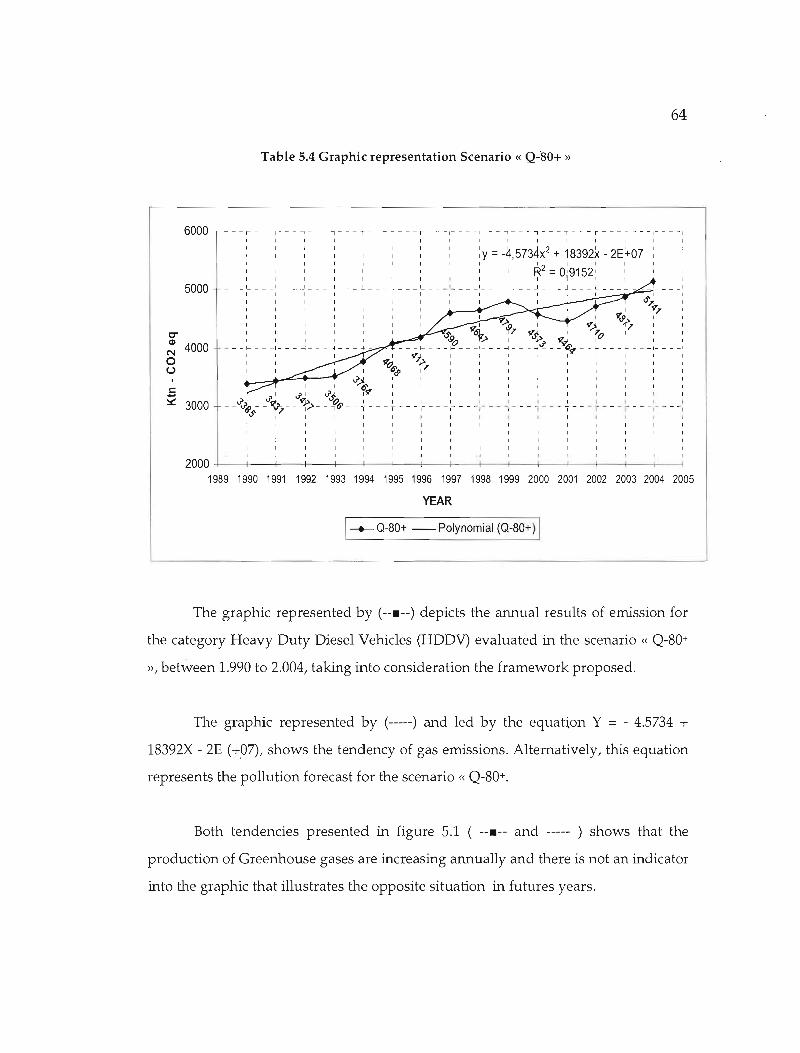
64
Table 5.4 Graphie representation Scenario « Q-'so+ »
6000 1- --~ --T--;---r--1- --f - - - ~ - -T---;~ -=- -r~7~]:2-: ~~;9~[ ~ ~~~~; T--1 1 1 1 1 1 1 1 1 1 1 1 1 1 1
, , , , , , , , , , R2 = 0'9152' , , 1 1 J 1 1 1 1 1 1 lit 1 1 1
5000 - - - '- - - -'- - - -' - - - -' - - - 1. - - - L L , , , -' l L L _
: : : : : : : : 1 1 : 1 1 ~; 1 1 1 1 1 1 1 v? 1 1 1 1 1 1 l 'fT 1
1 1 1 1 1 1 1 1 ~o 1 l , 1 r 1 1 ~ 9"61- T? 9:'1 10- , " , :90 -Y,> , S''>u' 9'ç'.' "
Ol 4000 - - - 1- - - - 1- - - -1- - - -l - - - -l - - - 6'"" - ~ 1- - - - ~ - - - 1- - - -,N 9"1 1 1 1 1 1 1 1 o U ~7 1: :::::
L_.....~-+-,-~, ~,,;L~ 1 1 1 1 :1 : 1 1 1 1
.5 , "'- ' u',i ,9' , , , , , , 1 l , 1 1
~ 3000 - _u'Jc9,j'- -"'~- - ~,>- - f6' - -.; --- ~ -- -:- -- -:- - --:- -- -:- - - ~ - - - -r - - - ~ - - - 1- - - -:- - --: 1 1 1 1 1 ., 1 1 1 1 1 1 1 1 1
1 1 1 1 1 1 1 1 1 1 1 1
1 1 1 1 1 1 1 1 1 1 1 1
t l '1 1 1 1 1 1 1
1 1 1 1 1 1 1 1 1
1 1 1 1 1 1 1 1
2000 11
1989 1990 1991 1992 1993 1994 1995 1996 1997 1998 1999 2000 2001 2002 2003 2004 2005
YEAR
I-+- 0-80+ -- Polynomial (0-80+) 1
The graphie represented by (--.--) depicts the armual results of emission for
the category Heavy DutY Diesel Vehicles (HDDV) evaluated in the scenario « Q-SO+
», between 1.990 to 2.004, taking into consideration the framework proposed.
The graphie represented by (-----) and led by the equahon y = - 4.5734 +
lS392X - 2E (+07), shows the tendency of gas emissions. Altematively, this equation
represents the pollution forecast for the scenario « Q-SO+.
Both tendencies presented in figure 5.1 ( --.-- and ----- ) shows that the
production of Greenhouse gases are increasing annually and there is not an indicator
into the graphie that illustrates the opposite situation in futures years.
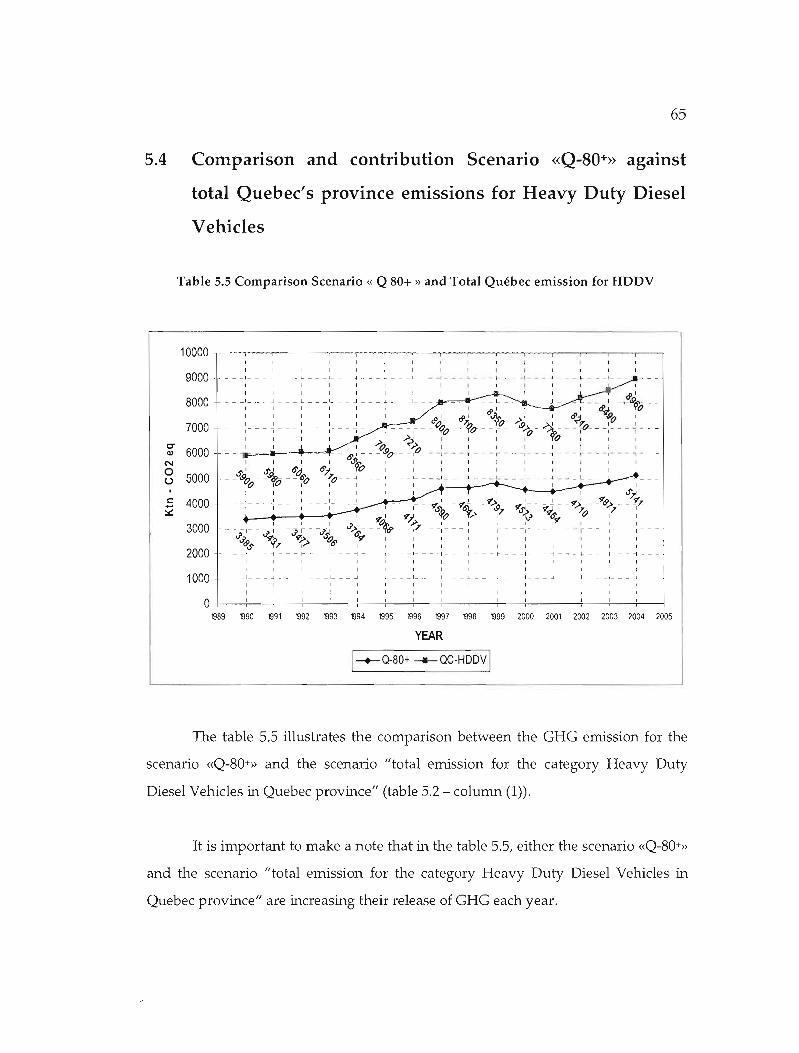
65
5.4 Comparison and contribution Scenario «Q-8D+» against
total Quebec's province emissions for Heavy Duty Diesel
Vehicles
Table 5.5 Cornparison Scenario « Q 80+ » and Total Québec ernission for HDDV
10000
9000 u;m~m:m,-~0-:m-:m;--'u ::u_~m:u>l-___ I J L I J L I L__ _ l __ '-~~--8000
: : : : : : ' &.: d': d'oi~' , d'J d'i.9o ,'0 7000 ---:- --: ---: ---:- -- ~ --~: --~- --~- -"ft7 --(- _.9~ - /~; - - ~ - -:- - - : - -
0al 6000 __ ~I -~~---qpo---~---:---:.--.J ---r---,---r --:
N 1 1 1 1 ~ 1 1 1 1 1 1 1 1 1
s: 1 s: ' 6'0 6'1 '1'0 , , , , , , , , ,0 u 5000 - - :9~ - -~o - - ~o-- - -~- - ~ - - - ~ - - - ~ - - _1_ - - J. - - - L - - _1_ - - ~ - - - L - - - - 1
1 1 1 1 1 1 1 l.s~ c: 4000 ------~ ---~ ------~ --~: --;;--~~ -~ot; -~7- -~~ - 9'~; -~1o- -~O'~ - - ?-~
3000 ---,- -- ~ --" ~ - -.r.:- - .r~_ - -~ - -~)'- - -:- - - ~ - - - ~ - - -:- - - ~ - - - ~ - - -:- - - ~ - - 9
2000 tJ~.s ~9'fl' 9'.;>,> ~r(f 1 : : : : : : : : 1 :
- - -1- - - -t - - - t- - - -1- - - -i - - - ,.. - - -1- - - -1- - - + - - - t- - - -1- - - -t - - - +- - - -1- - - -i - - 1 1 1 1 1 1 1 1 1 1 1 1
1 1 1 1 1 1 1 1 1 1 1 1 1 ___ 1 ...J L 1 .J L 1 1 .l • 1 .J L 1 ..J _1000
1 1 1 1 1 1 1 1 1 1 1
1 1 1 1 1 1 1 1 1 1 1
o+--...,'c__-;.-'--i-'--r.-'----;.-'--i-'--;-'--i-'--i-'--;----T'-~c__-_r'--i---c__--i
'e89 'e90 'e91 'e92 'e93 'e94 'e95 'e96 'e97 'e98 'e99 2000 2001 2002 2003 2004 2005
YEAR
,-+-0-80+ --- OC-HDDV 1
The table 5.5 illustrates the comparison between the CHC emission for the
scenario «Q-80+» and the scenario IItotal emission for the category Heavy Duty
Diesel Vehic1es in Quebec province ll (table 5.2 - column (1)).
It is important to make a note that in the table 5.5, either the scenario «Q-80+»
and the scenario IItotal emission for the category Heavy Duty Diesel Vehic1es m
Quebec province" are increasing their release of CHG each year.
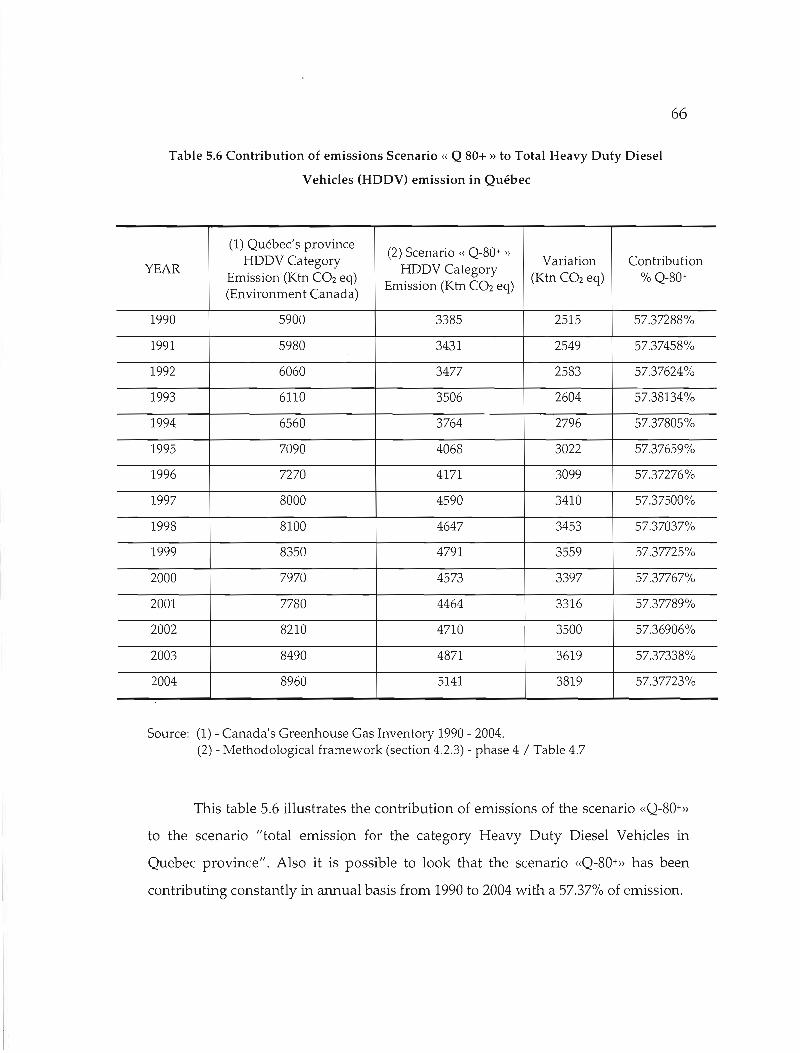
66
Table 5.6 Contribution of emissions Scenario « Q 80+ » to Total Heavy DutYDiesel
Vehicles (HDDV) emission in Québec
YEAR
(1) Québec's province HDDV Category
Emission (Km CO2 eq) (Environment Canada)
(2) Scenario « Q-80+ »
HDDV Ca tegory Emission (Km C02 eq)
Variation (Km C02 eq)
Contribu tion % Q-80+
1990 5900 3385 2515 57.37288%
1991 5980 3431 2549 57.37458%
1992 6060 3477 2583 57.37624%
1993 6110 3506 2604 57.38134%
1994 6560 3764 2796 57.37805%
1995 7090 4068 3022 57.37659%
1996 7270 4171 3099 57.37276%
1997 8000 4590 3410 57.37500%
1998 8100 4647 3453 57.37037%
1999 8350 4791 3559 57.37725%
2000 7970 4573 3397 57.37767%
2001 7780 4464 3316 57.37789%
2002 8210 4710 3500 57.36906%
2003 8490 4871 3619 57.37338%
2004 8960 5141 3819 57.37723%
Source: (1) - Canada's Greenhouse Gas Inventory 1990 - 2004. (2) - Methodological framework (section 4.2.3) - phase 4 / Table 4.7
This table 5.6 illustrates the contribution of ernissions of the scenario «Q-SO+»
to the scenario "total emission for the category Heavy DutY Diesel Vehic1es in
Quebec province". Also it is possible to look that the scenario «Q-SO+» has been
contributing constantly in ammal basis from 1990 to 2004 with a 57.37% of emission.
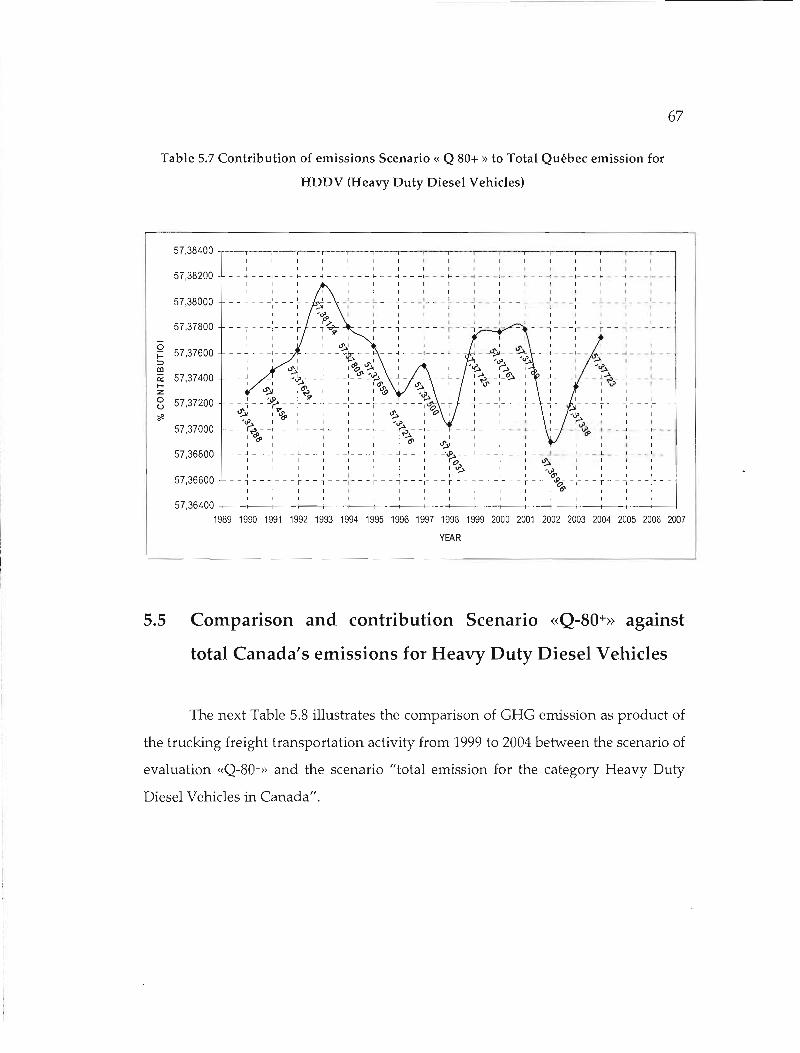
67
Table 5.7 Contribution of emissions Scenario « Q 80+ » to Total Québec emission for
HDDV (Heavy Duty Diesel Vehicles)
57,38400
57,38200
57,38000
57,37800
Q 1- 57,37600 ::> al a: 57.37400 1z 0 57,37200u <t
57,37000
57,36800
57,36600
57 ,36400 +-__~---+--__-+-----t-----+---+--+--_-__-+-------t----+---+--+----r-------i
1989 1990 1991 1992 1993 1994 1995 1996 1997 1998 1999 2000 2001 2002 2003 2004 2005 2006 2007
YEAR
5.5 Comparison and contribution Scenario «Q-8ü+» against
total Canada's emissions for Heavy DutYDiesel Vehicles
The next Table 5.8 illustrates the comparison of CHC emission as product of
the trucking freight transportation activity from 1999 to 2004 between the scenario of
evaluation «Q-80+» and the scenario "total emission for the category Heavy DutY
Diesel Vehic1es in Canada".
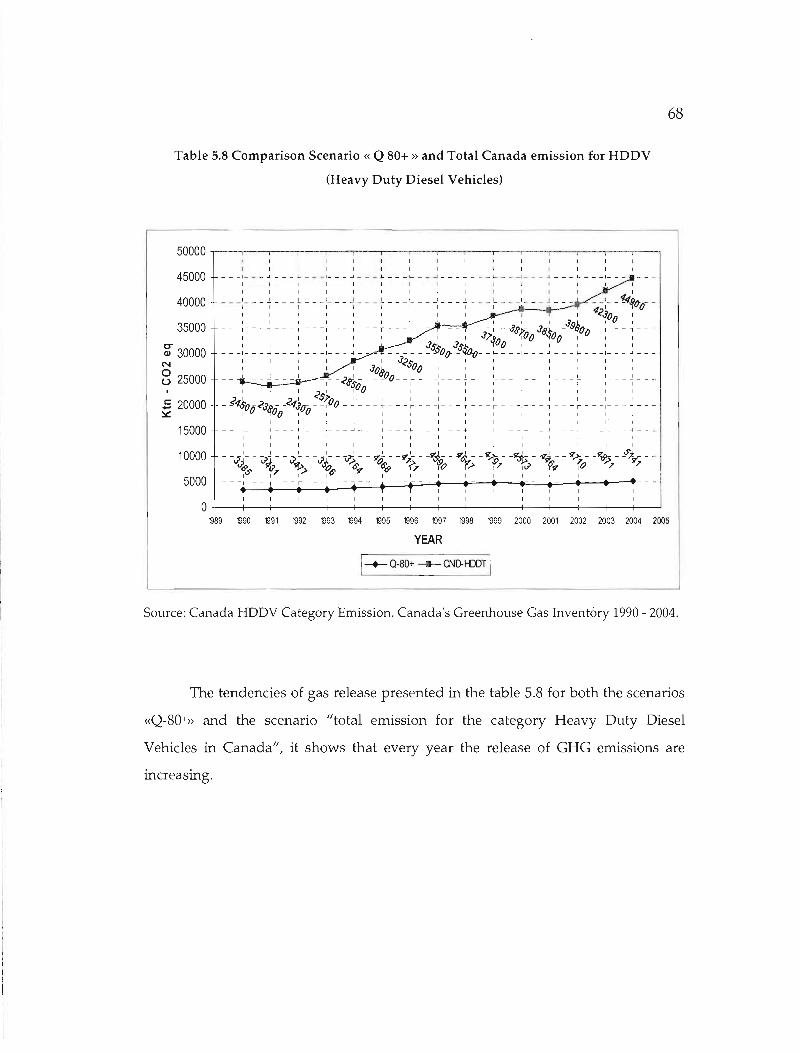
- -
68
Table 5.8 Comparison Scenario « Q 80+ » and Total Canada emission for HDDV
(Heavy DutY Diesel Vehicles)
50000 , 1 1 1
1 1 1 1 1 1 1 1 1 1 1 1 ___ 1 .J l- 1 ~ 1- 1 + l- __ -1_ _ _ _ __ 1. 1~ _45000
1 1 1 1 1 1 1 1 1 1 1 1 1 1
1 1 1 1 1 1 1 1 1 1 1 1 1
40000 ---:~~- ~ ---~ -- -:--- ~- --}-- -;- ---:-- -+ -__ : 1_ -~- - 4-;-- ~4f()o--1 1 1 1 1 1 1 lit 1 1<Joo
35000 - --;- -- ~ --- ~ -- -;- -- ~ - -- ~ -- -:- -- ,- - - ,- -J?jo-0'9~OOJe.to/9~ --;- -- ~ -- ~ 30000 - - -:- - - ~ - - - ~ - - -:- - - ~ - - - - -:- - ~~oo-~$~- - 1- q- -:- - - ~ - - - ~ - - -:- - - ~ - -
1 1 1 1 J<.I:' 1 1 1 1 1 1 1 1N
lit 1 Jo~ "'00 1 1 1 ; 1 1 1 10 u 25000 - - ! - - - - 1- - <~- - - ï~0 - -:- - - -: - - - +- - - ;- - - -; - - - ~ - - - ~ - --:- - - ~ - -
1 l '<. \ 1°0 1 1 1 1 1 1 1 J J 1
c 20000 -S'<tJo-~~- -<4301- ~~oo -~- -- ~ -- -:- -- -:- -- ~ --- ~ - --:- - - ~ --- ~ ---:- -- ~ - -~ 1 0 ~"10o 1 0 1 1 1 1 1 1 1 1 1 1 1
1 1 1 1 1 1 1 1 1 1 1 1 1· 1 ___ 1 .J L 1 J .\- 1 1 -l- _ 1 __ 1_ _.J L 1 .J _15000
1 1 1 1 1 1 1 1 r J 1 1
1 1 1 1 1 1 1 1 1 1 1 r 1 1 1
10000 - -,/- --" - - ~'- - --'- -.r, - -17:'- - -rr'- - -rT,f,- - ....61- _2"~ - -lf>+- -17:" - _rr); - -"dt-< - Y'I._ - :Jl&s J'Jû' st.,> J'Jo6' ~6'rr 06'& 77 :Po r'> of7 :;-'J' ~rr ro :;-'7 ~7
71 1 1 1 1 1 1 1 1 1 1 1 ...5000 • --. .- --.- i - -, - f - ~-- ~ - • ~ ~ -- -- ~ .--1 1 1 1 1
O-l---+---+--t---+--+---+---+--+---+----t--'t-----+--+---+----+-------1 '!l89 '!l90 '!l91 1992 '!l93 1994 '!l95 '!l96 1997 1998 1999 2000 2001 2002 2003 2004 2005
YEAR
I--+-0-80+ -------- ŒJo.HDDT1
Source: Canada HDDY Category Emission. Canada's Greenhouse Gas lnventory 1990 - 2004.
The tendencies of gas release presented in the table 5.S for both the scenarios
«Q-SO+» and the scenario "total emission for the category Heavy DutY Diesel
Vehic1es in Canada", it shows that every year the release of CHC emissions are
increasing.
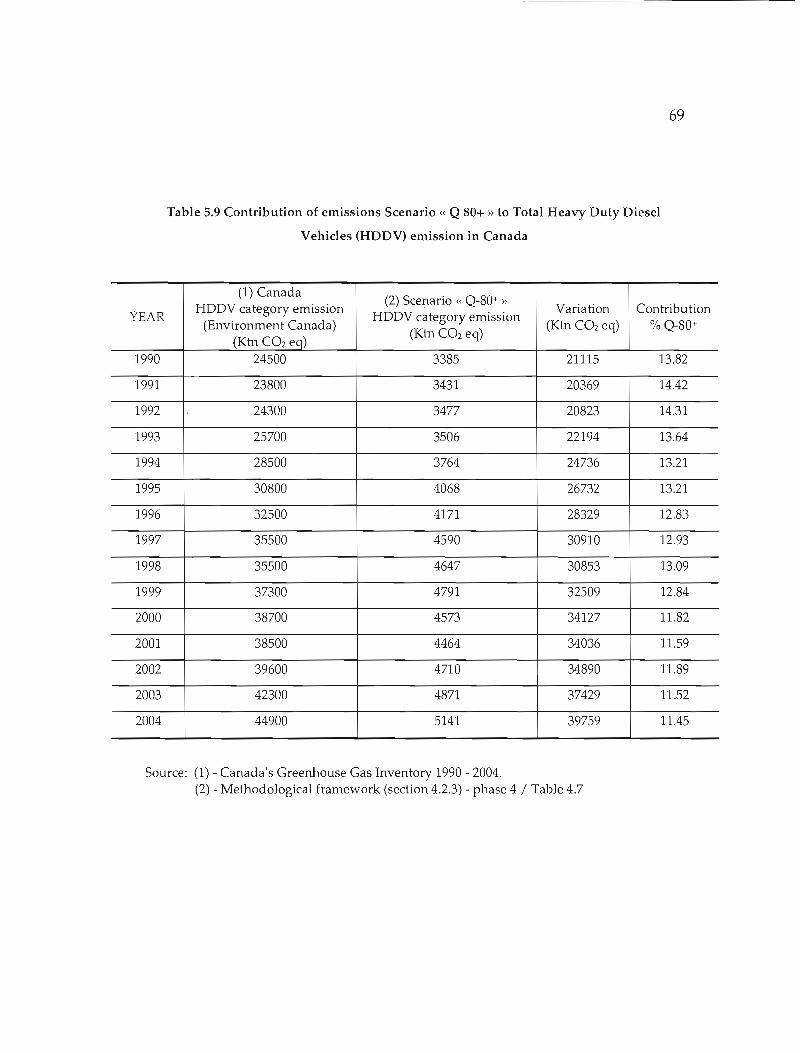
69
Table 5.9 Contribution of emissions Scenario « Q 80+ )} to Total Heavy DutYDiesel
Vehicles (HDDV) emission in Canada
YEAR
(1) Canada HDDV category emission
(Environment Canada) (Ktn COz eq)
(2) Scenario « Q-80+ »
HDDV category emission (Ktn COz eq)
Variation (Ktn COz eq)
Contribution % Q-80+
1990 24500 3385 21115 13.82
1991 23800 3431 20369 14.42
1992 24300 3477 20823 14.31
1993 25700 3506 22194 13.64
1994 28500 3764 24736 13.21
1995 30800 4068 26732 13.21
1996 32500 4171 28329 12.83
1997 35500 4590 30910 12.93
1998 35500 4647 30853 13.09
1999 37300 4791 32509 12.84
2000 38700 4573 34127 Il.82
2001 38500 4464 34036 Il.59
2002 39600 4710 34890 Il.89
2003 42300 4871 37429 11.52
2004 44900 5141 39759 11.45
Source: (1) - Canada's Greenhouse Gas Inventory 1990 - 2004. (2) - Methodological framework (section 4.2.3) - phase 4 / Table 4.7
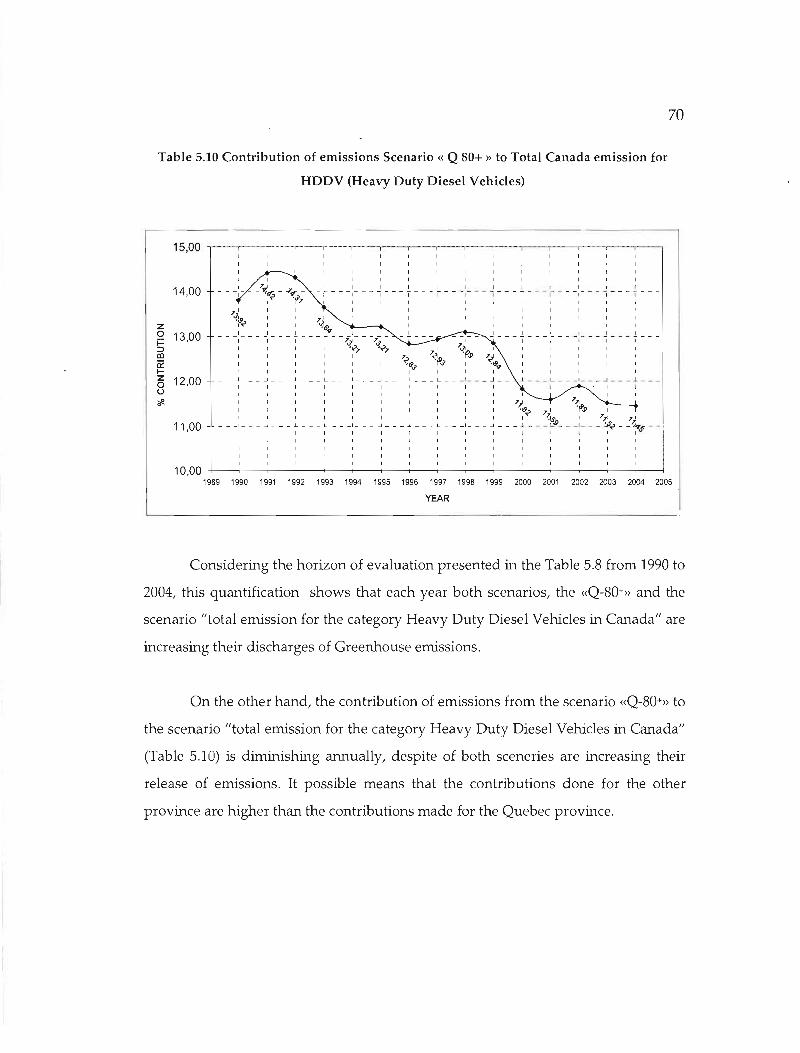
70
Table 5.10 Contribution of emissions Scenario « Q 80+ » to Total Canada emission for
HDDV (Heavy DutYDiesel Vehicles)
15,00 -··---r----r~·-·-"""ï---r ..-···r-·-,·-__,_---·l·--·r-···-r···--···"-r--r --r---r-- . ,1 1 1 ,1 1 1 l , , ,
, l , , , l , , ___ ,_ _7,!,,..:; _ -7; _ 1 1 1 1 1 1 1
14,00 - 1- - - -1- - - -1 - - - - - - ï - - -1- - - ï - - - T - - - 1- - - -1- - - -1 - - - 1 - - l~ 'iJ}' l , 1 , 1
)'. 1 1 1 1 1 , ,0,19~ 1 1 )'1 1 ~ l , 0- l ,z
0 1 1 1 'P'V t 1 ..! - - - ..!. - - - 1- 1 ...! ..!. _13,00 - - -1- - - -1 - - - 1 - - - - - - ~ - - -}'J ï= " ,,:J 1 1 1 '~)' '!t?7 1 ,al 1 1 1 1 1 7~ ~.o ~ ~ 1 1 1 1 l 't9"" '''''J> ''<99' 1
1- 1 1 1 1 1 1 1 1 1 1 1 1 1 1 1 ~ ___1 .J 1. L 1 .J .1 L 1 .J __ .1 __ L 1 ...1 Jo _z 12,000 1 1 1 1 1 1 1 J 1 1 ,u 1 j 1 1 1 1 1 1 1 1 1 ," ,
1 1 1 1 1 1 1 1 1 1 71~ 1 1 1 1 1 1 1 1 1 1 'c:9~ 7' , 1 r 1 1 1 1 1 1 1 1 1
___ 1 --l J. L. 1 ...J .1. L. 1 ..J 1 ~\.S.$l 1 7~ 7j11.00 - ~ - - -:- - - ~~ - - '~$" - •
1 1 1 1 r 1 1 1
1 t 1 1 1 1 1 , 1 1 1 1 1 1 1 1 1 1 1 1 , , ,
10,00 -+----t---~-____r__-__<__--r--------.------t---t--_r_______<---__+__-~-.__+-____1
1989 1990 1991 1992 1993 1994 1995 1996 1997 1998 1999 2000 2001 2002 2003 2004 2005
YEAR
Considering the horizon of evaluation presented in the Table 5.S from 1990 to
2004, this quantification shows that each year both scenarios, the «Q-SO+» and the
scenario "total emission for the category Heavy DutYDiesel Vehicles in Canada" are
increasing their discharges of Greenhouse emissions.
On the other hand, the contribution of emissions from the scenario «Q-SO+» to
the scenario "total emission for the category Heavy DutYDiesel Vehicles in Canada"
(Table 5.10) is diminishing annually, despite of both sceneries are increasing their
release of emissions. It possible means that the contributions done for the other
province are higher than the contributions made for the Quebec province.
CHAPTER6
CONCLUSIONS AND SUGGESTIONS FOR FURTHER
RESEARCH
The main conclusions from this evaluation are summarized as follow:
1. The use of the «Origin - destination Matrix surveys» from the Ministère des
transports du Québec (MTQ), it is an excellent option to evaluate gas
emission as product of trucking freight transportation activity. Consequently
with this evaluation is possible to know the total volume of emissions
produced by a specifie vehicle category and activity of vehicles, and the
emissions linked to the road network (see annexes).
2. This quantification and evaluation of emissions for the trucking freight
activity in the Quebec's province shows that this task is very complex and its
accuracy depends on the type of data employed, also the interpretation of
results and its explanation are very relative.
In this case, the comparison between the GHG emission for the scenario «Q
80+ », Quebec and Canada show that every year the release is increasing. On
the other hand, the situation of the scenario « Q-SO+ » respect to the Quebec's
province emission shows that this trend has been stable on the analyzed
horizon (Table 5.6). Furthermore if we make the comparison against the
Canadian emission situation of trucking freight transportation activity, it
72
shows the emission release of the scenario « Q-80+ » is diminishing from 1999
to 2004 (Table 5.9 and Table 5.10).
3. In Quebec from 1990 until 2007, the Ministère des transports du Québec
(MTQ) has produced three Origin - Destination survey during the years 1991,
1995 and 1999. However the information of 1991 and 1995 surveys was not
enough to have into account for this evaluation, considering the proposed
methodological framework. In 2007 the Ministry is carrying out a new
survey, but its result will be ready in approximately 3 years. For this reason,
and considering the necessity of annual measurements of GHe's and also in
order to produce futures quantifications, the proposed methodological frame
work could be can have improvements and up dates, considering the sources
of information and the availability of data to use. As previously mentioned,
this kind of quantitative evaluation depends on the information provided by
the institution or authoritY uncharged of the transportation in the province.
4. This evaluation has considered just one border point (De LacoHe) in the
quantification of emissions, but for futures estimations, it is important to
consider that Quebec's province share 28 border points with the Unites Sates,
also share other few ones with the provinces that surround it. In: order ta
procure accurateness on this kind of evaluation, it is essential to take into
account aH the incoming and outgoing displacements implicated in each of
those points.
5. With the intention to compare this kind of analysis and its result of gas
emission as product of truck freight transportation, it is important to consider
every geographic area of study, involving its own characteristics (weather,
topography, geographic conditions, type of roads, speed of operation, roads
capacity, fuels, etc.). Consequently, the fact to comparing two or more
73
balances of gas emission must involve an previously analysis of which
parameters and variables are employed in order to standardize the results
and their interpretation
6. The Trucking freight transportation activity is mostly concentrated on the
south area of Quebec - Province. Therefore for future evaluation of
Greenhouse emissions will be important to improve the data regarding the
administrative areas located on the north.
7. AH the results aimed to truck freight transportation emission are increasing
every year, but considering the type of unit employed to refer its emissions
(Ktn C02 - eq) will be important to improve the accuracy on the
methodology,' considering what a « Ktn C02 - eq » represents.
8. This quantification of emission makes possible to evaluate 400 trajectories in
the province of Québec in approximately 95.000 Km of roads. For future
evaluations, will be important to connect the Montreal port, as an important
point of departure and arrives for the roads network in Quebec with the
purpose to improve the Provincial Gas Inventory of emission.
9. This evaluation guided by the Tier 2, or <bottom-up> approach to estimates
C02 emissions only has concems to emission of "running" type. But on the
other hand and in order to improve the exactness on this type of
quantification, they are other emissions associated to the combustion of fuel
in the trucking freight activity as:
• Start: emission when the motor is started
• Hot soak: emission (by evaporation) when the truck is parked after
finishing a trip. The engine is still hot.
74
• Diurnal: emission (by evaporation) when the vehicle is inactive due to
the heat increase during the day.
• Resting: emission (by evaporation) by loss, at rest (escape and
infiltration).
• RlU1loss: emission (by evaporation) by loss when the vehicle runs.
• Crankcase: emission (by evaporation) due to the heating at the level
of the carter.
• Refueling: emission (by evaporation) during the filling of the fuel
tank.
10. Regarding the data consumption of fuel, a1l the documentation used in this
evaluation recommends the American consumption ratios to produce the
evaluation of Canadian emission. However, in order to improve this kind of
evaluation is essential to develop the Canadian consumption ratios according
to the next parameter:
• Fleet trucks characteristics
• The activities associated to this kind of vehicles
• Local fuel features
• Temperatures
• Humidity
• Season of calendar to evaluate
References
Alberti, M., 1996, "Measuring urban sustainability; Environmental Impact Assessment", Vo1.16. Pages 381 - 424.
Adil Najam, Saleemul Huq and Youba Sokona, 2003. "Clirnate negotiations beyond Kyoto: developing countries concerns and interests". Article, Climate Poliey, Vol. 3, Issue 3, Pages 221 - 231.
Agriculture and Agri-Food Canada. 1999. "The Health of Our Air: Toward Sustainable Agriculture". Research Branch, 100 p.
Beuthe M., Degrandsart F., Geerts J-F. and Jourquin B., 2002. "External costs of the Belgian interurban freight traffic: a network analysis of their internalisation". Transportation Research Part D: Transport and Environment, Volume 7, Issue 4, Pages 285 - 301.
Black W., 1996. Sustainable transportation: a US perspective", Journal of Transport Geography 4, Pages 151-159.
Côte Gilles. 1998. "Contribution potentielle du secteur des transports à la réduction des gaz à effet de serre au Québec". Mémoire de maîtrise en sciences de l'envirormement, Université du Québec à Montréal, 126 p.
Crainic Teodor G., Ricciardi Nicoletta and Storchi Giovarmi. 2004. "Advanced freight transportation systems for congested urban areas", Transportation Research Part C: Emerging Technologies, Vol. 12, Issue 2, Pages 119 - 137.
DeWitt William and Clinger Jermifer, 1997, "Intermodal freight transportation", University of Maryland and Louis Berger Group, Inc ",6 p.
Downing Thomas E., Munasinghe Mohan and Depledge Joarma, 2003, "Special Supplement on Climate Change and Sustainable Development", Climate Poliey, Vol. 3,. Supplement l, Pages S3 - S8.
Energy Information Administration (ElA), 2007, Monthly Energy Review Table 1.9. Motor Vehicle Mileage, Fuel Consumption, and Fuel Rate, On line: http:// tonto.eia.doe.gov /merquery/mer data.asp?table=T01.09 Consulted: December 14 of 2006.
76
Environment Canada Canada's Greenhouse Gas Inventory, 1990-2003, Armex 13: Emission Factors, on line: http://www.ec.gc.ca/pdb/ghg/inventory report/2003 report/arm13 e.cfm, consulted: November 17 of 2006.
Environment Canada. 2001. " Trucks and Air Emissions". Report; EPS 2/TS/14 "Final report". Air Pollution Prevention Directorate. Environmental Protection Service. 35p.
Environment Canada 2003. Science of Climate. Change Greenhouse Gas Concentration Trends in the 20th Century. On line: http://www.msc.ec.gc.ca/educationlscienceofclimatechange1understanding Igreenhouse gases/index e.html . Consulted: December 3,2006.
Environment Canada, 2006. "Canada's Greenhouse Gas lnventory 1990 - 2004". National Inventory Report Greenhouse Gas Sources and Sinks in Canada. The Canadian Government's Submission to the UN Framework Convention on Climate Change.
Environmental Protection Agency - EPA. 1996. Compilation of Air Pollutant Emission Factors, Vol. l, Stationary Point and Area Sources, 5th Edition, Us. Washington, D.C, U.s.A., AP-42.
Forkenbrock J. 2001. "Comparison of external costs of rail and truck freight transportation". Transportation Research Part A: Policy and Practice, Volume 35, Issue 4. Pages 321 - 337.
Gielen, D. J. and Yagita,H. 2002, "The long-term impact of GHG reduction policies on global trade: A case study for the petrochemical industry". Article, European Journal of Operational Research, Vol. 139, Issue 3, Pages 665 - 681.
Goldman Todd and Gorham Roger. 2005. "Sustainable urban transport: Four irmovative directions". Article, Technology in Society, In Press, 13 p.
Government of Canada, 2005. "Moving FOlward on Climate Change: A Plan for Honouring Our Kyoto Commitments", Catalogue No. En84-15/2005.
Grubb Michael, 2003, "Special Supplement on Climate Change and Sustainable Development" Supplement 1, Climate Policy, Vol. 3, Page SI.
Haughton, M.A., 2002. " Route reoptimization's impact on delivery efficiency", Transportation Research E 38, Pages 53 - 63.

77
Hengeveld, H. 1997. "An Assessment of New Developments Relevant to the Science of Climate Change." COz/Climate Report, A Periodical Newsletter Devoted to Current Events in COz/Climate Research, Environment Canada, Issue 97-1, Spring, 52 p.
Hobbie, John et al. 1984. "Role of Biota in Global COz Balance: The Controversy." BioScience, Vol. 34, No. 8, Pages. 492 - 498.
Hokanson, B., Minkoff, M., Nichols, S., Coward, S., 1981. "Measures of noise attributable to motor vehic1e travel". University of Iowa Institute of Urban and Regional Research.
IPCC/TEAP. Special report: safeguarding the ozone layer and the global climate system: issues related to hydrofluorocarbons and perfluorocarbons summary for policymakers, 24 p.
IPCC, 1990. Emissions Scenarios. Response Strategies Working Group.
IPCC, 1995: The Science of Climate Change (Cambridge, UK: Cambridge University Press, 1996) IPCC Global Warming Potential. On line: http://www.ipcc.ch/press/SPM.pdf Consulted: January 13 of 2007.
IPCC/OECD/IEA, 1996. "IPCC Guidelines for National Greenhouse Gas Inventories", Intergovemmental Panel on Climate Change, Organisation for Economic Co-operation and Development, and Intemational Energy Agency.
IPCC, 1997. "Good Practice Guidance and Uncertainty Management in National Greenhouse Gas Inventories", Intergovemmental Panel on Climate Change National Greenhouse Gas Inventories Programme.
Kessel Dagobert G. 2000, "Global warming - facts, assessment, counterrneasures", Article Journal of Petroleum Science and Engineering, Vol. 26, Issues 1 - 4, Pages 157 - 168.
Labelle, Christine. 2000. "Les gaz à effet de serre et les changements climatiques", Division des sciences et de la technologie, Gouvernement of Canada.
Léonardi Jacques and Baumgartner Michael. 2004. "COz efficiency in road freight transportation: Status quo, measures and potentia". Transportation Research Part D: Transport and Environment, Volume 9, Issue 6/ Pages 451- 464
78
Ministère des Transports du Québec (MTQ) ,1998. "Guide des normes de charges et de dimensions des véhicules", Direction de la sécurité en transport.
Ministère des Transports du Québec (MTQ), 2003, "Les déplacements interurbains de véhicules lourds au Québec Sommaire de l'Enquête sur le camionnage de 1999". 147p.
Minister of Public Works and Govemment Services, 2001. " Vision and balance: Canada Transportation Act Review".Catalogue No. T22-107/2001E. 346p.
Monirul, M. and Qader M, 2003, "Climate change and extreme weather events: can developing countries adapt?". Article, Climate Policy, Vol. 3, Issue 3. Pages 233 - 248.
Natural Resources Canada (NRCan), Transport Canada and Canadian Vehicle Manufacturers' Association. 2002. "Fuel Consumption Guide Ratings for new cars, pickup trucks and vans 2003".
Noreen Beg, Moriot, Corfee J., Ogunlade O., Yaw Afrane-Okesse Yaw, Tyani Lwazikazi, Oenton Fatma, Sokona Youba, Thomas Jean Philippe, Lèbre La Rovere , Emilio Jyoti K. Parikh. 2002. "Linkages between climate change and sustainable development" Climate Policy, Review Article, Volume 2, Issue 2 3, Pages 129 - 144.
Oppenheimer, Michael. 1998. "Global Warming and the Stability of the West Antarctic !ce Sheet", Pages 325 - 332.
Paniati Jeff, 2002, Congestion Picture, Federal Highway Administration Office of Operations (HOP), on line http://www.Ehwa.dot.gov / congestion / congpress.htmTraffic Consulted: March 28 of 2005.
Prades José A., Loulou Richard et Waaub Jean-Philippe, 1998. «Stratégies De Gestion Des Gaz à Effet de Serre: le cas des transports urbains». Sainte-Foy: Presses de l'Université du Québec, 277 p.
RabI A. and J.V. Spadaro J.V. 2000, "Health costs of automobile pollution". Revue Française d'Allergologie et d'Immunologie Clinique, Vol4û, Pages 55 - 59.
Statistics Canada, 2003. Le camionnage au Canada, catalogue No. 53-222-XPB.
79
Statistics Canada, 2004. The Canada e-Book. The Economy - by truck. on line http://www43.statcan.ca/03/03d/03d002ce.htm .Consulted: May 10 of 2007.
Santini Danilo, Vyas Anant and Anderson John, 2001, "Evaluation of 1997 fuel consumption patterns of heavy DutY Trucks", 7th Diesel Engine Emission Reduction Workshop, Center for transportation research, Argonne National Laboratory, 3 p.
SGA, 2000, "Emission Factors and Uncertainties for CH4 & NzO from Fuel Combustion", Unpublished report prepared for the Greenhouse Gas Division, Environment Canada, by SGA Energy Limited.
Swart Rob, Robinson John and Cohen Stewart. 2003. "Climate change and sustainable development: expanding the options", Article Climate Policy, Vol. 3, Supplement l, Pages S19 - 540.
Transports Canada. 2003. "Truck Activity in Canada Transports Canada- A Profile" Prepared by Fred P Nix. 32p.
United Nations, 1987, "Our Common Future". United Nations World Commission on Environment and Development, .Oxford University Press, Oxford, England.
World Business Council for Sustainable Development (WBCSD), 2001. "The Mobility 2001 report" world mobility at the end of the twentieth century and its sustainability, prepared for the Sustainable Mobility Working Group of the WBCSD by the Massachusetts Institute of Technology and Charles River Associated Incorporated. Switzerland.
World Energy Council (WEC), 2004, "Pilot programme on GHG emission reduction", Final report, 57 p.

Annexes
81
This Annex includes, for each of the twenty geographical areas examined, two
sections (1) and (2), not only the parameters of evaluation used but also the results of
the quantification.
The section (1) refers to the next parameters:
• Administrative area of destination
• City of reference in the administrative area of destination
• Distance between city of reference administrative area of origin and the city
of reference administrative area of destination
• Total number of trucks (category of study)
• Total number of Truck - Sub category T(l)
• Total number of Tractor with semitrailer - Sub category T(2)
• Total number of Truck with trailer - Sub category T(3)
• Consumption (Lt/Km) Sub category T(l)
• Consumption (Lt/Km) Sub category T(2)
• Consumption (Lt/Km) Sub category T(3)
• Emission factor for CO2(g/Lt Diesel)
• Emission factor for CH4(g/Lt Diesel)
• Emission factor for N20 (g/Lt Diesel)
The section (2) includes the results of the evaluation for:
• Emission in terms of C02 - eq for: C02 emission - Sub category T(l)
• Emission in terms of C02 - eq for: C02 emission - Sub category T(2)
• Emission in terms of C02 - eq for: C02 emission - Sub category T(3)
• Emission in terms of C02 - eq for: CH4 emission - Sub category T(l)
• Emission in terms of C02 - eq for: CH4 emission - Sub category T(2)
82
•� Emission in terms of COz - eq for: CH4 emission - Sub category T(3)
•� Emission in terms of COz - eq for: NzO emission - Sub category T(l)
•� Emission in terms of COz - eq for: NzO emission - Sub category T(2)
•� Emission in terms of COz - eq for: NzO emission - Sub category T(3)
•� Total emission year 1.999 in terms of COz - eq (2: (COz + CH4 + NzO))
between city of reference (administrative area of origin) and the city of
reference (administrative area of destination)