Eight-Japan Engineering Katahira & Engineers PROJET POUR ...

1
Genome-wide association study identifies eight new risk loci
for polycystic ovary syndrome
Yongyong Shi1-3,37, Han Zhao4-7,37, Yuhua Shi4-7,37, Yunxia Cao8,37, Dongzi Yang9,37,
Zhiqiang Li1-3,37, Bo Zhang10, Xiaoyan Liang11, Tao Li4, Jianhua Chen1,12, Jiawei Shen1,
Junzhao Zhao13,Li You4-7, Xuan Gao4-7, Dongyi Zhu14, Xiaoming Zhao15, Ying Yan16,
Yingying Qin4-7, Wenjin Li1,Junhao Yan4-7, Qingzhong Wang1, Junli Zhao17, Ling Geng4-7,
Jinlong Ma4-7, Yueran Zhao4-7,Guang He1, Aiping Zhang1, Shuhua Zou18, Aijun Yang19,
Jiayin Liu20, Weidong Li1, Baojie Li1, Chunling Wan1, Ying Qin21, Juanzi Shi22, Jing Yang23,
Hong Jiang24, Jin-e Xu25, Xiujuan Qi25, Yun Sun15,Yajie Zhang26, Cuifang Hao27, Xiuqing
Ju28, Dongni Zhao29, Chun-e Ren30, Xiuqing Li31, Wei Zhang32, Yiwen Zhang33, Jiangtao
Zhang4,5, Di Wu4,5, Changming Zhang4,5, Lin He1,2,34,35# and Zi-Jiang Chen4-7,15,36#
1Key Laboratory for the Genetics of Developmental and Neuropsychiatric Disorders,
Bio-X Institutes, Ministry of Education, Shanghai Jiao Tong University, Shanghai,
China.
2Shanghai genomePilot Institutes for Genomics and Human Health, Shanghai, China.
3Changning Mental Health Center, Shanghai, China.
4Center for Reproductive Medicine, Shandong Provincial Hospital, Shandong
University, Jinan, China.
5National Research Center for Assisted Reproductive Technology and Reproductive
Genetics, Jinan, China.
6The Key laboratory for Reproductive Endocrinology, Ministry of Education of the
People’s Republic of China, Jinan, China.
7Shandong Provincial Key Laboratory of Reproductive Medicine, Jinan, China.
8Reproductive Medicine Center, The First Affiliated Hospital, Anhui Medical University,
Hefei, China.
9Department of Obstetrics and Gynecology, Sun Yat-sen Memorial Hospital, Sun
Nature Genetics: doi:10.1038/ng.2384

2
Yat-Sen University, Guangzhou, China.
10Reproductive Medicine Center, The Maternal and Child Health Hospital of Guangxi
Zhuang Autonomous Region, Nanning, China.
11Reproductive Medicine Center, The Sixth Affiliated Hospital of Sun Yat-sen
University, Guangzhou, China.
12Shanghai Institute of Mental Health, Shanghai, China.
13Reproductive Medicine Unit, The First Affiliated Hospital of Wenzhou Medical
College, Wenzhou, China.
14Reproductive Medicine Center, Linyi People's Hospital, Linyi, China.
15Center for Reproductive Medicine, Renji Hospital, Shanghai Jiao Tong University
School of Medicine, Shanghai, China.
16National Institute of Hospital Administration, Ministry of Health of the People’s
Republic of China, Beijing, China.
17Reproductive Medicine Center, Affiliated Hospital of Ningxia Medical University,
Yinchuan, China.
18Center for Reproductive Medicine, Qingdao Women & Children Medical Healthcare
Center, Qingdao, China.
19Reproductive Medicine Center, Affiliated Hospital of Jining Medical College, Jining,
China.
20Department of Obstetrics and Gynecology, First Affiliated Hospital of Nanjing
Medical University, Nanjing, China.
21Oncology Translational Medicine, GlaxoSmithKline R&D China, Shanghai, China.
22Assisted Reproduction Center, Maternal and Child Health Care Hospital of Shaanxi
Province, Xi’an, China.
23Reproductive Medical Center, Renmin Hospital of Wuhan University, Wuhan, China.
24Department of Obstetrics and Gynecology, 105th Hospital of People’s Liberation
Army, Hefei, China.
25Department of Obstetrics and Gynecology, The Affiliated Hospital of Medical
College Qingdao University, Qingdao, China.
26Department of Obstetrics and Gynecology, Jinan Health Institute of Maternity and
Nature Genetics: doi:10.1038/ng.2384

3
Infant, Jinan, China.
27Reproductive Medical Center, Yantai Yuhuangding Hospital, Yantai, China.
28Department of Obstetrics and Gynecology, Tengzhou People's Hospital, Tengzhou,
China.
29Reproductive Medical Center, Shengjing Hospital of China Medical University,
Shenyang, China.
30Department of Obstetrics and Gynecology, Affiliated Hospital of Weifang Medical
College, Weifang, China.
31Department of Obstetrics and Gynecology, Anqiu People's Hospital, Anqiu, China.
32Department of Gynecology, Obstetrics & Gynecology Hospital of Fudan University,
Shanghai, China.
33Reproductive Medicine Unit, Weihai Women and Children Hospital, Weihai, China.
34Institutes of Biomedical Sciences, Fudan University, Shanghai, China.
35Institute for Nutritional Sciences, Shanghai Institute of Biological Sciences, Chinese
Academy of Sciences, Shanghai, China.
36Bio-X Institutes, Shanghai Jiao Tong University, Shanghai, China.
37These authors contributed equally to this work.
#Correspondence should be addressed to Z-J.C. ([email protected])or L.H.
Nature Genetics: doi:10.1038/ng.2384
4
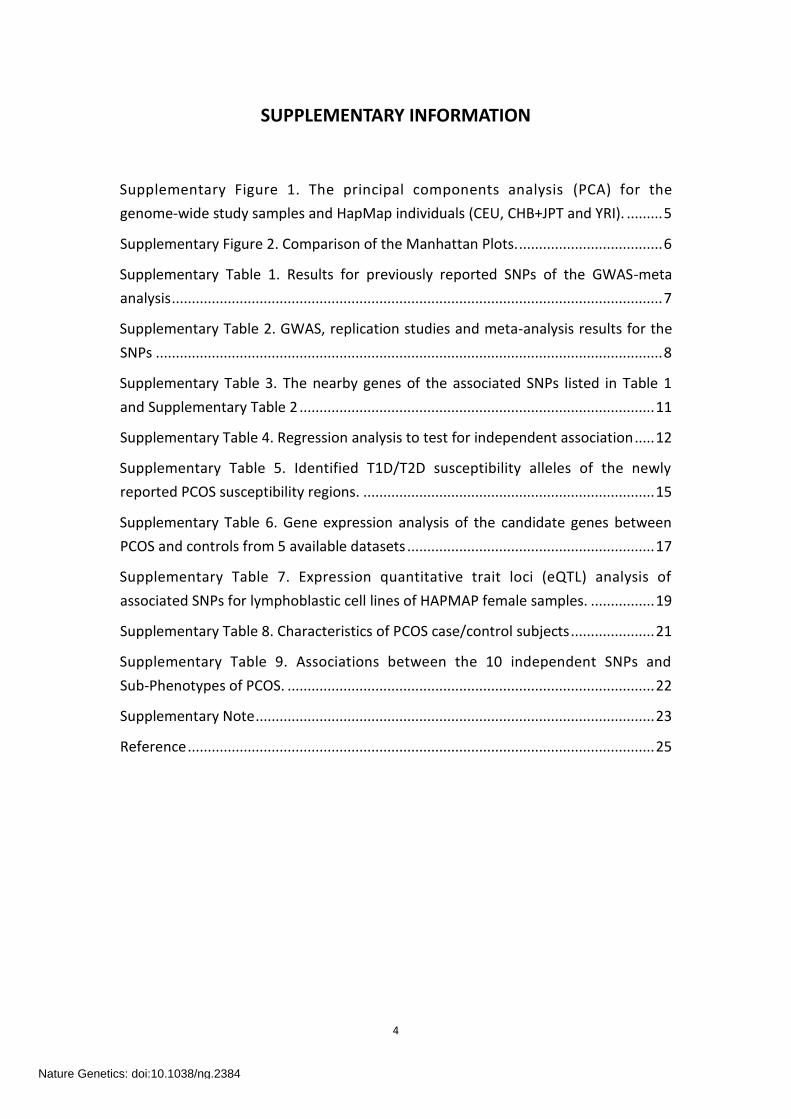
SUPPLEMENTARY INFORMATION
Supplementary Figure 1. The principal components analysis (PCA) for the
genome-wide study samples and HapMap individuals (CEU, CHB+JPT and YRI). ......... 5
Supplementary Figure 2. Comparison of the Manhattan Plots. .................................... 6
Supplementary Table 1. Results for previously reported SNPs of the GWAS-meta
analysis ........................................................................................................................... 7
Supplementary Table 2. GWAS, replication studies and meta-analysis results for the
SNPs ............................................................................................................................... 8
Supplementary Table 3. The nearby genes of the associated SNPs listed in Table 1
and Supplementary Table 2 ......................................................................................... 11
Supplementary Table 4. Regression analysis to test for independent association ..... 12
Supplementary Table 5. Identified T1D/T2D susceptibility alleles of the newly
reported PCOS susceptibility regions. ......................................................................... 15
Supplementary Table 6. Gene expression analysis of the candidate genes between
PCOS and controls from 5 available datasets .............................................................. 17
Supplementary Table 7. Expression quantitative trait loci (eQTL) analysis of
associated SNPs for lymphoblastic cell lines of HAPMAP female samples. ................ 19
Supplementary Table 8. Characteristics of PCOS case/control subjects ..................... 21
Supplementary Table 9. Associations between the 10 independent SNPs and
Sub-Phenotypes of PCOS. ............................................................................................ 22
Supplementary Note .................................................................................................... 23
Reference ..................................................................................................................... 25
Nature Genetics: doi:10.1038/ng.2384

5
Supplementary Figure 1. The principal components analysis (PCA) for the
genome-wide study samples and HapMap individuals (CEU, CHB+JPT and YRI).
Supplementary Figure 1. The principal components analysis (PCA) for the
genome-wide study samples and HapMap individuals (CEU, CHB+JPT and YRI). Plot
of first two principal components from the analysis of study data (1,510 cases and
2,106 controls) combined with HapMap data. The samples’ disease status and the
ethnicity of the HapMap samples is indicated by color. The legend uses standard
HapMap abbreviations (see http://hapmap.ncbi.nlm.nih.gov/). Controls are red
circles; Cases are blue circles; Chinese/Japanese samples are green circles; European
samples are light blue circles; and African samples are purple circles. Those samples
excluded from further analysis were marked by grey crosses.
Nature Genetics: doi:10.1038/ng.2384

6
Supplementary Figure 2. Comparison of the Manhattan Plots.
Supplementary Figure 2. Comparison of the Manhattan Plots. The panels
summarize the results of the GWAS results (the top one for the meta-analysis; the
middle one for the previous GWA study (GWAS I)10, and the bottom one for the new
study (GWAS II). Previously established loci are marked in italics with smaller
font-sizes and the newly discovered loci are in roman type with bigger font-sizes.
Nature Genetics: doi:10.1038/ng.2384

7
Supplementary Table 1. Results for previously reported SNPs of the GWAS-meta analysis
SNP CHR Allelea
GWAS I
(744 cases VS
895 controls)
GWAS II
(1510 cases VS
2106 controls)
GWAS META
OR
[95% CI] Pb
OR
[95% CI] Pb OR P
rs13405728 2p16.3 G/A 0.61
[0.53-0.74] 2.54E-07
0.81
[0.72-0.92] 8.30E-04 0.74 3.77E-09
rs12468394 2p21 A/C 0.60
[0.51-0.70] 1.20E-09
0.78
[0.69-0.88] 6.52E-05 0.71 2.45E-12
rs13429458 2p21 C/A 0.59
[0.48-0.70] 1.05E-07
0.71
[0.62-0.82] 1.03E-06 0.67 4.17E-13
rs12478601 2p21 T/C 0.61
[0.52-0.72] 5.55E-09
0.82
[0.74-0.92] 6.16E-04 0.75 3.37E-10
rs10818854 9q33.3 A/G 1.80
[1.43-2.25] 1.20E-06
1.07
[0.90-1.29] 4.20E-01 1.30 2.50E-04
rs2479106 9q33.3 G/A 1.51
[1.30-1.79] 5.09E-07
1.26
[1.13-1.43] 9.06E-05 1.35 5.14E-10
rs10986105 9q33.3 C/A 2.08
[1.64-2.63] 6.13E-09
1.15
[0.96-1.37] 1.20 E-01 1.42 1.44E-06
CHR, chromosome; MAF, minor allele frequency. aMinor allele/major allele.
bPCA adjusted P-values.
Nature Genetics: doi:10.1038/ng.2384
8
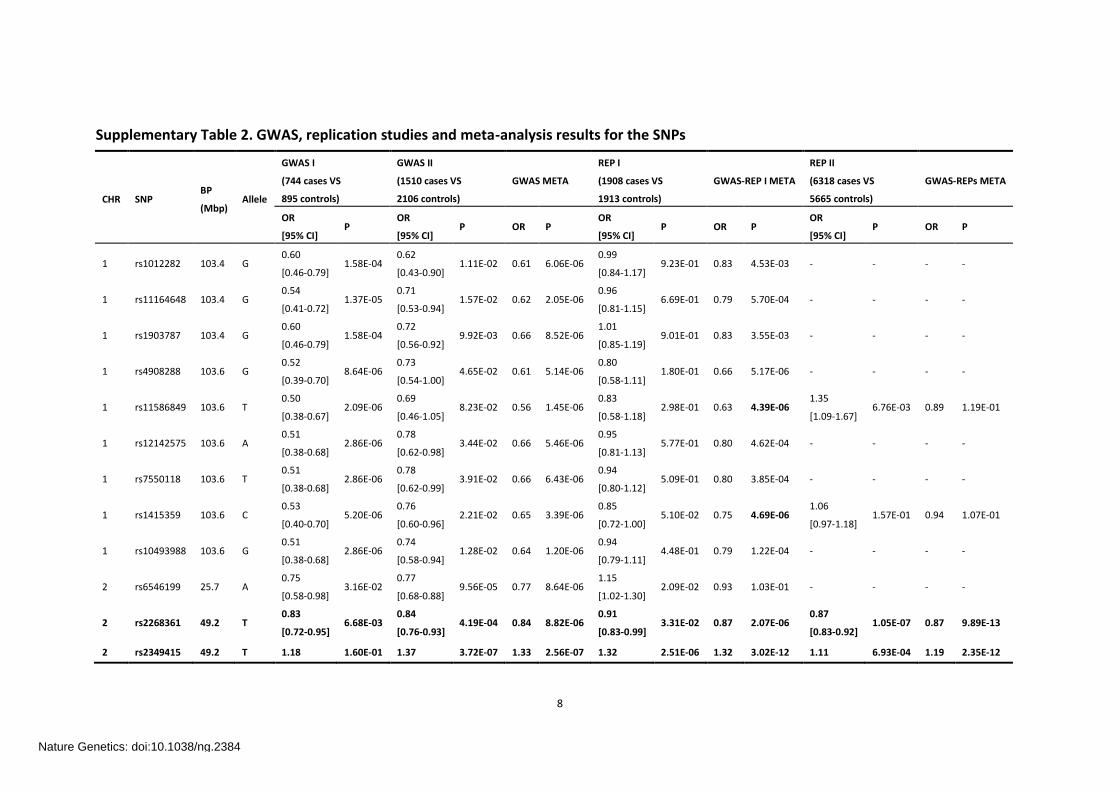
Supplementary Table 2. GWAS, replication studies and meta-analysis results for the SNPs
CHR SNP BP
(Mbp) Allele
GWAS I
(744 cases VS
895 controls)
GWAS II
(1510 cases VS
2106 controls)
GWAS META
REP I
(1908 cases VS
1913 controls)
GWAS-REP I META
REP II
(6318 cases VS
5665 controls)
GWAS-REPs META
OR
[95% CI] P
OR
[95% CI] P OR P
OR
[95% CI] P OR P
OR
[95% CI] P OR P
1 rs1012282 103.4 G 0.60
[0.46-0.79] 1.58E-04
0.62
[0.43-0.90] 1.11E-02 0.61 6.06E-06
0.99
[0.84-1.17] 9.23E-01 0.83 4.53E-03 - - - -
1 rs11164648 103.4 G 0.54
[0.41-0.72] 1.37E-05
0.71
[0.53-0.94] 1.57E-02 0.62 2.05E-06
0.96
[0.81-1.15] 6.69E-01 0.79 5.70E-04 - - - -
1 rs1903787 103.4 G 0.60
[0.46-0.79] 1.58E-04
0.72
[0.56-0.92] 9.92E-03 0.66 8.52E-06
1.01
[0.85-1.19] 9.01E-01 0.83 3.55E-03 - - - -
1 rs4908288 103.6 G 0.52
[0.39-0.70] 8.64E-06
0.73
[0.54-1.00] 4.65E-02 0.61 5.14E-06
0.80
[0.58-1.11] 1.80E-01 0.66 5.17E-06 - - - -
1 rs11586849 103.6 T 0.50
[0.38-0.67] 2.09E-06
0.69
[0.46-1.05] 8.23E-02 0.56 1.45E-06
0.83
[0.58-1.18] 2.98E-01 0.63 4.39E-06
1.35
[1.09-1.67] 6.76E-03 0.89 1.19E-01
1 rs12142575 103.6 A 0.51
[0.38-0.68] 2.86E-06
0.78
[0.62-0.98] 3.44E-02 0.66 5.46E-06
0.95
[0.81-1.13] 5.77E-01 0.80 4.62E-04 - - - -
1 rs7550118 103.6 T 0.51
[0.38-0.68] 2.86E-06
0.78
[0.62-0.99] 3.91E-02 0.66 6.43E-06
0.94
[0.80-1.12] 5.09E-01 0.80 3.85E-04 - - - -
1 rs1415359 103.6 C 0.53
[0.40-0.70] 5.20E-06
0.76
[0.60-0.96] 2.21E-02 0.65 3.39E-06
0.85
[0.72-1.00] 5.10E-02 0.75 4.69E-06
1.06
[0.97-1.18] 1.57E-01 0.94 1.07E-01
1 rs10493988 103.6 G 0.51
[0.38-0.68] 2.86E-06
0.74
[0.58-0.94] 1.28E-02 0.64 1.20E-06
0.94
[0.79-1.11] 4.48E-01 0.79 1.22E-04 - - - -
2 rs6546199 25.7 A 0.75
[0.58-0.98] 3.16E-02
0.77
[0.68-0.88] 9.56E-05 0.77 8.64E-06
1.15
[1.02-1.30] 2.09E-02 0.93 1.03E-01 - - - -
2 rs2268361 49.2 T 0.83
[0.72-0.95] 6.68E-03
0.84
[0.76-0.93] 4.19E-04 0.84 8.82E-06
0.91
[0.83-0.99] 3.31E-02 0.87 2.07E-06
0.87
[0.83-0.92] 1.05E-07 0.87 9.89E-13
2 rs2349415 49.2 T 1.18 1.60E-01 1.37 3.72E-07 1.33 2.56E-07 1.32 2.51E-06 1.32 3.02E-12 1.11 6.93E-04 1.19 2.35E-12
Nature Genetics: doi:10.1038/ng.2384

9
[0.94-1.49] [1.22-1.55] [1.18-1.47] [1.05-1.19]
2 rs10865238 49.3 A 1.14
[0.95-1.36] 1.51E-01
1.34
[1.19-1.52] 3.01E-06 1.27 3.33E-06
1.25
[1.12-1.39] 8.09E-05 1.26 1.13E-09
1.14
[1.07-1.22] 5.74E-05 1.19 2.19E-12
3 rs4857114 94.2 T 0.84
[0.73-0.96] 1.34E-02
0.82
[0.74-0.91] 8.54E-05 0.83 3.58E-06
1.01
[0.92-1.10] 8.73E-01 0.90 7.32E-04 - - - -
4 rs4588519 29.3 C 0.76
[0.60-0.97] 2.50E-02
0.67
[0.54-0.81] 7.73E-05 0.70 8.07E-06
1.06
[0.92-1.21] 4.44E-01 0.88 1.62E-02 - - - -
7 rs2285538 90.1 C 0.85
[0.74-0.98] 2.23E-02
0.82
[0.74-0.90] 5.90E-05 0.83 4.25E-06
1.02
[0.93-1.11] 6.65E-01 0.91 1.55E-03 - - - -
8 rs4872310 25.2 A 1.28
[1.11-1.47] 4.90E-04
1.20
[1.09-1.32] 2.83E-04 1.23 6.45E-07
1.05
[0.96-1.15] 3.12E-01 1.15 9.89E-06 - - - -
8 rs3098717 95.5 C 1.32
[1.12-1.55] 8.44E-04
1.31
[1.17-1.47] 2.96E-06 1.31 9.36E-09
1.03
[0.93-1.15] 5.87E-01 1.18 2.79E-06
1.00
[0.94-1.06] 9.35E-01 1.07 1.90E-03
9 rs4744370 97.5 C 0.85
[0.73-0.97] 1.92E-02
0.83
[0.75-0.91] 1.55E-04 0.83 8.95E-06
0.90
[0.82-0.99] 2.56E-02 0.86 1.53E-06
0.87
[0.83-0.92] 2.26E-07 0.87 1.63E-12
9 rs4385527 97.6 A 0.82
[0.68-0.99] 4.35E-02
0.77
[0.67-0.87] 6.77E-05 0.78 9.62E-06
0.90
[0.82-0.99] 2.32E-02 0.85 4.29E-06
0.86
[0.81-0.93] 4.64E-05 0.84 5.87E-09
9 rs3802458 97.7 G 0.68
[0.52-0.89] 4.28E-03
0.70
[0.58-0.85] 2.44E-04 0.69 3.51E-06
0.96
[0.75-1.22] 7.24E-01 0.76 4.01E-05 - - - -
9 rs3802457 97.7 A 0.68
[0.52-0.89] 4.28E-03
0.70
[0.57-0.85] 2.65E-04 0.69 3.81E-06
0.88
[0.75-1.03] 1.17E-01 0.77 9.88E-06
0.76
[0.69-0.83] 1.07E-09 0.77 5.28E-14
9 rs10993446 97.8 T 0.67
[0.51-0.87] 3.03E-03
0.53
[0.37-0.74] 2.53E-04 0.61 4.87E-06
0.89
[0.76-1.05] 1.71E-01 0.77 1.01E-04 - - - -
10 rs11248467 125.0 C 0.74
[0.54-1.00] 4.59E-02
0.63
[0.51-0.79] 4.92E-05 0.67 8.42E-06
1.04
[0.90-1.19] 6.04E-01 0.88 1.90E-02 - - - -
10 rs11595691 133.2 A 1.20
[0.89-1.62] 2.29E-01
1.33
[1.17-1.51] 1.68E-05 1.31 9.30E-06
1.00
[0.89-1.12] 9.55E-01 1.14 2.09E-03 - - - -
11 rs1894116 102.1 G 1.45
[1.23-1.72] 1.36E-05
1.23
[1.09-1.39] 5.91E-04 1.30 1.11E-07
1.21
[1.09-1.35] 6.29E-04 1.26 4.38E-10
1.27
[1.20-1.36] 4.45E-14 1.27 1.08E-22
12 rs2069408 56.4 G 1.42 1.18E-05 1.21 6.16E-02 1.34 4.53E-06 1.18 2.07E-03 1.24 1.21E-07 1.22 5.77E-11 1.22 3.73E-17
Nature Genetics: doi:10.1038/ng.2384

10
[1.21-1.67] [0.99-1.48] [1.06-1.30] [1.15-1.28]
12 rs705702 56.4 G 1.41
[1.21-1.66] 1.93E-05
1.28
[1.15-1.43] 7.92E-06 1.32 1.09E-09
1.21
[1.09-1.34] 2.27E-04 1.27 2.34E-12
1.26
[1.19-1.34] 7.44E-15 1.27 8.64E-26
12 rs11171739 56.5 C 1.39
[1.19-1.62] 3.43E-05
1.28
[1.15-1.44] 1.02E-05 1.32 2.11E-09
1.23
[1.11-1.36] 8.77E-05 1.28 1.36E-12 - - - -
12 rs877636 56.5 G 1.23
[0.99-1.52] 6.22E-02
1.29
[1.15-1.44] 7.36E-06 1.27 1.28E-06
1.19
[1.07-1.32] 9.75E-04 1.23 7.46E-09
1.24
[1.17-1.31] 9.78E-13 1.24 3.90E-20
12 rs2292239 56.5 T 1.14
[0.89-1.47] 3.03E-01
1.29
[1.15-1.44] 6.02E-06 1.26 5.22E-06
1.27
[1.15-1.41] 5.16E-06 1.27 1.17E-10
1.25
[1.17-1.32] 3.87E-13 1.25 2.72E-22
12 rs6581657 66.2 G 0.62
[0.45-0.87] 5.14E-03
0.74
[0.62-0.87] 2.55E-04 0.71 6.58E-06
0.97
[0.86-1.10] 6.64E-01 0.86 1.56E-03 - - - -
12 rs2293120 66.2 C 0.71
[0.55-0.91] 5.98E-03
0.72
[0.61-0.84] 6.01E-05 0.71 1.19E-06
0.92
[0.82-1.03] 1.53E-01 0.83 2.10E-05 - - - -
12 rs2272046 66.2 C 0.71
[0.55-0.91] 6.78E-03
0.65
[0.54-0.78] 5.38E-06 0.67 1.43E-07
0.80
[0.68-0.95] 1.07E-02 0.73 1.89E-08
0.69
[0.63-0.76] 9.10E-15 0.70 1.95E-21
14 rs1242925 23.1 T 0.83
[0.71-0.97] 2.30E-02
0.80
[0.71-0.90] 1.31E-04 0.81 9.38E-06
0.94
[0.85-1.05] 2.75E-01 0.87 5.42E-05 - - - -
14 rs1242933 23.1 G 0.81
[0.68-0.95] 1.06E-02
0.79
[0.70-0.89] 1.15E-04 0.80 3.78E-06
0.98
[0.88-1.10] 7.81E-01 0.87 2.46E-04 - - - -
16 rs4784165 52.3 G 1.09
[0.82-1.45] 5.55E-01
1.28
[1.16-1.42] 1.95E-06 1.26 2.82E-06
1.09
[0.99-1.20] 7.24E-02 1.17 4.55E-06
1.14
[1.08-1.21] 1.57E-06 1.15 3.64E-11
16 rs2115624 72.7 C 1.75
[1.32-2.31] 7.17E-05
1.71
[1.12-2.59] 1.21E-02 1.74 3.16E-06
0.94
[0.86-1.03] 1.80E-01 1.02 6.43E-01 - - - -
19 rs2059807 7.2 G 1.34
[1.16-1.56] 1.16E-04
1.19
[1.07-1.33] 1.66E-03 1.24 1.58E-06
1.16
[1.05-1.28] 4.40E-03 1.20 4.11E-08
1.09
[1.02-1.15] 6.61E-03 1.14 1.09E-08
20 rs6022786 52.4 A 1.32
[1.14-1.53] 1.72E-04
1.21
[1.09-1.34] 3.76E-04 1.24 4.05E-07
1.11
[1.01-1.22] 3.77E-02 1.18 2.30E-07
1.10
[1.04-1.16] 4.82E-04 1.13 1.83E-09
21 rs1788413 43.8 C 1.30
[1.12-1.51] 6.15E-04
1.40
[1.13-1.75] 2.74E-03 1.33 6.38E-06
0.98
[0.88-1.08] 6.67E-01 1.10 1.38E-02 - - - -
Nature Genetics: doi:10.1038/ng.2384

11
Supplementary Table 3. The nearby genes of the associated SNPs listed in Table 1 and Supplementary Table 2
CHR SNP Position Allele Nearby Gene Distance (bp)
2 rs2268361 49055116 T/C FSHR 11960||180018
2 rs2349415 49101336 C/T FSHR 58180||133798
2 rs10865238 49122308 A/G FSHR 79152||112826
9 rs4744370 96517614 C/T FBP1||C9orf3 -75990||-11201
9 rs4385527 96688408 G/A C9orf3 159593||200854
9 rs3802457 96781157 G/A C9orf3 252342||108105
11 rs1894116 101575849 G/A YAP1 89308||33510
12 rs2069408 54650588 A/G CDK2 3762||2247
12 rs705702 54676903 G/A LOC100131294 16904||937
12 rs11171739 54756892 C/T RPS26||ERBB3 -32618||-3267
12 rs877636 54766850 G/A ERBB3 6691||16545
12 rs2292239 54768447 T/G ERBB3 8288||14948
12 rs2272046 64510728 C/A HMGA2 6221||135610
16 rs4784165 50905320 G/T LOC388276||TOX3 -238956||-124098
19 rs2059807 7117109 G/A INSR 53843||127902
20 rs6022786 51880710 A/G ZNF217||LOC100128404 -247667||-43734
Nature Genetics: doi:10.1038/ng.2384

12
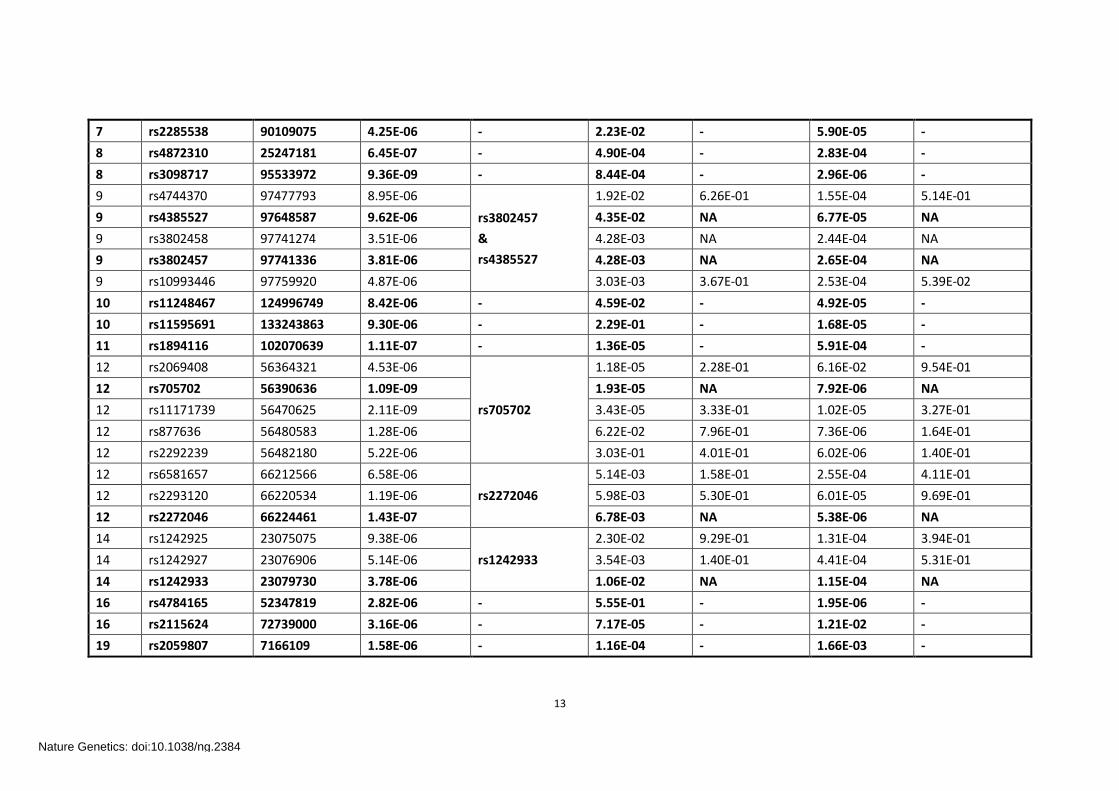
Supplementary Table 4. Regression analysis to test for independent association
CHR Test SNP BP Test SNP Pa Conditioned
on
GWAS I GWAS II
Test SNP P Conditioned
SNP P Test SNP P
Conditioned
SNP P
1 rs1012282 103427381 6.06E-06
rs10493988
2.86E-06 4.11E-01 1.28E-02 7.40E-02
1 rs11164648 103436141 2.05E-06 2.09E-06 8.67E-01 8.23E-02 1.87E-01
1 rs1903787 103444497 8.52E-06 1.37E-05 4.11E-01 1.57E-02 2.49E-01
1 rs4908288 103551477 5.14E-06 5.20E-06 5.52E-01 2.21E-02 7.82E-01
1 rs11586849 103553607 1.45E-06 3.17E-06 4.40E-01 1.33E-01 6.09E-01
1 rs1337195 103554293 4.18E-06 8.64E-06 8.41E-01 4.65E-02 8.50E-01
1 rs12142575 103558163 5.46E-06 2.86E-06 NA 3.44E-02 1.94E-01
1 rs7550118 103563102 6.43E-06 1.33E-05 NA 1.35E-02 9.05E-02
1 rs1415359 103564441 3.39E-06 1.58E-04 8.82E-01 1.11E-02 3.73E-01
1 rs10493988 103566156 1.20E-06 2.86E-06 NA 3.91E-02 NA
1 rs11164672 103571751 5.57E-06 1.58E-04 8.29E-02 9.92E-03 8.74E-01
2 rs6546199 25683447 8.64E-06 - 3.16E-02 - 9.56E-05 -
2 rs2268361 49201612 8.82E-06 rs2349415
&
rs2268361
6.68E-03 NA 4.19E-04 NA
2 rs2349415 49247832 2.56E-07 1.60E-01 NA 3.72E-07 NA
2 rs10865238 49268804 3.33E-06 1.51E-01 6.81E-01 3.01E-06 3.39E-01
2 rs2268361 49201612 8.82E-06
rs13405728
6.68E-03 9.64E-03 4.19E-04 6.10E-04
2 rs2349415 49247832 2.56E-07 1.60E-01 2.25E-01 3.72E-07 8.59E-07
2 rs10865238 49268804 3.33E-06 1.51E-01 2.58E-01 3.01E-06 5.49E-06
3 rs4857114 94213083 3.58E-06 - 1.34E-02 - 8.54E-05 -
4 rs4588519 29303608 8.07E-06 - 2.50E-02 - 7.73E-05 -
Nature Genetics: doi:10.1038/ng.2384
13
7 rs2285538 90109075 4.25E-06 - 2.23E-02 - 5.90E-05 -
8 rs4872310 25247181 6.45E-07 - 4.90E-04 - 2.83E-04 -
8 rs3098717 95533972 9.36E-09 - 8.44E-04 - 2.96E-06 -
9 rs4744370 97477793 8.95E-06
rs3802457
&
rs4385527
1.92E-02 6.26E-01 1.55E-04 5.14E-01
9 rs4385527 97648587 9.62E-06 4.35E-02 NA 6.77E-05 NA
9 rs3802458 97741274 3.51E-06 4.28E-03 NA 2.44E-04 NA
9 rs3802457 97741336 3.81E-06 4.28E-03 NA 2.65E-04 NA
9 rs10993446 97759920 4.87E-06 3.03E-03 3.67E-01 2.53E-04 5.39E-02
10 rs11248467 124996749 8.42E-06 - 4.59E-02 - 4.92E-05 -
10 rs11595691 133243863 9.30E-06 - 2.29E-01 - 1.68E-05 -
11 rs1894116 102070639 1.11E-07 - 1.36E-05 - 5.91E-04 -
12 rs2069408 56364321 4.53E-06
rs705702
1.18E-05 2.28E-01 6.16E-02 9.54E-01
12 rs705702 56390636 1.09E-09 1.93E-05 NA 7.92E-06 NA
12 rs11171739 56470625 2.11E-09 3.43E-05 3.33E-01 1.02E-05 3.27E-01
12 rs877636 56480583 1.28E-06 6.22E-02 7.96E-01 7.36E-06 1.64E-01
12 rs2292239 56482180 5.22E-06 3.03E-01 4.01E-01 6.02E-06 1.40E-01
12 rs6581657 66212566 6.58E-06
rs2272046
5.14E-03 1.58E-01 2.55E-04 4.11E-01
12 rs2293120 66220534 1.19E-06 5.98E-03 5.30E-01 6.01E-05 9.69E-01
12 rs2272046 66224461 1.43E-07 6.78E-03 NA 5.38E-06 NA
14 rs1242925 23075075 9.38E-06
rs1242933
2.30E-02 9.29E-01 1.31E-04 3.94E-01
14 rs1242927 23076906 5.14E-06 3.54E-03 1.40E-01 4.41E-04 5.31E-01
14 rs1242933 23079730 3.78E-06 1.06E-02 NA 1.15E-04 NA
16 rs4784165 52347819 2.82E-06 - 5.55E-01 - 1.95E-06 -
16 rs2115624 72739000 3.16E-06 - 7.17E-05 - 1.21E-02 -
19 rs2059807 7166109 1.58E-06 - 1.16E-04 - 1.66E-03 -
Nature Genetics: doi:10.1038/ng.2384

14
20 rs6022786 52447303 4.05E-07 - 1.72E-04 - 3.76E-04 -
21 rs1788413 43788690 6.38E-06 - 6.15E-04 - 2.74E-03 -
Nature Genetics: doi:10.1038/ng.2384

15
Supplementary Table 5. Identified T1D/T2D susceptibility alleles of the newly reported PCOS susceptibility regions.
First Author/ Journal/Study Disease/Trait Region Reported
Gene(s)
Strongest
SNP-Risk Allele
P-value OR SNPs Reported in Our Study
SNP-Risk Allele OR R2
(CHB/CEU)
Plagnol V, PLoS Genet.
Genome-wide association analysis
of autoantibody positivity in type 1
diabetes cases.
Type 1
diabetes
12q13.2 ERBB3 rs2292239-T 3 x 10-27 1.30 rs2292239-T 1.25 NR
12q13.2 IKZF4 rs1701704-T 5 x 10-18 1.25 rs705702-G 1.27 0.810/0.904
Voight BF, Nat Genet. Twelve type
2 diabetes susceptibility loci
identified through large-scale
association analysis.
Type 2
diabetes
12q14.3 HMGA2 rs1531343-C 4 x 10⁻⁹ 1.10 rs2272046-A 1.43 0.002/0.003
Barrett JC, Nat Genet.
Genome-wide association study
and meta-analysis find that over
40 loci affect risk of type 1
diabetes.
Type 1
diabetes
12q13.2 ERBB3 rs2292239-? 2 x 10-25 NR rs2292239-T 1.25 NR
Cooper JD, Nat Genet.
Meta-analysis of genome-wide
association study data identifies
additional type 1 diabetes risk loci.
Type 1
diabetes
12q13.2 ERBB3 rs2292239-A 3 x 10-16 NR rs2292239-T 1.25 NR
Hakonarson H, Diabetes. A novel
susceptibility locus for type 1
diabetes on Chr12q13 identified by
a genome-wide association study.
Type 1
diabetes
12q13.2 RAB5B,
SUOX, IKZF4,
ERBB3, CDK2
rs1701704-C 9 x 10⁻¹⁰ 1.25 rs705702-G 1.27 0.810/0.904
Nature Genetics: doi:10.1038/ng.2384
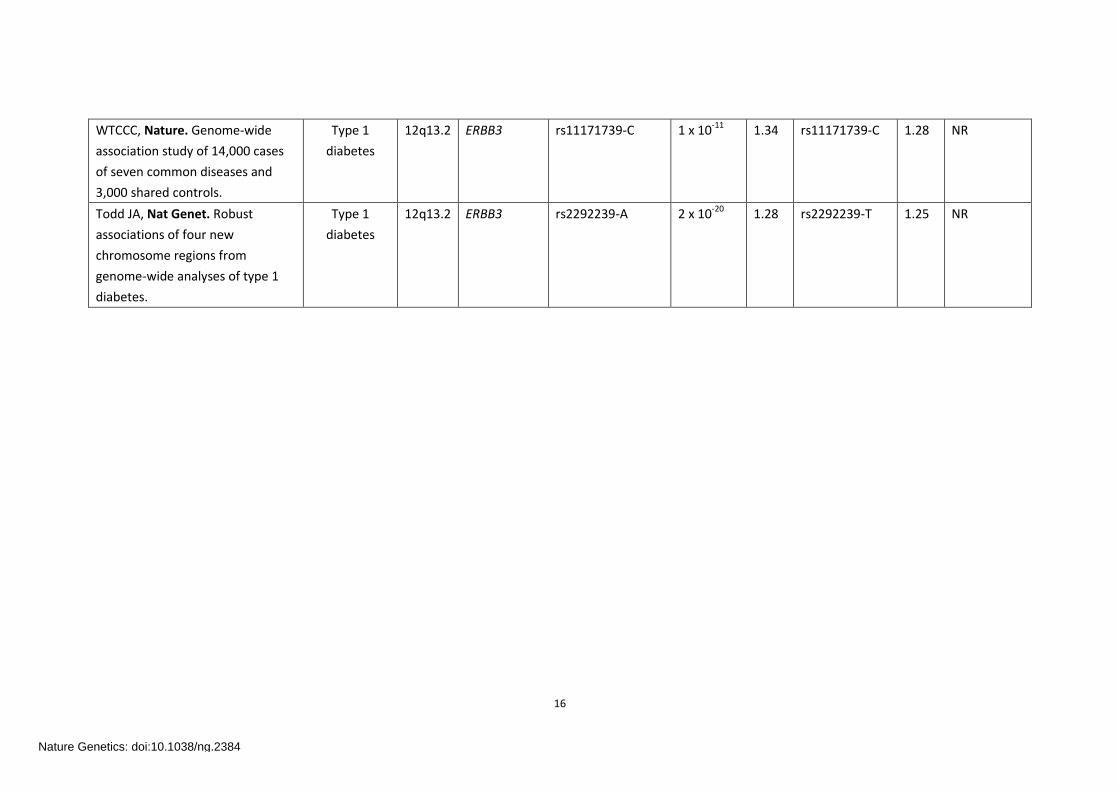
16
WTCCC, Nature. Genome-wide
association study of 14,000 cases
of seven common diseases and
3,000 shared controls.
Type 1
diabetes
12q13.2 ERBB3 rs11171739-C 1 x 10-11 1.34 rs11171739-C 1.28 NR
Todd JA, Nat Genet. Robust
associations of four new
chromosome regions from
genome-wide analyses of type 1
diabetes.
Type 1
diabetes
12q13.2 ERBB3 rs2292239-A 2 x 10-20 1.28 rs2292239-T 1.25 NR
Nature Genetics: doi:10.1038/ng.2384

17
Supplementary Table 6. Gene expression analysis of the candidate genes between PCOS and controls from 5 available datasets
PUBMED GEO ID Gene probe_id FC Regulation P Samples Description Platform(s)
17563058 GSE6798
INSR 226450_at 1.10 DOWN 6.30E-03
Skeletal muscle of 16 PCOS
patients and 13 healthy
control subjects
Affymetrix
HG-U133_Plus_2
SUOX 204067_at 1.12 DOWN 6.05E-02
YAP1 213342_at 1.17 DOWN 1.13E-01
RAB5B 201276_at 1.06 UP 1.64E-01
ZNF217 203739_at 1.18 UP 1.65E-01
HMGA2 208025_s_at 1.09 DOWN 1.87E-01
RPS26 217753_s_at 1.04 DOWN 0.66301
18560589 GSE8157
INSR 226450_at 1.12 DOWN 5.28E-03
Skeletal muscle of 10 PCOS
patients and 13 healthy
control subjects
Affymetrix
HG-U133_Plus_2
YAP1 213342_at 1.24 DOWN 3.32E-02
RPS26 217753_s_at 1.23 DOWN 3.45E-02
SUOX 204067_at 1.15 DOWN 3.50E-02
CDK2 204252_at 1.11 DOWN 3.85E-02
HMGA2 208025_s_at 1.15 DOWN 3.96E-02
C9orf3 212848_s_at 1.06 DOWN 1.37E-01
15598877 GSE1615
ZNF217 203739_at 1.58 UP 3.40E-03
Theca cells from the ovaries of
5 PCOS patients and 4 normal
women
Affymetrix
HG-U133A &
HG-U133B
INSR 226212_s_at 1.30 UP 6.23E-03
ERBB3 202454_s_at 1.29 DOWN 1.77E-02
RAB5B 201276_at 1.17 UP 1.32E-01
Nature Genetics: doi:10.1038/ng.2384

18
RPS26 217753_s_at 1.16 UP 0.67043
17148555 GSE5850
HMGA2 208025_s_at 1.14 DOWN 7.50E-02 Oocytes of 6 PCOS women
and 6 normal
Affymetrix
HG-U133_Plus_2 INSR 213792_s_at 3.00 UP 1.92E-01
RPS26 217753_s_at 1.56 UP 0.69551
17062763 GSE5090 RPS26 217753_s_at 1.32 DOWN 3.32E-01
Omental adipose tissue
samples obtained from 8
morbidly obese PCOS patients
and 7 morbidly obese
non-PCOS women
Affymetrix
HG-U133A
Nature Genetics: doi:10.1038/ng.2384

19
Supplementary Table 7. Expression quantitative trait loci (eQTL) analysis of associated SNPs for lymphoblastic cell lines of HAPMAP female
samples.
CHR SNP Gene Probe
HAPMAP-FEMALES
(N=105)
CHB+JPT-FEMALES
(N=45)
CEU-FEMALES
(N=30)
YRI-FEMALES
(N=30)
BETA P BETA P BETA P BETA P
2 rs2268361
FSHR GI_31657135-A
-0.0055 0.5752 0.0234 0.2548 -0.0088 0.7470 -0.0313 0.1705
2 rs2349415 0.0069 0.4972 -0.0083 0.7701 0.0035 0.8491 -0.0104 0.5870
2 rs10865238 0.0053 0.6276 0.0051 0.8619 -0.0132 0.4637 -0.0020 0.9165
9 rs4744370
FBP1 GI_16579887-S
-0.0150 0.4397 0.0427 0.3885 -0.0533 0.0370 -0.0170 0.6438
9 rs4385527 0.0026 0.9093 0.0755 0.1594 -0.0415 0.1507 -0.0658 0.1643
9 rs3802457 -0.0323 0.3863 -0.0767 0.2913 NA NA 0.0167 0.7048
9 rs4744370
C9orf3 GI_24432057-S
-0.0154 0.3232 -0.0442 0.0705 0.0013 0.9668 0.0495 0.1953
9 rs4385527 0.0126 0.4998 -0.0052 0.8472 0.0252 0.4481 -0.1083 0.0259
9 rs3802457 -0.0140 0.6306 0.0042 0.9043 NA NA 0.0117 0.8136
11 rs1894116 YAP1 GI_20986484-S -0.0097 0.5544 0.0032 0.8627 0.0153 0.8156 -0.0513 0.0925
12 rs2069408
CDK2 GI_16936529-A
0.0194 0.7240 -0.0658 0.3449 0.0329 0.7736 -0.1872 0.2206
12 rs705702 -0.0290 0.6032 -0.1227 0.0941 -0.0505 0.6267 -0.2572 0.1599
12 rs11171739 -0.1218 0.0012 -0.0442 0.5515 -0.1255 0.1605 0.0091 0.9178
12 rs877636 -0.0805 0.0519 -0.0442 0.5515 -0.1490 0.1117 0.1208 0.0504
12 rs2292239 -0.1292 0.0039 -0.0442 0.5515 -0.1490 0.1117 -0.1290 0.0250
12 rs2069408
RAB5B GI_33943097-S
-0.0340 0.4413 -0.0250 0.6612 0.0469 0.5736 0.0952 0.4644
12 rs705702 -0.0845 0.0581 -0.0395 0.5155 -0.0657 0.3835 0.0261 0.868
12 rs11171739 0.0268 0.3892 -0.0967 0.1059 -0.0408 0.5374 0.0001 0.9990
12 rs877636 -0.0269 0.4235 -0.0967 0.1059 -0.0883 0.1998 -0.0955 0.0680
Nature Genetics: doi:10.1038/ng.2384

20
12 rs2292239 -0.0303 0.4105 -0.0967 0.1059 -0.0883 0.1998 0.0258 0.6110
12 rs2069408
SUOX GI_4557866-S
0.0033 0.8660 -0.0311 0.2511 0.0417 0.2164 -0.0036 0.9505
12 rs705702 -0.0140 0.4801 -0.0316 0.2729 -0.0075 0.809 -0.0445 0.5267
12 rs11171739 -0.0172 0.2095 -0.0070 0.8077 -0.0328 0.2216 0.0222 0.5050
12 rs877636 -0.0153 0.3044 -0.0070 0.8077 -0.0410 0.1444 0.0109 0.6522
12 rs2292239 -0.0206 0.2041 -0.0070 0.8077 -0.0410 0.1444 -0.0104 0.6487
12 rs2069408
RPS26 GI_15011935-S
0.2459 4.37E-03 0.5792 1.16E-10 0.4037 9.58E-03 -0.2863 0.1313
12 rs705702 0.4142 9.13E-07 0.6798 7.25E-15 0.6243 1.86E-07 0.1975 0.3935
12 rs11171739 0.5194 1.03E-27 0.5632 2.07E-08 0.5876 2.43E-09 0.4518 3.80E-07
12 rs877636 0.4715 1.76E-16 0.5632 2.07E-08 0.5228 7.43E-06 0.1571 0.0413
12 rs2292239 0.4187 3.31E-10 0.5632 2.07E-08 0.5228 7.43E-06 0.0998 0.1778
12 rs2069408
ERBB3 GI_4503596-S
-0.0063 0.5568 0.0003 0.9867 -0.0080 0.7399 0.0135 0.6606
12 rs705702 -0.0009 0.9316 0.0019 0.9086 0.0091 0.676 -0.0269 0.4659
12 rs11171739 0.0049 0.5094 -0.0054 0.7452 0.0177 0.3540 -0.0261 0.1298
12 rs877636 0.0037 0.6509 -0.0054 0.7452 0.0174 0.3857 -0.0088 0.4888
12 rs2292239 0.0040 0.6522 -0.0054 0.7452 0.0174 0.3857 0.0009 0.9409
12 rs2272046 HMGA2 GI_14141182-S 0.0101 0.9067 0.0660 0.1574 -0.1203 0.7881 NA NA
16 rs4784165 TOX3 GI_29747038-S -0.0346 0.3611 -0.0134 0.8516 -0.0646 0.4068 0.0021 0.9157
19 rs2059807 INSR GI_4557883-S 0.0078 0.8712 0.0114 0.8760 0.1286 0.1823 0.0689 0.545
20 rs6022786 ZNF217 GI_40807454-S 0.0540 0.2830 0.0592 0.4869 0.0039 0.9663 0.0493 0.3526
Nature Genetics: doi:10.1038/ng.2384

21
Supplementary Table 8. Characteristics of PCOS case/control subjects
Group Number Age BMI T
GWAS I PCOS 744 28.85±3.62 24.55±3.99 81.11±21.03
Control 895 30.68±4.68 22.683.23 N/A
GWAS II PCOS 1510 28.12±2.75 24.59±3.17 58.45±20.01
Control 2106 53.95±7.18 24.93±3.85 N/A
REP I PCOS 1908 28.01±3.01 24.23±3.19 54.69±19.91
Control 1913 31.29±5.00 22.49±2.17 32.39±13.26
REP II PCOS 6318 27.83±3.11 23.72±3.18 60.25±22.61
Control 5665 29.52±4.75 21.95±2.32 35.73±12.41
Nature Genetics: doi:10.1038/ng.2384
22
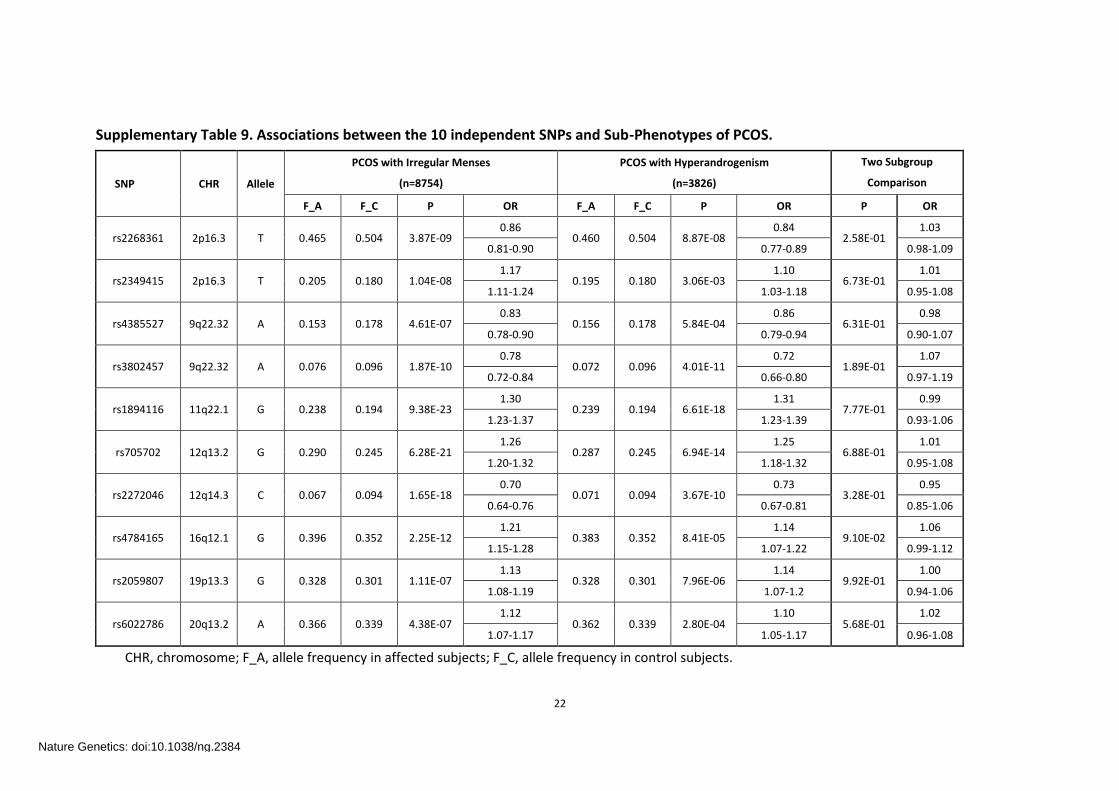
Supplementary Table 9. Associations between the 10 independent SNPs and Sub-Phenotypes of PCOS.
SNP CHR Allele
PCOS with Irregular Menses
(n=8754)
PCOS with Hyperandrogenism
(n=3826)
Two Subgroup
Comparison
F_A F_C P OR F_A F_C P OR P OR
rs2268361 2p16.3 T 0.465 0.504 3.87E-09 0.86
0.460 0.504 8.87E-08 0.84
2.58E-01 1.03
0.81-0.90 0.77-0.89 0.98-1.09
rs2349415 2p16.3 T 0.205 0.180 1.04E-08 1.17
0.195 0.180 3.06E-03 1.10
6.73E-01 1.01
1.11-1.24 1.03-1.18 0.95-1.08
rs4385527 9q22.32 A 0.153 0.178 4.61E-07 0.83
0.156 0.178 5.84E-04 0.86
6.31E-01 0.98
0.78-0.90 0.79-0.94 0.90-1.07
rs3802457 9q22.32 A 0.076 0.096 1.87E-10 0.78
0.072 0.096 4.01E-11 0.72
1.89E-01 1.07
0.72-0.84 0.66-0.80 0.97-1.19
rs1894116 11q22.1 G 0.238 0.194 9.38E-23 1.30
0.239 0.194 6.61E-18 1.31
7.77E-01 0.99
1.23-1.37 1.23-1.39 0.93-1.06
rs705702 12q13.2 G 0.290 0.245 6.28E-21 1.26
0.287 0.245 6.94E-14 1.25
6.88E-01 1.01
1.20-1.32 1.18-1.32 0.95-1.08
rs2272046 12q14.3 C 0.067 0.094 1.65E-18 0.70
0.071 0.094 3.67E-10 0.73
3.28E-01 0.95
0.64-0.76 0.67-0.81 0.85-1.06
rs4784165 16q12.1 G 0.396 0.352 2.25E-12 1.21
0.383 0.352 8.41E-05 1.14
9.10E-02 1.06
1.15-1.28 1.07-1.22 0.99-1.12
rs2059807 19p13.3 G 0.328 0.301 1.11E-07 1.13
0.328 0.301 7.96E-06 1.14
9.92E-01 1.00
1.08-1.19 1.07-1.2 0.94-1.06
rs6022786 20q13.2 A 0.366 0.339 4.38E-07 1.12
0.362 0.339 2.80E-04 1.10
5.68E-01 1.02
1.07-1.17 1.05-1.17 0.96-1.08
CHR, chromosome; F_A, allele frequency in affected subjects; F_C, allele frequency in control subjects.
Nature Genetics: doi:10.1038/ng.2384
23
Supplementary Note
The exact pathophysiology of PCOS is complex and largely unclear with respect to
initiating event. In general, underlying hormonal imbalance is assumed to be created
by a combination of increased androgens and/or insulin resistance secondarily
leading to polycystic ovarian changes. It is believed that genetic and environmental
contributors to hormonal disturbances work together with other confounding
factors, including obesity, ovarian dysfunction and hypothalamic pituitary
abnormalities, to produce the ultimate clinical presentations1,2. Hyperandrogenism is
an especially well-established contributor to PCOS aetiology, detected in about 30%
to 80% PCOS cases3. Insulin resistance is also present in approximately 50% to 80% of
women with PCOS, through augmenting androgen production and increasing free
androgens by reducing sex hormone binding globulin4. Moreover, obesity perse
increases hyperandrogenism, hirsutism, infertility and pregnancy complications of
PCOS5,6. In PCOS, obesity is believed to worsen the insulin resistance, exacerbates
reproductive and metabolic features. Many genes could thus contribute to the PCOS
phenotype. Whether genes are directly involved in the origin on the above pathways
are pivotal to understanding PCOS.
We further correlated the association of those 10 independent SNPs (including the
8 new loci) in our PCOS cases with irregular menses or hyperandrogenism (versus
controls) (Supplementary Table 9). Except for rs3802457 conferring more risk to
hyperandrogenism, the other tested SNPs are all strongly associated with subgroup
of irregular menses, and less strong with hyperandrogenism. But further comparisons
Nature Genetics: doi:10.1038/ng.2384

24
of the two subgroups with the 10 markers show no significant difference
(Supplementary Table 9). To be noted, hyperandrogenism is not a universal finding in
Han Chinese with PCOS; thus, findings might be different in a Caucasian population.
To compare gene expression of these candidate genes between PCOS patients and
healthy control subjects, we downloaded several datasets (GSE67987, GSE81578,
GSE16159, GSE585010, GSE509011) from NCBI's Gene Expression Omnibus (GEO).
These datasets were all generated on Affymetrix arrays, and the normalization and
gene expression analysis were conducted using the same protocol (Online Methods).
Several genes showed different expression pattern with nominal significance (P<0.05)
between PCOS cases and normal controls (Supplementary Table 6). INSR and RPS26
were differentially expressed in three datasets; however, the regulation directions
also differed among different tissues. INSR mRNA levels were decreased in muscles
of PCOS patients, while increased in ovarian theca cells. HMGA2 is down-regulated in
muscles and oocytes, and ZNF217 is up-regulated in muscles and theca cells. In order
to investigate the relationship between the PCOS susceptibility alleles and
expression levels of related genes, a published expression quantitative trait loci
(eQTL) dataset(GSE3612)12-14 was analyzed (Supplementary Table 7). RPS26
expression trait was significantly associated with the candidate SNPs of 12q13.2, in
which the most significant SNP is rs11171739 (P=1.03×10⁻²⁷); the cis regulation
pattern is consistent with several other cell types reports15-18. However, Rotival et al.
also identified rs11171739 as a cis eQTL of SUOX (P=3.08×10⁻¹⁸) in circulating
monocyte samples from European population15. The minor allele effect of
Nature Genetics: doi:10.1038/ng.2384
25
rs11171739 on RPS26 expression (increase) or over-expression in the theca cells and
oocytes from PCOS patients are consistent with our results (minor allelic OR=1.39).
Thus clues may be provided for understanding the mechanisms among GWAS loci
and PCOS. However, patterns of co-expression might differ among different tissues,
and systematic variations were always introduced during experiments15. Further
functional studies should be performed to validate the relationship between GWAS
loci and PCOS.
Notably, many of the signals we report have no ostensible relationship with those
of BMI loci reported elsewhere in GWASs investigating condition. One explanation
may be that PCOS cases in Chinese have relatively much lower mean BMI compared
to most PCOS cases in western settings19. Thus, we suggest large scale GWAS be
carried out in Western population because we may be detecting signals more
relevant to non-obesity related PCOS, whereas their populations may reveal new
variants specifically related to obese PCOS.
Reference
1. Al-Zaid, M., Towers, P.A., Scott, C.J. & Al-Shoumer, K.A. Ovarian steroids modulate
neuroendocrine dysfunction in polycystic ovary syndrome. J Endocrinol Invest 28, 882-892
(2005).
2. Legro, R.S. & Strauss, J.F. Molecular progress in infertility: polycystic ovary syndrome. Fertility
and sterility 78, 569-576 (2002).
3. Azziz, R. et al. The Androgen Excess and PCOS Society criteria for the polycystic ovary
syndrome: the complete task force report. Fertility and sterility 91, 456-488 (2009).
4. Legro, R.S., Castracane, V.D. & Kauffman, R.P. Detecting insulin resistance in polycystic ovary
syndrome: purposes and pitfalls. Obstetrical & gynecological survey 59, 141-154 (2004).
5. Kiddy, D.S. et al. Differences in clinical and endocrine features between obese and non-obese
subjects with polycystic ovary syndrome: an analysis of 263 consecutive cases. Clinical
endocrinology 32, 213-220 (1990).
6. Balen, A.H. et al. Andrology: Polycystic ovary syndrome: the spectrum of the disorder in 1741
Nature Genetics: doi:10.1038/ng.2384

26
patients. Human Reproduction 10, 2107-2111 (1995).
7. Skov, V. et al. Reduced expression of nuclear-encoded genes involved in mitochondrial
oxidative metabolism in skeletal muscle of insulin-resistant women with polycystic ovary
syndrome. Diabetes 56, 2349-2355 (2007).
8. Skov, V. et al. Pioglitazone enhances mitochondrial biogenesis and ribosomal protein
biosynthesis in skeletal muscle in polycystic ovary syndrome. PLoS One 3, e2466 (2008).
9. Wood, J.R. et al. Valproate-induced alterations in human theca cell gene expression: clues to
the association between valproate use and metabolic side effects. Physiological genomics 20,
233-243 (2005).
10. Wood, J.R., Dumesic, D.A., Abbott, D.H. & Strauss Iii, J.F. Molecular abnormalities in oocytes
from women with polycystic ovary syndrome revealed by microarray analysis. Journal of
Clinical Endocrinology & Metabolism 92, 705-713 (2007).
11. Cortón, M. et al. Differential gene expression profile in omental adipose tissue in women
with polycystic ovary syndrome. Journal of Clinical Endocrinology & Metabolism 92, 328-337
(2007).
12. Stranger, B.E. et al. Population genomics of human gene expression. Nature genetics 39,
1217-1224 (2007).
13. Stranger, B.E. et al. Relative impact of nucleotide and copy number variation on gene
expression phenotypes. Science 315, 848-853 (2007).
14. Stranger, B.E. et al. Genome-wide associations of gene expression variation in humans. PLoS
genetics 1, e78 (2005).
15. Rotival, M. et al. Integrating Genome-Wide Genetic Variations and Monocyte Expression
Data Reveals Trans-Regulated Gene Modules in Humans. PLoS genetics 7, e1002367 (2011 ).
16. Dixon, A.L. et al. A genome-wide association study of global gene expression. Nature genetics
39, 1202-1207 (2007).
17. Schadt, E.E. et al. Mapping the genetic architecture of gene expression in human liver. PLoS
biology 6, e107 (2008).
18. Idaghdour, Y. et al. Geographical genomics of human leukocyte gene expression variation in
southern Morocco. Nature genetics 42, 62-67 (2009).
19. Guo, M. et al. Comparison of the phenotype of Chinese versus Dutch Caucasian women
presenting with polycystic ovary syndrome and oligo/amenorrhoea. Human Reproduction 27,
1481-1488 (2012).
Nature Genetics: doi:10.1038/ng.2384