Genome-Wide Association Mapping of Quantitative Traits in ...MOUSE GENETIC RESOURCES Genome-Wide...
8
MOUSE GENETIC RESOURCES Genome-Wide Association Mapping of Quantitative Traits in Outbred Mice Weidong Zhang,* ,1 Ron Korstanje,* ,1 Jill Thaisz, † Frank Staedtler, ‡ Nicole Harttman, ‡ Lingfei Xu, † Minjie Feng, † Liane Yanas, † Hyuna Yang,* William Valdar, § Gary A. Churchill,* and Keith DiPetrillo †,2 *The Jackson Laboratory, Bar Harbor, Maine 04609, † Novartis Institutes for BioMedical Research and Novartis Pharmaceutical Corporation, East Hanover, New Jersey 07936, ‡ Novartis Pharmaceutical Corporation, Basel, Switzerland 4033, and § Department of Genetics, University of North Carolina, Chapel Hill, North Carolina 27599 ABSTRACT Recent developments in high-density genotyping and statistical analysis methods that have enabled genome-wide association studies in humans can also be applied to outbred mouse populations. Increased recombination in outbred populations is expected to provide greater mapping resolution than traditional inbred line crosses, improving prospects for identifying the causal genes. We carried out genome-wide association mapping by using 288 mice from a commercially available outbred stock; NMRI mice were genotyped with a high-density single-nucleotide polymorphism array to map loci influencing high-density lipoprotein cholesterol, systolic blood pressure, triglyceride levels, glucose, and urinary albumin-to-creatinine ratios. We found significant associations (P , 10 25 ) with high-density lipoprotein cholesterol and identified Apoa2 and Scarb1, both of which have been previously reported, as candidate genes for these associations. Additional suggestive associations (P , 10 23 ) identified in this study were also concordant with published quantitative trait loci, suggesting that we are sampling from a limited pool of genetic diversity that has already been well characterized. These findings dampen our enthusiasm for currently available commercial outbred stocks as genetic mapping resources and highlight the need for new outbred populations with greater genetic diversity. Despite the lack of novel associations in the NMRI population, our analysis strategy illustrates the utility of methods that could be applied to genome-wide association studies in humans. KEYWORDS Mouse Genetic Resource Linkage analysis using crosses between inbred mouse strains is a pow- erful method for detecting genetic loci underlying quantitative traits (i.e., quantitative trait loci; QTL). However, mapping resolution is typically too coarse to identify the causal genes. Several breeding strategies, including heterogeneous stocks, advanced intercross lines, and the collaborative cross (CC), can produce populations with in- creased recombination and improved mapping resolution (Flint et al. 2005). Recently, both wild-caught and commercial stocks of outbred mice have been proposed as resources for genetic fine mapping (Aldinger et al. 2009; Laurie et al. 2007; Yalcin et al. 2010). Yalcin et al. surveyed genetic variation in 66 commercial outbred stocks and identified several with high average minor allele frequency (MAF), low levels of linkage disequilibrium (LD), and absence of population struc- ture as the most promising choices for mapping studies. Outbred populations have been used previously to refine the location of QTL detected in other mapping studies (Talbot et al. 1999). Rgs2 was identified as the causal gene for anxiety related traits in mice by analyzing 729 outbred MF1 mice with 42 SNP markers spanning a previously mapped QTL interval on Chromosome 1 (Yalcin et al. 2004). Outbred populations have also been used for de novo QTL mapping similar to genome-wide association (GWA) studies with hu- man populations (Ghazalpour et al. 2008; Huang et al. 2009; Valdar et al. 2006). Valdar et al. used an outbred population for genome-wide analysis of cardiovascular disease (CVD) risk factors, but their study included relatively few single nucleotide polymorphisms (SNPs; 13,500) compared with the . 100,000 genetic markers typically used in human GWA studies. Copyright © 2012 Zhang et al. doi: 10.1534/g3.111.001792 Manuscript received June 23, 2011; accepted for publication October 6, 2011 This is an open-access article distributed under the terms of the Creative Commons Attribution Unported License (http://creativecommons.org/licenses/ by/3.0/), which permits unrestricted use, distribution, and reproduction in any medium, provided the original work is properly cited. Supporting information is available online at http://www.g3journal.org/lookup/ suppl/doi:10.1534/g3.111.001792/-/DC1 1 These authors contributed equally to this work. 2 Corresponding author: Novartis Institutes for BioMedical Research and Novartis Pharmaceutical Corporation, 1 Health Plaza, Bldg 437, Room 4331, East Hanover, NJ 07936. E-mail: [email protected] Volume 2 | February 2012 | 167
Transcript of Genome-Wide Association Mapping of Quantitative Traits in ...MOUSE GENETIC RESOURCES Genome-Wide...
MOUSE GENETIC RESOURCES
Genome-Wide Association Mapping of QuantitativeTraits in Outbred MiceWeidong Zhang,*,1 Ron Korstanje,*,1 Jill Thaisz,† Frank Staedtler,‡ Nicole Harttman,‡ Lingfei Xu,†
Minjie Feng,† Liane Yanas,† Hyuna Yang,* William Valdar,§ Gary A. Churchill,* and Keith DiPetrillo†,2
*The Jackson Laboratory, Bar Harbor, Maine 04609, †Novartis Institutes for BioMedical Research and NovartisPharmaceutical Corporation, East Hanover, New Jersey 07936, ‡Novartis Pharmaceutical Corporation, Basel, Switzerland4033, and §Department of Genetics, University of North Carolina, Chapel Hill, North Carolina 27599
ABSTRACT Recent developments in high-density genotyping and statistical analysis methods that haveenabled genome-wide association studies in humans can also be applied to outbred mouse populations.Increased recombination in outbred populations is expected to provide greater mapping resolution thantraditional inbred line crosses, improving prospects for identifying the causal genes. We carried outgenome-wide association mapping by using 288 mice from a commercially available outbred stock; NMRImice were genotyped with a high-density single-nucleotide polymorphism array to map loci influencinghigh-density lipoprotein cholesterol, systolic blood pressure, triglyceride levels, glucose, and urinaryalbumin-to-creatinine ratios. We found significant associations (P , 1025) with high-density lipoproteincholesterol and identified Apoa2 and Scarb1, both of which have been previously reported, as candidategenes for these associations. Additional suggestive associations (P , 1023) identified in this study were alsoconcordant with published quantitative trait loci, suggesting that we are sampling from a limited pool ofgenetic diversity that has already been well characterized. These findings dampen our enthusiasm forcurrently available commercial outbred stocks as genetic mapping resources and highlight the need fornew outbred populations with greater genetic diversity. Despite the lack of novel associations in the NMRIpopulation, our analysis strategy illustrates the utility of methods that could be applied to genome-wideassociation studies in humans.
KEYWORDS
Mouse GeneticResource
Linkage analysis using crosses between inbred mouse strains is a pow-erful method for detecting genetic loci underlying quantitative traits(i.e., quantitative trait loci; QTL). However, mapping resolution istypically too coarse to identify the causal genes. Several breedingstrategies, including heterogeneous stocks, advanced intercross lines,and the collaborative cross (CC), can produce populations with in-creased recombination and improved mapping resolution (Flint et al.2005). Recently, both wild-caught and commercial stocks of outbred
mice have been proposed as resources for genetic fine mapping(Aldinger et al. 2009; Laurie et al. 2007; Yalcin et al. 2010). Yalcinet al. surveyed genetic variation in 66 commercial outbred stocks andidentified several with high average minor allele frequency (MAF), lowlevels of linkage disequilibrium (LD), and absence of population struc-ture as the most promising choices for mapping studies.
Outbred populations have been used previously to refine thelocation of QTL detected in other mapping studies (Talbot et al.1999). Rgs2 was identified as the causal gene for anxiety related traitsin mice by analyzing 729 outbred MF1 mice with 42 SNP markersspanning a previously mapped QTL interval on Chromosome 1 (Yalcinet al. 2004). Outbred populations have also been used for de novo QTLmapping similar to genome-wide association (GWA) studies with hu-man populations (Ghazalpour et al. 2008; Huang et al. 2009; Valdaret al. 2006). Valdar et al. used an outbred population for genome-wideanalysis of cardiovascular disease (CVD) risk factors, but their studyincluded relatively few single nucleotide polymorphisms (SNPs;�13,500) compared with the . 100,000 genetic markers typically usedin human GWA studies.
Copyright © 2012 Zhang et al.doi: 10.1534/g3.111.001792Manuscript received June 23, 2011; accepted for publication October 6, 2011This is an open-access article distributed under the terms of the CreativeCommons Attribution Unported License (http://creativecommons.org/licenses/by/3.0/), which permits unrestricted use, distribution, and reproduction in anymedium, provided the original work is properly cited.Supporting information is available online at http://www.g3journal.org/lookup/suppl/doi:10.1534/g3.111.001792/-/DC11These authors contributed equally to this work.2Corresponding author: Novartis Institutes for BioMedical Research and NovartisPharmaceutical Corporation, 1 Health Plaza, Bldg 437, Room 4331, East Hanover,NJ 07936. E-mail: [email protected]
Volume 2 | February 2012 | 167
Our GWA study using 288 outbred NMRI mice genotyped withthe Mouse Diversity Array (Yang et al. 2009) was performedwith multiple aims in mind. The first aim was to map loci associatedwith cardiovascular disease risk, including HDL cholesterol, bloodpressure, triglyceride levels, glucose, and urinary albumin-to-creatinineratio (ACR). The second aim was to compare results obtained withdifferent genome scan statistics and permutation strategies. The finalgoal was to critically assess the utility of the NMRI population asa resource for GWA studies because commercial outbred stocks havebeen proposed as a novel and potentially powerful resource for geneticmapping (Yalcin et al. 2010).
MATERIALS AND METHODSAnimalsThree hundred 4- to 6-week-old, male NMRI mice were purchasedfrom Taconic (Taconic Europe) and individually housed in solid-bottom cages with free access to water and standard rodent chow (cat.no. 8604; Harlan-Teklad). The vivarium was maintained on a 12-hrlight/dark cycle (6 AM to 6 PM) at 20-24�.
PhenotypingTail-cuff blood pressure was measured in 8-week-old mice usinga CODA-6 noninvasive blood pressure monitoring system (KentScientific) as previously described (Feng et al. 2009). All of the meas-urements were taken in the afternoon, and values from 100 measure-ment cycles (20 per day for 5 days) were used to calculate the averagesystolic blood pressure (SBP), diastolic blood pressure (DPB), meanarterial pressure (MAP), and standard deviation (SD) for each mouse.Any reading .2 SD from the mean for an individual mouse wasdiscarded, and final averages and SD were recalculated. Only micehaving a final average SBP calculated from 40 cycles, of 100 cyclesmaximum, were used for the QTL analyses. Once the mice were 10weeks of age, spot urine samples were collected daily in the morningfor 1 week, and the urine for each mouse was pooled and centrifugedfor 5 min at 10,000 rpm. The supernatant was transferred into a cleantube and urinary albumin and creatinine concentrations were mea-sured using a Roche Hitachi 917 Clinical Chemistry Autoanalyzer. Aseries of mouse albumin standards (Kamiya Biomedical Co., Seattle,WA) was also quantified and the final urinary albumin concentrationin each sample was calculated by linear regression from the mousealbumin standards. This method has been shown to accurately quantifyalbumin concentrations in mouse urine samples (Grindle et al. 2006).
Blood samples were obtained from each mouse by submandibularpuncture after a 4-hr fast. Plasma samples were frozen at 280� forlater measurement of total cholesterol (CHL), high-density lipoproteincholesterol (HDL-C), triglycerides (TG), and glucose (GLU) usinga Beckman Synchron CX5 Chemistry Analyzer. All traits exceptACR were approximately normally distributed. The ACR was highlyskewed, with many mice having an ACR of zero. We tested a varietyof ACR transformations, but all lead to similar conclusions. We reportthe result for the log-transformed variable logACR ¼ loge(ACR 1 1).The lipid traits (HDL-C and CHL) and the blood pressure traits (SBP,DBP and MAP) were highly correlated among themselves (r . 0.97),and although we analyzed each of the individual traits, results wereessentially identical and we report here only our analysis of HDL andSBP, as representative of these groups of traits.
GenotypingGenomic DNA was isolated by phenol:chloroform extraction fromtail biopsies taken from the 290 NMRI mice that completed thephenotyping protocol, and DNA concentrations were quantified using
a Nanodrop spectrophotometer. Samples were genotyped by theNovartis Genomics Factory using the Mouse Diversity GenotypingArray (Yang et al. 2009). SNP genotypes were called using a customsoftware pipeline for this array platform (http://cgd.jax.org/tools/mousedivgeno/). A total of 581,672 SNP genotypes were obtainedfor each of the 290 animals. Of these, 244,840 SNPs (42%) werepolymorphic. Two samples were identified with 99% identity of theirSNP genotypes and were removed from subsequent analysis, whichwas carried out on the remaining 288 mice. We computed the MAFand tested Hardy-Weinberg equilibrium for each polymorphic SNPand retained 103,872 SNPs with MAF . 2%, Hardy-Weinberg equi-librium x2 , 20 and missing values , 40%. The small proportion(1.3%) of missing genotypes that remained were imputed using fast-Phase (Scheet and Stephens 2006). Identical SNPs within a 2Mb in-terval were collapsed resulting in a total of 44,428 unique SNPgenotypes that were used in subsequent analyses.
Population structureThe squared correlation coefficient (r2) was calculated for all pairs ofSNPs within a 50-Mb sliding window across the genome. Locallyweighted scatter plot smoothing (LOWESS) was used to computethe median r2 as a function of distance between pairs of SNPs. Theinformation content of each SNP was computed as the symmetricShannon entropy, (pln(p) 1 (1 2 p)ln(1 2 p)), where p is theMAF of the SNP. In addition to the NMRI population, we computedinformation content of the full set of 581,672 SNPs genotyped in 79strains of the BxD recombinant inbred panel and in the eight founderstrains of the collaborative cross (Yang et al. 2011). A kinship matrixbetween the individual animals was calculated based on identity bystate among the 44,428 SNPs using EMMA (Kang et al. 2008). Hier-archical clustering of 288 animals was computed and visualized usingthe heatmap function in R 2.10.0 (R Development Core Team 2009).
Association mappingWe carried out single-locus association genome scans on diallelicSNPs using each of three statistical tests. We computed a linear trendtest (1df) by regressing the trait on genotype scores 21, 0, 1 corre-sponding to AA, AB, and BB genotypes, respectively. The trend testassumes additive genetic effects at a locus. We also conducted analysisof variance (ANOVA; 2df) that allows for both additive and dominanteffects at a locus. Finally we used the EMMA software to fit a mixedlinear model at each SNP (described in detail by Kang et al. 2008).EMMA accounts for population structure by modeling the variance-covariance matrix as a function of this estimated kinship matrix. Thegenetic and residual variance components, sg and se, are estimatedusing an efficient implementation of restricted maximum likelihood inEMMA. A linear trend test is computed for each SNP genome-wideand a –log(p) score is reported. Fixed effect covariates can be includedin genome scans using any of these statistical tests, which enabledimplementation of conditional scans and forward stepwise search byincluding previously selected marker genotypes as covariates.
Genome-wide significance thresholdsTo assess genome-wide significance of the association statistics, weused a novel simulation technique. We transformed each phenotypeusing van der Waerden’s scores (Conover 1999) and estimated geneticand residual variances of the transformed data for each trait usingEMMA. For each phenotype, we simulated 288 trait values by sam-pling from a multivariate normal distribution using the mvrnormfunction in R with covariance matrix defined by the estimated kin-ship. We then replaced the simulated values with observed values ina manner that preserved the rank order of the simulated values.
168 | W. Zhang et al.
Specifically, we computed the ranks of the original and of the simu-lated data. The original data value with rank k is then reassigned to theindividual with kth rank among the simulated data. In this way, weobtain a permutation of the original data that retains the correlationstructure implied by the kinship matrix. We performed a genome scanusing the permuted trait values and recorded the largest –log(p)scores. This was repeated 100 times. We fitted a generalized extremevalue distribution to these scores and derived significance thresholdsfrom the quantiles of this distribution (Knijnenburg et al. 2009).
We also used a free data permutation analysis for each phenotype(Churchill and Doerge 1994). The validity of this simple permutationtest is based on an assumption that the individuals in the study areexchangeable. This assumption is not valid when there are differentdegrees of familial relationship present in the study population; how-ever, we used the simple free permutation as a reference point toassess the impact of applying a more complex, but justifiable, pro-cedure in the context of this study.
Multilocus analysisComplex traits are influenced by variation at multiple loci and wecan often obtain more realistic estimates of effect sizes andsignificance by considering the simultaneous effects of multipleloci. We used forward stepwise regression with bootstrap resam-pling (Valdar et al. 2009) to develop multi-locus models for eachtrait. We first created 100 resampled data sets consisting of traitand genotype values from 288 animals that are sampled at randomfrom the original data with replacement. We performed forwardstepwise regression on each resampled data set to obtain a multi-locus regression model with 20 SNPs. The number 20 is arbitrary.All that is required is to ensure that the number of SNPs in theregression model is more than the number that could significantlyinfluence the trait. We calculated the resample model inclusionprobabilities (RMIP) for each SNP m as
RMIPm 51R
XR
r51
irm
where R ¼ 100 is the number of resampled data sets irm ¼ 1 if atleast one SNP within 6 w Mb of SNP m was included in the modelof sample r, otherwise irm ¼ 0. We varied the window size w from60.5 Mb to 64 Mb.
Precision analysisTo assess the genome-wide average precision of mapping in thispopulation, we performed a simulation study using the observedgenotype data. We randomly sampled a SNP from the genome andsimulated trait values assuming that this SNP was the causal locus. Wesimulated an effect size corresponding to the same percentage of totalvariance explained as the HDL QTL on Chromosome 1 (reported inthe section QTL mapping, below). Trait values were sampled froma multivariate normal distribution using mvrnorm in R with correla-tion structure defined by the kinship matrix and the genetic and re-sidual variances were as estimated for HDL. We removed the selectedSNP from the data and performed a genome scan with EMMA. Thedistance between the SNP with highest –log(p) and the target SNP wasrecorded. In cases where a group of adjacent SNPs had tied P values,we computed the median distance between the location of associationpeak and the target SNP. We repeated this process 1000 times, andcomputed the distribution of distances from the peak to the targetSNP. A small proportion of association peaks were observed on
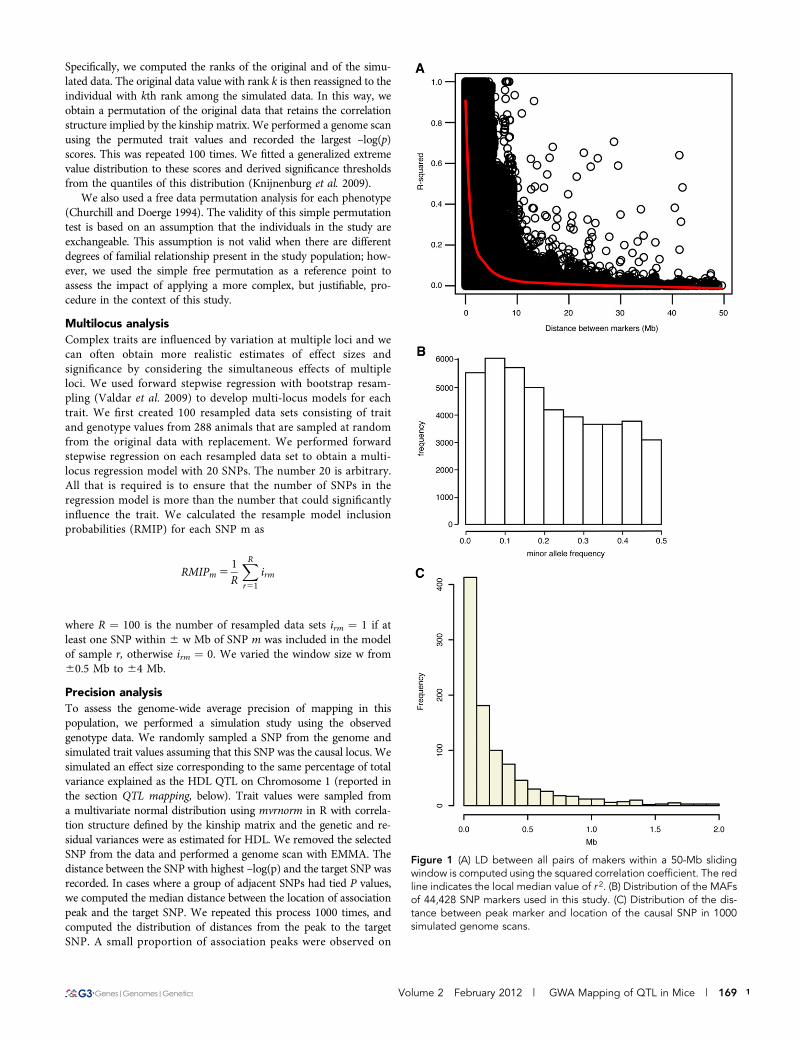
Figure 1 (A) LD between all pairs of makers within a 50-Mb slidingwindow is computed using the squared correlation coefficient. The redline indicates the local median value of r 2. (B) Distribution of the MAFsof 44,428 SNP markers used in this study. (C) Distribution of the dis-tance between peak marker and location of the causal SNP in 1000simulated genome scans.
1Volume 2 February 2012 | GWA Mapping of QTL in Mice | 169

different chromosomes from the target SNP. These events wererecorded but were excluded from the distance calculation.
RESULTSGenetic parameters of the NMRI populationWe used SNP genotypes to characterize the genomes of 288 NMRImice to assess their suitability as a mapping population (the finaldataset is available at http://cgd.jax.org/datasets/datasets.shtml). Thesquared correlation coefficient (r2) between SNPs was used as a mea-sure of LD. We observed a sharp decay of LD with increasing physicaldistance between SNPs (Figure 1A). The LD decay radius, defined asthe physical distance at which r2 falls below 0.5, was 1.2 Mb. Thedistribution of MAFs was broad with 22,205 SNPs having MAF. 0.2(Figure 1B). The average MAF was 0.23, excluding 336,832 invariantSNPs and 128,923 SNPs with MAF , 0.02. These values for the LDdecay radius and average MAF are comparable with other NMRIcohorts, a finding that suggests that NMRI would be a good choicefor association mapping (Yalcin et al. 2010).
Population structure due to stratification or to family relationshipswithin a sample can adversely affect mapping studies if not accounted
for in the analysis (Cheng et al. 2010). We assessed the degree ofstructure in our NMRI population using hierarchical clustering of288 animals based on the kinship matrix. We observed a few smallgroups of related animals, but there appeared to be no major structurein our population (supporting information, Figure S1). The meanpercentage of identical SNPs (of the 44K filtered set) between anypair of animals was 74%, with a range from 69 to 91%.
Mapping resolution was assessed using simulations as describe inMaterials and Methods. The maximum –log(p) occurred on the samechromosome as the simulated QTL in 99.3% of simulations. When thepeak was on the same chromosome it was within 1.34 Mb in 95% ofsimulations, within 0.52 Mb in 80% of simulations, and within 0.17 Mbin 50% of simulations (Figure 1C). The long right tail of the distribu-tion indicates that mapping resolution was low in some regions of thegenome.
The size and distribution of LD blocks was assessed visually usingHaploview (Barrett et al. 2005) (Figure S2, A and B). LD blocks arelarger in our NMRI sample than is usually seen in a human populationsample. There are also substantial regions of long-range LD, which istypical of laboratory mouse populations (Petkov et al. 2005) and couldpotentially create spurious associations at SNP markers that are distantfrom the causal polymorphism (Dickson et al. 2010).
To assess the genetic diversity of NMRI relative to other mousepopulations, we computed the mean information content (Shannonentropy) for all 581K SNP markers in our NMRI population, in 79BxD recombinant inbred strains, and in the eight founder strains ofthe Collaborative Cross (CC) (Collaborative Cross Consortium 2012).The average entropies for all SNP markers in NMRI, BxD, and CCwere 0.10, 0.14, and 0.43, respectively. We computed average infor-mation content in 4-Mb windows across the genome in each of thesepopulations to assess local variation in informative SNPs (Figure 2). Anumber of regions of low diversity were identified in the NMRI andBxD populations, for example on Chromosome 10, consistent withprevious reports of the distribution of genetic diversity in classicalinbred mouse strains (Yang et al. 2007). The distribution of informa-tive SNPs in the CC population is uniformly high.
Genome-wide significance thresholdsWe used two methods to assess significance thresholds for GWAmapping, simulation and unrestricted permutation. We applied theseto each of three methods for measuring association: the trend test,ANOVA test, and mixed model. The estimated genome-widesignificance thresholds for glucose, HDL cholesterol, systolic bloodpressure, and triglycerides were similar across all of these combina-tions. Values ranged from 5.12 to 5.90, but no single method or traitwas consistently higher or lower than another (Table 1). The excep-tion was logACR, which was skewed compared with the other traits(Figure S3). The genome-wide 5% threshold for logACR ranged from
Figure 2 SNP information content. The average Shannon entropy inof SNPs in 4-Mb windows across the genome is shown for NMRI (A), 79BxD recombinant inbred strains (B), and the eight founder strains ofcollaborative founder strains (C).
n Table 1 Genome-wide significance (0.05) thresholds for associationmapping test statistics
HDL SBP GLU TG log(ACR)
Simulation Trendtest 5.37 5.17 5.53 5.51 8.00ANOVA 5.40 5.05 5.44 5.81 14.62EMMA 5.31 5.16 5.50 5.46 8.01
Permutation Trendtest 5.46 5.29 5.51 5.74 7.79ANOVA 5.40 5.16 5.10 5.53 12.45EMMA 5.37 5.23 5.41 5.66 7.76
HDL, high-density lipoprotein; SBP, systolic blood pressure; GLU, glucose, TG,triglyceride; log(ACR), log-transformed albumin-to-creatinine ratio; ANOVA,analysis of variance.
170 | W. Zhang et al.
7.76 to 7.79 for EMMA and the simple trend test, but the ANOVAthresholds were substantially greater (12.45 using permutation). Weattribute this to the combination of extreme logACR values with rareheterozygous genotypes that arise in many permutations of the data.The trend test is robust to this effect, but it risks missing associationswith large dominant components.
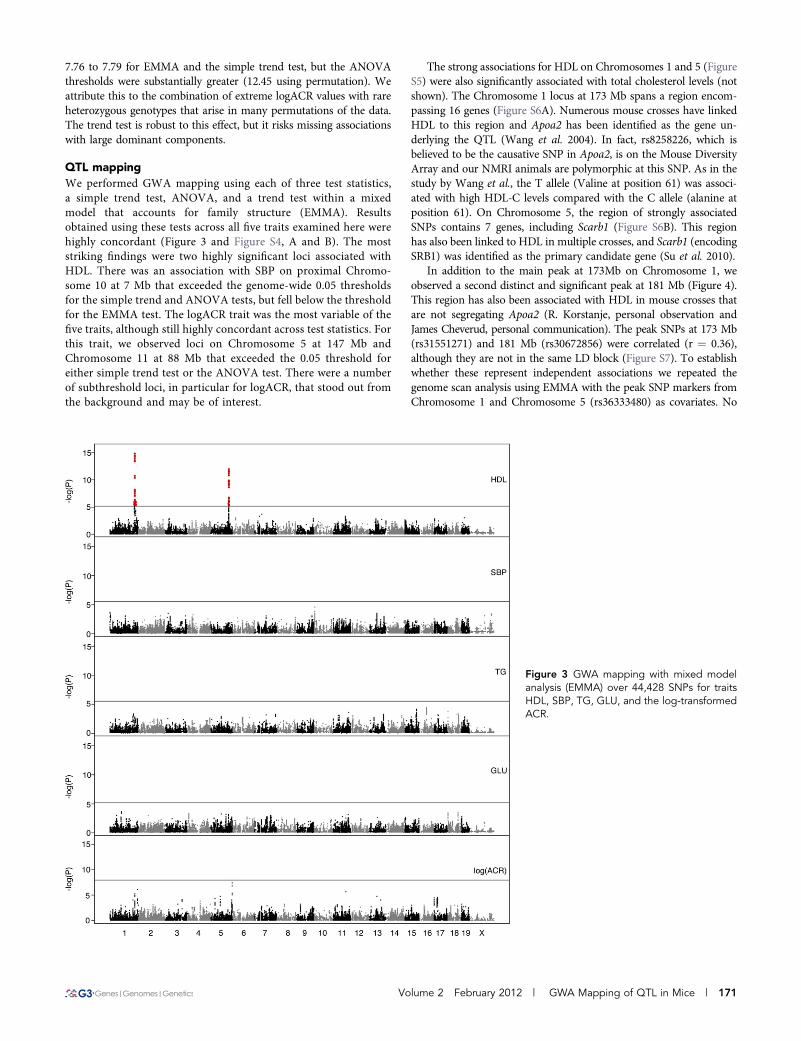
QTL mappingWe performed GWA mapping using each of three test statistics,a simple trend test, ANOVA, and a trend test within a mixedmodel that accounts for family structure (EMMA). Resultsobtained using these tests across all five traits examined here werehighly concordant (Figure 3 and Figure S4, A and B). The moststriking findings were two highly significant loci associated withHDL. There was an association with SBP on proximal Chromo-some 10 at 7 Mb that exceeded the genome-wide 0.05 thresholdsfor the simple trend and ANOVA tests, but fell below the thresholdfor the EMMA test. The logACR trait was the most variable of thefive traits, although still highly concordant across test statistics. Forthis trait, we observed loci on Chromosome 5 at 147 Mb andChromosome 11 at 88 Mb that exceeded the 0.05 threshold foreither simple trend test or the ANOVA test. There were a numberof subthreshold loci, in particular for logACR, that stood out fromthe background and may be of interest.
The strong associations for HDL on Chromosomes 1 and 5 (FigureS5) were also significantly associated with total cholesterol levels (notshown). The Chromosome 1 locus at 173 Mb spans a region encom-passing 16 genes (Figure S6A). Numerous mouse crosses have linkedHDL to this region and Apoa2 has been identified as the gene un-derlying the QTL (Wang et al. 2004). In fact, rs8258226, which isbelieved to be the causative SNP in Apoa2, is on the Mouse DiversityArray and our NMRI animals are polymorphic at this SNP. As in thestudy by Wang et al., the T allele (Valine at position 61) was associ-ated with high HDL-C levels compared with the C allele (alanine atposition 61). On Chromosome 5, the region of strongly associatedSNPs contains 7 genes, including Scarb1 (Figure S6B). This regionhas also been linked to HDL in multiple crosses, and Scarb1 (encodingSRB1) was identified as the primary candidate gene (Su et al. 2010).
In addition to the main peak at 173Mb on Chromosome 1, weobserved a second distinct and significant peak at 181 Mb (Figure 4).This region has also been associated with HDL in mouse crosses thatare not segregating Apoa2 (R. Korstanje, personal observation andJames Cheverud, personal communication). The peak SNPs at 173 Mb(rs31551271) and 181 Mb (rs30672856) were correlated (r ¼ 0.36),although they are not in the same LD block (Figure S7). To establishwhether these represent independent associations we repeated thegenome scan analysis using EMMA with the peak SNP markers fromChromosome 1 and Chromosome 5 (rs36333480) as covariates. No
Figure 3 GWA mapping with mixed modelanalysis (EMMA) over 44,428 SNPs for traitsHDL, SBP, TG, GLU, and the log-transformedACR.
Volume 2 February 2012 | GWA Mapping of QTL in Mice | 171
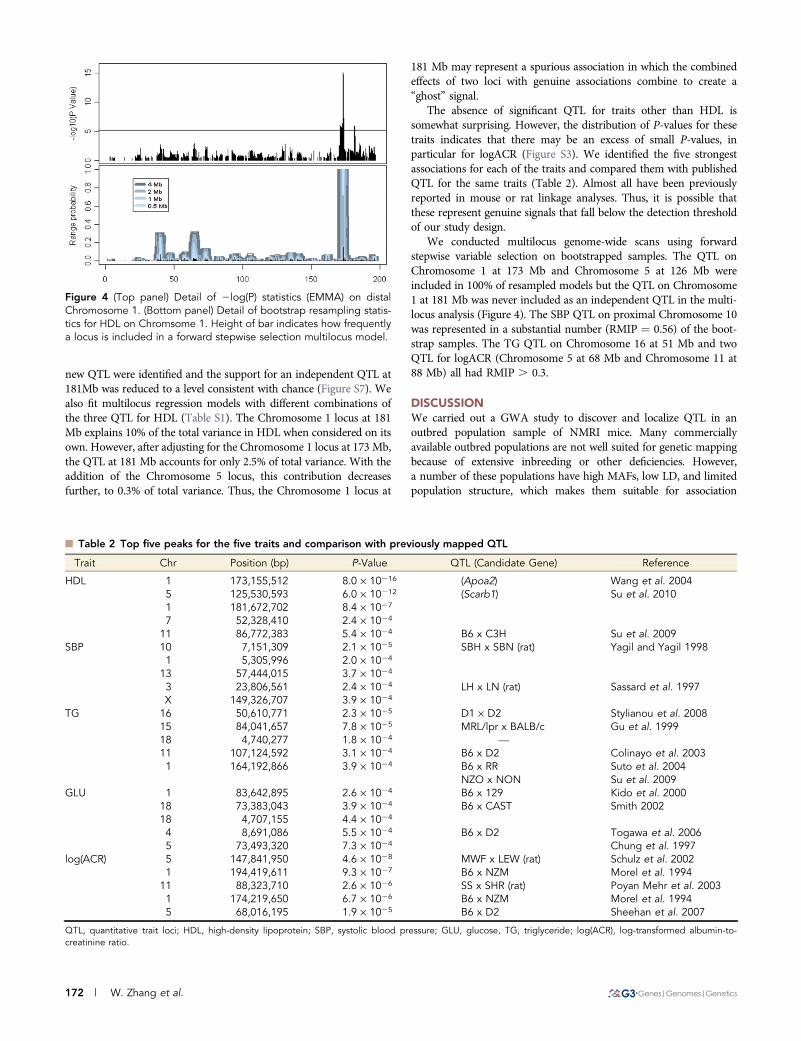
new QTL were identified and the support for an independent QTL at181Mb was reduced to a level consistent with chance (Figure S7). Wealso fit multilocus regression models with different combinations ofthe three QTL for HDL (Table S1). The Chromosome 1 locus at 181Mb explains 10% of the total variance in HDL when considered on itsown. However, after adjusting for the Chromosome 1 locus at 173 Mb,the QTL at 181 Mb accounts for only 2.5% of total variance. With theaddition of the Chromosome 5 locus, this contribution decreasesfurther, to 0.3% of total variance. Thus, the Chromosome 1 locus at
181 Mb may represent a spurious association in which the combinedeffects of two loci with genuine associations combine to create a“ghost” signal.
The absence of significant QTL for traits other than HDL issomewhat surprising. However, the distribution of P-values for thesetraits indicates that there may be an excess of small P-values, inparticular for logACR (Figure S3). We identified the five strongestassociations for each of the traits and compared them with publishedQTL for the same traits (Table 2). Almost all have been previouslyreported in mouse or rat linkage analyses. Thus, it is possible thatthese represent genuine signals that fall below the detection thresholdof our study design.
We conducted multilocus genome-wide scans using forwardstepwise variable selection on bootstrapped samples. The QTL onChromosome 1 at 173 Mb and Chromosome 5 at 126 Mb wereincluded in 100% of resampled models but the QTL on Chromosome1 at 181 Mb was never included as an independent QTL in the multi-locus analysis (Figure 4). The SBP QTL on proximal Chromosome 10was represented in a substantial number (RMIP ¼ 0.56) of the boot-strap samples. The TG QTL on Chromosome 16 at 51 Mb and twoQTL for logACR (Chromosome 5 at 68 Mb and Chromosome 11 at88 Mb) all had RMIP . 0.3.
DISCUSSIONWe carried out a GWA study to discover and localize QTL in anoutbred population sample of NMRI mice. Many commerciallyavailable outbred populations are not well suited for genetic mappingbecause of extensive inbreeding or other deficiencies. However,a number of these populations have high MAFs, low LD, and limitedpopulation structure, which makes them suitable for association
n Table 2 Top five peaks for the five traits and comparison with previously mapped QTL
Trait Chr Position (bp) P-Value QTL (Candidate Gene) Reference
HDL 1 173,155,512 8.0 · 10216 (Apoa2) Wang et al. 20045 125,530,593 6.0 · 10212 (Scarb1) Su et al. 20101 181,672,702 8.4 · 1027
7 52,328,410 2.4 · 1024
11 86,772,383 5.4 · 1024 B6 x C3H Su et al. 2009SBP 10 7,151,309 2.1 · 1025 SBH x SBN (rat) Yagil and Yagil 1998
1 5,305,996 2.0 · 1024
13 57,444,015 3.7 · 1024
3 23,806,561 2.4 · 1024 LH x LN (rat) Sassard et al. 1997X 149,326,707 3.9 · 1024
TG 16 50,610,771 2.3 · 1025 D1 · D2 Stylianou et al. 200815 84,041,657 7.8 · 1025 MRL/lpr x BALB/c Gu et al. 199918 4,740,277 1.8 · 1024 —
11 107,124,592 3.1 · 1024 B6 x D2 Colinayo et al. 20031 164,192,866 3.9 · 1024 B6 x RR Suto et al. 2004
NZO x NON Su et al. 2009GLU 1 83,642,895 2.6 · 1024 B6 x 129 Kido et al. 2000
18 73,383,043 3.9 · 1024 B6 x CAST Smith 200218 4,707,155 4.4 · 1024
4 8,691,086 5.5 · 1024 B6 x D2 Togawa et al. 20065 73,493,320 7.3 · 1024 Chung et al. 1997
log(ACR) 5 147,841,950 4.6 · 1028 MWF x LEW (rat) Schulz et al. 20021 194,419,611 9.3 · 1027 B6 x NZM Morel et al. 1994
11 88,323,710 2.6 · 1026 SS x SHR (rat) Poyan Mehr et al. 20031 174,219,650 6.7 · 1026 B6 x NZM Morel et al. 19945 68,016,195 1.9 · 1025 B6 x D2 Sheehan et al. 2007
QTL, quantitative trait loci; HDL, high-density lipoprotein; SBP, systolic blood pressure; GLU, glucose, TG, triglyceride; log(ACR), log-transformed albumin-to-creatinine ratio.
Figure 4 (Top panel) Detail of 2log(P) statistics (EMMA) on distalChromosome 1. (Bottom panel) Detail of bootstrap resampling statis-tics for HDL on Chromsome 1. Height of bar indicates how frequentlya locus is included in a forward stepwise selection multilocus model.
172 | W. Zhang et al.
mapping (Yalcin et al. 2010). Our NMRI mapping population satisfiedthese criteria and detected two significant QTL for HDL, demonstrat-ing that loci with large effect sizes are readily detectable and can bemapped with high resolution. However, the sample size of 288 micelacked the statistical power to detect alleles with small effects, leadingto a number of suggestive associations. Most of the top scoring sug-gestive associations in our study replicate previously reported QTL.Failure to identify new loci suggests that the NMRI population carriesmostly the same allelic variants characterized in complex traits anal-yses using classical inbred mouse strains.
Association mapping with outbred mouse populations is similar tohuman GWA studies in many respects, including the use of high-density SNP genotyping and genome-wide SNP-based associationtesting. We detected minimal population structure and observed rapiddecay of LD within our NMRI population. However, the rate of LDdecay is less than in wild-caught mice and human populations.Whereas there is no significant LD between markers more than 2 Mbapart in wild-caught mice (Laurie et al. 2007) and 0.5 Mb apart inhumans (Dawson et al. 2002), the distance is approx 10 Mb in NMRImice. As with human GWA studies, we assumed no previous knowl-edge of ancestral haplotypes in the founder population, which pre-cludes inference-based linkage analysis methods. Our study differsfrom a human GWA in that the environment and phenotyping aretightly controlled and the population size is much smaller than istypical in human studies.
We identified significant association peaks for only one trait, HDL.We investigated the 5 peaks with the smallest P-value for each trait tosee whether these non-significant peaks could be true associations.Nearly all were previously identified in mouse or rat linkage analyses.Concordance with known QTL suggests that these GWA peaks couldbe true-positive associations and that we could use the NMRI resultsto help identify candidate genes for the published QTL. For example,HDL was associated with a locus on Chromosome 11 (between 79.87and 96.67 Mb) that includes 316 genes. A cross between C57BL/6J andC3H/HeJ mice previously linked HDL to this locus with a 95% CIbetween 57.00 and 88.50 Mb (including 854 genes). Assuming thesame causal gene for the GWA and the QTL cross, we can narrowthe search for candidate genes to the overlapping region from 79.87 to88.50 Mb containing 177 genes. We can use high-density SNP data(Yang et al. 2011) to exclude regions that are identical-by-descentbetween C57BL/6J and C3H/HeJ mice based on the assumption thatregions with no genetic variation between the two strains are unlikelyto contain the QTL gene. In this way we eliminate 100 candidategenes. Of the 77 genes left in the interval, the gene encoding thehepatocyte nuclear factor 1b (Hnf1b) is a strong candidate becausegenetic deletion specifically in hepatocytes and bile duct cells signifi-cantly raises plasma cholesterol levels (Coffinier et al. 2002). Addi-tional work will be required to experimentally validate candidate genesfor these loci.
We expected the NMRI population to yield more significant QTLand to provide greater mapping resolution than we observed.Considering ancestry of NMRI, which originate from Swiss micefrom Lausanne, provides a possible explanation. The mice weremoved to the United States in 1926, transferred to the NIH in 1937,and subsequently inbred for 51 generations. The mice later moved tothe Naval Medical Research Institute (and obtained the name NMRI),to the Zentral Institut fur Verzuchstierzucht in Hannover, and finallyto Taconic. The bottleneck at the NIH likely reduced the geneticvariation greatly. Most existing outbred populations, including NMRI,were derived from classical laboratory inbred strains and as such willhave significant blind spots and limited haplotype diversity (Yang
et al. 2011). Limited genetic diversity and uneven distribution of poly-morphic loci may have limited the success of our mapping effortsusing the NMRI population.
Spurious QTL detection in GWA studies can occur for a variety ofreasons (Dickson et al. 2010). Multilocus QTL modeling can be usefulto evaluate the robustness of QTL detected. We identified two asso-ciation peaks for HDL on Chromosome 1 using single marker analysisbut only one QTL at 173 Mb was supported in the multilocus analysis,which suggests that the second QTL may represent a spurious finding.Yalcin et al. (2010) reported a significant association for HDL at theApoa2 locus. They also report secondary association signals at173.6Mb and 173.7Mb, substantially proximal to our locus at181Mb. This region of Chromosome 1 has a complex LD structurein our NMRI sample (Figure 4) and among mouse inbred strains(Petkov et al. 2005). As a result it is difficult to determine if any ofthe observed associations distal to Apoa2 are genuine or spurious.
Multiple testing presents a statistical challenge for both mouse andhuman GWA studies. The Bonferroni correction widely applied tohuman GWA analyses imposes a substantial multiple testing penalty,effectively limiting the ability to detect loci with small effects to reducethe detection of spurious loci. In our analysis, we used a novelpermutation technique to calculate significance thresholds throughsimulation. Although permutation tests have been shown to bepotentially misleading in the presence of family structure (Chenget al. 2010), our simulation strategy accounts for population structureand for non-normal trait distributions. This permutation methodcould also be applied to human GWA studies. Although thresholdsobtained with the simulation method did not differ substantially fromthose obtained with free permutation in this study, the twoapproaches would likely differ when applied to populations with morepronounced genetic structure. Therefore, we hesitate to recommendfree permutation without a deeper investigation of the issues.
Precision of QTL mapping is not well understood in humanGWA. We used a simulation approach to estimate mapping precisionin our NMRI population and established that we can localize a QTLwith large effect size to within 1.34 Mb of the greatest associationpeak. This result represents a genome-wide average and there maysubstantial local variation in mapping precision. This approach couldbe applied over a range of QTL effect sizes in any genotypedpopulation sample including human GWA studies. Our assessmentof mapping precision is tailored to the particular QTL found in thisstudy. QTL of smaller effect size or in the context of a complex geneticbackground may be mapped with less precision.
This study demonstrates that GWA analysis can be successfullyapplied to outbred mice populations to identify genetic variantsunderlying complex traits. GWA studies can complement classicallinkage analyses using inbred mouse crosses to refine QTL andidentify causal genes, and future studies using outbred populationswith greater genetic diversity should be even more powerful foridentifying causal genes. However, the promise of currently availablecommercial outbred populations is limited by low genetic diversityand the requirement for sample sizes substantially larger than theapproximately 00 animals used in this study.
ACKNOWLEDGMENTSThis work was supported by the Novartis Institutes for BioMedicalResearch, DK069381 (R.K.) from the NIDDK, HL095668 (R.K.) fromthe NHLBI, GM070683 (G.A.C.), and by the National Institute ofGeneral Medical Sciences Centers of Excellence in systems biologygrant GM076468 (R.K. and G.A.C.).
Volume 2 February 2012 | GWA Mapping of QTL in Mice | 173
LITERATURE CITEDAldinger, K. A., G. Sokoloff, D. M. Rosenberg, A. A. Palmer, and K. J. Millen,
2009 Genetic variation and population substructure in outbred CD-1mice: implications for genome-wide association studies. PLoS One 4:e4729.
Barrett, J. C., B. Fry, J. Maller, and M. J. Daly, 2005 Haploview: analysis andvisualization of LD and haplotype maps. Bioinformatics 21: 263–265.
Cheng, R., J. E. Lim, K. E. Samocha, G. Sokoloff, M. Abney et al.,2010 Genome-wide association studies and the problem of relatednessamong advanced intercross lines and other highly recombinant popula-tions. Genetics 185: 1033–1044.
Chung, W. K., M. Zheng, M. Chua, E. Kershaw, L. Power-Kehoe et al.,1997 Genetic modifiers of Leprfa associated with variability in insulinproduction and susceptibility to NIDDM. Genomics 41: 332–344.
Churchill, G. A., and R. W. Doerge, 1994 Empirical threshold values forquantitative trait mapping. Genetics 138: 963–971.
Coffinier, C., L. Gresh, L. Fiette, F. Tronche, G. Schutz et al., 2002 Bilesystem morphogenesis defects and liver dysfunction upon targeted de-letion of HNF1beta. Development 129: 1829–1838.
Colinayo, V. V., J. H. Qiao, X. Wang, K. L. Krass, E. Schadt et al.,2003 Genetic loci for diet-induced atherosclerotic lesions and plasmalipids in mice. Mamm. Genome 14: 464–471.
Collaborative Cross Consortium 2012 The genome architecture of theCollaborative Cross mouse genetic reference population. Genetics 190:389–401.
Conover, W. J., 1999 Practical nonparametric statistics, John Wiley, NewYork, Chichester.
Dawson, E., G. R. Abecasis, S. Bumpstead, Y. Chen, S. Hunt et al., 2002 Afirst-generation linkage disequilibrium map of human chromosome 22.Nature 418: 544–548.
Dickson, S. P., K. Wang, I. Krantz, H. Hakonarson, and D. B. Goldstein,2010 Rare variants create synthetic genome-wide associations. PLoSBiol. 8: e1000294.
Feng, M., M. E. Deerhake, R. Keating, J. Thaisz, L. Xu et al., 2009 Geneticanalysis of blood pressure in 8 mouse intercross populations. Hyperten-sion 54: 802–809.
Flint, J., W. Valdar, S. Shifman, and R. Mott, 2005 Strategies for mapping andcloning quantitative trait genes in rodents. Nat. Rev. Genet. 6: 271–286.
Ghazalpour, A., S. Doss, H. Kang, C. Farber, P. Z. Wen et al., 2008 High-resolution mapping of gene expression using association in an outbredmouse stock. PLoS Genet. 4: e1000149.
Grindle, S., C. Garganta, S. Sheehan, J. Gile, A. Lapierre et al., 2006 Validationof high-throughput methods for measuring blood urea nitrogen and uri-nary albumin concentrations in mice. Comp. Med. 56: 482–486.
Gu, L., M. W. Johnson, and A. J. Lusis, 1999 Quantitative trait locusanalysis of plasma lipoprotein levels in an autoimmune mouse model:interactions between lipoprotein metabolism, autoimmune disease, andatherogenesis. Arterioscler. Thromb. Vasc. Biol. 19: 442–453.
Huang, G. J., S. Shifman, W. Valdar, M. Johannesson, B. Yalcin et al.,2009 High resolution mapping of expression QTLs in heterogeneousstock mice in multiple tissues. Genome Res. 19: 1133–1140.
Kang, H. M., N. A. Zaitlen, C. M. Wade, A. Kirby, D. Heckerman et al.,2008 Efficient control of population structure in model organism as-sociation mapping. Genetics 178: 1709–1723.
Kido, Y., N. Philippe, A. A. Schaffer, and D. Accili, 2000 Genetic modifiersof the insulin resistance phenotype in mice. Diabetes 49: 589–596.
Knijnenburg, T. A., L. F. Wessels, M. J. Reinders, and I. Shmulevich,2009 Fewer permutations, more accurate P-values. Bioinformatics 25:i161–i168.
Laurie, C. C., D. A. Nickerson, A. D. Anderson, B. S. Weir, R. J. Livingstonet al., 2007 Linkage disequilibrium in wild mice. PLoS Genet. 3: e144.
Morel, L., U. H. Rudofsky, J. A. Longmate, J. Schiffenbauer, and E. K. Wakeland,1994 Polygenic control of susceptibility to murine systemic lupus erythe-matosus. Immunity 1: 219–229.
Petkov, P. M., J. H. Graber, G. A. Churchill, K. DiPetrillo, B. L. King et al.,2005 Evidence of a large-scale functional organization of mammalianchromosomes. PLoS Genet. 1: e33.
Poyan Mehr, A., A. K. Siegel, P. Kossmehl, A. Schulz, R. Plehm et al.,2003 Early onset albuminuria in Dahl rats is a polygenetic trait that isindependent from salt loading. Physiol. Genomics 14: 209–216.
Sassard, J., M. Vincent, V. Orea, P. Privat, and A. Bataillard, 1997 Geneticsof blood pressure and associated phenotypes in the Lyon rat. Clin. Exp.Hypertens. 19: 567–575.
Scheet, P., and M. Stephens, 2006 A fast and flexible statistical model forlarge-scale population genotype data: applications to inferring missinggenotypes and haplotypic phase. Am. J. Hum. Genet. 78: 629–644.
Schulz, A., A. Litfin, P. Kossmehl, and R. Kreutz, 2002 Genetic dissection ofincreased urinary albumin excretion in the munich wistar fromter rat. J.Am. Soc. Nephrol. 13: 2706–2714.
Sheehan, S., S. W. Tsaih, B. L. King, C. Stanton, G. A. Churchill et al.,2007 Genetic analysis of albuminuria in a cross between C57BL/6J andDBA/2J mice. Am. J. Physiol. Renal Physiol. 293: F1649–F1656.
Smith, S.A., 2002 Peroxisome proliferator-activated receptors and the regula-tion of mammalian lipid metabolism. Biochem. Soc. Trans. 30: 1086–1090.
Stylianou, I. M., S. R. Langley, K. Walsh, Y. Chen, C. Revenu et al.,2008 Differences in DBA/1J and DBA/2J reveal lipid QTL genes. J.Lipid Res. 49: 2402–2413.
Su, Z., N. Ishimori, Y. Chen, E. H. Leiter, G. A. Churchill et al., 2009 Fouradditional mouse crosses improve the lipid QTL landscape and identifyLipg as a QTL gene. J. Lipid Res. 50: 2083–2094.
Su, Z., M. S. Leduc, R. Korstanje, and B. Paigen, 2010 Untangling HDLquantitative trait loci on mouse chromosome 5 and identifying Scarb1and Acads as the underlying genes. J. Lipid Res. 51: 2706–2713.
Suto, J., Y. Takahashi, and K. Sekikawa, 2004 Quantitative trait locusanalysis of plasma cholesterol and triglyceride levels in C57BL/6J x RR F2mice. Biochem. Genet. 42: 347–363.
Talbot, C. J., A. Nicod, S. S. Cherny, D. W. Fulker, A. C. Collins et al.,1999 High-resolution mapping of quantitative trait loci in outbredmice. Nat. Genet. 21: 305–308.
Togawa, K., M. Moritani, H. Yaguchi, and M. Itakura, 2006 Multidimensionalgenome scans identify the combinations of genetic loci linked to diabetes-related phenotypes in mice. Hum. Mol. Genet. 15: 113–128.
Valdar, W., L. C. Solberg, D. Gauguier, S. Burnett, P. Klenerman et al.,2006 Genome-wide genetic association of complex traits in heteroge-neous stock mice. Nat. Genet. 38: 879–887.
Valdar, W., C. C. Holmes, R. Mott, and J. Flint, 2009 Mapping in structuredpopulations by resample model averaging. Genetics 182: 1263–1277.
Wang, X., R. Korstanje, D. Higgins, and B. Paigen, 2004 Haplotype analysisin multiple crosses to identify a QTL gene. Genome Res. 14: 1767–1772.
Yagil, Y., and C. Yagil, 1998 Genetic basis of salt-susceptibility in the Sabrarat model of hypertension. Kidney Int. 53: 1493–1500.
Yalcin, B., S. A. Willis-Owen, J. Fullerton, A. Meesaq, R. M. Deacon et al.,2004 Genetic dissection of a behavioral quantitative trait locus showsthat Rgs2 modulates anxiety in mice. Nat. Genet. 36: 1197–1202.
Yalcin, B., J. Nicod, A. Bhomra, S. Davidson, J. Cleak et al.,2010 Commercially available outbred mice for genome-wide associa-tion studies. PLoS Genet. 6: e1001085.
Yang, H., T. A. Bell, G. A. Churchill, and F. Pardo-Manuel de Villena,2007 On the subspecific origin of the laboratory mouse. Nat. Genet. 39:1100–1107.
Yang, H., Y. Ding, L. N. Hutchins, J. Szatkiewicz, T. A. Bell et al., 2009 Acustomized and versatile high-density genotyping array for the mouse.Nat. Methods 6: 663–666.
Yang, H., J. R. Wang, J. D. Didion, R. J. Buus, T. A. Bell et al., 2011 Subspecificorigin and haplotype diversity in the laboratory mouse. Nat. Genet. 43: 648–655.
Edited by Lauren M. McIntyre, Dirk-Jan de Koning,and 4 dedicated Associate Editors
174 | W. Zhang et al.