Fondation Mohammed VI pour la Protection de l'Environnement - … · 2014-08-13 · de las 3r a las...
222
Proceedings of 7th WEEC Niche 5: Ecological and green economies 0
Transcript of Fondation Mohammed VI pour la Protection de l'Environnement - … · 2014-08-13 · de las 3r a las...
Proceedings of 7th WEEC Niche 5: Ecological and
green economies
0
Le 7WEEC a été organisé sous le Haut patronage de Sa Majesté le Roi Mohammed VI, et sous la présidence effective de Son Altesse Royale la Princesse Lalla Hasnaa, par:
Co-Présidence du Congrès - Fondation Mohammed VI pour l’environnement (Fondation) Lahoucine Tijani - Secretariat Permanent (SP) Mario Salomone
Comité d’Orientation: Fondation: Lahoucine Tijani, Nouzha Alaoui, Mounir Temmam - SP: Mario Salomone, Dario Padovan, Roland Gerard Coordination Fondation-SP; Budget; Relations internationales; Programme Plénières et événements parallèles, workshops, tables rondes, Validation activités, Comités scientifiques
Comité Opérationnel de coordination Fondation:Nouzha Alaoui, Loubna Chaouni ComitéScientifique Fondation: Mounir Temmam, Ihssane El Marouani, Fatima Zohra Lahlali - SP: Isabel Orellana Comité Communication/ Presse Fondation: Hassan Taleb, Narjiss Zerhouni, Raja Bensaoud, Samuel Vallée - SP: Bianca La Placa, Veronica Ottria, Romina Anardo, Beppe Enrici - VG59: Davide Garetto, Nicola Zonta - Shem’s: Toufiq Kabbadj -Capstrat: Raja Bensaoud - Target: Mme Alami Comité Finances Fondation: Fatiha Bourhchouch SP: Claudia Gaggiottino, Roberto Ceschina, Federica Merlo, Eugenio Bernardi Comité Logistique SP: Bianca La Placa, Vanessa Vidano, Loredana Crucitti - Target: Houda Allam - S/Tours : Amina Smina Comité Eco Responsabilité Fondation: Abdelaziz Belhouji - SP: Pedro Vega Marcote - Target: Layla Skalli. Comité ‘Activités en Parallèle’ Fondation: Loubna Chaouni (Portes ouvertes), Latimad Zair (Espace tous acteurs), Najia Fatine, Kenza Khallafi (E-journal), Asmaa Faris (Ateliers pédagogiques, Side events et Espace Stand) - SP : Roland Gerard, Patrizia Bonelli, Stefano Moretto Actes sous la direction de Mario Salomone Coordination de la publication Bianca La Placa Couverture Francesca Scoccia Collaboration Veronica Ottria All rights reserved – Tous les droits réservés
© 2014, WEEC World Environmental Education Congress Network Istituto per l’Ambiente e l’Educazione Scholé Futuro onlus Strada del Nobile 86 - 10131 Torino (Italie) [email protected] www.environmental-education.org
ISBN 9788885313361
Proceedings of 7th WEEC Niche 5: Ecological and
green economies
2
Niche 5
Ecological economics and green economies
Les économies écologiques et les économies vertes
La economía ecológica y las economías verdes
البيئي واالقتصاد األخضر االقتصاد
Partecipants 5
Economie écologique et économie verte Synthèse des travaux de la niche 5 revu et enrichi par Mohamed Wakrim
12
Cleaning hypoxic ocean/inland-water zones. Converting floating minerals and nutrients stored in overpopulations of algaes and jellyfish choking ocean to feed starving desert soils Michele Baron
17
Le rôle de l’éducation à l’environnement dans la création des éco-entreprises marocaines. Une étude exploratoire Belabbes Sanaa, Chakir Ahmed
20
Cuestionar el modelo económico cuestionando el consumo Las nueve necesidades para la educación ambiental Nancy Virginia Benítez Esquivel, Rafael Tonatiuh Ramírez Beltrán
33
مستدامة وتنمية سليمة لبيئة رهان البيئية السياحة المغربي المتوسط األطلس) إفران إقليم: نموذج
السعيدي جميلة. ذة Imad, branat
40
Lessons from Nature. Using insights from nature to inspire a brighter future Richard Dawson, Kamen Chipev,Steve Bunce
53
Agricultural modernization in Goiás, Brazil, and its environmental impacts. Rationality and modernizing risk society Agustina Rosa Echeverria, Eloisa Pio de Santana
64
Caractérisation du fruit du cactus (Opuntia spp) au Maroc El mzouri Elhoussein, Youssef Elkharrassi, Boubker Nasser
82
La cultura del agua en la agricultura española. Gestión y consumo del agua desde la perspectiva de los agricultores andaluces Esther Mena Rodríguez, Miguel Ángel Fernández Jiménez
88
Italians’ attitude toward tap water A quantitative study in the Campania region Paola Pascale, G. Orazio Pascale, Federica Minutillo, Giovanni d’Errico,
Giancarlo Chiavazzo
98
Proceedings of 7th WEEC Niche 5: Ecological and
green economies
4
Socioenvironmental diagnosis with small familiar farmers. Perception about the socioenvironmental problems in Guarani Aquifer’s recharge area André Santachiara Fossaluza, Maria de Lourdes Spazziani
118
La imagen acerca de la sostenibilidad/insostenibilidad en empresas de economía social. Estudio de ideas previas Chiara Scalabrino, José Mª Oliva
130
Survay of cost for deployment of sustainability in a residence The cost difference between a residence and a sustainable conventional residence William de AraujoThomaz, Lucia Bressiani
159
Study of carbonate concrete Search for sustainability through compensatory measure William de AraujoThomaz, Edna Possan
171
الريف بجبال المستدامة والتنمية البيئية السياحة شمال الغربي بالريف والحسيمة شفشاون إقليمي حالة
المغربMohammed Tussi
178
Pagos por servicios ambientales: ¿Una opción viable para el financiamento del derrollo sostenible en Venezuela? Vladimir José Valera Mejías
184
Política medioambiental: la educación medioambiental María Rosa Vázquez Rodríguez
195
Intégration des préoccupations environnementales dans le Projet Arboriculture Fruitière (cas de la chaîne de valeur du palmier dattier) YAHYAOUI Abdelaziz
204
Partecipants
Renewable energy - Ecological economics and green economies Workshop Eric Yuah - Ninisry Of Energy And Water Resources
Lessons from Nature - Ecological economics and green economies Workshop Richard Dawson - Field Studies Council
Ecological economics and green economies - البيئة والمجتمع بواحات درعة الوسطى ورهان السياحة المستدامةPoster presentation
المغرب -عبد اللطيف الخليفي
Educación Ambiental en el proceso Licenciamiento - Ecological economics and green economies Poster presentation Anne Kassiadou Menezes - Celso Sanchez
Ecological economics and green economies - السياحة البيئية رهان لبيئة سليمة وتنمية مستدامةPoster presentation Imad BRANAT - Université Hassan II / Mohammedia-Casablanca, Faculté des lettres et des sciences humaines-Mohammedia ذة. جميلة السعيدي
EL TURISMO AGRO-ECOLÓGICO - Ecological economics and green economies Poster presentation Maria Aura Torres - Universidad De Los Andes Evelín Cadenas
STUDIES TO DEVELOP AN IMPROVED LOW COST SOLAR HEATER - Ecological economics and green economies Poster presentation Willian Mossmann - Federal University of Technology – Paraná (UTFPR) Renan Alex Kuntz; Cristiano Poleto
Educación para el consumo responsable en Venezuela - Ecological economics and green economies Poster presentation Jose Ali Moncada Rangel - UPEL Jesus Aranguren, Karem Gomez y Arturo Gomez
Modelo educativo ambiental para el manejo integral de cuencas - Ecological economics and green economies
Proceedings of 7th WEEC Niche 5: Ecological and
green economies
6
Poster presentation Jesus Aranguren - UPEL José Alí Moncada, Carlos Lugo, Julio Blones y Aliffer Mora
Socioenvironmental diagnosis with small familiar farmers - Ecological economics and green economies Poster presentation Andre Santachiara Fossaluza - Maria de Lourdes Spazziani
SURVEY OF COST FOR DEPLOYMENT OF SUSTAINABILITY IN A RESIDENCE - Ecological economics and green economies Poster presentation William Thomaz -Lucia Bressiani
Ecological Economics in Latin America: A growing movement for a sustainable development - Ecological economics and green economies Poster presentation Gabriel Zunino - Universidad Nacional de General Sarmiento
Advancing environmental learning for sustainability in the sailing tourism industry - Ecological economics and green economies Poster presentation Maria Daskolia - University of Athens Maria-Panagiota Grillia
Ecological economics and green economies - السياحة البيئية والتنمية المستدامة بجبال الريفPoster presentation Mohammed TUSSI -
AGRICULTURE MODERNIZATION IN GOIÁS – BRAZIL AND ITS ENVIRONMENTAL IMPACTS: MODERNIZING RATIONALITY AND RISK SOCIETY - Ecological economics and green economies Poster presentation Agustina Echeverría - Universidade Federal de Goiás Eloisa Pio de Santana
Protección de los Espacios naturales: - Ecological economics and green economies Poster presentation María Rosa Vázquez Rodríguez - Universidad Rey Juan Carlos
de las 3r a las 10r: Estrategías Ambientales para el Desarrollo - Ecological economics and green economies Poster presentation Walter Pardave Livia - Universidad De Santander Udes
Environmental Education in the company - Ecological economics and green economies Poster presentation Patrick Mendes Berto - UNIBAVE / Copobras S/A Ismael Gomes Dagostin
Formation et recherche en énergise renouvelables et efficacité énergétique à l'Université Ibn Zohr - Ecological economics and green economies Round table papers Ahmed Ihlal - Faculté des sciences Agadir
Approche agro-écologique de formation interculturelle - Ecological economics and green economies Round table papers Abdelkader Guerdane - Orane Bischof, Salma Daoud, Lydia Bourdreux
Gestion environnementale des hébergements touristiques - Ecological economics and green economies Oral papers loubna Chaouni Benabdallah -
Análisis socio-económico del Pago por Servicios Ambientales en un contexto rural-urbano - Ecological economics and green economies Oral papers Angela Caro Borrero - Universidad Nacional Autónoma De México Corbera-Elizalde Estve, Almida-Leñero Lucia, Neitzel Kurt Christoph
STUDY OF CARBONATED CONCRETE - Ecological economics and green economies Oral papers William Thomaz - Edna Possan
L'éducation environnementale, un pilier indispensable pour le passage à une économie verte - Ecological economics and green economies Oral papers Philippe Simonis
Proceedings of 7th WEEC Niche 5: Ecological and
green economies
8
Création de TPE par le biais de l'Agro écologie - Ecological economics and green economies Oral papers Tariq ZIDI - Fondation Norsys
Interdisciplinary Ecological Engineering Education and Green Economy Practices -Ecological economics and green economies Oral papers Ping Fang - Associate Professor Pu LU
Política medioambiental - Ecological economics and green economies Oral papers María Rosa Vázquez Rodríguez - Universidad Rey Juan Carlos
Communication environnementale d’entreprise - Ecological economics and green economies Oral papers Dominique Thaly - GIZ
Managing Food and Health Security while Enhancing Sustainabilty: - Ecological economics and green economies Oral papers Mohamed Behnassi - Associate Professor, Faculty of Law, Economics and Social Sciences, Ibn Zohr University of Agadir (Morocco) / Director of the North-South Center for Social Sciences (NRCS)
Education in Environmental Organic Analytical chemistry in Armenia - Ecological economics and green economies Oral papers Gagik Torosyan - head of chenimcal technology and evironmental engineering department Ani Avetisyan, Roland Kallenborn
LA CULTURA DEL AGUA EN LA AGRICULTURA ESPAÑOLA - Ecological economics and green economies Oral papers Esther Mena Rodríguez - Universidad de Málaga Miguel Ángel Fernández Jiménez
Le rôle des éco-entreprises dans le développement des zones rurales : - Ecological economics and green economies Oral papers Sanaa BELABBES - Laboratoire de Recherche en Entrepreneuriat, Finance et Audit. Université Ibn Zohr Ahmed CHAKIR
Communities of Practice for Green Economy Entrepreneurs - Ecological economics and green economies
Oral papers Arnica Rowan - Okanagan College
LA IMAGEN ACERCA DE LA SOSTENIBILIDAD EN EMPRESAS DE ECONOMÍA SOCIAL - Ecological economics and green economies Oral papers Chiara Scalabrino - Universidad de Cádiz -Facultad de Ciencias de la Educación José Mª Oliva
Consumer’s sustainable lifestyle - Ecological economics and green economies Oral papers Antonio Pascale - Legambiente e Centro di Educazione Ambientale La Vite e il Pioppo Sara Ianuario, Paola Pascale, Gennaro Conte
La promotion de la pisciculture dans les villages du Haut Atlas (Maroc) - Ecological economics and green economies Oral papers Mohamed GHAMIZI - Université cadi Ayad
PAGOS POR SERVICIOS AMBIENTALES: ¿UNA OPCIÓN VIABLE PARA EL FINANCIAMIENTO DEL DESARROLLO SOSTENIBLE EN VENEZUELA? - Ecological economics and green economies Oral papers Vladimir José Valera Mejías - Universidad Metropolitana / Universidad Simón Bolívar
Promouvoir l’éducation à l’environnement et la mettre en réseau pour la renforcer. - Ecological economics and green economies Oral papers Armelle MAUGER -
Diagnostic des besoins sociaux et éducationnels pour une éducation éco-nomique au Québec - Ecological economics and green economies Oral papers Hugue Asselin - Centre de recherche en éducation et formation relative à l'environnement et à l'écocitoyenneté - Université du Québec à Montréal
Italians attitudes towards the water from the tap. - Ecological economics and green economies Oral papers Antonio Pascale - Legambiente e Centro di Educazione Ambientale La Vite e il Pioppo Giancarlo Chiavazzo, Orazio Pascale, Paola Pascale, Giovanni D'Errico
Le rôle de l’éducation à l’environnement dans la création des éco-entreprises marocaines: - Ecological economics and green economies Oral papers Sanaa BELABBES - Laboratoire de Recherche en Entrepreneuriat, Finance et Audit. Université
Proceedings of 7th WEEC Niche 5: Ecological and
green economies
10
Ibn Zohr Pr. Ahmed CHAKIR
Vers une économie de recyclage au Maroc - Ecological economics and green economies Oral papers akram el korchi - ENSA AGADIR Cheikh el KORCHI
Terramacchina (Earth-machine) - Ecological economics and green economies Oral papers Antonella Bachiorri - University of Parma (Department of Biosciences) - Italy Alessandra Puglisi, Guido Giombi
Energy and Social Change - Ecological economics and green economies Oral papers Alfredo Agustoni - G. d'Annunzio University of Chieti-Pescara
ECONOMIE VERTE ENTRE LEGISLATION ET INSTRUMENTS D'AMENAGEMENT DU TERRITOIRE - Ecological economics and green economies Oral papers Faiçal CHEBOUROU - Direction de l'Environnement Faïçal CHEBOUROU-Ingénieur d’état en Ecologie et Environnement
البيئي و االقتصاد األخضراالقتصاد - Ecological economics and green economies Oral papers antar boulahdid - cem mebarki tahar
Croissance Verte et Développement Territorial - Ecological economics and green economies Oral papers Abdelouahed FIKRAT - Direction de l'Aménagement du Territoire / MHUPV
Brazilian Good Practices in Rural Sustainability - Ecological economics and green economies Oral papers Nilo S. Diniz - Ministry of the Environment of Brazil - Dept Environmental Education Ana Luisa Campos, Alex Barroso Bernal, Adriana de Magalhaes Chaves Martins and Aida Maria Farias da Silva.
Recherche et planification participative d'un développement durable - Ecological economics and green economies Oral papers HOUSSINE NIBANI - NIBANI Houssine
Caractérisation du fruit du cactus (Opuntia spp) au Maroc marocain - Ecological economics and green economies
Oral papers YOUSSEF EL KHARRASSI - ELMZOURI.E (1)., Y.ELKHARRASSI (1 ,2)., B.NASSER(2)
les jardins filtrants, une gestion environnementale des eaux usées en milieu rural - Ecological economics and green economies Oral papers hassan ABOUTAYEB -
Economies d’énergie en zones urbaines et rurales au Maroc - Ecological economics and green economies NGO Forum Virginie Guy
Using algae in hypoxic ocean and water-way - Ecological economics and green economies NGO Forum Michele Baron
Proceedings of 7th WEEC Niche 5: Ecological and
green economies
12
Economie écologique et économie verte
Synthèse des travaux de la niche 5 revu et enrichi par Mohamed Wakrim
La thématique représente un volet essentiel tant dans le programme du congrès que dans
son animation et l’on peut considérer, de l’avis de plusieurs, l’apport consistant de la niche
5, comme une contribution remarquable, dans le succès éclatant remporté par le 7éme
Congrès WEEC de Marrakech.
De même, les enseignements et les conclusions tirés du Congrès au titre de la
thématique, sont nombreux, riches et bien édifiants. Plusieurs des projets et des
expériences présentés, discutés et partagés durant le Congrès, revêtent des caractères
de nouveauté, d’originalité et d’innovation, ce qui représente un enrichissement substantiel
du portefeuille des initiatives et des démarches d’intervention en faveur de la nécessaire
transition vers les économies écologiques et les économies vertes.
Le congrès avait permis, en particulier, de noter une certaine avancée en termes de
pensée et de prise de conscience de l’importance et de l’urgence qui s’imposent, à tous, à
prendre plus au sérieux, la nécessité impérieuse d’une évolution vers des modèles
économiques et des modes de production et de consommation, plus responsables et plus
respectueux de l’environnement.
Il y a également une grande prise de conscience des défis majeurs et réels qui s’érigent
devant les évolutions souhaitées. Des défis perçus et exprimés par des participants,
comme des contraintes, des difficultés et des obstacles, qu’il est important de bien cerner,
maitriser et affronter, dans toute démarche et toute initiative visant des avancées
substantielles dans ce domaine.
Il a été reconnu toutefois, qu’en face de telles situations de difficultés, il existe des
possibilités d’action avec des marges de manœuvre conséquentes, qui ne demandent
qu’à être inventoriées, maitrisées et renforcées, pour la réalisation de progrès
considérables en faveur d’un développement au niveau souhaité de l’économie verte
entendue dans son sens le plus large.
Les voies de promotion sont nombreuses et les efforts à déployer doivent porter sur
plusieurs axes notamment : L’axe des principes à privilégier et à observer, celui des
stratégies prioritaires à développer mais aussi l’axe des méthodologies et des outils les
plus efficaces, qu’il est important de mettre au point et de mettre à l’œuvre.
La sélection des contributions présentées par les experts lors du congrès, avait eu le
mérite, en plus de sa qualité et sa pertinence par rapport à la thématique, de couvrir un
large éventail d’expériences et de projets, mettant ainsi en exergue l’étendue et la
richesse du potentiel d’innovation dans ce domaine.
Le potentiel, les marges de manœuvre et les possibilités d’actions, que la thématique
recèle, sont à la fois des motifs d’espoir et annonciateurs d’un avenir prometteur dans ce
domaine, mais sont aussi les indicateurs d’un vaste chantier d’investigation ouvert devant
la promotion de la transition souhaitée. Ont été évoqués en particulier lors du congrès (i)
Les possibilités d’une utilisation plus efficiente de la ressource énergétique et des matières
premières non renouvelables, (ii) des solutions de poursuite du développement avec
moins de dégagement de gaz à effet de serre, (iii) l’importance et les bienfaits des
écotechnologies, (iv) des exemples de pratiques porteuses de production et de
consommation responsables, (v) les possibilités qu’offre un aménagement du territoire
durable en termes notamment de transport raisonné et de villes durables, (vi) les voies de
protection et de rétablissement des services éco systémiques rendus par l’eau, les sols et
la biodiversité, etc.
Plus concrètement, les recommandations concernant la Niche thématique 5 « Economie
écologique et économie verte », retenues à l’issue du congrès, sont récapitulées et
présentées dans ce qui suit, selon les quatre axes convenus, à savoir (i) Principaux défis,
(ii) Principes à privilégier, (iii) Stratégies prioritaires et (iv) Méthodologies et outils les plus
efficace.
PRINCIPAUX DEFIS: Les défis sont perçus comme des contraintes et des obstacles qui
ne manqueraient pas de retarder, de gêner, voire d’empêcher les évolutions souhaitées.
Les défis identifiés tiennent essentiellement :
Proceedings of 7th WEEC Niche 5: Ecological and
green economies
14
D’abord, à des situations et des attitudes plutôt défavorables qui sont bien ancrées dans la
société, telles que :
Des modèles économiques souvent contraignants;
Des modes de production et de consommation peu soucieux de l’environnement et
de la durabilité
Des perceptions de développement, héritées, et qui sont souvent compromettantes,
Puis, à d’énormes besoins que l’évolution souhaitée nécessitera en termes notamment :
De sensibilisation et de persuasion à une prise de conscience environnementale,
individuelle et collective;
De communication, sachant les multiples difficultés à accéder et à interagir, avec
les populations dans maints contextes ;
D’intervention pour une conciliation difficile entre développement durable et
pauvreté, dans des milieux défavorisés : Les besoins dans de tels contextes sont
immédiats, alors que le développement durable (économies vertes), est une
évolution de long terme.
A y ajouter également de multiples défis externes qui viennent s’imposer à tous et rendre
encore plus difficile l’intervention. Citons à ce niveau le changement climatiques, la
pression démographique, etc.
PRINCIPES A PRIVILEGIER :
Les principes qu’il est important d’observer et de mettre au-devant face aux défis précités,
relèvent pour l’essentiel de la bonne Gouvernance, notamment les principes de
démocratie dans toute démarche de planification et de mise en œuvre, de cohérence,
d’équité, de responsabilité, d’obligation des résultats, etc.
Une mention spéciale a été soulignée en ce qui concerne la promotion des principes dits
REP (responsabilité élargie des producteurs) et pollueur /payeur au titre de l’éco-
contribution;
Il s’agit également de s’assurer, à chaque fois, de la pertinence de l'action ou de la
démarche à promouvoir, et de sa faisabilité tant sociale qu’économique et
environnementale, et de pouvoir aussi cerner et maitriser les effets pervers et secondaires
éventuels, associés aux solutions promues afin de prévoir les mesures appropriées de
leurs mitigation et/ou compensation.
Un accent particulier a été mis concernant la démarche de promotion de l’économie verte
en tant qu’opportunité de lutte contre la pauvreté, de préservation des ressources
naturelles et de développement tant de la ville que de la compagne.
STRATEGIES PRIORITAIRES : Les recommandations préconisées sous l’axe des
stratégies visent, en particulier, la création d’un environnement propice et propre à
favoriser l’introduction progressive des préoccupations environnementales et des concepts
d’économie verte. L’on doit à ce niveau, privilégier :
Une plus grande contextualisation des programmes et des approches et leur
adaptation à la diversité des terroirs.
Le développement de filières porteuses et mobilisatrices en faveur de l’économie
verte
La mise en place d’instruments économiques et fiscaux pour encourager
l’investissement dans l’économie verte,
Le développement de porte -feuilles de projets/ solutions à vocation économies
vertes;
La promotion de la culture de développement des synergies;
L’encouragement de la recherche et l'innovation, et
Un plus grand intérêt aux actions concrètes de terrain.
METHODOLOGIE ET OUTILS LES PLUS EFFICACES : Au titre de l’axe méthodologies
et outils, les recommandations sont formulées comme suit :
Privilégier l’approche éco-systémique dans le développement des économies
vertes;
Cerner les conditions de pérennité et de durabilité de toute initiative, action ou
projet,
Promouvoir la participation à tous les niveaux de diagnostic, de planification, de
mise en œuvre, de suivi, etc.
Proceedings of 7th WEEC Niche 5: Ecological and
green economies
16
Fonder l’action sur les pratiques de démonstration et d’expérimentation;
Investir dans le renforcement des capacités des partenaires et acteurs, parties
prenantes;
Mettre en place un cadre réglementation approprié et des systèmes efficaces de
contrôle.
En somme, l’Education à l’Environnement et à l’Economie Verte doit pouvoir
accompagner l’Homme depuis l’école et se poursuivre durant tout son parcours
professionnel et au-delà.
Compte redu rédigé par Mohamed Wakrim, membre du groupe de conduite des travaux
de la Niche thématique 5 “Economie écologique et économie et verte”, constitué de :
Mohamed Wakrim, Hassan Chouaouta et Pedro Vega Marcote.
Cleaning hypoxic ocean/inland-water zones
Converting floating minerals and nutrients stored in overpopulations of algaes and
jellyfish choking ocean to feed starving desert soils
Michele Baron
Micro-screen harvesters scoop ocean-hypoxic zone nitrogen-phosphate rich algae into
holding tanks, and introduce the nutrient rich matter to the Sahara/other desert zones.
Introduce low-water-consumption xeriscaped plants (with fungii to introduce microbes in
soil), and augment with bio-diverse plantings (including succulents-- ice plant, harvesting
fruit to prevent invasion of species; dragon fruit and cactus pear, etc); then vegetable,
flowering, fruit and other trees-- decreasing heat bloom, desiccation, desertification;
increasing pollinator-support, food and water security.
Dead Zones (hypoxia) are large regions of water so low in oxygen that they cannot support
most aquatic life. Algae blooms on the surface of waters block the sun’s rays from
reaching underwater plants, and even grow on sea weeds and aquatic plants growing near
enough to the surface, further reducing the amount of sunlight they receive. Without
sunlight, water plants (sea weeds, kelps, large grasses) cannot grow, and provide critical
food, habitat, and even oxygen to oceanic and inland waters.
Leftover algae that are not consumed by fish (and that is another problem, since small fish
fry, polyps and other small species which consume algae are consumed by the myriad
jellyfish which thrive in low-oxygen, algae-rich waters) fall to the bottom of the water-
system, where they are decomposed by bacteria which leaves little or no dissolved oxygen
for the shellfish and other bottom-dwelling species in the aquatic environment. Burning
fossil fuels continues to pump carbon into the atmosphere, further lowering
oceanic/aquatic pH, also ideal conditions for incubating algae blooms, jellyfish, and the
Overfishing and the “throw-away” bycatch further threatens the well-being of our oceans
and waterways, by depleting needed populations of algae- and jellyfish- eaters, and by
adding to the decomposition of aquatic life on ocean and deep-water floors. Whales,
dolphins, loggerhead and leatherback marine turtles are caught, and die, each year, in
commercial fishing gear, while trawling ocean floors kills the kelps, sea grasses, and
Proceedings of 7th WEEC Niche 5: Ecological and
green economies
18
shellfish which could help keep the world’s waters clean and oxygenated. With 90% of the
ocean’s large fish in decline, jellyfish do not have as many predators as they used to.
Meahwhile, PelagiaNoctiluca (“Mauve Stingers” plague the Mediterranean seas by the
millions; Nomura’s Jelly Fish (echizenkurage in Japanese), which can grow to over 600
pounds, and other species of jellyfish are thriving in the dying waters of the world.
However, we are not without solutions to diminish, and correct, the poisoning and
suffocation of our oceans and waterways. Instead of overfishing depleted fish populations,
trawlers can be contracted to scoop up surface algae before they die and fall to the waters’
bottom layers, and to remove the huge infestations of jellyfish which currently clog water-
zones, and eat much of the fish eggs and small fry that, if left undisturbed, could better
repopulate healthy oceans and waters. Catching, and utilizing jellyfish as food, fuel, or
compost is a far better solution than chopping them up in the water, since this only causes
the butchered jellyfish to release hundreds, even thousands of polyps, which can mature
into additional jellyfish needing to be cleaned up.
While some algae and jellyfish can be processed and eaten (various cultures have dined
on healthy species for centuries), or (especially if largely dead/decomposing, therefore
inedible masses of algae and jellyfish are collected) treated and processed into methane,
compost, and recycled grey-water products in anerobic extractors and micro-digester
systems, algae and jellyfish can also be utilized as raw materials for building nutrient-rich
soils in sand-based or depleted topsoil systems. Whether processed for direct, super-
saturated aquatic application to non-arable soil bases (especially efficient in warm/hot
zones where decomposition processes are rapid), or utilized in methane-production
(“renewable” fuel, which can be further “cleaned and greened” by solar-heated evaporation
processes), the compostable materials from jellyfish and algae population explosions can
rebuild terrestrial ecosystems, with the addition of fungi and beneficial microbes,
processing worms and other digesters, nitrogen-fixing legumes and other plants, and
xeriscaped agriculture.
And waterway and oceanic cleanup can similarly progress, by instituting submerged-rope-
farming of kelps (e.g. the red kelp Gracilaria) and other filtration-efficient, bio-remediation
water grasses and sea weeds (which remove inorganic nutrients from waters, produce
oxygen, and provide food and habitat), and the submerged-rope-and-net farming of clams,
mussels, and other bivalves filter organically-bound particles, e-coli, and other microbes
which would otherwise contribute to the nutrient-rich, acidified, warm waters which lead to
algae blooms, algae death/water-floor decomposition, and the spread of hypoxic
waterzones and massive populations of jellyfish.
Since sea weeds and shell fish can provide solid nutritional value to human consumers,
industries which invest in such bio-remediation measures can reap profits along with their
ocean- and water- cleaning harvests. Methane fuel-producers, grey-water extractors, and
compost-processors, similarly, can earn living wages while utilizing the algae and jellyfish
infestations which are clogging our waterways, to produce clean energy, reusable water,
and arable lands to support terrestrial eco- and agri-systems. Whether small/artisanal-
sized operations, or scalable to regional, or global water-cleanup efforts supported by
industry, NGO, and government investors in a program of serendipitous benefit to oceans,
lands, and the humans running the industries and cleanup efforts, bioextaction of raw
materials, and bio-remediation through kelp, water-grasses, and shell-fish farming can
improve the chances of sustainable life for many, if not most, of the globe’s millions of
species of Earthlings on our shared, interdependent planet.
Proceedings of 7th WEEC Niche 5: Ecological and
green economies
20
Le rôle de l’éducation à l’environnement dans la création des éco-
entreprises marocaines
Une étude exploratoire
Belabbes Sanaa, Ecole Nationale de commerce et de Gestion d'Agadir (Université Ibnou
Zohr)
Chakir Ahmed, Ecole Nationale de commerce et de Gestion d'Agadir (Université Ibnou
Zohr)
Résumé:
A travers notre travail, nous avons essayé d’étudier les facteurs ayant influencés les
écopreneurs dans la perception de l’éco-opportunité pour la création de l’éco-entreprise.
L’objectif étant de relever les écopreneurs qui ont été influencés par l’éducation
environnementale pour créer leurs éco-entreprises. Des études de cas ont été effectuées
en se basant sur des entretiens semi-directifs avec 20 fondateurs d’éco-entreprises
marocaines de différents secteurs d’activité. Les résultats obtenus démontrent
l’importance de l’éducation à l’environnement dans le développement de l’économie verte.
Introduction
Le domaine de recherche en entrepreneuriat est un vaste domaine multidisciplinaire qui
s'est considérablement développé au fil des ans. De Schumpeter (1926) qui a présenté
une analyse originale de la fonction de l'entrepreneur comme un agent de destruction
créatrice au sein du système économique, à la mise au point de l'ère d'après-guerre de la
science du comportement sur les qualités personnelles de l'entrepreneur, le pendule est
maintenant de nouveau basculé en arrière vers une vision plus axée sur les processus de
l'entrepreneuriat. Bien qu’il ait déjà fait l’objet de recherches qui remontent au XVIIIe
siècle, le mouvement académique de l’entrepreneuriat a eu son tremplin dans les années
1980 avec l’apparition des revues scientifiques spécialisées dans l’entrepreneuriat, et a
accéléré au début des années 1990 où des cours spécialisés ont été assurés dans de
nombreuses universités.
Contrairement à d'autres domaines de la recherche en gestion, la recherche traitant
l’écopreneuriat est relativement nouvelle (Schaper, 2002, p.38). Il a commencé à se
développer comme un champ dans les années 1990, quand certains auteurs ont
commencé à étudier "l'entrepreneur vert , "l'entrepreneur de l'environnement" et "l’éco-
entrepreneur" qui a ensuite fusionné en "Écopreneurs" (Schaper, 2002, p. 38). En dépit
d'un corps restreint mais croissant de littérature sur le sujet, le domaine de l’écopreneuriat,
en raison de sa relative nouveauté, reste quelque peu fragmentée, et certains de ses
concepts restent flous. Il est également l'objet de recherches qui manque d'études
empiriques.
La question centrale de recherche est donc la suivante : Comment l’éducation à
l’environnement influence-t-elle la perception de l’ éco-opportunité? Pour y répondre, deux
hypothèses ont été posées. la première stipule que l’éducation à l’environnement est un
facteur incitatif principal à la création de l’éco-entreprise, alors que la seconde s'intéresse
plutôt aux différents facteurs qui agissent en interaction avec l’éducation à
l’environnement. L’étude de cette population d’entrepreneurs nous semble riche pour les
chercheurs et le marché des éco-entreprises est promis à un bel avenir à en croire les
tendances sociétales actuelles.
Cet article s’articule autour du cadre théorique de l’étude (partie 1), ainsi que des résultats
préliminaires et de la méthodologie suivie (partie 2) pour mener à bien ce travail en cours.
1. Cadre théorique de l'écopreneuriat
1.1. Le positionnement de l’écopreneuriat dans le champ de l'entrepreneuriat
durable
Le terme « écopreneuriat » est une combinaison de deux mots, « écologie » (« éco») et «
entrepreneuriat ». L'écopreneuriat peut donc être grossièrement définie comme « l'esprit
d'entreprise à travers un œil soucieux de l’environnement». L’écopreneuriat est
caractérisés par certains aspects fondamentaux des activités entrepreneuriales qui sont
orientés moins vers les systèmes de gestion ou procédures techniques et davantage axée
sur l'initiative personnelle et les compétences de la personne ou de l'équipe
entrepreneuriale pour garantir le succès du marché avec des innovations
environnementales. Après une première vague de la littérature, au début des années
1990, ce n'est que récemment que certains auteurs ont commencé à traiter plus en détail
l’entrepreneuriat axée sur l'environnement (voir Anderson et Leal, 1997; Bennett 1991;
Berle 1991; Bleu 1990; Isaak 1998; Keogh et Polonsky 1998 ; Kyrö 2001; Larson 2000;
Lober 1998; Pastakia 1998; Schaltegger et Petersen, 2001; Staber 1997; Wiklund 1999).
L’écopreneuriat commence d'abord par les individus dont le souci environnemental est
une préoccupation personnelle. L’écopreneur montre la maîtrise personnelle (voir Senge,
Proceedings of 7th WEEC Niche 5: Ecological and
green economies
22
1996) et considère sa vie professionnelle comme un acte créatif. Les différences entre les
objectifs personnels et la réalité perçue sont considérées comme étant un défi et non
comme un problème (voir Senge 1996: 175).
Il influence considérablement son entreprise avec ses objectifs et préférences
personnelles d'une manière qui soient reflétés dans les objectifs de l'entreprise. Il s'agit
plus souvent et dans une large mesure des start-ups et les petites entreprises que les
grandes entreprises. Alors que les managers de l'environnement peuvent quitter une
entreprise sans que l'entreprise ait perdu son caractère substantiel. En raison de la forte
influence de la personnalité du chef d'entreprise (ou dirigeants) sur les objectifs de
l'entreprise, le statut d'écopreneur peut aussi être important pour la société tout entière. En
conséquence, l’écopreneuriat, définie dans un sens étroit, traite une start-up d'une société
très innovante fournissant des produits et services environnementaux (pour une définition
similaire de l'entrepreneuriat, voir Ripsas 1997).
Cependant, l’écopreneuriat peut aussi être vu dans des entreprises créées, comme le
processus de création, substantiellement réussi, des produits et services
environnementaux. D’un point de vue plus large, l’écopreneuriat peut donc être décrite
comme étant une entreprise innovante, orientée vers le marché sous forme de
personnalité et axée sur la création de valeur grâce à des innovations environnementales
et les produits en dépassant la phase de création d'une entreprise. Cette large définition
de l’écopreneuriat considère les intrapreneurs (Pinchot, 1988), comme étant un sous-
groupe important des écopreneurs, du fait que les intrapreneurs représentent des acteurs
à l'intérieur d'une organisation qui permettent de modifier substantiellement et façonner
aussi bien le développement de l’éco-entreprise que celui de l’environnement.
L'adoption d’affaires respectueuses de l'environnement peut, en théorie, ouvrir une
gamme supplémentaire d’opportunités pour les entrepreneurs. Le passage à un cadre
entrepreneurial durable offre de nombreuses niches que les individus entreprenants et les
entreprises peuvent identifier avec succès. Ceux-ci comprennent, entre autres, le
développement de nouveaux produits et services, l'amélioration de l'efficacité des
entreprises existantes, de nouvelles méthodes de commercialisation et la reconfiguration
des modèles d'affaires et des pratiques existants. Cependant, l'entrepreneuriat vert est
non seulement importante parce qu'elle fournit de nouvelles opportunités pour les
premiers entrepreneurs agiles qui les identifient et les exploitent, mais aussi parce qu'il a
le potentiel pour être une force majeure dans la transition globale vers un modèle
économique plus durable. Dans une économie fondée sur le marché, les écopreneurs
jouent un rôle essentiel dans l'adoption éventuelle de pratiques commerciales écologiques
par la communauté des affaires en général à travers le rôle qu'ils fournissent à d'autres
entreprises. En démontrant les avantages économiques qui viennent du fait d'être plus
écologique, les écopreneurs agissent comme un facteur « Pull » qui attire d'autres
entreprises de façon proactive à devenir écologiquement responsable, à la différence des
facteurs « Push » de la réglementation gouvernementale et la pression des parties
prenantes.
Se focalisant sur les aspects environnementaux, les écopreneurs se trouvent à proximité
de l'entrepreneuriat durable, mais avec un accent moins fort des performances durables
comme un objectif de l’activité. Les écopreneurs visent avec leurs entreprises dans des
parts de marché beaucoup plus grandes et un turnover élevé (plus ou moins
écologiquement sensibles) dans les marchés de masse. Alors que historiquement les
écopreneurs avaient souvent l'accent mis sur un marché plus large (et non une forte
orientation non-lucrative comme l'entrepreneuriat social traditionnel), leur valeur est
focalisée sur la performance environnementale et pas beaucoup sur la performance
sociale.
1.2. La motivation dans l’écopreneuriat :
Une revue de la littérature traitant l’entrepreneuriat nous amène à conclure que la
motivation d'un individu à devenir un entrepreneur est souvent complexe et multi-facettes
(Marlow & Strange, 1994; Shane, Kolvereid, et Westhead, 1991). Les motivations pour
l’entrepreneuriat se sont souvent articulées autour de quatre principaux facteurs: le désir
d'indépendance, les motivations monétaires, les facteurs liés à la famille, et les facteurs
liés au travail (Carter, Gartner, Shaver et Gatewood, 2003; DeMartino & Barbato, 2003).
Les chercheurs ont appelé à une enquête plus approfondie afin de déterminer si les
écopreneurs diffèrent dans leurs motivations des entrepreneurs en général et de quelles
manières.
Comme les entrepreneurs en général, les motivations pour l’écopreneuriat semblent aussi
être complexes et multi-facettes (Kirkwood & Walton, 2010b). L'une des caractéristiques
distinctives des écopreneurs est leur raisonnement éthique solide (Linnanen, 2002).
Habituellement, ils ont une «raison d'être» qui dépasse leur désir de profits et souvent elle
est associée à faire du monde un meilleur endroit où vivre (Linnanen, 2002). En effet ils
sont souvent perçus en tant que «agents du changement cruciaux » (Walley & Taylor,
Proceedings of 7th WEEC Niche 5: Ecological and
green economies
24
2002) ou « une force indispensable pour permettre que le monde change son chemin »
(Cohen et Winn, 2007, p 46). Ainsi, leurs motivations pour faire la différence et le rôle
qu'ils jouent, ce faisant, à travers «des moyens de déplacement non durables» (ibid.)
signifient que pour la durabilité, ils jouent un rôle de transition important. Pour
l’écopreneur, cependant, les raisons éthiques ne sont souvent pas les seules raisons de
création de l'entreprise, mais peut-être, en fait, la seule différence clé entre les motivations
des écopreneurs et celles des entrepreneurs (Kirkwood & Walton, 2010b).
Quant à Pastakia (2002), il a présenté les principaux moteurs-clés des écopreneurs par
les forces internes et externes. Pastakia explique que ces forces sont une corrélation de
cause à effet. Les motivations et les influences sont les conséquences des changements
tels que la détérioration de l'environnement et de la rareté des ressources naturelles. Par
conséquent, ces problèmes encouragent les investisseurs, les consommateurs, les
producteurs, les citoyens et les gouvernements à exiger plus de produits écologiques et
environnementaux des rapports économiques. La prise de conscience de la société
favorise les organismes de réglementation à adopter des lois et règlements, des politiques
d'incitation pour encourager l’écopreneuriat.
Pastakia (2002, p. 95) affirme, d'une part, que les forces internes sont des forces
idéologiques fortes comme les valeurs des entrepreneurs, ses plans et ses objectifs qui
contribuent à une société durable. Il a estimé qu'un écopreneur potentiel est celui qui a
mis en pratique ce qu'il croit. D'autre part, les forces externes sont constituées des
préoccupations économiques, sociales et environnementales qui entourent les
entreprises. Cette force comprend deux facteurs: les facteurs « Pull » représentées par le
jugement des investisseurs, des consommateurs et des politiques qui encouragent les
modifications apportées à une société plus durable; et les facteurs « Push » qui émanent
des lois et des règlements, l'activisme judiciaire, la société civile, des consommateurs et
des investisseurs.
L'examen de la recherche en entrepreneuriat indique que les interactions entre la
personnalité et certains facteurs tels que l'expérience passée, la compétence existante et
le contexte immédiat se sont avérées décisives pour la compréhension de
l'entrepreneuriat (Blundell et Smith, 2001). L’approche socio-psychologique intégrée dans
l'entrepreneuriat (Chell et al 1991), met l'accent, entre autres, sur la façon dont les gens
réagissent à l'expérience et les aspects essentiels du contexte de l'entreprise. Cette
approche résonne fortement avec la vision de la structure-action sur l'envirentalisme. Nous
voyons les influences et la motivation en tant qu'éléments clairs dans cette dynamique de
la structure-action. En d'autres termes, ce sont des éléments des structures fortes et
faibles de la société qui influencent sur les entrepreneurs potentiels et les incitent à créer
une entreprise verte.
Les recherches de Cohen et Winn (2007) ont conclu que la motivation de l'écopreneur
pourrait être de combler un besoin du marché. Ces types de besoins type ont surgi à la
suite des imperfections du marché - les imperfections qui produisent la dégradation de
l'environnement (Cohen et Winn, 2007) ou comme une réponse au marché qui ne traite
pas les externalités négatives (Pastakia, 1998). En outre, les écopreneurs ont été trouvés
à être motivés par un désir d'indépendance, mais semble être moins axés sur le désir de
faire de l'argent par rapport à la recherche antérieure des entrepreneurs en général
(Kirkwood & Walton, 2010).
D’autres auteurs ont affirmé que les opportunités sont la clé de démarrage d'une
entreprise. Ils ont expliqué que les problèmes environnementaux et sociaux offrent des
possibilités de création d'entreprise. Cela suggère que certains entrepreneurs profitent des
problèmes environnementaux et sociaux afin de créer une nouvelle idée commerciale, un
nouveau concept et une nouvelle forme. Ils ont également la possibilité d'établir leurs
valeurs personnelles dans leur entreprise (Tilley & Young, 2009, p. 85). Ainsi, la gestion
de leur propre entreprise leur donne la liberté de concevoir, construire et former leurs
entreprises.
Sur un plan plus pratique, Hendrickson & Tuttle (1997), en se basant sur des études de
cas aux Etats-Unis sur le contexte américains, présentent un système de classification de
l'environnement qui peut être utilisé pour catégoriser la mission ou la stratégie de marché
pour différentes entreprises environnementales.
Ce cadre contient des variables internes et externes pour la définition des critères. En ce
qui concerne le contexte externe, il s'appuie sur le travail de Post & Altman (1994) qui
identifient, à partir d'un point de vue macro sociologique, trois facteurs1 de changement:
la conformité écologie : améliorer l'environnement par la réglementation gouvernementale
et les sanctions.
le marché environnementaliste: induire des comportements écologiquement bénéfique par
le biais de diverses mesures d'incitation positives, et la valeur environnementaliste:
apporter des changements à travers des consommateurs qui ont la volonté d'agir par leurs
valeurs environnementales
1 Ce ne sont pas des facteurs motivationnels des entrepreneurs
Proceedings of 7th WEEC Niche 5: Ecological and
green economies
26
En résumé, il semble que les écopreneurs ont une gamme de motivations pour se lancer
en affaires, qui semblent être un mélange de social, environnemental et commercial
(Kirkwood & Walton, 2010b; Pastakia, 1998; Walley & Taylor, 2002).
2. Les facteurs incitatifs à la création des éco-entreprises au Maroc
2.1. Méthodologie
Notre recherche est de nature exploratoire et vise à chercher sur le terrain maeocain les
différents facteurs en termes d’impact sur la création des éco-entreprises. Evrard et alii.
(1997), ont présenté quatre caractéristiques principales de l'étude exploratoire: la faible
taille de l’échantillon ; l’interaction observateur-observé ; le rôle central de l’interprétation
des données et le recueil de données qualitatives. Le thème de notre recherche concerne
un phénomène émergent au Maroc pour lequel l’indétermination théorique est importante,
ce qui justifie le choix d’une étude exploratoire qualitative. Chose qui exige d’être proche
de la personne étudiée. L'accent sera donc mis non seulement sur ce qui est dit, mais
aussi sur la façon dont il est dit, et dans quel contexte. Nous avons donc procéder en nous
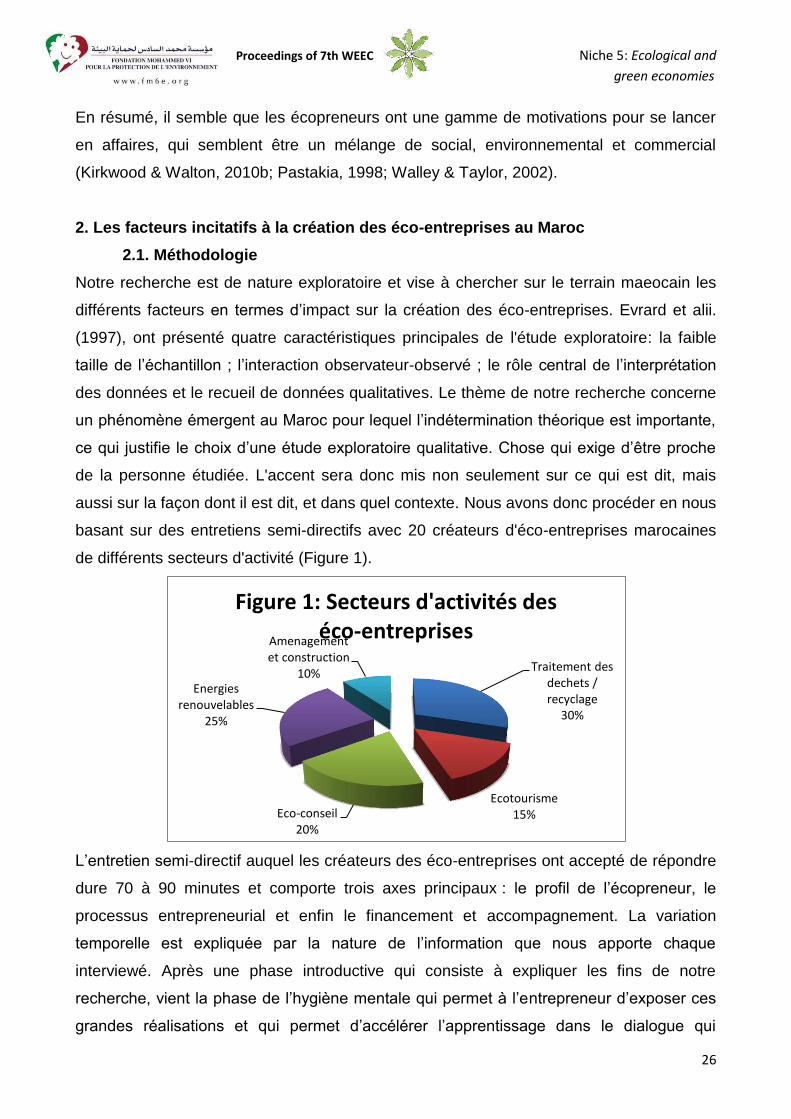
basant sur des entretiens semi-directifs avec 20 créateurs d'éco-entreprises marocaines
de différents secteurs d'activité (Figure 1).
L’entretien semi-directif auquel les créateurs des éco-entreprises ont accepté de répondre
dure 70 à 90 minutes et comporte trois axes principaux : le profil de l’écopreneur, le
processus entrepreneurial et enfin le financement et accompagnement. La variation
temporelle est expliquée par la nature de l’information que nous apporte chaque
interviewé. Après une phase introductive qui consiste à expliquer les fins de notre
recherche, vient la phase de l’hygiène mentale qui permet à l’entrepreneur d’exposer ces
grandes réalisations et qui permet d’accélérer l’apprentissage dans le dialogue qui
Traitement des dechets / recyclage
30%
Ecotourisme 15% Eco-conseil
20%
Energies renouvelables
25%
Amenagement et construction
10%
Figure 1: Secteurs d'activités des éco-entreprises
s’instaure entre deux personnes. Ensuite, vient la phase de l’entretien, où nous avons
laissé libre expression à l’interviewée en le dirigeant de temps à autre selon les sous-axes
que comporte le guide d’entretien.
2.2. Discussion des résultats préliminaires
La retranscription des entretiens a été faite à l'aide du logiciel de reconnaissance vocale
"Dragon Naturally Speacking" puis ont été introduit dans le logiciel "QSR Nvivo 10" pour
une analyse qualitative des résultats. Ce dernier nous a permit de relever les mots les plus
répétés lors des 20 entretiens réalisés auprès des écopreneurs. L'objectif est de relever
les différents facteurs, représentés par des "noeuds" sur le logiciel, et qui ont incités ces
écopreneurs à créer leurs éco-entreprises.
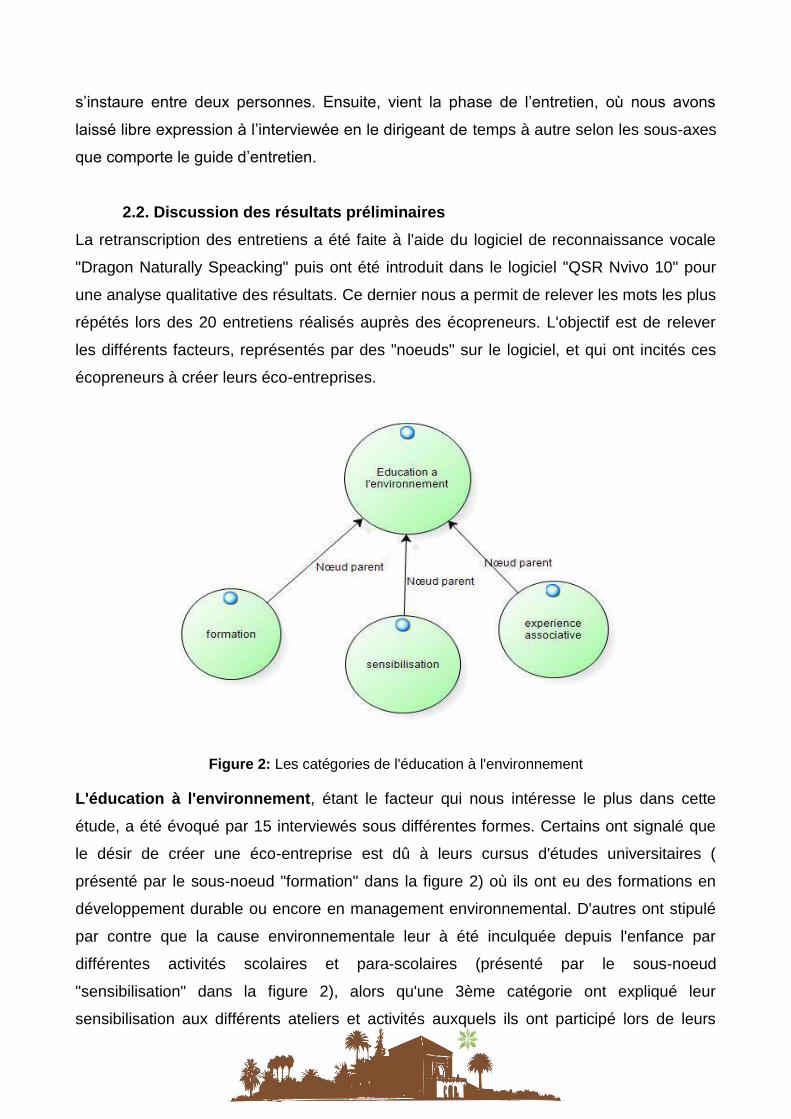
Figure 2: Les catégories de l'éducation à l'environnement
L'éducation à l'environnement, étant le facteur qui nous intéresse le plus dans cette
étude, a été évoqué par 15 interviewés sous différentes formes. Certains ont signalé que
le désir de créer une éco-entreprise est dû à leurs cursus d'études universitaires (
présenté par le sous-noeud "formation" dans la figure 2) où ils ont eu des formations en
développement durable ou encore en management environnemental. D'autres ont stipulé
par contre que la cause environnementale leur à été inculquée depuis l'enfance par
différentes activités scolaires et para-scolaires (présenté par le sous-noeud
"sensibilisation" dans la figure 2), alors qu'une 3ème catégorie ont expliqué leur
sensibilisation aux différents ateliers et activités auxquels ils ont participé lors de leurs
Proceedings of 7th WEEC Niche 5: Ecological and
green economies
28
expériences associatives ( présenté par le sous-noeud "expérience associative" dans la
figure 2). Ces trois catégories2 nous ont permis de dresser une typologie de "l'éducation à
l'environnement" présentées dans le schéma ci-dessus. Alors que L'importance du
marché a été évoquée par 17 interviewés et à été expliquée par l'effet de mode que
connait ce marché ainsi que l'offre et la demande perçues par ces écopreneurs.
D'autres facteurs ont été relevés lors de cette étude. Un seul interviewé avait stipulé que
l'intérêt derrière la création de son éco-entreprise était d'atteindre un niveau
d'accomplissement et plus de satisfaction que pourrait être réalisé à partir d'autres
emplois. Ce facteur psychologique reflétant l'estime de soi, a été expliqué par McClelland
comme étant un facteur motivationnel fondamental pour la définition des caractéristiques
de l'entrepreneur. Un autre modèle basé sur les besoins qui explique la motivation est la
pyramide des besoins de Maslow. Ce dernier a regroupé les besoins dans une hiérarchie
dans un ordre croissant: besoins physiologiques, les besoins de sécurité, les
besoins pour l’appartenance et estime de soi et qui peut expliquer presque tous les
types de comportement. Alors que cinq écopreneurs ont lié la création de leurs éco-
entreprises au désir de contribuer à la protection de l'environnement. Ce facteur
reflétant l'engagement de l'écopreneur a été expliqué par Keogh & Polonsky (1998)
comme étant la forme la plus forte de l'engagement environnemental qui rend la prise en
compte des préoccupations environnementales et la réalisation des objectifs
environnementaux une fin en soi, et un écopreneur opérant par engagement affectif à
l'environnement choisira toujours la solution la plus écologique possible. Cela ne permettra
pas seulement à mener à des éco-innovations, mais aussi d'exploiter les éco-opportunités
que les autres perçoivent comme marginales ou sans intérêt.
L'influence de l'entourage, l'appui de l'Etat et l'experience professionnelle dans une
éco-entreprise sont aussi des facteurs influençant la création des éco-entreprises et qui
sont classés par certains auteurs comme étant des facteurs qui dépendent de
l'environnement par lequel les individus sont entourés.
2 Il est à signaler que certains interviewés ont évoqué ces trois catégories dans leurs entretiens en précisant que le
désir de protéger l'environnement était bien un objectif fixé depuis l'enfance qui les a motivés pour choisir une formation spécialisée dans le domaine lors de leurs études supérieures et à participer à des expériences associatives en parrallèle.
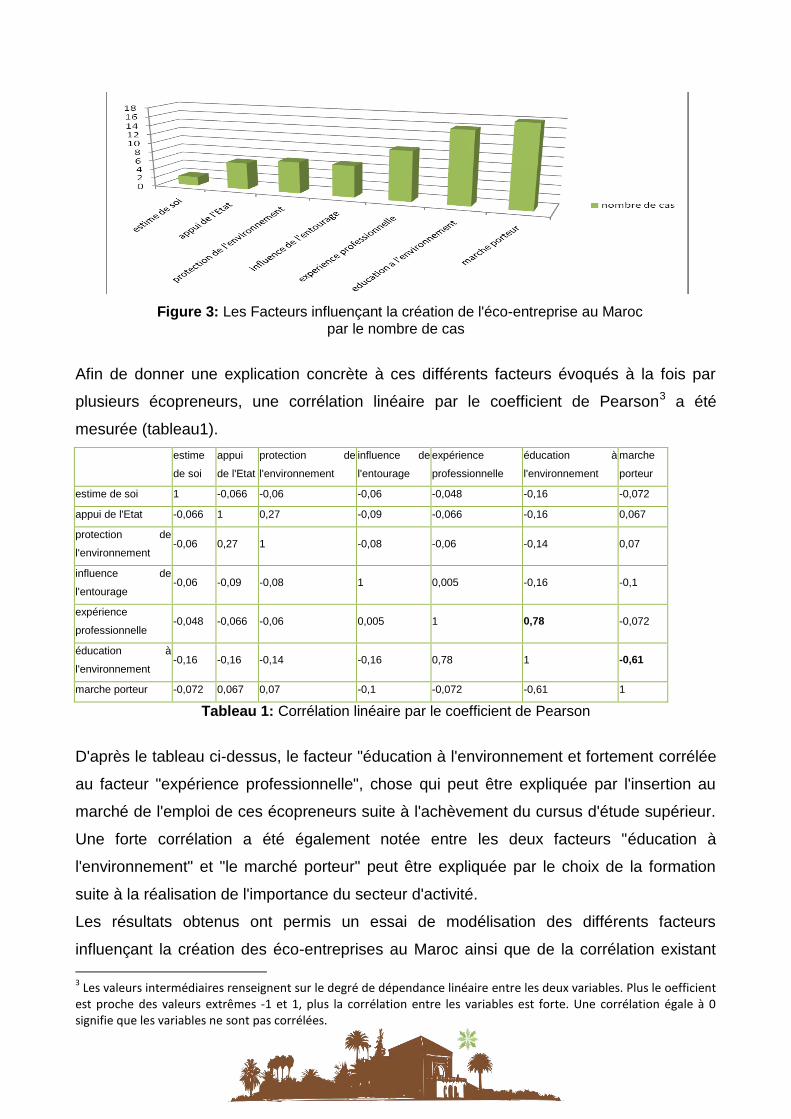
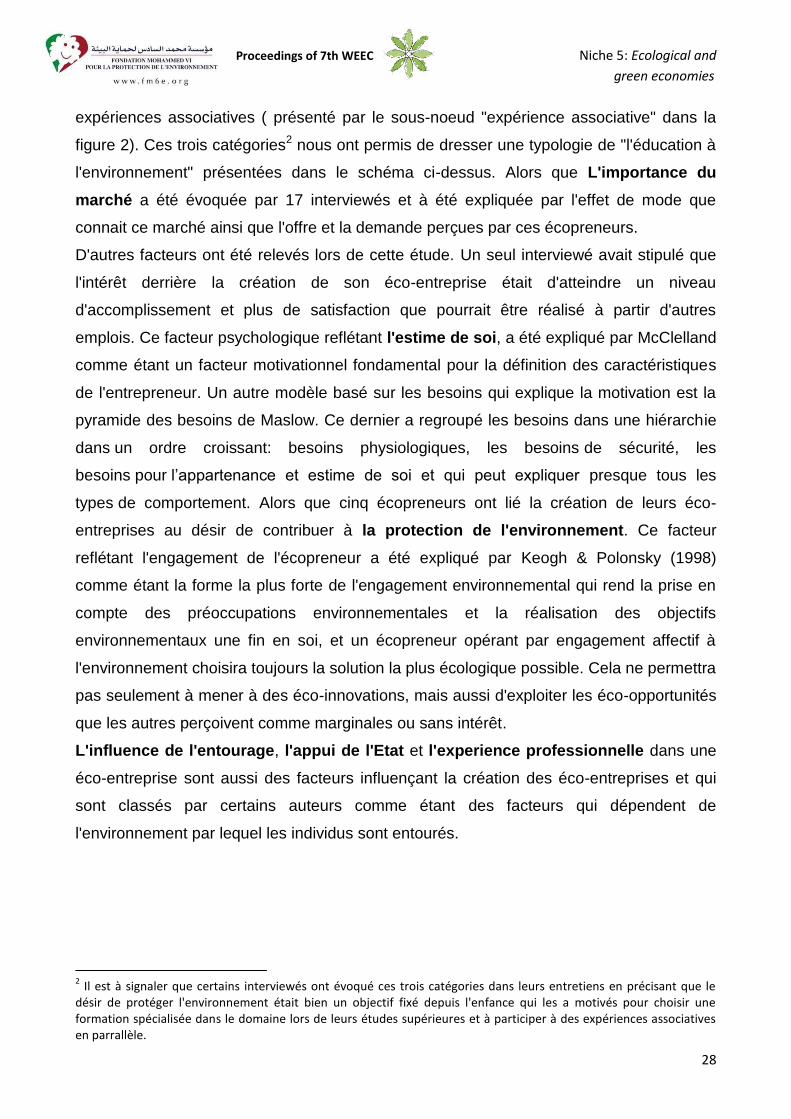
Figure 3: Les Facteurs influençant la création de l'éco-entreprise au Maroc
par le nombre de cas
Afin de donner une explication concrète à ces différents facteurs évoqués à la fois par
plusieurs écopreneurs, une corrélation linéaire par le coefficient de Pearson3 a été
mesurée (tableau1).
estime
de soi
appui
de l'Etat
protection de
l'environnement
influence de
l'entourage
expérience
professionnelle
éducation à
l'environnement
marche
porteur
estime de soi 1 -0,066 -0,06 -0,06 -0,048 -0,16 -0,072
appui de l'Etat -0,066 1 0,27 -0,09 -0,066 -0,16 0,067
protection de
l'environnement -0,06 0,27 1 -0,08 -0,06 -0,14 0,07
influence de
l'entourage -0,06 -0,09 -0,08 1 0,005 -0,16 -0,1
expérience
professionnelle -0,048 -0,066 -0,06 0,005 1 0,78 -0,072
éducation à
l'environnement -0,16 -0,16 -0,14 -0,16 0,78 1 -0,61
marche porteur -0,072 0,067 0,07 -0,1 -0,072 -0,61 1
Tableau 1: Corrélation linéaire par le coefficient de Pearson
D'après le tableau ci-dessus, le facteur "éducation à l'environnement et fortement corrélée
au facteur "expérience professionnelle", chose qui peut être expliquée par l'insertion au
marché de l'emploi de ces écopreneurs suite à l'achèvement du cursus d'étude supérieur.
Une forte corrélation a été également notée entre les deux facteurs "éducation à
l'environnement" et "le marché porteur" peut être expliquée par le choix de la formation
suite à la réalisation de l'importance du secteur d'activité.
Les résultats obtenus ont permis un essai de modélisation des différents facteurs
influençant la création des éco-entreprises au Maroc ainsi que de la corrélation existant 3 Les valeurs intermédiaires renseignent sur le degré de dépendance linéaire entre les deux variables. Plus le oefficient
est proche des valeurs extrêmes -1 et 1, plus la corrélation entre les variables est forte. Une corrélation égale à 0 signifie que les variables ne sont pas corrélées.
Proceedings of 7th WEEC Niche 5: Ecological and
green economies
30
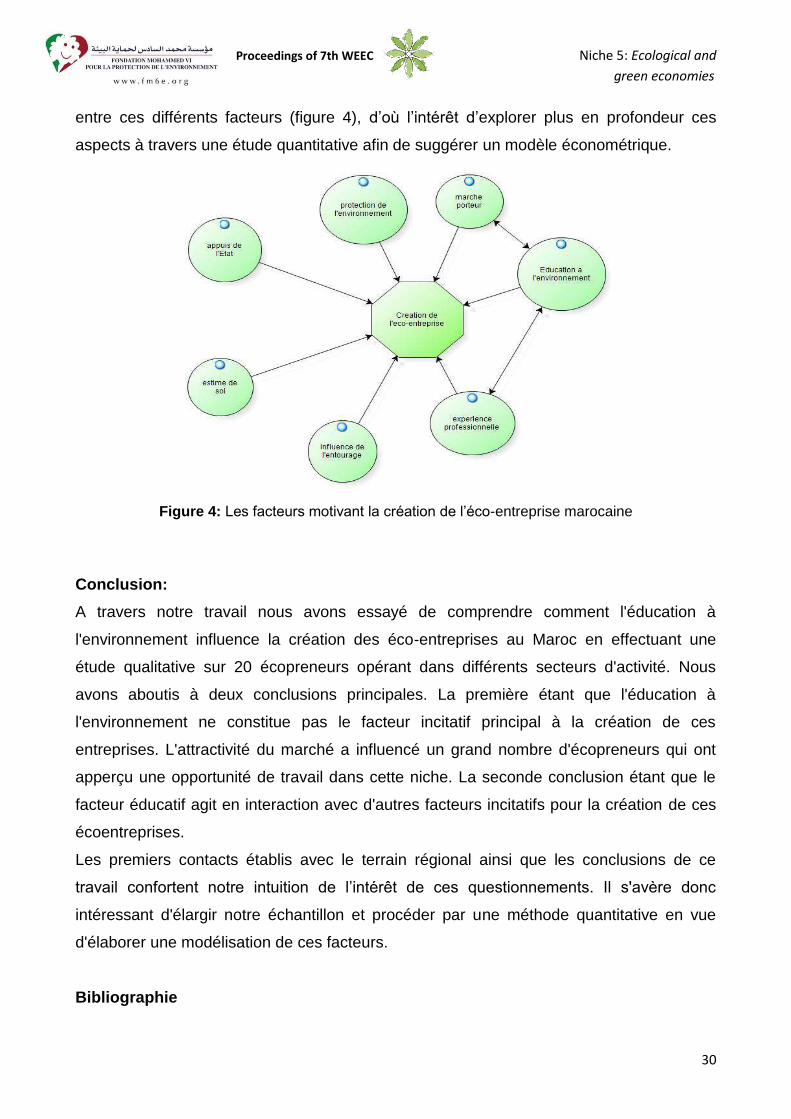
entre ces différents facteurs (figure 4), d’où l’intérêt d’explorer plus en profondeur ces
aspects à travers une étude quantitative afin de suggérer un modèle économétrique.
Figure 4: Les facteurs motivant la création de l’éco-entreprise marocaine
Conclusion:
A travers notre travail nous avons essayé de comprendre comment l'éducation à
l'environnement influence la création des éco-entreprises au Maroc en effectuant une
étude qualitative sur 20 écopreneurs opérant dans différents secteurs d'activité. Nous
avons aboutis à deux conclusions principales. La première étant que l'éducation à
l'environnement ne constitue pas le facteur incitatif principal à la création de ces
entreprises. L'attractivité du marché a influencé un grand nombre d'écopreneurs qui ont
apperçu une opportunité de travail dans cette niche. La seconde conclusion étant que le
facteur éducatif agit en interaction avec d'autres facteurs incitatifs pour la création de ces
écoentreprises.
Les premiers contacts établis avec le terrain régional ainsi que les conclusions de ce
travail confortent notre intuition de l’intérêt de ces questionnements. Il s'avère donc
intéressant d'élargir notre échantillon et procéder par une méthode quantitative en vue
d'élaborer une modélisation de ces facteurs.
Bibliographie
Anderson, T. & Leal, D. (1997). Enviro-Capitalism: Doing Good While Doing Well,
Lanham, MD: Rowman Littlefield Publishers.
Bennett, S.J. (1991). Ecopreneuring: The Complete Guide to Small Business
Opportunities from the Environmental Revolution, New York , NY: Wiley.
Berle, G. (1991). The green entrepreneur: business opportunities that can save the earth
and make you money, Blue Ridge Summit, PA: Liberty Hall Press.
Carter, N., Gartner, W. B., Shaver, K. G., & Gatewood, E. J. (2003). The career reasons of
nascent entrepreneurs. Journal of Business Venturing, 18, 13-39.
Cohen, B. & Winn, M. (2007). Market imperfections, opportunity and sustainable
entrepreneurship, Journal of Business Venturing, 22 (1), 29-49.
DeMartino, R., & Barbato, R. (2003). Differences between women and men MBA
entrepreneurs: Exploring family flexibility and wealth creation as career motivators. Journal
of Business Venturing, 18(6), 815-832.
Hendrickson, L., & Tuttle, D. (1997). Dynamic management of the environmental
enterprise: a qualitative analysis. Journal of Organizational Change Management, 10(4),
363-375.
Issak, R. (1999). Green logic: Ecopreneurship, theory and ethics. Kumarian Press.
38(Summer), 81-91.
Keogh, P. D. & Polonsky, M. J. (1998). Environmental commitment: A basis for
environmental entrepreneurship?. Journal of Organizational Change Management, 11 (1),
38-49.
Kirkwood, J., & Walton, S. (2010). What motivates ecopreneurs to start a business?.
International Journal of Entrepreneurial Behaviour and Research, 16(3), 204-228.
Kyrö, P. (2001). To grow or not to grow? Entrepreneurship and sustainable development.
The International Journal of Sustainable Development and World Ecology, 8.
Larson, A.L. (2000). Sustainable Innovation through an Entrepreneurship Lens. Business
Strategy and the Environment, Vol. 9, 304 – 317.
Linnanen L. (2002). An insider’s experiences with environmental entrepreneurship.
Greener Management International. Helsinki University of Technology, Finland, 71-80
Lober, D.J. (1998). Pollution Prevention and Corporate Entrepreneuship. Journal of
Organizational Change Management, 11 (1), 26-37.
Proceedings of 7th WEEC Niche 5: Ecological and
green economies
32
Marlow, S. & Strange, A. (1994). Female entrepreneurs – success by whose standards?”,
in Tanton, M. (Ed.), Female Entrepreneurs – Success by Whose Standards?, London:
Routledge.
Pastakia A. (2002). Assessing Ecopreneurship in the Context of a Developing Country The
case of India. Greener Management International, 93- 108.
Pastakia, A. (1998). Grassroots ecopreneurs: Change agents for a sustainable society.
Journal of Organizational Change Management, 11(2), 157-173.
Pinchot, G. (1988). Intrapreneuring. Wiesbaden: Gabler.
Post, J. & Altman, B. (1994). Managing the environmental change process: barriers and
opportunities. Journal of Organizational Change Management, 7(4), 64-81.
Schaltegger, S. (2002). A framework for ecopreneurship: Leading bioneers and
environmental managers to ecopreneurship. Greener Management International,
38(Summer), 45-58.
Schaper, M. (2002). The essence of ecopreneurship. Greener Management International,
38 (Summer), 26-30.
Schumpeter, J. A. (1934). The theory of economic development. Cambridge, MA: Harvard
University Press.
Shane, S., Kolvereid, L. & Westhead, P. (1991). An exploratory examination of the
reasons leading to new firm formation across country and gender. Journal of Business
Venturing, 6(6), 431-46.
Staber, U. (1997). An ecological perspective on entrepreneurship in industrial districts.
Entrepreneurship and Regional Development, 24(1), 37-48.
Tilley F. & Young W. (2009). Sustainability Entrepreneurs: Could they be the true wealth
generators of the future?. Greener Management International, University Of Leeds UK, 79-
92.
Walley, E.E. & Taylor, D.W. (2002). Opportunists, Champions, Mavericks...?. Greener
Management International, 13 -31.
Wiklund, J. (1999). The Sustainability of the Entrepreneurial Orientation – Performance
Relationship. Entrepreneurship Theory and Practice, 24(1), 37-48.
Cuestionar el modelo económico cuestionando el consumo
Las nueve necesidades para la educación ambiental
Nancy Virginia Benítez Esquivel de la Universidad Pedagógica Nacional, México.
Rafael Tonatiuh Ramírez Beltrán de la Universidad Pedagógica Nacional, México.
Resumen
Partimos de considerar que la crisis ambiental actual se origina en el modelo económico
dominante y globalizado, una de sus características es que depende del consumismo. El
acto de comprar, el consumo, es la actuación económica que corresponde realizar a la
ciudadanía en es este modelo. El consumo es también la concreción de prácticas y
relaciones ambientales diversas a las cuales es necesario cuestionar. Reflexionar en
torno a las 9 necesidades propuestas por Neef, Elizalde y Hopenhayn permite hacerlo y
provoca la necesidad de transformación de las prácticas de consumo personal y familiar.
Introducción
El presente documento intenta compartir la experiencia del trabajo didáctico alrededor de
lo que hemos llamado las nueve necesidades al interior de la Maestría en Educación
Ambiental que imparte la Unidad Azcapotzalco de la Universidad Pedagógica Nacional. La
idea de las nueve necesidades es tomada de los planteamientos de Neef, Hopenhayn y
Elizalde (1986) en el libro: Desarrollo a escala humana y ha sido aprovechada para que, a
través de actividades didácticas, en grupo reflexionemos acerca de las posibilidades de
actuación frente a una crisis ambiental cuyo origen se encuentra en el modelo de
desarrollo.
Para ello, ofrecemos algunas notas sobre los subsistemas de necesidades, satisfactores y
bienes. Más adelante describimos la forma en que hemos trabajado las nueve
necesidades como parte de la formación de educadores ambientales, y en espacios
diversos.
Necesidades, satisfactores y bienes
Antonio Elizalde (2009), en su artículo “Ética, sustentabilidad y consumo: ¿Cómo ser más,
teniendo menos, haciendo mucho por uno mismo y por los otros y sintiéndose además
feliz?”, recupera algunos planteamientos del libro Desarrollo a escala humana (del que es
coautor) en torno a una teoría de las necesidades humanas fundamentales y una
Proceedings of 7th WEEC Niche 5: Ecological and
green economies
34
concepción del desarrollo que rompe radicalmente con las visiones dominantes. Al
respecto propone la existencia de un sistema conformado por tres subsistemas: el de las
necesidades, el de los satisfactores y el de los bienes. Para efectos de esta ponencia,
sólo traemos algunas notas textuales que permitan identificar a cada uno:
“El subsistema de las necesidades incluye lo que podríamos describir como nuestra
interioridad; nuestras necesidades radican al interior de nuestra piel y solamente podemos
vivenciarlas en forma subjetiva. La necesidad siempre se vivencia en un plano
absolutamente personal (es algo) que está impreso en nuestra naturaleza. Somos
nuestras necesidades. Siendo las necesidades algo que fundamentalmente nos es dado,
por más que queramos no las podemos modificar como no podemos modificar nuestros
subsistemas biológicos, porque son y hacen parte de la vida. Por tal razón, afirmamos que
las necesidades fundamentales son universales, es decir, son y han sido las mismas para
todos los seres humanos a lo largo de la historia de las culturas”.
(Elizalde, 2009: 136-137)
Los autores consideran que las necesidades humanas son nueve: entendimiento,
subsistencia, protección, participación, afecto, libertad, identidad, ocio y creación. Cada
una constituye un subsistema dentro del subsistema de las necesidades humanas. Son
pocas, finitas, clasificables y universales, lo cual cambia los conceptos de pobreza y
riqueza, especialmente porque se nos ha hecho creer que lo más importante es satisfacer
la necesidad de subsistencia. En tal sentido, es importante no confundir el crecimiento en
la cantidad de los bienes con el desarrollo de las personas. No verlas como carencias sino
como posibilidades.
“El segundo subsistema es el de los satisfactores. Por el contrario del anterior subsistema,
éstos son las formas históricas y culturales mediante damos cuenta de nuestras
necesidades humanas fundamentales. Son la historización de éstas. Constituyen las
formas mediante las cuales en cada cultura, en cada sociedad, en cada circunstancia
histórica se buscan y diseñan las mejores formas de actualizar las necesidades de sus
integrantes. Sin embargo, en cuanto formas de hacer las cosas, los satisfactores, por una
parte, son inmateriales, y por otra, constituyen la interfaz entre lo que es la exterior idad y
la interioridad, entre los bienes y las necesidades fundamentales”. (Elizalde, 2009:137)
Los autores identifican cinco tipos de satisfactores:
Destructores o violadores. Por la forma que satisfacen la necesidad no sólo aniquilan
la posibilidad de satisfacción de esa necesidad sino que además imposibilitan la
satisfacción de otras necesidades. Ejemplo: armamentismo.
Pseudo-satisfactores. Estimulan una falsa satisfacción de una necesidad; son
inducidos por la publicidad u otro medio de persuasión: prostitución, modas, drogadicción.
Inhibidores. Sobresatisfacen una necesidad y dificultan la posibilidad de satisfacer
otras; se hallan ritualizados y muy arraigados en hábitos y costumbres: paternalismo,
clientelismo político, monocultivo, competencia excesiva.
Singulares. Apuntan a la satisfacción única y exclusiva de una necesidad y son
neutros respecto a otras necesidades y generalmente institucionalizados: espectáculos
deportivos.
Sinérgicos. Logran producir un potenciamiento generalizado en todo el sistema y
aunque apuntan a una necesidad, actualizan a la vez otras necesidades: lactancia
materna.
“El tercer subsistema es el de los bienes. Éstos son los artefactos materiales de la cultura
y son fundamentalmente pura exterioridad, son objetos o cosas que potencian la
capacidad de los satisfactores para dar cuenta de la necesidad. Vivimos rodeados de
bienes. Bienes son todos los elementos producidos por nosotros que están fuera de
nuestra propia piel (…) tienen una existencia física, son materiales. Por definición, un bien
es algo de tipo material, algo concreto y consecuentemente tiene un peso entrópico1. De
modo tal que grava al sistema mayor, que es el sistema de la vida, de la biosfera.
Una característica del modelo de desarrollo capitalista es que promueve la idea de que las
necesidades se satisfacen con la compra de bienes, y que la necesidad de subsistencia
es la prioritaria; que la satisfacción de las necesidades se mide por el poder adquisitivo de
la población y que se trata de elevar éste para elevar la “calidad” de vida. Con los
planteamientos que hemos revisado es posible asomarnos a una manera distinta de mirar
1 “… los bienes, en cuanto tienen peso entrópico, están acotados dentro de límites que no se pueden transgredir. Por ejemplo, en algún momento la cantidad de bienes se traducen en chatarra y por más que creamos que los procesos económicos terminan exclusivamente en los bienes, eso es equivocado. Termina en lo que es fundamentalmente producción de basura y eso implica problemas como el dónde depositar los desechos. Un indicador del desarrollo es la producción de basura; en la medida que aumenta el ingreso per cápita y por tanto el consumo, aumenta la basura. Los pobres producen poca basura, los ricos producen mucha basura.” (Elizalde, 2009:137-138)
Proceedings of 7th WEEC Niche 5: Ecological and
green economies
36
y descifrar el mundo, toda vez que sugieren que no se trata de comprar y acumular
bienes, que los satisfactores son más bien prácticas humanas que no dependen del poder
adquisitivo y que las necesidades aunque pocas, son de un espectro más amplio que la
subsistencia.
Las nueve necesidades en una estrategia didáctica
En la maestría en educación ambiental de la Universidad Pedagógica Nacional de México,
más concretamente en la asignatura de Medio ambiente interesan tres conceptos básicos:
medio ambiente, crisis ambiental y sustentabilidad. Esta asignatura se imparte en el
primer semestre, simultánea a la de Teorías del desarrollo y previa a Educación
ambiental. En el primer caso nos preocupa romper la visión muy común de que el medio
ambiente es la naturaleza y tratamos de ampliar esta visión reconociendo la mediación
cultural en la conformación compleja del mismo. En tal sentido, es importante reconocer
que el ser humano es también naturaleza y es también una especie con derecho a vivir, y
por tanto parte de la gran cadena de la vida, dado que es muy común también percibir a la
humanidad como algo ajeno a la naturaleza o como el depredador por excelencia. En
cuanto a la crisis ambiental, hacemos hincapié en su carácter civilizatorio y muy propio del
modelo de desarrollo capitalista que, en términos de Víctor Manuel Toledo (1992) tiene
dos víctimas: los pobres y la naturaleza. En este rubro es necesario que nuestros
estudiantes reconozcan la manera en que el modelo de desarrollo está introyectado en la
cotidianidad y en el presente, que no siempre hemos vivido como ahora y que, por tanto,
es posible y deseable poner en marcha alternativas. Ahí entra la sustentabilidad como ese
conjunto de características de los ecosistemas que pueden orientar la organización
humana, de manera que nuestra especie pueda vivir de manera más armónica con el
entorno, que es posible reducir el impacto de nuestra especie en el planeta.
En ese conjunto de preocupaciones, el encuentro con los planteamientos de las
necesidades, los bienes y los satisfactores a fines de 2010 ha resultado significativo e
inspirador para esta clase y para los estudiantes, quienes en su mayoría son profesores
en servicio. El primer paso natural fue invitarlos a la lectura del texto “Ética,
sustentabilidad y consumo…” para su comentario en clase. Casi al mismo tiempo con el
diálogo en torno al texto se van asentando ideas en torno a, por ejemplo, que los
satisfactores son en realidad “prácticas”, y ello se conecta con el trabajo que se había
venido realizando en la identificación y conceptualización de “prácticas ambientales
cotidianas” las cuales se han propuesto como “contenidos de la educación ambiental” y de
las cuales no profundizaremos en este espacio, tan sólo diremos que su identificación
permite reconocer el papel del modelo civilizatorio en el actuar cotidiano, así como que
nos relacionamos constantemente con el ambiente de múltiples y muy diversas maneras y
que ello da cuenta de nuestra evolución cultural en la historia familiar o comunitaria.
A mediados de 2011 tuvimos la oportunidad de participar en el 2º Foro de los pueblos
indígenas cuya temática era multiculturalidad, biodiversidad y sustentabilidad, en el cual
fue importante partir de una pregunta para el auditorio de campesinos: ¿Trabajamos para
tener dinero para satisfacer nuestras necesidades o trabajamos para satisfacer nuestras
necesidades? Obviamente, para ellos fue sencillo identificar que se trataba de la segunda
opción, pero que esto tenía un significado más profundo. Así que después de compartir un
fragmento del video “Canastitas en serie” les presentamos las nueve necesidades y
planteamos algunas otras ideas como: lo que produce una comunidad tiene que servir
para satisfacer primero las necesidades de la comunidad, y tener cuidado con proyectos
de desarrollo sustentable impulsados por el gobierno o asociaciones que en realidad nos
son sustentables, ya que profundizan la dependencia económica o empujan a las
comunidades a competir injustamente en mercados internacionales, con ofertas de poca
demanda (es el caso de la artesanía). Al término de la presentación se acercaron
personas para apuntar las nueve necesidades y llevárselas escritas. Una de ellas nos dijo
que no se había imaginado que el ocio fuera una necesidad.
A partir de esta experiencia fuimos comprendiendo que, por ejemplo, el trabajo en sí
mismo, es un satisfactor sinérgico y que, con fines didácticos, si colocamos a las nueve
necesidades como primera columna en una tabla y en la siguiente escribimos una práctica
o satisfactor enunciado de una manera más o menos pertinente, podríamos tener
elementos para una reflexión grupal que se profundiza paulatinamente. Para una
estudiante, hoy egresada, ésta fue una actividad didáctica en el proyecto de intervención
con el que obtuvo su grado y que estuvo dirigido a estudiantes de Licenciatura en
educación preescolar. Al respecto en su tesis señala:
“A partir de la reflexión en la definición de los satisfactores en lo cotidiano, las alumnas
detectaron que una posibilidad distinta de impactar en la relación con el ambiente, los
otros y ellas mismas, es a través de afrontar, que es necesario darle un giro a los
Proceedings of 7th WEEC Niche 5: Ecological and
green economies
38
satisfactores que constituyen parte importante de la interacción con el ambiente. (…)
Pensando un poco más sobre esta realidad las alumnas también refieren que al
pensar en el tipo de bienes y revisar la necesidad que se satisface con ellos, se dan
cuenta de que prioritariamente se está aportando al crecimiento de una economía
dominante promovida principalmente por los medios de comunicación.” (Ortega,
2013:176)
El diálogo entablado en torno a experiencias como ésta ha traído consigo varios
productos, uno de ellos es el diseño de la asignatura de medio ambiente para la XII
generación de la maestría, que actualmente la cursa y que representa hasta el momento
una estrategia muy completa que no sería posible describir aquí. Sólo daremos algunos
antecedentes a partir de los cuales la reflexión en torno a las nueve necesidades ha
resultado significativo.
Uno de los intereses en la maestría es que los estudiantes sean capaces de escribir una
tesis y para ello entendemos que, aunque dominan la escritura, la escritura argumentada
y formal requiere de un proceso de acompañamiento y retroalimentación constante, de
modo que, además del control de lectura, en esta ocasión hemos pedido a los estudiantes
que escriban “diarios” en los que registran su cotidianidad en torno a temáticas
específicas, como: los momentos en que se relacionan con el ambiente, sus prácticas
ambientales cotidianas o la presencia de la crisis en su vida. Este trabajo permite
paulatinamente vincular lo que leen en los textos con su vida cotidiana y reflexionar
habitualmente.
“Las nueve necesidades” entra como contenido en la Unidad referida a la crisis ambiental
y enfilada hacia la de sustentabilidad. Como actividad extra clase los estudiantes leyeron
el artículo “Ética, sustentabilidad y consumo…” e hicieron un control de lectura y además
les encargamos que llevaran fotografías de 50 objetos valiosos en imágenes recortadas
de 5x5cm. En la clase, primero se hizo una revisión del texto, en concreto de los
subsistemas de necesidades, satisfactores y bienes, durante la cual los estudiantes de
inmediato comentaron sus reflexiones en torno al modelo de desarrollo, a la forma de
consumir y a las creencias propias de que se trata de tener cada vez más. Posteriormente
les pedimos que pegaran las fotografías de los objetos en hojas de rotafolio clasificadas
por necesidad. Fue interesante que había objetos que no correspondían a ninguna
necesidad, que la mayoría corresponde a la necesidad de subsistencia, y sobre todo, que
hubo una cantidad importante de objetos (bienes) asociados a la identidad y la libertad.
Adicionalmente comentaron que no imaginaban tener más de 50 objetos valiosos en su
casa, y que el criterio de lo que es valioso pasó de “lo caro” a “lo útil”. Al respecto
comentaron también que lo útil es menos caro. Por supuesto se trataba de relacionar los
objetos con necesidades, aun cuando la lectura habla de que esta relación no es directa,
sin embargo, nos interesaba que cayeran en cuenta de la acumulación de objetos en la
que ciframos nuestro éxito e identidad.
Con las imágenes de fondo pasamos a revisar algunos satisfactores. En principio con la
pregunta sobre si en esta semana se había satisfecho todas las necesidades y que
comentaran cómo. Luego identificando algunos satisfactores o maneras de satisfacer una
necesidad para analizar qué tan sinérgicos son. El ejercicio colectivo giró en torno a la
alimentación, a partir de tres opciones: preparar la comida en casa, comprar comida para
llevar o comer fuera. Preparar la comida en casa resultó ser el satisfactor más sinérgico y
derivado del ejercicio nos preguntamos si tenemos tiempo para preparar comida en casa
y por qué. Para concluir se analizó el trabajo como satisfactor, enfatizando que se nos ha
vendido la idea de que el trabajo es el instrumento para satisfacer las necesidades por el
ingreso que aporta, cuando es un satisfactor de alta sinergia en sí mismo. La tarea fue
identificar otros satisfactores sinérgicos a través de sus diarios de campo.
Referencias bibliográficas
Elizalde, A. (2009) “Ética, sustentabilidad y consumo: ¿Cómo ser más, teniendo menos,
haciendo mucho por uno mismo y por los otros y sintiéndose además feliz?”, en Reyes J.
y Castro E. (2009) Urgencia y utopía frente a la crisis de civilización. Guadalajara, México,
Universidad de Guadalajara.
Max- Neef, M., Elizalde A. y Hopenhayn Martín (1986) Desarrollo a escala humana, una
opción para el futuro. Santiago de Chile, Cepaur.
Ortega, L. (2013) Interacciones educativas y educación ambiental. Una intervención con
alumnas de Licenciatura en educación. Tesis para obtener el grado de Maestra en
Educación Ambiental. México, Universidad Pedagógica Nacional.

Proceedings of 7th WEEC Niche 5: Ecological and
green economies
40
البيضاء الدار -المحمدية الثاني الحسن جامعة
المحمدية -كلية اآلداب والعلوم اإلنسانية
" مستدامة وتنمية سليمة لبيئة رهان :البيئية السياحة"
)األطلس المتوسط المغربي( إفرانإق ليم نموذج: ي / الطالب الباحث: عماد ابرانات تحت إشراف الدكتورة: جميلة السعيد
[email protected] / [email protected] LABORATOIRE: GESIAC
تقديم
ف من رئيسية وظيفة البيئية الجودة تأكيد أصبحت لقد تنمية تحقيق أجل من عليها المتعارف الوظائ على اإلنتاج مستوى لرفع اومشجع امهم عامال المستدامة التنمية موضوع يكون أن يجب وبالتالي مستدامة،
طبيعة تحديد المستدامة للتنمية تتيح التي الفرص تشجيع رعب التدبير مستوى رفع وعليه يتحتم األصعدة، جميع .أفضل اجتماعية وحياة ةنظيف بيئة توفير مع تتالءم التي الصناعات
الوطني، يوفي إطار الحديث عن اقتصاد يحترم البيئة وباعتبار السياحة قاطرة تنموية ضمن النسيج االقتصاد اتجه المغرب نحو تدعيم السياحة المسؤولة كخيار استراتيجي يضمن عنصر االستدامة في جميع التدخالت.
ى المسؤولة العمل على نشر الثقافة البيئية فضال عن الثقافة السياحية وبالتالي فإن وزيادة الوعي سواء لدئ الفكر البيئي في نفوس شرائح ضرورة غرس مبالاألفراد أو األجهزة الحكومية هو ما يقتضي فاهيم وأسس ومبادى الجميع أنالمجتمع منذ الصغر فاحترام البيئة يجب ومعه األجيال ألن حماية البيئة ، يكون شعورًا داخليًا لد
.للعيش في بيئة آمنة ونقية تسعى إليه المجتمعات أنهدف عام يجب القادمةالسياحة البيئية، التي تعتمد على عوامل بأخذ بعين االعتبار نوعية في اآلونة األخيرة طفرة د السياحةشهتلهذا
في تنشيط -المتقدمة– أن السياحة البيئية السليمة تساهم في كثير من الدول فنجدجذب طبيعية وبيئية، كن السياحة البيئية يم أن االقتصاد الوطني فضال عن دورها في المحافظة على الموارد الطبيعية ، بمعنى آخر
في الموارد الطبيعية لمنفعة اإلنسانأن توفر تمويال ذاتيا مستمرا يعود مردوده بالفائدة على إدارة وتطوير الحاضر والمستقبل.
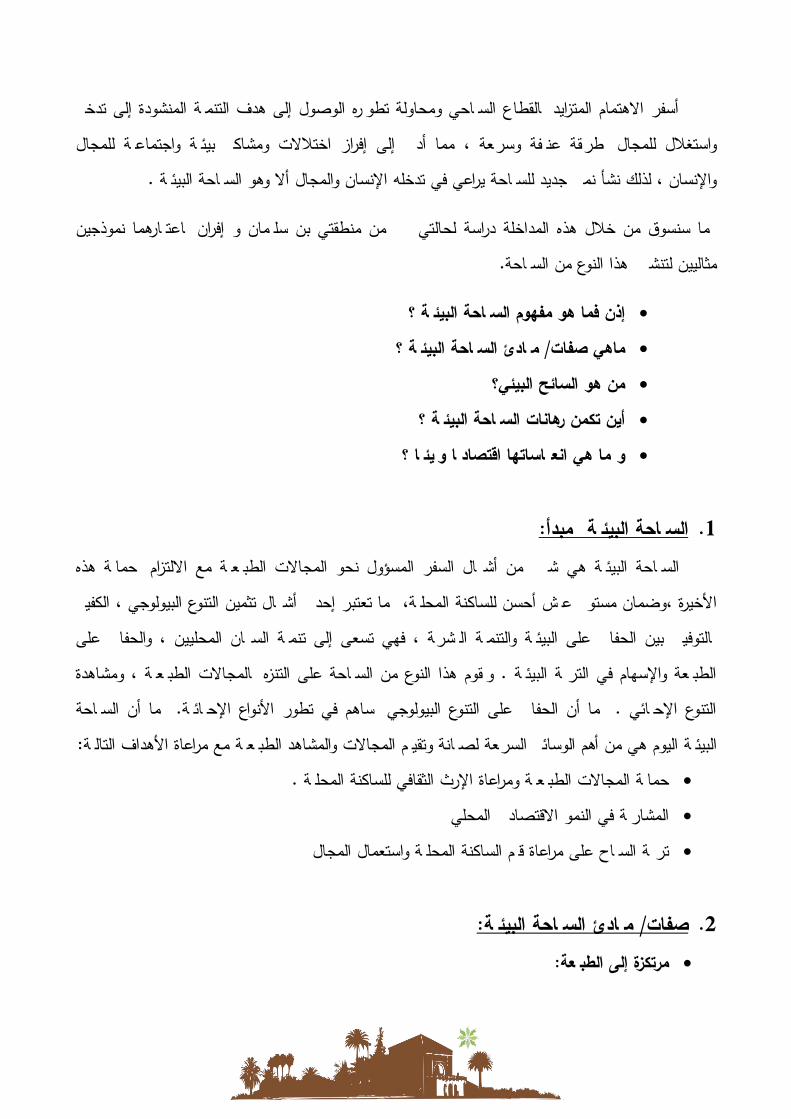
أسفر االهتمام المتزايد بالقطاع السياحي ومحاولة تطويره الوصول إلى هدف التنمية المنشودة إلى تدخل ى إلى إفراز اختالالت ومشاكل بيئية واجتماعية للمجال واستغالل للمجال بطريقة عنيفة وسريعة ، مما أد
واإلنسان ، لذلك نشأ نمط جديد للسياحة يراعي في تدخله اإلنسان والمجال أال وهو السياحة البيئية .
كما سنسوق من خالل هذه المداخلة دراسة لحالتي كل من منطقتي بن سليمان و إفران باعتبارهما نموذجين شيط هذا النوع من السياحة.مثاليين لتن
مفهوم السياحة البيئية ؟ هو فما إذن ؟ صفات/ مبادئ السياحة البيئيةماهي ؟السائح البيئي من هو أين تكمن رهانات السياحة البيئية ؟ ؟اقتصاديا وبيئيا ها انعكاساتو ما هي
السياحة البيئية كمبدأ: .1
بحماية هذه االلتزامشكل من أشكال السفر المسؤول نحو المجاالت الطبيعية مع السياحة البيئية هيى تعتبر ، كمااألخيرة ،وضمان مستوى عيش أحسن للساكنة المحلية أشكال تثمين التنوع البيولوجي ، الكفيل إحد
ين ، والحفاظ على بالتوفيق بين الحفاظ على البيئية والتنمية البشرية ، فهي تسعى إلى تنمية السكان المحليالطبيعة واإلسهام في التربية البيئية . ويقوم هذا النوع من السياحة على التنزه بالمجاالت الطبيعية ، ومشاهدة
السياحة أنكما .التنوع اإلحيائي . كما أن الحفاظ على التنوع البيولوجي يساهم في تطور األنواع اإلحيائية التالية: فلسريعة لصيانة وتقييم المجاالت والمشاهد الطبيعية مع مراعاة األهدامن أهم الوسائل ا هي البيئية اليوم
. حماية المجاالت الطبيعية ومراعاة اإلرث الثقافي للساكنة المحلية ي المحلي المشاركة في النمو االقتصاد تربية السياح على مراعاة قيم الساكنة المحلية واستعمال المجال
:السياحة البيئيةصفات/ مبادئ .2 :مرتكزة إلى الطبيعة

Proceedings of 7th WEEC Niche 5: Ecological and
green economies
42
البيولوجية، وأيضًا المعالم المادية ، إن السياحة البيئية مرتكزة إلى البيئة الطبيعية مع التركيز على المعالم الحيوية)الطبيعية/ الفيزيائية( والمعالم الثقافية. حيث تحدث السياحة البيئية في موقع طبيعي وتعتمد عليه، وقد تتضمن مكونات ثقافية حيثما وجدت تلك المكونات في موقع طبيعي. وهنا يكون الحفاظ على المورد الطبيعي أمرًا
أساسيًا من أجل تخطيط وتطوير وا دارة السياحة البيئية.
:)مستدامة إيكولوجيا )بيئيًا
ف فعالياتها ا حترام بيئة وثقافة البلد السياحة البيئية هي سياحة مستدامة بيئيًا، هذا يستوجب أن تتضمن في مختلي أو المنطقة المضيفة. وهذا يتطلب إجراءات إدارية وتنظيمية عديدة أهمها تحديد القدرة االستيعابية للموقع، أ
ي يسمح له بزيارة الموقع أو المنطقة بدون إحداث تغيير غير مقبول أو محبذ تحديد العدد األقصى من الزوار الذاقض أو انخفاض غير محبذ في نوعية التجربة أو الخبرة التي سيكتسبها السائح في البيئة الطبيعية وبدون تن
البيئي.
كما تلعب الترسانة القانونية المعدة لهذا الغرض دورا مهما في ضمان شرط اإلستدامة في هذا النوع من السياحة.
بيئيًا:مثقفة
ف والتفسير البيئي يشكالن أدوات هامة لخلق تجربة سياح ية بيئية ممتعة ومفيدة أو ذات معنى. وسمة إن التثقيي يتوجه إليه. ى السمات المميزة للمنتج السياحي البيئي وبالتالي المحددة لقطاعه السوقي الذ ف تشكل إحد التثقيفالسياحة البيئية في الحالة المثالية ينبغي أن تقود إلى تصرف إيجابي إزاء البيئية عبر تبني وعي معزز للحفاظ
ف البيئي أن يؤثر في سلوك السائح والمجتمع وصناعة السياحة ويساعد في على البيئ ة. وعليه يمكن للتثقيف البيئي أن يكون مفيدًا كأداة االستدامة طويلة األمد للنشاط السياحي في المناطق الطبيعية. كما يمكن للتثقي
ة الكبيرة المتعلقة بالبيئة، ذلك أنهإلدارة المناطق الطبيعية، حيث أن التفسير يساعد السياح على رؤية الصور يعترف بالقيم الطبيعية والثقافية للمنطقة باإلضافة للقضايا األخرى مثل إدارة الموارد.
السائح البيئي .3ف وفريد يدور جدل كبير عندما تذكر الصفات المميزة للسائح البيئي، وهذا يعني بدون شك أنه سائح مختل
مميزات هذا السائح:، حيث سنجد من أهم من نوعه .إيمانه بأهمية و قيمة هذا النوع من السياحة .ي للوصول إلى هدفه تحمل المشاق والصعوبات وقبول التحد
.الرغبة في التفاعل مع السكان المحليين واالنخراط بثقافتهم وحياتهم االجتماعية .ف حتى بوجود خدمات سياحية بسيطة سهل التكي السير مشيًا على األقدام لفترات طويلة نسبيًا، ومواجهة الصعوبات بروح تحمل اإلزعاج والقدرة على
طيبة. .إيجابي وغير انفعالي وجود رغبة كبيرة للتعرف على األماكن الطبيعية حقيقية، ميدانية الرغبة في الحصول على خبرة
.والحضارية
رهانات السياحة البيئية: .4
واجهات فهناك:تراهن السياحة البيئية اليوم على عدة
.ضمان طابع االستدامة بهذا النوع من النشاط السياحي الملتزم
البيئية.إدماج السكان المحليين في نشاط السياحة
على خصوصياتها الطبيعية والثقافية . لالستقبال ضمان محافظة المنطقة المراد تهيئتها
. االلتزام بعدد محدود من الزوار
:يااقتصاديا وبيئها انعكاسات .5 اإليجابية:االنعكاسات
ى الساكنة المحلية ونشر ثقافة بيئية التشجيع على حماية البيئية .عبر ترسيخ الحس البيئي لد
التشجيع على المحافظة وحماية المنظومة اإلحيائية األصلية.
إشراك السياح البيئيين بشكل مباشر في تحسين الوضع المعيشي للسكان.
اقتصادية ذات جدوى اقتصادية و صديقة للبيئة.إقامة مشاريع
السلبية:االنعكاسات
للوافد غير المنظم للسياح. نظراتدهور المجال عند تجاوز الطاقة االستيعابية له

Proceedings of 7th WEEC Niche 5: Ecological and
green economies
44
البيئية.نظرا لعدم استقرار السياحة العمل،هجرة السكان المحليين بحثا عن
.) تراجع التنوع اإلحيائي ) نبيت، وحيش
حالة: دراسة .6
:مجال متميز لممارسة السياحة البيئية إفران
بين جبال األطلس المتوسط توجد مدينة إفران ذات المؤهالت السياحية الكبيرة ، تتمثل في الغنى الطبيعي من مساحة إقليم %24من )أودية وجبال ومواقع بركانية وشالالت وبحيرات ومنابع المياه ، وغطاء غابوي يمثل
.( ،إضافة إلى الموروث العمراني والثقافي والتاريخي الغني )الصناعة التقليدية والفلكلور والمطبخ إفران .. المحلي...(
كل هذه المؤهالت تجعل من المنطقة قطب سياحي مهم ، تمارس فيه عدة هوايات ) كركوب الخيل وركوب الدراجات والتزحلق على الجليد ...(.
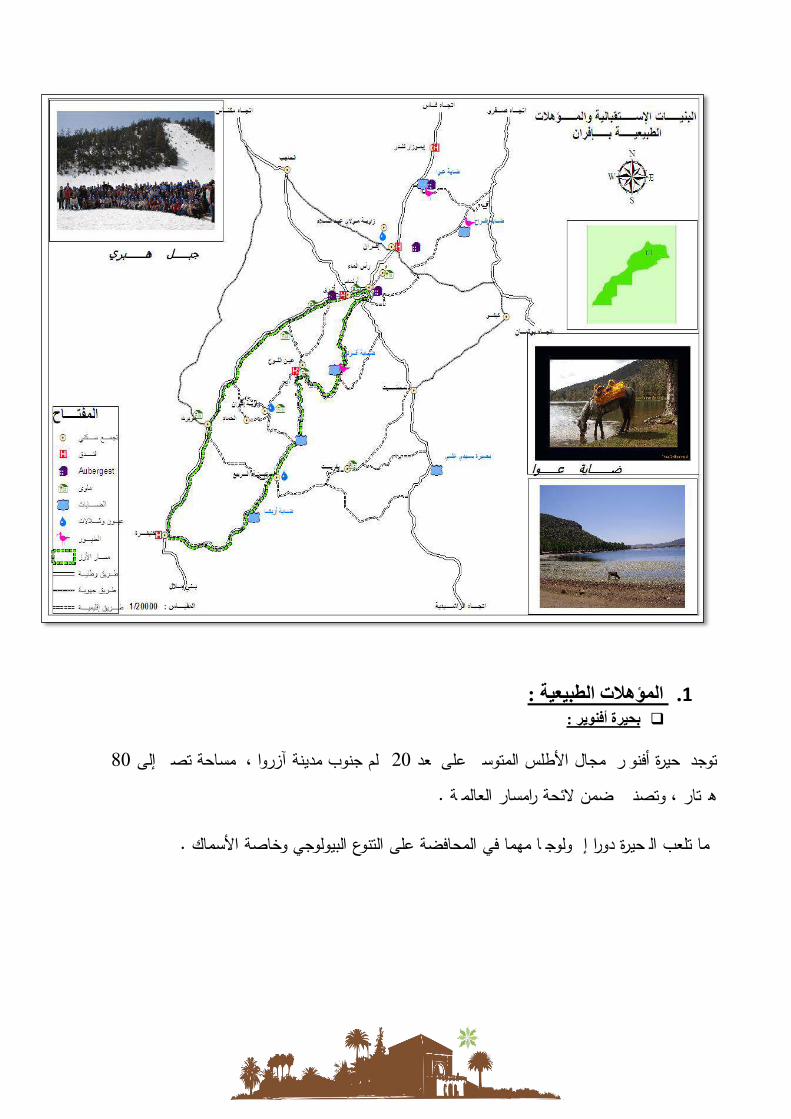
المؤهالت الطبيعية : .1 بحيرة أفنوير :
02كلم جنوب مدينة آزروا ، بمساحة تصل إلى 42توجد بحيرة أفنوير بمجال األطلس المتوسط على بعد ف ضمن الئحة رامسار العالمية . هكتار ، وتصن
كما تلعب البحيرة دورا إيكولوجيا مهما في المحافضة على التنوع البيولوجي وخاصة األسماك .
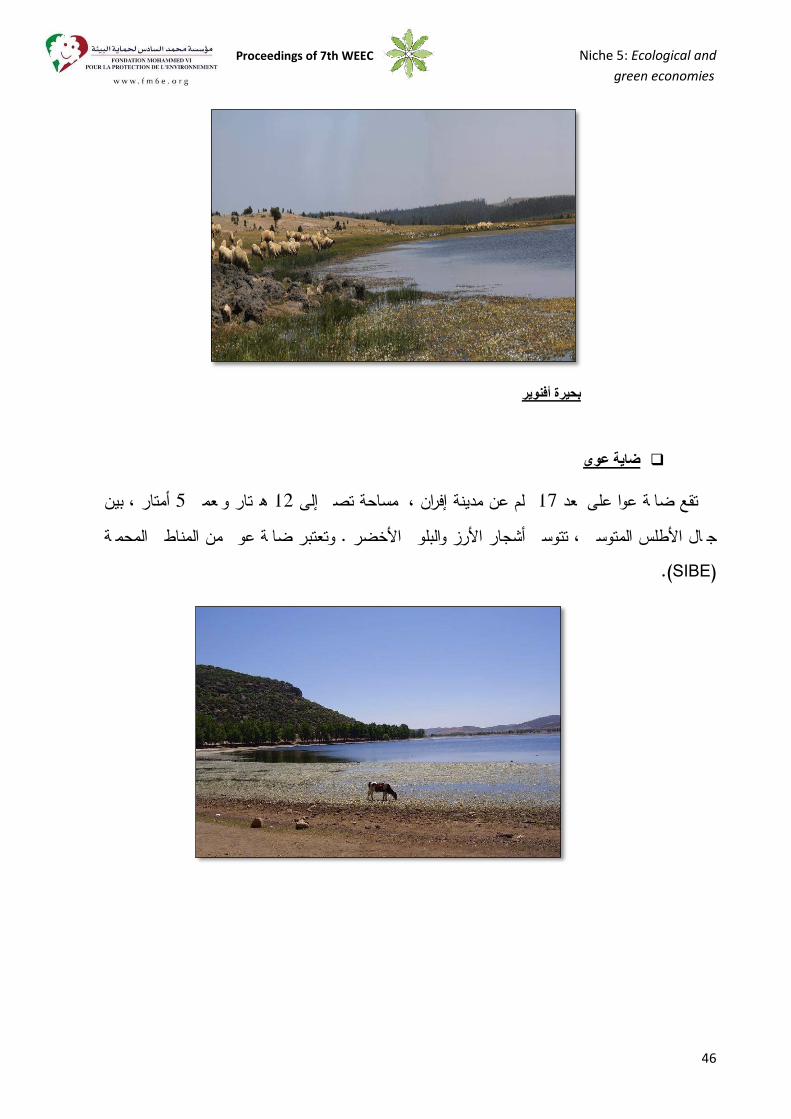
Proceedings of 7th WEEC Niche 5: Ecological and
green economies
46
بحيرة أفنوير
عوى ضاية
أمتار ، بين 5هكتار وبعمق 74كلم عن مدينة إفران ، بمساحة تصل إلى 71تقع ضاية عوا على بعد وتعتبر ضاية عوى من المناطق المحمية جبال األطلس المتوسط ، تتوسط أشجار األرز والبلوط األخضر .
(SIBE).
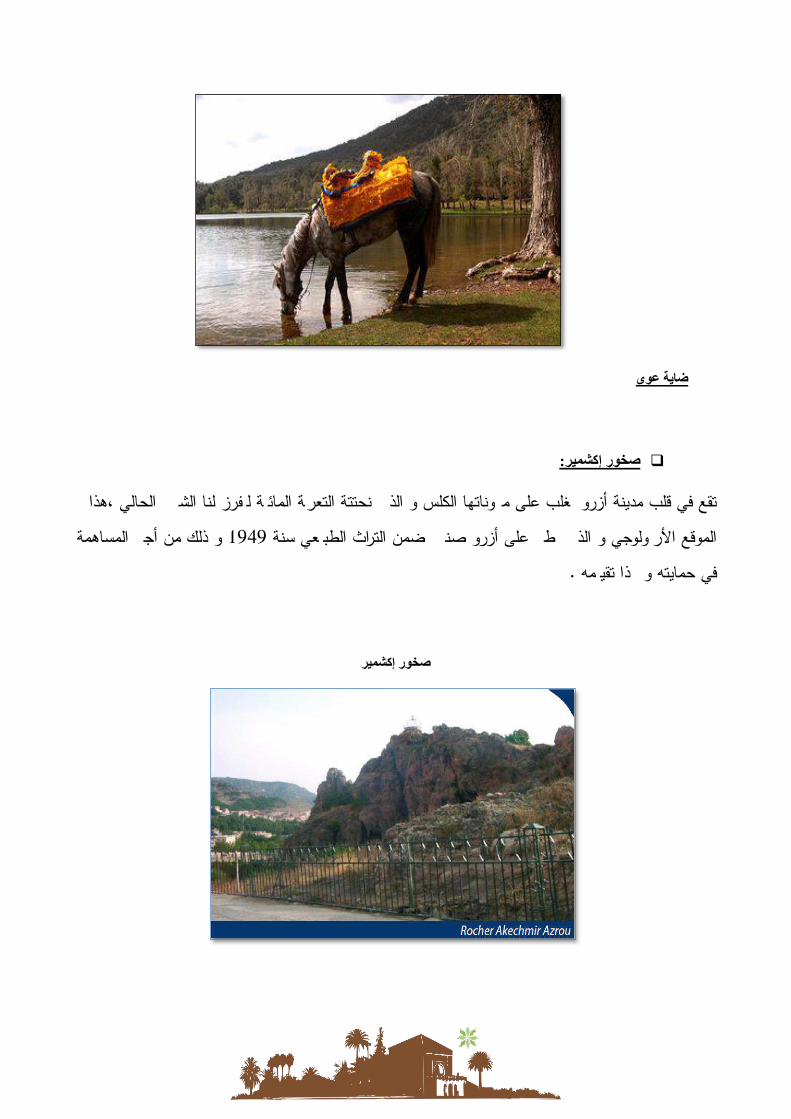
عوى ضاية
إكشميرصخور:
ي نحتتة التعرية المائية ليفرز لنا الشكل الحالي ،هذا تقع في قلب مدينة أزرو يغلب على مكوناتها الكلس و الذف ضمن التراث الطبيعي ي يطل على أزرو صن و ذلك من أجل المساهمة 7121سنة الموقع األركولوجي و الذ
في حمايته و كذا تقييمه .
صخور إكشمير
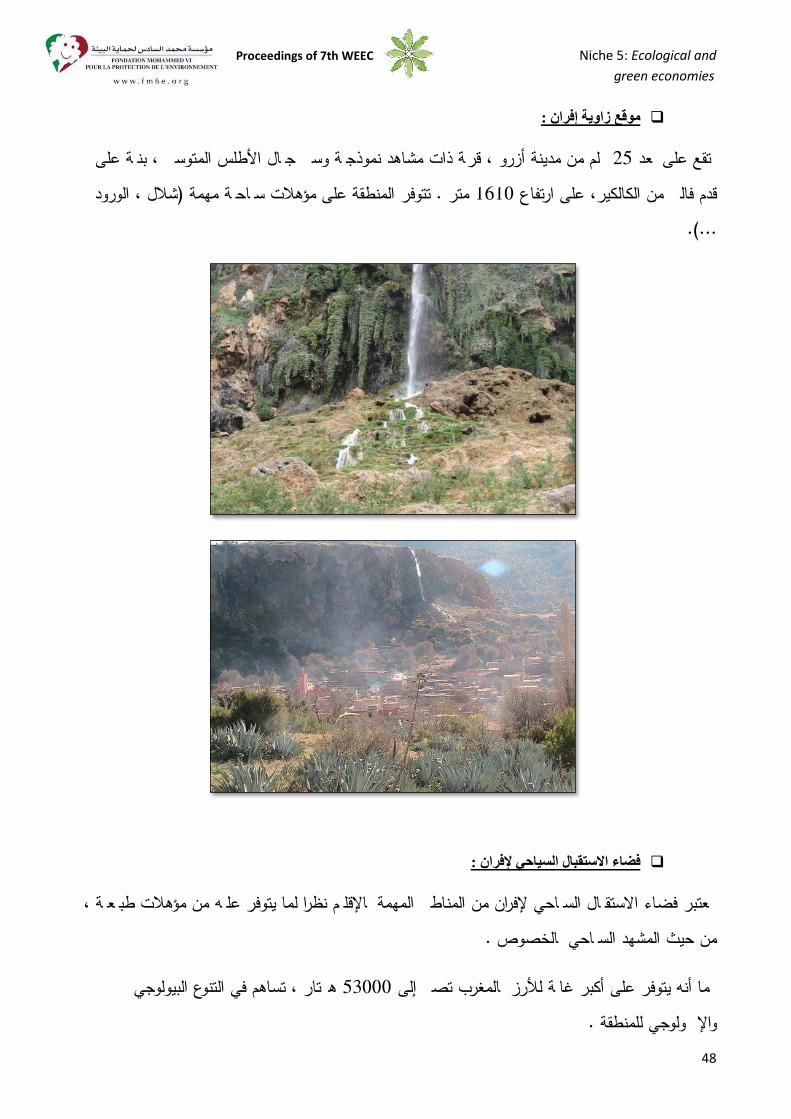
Proceedings of 7th WEEC Niche 5: Ecological and
green economies
48
إفرانموقع زاوية :
، بنية على وسط جبال األطلس المتوسط كلم من مدينة أزرو ، قرية ذات مشاهد نموذجية 45تقع على بعد )شالل ، الورود ياحية مهمةس متر . تتوفر المنطقة على مؤهالت 7172قدم فالق من الكالكير، على ارتفاع
)....
فضاء االستقبال السياحي إلفران :
االستقبال السياحي إلفران من المناطق المهمة باإلقليم نظرا لما يتوفر عليه من مؤهالت طبيعية ، يعتبر فضاء من حيث المشهد السياحي بالخصوص .
هكتار ، تساهم في التنوع البيولوجي 50222كما أنه يتوفر على أكبر غابة لألرز بالمغرب تصل إلى للمنطقة . واإليكولوجي
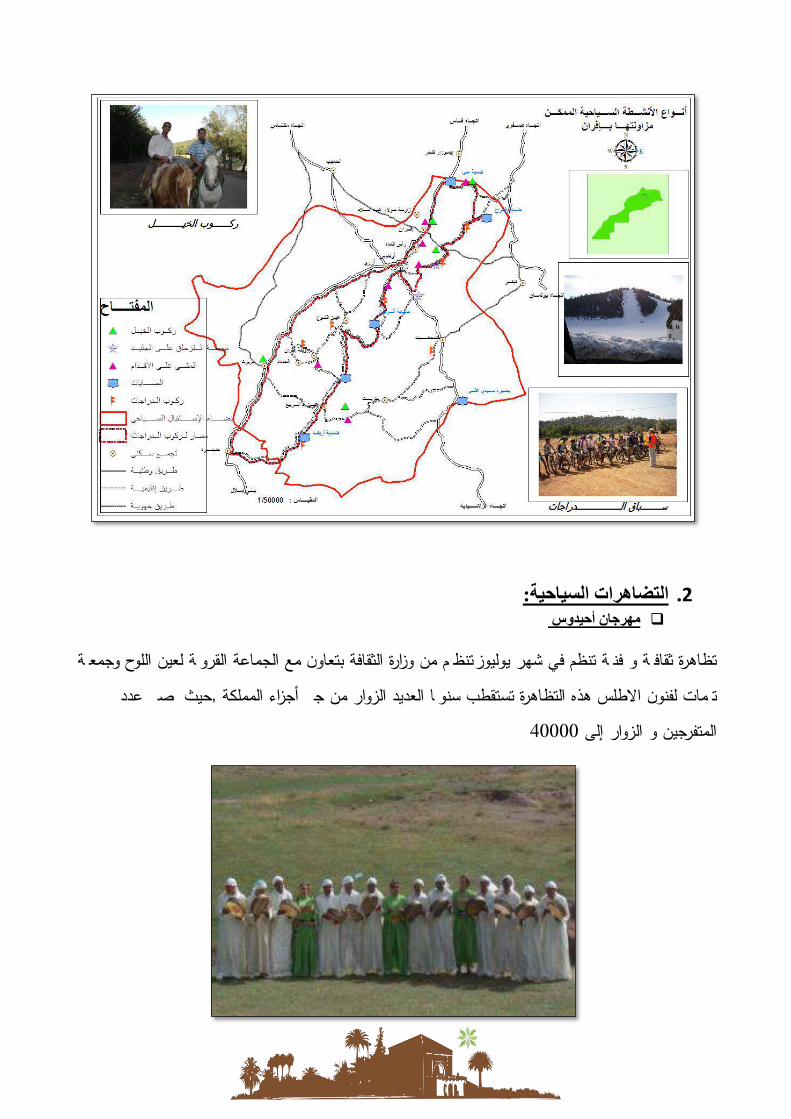
السياحية: التضاهرات .2 مهرجان أحيدوس
وزارة الثقافة بتعاون مع الجماعة القروية لعين اللوح وجمعية تظاهرة ثقافية و فنية تنظم في شهر يوليوزبتنظيم من تيمات لفنون االطلس هذه التظاهرة تستقطب سنويا العديد الزوار من جل أجزاء المملكة ,حيث يصل عدد
22222 المتفرجين و الزوار إلى
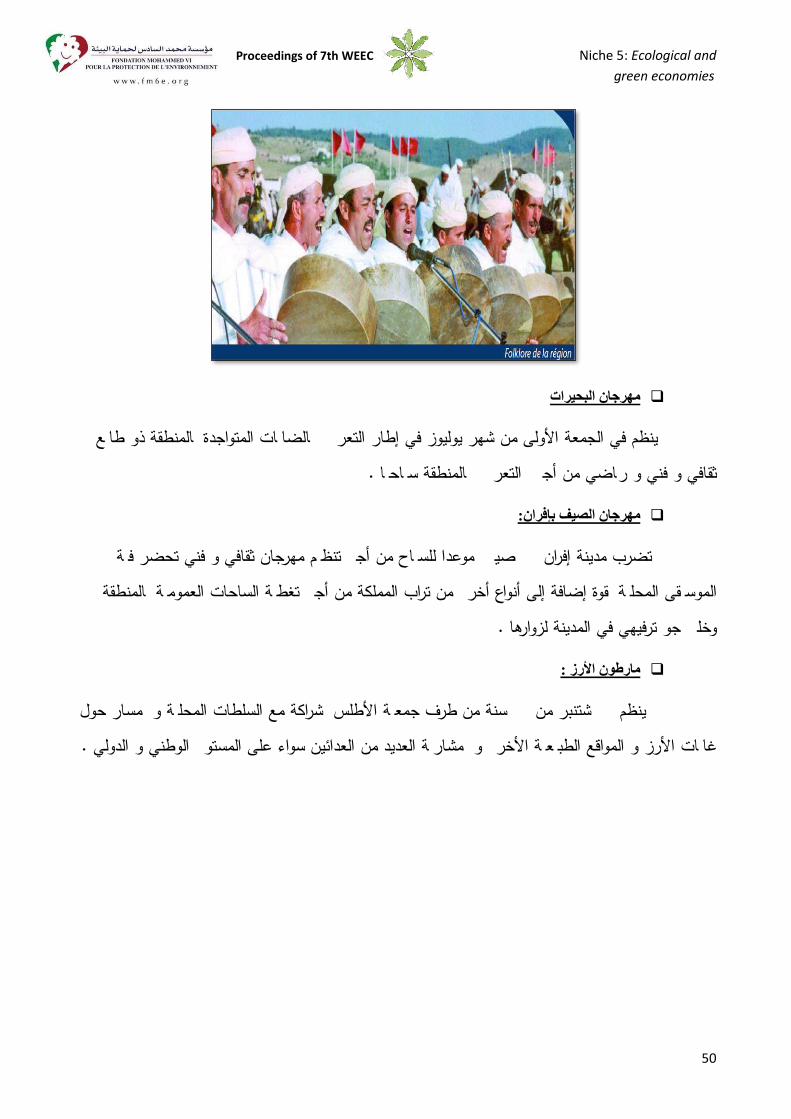
Proceedings of 7th WEEC Niche 5: Ecological and
green economies
50
مهرجان البحيرات
ف بالضايات المتواجدة بالمنطقة ذو طابع ينظم في الجمعة األولى من شهر يوليوز في إطار التعريف بالمنطقة سياحيا . ثقافي و فني و رياضي من أجل التعري
:مهرجان الصيف بإفران
ف موعدا للسياح من أجل تنظيم مهرجان ثقافي و فني تحضر فية تضرب مدينة إفران كل صيالموسيقى المحلية بقوة إضافة إلى أنواع أخرى من تراب المملكة من أجل تغطية الساحات العمومية بالمنطقة
وخلق جو ترفيهي في المدينة لزوارها .
: مارطون األرز
ينظم كل شتنبر من كل سنة من طرف جمعية األطلس بشراكة مع السلطات المحلية و بمسار حول و المواقع الطبيعية األخرى و بمشاركة العديد من العدائين سواء على المستوى الوطني و الدولي .غابات األرز
الحرف التقليدية:
ي لالقليم ,فهي 02عامل مقسمين على 0222تشغل تشغل الحرف التقليدية حيزا مهما في النسيج االقتصادحرفة , من بين أهم الحرف تلك المرتبطة بالخشب و كذا النسيج و الطرز وذلك داخل وحدات صغيرة أو
جمعيات تعنى بالحرف التقليدية.
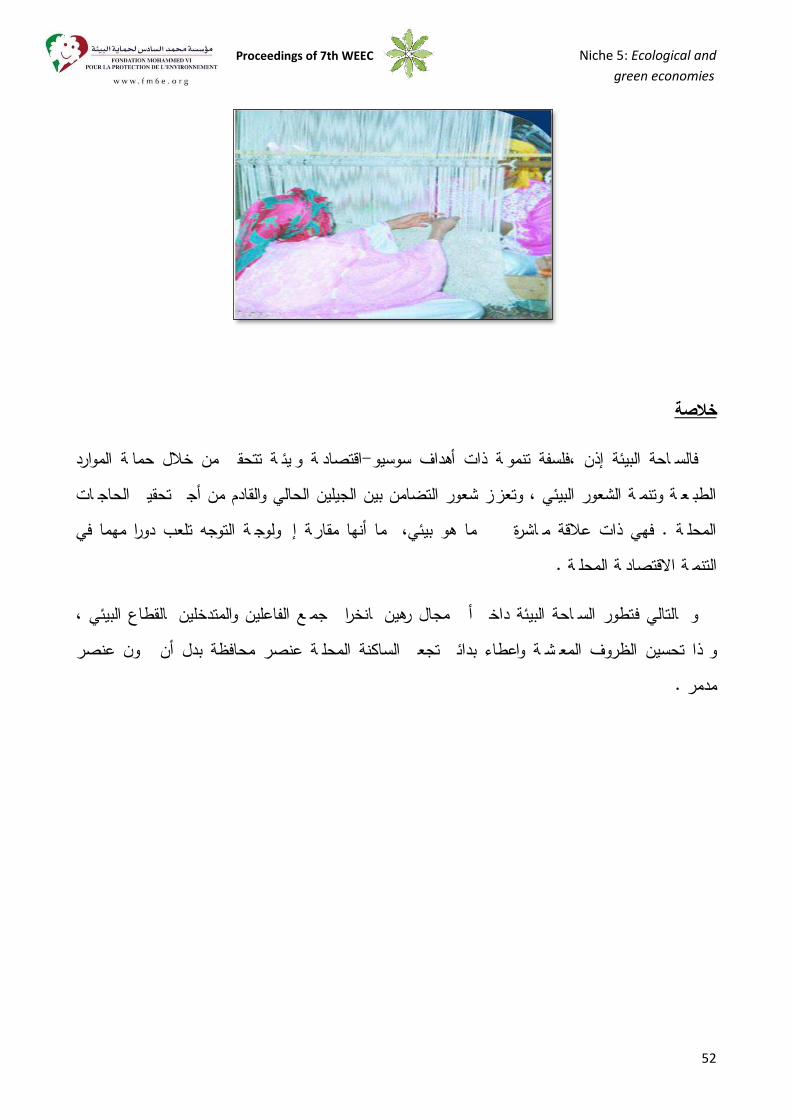
Proceedings of 7th WEEC Niche 5: Ecological and
green economies
52
خالصة
تتحقق من خالل حماية الموارد وبيئية اقتصادية -سوسيو أهداففالسياحة البيئة إذن ،فلسفة تنموية ذات الطبيعية وتنمية الشعور البيئي ، وتعزيز شعور التضامن بين الجيلين الحالي والقادم من أجل تحقيق الحاجيات المحلية . فهي ذات عالقة مباشرة بكل ما هو بيئي، كما أنها مقاربة إيكولوجية التوجه تلعب دورا مهما في
التنمية االقتصادية المحلية .
ي مجال رهين بانخراط جميع الفاعلين والمتدخلين بالقطاع البيئي ، و بالتالي ف تطور السياحة البيئة داخل أوكذا تحسين الظروف المعيشية وا عطاء بدائل تجعل الساكنة المحلية عنصر محافظة بدل أن يكون عنصر
مدمر .
Lessons from Nature
Using insights from nature to inspire a brighter future
Richard Dawson - Field Studies Council, UK
Kamen Chipev - TIME Foundation, Bulgaria
Steve Bunce - Field Studies Council, UK
Abstract
What would it be like if we no longer needed to worry about where the energy we need
comes from? Or ugly waste dumps were a thing of the past, food insecurity did not exist
and communities were resilient to changes in global markets? Rather than imagining the
answers to such questions, Lessons from Nature (LfN) inspires with real steps to make
this a reality.
Nature is the source of inspiration for learning. Learners are connected with nature and
discover that nature can be a mentor that offers insights that can inspire the
building of a brighter future. Discovery learning, activity based learning and Learning
Outside the Classroom can be utilised to foster inspiration and to stimulate a desire for
understanding.
Using insights from nature to inspire and build a brighter future
The way Lessons from Nature (LfN) works is simple, we want young people to be inspired
and excited about their future, the possibilities it holds and the role they will play in it. We
Proceedings of 7th WEEC Niche 5: Ecological and
green economies
54
believe the future can and should be bright for all young people. This does not mean the
future will be the same as today; change is the only constant. Communities will need to
learn how to redesign themselves to combat some serious environmental and social
issues; and business will need to learn how to develop economics in a natural resource
constrained world. LfN provides the tools for a hopeful future.
LfN asks what sort of future young people would like to live in and how this preferred future
can be made reality. It challenges traditional assumptions about how things are made,
economies managed and lives lived. The project is not about individuals feeling guilty or
doing less harm and delaying a point of crisis; instead it is about re-thinking the future. It
attempts to present a more hopeful and realistic way for young people to achieve the sort
of future they want. After all it will be their future.
LfN presents opportunities to learn through first-hand experience helping to inspire
discovery and foster real understanding in relation to insights from nature that can be
applied to the modern world. In undertaking the LfN activities, young people will develop a
wide range of competencies for the jobs of the future. These include creativity, critical
thinking, evaluation and reflection, sharingand entrepreneurship.
How does LfN work?
LfN ensures good choices get made, not to say what those choices are. We all have our
own dreams for the future and of course as we grow they change and develop. How can
we keep those dreams alive? LfN believes we can by learning and applying
the same principles that nature has used for over 4.5 billion years to design human
systems that are abundant, beautiful and resilient. To do this we follow four steps: inspiring
the leaner, helping them discover how nature works, understanding how nature’s
principles can be applied to human systems, and finally applying these new insights to
their own lives.
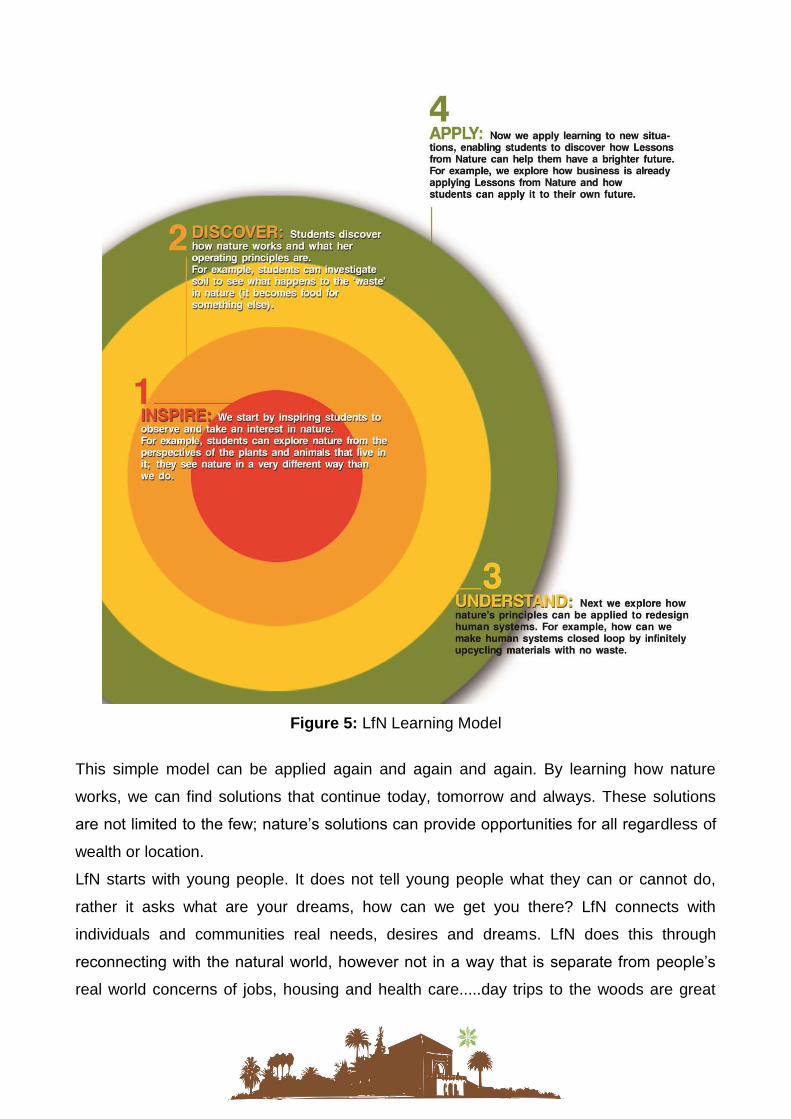
Figure 5: LfN Learning Model
This simple model can be applied again and again and again. By learning how nature
works, we can find solutions that continue today, tomorrow and always. These solutions
are not limited to the few; nature’s solutions can provide opportunities for all regardless of
wealth or location.
LfN starts with young people. It does not tell young people what they can or cannot do,
rather it asks what are your dreams, how can we get you there? LfN connects with
individuals and communities real needs, desires and dreams. LfN does this through
reconnecting with the natural world, however not in a way that is separate from people’s
real world concerns of jobs, housing and health care.....day trips to the woods are great
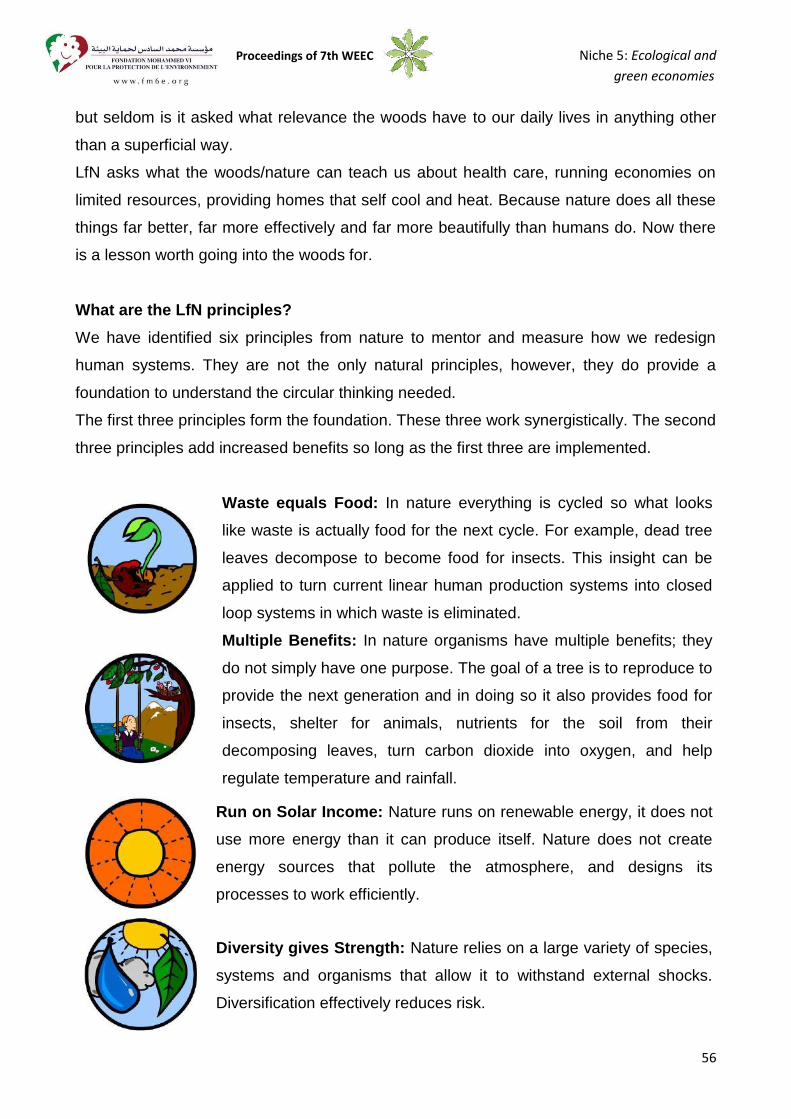
Proceedings of 7th WEEC Niche 5: Ecological and
green economies
56
but seldom is it asked what relevance the woods have to our daily lives in anything other
than a superficial way.
LfN asks what the woods/nature can teach us about health care, running economies on
limited resources, providing homes that self cool and heat. Because nature does all these
things far better, far more effectively and far more beautifully than humans do. Now there
is a lesson worth going into the woods for.
What are the LfN principles?
We have identified six principles from nature to mentor and measure how we redesign
human systems. They are not the only natural principles, however, they do provide a
foundation to understand the circular thinking needed.
The first three principles form the foundation. These three work synergistically. The second
three principles add increased benefits so long as the first three are implemented.
Waste equals Food: In nature everything is cycled so what looks
like waste is actually food for the next cycle. For example, dead tree
leaves decompose to become food for insects. This insight can be
applied to turn current linear human production systems into closed
loop systems in which waste is eliminated.
Multiple Benefits: In nature organisms have multiple benefits; they
do not simply have one purpose. The goal of a tree is to reproduce to
provide the next generation and in doing so it also provides food for
insects, shelter for animals, nutrients for the soil from their
decomposing leaves, turn carbon dioxide into oxygen, and help
regulate temperature and rainfall.
Run on Solar Income: Nature runs on renewable energy, it does not
use more energy than it can produce itself. Nature does not create
energy sources that pollute the atmosphere, and designs its
processes to work efficiently.
Diversity gives Strength: Nature relies on a large variety of species,
systems and organisms that allow it to withstand external shocks.
Diversification effectively reduces risk.
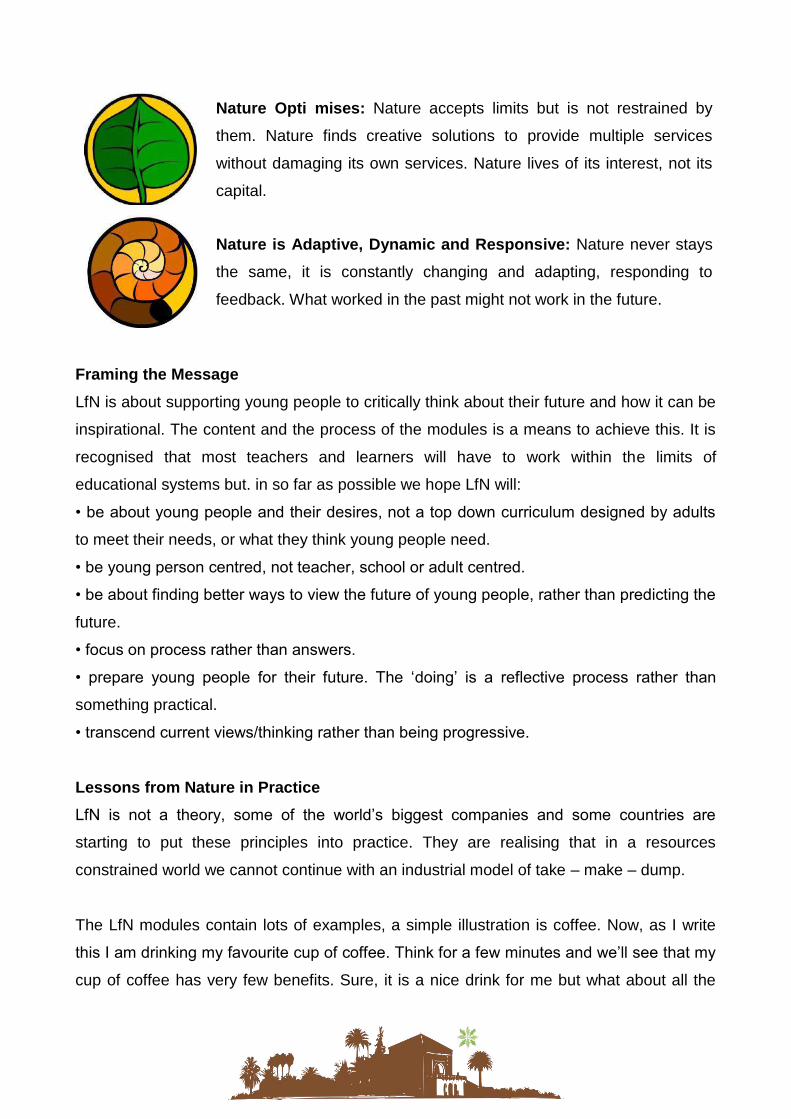
Nature Opti mises: Nature accepts limits but is not restrained by
them. Nature finds creative solutions to provide multiple services
without damaging its own services. Nature lives of its interest, not its
capital.
Nature is Adaptive, Dynamic and Responsive: Nature never stays
the same, it is constantly changing and adapting, responding to
feedback. What worked in the past might not work in the future.
Framing the Message
LfN is about supporting young people to critically think about their future and how it can be
inspirational. The content and the process of the modules is a means to achieve this. It is
recognised that most teachers and learners will have to work within the limits of
educational systems but. in so far as possible we hope LfN will:
• be about young people and their desires, not a top down curriculum designed by adults
to meet their needs, or what they think young people need.
• be young person centred, not teacher, school or adult centred.
• be about finding better ways to view the future of young people, rather than predicting the
future.
• focus on process rather than answers.
• prepare young people for their future. The ‘doing’ is a reflective process rather than
something practical.
• transcend current views/thinking rather than being progressive.
Lessons from Nature in Practice
LfN is not a theory, some of the world’s biggest companies and some countries are
starting to put these principles into practice. They are realising that in a resources
constrained world we cannot continue with an industrial model of take – make – dump.
The LfN modules contain lots of examples, a simple illustration is coffee. Now, as I write
this I am drinking my favourite cup of coffee. Think for a few minutes and we’ll see that my
cup of coffee has very few benefits. Sure, it is a nice drink for me but what about all the
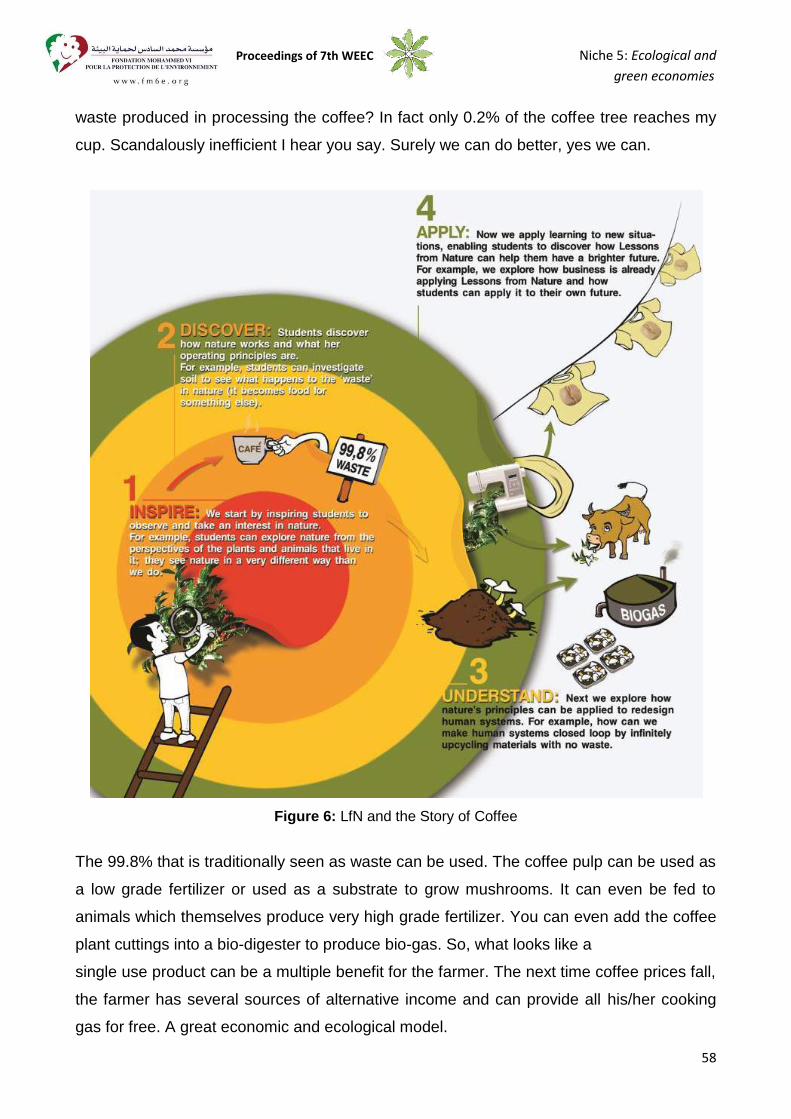
Proceedings of 7th WEEC Niche 5: Ecological and
green economies
58
waste produced in processing the coffee? In fact only 0.2% of the coffee tree reaches my
cup. Scandalously inefficient I hear you say. Surely we can do better, yes we can.
Figure 6: LfN and the Story of Coffee
The 99.8% that is traditionally seen as waste can be used. The coffee pulp can be used as
a low grade fertilizer or used as a substrate to grow mushrooms. It can even be fed to
animals which themselves produce very high grade fertilizer. You can even add the coffee
plant cuttings into a bio-digester to produce bio-gas. So, what looks like a
single use product can be a multiple benefit for the farmer. The next time coffee prices fall,
the farmer has several sources of alternative income and can provide all his/her cooking
gas for free. A great economic and ecological model.

The LfN Modules
The project is aimed at learners aged 12-16. The learning supports a range of subjects
including:
• Science
• Geography
• Design Technology
• Business Studies
The modules aims to inspire young people and provide learning that will equip them with
the skills, knowledge and understanding for jobs in the future. They promote learning that
contrasts significantly with traditional ESD ‘do less harm’ approaches. (a world with fewer
toxins and less useless waste still has problems, and reducing economic activity is unlikely
to bring prosperity).
Discovery learning, activity based learning and Learning Outside the Classroom are
utilised to stimulate a desire for understanding.
A total of 18 learning modules have been developed; three each adapted to education
systems in the UK, Bulgaria, Latvia, Romania, Spain and the Netherlands. Each module
includes activities that deliver the learning model: inspire – discover – understand – apply.
In theory learners can progress through the modules without the need for teacher support.
The principal benefit of this is that learners are not dependent upon the prior knowledge of
teachers. There is no need for teachers to fear that they don’t have enough knowledge of
some of the areas of learning that may be unfamiliar to them.
Having said that good teachers can make a significant difference to the progress that
pupils can make in their progression through learning through the LfN activities. Good
teachers will be able to:
• Ensure that the learning locations are safe and appropriate (school grounds, parks,
woodlands and other places).
• Ensure that the resource materials (clearly identified in the modules) are made ready in
advance of the learning.
• Guide learners to modules that might best fit their needs.
Proceedings of 7th WEEC Niche 5: Ecological and
green economies
60
• Support less able learners.
• Encourage wider and deeper critical and creative thinking in more able learners.
• Apply insights from nature to planning of their own futures and in the planning for the
school.
• Share insights from nature and promote the programme to others.
• Adapt modules to specific needs.
• Develop new modules to add to those already on the website.
• Share good practice.
The most essential role of class teachers in the project is to facilitate learning.
Assessment
Assessment is part of the LfN learning process, not an additional activity that appears at
the end of the modules. Assessment is integrated into the modules because it is important
that learners assess and reflect on their own learning as a critical part of the LfN process.
LfN is not about traditional school knowledge, and as such traditional assessment
approaches are not always valid. LfN is a learning process in which students are aware of
and reflecting on the meaning of their learning (What have I done? What does it mean for
me? etc). Reflection fits into Kolb’s learning cycle on which the modules are based and it
supports and adds value to the activities in each module.
At the end of each section there is a reflection task. Learners are asked to add notes to the
Reflection sheet including how the learning could impact their future.
In addition to reflecting on their own learning and how it has progressed through taking
part in the modules learners will also assess competency and whether the modules have
challenged and influenced their view of their future.
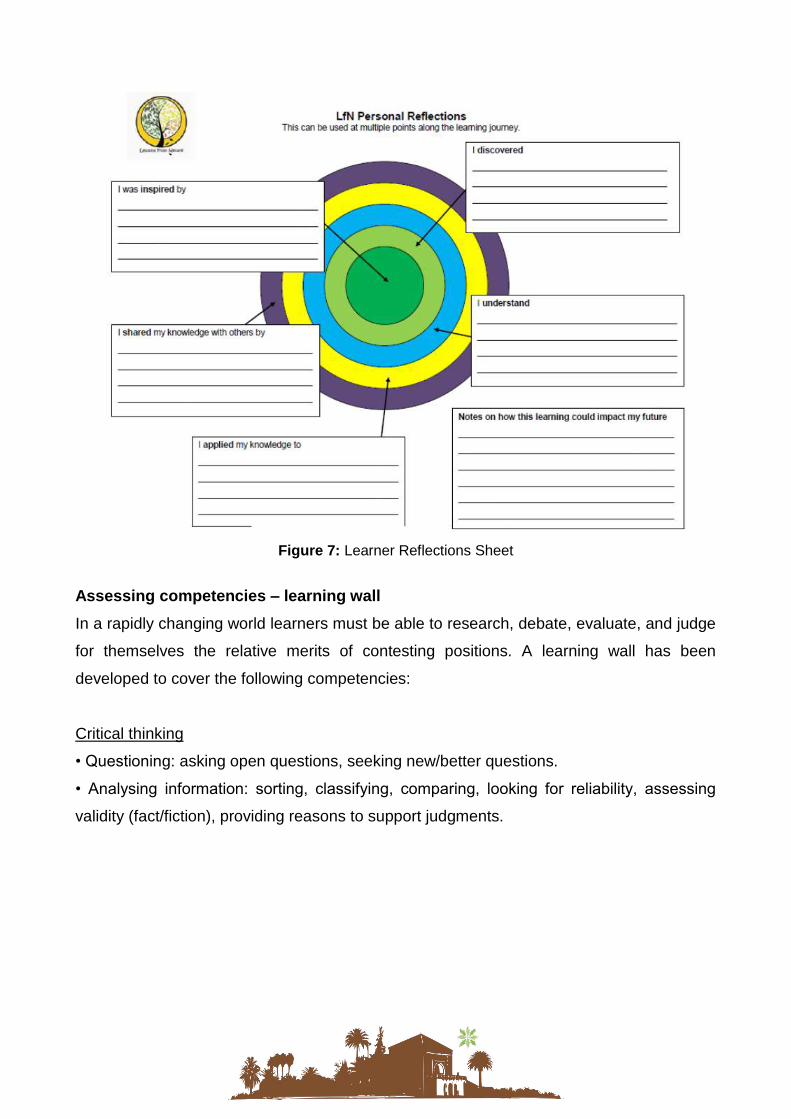
Figure 7: Learner Reflections Sheet
Assessing competencies – learning wall
In a rapidly changing world learners must be able to research, debate, evaluate, and judge
for themselves the relative merits of contesting positions. A learning wall has been
developed to cover the following competencies:
Critical thinking
• Questioning: asking open questions, seeking new/better questions.
• Analysing information: sorting, classifying, comparing, looking for reliability, assessing
validity (fact/fiction), providing reasons to support judgments.
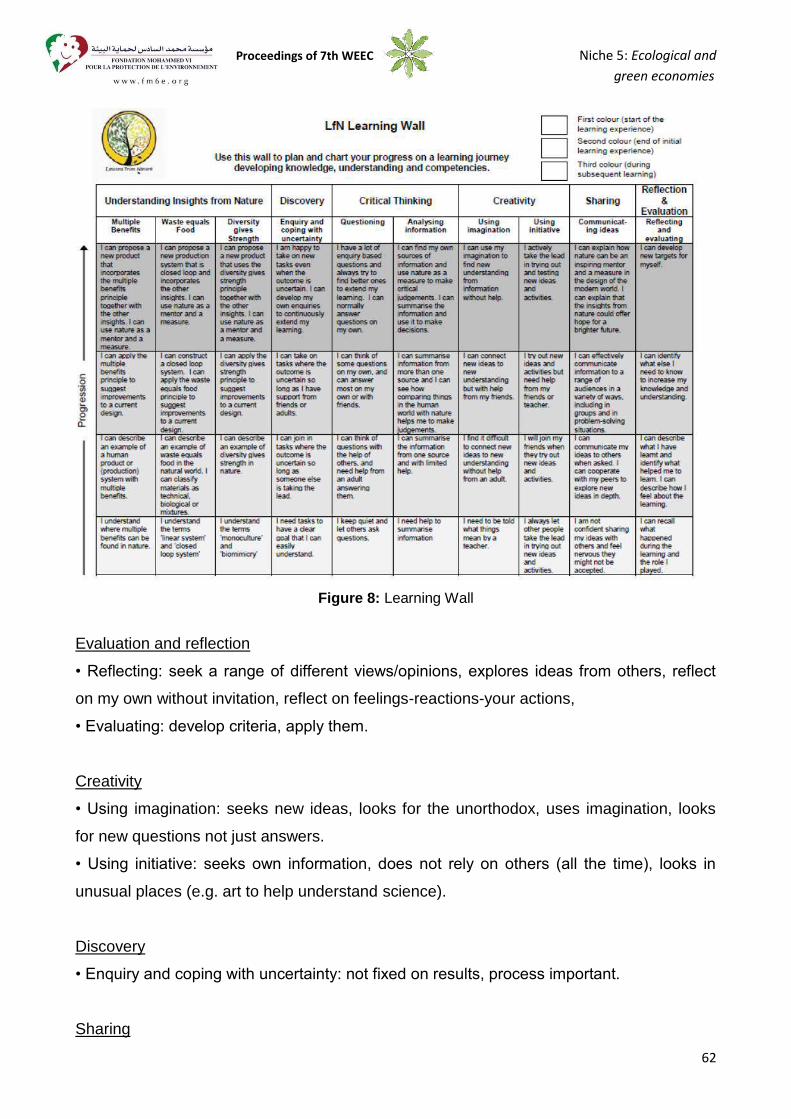
Proceedings of 7th WEEC Niche 5: Ecological and
green economies
62
Figure 8: Learning Wall
Evaluation and reflection
• Reflecting: seek a range of different views/opinions, explores ideas from others, reflect
on my own without invitation, reflect on feelings-reactions-your actions,
• Evaluating: develop criteria, apply them.
Creativity
• Using imagination: seeks new ideas, looks for the unorthodox, uses imagination, looks
for new questions not just answers.
• Using initiative: seeks own information, does not rely on others (all the time), looks in
unusual places (e.g. art to help understand science).
Discovery
• Enquiry and coping with uncertainty: not fixed on results, process important.
Sharing
• Sharing: share ideas with others (self, friends, family, others, blog, presentations etc)
• Communicating ideas: different ways of communication, seeks best way to communicate
a message.
To be able to see progress throughout the learning journey learners should identify where
they are on the learning wall before beginning the activities. Learners should chart their
progress on the learning wall at the end of each section. The learning wall is a form of
ipsative assessment where a learner is assessed against their own previous standards. It
can measure how well a particular task has been undertaken. This type of assessment can
enhance motivation to learn.
Find Out More
Lessons from Nature is an ongoing programme.
Change is the only constant and we have only just begun. We would like to hear from you.
Contact Lessons from Nature:
Richard Dawson
www.lessonsfromnature.org
Proceedings of 7th WEEC Niche 5: Ecological and
green economies
64
Agricultural modernization in Goiás, Brazil, and its environmental
impacts
Rationality and modernizing risk society
Agustina Rosa Echeverria1 - Universidade Federal de Goiás – Brasil
Eloisa Pio de Santana2 - Secretaria de Estado de Ciência e Tecnologia do Estado de
Goiás - Brasil
ABSTRACT
The implementation of the so-called “green revolution” in Brazil has made agricultural
production more and more dependent on technology. It was supported by a network of
rural expansion, elaborated by the State, which primarily benefitted large producers but
also affected small scale family farmers. In general, it led them to assume rational and
reflective thinking, understood as self-confrontation with the effects of the risk society, that
is, modern society confronting the risks of its own creation. This article defends the need to
build a new environmental rationality which would make new productive practices possible
in the countryside.
KEYWORDS: Modernization of agriculture, Reflectivity, Environmental Rationality, Family
Farming. Risk Society.
INTRODUCTION
In the early 1980s, one of the issues under debate was the modernization of agriculture, or
in other words, the effects of the public policies for restructuring the rural sector,
implemented since the mid-1960s.
The modernization of agriculture has had a major impact on small scale family farming,
has caused a high level of social exclusion and, above all, has had a powerful impact on
the environment. This process was partly sustained by a powerful network of rural
expansion, elaborated by the State.
1 Bachelor, Licentiate and Master in Chemistry from the People’s Friendship University of Russia - Moscow. PhD in
Education from the State University of Campinas - UNICAMP - Brazil. Professor of the Institute of Chemistry, the Master Program in Education in Science and Mathematics and the doctoral program in Environmental Sciences at UFG. Coordinator of the Center for Research in the Teaching of Science (NUPEC/UFG). E-mail: [email protected] 2Bachelor of Social Science, Specialist in Human Resources Management and Environmental Educationt, Master in
Sociology and PhD in Environmental Sciences from the Federal University of Goiás. Policy and Thematic Program Manager at the Secretariat of State for Science and Technology. E-mail: [email protected]
The industrialization of Brazilian agriculture, also called technological modernization, has
been the subject of numerous analyzes from different angles (Sorj, 1980; Graziano da
Silva, 1980; Kageyama, 1990; Graziano Neto, 1982; Brum, 1988).
Sorj (1980) analyzes agricultural credit as the most significant instrument of the period,
with the setting up of the National Rural Credit System (NRCS) which laid the foundations
for ensuring that part of the funds raised by banks would be channeled into the agricultural
sector. Credit assistance or loans at favorable interest rates was the decisive factor in the
“modernization” of Brazilian agriculture. The farmer was subject to inspection and received
technical assistance introduced on a large scale in the “technological package” of
modernization.
At first there was credit only for wheat; later on, from 1969 onwards, it also became
available for soybeans, and from 1979 onwards for other crops as well as the rearing of
livestock and poultry. Credit to purchase machinery, tools, equipment, lime, fertilizers,
seeds, defensive pesticides (herbicides, weed-killers, fungicides, etc.), credit for costs, for
building facilities, for the acquisition of matrices, etc. (Brum, 1988, p. 88)
Another factor analyzed by Sorj (1980) was the distribution of rural credit. This was fairly
evenly divided between credit and running costs, marketing and investment. However,
when all producers are considered, these funds primarily benefited medium-sized and
large farmers while small scale family farmers, especially the poorest, were excluded.
When the NRCS was implemented, collateral requirements were the main obstacles faced
by family farmers. A letter of consent from the proprietor was required for partners and
tenants. It was difficult to obtain and at the moment of releasing the funds, the time limits
for withdrawal were not always favorable for family farmers. In addition, there was
excessive bureaucracy involved in the banking transactions.
According to Graziano da Silva (1980), the implementation of agricultural industrialization
was more a political than a technical issue, in which big business aligned itself with
latifundia owners, under the aegis of the State. From that, it can be seen that the
modernization of agriculture was littered with contradictions, which aggravated still further
the already precarious production situation of small scale family farmers principally. In the
end, the agrarian structure was still highly concentrated, but an internal transformation had
taken place at the level of production relations, which allowed agriculture to respond to the
needs of industrialization.
Proceedings of 7th WEEC Niche 5: Ecological and
green economies
66
Right across the capitalist world, the expansion of the internal market for Brazilian
industrialization was brought about by the proletarianization of small farmers by making
them into independent producers. “It seems clear, therefore, that the ‘old style’ agriculture,
understood as an ‘autonomous sector’ will gradually tend to disappear” (Graziano da Silva,
1980, p. 68), and would thus depend on certain policies, or more precisely, on the State as
a promoter of production.
Industrialization was presented as a miraculous formula which by itself was capable of
bringing about development; and the agricultural sector, considered responsible for the
backwardness of these countries, should give up its dominant position in the economy. [...]
The process of modernization was clearly seen to involve ever greater farms, with a
consequent worsening in wealth distribution in the agricultural sector [...] While fertilizers
and pesticides increase the productivity of the land, they also increase the demands for
unskilled labor at harvesting time. Mechanization, to the extent that it mainly affects
activities other than harvesting (for technological reasons), intensifies the seasonal
employment of such workers. Thus, modernization increases the demand and reduces the
period of employment of the non-qualified workforce on a given farm. The most
economical solution for the owner who wants to update is to replace permanent workers
by temporary workers, which leads to an increase in the seasonal employment of rural
workers. (Graziano da Silva, 1982, p. 17, 29-30)
To understand this modernization of Brazilian Agriculture and Stock Breeding, certain
misunderstandings must be cleared up. According to Kageyama (1990), there are three
concepts often treated as synonymous, which in fact are not: Agricultural Modernization,
Industrialization of Agriculture and the formation of Agro-industrial Businesses.
Modernization primarily means a change in the technical basis of agricultural production.
This process took on national dimensions in the post-war era in agriculture with the
introduction of machinery, chemicals, changes in tools and changes in crops or new
varieties. There was a change in the technical basis of production which transformed the
peasants’ manual production into modern, intensive, mechanized agriculture, a new way of
producing. (Kageyama, 1990, p.113)
The modernization of agriculture means moving away from working with existing natural
conditions to the manufacture of these same conditions when they are absent, which
means changes in production. This long process of transforming the technical basis, called
modernization, culminates in the industrialization of agriculture itself. This means
subordinating nature to capital.
The industrialization of agriculture includes the idea that agriculture ends up becoming a
branch of production similar to an industry, like a “factory” which purchases certain goods
and produces raw materials for other branches of production. The peasant produced in
“interaction with nature” as if it were a “natural laboratory”. They worked the land with the
supplies and tools which they had at their disposal, almost always produced on their land.
Industrialized agriculture, by contrast, is connected to other branches of production; in
order to produce it depends on the supplies it receives from certain industries, and no
longer just produces consumer goods, but basically intermediate goods or raw materials
for other transformation industries. The industrialization of agriculture is qualitatively
different, which makes the process of modernization irreversible. From the moment
agriculture becomes industrialized, its technical basis can no longer move backwards; if it
regresses, then agricultural production also regresses. (Kageyama, 1990, pp.113-114)
Finally, after 1975, the so-called agroindustrial businesses came on the scene. Various
complexes were formed while agriculture continued to specialize. Thus, modern
agriculture is that agricultural phase characterized by the intensive use of modern
machinery and supplies, and greater rationalization and incorporation of technical
innovations, that is, the use of methods and techniques for the preparation and cultivation
of the large tracts of land and more sophisticated harvesting processes.
While modernization involves technical and intra-sectorial integration and the
commercialization of agriculture, it also fosters the replacement of internal elements of the
rural complex with purchases from outside the sector (machinery and supplies), and
thereby paves the way for the setting up of industries of capital goods and supplies for
agriculture.
(Kageyama. 1990, p. 115)
In agriculture this can be seen from the increase in the intermediate consumption of
purchases of industrial equipment and supplies for the production of goods.
From the mid-1960s, modernization reached a more advanced level, that of the
industrialization of agriculture. It must be stressed that the industrialization of agriculture is
Proceedings of 7th WEEC Niche 5: Ecological and
green economies
68
not limited to the use of industrial goods for agricultural production, although this is one of
its components.
The industrialization of the countryside is one specific point in the modernization process:
the “re-unification of agriculture-industry” at a level higher than that of the simple
consumption of industrial goods. It is that moment in modernization when industry takes
command [...] agriculture thus becomes a branch of production which buys goods and
sells raw materials to other industrial branches [...]. Land is no longer a “natural laboratory”
but has become a commodity. The equipment used is no longer merely a tool, but part of
the capital for appreciation. (Kageyama, 1990, p.122)
For Graziano Neto (1982), the modernization of agriculture can be further defined as a
process exerting powerful impacts on the social relations of production, which, in this case,
implies a greater integration of producer and production in the market and in the rationality
of profit.
According to him:
[...] As this technical progress takes place in agriculture, there is also a change in the
organization of production, with regard to its social (and not technical) relations. The
composition and use of labor are changed, there is an increased use of the boia fria or
floating workers; workers are more and more paid as wage earners. Small scale
producers, be they owners, partners or squatters, are expropriated. In certain regions this
leads to production being organized in an entrepreneurial mold.
(Graziano Neto, 1982, p.26)
According to Brum (1988), the capitalist transformation of agriculture is another feature of
modernization. As the process takes hold and progresses, agriculture tends to become
specialized, with a trend towards monoculture. This tendency, on the one hand, creates
difficulties and strangles the small scale farm and independent producer, while on the
other it makes both large and medium-sized rural enterprises feasible and stimulates their
creation. The relations of capitalist production are established: owners of the means of
production (land, machinery etc.) assume the role of employers and the direct workers are
deprived of their means, and become wage earners.
The implementation of the modernization of agriculture, also called “the green revolution”
brought about a growing rationalization of production in the countryside. In the late 1950s
and early 1960s agriculture became a central topic of discussion. According to the
Economic Commission for Latin America (ECLAC), agro-exports were the problem and if
there was to be any economic growth, there had to be capital accumulation, that is, that
the situation of being exporters of raw materials had to change, and a leap towards
industrialization had to be taken.
In the 1960s, industrialization came with the participation of foreign capital and was
introduced with great intensity by means of plans for action. Industry gradually took control
of the process of capital accumulation. During this phase, the country gradually
relinquished its predominantly agricultural character and industrialization was brought
about by substituting imports. The chemical fertilizer and pesticide industry was
established through the setting up of the petrochemical industry while that of tractors and
equipment was set up through the establishment of the steel industry. In this context,
agriculture had to be restructured in order to increase productivity; its goal now was to
produce, with ever greater returns.
The agricultural model adopted in the 1960s involved using capital and foreign technology:
specialized groups provided supplies, machinery, seeds, pesticides and fertilizers.
On analyzing the effects of the public policies for the structuring of agriculture, since the
mid-1960s, it should be noted that the State appears as the agent needed to induce
technological change in the Brazilian agricultural sector, through establishing “agricultural
modernizing” policies. So from the late 1960s onwards, policies gradually created
conditions for agriculture to reach other technological and productive levels.
Thus, in 1965, activities for institutional support included the setting up of a rural credit
system in the following categories: land, investment, costs and marketing; then came the
institutionalization of agricultural research (with the creation of EMBRAPA3), and the
centralization of technical assistance and rural outreach (EMBRATER4). In addition, the
State fostered the production of goods from outside the sector, by expanding the
production of capital goods, such as machinery (harvesters and tractors, mostly) and
equipment, as well as fertilizers, correctives, and defensives or pesticides. It also sought to
enhance marketing channels, through minimum price policies, the creation of agricultural
insurance and encouraged agricultural cooperatives. In the end, these different policies
contributed to the expansion and centralization of agribusinesses. (Tavares, 1991, pp.22-
23)
3 EMBRAPA (Brazilian Research Company for Agriculture and Stock Breeding).
4 EMBRATER (Brazilian Company for Technical Assistance and Rural Outreach)
Proceedings of 7th WEEC Niche 5: Ecological and
green economies
70
The major technical, economic and social transformations in agriculture were not the result
of “free” market forces. On the contrary, the State was present at all stages of the process,
either creating conditions to bring these transformations about (through funding and
technological policies), or coordinating the different elements of a defined project for
modernizing Brazilian agriculture.
In historical terms, State intervention to stimulate the modernization of Brazilian agriculture
could be seen as a new step in a process already unfolding, since the 1930s, and which
was one of the fundamental problems of Brazilian industrialization: the adaptation of
agriculture to meet the needs of capital accumulation led by the urban industrial sector.
Policies were geared towards the whole agricultural sector and impacted differently on the
export and import sectors, which affected the various types of products, producers and
regions in varying degrees.
Although State action involved several public and private institutions, agriculture-related
funding and research agencies, special programs for development at regional and national
levels, plans connected to particular agricultural products and social questions, it was a
unifying action, if not in terms of its explicit objectives, at least in relation to content and
means. It always involved the modernization of agriculture and the integration of
agriculture with the dynamics of capitalist expansion, which is the same as integrating
agriculture and industry.
This process exerted powerful impacts on small scale farmers. It brought about high levels
of social exclusion and, above all, led to major impacts for the environment, causing
environmental, economic and social fragility. This fragility was characterized by a loss of
biodiversity and, in turn, by genetic erosion, in other words, traditional seed varieties were
replaced by modern scientifically created varieties in the pursuit of productivity and
profitability. (Balsan, 2006)
The choice of a particular style of rural development and adoption of a corresponding
model of agricultural modernization, brought undesirable and often uncontrollable impacts
in its trail, either because of the way it was implemented or because of the nature of the
technologies involved, especially in the use of goods and types of soil management
adopted. (Caporal, 2004)
There were various reactions from the environment, because the inappropriate use of the
soil for crops, disrespect for its limitations and agricultural potential accelerated the
degradation of the productive capacity of the soil and hence of the environment.
The rapid and complex changes in agricultural production, and the dominant interests of
the development style adopted had social and environmental implications and risks for
human health which threatened the viability of towns and cities and consequently the
future of society itself. Therefore,
pesticides emerge from this analysis as one of the main present sources of risk, primarily
for food security, and this in turn, includes other types of technological risks, such as those
involving chemical additives or genetically modified components. We are increasingly
exposed to combinations of chemicals in our food, while at the same time, the farmers
themselves are using various chemical inputs for their crops. The burning issue of the
contamination of both food and water is being debated with regard to the maximum levels
of pesticide residues the human body can tolerate. (Guivant, 2000 p. 10)
In summary, it could be said that the negative impacts of this style of agriculture result in
the social exclusion of many farmers, reduced levels of food security, a reduction in the
biodiversity of ecosystems, deforestation, soil erosion, the indiscriminate use of pesticides
and the contamination of foodstuffs with the ensuing damage to the environment and
human health.
MODERNIZING RATIONALITY AND THE RISK SOCIETY
The structuring principle of the modernization of agriculture was capitalist and
instrumental, dominated by the rationality of ends and means, or “[...] technological
rationality and economic calculations which are the instrumental of modern civilization
imbued with the principles of immediate profitability, efficiency and productivity.” (Leff,
2006-b, p. 263)
Thus,
the theoretical instrumental rationality behind modernity and its expression through its
values, codes of conduct, epistemological principles and productive logic have led to
the destruction of the basis of natural resources and the conditions of sustainability of
civilization. This has triggered ecological imbalances on a global scale, the destruction
of biotic and cultural diversity, the loss of cultural practices and values, the
impoverishment of a growing population and degradation of quality of life for the
majority. This crisis of economic growth leads to the founding of an alternative type of
development based on other ethical values, other principles of production and other
Proceedings of 7th WEEC Niche 5: Ecological and
green economies
72
societal meanings, without which human life will not be sustained. (Leff, 2006-b, p.84-
85)
The process of modernizing rationalization leads us back to Weber (1989) who built four
pure types of social action: instrumentally rational action; value-rational action; affectual
action and traditional action. In the context of our analysis, it behooves us to delve a little
deeper into the first type mentioned.
For Weber (1989), instrumentally rational action refers to “expectations in terms of the
behavior of objects in the outside world and of other people, and the use of these
expectations as ‘conditions’ or ‘means’ to achieve one’s own ends, seen and rationally
pursued as success”.
To reach a predetermined goal, the necessary or appropriate means are seized upon,
after being evaluated and matched as clearly as possible. Once the objective has been
established, the most appropriate means are used, that is, the means are suited to the
ends.
Still according to Weber,
Those whose actions are dictated by ends, means and secondary consequences act in a
rational manner in terms of ends. They rationally consider the means in relation to
secondary consequences as well as the different ends possible, in other words, those who
act in neither an affectual nor traditional way. The decision between ends and competing
incompatible consequences, in turn, can be rationally led in terms of values, in such a
case, action is only rational in terms of ends in what has to do with means. (Weber, 1989,
p.16)
In the modernization of agriculture, the means necessary to reach the ends were used.
This led to social, environmental, economic and cultural risks. It should be emphasized
that this rationality, as we have seen, affected the bases of sustainability, particularly those
of the environment.
The social, environmental, economic and cultural risks involved in this stage of
modernization were not the result of a conscious choice. They are really the undesirable
consequences of “autonomous modernization processes, blind and deaf to their own
effects and threats". (Beck, 1997, pp.16)
The concept of risk assumes a strategic role in understanding the characteristics,
limitations and transformations of the project of modernity. The society which produces
risks is increasingly reflexive, which is the same as saying that it becomes a theme and
problem for itself. (Beck, 1997)
For Beck (1997, p.16), “reflexive modernization” means self-confrontation with the effects
of the risk society which cannot be treated or assimilated by the system of industrial
society. This concept does not mean reflection, but self-confrontation.
In this context, reflexivity must not be confused with reflection. For this author,
“Reflection” is individualistic, conscious and intentional, a return of consciousness to itself,
to examine its own content. “Reflexivity” is like a “reflex”, it is neither individualistic, nor
conscious nor intentional. It is the way the referral principle of reflexive modernity clashes
with the principle of simple modernity. Reflexive modernity largely deals with the side
effects, the dangers or evils which arise out of the production of the goods of simple
modernity. (...) Reflexivity can also include reflection, and can be individual, collective or
institutional. (1997, pp.16-17)
In modernity, reflexivity is a defining characteristic of all human action through principles,
values, ideals, etc.. In traditional cultures, the past is revered and symbols are appreciated
because they hold and perpetuate the experience of generations. Tradition is a way of
integrating the monitoring of action to the time-space organization of the community. But
tradition is not entirely static, because it has to be reinvented with each new generation to
the extent that it assumes its cultural heritage from its forebears. (Giddens, 1991)
With the advent of modernity, reflexivity takes on a different character. Thus,
The reflexivity of modern social life consists of the fact that social practices are constantly examined and
reformulated in the light of renewed information about these same practices, thereby constitutively altering
their character. (Giddens, 1991, p.45)
All forms of social life in modernity are partially constituted by scientific knowledge.
To a large extent we belong to a world which is entirely constituted through reflexively
applied knowledge, but where, at the same time, we can never be sure that elements of
this knowledge will not be revised. All sciences participate in this reflexive relationship,
although sociology holds a very central place. According to Giddens (1990, p. 49),
“modernity itself is deeply and intrinsically sociological”.
Proceedings of 7th WEEC Niche 5: Ecological and
green economies
74
The institutions of industrial society become the producers and legitimizers of threats
which they cannot control, that is, certain aspects of industrial society become socially and
politically problematic. Such consequences are beyond control, so this requires a thorough
reformulation of the role of science and technology. (Beck, 1997)
The concept of risk society brings about transformations in three areas of reference (Beck,
1997, p.17):
1) in the relations of modern industrial society with natural and cultural resources, values
which are squandered in the emergence of widely established modernization;
2) in the relations of society with the dangers and problems it produces, which go beyond the
social bases of security and undermine the conventional social order (business, law and
science);
3) in the sources of meaning, such as class consciousness or belief in progress, which face
disintegration disillusionment, and produce contradictory impacts at global and individual
levels; they make the individual become an individual, or more exactly, as Beck (1997)
sees it, merely an individual with rights (and obligations). The adversities of modern life
which were dealt with in a family group, with recourse to class or social group, have to be
increasingly seen, interpreted and dealt with by the person themselves. One would hope
that, because of the complexity of modern society, people will be able to make the
necessary decisions on a well-grounded and responsible basis, that is, considering the
consequences which are possible. Inequalities and class consciousness have lost their
central position in society.
In a risk society, recognition of the unpredictability of threats brought about by technical
and industrial development requires self-reflection in relation to the bases of social
cohesion and the examination of the conventions and prevailing fundamentals of
“rationality”. In the self-concept of the risk society, society becomes reflexive (in the
strictest sense of the word). (Beck, 1997, p.19)
Two phases can be distinguished in the risk society: first, the stage in which the effects
and self-threats are systematically produced, but are not public issues or the center of
political conflict. Second, a completely different situation arises when the dangers of
industrial society begin to dominate public debates and conflicts, both political and private.
(Ferreira, 2006) However, the risks are rooted precisely in the triumph of the instrumentally
rational order, founded on economic and instrumental rational principles which shaped the
different spheres of the social body: technological standards, production practices,
bureaucratic organization and ideological apparatus of the State.
ENVIRONMENTAL RATIONALITY
This modernizing technical rationality needs to be rethought. It has had so many social
and environmental impacts and generated a society of risks. This rethinking in the search
for a solution to environmental questions would be a new rationality and this is the case of
environmental rationality proposed by Leff (2001).
The civilizing process of modernity was founded on principles of economic and
instrumental rationality which shaped the various spheres of the social body: technological
standards, production practices, bureaucratic organization and the ideological apparatus of
the State. The ecological problematic questions the environmental costs arising out of a
productive rationality based on economic calculations and the effectiveness of control and
prediction systems, on the standardization of social behavior and the efficiency of its
technological means. The environmental issue thus establishes the need for democratic
reforms in the State, the inclusion of ecological norms in the economic process and create
new techniques to control the contaminating effects and put an end to the socio-
environmental externalities generated by the logic of capital.
(Leff, 2001, p.133)
The environmental question is an eminently social problem generated by a set of
economic, political, legal, social and cultural processes. The building of an environmental
rationality and an alternative style of development involves activating a set of social
processes: incorporation of the values of the environment in individual ethics, human rights
and the norms which underlie and sanction the behavior of economic and social actors;
institutional changes which allow a transversal administration of development; the
interdisciplinary integration of knowledge and professional formation and the start of a
dialogue between science and non-scientific knowledge.
This is a process which involves societal transformations and academic research. It affects
the relationships between institutions, organizations, practices and social movements
which transverse the conflictual field of the environment, affecting forms of perception,
access to natural resources, quality of life and people’s styles of development.
Proceedings of 7th WEEC Niche 5: Ecological and
green economies
76
The principles of rationality on which modern civilization is founded have brought about a
global process of socio-environmental degradation which destroys the bases of
sustainability of the economic process, undermining the principles of social justice and
denying the values of diversity.
(Leff, 2006, p.248)
The environmental question sets new ethical principles, as it opens up new perspectives
for development, transforms production and knowledge systems, that is, it reorders the
behavior of society along an alternative rationality (Leff, 2006-b).
What is the meaning of this alternative rationality, what rationality would underlie the
building of sustainability? It is a rationality which implies different ways of thinking,
imagining, feeling, signifying and appreciating things in the world. But, what is the
difference between environmental and capitalist rationality?
The difference between environmental and capitalist rationality is expressed in the
confrontation of social interests rooted in structures, institutions, paradigms of knowledge,
ways of understanding the world and processes of legitimation, which different agents,
classes and social groups face. (Leff, 2006-b, p.249-250)
Environmental rationality must be built and concretized through the relationship between
theory and praxis, which arises in the practical field of a general social problem, guiding
knowledge in the strategic field of power and political action. It thus incorporates a set of
values and criteria which cannot be evaluated in terms of the model of economic
rationality, nor reduced to a market measure.
Environmental rationality, according to Leff (2006-b) is built through the intertwining of four
levels of rationality:
1. A material or substantive environmental rationality which establishes the value system
which regulates social behavior and guides action for the building of a social rationality
grounded in the theoretical (environmental knowledge), material (ecological rationality) and
ethical (axiological rationality) principles of sustainability. The environmental issue is seen
as a social problem of development, which creates the need to regulate the processes of
production and consumption which degrade the environment and quality of life, as they are
subject to economic rationality and the logic of the market. This environmental crisis
generates new values and material forces for the building of a new social order which will
be shaped as principles of the discursive formations of environmentalism and the
foundations of an environmental rationality.
2. A theoretical environmental rationality, which constructs the concepts which connect the
values of substantive rationality with the material processes which sustain it. The theory
makes a conception of social organization intelligible as a whole and thus guides the
practical action for its construction. Theoretical environmental rationality appears as a
conceptual production oriented towards the building of a social and productive rationality,
founded on new values and potential which systematize, give coherence to the value
principles of the ideological formations of environmental discourse and conceptually
organize the different natural and social processes which constitute the material support of
environmental rationality.
3. A technical or instrumental rationality which produces the functional and operational links
between the social goals and material bases of sustainable development through actions
consistent with the principles of material and substantive rationality. It thereby creates a
system of effective means which make environmental management efficient and include ta
technological system suitable for transition to an environmental rationality. Technical or
instrumental rationality establishes the means which make environmental management
effective. It includes clean technologies, legal instruments and the institutional
arrangements of environmental policies, as well as the organizational forces of the
environmental movement from which come the social forces and power strategies to
transform the dominant economic rationality.
4. A cultural rationality, understood as a system of meanings which shapes the differentiated
identities of various cultural formations and gives coherence and integrity to their symbolic,
social and productive practices. Cultural environmental rationality establishes a link
between the principle of cultural diversity and its implementation in specific cultural
organizations, which leads to a dialogue of knowledge between the knowledge embodied
in cultural identities and that knowledge which, based on ethics, techniques and law,
strengthens local identities and capacities. The process of environmental rationalization
requires the implementation of a process of deconstruction of the dominant culture and
hegemony in order to incorporate the values of an ecological and environmental culture,
Proceedings of 7th WEEC Niche 5: Ecological and
green economies
78
while at the same time, opening out to the values of other cultures and a policy of
interculturalism which is not without contradictions and antagonisms.
A new environmental rationality needs to be built to guide public policies, based on criteria
for decision-making by social agents who will consider and legitimize the actions and
behavior of different actors and social groups in the effort to reach definable ends and
objectives of environmental sustainability.
Rationality is built by integrating the spheres of theoretical, substantive, material,
instrumental and cultural rationality. This implies that this rationality is not simply sustained
by principles of a conservationist ethic, but that such values be converted into productive
principles which give coherence to a new theory of production, which requires
mechanisms to give it efficacy, by supporting and guiding the advances and applications of
science and technology. (Leff, 2006-b, p.264)
The building of a new environmental rationality implies a rationalization process which
legitimizes the criteria for decision-making and which underlie a set of actions directed
towards the goals of sustainability. This process is characterized by the opposition of the
interests and perspectives of economic and environmental rationality, its domination
strategies and negotiating tactics. The building of a new environmental rationality aims to
transform ideological formations, institutional practices, governmental functions, legal
norms, cultural values, technological standards and social behavior rooted in a field of
forces in which in the interests of classes, groups and individuals manifest themselves.
These manifestations hinder or mobilize historical changes which imply a set of political
and social processes expressing the confrontation of two opposing “logics”. (Leff, 2006-b).
The building of an environmental rationality implies the need to deconstruct the concepts
and methods of various sciences and fields of knowledge, as well as the value systems
and beliefs which underpin and promote economic and instrumental rationality on which
rests a sustainable productive social order. (Leff, 2006-b, p.282)
CONCLUSION
The foregoing is an attempt to demonstrate the risks and consequences caused by the
rationality underlying the modernization of agriculture, in which the environmental impacts
were highlighted. We saw that it is a complex process, characterized by a confrontation of
society with the risks created by itself. The concept of risk assumes a strategic role in
giving direction to collective and individual lifestyles.
The building of an environmental rationality involves a change in concepts, a change in
culture, while making a transition to styles of sustainable agriculture, reducing impacts on
the environment and on health and preserving natural resources, a key aspect in
improving the quality of life of present and future generations.
According to Sachs (2002), we need a holistic and interdisciplinary approach, in which
natural and social scientists work together in order to find intelligent ways of using and
exploiting nature's resources, while respecting its diversity. The conservation and rational
use of nature can and must go together. Productive use does not necessarily need to
damage the environment or destroy diversity, if we are aware that all our economic
activities are solidly rooted in the natural environment.
Sachs (2002) shows us that we need to come to an endogenous development, while
simultaneously heeding the three pillars of sustainable development: growth to meet the
criteria of social relevance, ecological prudence and economic viability. Growth patterns
must be examined and evaluated from economic, social and ecological points of view.
Growth which only affects the economic sphere, at the expense of the social and
ecological, is uncontrolled growth. When it only affects the economic and social spheres to
the detriment of the ecological, it is simply benign social growth. When it affects the
economic and ecological spheres and does not affect the social sphere it is
environmentally sustainable. True development, according to Sachs (2002), is only
possible when it has impacts in the economic, social and ecological spheres.
We need to go beyond economic growth, not just giving priority to an increase in growth,
and also go beyond the market, not prioritizing profit and resource allocation. We must
also recognize that sustainable development is a global challenge, which goes beyond the
ecological economy, that is, what is needed is a viable combination of economics and
ecology, the natural sciences describing what is needed for a sustainable world, and the
social sciences organizing the strategies for transition towards this path.
The adoption of the polysemic and complex concept of “sustainable development” begins
to be understood here not as a mere effort to increase the production of goods and
services and raise the living standards of the local society, but as the building of a just
social architecture.
Proceedings of 7th WEEC Niche 5: Ecological and
green economies
80
REFERENCES
Amâncio, C. (2010) O Porquê da educação ambiental. Retrieved from
http://www.zoonews.com.br/notícias2/notícia.php?idnotícia=64523.
Aquino, S.L. de; Pedlowski, M.A.; Canela, M.C.; Silva, I.L.A. da. (23-26 May, 2006).
Analisando os Impactos Sócioambientais resultantes do uso de agrotóxicos num
assentamento de Reforma Agrária: Brasília-DF: III Encontro da ANPPAS.
Brandenburg, A. (2007). Ciências Sociais e Ambiente Rural: principais temas e
perspectivas analíticas. Retrieved from http://www.scielo.br/polf/asoc/v.8 n1/a04.08n1.pdh.
Beck, U. (1997). A Reinvenção da Política. In: Giddens, A.; Beck, U.; Lash, S.
Modernização Reflexiva: Política, Tradição, Estética na ordem social moderna. São Paulo:
UNESP, pp.11-72.
Brum, A.J. (1988). Modernização da Agricultura: trigo e soja. Petrópolis: Vozes.
Ferreira, L. da C. (2006). Idéias para uma Sociologia da questão Ambiental no Brasil. São
Paulo: Ed. Anna Blume,
Fonseca, M.T.L. (1985). Extensão Rural no Brasil, um projeto educativo para o capital.
São Paulo: Loyola.
Freire, P. (1992). Extensão ou Comunicação. Rio de Janeiro: Paz e Terra.
Giddens, A.; Beck, U.; Lash, S. (1997). Modernização Reflexiva: Política, Tradição,
Estética na ordem social moderna. São Paulo: UNESP.
Giddens, A. (2003). A Constituição da Sociedade. São Paulo: Martins Fontes.
Giddens, A. (1991). As Consequências da Modernidade. São Paulo: Ed. UNESP.
Graziano da Silva, J. (1982). A Modernização Dolorosa. Rio de Janeiro: Zahar editores.
Graziano Neto, F. (1985). Questão Agrária e Ecologia: crítica da moderna agricultura. São
Paulo: Brasiliense.
Guivant, J.S. (2001). A Teoria da sociedade de risco de Ulrich Beck: entre o diagnóstico e
a profecia. Revista Estudos Sociedade e Agricultura. Nº16, abril pp 95-112.
Kageyama, Â. (eds.) (1990). O Novo padrão agrícola brasileiro: Do complexo rural aos
complexos agroindustriais. In: Delgado, G.C., Gasques, J.G., Vila Verde, C.M. Agricultura
e Políticas públicas. Brasília: IPEA, cap.11, pp. 113-223.
Leff, E. (2001). Saber Ambiental. Petrópolis: Editora Vozes.
Leff, E. (2006 a).Epistemologia Ambiental.São Paulo: Cortez Editora.
Leff, E. (2006 b). Racionalidade Ambiental. Rio de Janeiro: Civilização Brasileira.
Sachs, I. (2002). Caminhos para o desenvolvimento Sustentável Stroh, P.Y. (eds.). Rio de
Janeiro: Garamond.
Sachs, I. (2003). Inclusão Social pelo Trabalho: Desenvolvimento Humano, trabalho
decente e o futuro dos empreendedores de pequeno porte. Rio de Janeiro: Garamond.
Sorj, B. (1980). Estado e Classes Sociais na agricultura Brasileira. Rio de Janeiro: Zahar
editores.
Proceedings of 7th WEEC Niche 5: Ecological and
green economies
82
Caractérisation du fruit du cactus (Opuntia spp) au Maroc
El mzouri Elhoussein – INRA, Centre Régional de la Recherche Agronomique Settat
Youssef Elkharrassi - INRA, Université Hassan 1er Settat
Boubker Nasser, Université Hassan 1er Settat
Résumé
La commercialisation et la valorisation du fruit du cactus intéressent de plus en plus les
investisseurs nationaux et internationaux. Les caractéristiques du fruit peuvent affecter le
mode et le type de sa valorisation. L’objectif de ce travail, est la caractérisatio biométrique
et phénotypique du fruit des différents cactus Marocain. Trente deux écotypes ont été
collectés et implantés dans la station expérimentale de l'INRA de Jemaat Riah-Settat-
Maroc. Ce cactétum comporte 11 lignes dont chacune contiennent 3 écotypes classés
selon leur origine. Les observations collectées en mois de juin et juillet 2012, concernent
:le nombre de fruits par raquette, la taille et la couleur du fruit, le pourcentage de la chaire.
Les résultats montrent que les 32 écotypes présentent quatre couleurs de fruits à savoir la
présence de quatre type de couleur, on a constaté que la couleur jaune orangé est la plus
représenté avec 28 écotype, et
12 écotypes, avec une taille de fruit élevée allant de 85 à 103 g, et une différence
moyenne au niveau du pourcentage de la chaire quivarie dans un intervalle de 27,13% à
57,69%. En conclusion, les différents paramètres étudiés sur le fruit de cactus indiquent la
diversité du germoplasme national pour la qualité et la taille du fruit.
Introduction
Le cactus (Opuntia) est un arbuste originaire des régions arides et semi-aride du Mexique
d’où il a été introduit en Afrique du Nord vers le 16ème siècle, grâce à sa conduite simple
et moins exigeante, à sa rentabilité économique et aux larges possibilités qu’il offre dans
le domaine agro- industriel. Il a été planté dans de nombreux périmètres dans le cadre des
projets de développement agricole et dans des programmes de lutte contre la sécheresse
soit dans des terrains collectifs ou privés. La culture du cactus Opuntia est pratiquée
actuellement pour plusieurs raisons: comme plante ornementale, pour la production de
fourrage, des fruits exotiques et surtout pour les utilisations agro- industrielles et
pharmaceutiques.Cette plante constitue une source naturelle et renouvelable. Elle
présente l’avantage de pousser dans les régions où les autres cultures traditionnelles
ont peu de chance de réussir. Le potentiel de cette plante est bien réel, à condition qu’elle
soit introduite dans un environnement convenable. Le Maroc quia connu plusieurs années
de sécheresse successives gagnerait à développer la culture de cette plante et à
intensifier la vulgarisationdeson usage en tant que source de fourrage et même son
industrialisation. La première importance économique du cactus dans le monde réside
dans la production de fruits comestibles (Pimienta Barrios et al.,1993).La production de
fourrage pour le bétail représente la deuxième importance économique de cette plante au
Maroc. Le cactus est utilisé depuis longtemps dans l’alimentation des bétails des zones
arides et sa production dans ces zones est plus rentable que celle de centaines autres
types fourragères comme le maïs ou le sorgho(Russel.,1986).
Les Opuntia se propagent par multiplication asexuée ou à travers les graines ou par
culture in vitro (Victor et Villalobos,1995). La multiplication asexué e est effectuée par
bouturage. Dans la pratique culturale, la bouture du figuier de barbarie est formée par une
raquette de deux ans avec deux ou trois raquettes d’un an (Barbera, 1991).Ces jeunes
pousses sont riches en vitamines C, calcium, et leur teneur nutritive est proche de celle de
la laitue et des épinards. (Mohamed-Yasseen et al., 1996. Saenz,2002).Cependant le
choix du type de plante (écotypes) différera selon les utilisations(alimentation du bétail,
lutte contre l’érosion,….). En effet les programmes d’amélioration, d’étiquetage et de
caractérisation des ressources génétiques de cette plante sont rares et cecidue à la
grande diversité génétique de cette dernière. Dans ce cadre nous avons étudiés des
plantes de figuier de barbarie âgé de neuf ans dans le cactétum expérimentaldel’INRA-
Settat,JamaâtRiah.
Objectif
La caractérisation biométrique et phénotypique du fruit des différents cactus Marocain.
Extraire le jus de fruit à fin de caractériser ça composition biochimique pour classer les
écotypes selon les régions quiont un fruit de bon qualité.
Matériels et méthodes
Le matériel végétal étudié est la plante d’opuntia Sppqui comprennent deux types
d’espèces: Opuntia ficus indica et Opuntia Megacantha Slam dyk selon la dernière
étude systématique (El mzouriet al 2012), âgée de 9 à 10 ans, manifestement sain,
vigoureux et il est constitué de différents écotypes d’origine divers. La collecte des fruits
Proceedings of 7th WEEC Niche 5: Ecological and
green economies
84
a été faite par un groupe de chercheur de l’INRAde Settat dans le mois juin et juillet, et le
nombre des écotypes est 32 avec trois plantes pour chaque écotype.ils sont nommés de A
à K.Pour chaque plante on a prélevé trois fruits, dans l’ensemble était de 9 fruits pour
chaque écotype avec une somme totale de 99 fruits pour tous les écotypes.Les fruits ont
été prélevé avec un petit morceau de raquette, afin qu’ils gardent qu’il garde leur
métabolisme stable et ne s’altère pas, vu que nous étions à l’été.Chaque fruit a été
mesuré dans une balance de précision, on notant les valeurs du poids du fruit fraiche,
celuide la chaire fraiche. Ensuite on enlève la chaire avec la pulpe afin de faire une
observation morphologique dans le but de séparer les fruits selon leur couleur, et voir s’il y
a une différence morphologique entre les écotypes au niveau des couleurs des fruits.
Après les mesures, on met les chaires fraiches à l’étuve avec une température de 55
°C pour une durée de 24h, ensuite on mesure le poids de la chaire sèche dans une
balance de précision.
Résultats
On a remarqué que l’un des écotypes leurs fruits ont gardé le même stade de
maturation, petite tailles et contiennent beaucoup de graine, ce quinous a pas permis de
pouvoir extraire un jus pour déterminer ça composition biochimique. Pour l’écotype Ex, il a
gardé le même stade de pré-maturation quinous a pas permis de pouvoir extraire son jus
de fruit et aussifaire les mesures biométriques.
Les résultats montrent que les 32 écotypes présentent quatre couleurs de fruits à savoir :
le rose, vert, rose/rouge, jaune orangé, avec 28 écotypes de couleur Jaune-Orangé quiest
le plus présenté, et deux écotypes de couleur Rose-Rouge, et deux autres écotypes dont
l’un représente la couleur verte et l’autre la couleur rose. (Tableau 2).
Le nombre de fruit de cactus par raquette et par écotype varie de 3 à 17,6 à l’exception
des écotypes G3, H3et J3, qui présente une absence des fruits, ceci peut être expliqué
que ces derniers ont une floraison tardive qui va donner des fruits tardive, vu que cette
observation a été faite début du mois de juin, et qui va être confirmé par la deuxième
observation en moitié du mois de juillet, tel que ces écotypes ont montré la présence des
fruits qui vont être récolté pour l’analyse physicochimique du jus de fruit.
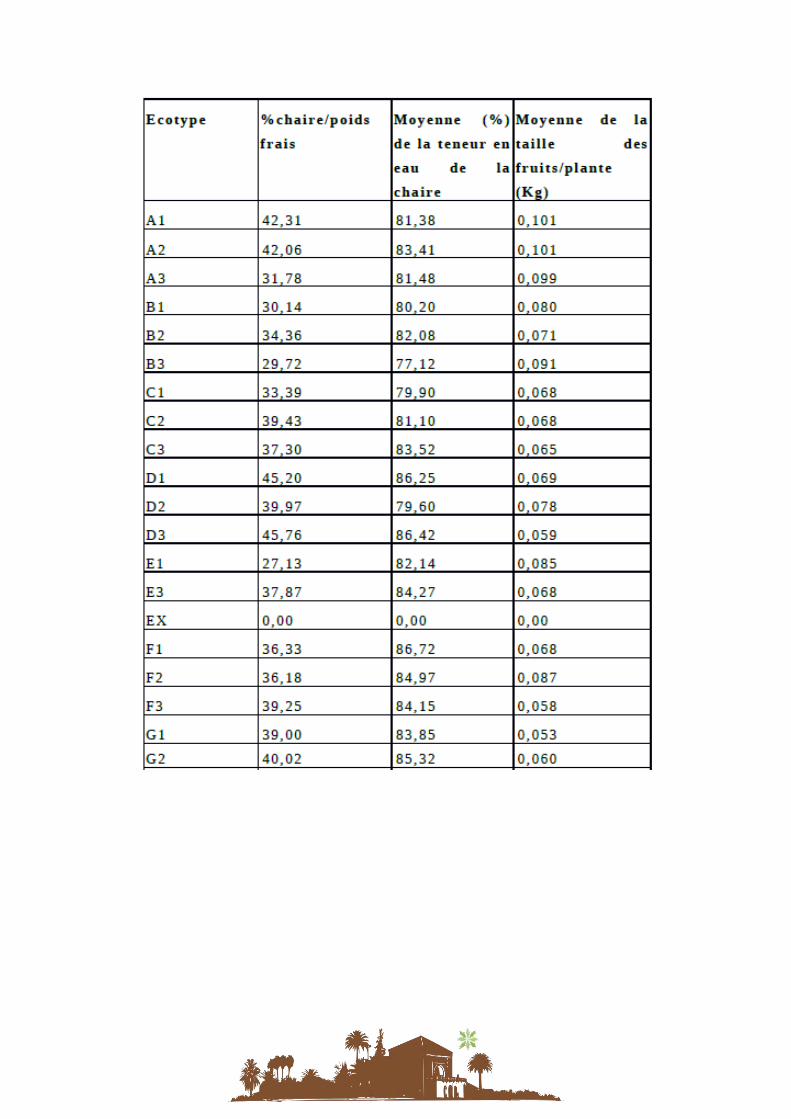
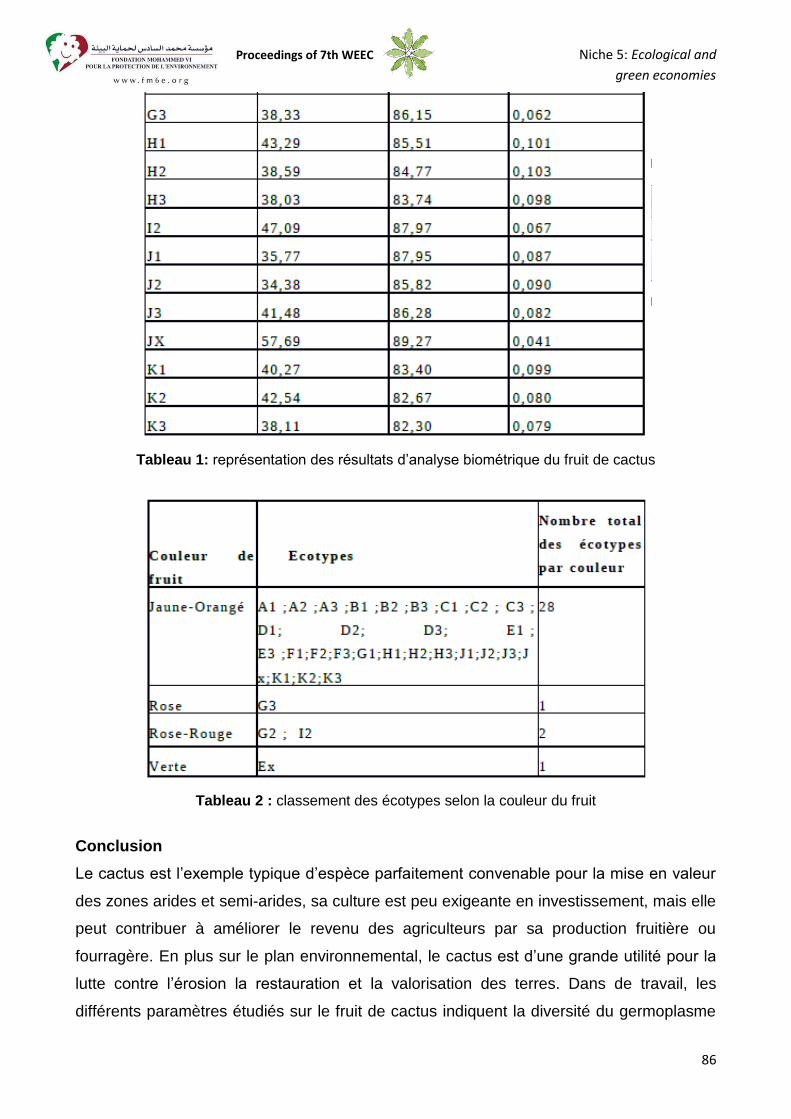
Proceedings of 7th WEEC Niche 5: Ecological and
green economies
86
Tableau 1: représentation des résultats d’analyse biométrique du fruit de cactus
Tableau 2 : classement des écotypes selon la couleur du fruit
Conclusion
Le cactus est l’exemple typique d’espèce parfaitement convenable pour la mise en valeur
des zones arides et semi-arides, sa culture est peu exigeante en investissement, mais elle
peut contribuer à améliorer le revenu des agriculteurs par sa production fruitière ou
fourragère. En plus sur le plan environnemental, le cactus est d’une grande utilité pour la
lutte contre l’érosion la restauration et la valorisation des terres. Dans de travail, les
différents paramètres étudiés sur le fruit de cactus indiquent la diversité du germoplasme
national pour la qualité et la taille du fruit. Ce qui servirait comme base d’orientation pour
des programmes d’investissement dans le fruit de cactus en vu de sa valorisation dans le
futur.
Références bibliographiques
Barbera G., 1991a:Il Ficodindia. In:A.A.V.V., Frutticoltura Speciale.REDA,
Roma:680-683.
El mzourietal2012, Mémoire de PFE :Contribution à l’étude systématique ettraits
agro-morphologiques du germoplasme du cactus Marocain (Opuntia spp), institut
nationale de la recherche agronomique INRA-CRRA ,Settat
Mohamed-Yasseen,Y.; Barringer, S.A.;Splittstoesser, W.E.; J:Arid Environ., 1996,
32(3), 347-353.
Pimienta Barrios, E; Barbera Get Inglese P 1993:Cactus pear (Opuntia spp,
Cactaceae) InternationalNetwork an effort for productivity. Succulent journal (US),
65, 225-229.
RusselC E., 1986:cactus ecologyand range management during drought.
Proceeding of the symposiumon livestock and wild life management during
drought(R D Brown Ed). Caesar Kleberg wild life reseaches InstitutUniv Kingsville
Texas p.59-69.
Saenz,C., 2002:Acta Horticulturae, 581, 253-263.
Victor MetVillalobos A.,1995 :Tissu culture application of Opuntia :Micro
propagation. Plant production and pretaction. Agro-ecology, cultivation and uses of
cactus pear:FAO. Pp 132:71-77
Proceedings of 7th WEEC Niche 5: Ecological and
green economies
88
La cultura del agua en la agricultura española
Gestión y consumo del agua desde la perspectiva de los agricultores andaluces
Esther Mena Rodríguez
Miguel Ángel Fernández Jiménez
Universidad de Málaga
Resumen
Este trabajo es parte de una investigación más amplia de ámbito andaluz sobre la
implicación ciudadana en el consumo responsable del agua.
El objetivo que nos planteamos era ofrecer la opinión que tienen, en este caso, los
agricultores sobre el consumo de este bien escaso.
Para ello se construyó un cuestionario tipo Likert y aplicó a una muestra de regantes de
todas las provincias de Andalucía (N=1030).
Los resultados arrojan datos importantes en relación al objetivo de la investigación y
reflejan ciertas concepciones que justifican algunas actuaciones en cuanto al uso y
gestión del agua.
Introducción
El agua es tanto un derecho como una responsabilidad y esencial para la vida. Nuestra
existencia, así como las actividades económicas dependen totalmente de este precioso y,
en nuestra comunidad autónoma, escaso recurso.
La agricultura juega un papel muy importante en el uso y consumo del agua. Es uno de
los sectores en los que se consume más en relación al gasto total del agua en España,
concretamente un 75% seguido por un 12% en consumo familiar, un 10% en la Industria y
un 3% en servicios, según datos del Instituto Nacional de Estadística (2008).
En Andalucía el consumo total de agua en la agricultura representa el 19,6% con una
superficie de 87.268 Km2, somos la primera comunidad autónoma en cuanto al gasto de
agua (28,91%), seguida por Castilla-La Mancha (14,01%) y por Castilla-León (11,89%)
según datos del Ministerio de Agricultura, Alimentación y Medio Ambiente (ESYRCE,
2011).
Sin embargo y a pesar de la relevancia de la agricultura en este tema, las campañas de
sensibilización y de educación ambiental se dirigen principalmente a los ciudadanos y no
así a este sector productivo.
Por todo lo expuesto nos planteamos desde la Universidad de Málaga llevar a cabo una
investigación de ámbito andaluz1, sobre la implicación ciudadana en el consumo
responsable del agua y, dedicarle un apartado especial a éste sector productivo y
estratégico que está, generalmente ausente en las investigaciones sobre Educación
Ambiental, al ser un sector de la población de difícil acceso, con una cultura y tradición
propias, que pocas veces es atendido y comprendido.
Incluso a nivel internacional investigaciones que relacionen el binomio agricultura-
educación ambiental son escasas, algunas excepciones en este ámbito son los trabajos
de Bekalo y Bangay (2002), Shava, Krasny, Tidball y Zazu (2010), Sumner (2008), Tal
(2008) y Villamagna y Murphy (2008).
Objetivos
Objetivo general: Conocer la información que poseen personas relacionadas con la
agricultura en Andalucía, así como las actitudes y estados de ánimo que tienen y la
valoración sobre propuestas de cambio y posibles mejoras sobre diversos aspectos
relacionados con el uso y el consumo del agua.
Objetivos específicos: Encontrar diferencias y relaciones entre las opiniones de los
regantes y variables como la edad, el género, la situación laboral actual, la provincia de
origen, la superficie de cultivo y la producción.
Método
En un primer momento se llevó a cabo un estudio descriptivo en el que se entrevistó en
profundidad a una muestra de personas elegidas por muestreo teórico y pertenecientes a
diversos sectores andaluces con un rol relevante en gestión y uso responsable del agua
(empresas, administración, asociaciones conservacionistas y de educación ambiental,
medios de comunicación especializados,…).
A partir del análisis de la información recabada en las entrevistas, se diseñó un
cuestionario de 30 ítems con un formato de escala de apreciación tipo Likert donde el 5
indica que se está “totalmente de acuerdo” con la afirmación contenida en el ítem y 1 que
se está “totalmente en desacuerdo”.
1 Proyecto IMCIGRA: Implicación Ciudadana en la Gestión Responsable del Agua. Análisis del contexto andaluz y líneas socioeducativas de actuación. Proyecto de Excelencia a cargo de un equipo de investigación de la Universidad de Málaga (financiado por la Junta de Andalucía).
Proceedings of 7th WEEC Niche 5: Ecological and
green economies
90
El cuestionario se elaboró para conocer diversos aspectos relacionados con el uso y el
consumo del agua así como con los valores y la cultura que se tiene desde la propia
perspectiva de los regantes y se estructuró en 3 dimensiones:
a) representativa (6 ítems), para obtener información de algunos aspectos
relevantes del uso del agua
b) emotiva (17 ítems), para recabar sentimientos, actitudes y estados de ánimo de
los agricultores y regantes
c) apelativa (7 ítems), para conocer su valoración de propuestas de cambio y
mejora dirigidas a diversos sectores.
También se añadieron una serie de cuestiones relativas a variables de clasificación
(género, edad, localidad, situación laboral actual, superficie, tipo y producción de los
cultivos) para conocer en mayor profundidad a la muestra
Antes de su aplicación dicho cuestionario fue validado por profesorado universitario
experto en metodología de investigación que hizo las sugerencias oportunas las cuales
fueron incluidas en una segunda versión del cuestionario. A continuación hubo una
primera aplicación piloto para ayudar a la redefinición de los ítems.
Posteriormente se realizó un estudio de fiabilidad y validez obteniendo un α de Cronbach
de 0,787 de consistencia interna en el cuestionario y, a partir de un análisis factorial de
componentes principales se encontró un total de 9 componentes que explicaban el
52,16% de la varianza total. Se realizaron además análisis descriptivos de los datos
(porcentajes, media y desviación típica), prueba no paramétrica de χ2 (comparando las
frecuencias observadas con las esperadas), análisis de correlaciones (entre las variables
de clasificación de edad, superficie de cultivo y productividad con los diferentes ítems del
cuestionario) y análisis multivariante de la varianza (entre las variables provincia y
situación laboral con los ítems del cuestionario). Todos ellos con el paquete estadístico
SPSS 17.0.
Finalmente el cuestionario se aplicó a una muestra seleccionada de manera
pseudoaleatoria, no probabilística (n=1030), de regantes y agricultores de la mayor parte
de las comarcas y provincias andaluzas. La muestra estuvo compuesta por un 53% de
hombres y un 47% de mujeres, de entre 17 y 77 años (media de 36 años y desviación
típica de 11,13).
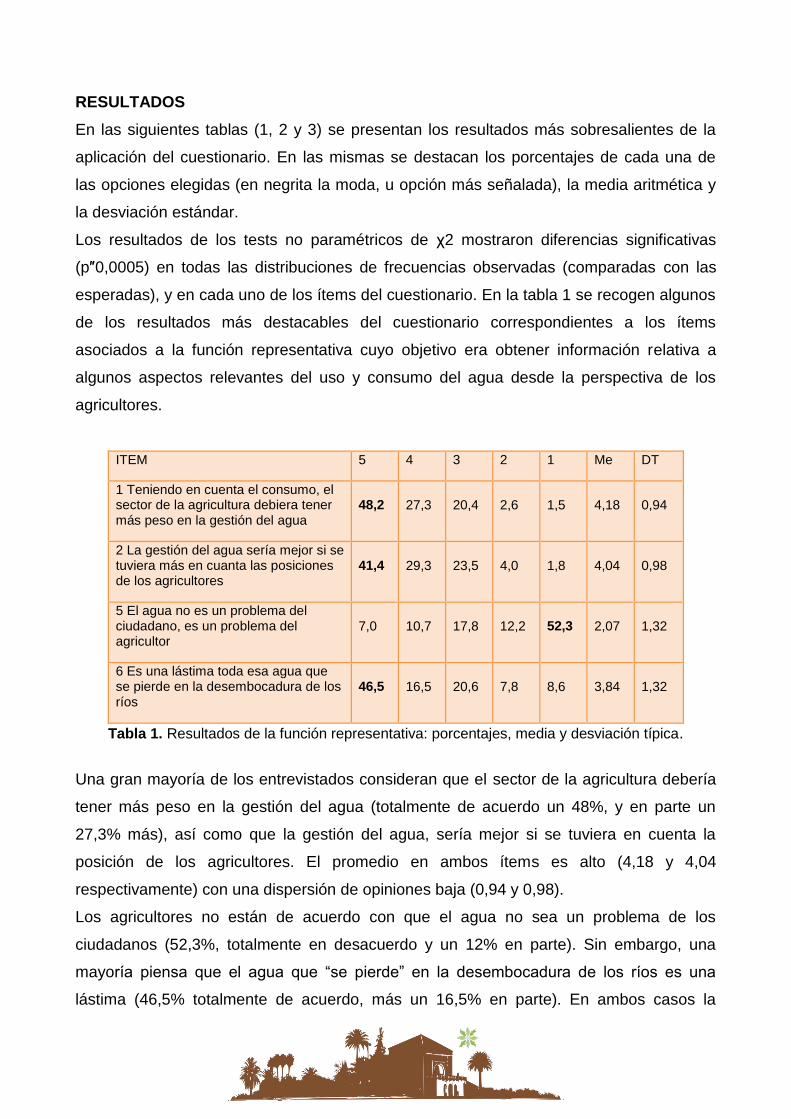
RESULTADOS
En las siguientes tablas (1, 2 y 3) se presentan los resultados más sobresalientes de la
aplicación del cuestionario. En las mismas se destacan los porcentajes de cada una de
las opciones elegidas (en negrita la moda, u opción más señalada), la media aritmética y
la desviación estándar.
Los resultados de los tests no paramétricos de χ2 mostraron diferencias significativas
(p″0,0005) en todas las distribuciones de frecuencias observadas (comparadas con las
esperadas), y en cada uno de los ítems del cuestionario. En la tabla 1 se recogen algunos
de los resultados más destacables del cuestionario correspondientes a los ítems
asociados a la función representativa cuyo objetivo era obtener información relativa a
algunos aspectos relevantes del uso y consumo del agua desde la perspectiva de los
agricultores.
ITEM 5 4 3 2 1 Me DT
1 Teniendo en cuenta el consumo, el sector de la agricultura debiera tener más peso en la gestión del agua
48,2 27,3 20,4 2,6 1,5 4,18 0,94
2 La gestión del agua sería mejor si se tuviera más en cuanta las posiciones de los agricultores
41,4 29,3 23,5 4,0 1,8 4,04 0,98
5 El agua no es un problema del ciudadano, es un problema del agricultor
7,0 10,7 17,8 12,2 52,3 2,07 1,32
6 Es una lástima toda esa agua que se pierde en la desembocadura de los ríos
46,5 16,5 20,6 7,8 8,6 3,84 1,32
Tabla 1. Resultados de la función representativa: porcentajes, media y desviación típica.
Una gran mayoría de los entrevistados consideran que el sector de la agricultura debería
tener más peso en la gestión del agua (totalmente de acuerdo un 48%, y en parte un
27,3% más), así como que la gestión del agua, sería mejor si se tuviera en cuenta la
posición de los agricultores. El promedio en ambos ítems es alto (4,18 y 4,04
respectivamente) con una dispersión de opiniones baja (0,94 y 0,98).
Los agricultores no están de acuerdo con que el agua no sea un problema de los
ciudadanos (52,3%, totalmente en desacuerdo y un 12% en parte). Sin embargo, una
mayoría piensa que el agua que “se pierde” en la desembocadura de los ríos es una
lástima (46,5% totalmente de acuerdo, más un 16,5% en parte). En ambos casos la
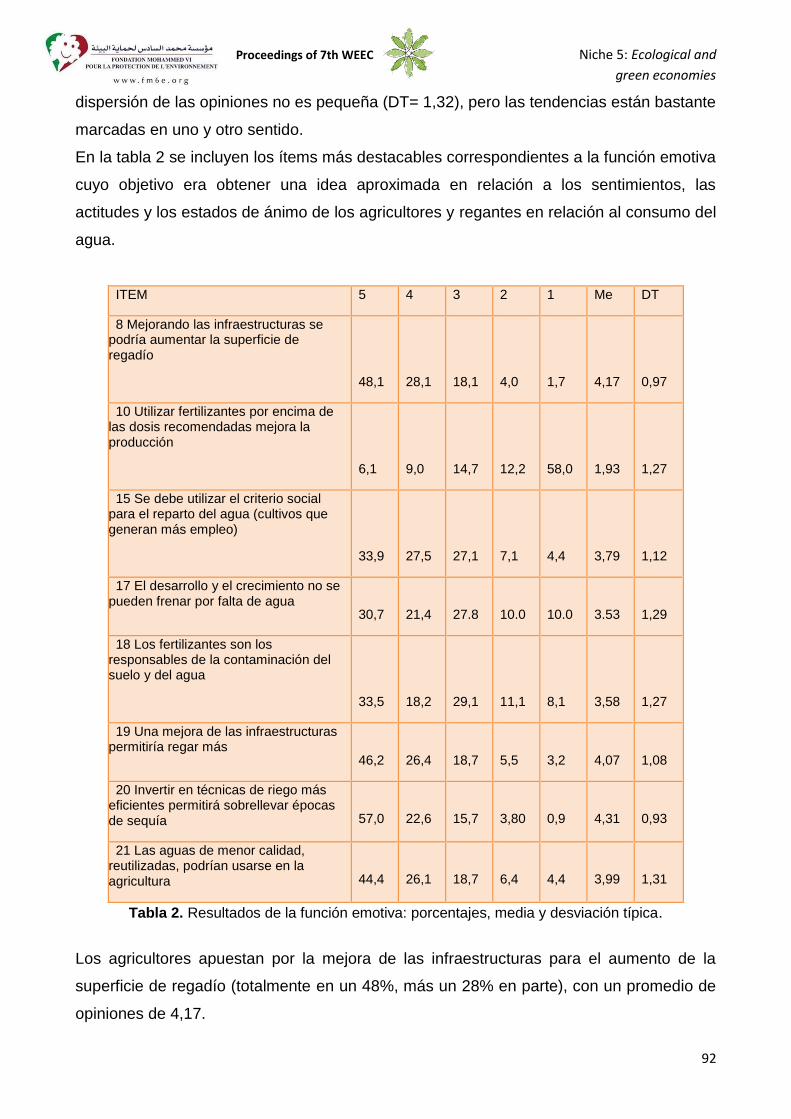
Proceedings of 7th WEEC Niche 5: Ecological and
green economies
92
dispersión de las opiniones no es pequeña (DT= 1,32), pero las tendencias están bastante
marcadas en uno y otro sentido.
En la tabla 2 se incluyen los ítems más destacables correspondientes a la función emotiva
cuyo objetivo era obtener una idea aproximada en relación a los sentimientos, las
actitudes y los estados de ánimo de los agricultores y regantes en relación al consumo del
agua.
ITEM 5 4 3 2 1 Me DT
8 Mejorando las infraestructuras se podría aumentar la superficie de regadío
48,1
28,1
18,1
4,0
1,7
4,17
0,97
10 Utilizar fertilizantes por encima de las dosis recomendadas mejora la producción
6,1
9,0
14,7
12,2
58,0
1,93
1,27
15 Se debe utilizar el criterio social para el reparto del agua (cultivos que generan más empleo)
33,9
27,5
27,1
7,1
4,4
3,79
1,12
17 El desarrollo y el crecimiento no se pueden frenar por falta de agua
30,7
21,4
27.8
10.0
10.0
3.53
1,29
18 Los fertilizantes son los responsables de la contaminación del suelo y del agua
33,5
18,2
29,1
11,1
8,1
3,58
1,27
19 Una mejora de las infraestructuras permitiría regar más
46,2
26,4
18,7
5,5
3,2
4,07
1,08
20 Invertir en técnicas de riego más eficientes permitirá sobrellevar épocas de sequía
57,0
22,6
15,7
3,80
0,9
4,31
0,93
21 Las aguas de menor calidad, reutilizadas, podrían usarse en la agricultura
44,4
26,1
18,7
6,4
4,4
3,99
1,31
Tabla 2. Resultados de la función emotiva: porcentajes, media y desviación típica.
Los agricultores apuestan por la mejora de las infraestructuras para el aumento de la
superficie de regadío (totalmente en un 48%, más un 28% en parte), con un promedio de
opiniones de 4,17.
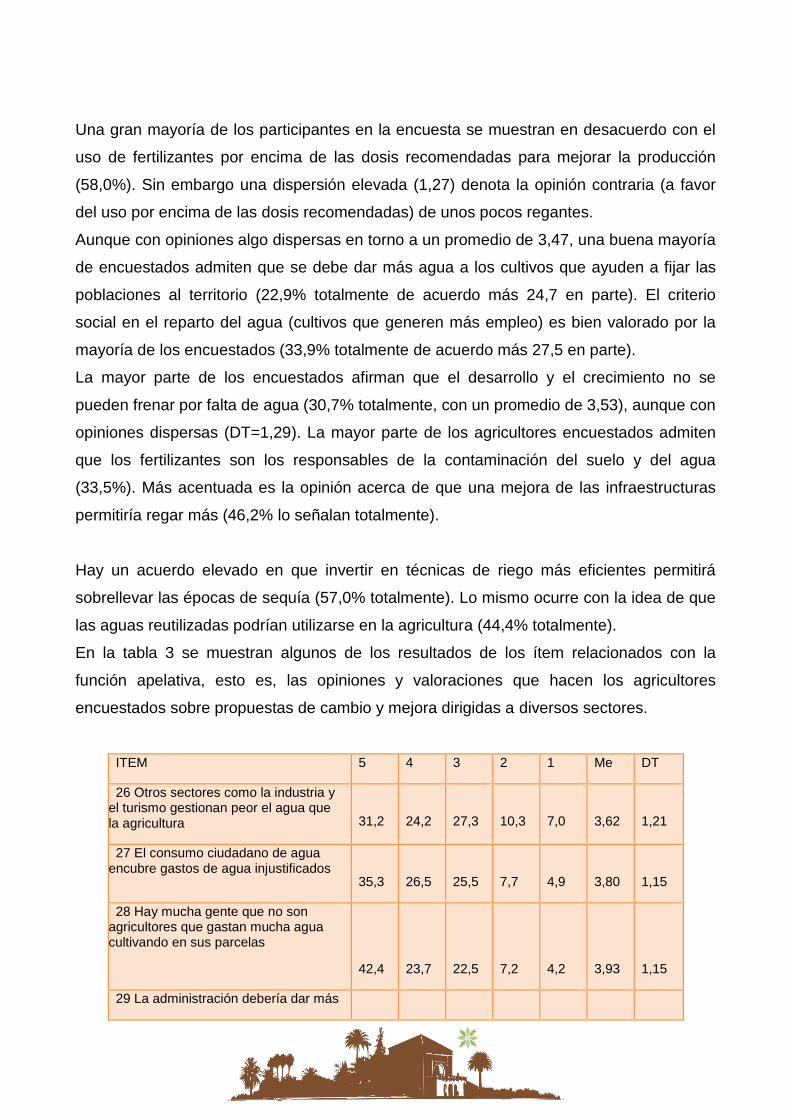
Una gran mayoría de los participantes en la encuesta se muestran en desacuerdo con el
uso de fertilizantes por encima de las dosis recomendadas para mejorar la producción
(58,0%). Sin embargo una dispersión elevada (1,27) denota la opinión contraria (a favor
del uso por encima de las dosis recomendadas) de unos pocos regantes.
Aunque con opiniones algo dispersas en torno a un promedio de 3,47, una buena mayoría
de encuestados admiten que se debe dar más agua a los cultivos que ayuden a fijar las
poblaciones al territorio (22,9% totalmente de acuerdo más 24,7 en parte). El criterio
social en el reparto del agua (cultivos que generen más empleo) es bien valorado por la
mayoría de los encuestados (33,9% totalmente de acuerdo más 27,5 en parte).
La mayor parte de los encuestados afirman que el desarrollo y el crecimiento no se
pueden frenar por falta de agua (30,7% totalmente, con un promedio de 3,53), aunque con
opiniones dispersas (DT=1,29). La mayor parte de los agricultores encuestados admiten
que los fertilizantes son los responsables de la contaminación del suelo y del agua
(33,5%). Más acentuada es la opinión acerca de que una mejora de las infraestructuras
permitiría regar más (46,2% lo señalan totalmente).
Hay un acuerdo elevado en que invertir en técnicas de riego más eficientes permitirá
sobrellevar las épocas de sequía (57,0% totalmente). Lo mismo ocurre con la idea de que
las aguas reutilizadas podrían utilizarse en la agricultura (44,4% totalmente).
En la tabla 3 se muestran algunos de los resultados de los ítem relacionados con la
función apelativa, esto es, las opiniones y valoraciones que hacen los agricultores
encuestados sobre propuestas de cambio y mejora dirigidas a diversos sectores.
ITEM 5 4 3 2 1 Me DT
26 Otros sectores como la industria y el turismo gestionan peor el agua que la agricultura
31,2
24,2
27,3
10,3
7,0
3,62
1,21
27 El consumo ciudadano de agua encubre gastos de agua injustificados
35,3
26,5
25,5
7,7
4,9
3,80
1,15
28 Hay mucha gente que no son agricultores que gastan mucha agua cultivando en sus parcelas
42,4
23,7
22,5
7,2
4,2
3,93
1,15
29 La administración debería dar más
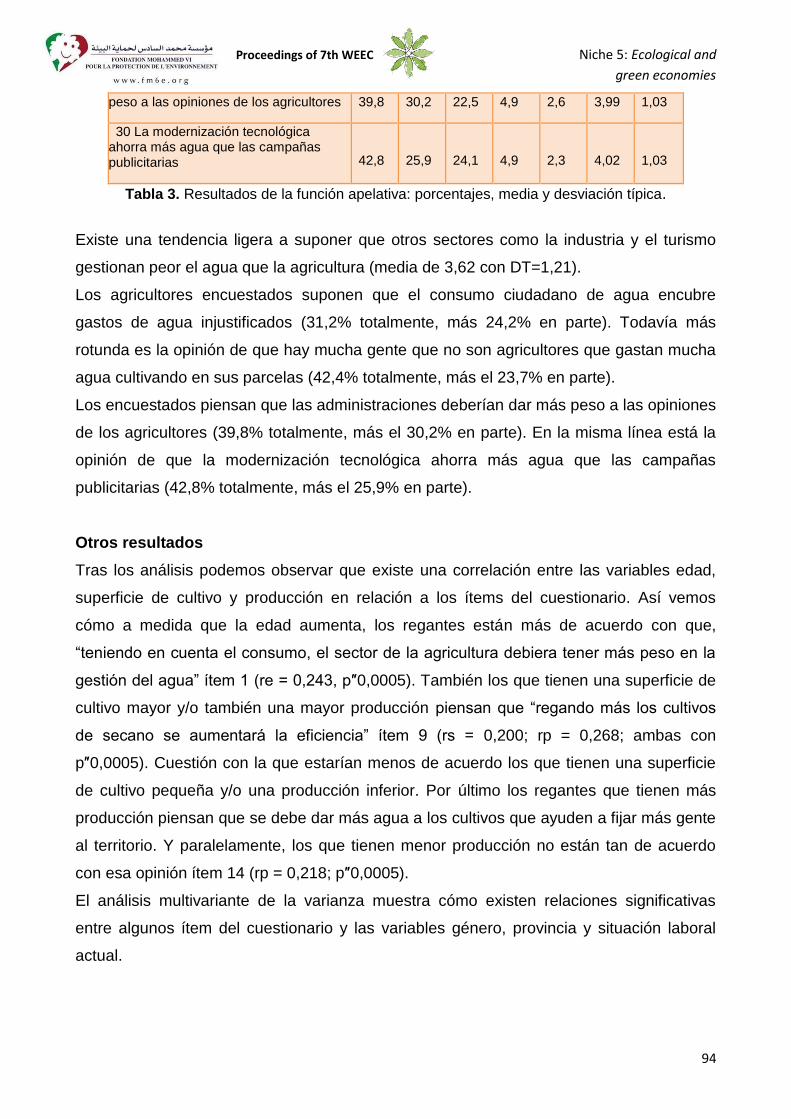
Proceedings of 7th WEEC Niche 5: Ecological and
green economies
94
peso a las opiniones de los agricultores 39,8 30,2 22,5 4,9 2,6 3,99 1,03
30 La modernización tecnológica ahorra más agua que las campañas publicitarias
42,8
25,9
24,1
4,9
2,3
4,02
1,03
Tabla 3. Resultados de la función apelativa: porcentajes, media y desviación típica.
Existe una tendencia ligera a suponer que otros sectores como la industria y el turismo
gestionan peor el agua que la agricultura (media de 3,62 con DT=1,21).
Los agricultores encuestados suponen que el consumo ciudadano de agua encubre
gastos de agua injustificados (31,2% totalmente, más 24,2% en parte). Todavía más
rotunda es la opinión de que hay mucha gente que no son agricultores que gastan mucha
agua cultivando en sus parcelas (42,4% totalmente, más el 23,7% en parte).
Los encuestados piensan que las administraciones deberían dar más peso a las opiniones
de los agricultores (39,8% totalmente, más el 30,2% en parte). En la misma línea está la
opinión de que la modernización tecnológica ahorra más agua que las campañas
publicitarias (42,8% totalmente, más el 25,9% en parte).
Otros resultados
Tras los análisis podemos observar que existe una correlación entre las variables edad,
superficie de cultivo y producción en relación a los ítems del cuestionario. Así vemos
cómo a medida que la edad aumenta, los regantes están más de acuerdo con que,
“teniendo en cuenta el consumo, el sector de la agricultura debiera tener más peso en la
gestión del agua” ítem 1 (re = 0,243, p″0,0005). También los que tienen una superficie de
cultivo mayor y/o también una mayor producción piensan que “regando más los cultivos
de secano se aumentará la eficiencia” ítem 9 (rs = 0,200; rp = 0,268; ambas con
p″0,0005). Cuestión con la que estarían menos de acuerdo los que tienen una superficie
de cultivo pequeña y/o una producción inferior. Por último los regantes que tienen más
producción piensan que se debe dar más agua a los cultivos que ayuden a fijar más gente
al territorio. Y paralelamente, los que tienen menor producción no están tan de acuerdo
con esa opinión ítem 14 (rp = 0,218; p″0,0005).
El análisis multivariante de la varianza muestra cómo existen relaciones significativas
entre algunos ítem del cuestionario y las variables género, provincia y situación laboral
actual.
Concretamente los hombres (media de 3,62) están más de acuerdo que las mujeres
agricultoras (media de 3,34) con que se debe dar más agua a los cultivos que ayuden a
fijar más gente al territorio (p=0,0005) ítems 14, 23 y 28. Existe una diferencia significativa
(p=0,026) entre la opinión de las agricultoras (media de 3,38), que están más de acuerdo
que los agricultores hombres (media de 3,21) con que el principal uso del agua de los ríos
debe ser la agricultura. De la misma forma, las mujeres (media de 4,10) tienen una
opinión significativamente diferente (p=0,001) y superior a los hombres (media de 3,85),
sobre que hay mucha gente que no son agricultores que gastan mucha agua cultivando
en sus parcelas.
La situación laboral actual (trabajador por cuenta ajena, autónomo, miembro de
cooperativa o desempleado). Así los autónomos (media de 3,85) les importa menos pagar
más de canon para tener más agua que a los trabajadores por cuenta ajena (media de
2,62, con p=0,006) y que a los desempleados (media de 2,43, con p=0,003), ítems 13 y
16. Los desempleados (media de 3,53), además, piensan que se debe proporcionar más
agua a las superficies de cultivo más grandes que los trabajadores por cuenta ajena
(media de 3,53, con p=0,033).
Los participantes en la encuesta de la provincia de Almería (media de 4,35 con p=0,027)
están más de acuerdo que “el problema del agua se resolvería trasvasando agua de las
cuencas excedentarias a las deficitarias” que los de Granada (media de 3,40). De la
misma forma, los regantes de Almería (media de 3,88 con p=0,05) opinan que “mejorando
las infraestructuras se podría aumentar la superficie de regadío” más que los de Málaga
(media de 3,98). Los agricultores de Granada (media de 4,52 con p=0,032) creen más
que “las aguas de menor calidad, reutilizadas, podrían usarse en la agricultura” que los de
Sevilla (media de 3,85). Los participantes en la encuesta de la provincia de Almería
(media de 4,06) están más de acuerdo que “el consumo ciudadano de agua encubre
gastos de agua injustificados” que los de Granada (media de 3,51 con p=0,003) y los de
Jaén (media de 3,55 con p=0,025) ítems 7, 8, 21 y 27.
Conclusiones
En términos generales, los regantes piensan que el sector de la agricultura debería tener
más peso en la gestión del agua y que ésta mejoraría si se tuviera más en cuenta las
opiniones de los agricultores. Aunque admiten que en la agricultura se malgasta agua, y
Proceedings of 7th WEEC Niche 5: Ecological and
green economies
96
que el agua es un problema de la ciudadanía, más que de los propios agricultores,
también consideran que el agua no debería dejarse “perder” en las desembocaduras de
los ríos.
Casi la totalidad apuesta por la mejora de las infraestructuras hidráulicas que permitiesen
un aumento de la superficie de regadío. El desarrollo y el crecimiento no se pueden
frenar, según su opinión, por falta de agua. Una gran mayoría cree que las aguas
reutilizadas podrían utilizarse en la agricultura, y que habría que invertir más en
tecnologías para aumentar la eficiencia y combatir los periodos de sequía. También
apuestan por el uso de criterios sociales (generación de empleo) para el reparto del agua.
Los regantes consideran que otros sectores (industria, turismo, ciudadanía…) gestionan
peor el agua que la agricultura. Según su opinión, es más positivo apostar por la
modernización tecnológica que por las campañas divulgativas de ahorro de agua.
Se han encontrado algunas diferencias relevantes (con significación estadística) entre las
opiniones de los participantes en la encuesta en relación a su edad, al género, a su
situación laboral actual, a la provincia de origen, a la superficie de cultivo y a la producción
de las tierras que trabajan.
Se puede concluir que el análisis de resultados del cuestionario arroja resultados
sustanciales en relación a concepciones y valores utilizados en la justificación de sus
comportamientos (tanto desde el punto de vista cognitivo-representativo, como del
afectivo-expresivo), así como las apelaciones que realizan desde su perspectiva, los
regantes, a otros sectores claves en la gestión responsable del uso y el consumo del
agua.
Aunque se puedan admitir algunas limitaciones en la generalización de los resultados,
debidas al muestreo empleado, se ha de ponderar la dificultad de acceso a este tipo de
poblaciones que, sin embargo, se ha resuelto con un trabajo de campo eficaz, que ha
permitido obtener unos resultados relevantes en relación a los objetivos del trabajo.
Bibliografía
FAO (2010): FAO Aquastat Database. Disponible en:
http://www.fao.org/nr/water/aquastat/dbases/indexesp.stm
INE (2008): “Estadísticas e indicadores del agua”. Cifras INE. Boletín informativo del
Instituto Nacional de Estadística 1/2008.
Ministerio de Agricultura, Alimentación y Medio Ambiente (2011). “Encuesta sobre
Superficies y Rendimientos de Cultivos” (ESYRCE, 2011).
Bekalo, S., Bangay, C. (2002): “Towards Effective Environmental Education in Ethiopia:
Problems and Prospects in Responding to the Environment--Poverty Challenge”.
International Journal of Educational Development, 1, 35-46.
Shava, S., Krasny, M. E., Tidball, K. G. y Zazu, C. (2010): “Agricultural Knowledge in
Urban and Resettled Communities: Applications to Social-Ecological Resilience and
Environmental Education”. Environmental Education Research, 16 (5-6), 575-589.
Sumner, J. (2008): “Protecting and Promoting Indigenous Knowledge: Environmental Adult
Education and Organic Agriculture”. Studies in the Education of Adults, 40 (2), 207-223.
Tal, T (2008): “Learning about Agriculture within the Framework of Education for
Sustainability”. Environmental Education Research, 14 (3), 273-290.
Villamagna, A. M. y Murphy, B. R. (2008): “Water Resources Management in the Lerma-
Chapala Basin, Mexico: A Case Study”. Journal of Natural Resources and Life Sciences
Education, 37, 102-110.
Proceedings of 7th WEEC Niche 5: Ecological and
green economies
98
Italians’ attitude toward tap water
A quantitative study in the Campania region
Paola Pascale, Regional Centre For Sustainable Development “la vite e il pioppo”,
Campania Regional Network INFEA - Antonio Pascale, G. Orazio Pascale, Federica
Minutillo, Geofilos Legambiente - Giovanni d’Errico, Giancarlo Chiavazzo, Legambiente
Campania Region***.
Abstract
The debate on water as a public resource and its sustainable consumption has taken on a
global dimension. The problem of water scarcity requires radical revision of consumption,
which must comply with the principles of responsibility and ethics. In this context, Italy is
characterized by the highest levels both of tap water consumption and of bottled water
consumption. The study is based on a survey of 600 people in Campania Region, South
Itay , carried out to identify the behavioural patterns about tap water consumption and to
analyse the relationship between consumption, lifestyles and attitudes towards
environmental issues.
1 Introduction
In Italy, the domestic consumption of drinking water in 2011 was, on average, 175.4 litres
(64 cubic metres) per capita per day (ISTAT 2013), which is 3.7% less than the previous
year. In effect, according to ISTAT data, a constant reduction of water consumption has
been recorded over the last ten years; this is because people are more careful when using
water resources. In the long term, reduction has been a little less than 15% (it was 206.1
litres per capita per day in 2002).
Although the water is of good quality, Italians still demonstrate a lack of trust in tap water:
in 2011, 30% of families had one or more members who said they did not trust it enough to
drink.
This phenomenon reaches the highest levels in the regions of the South of Italy. In 2010
61.8% of Italian families bought mineral water, a slightly smaller percentage compared
with the previous years. The average monthly expenditure on mineral water, per family, in
*** The paper is the result of the collaboration of the Authors. The text is attributed as follows: sections 1
Pascale A..; sections 2, 2.1, 2.2 and 2.3 Pascale P; ; sections 3 D’Errico G.; . 3.1 Pascale O. Minutillo F.; section 4 Chiavazzo G.
2010 was 19.50 euros, without highlighting significant territorial differences. This
expenditure is almost as much as is spent on domestic water supply (ISTAT, 2013).
At the same time as the decrease in tap water consumption, there has been an increase in
the consumption of bottled water: in 2011, 188 litres of bottled water per capita were
consumed. Italy is in the first place in Europe for consumption of bottled water; according
to a recent study by Legambiente there are 168 firms involved in the water business, with
304 different brands of bottled water, and a total budget of 2.25 billion euros.
The consumption of bottled water has a high environmental impact: CO2 emissions, petrol
consumption, plastic consumption, poor plastic recycling. Moreover, the problem of
transport is very important: a bottle of water originating from the Alps, for example, travels
more than 1,000 kilometres to get to the table of the residents in the Campania region,
with fuel consumption and consequent emission of polluting substances.
The lack of trust in the quality of tap water comes also from the lack of information on the
checks and strict rules and regulations regarding the domestic water supply in Italy.
To counter this tendency, correct information on the quality of tap water in our homes is
necessary. Citizens, in fact, have the right to know the chemical-physical composition of
the water they drink but also the duty to change direction with respect to the current levels
of consumption, they must be aware of the scarcity of water resources and adopt a new
more responsible consumption style.
In this context, the project “Ti Voglio Bere”(I Want To Drink You) was born, carried out by
the following network of associations and organisations of the third sector:
- Legambiente1 (League for the Environment), the most widespread environmental
organisation in Italy,
- Campania Regional Network INFEA2 (Environmental Information, Training and
Education), a tool of the Public Administration of the Campania Region, aimed at
implementing education and information activities to promote sustainable development.
- The Centre for voluntary service “CSV Asso.Vo.Ce”, Association for voluntary service in
the province of Caserta, aimed at promoting the culture of solidarity and voluntary service.
To achieve the stated objectives, the project has been articulated in two main activities:
to carry out a survey directed to a sample of 600 residents in the Campania Region,
one of the most densely populated regions of the South of Italy;
1 The research was coordinated by Legambiente Geofilos, Succivo and was carried out by Legambiente
Pietramelara and Sessa Aurunca, in the province of Caserta. 2 The research was carried out by the Regional Centre for Sustainable Development “la vite e il pioppo”,
managed by Legambiente Geofilos.
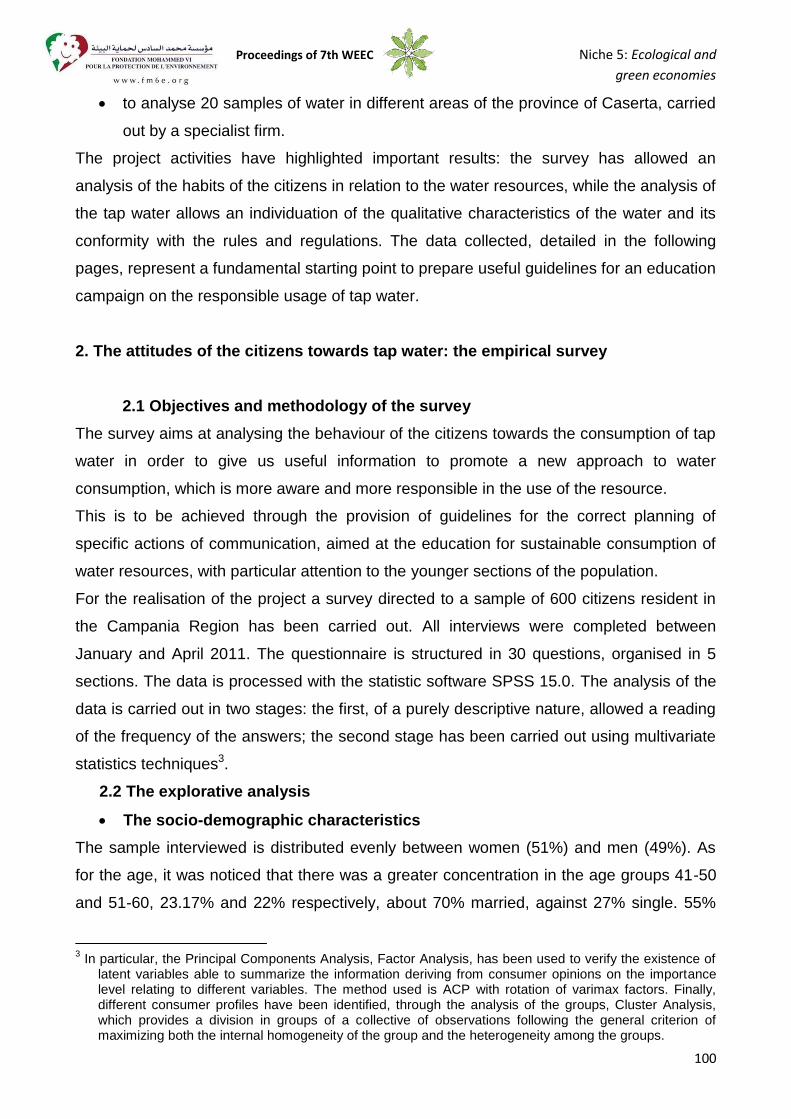
Proceedings of 7th WEEC Niche 5: Ecological and
green economies
100
to analyse 20 samples of water in different areas of the province of Caserta, carried
out by a specialist firm.
The project activities have highlighted important results: the survey has allowed an
analysis of the habits of the citizens in relation to the water resources, while the analysis of
the tap water allows an individuation of the qualitative characteristics of the water and its
conformity with the rules and regulations. The data collected, detailed in the following
pages, represent a fundamental starting point to prepare useful guidelines for an education
campaign on the responsible usage of tap water.
2. The attitudes of the citizens towards tap water: the empirical survey
2.1 Objectives and methodology of the survey
The survey aims at analysing the behaviour of the citizens towards the consumption of tap
water in order to give us useful information to promote a new approach to water
consumption, which is more aware and more responsible in the use of the resource.
This is to be achieved through the provision of guidelines for the correct planning of
specific actions of communication, aimed at the education for sustainable consumption of
water resources, with particular attention to the younger sections of the population.
For the realisation of the project a survey directed to a sample of 600 citizens resident in
the Campania Region has been carried out. All interviews were completed between
January and April 2011. The questionnaire is structured in 30 questions, organised in 5
sections. The data is processed with the statistic software SPSS 15.0. The analysis of the
data is carried out in two stages: the first, of a purely descriptive nature, allowed a reading
of the frequency of the answers; the second stage has been carried out using multivariate
statistics techniques3.
2.2 The explorative analysis
The socio-demographic characteristics
The sample interviewed is distributed evenly between women (51%) and men (49%). As
for the age, it was noticed that there was a greater concentration in the age groups 41-50
and 51-60, 23.17% and 22% respectively, about 70% married, against 27% single. 55%
3 In particular, the Principal Components Analysis, Factor Analysis, has been used to verify the existence of
latent variables able to summarize the information deriving from consumer opinions on the importance level relating to different variables. The method used is ACP with rotation of varimax factors. Finally, different consumer profiles have been identified, through the analysis of the groups, Cluster Analysis, which provides a division in groups of a collective of observations following the general criterion of maximizing both the internal homogeneity of the group and the heterogeneity among the groups.
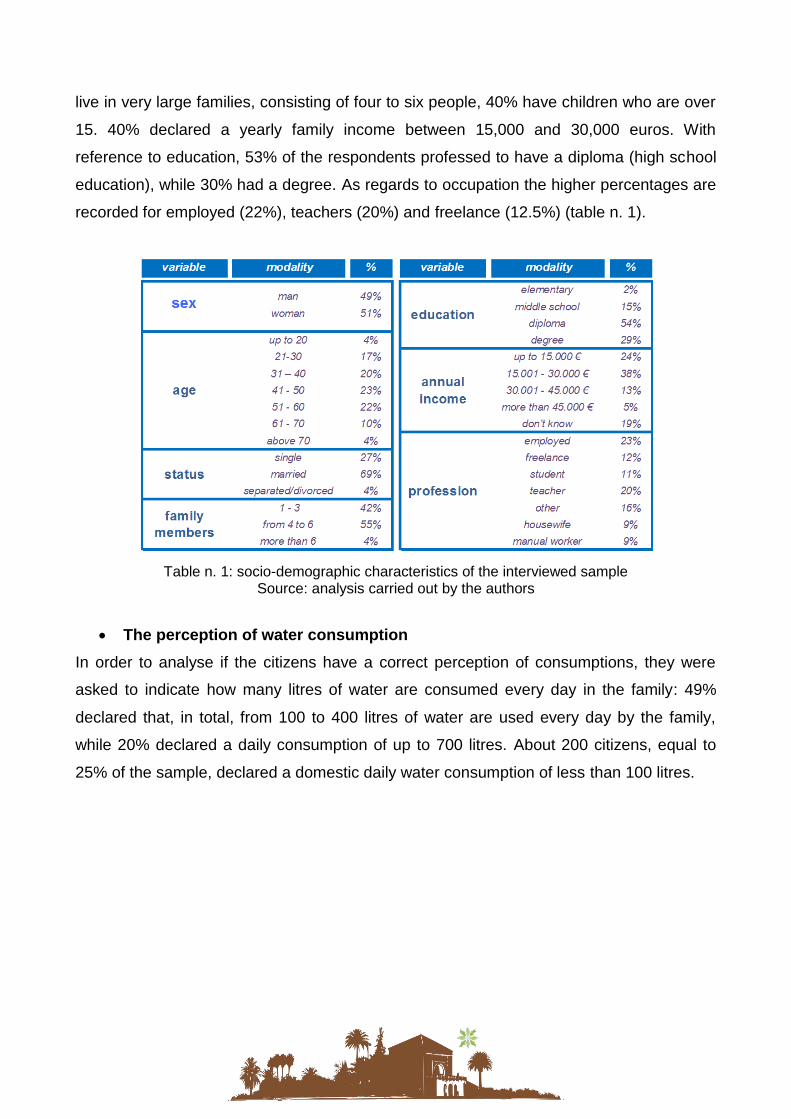
live in very large families, consisting of four to six people, 40% have children who are over
15. 40% declared a yearly family income between 15,000 and 30,000 euros. With
reference to education, 53% of the respondents professed to have a diploma (high school
education), while 30% had a degree. As regards to occupation the higher percentages are
recorded for employed (22%), teachers (20%) and freelance (12.5%) (table n. 1).
Table n. 1: socio-demographic characteristics of the interviewed sample
Source: analysis carried out by the authors
The perception of water consumption
In order to analyse if the citizens have a correct perception of consumptions, they were
asked to indicate how many litres of water are consumed every day in the family: 49%
declared that, in total, from 100 to 400 litres of water are used every day by the family,
while 20% declared a daily consumption of up to 700 litres. About 200 citizens, equal to
25% of the sample, declared a domestic daily water consumption of less than 100 litres.
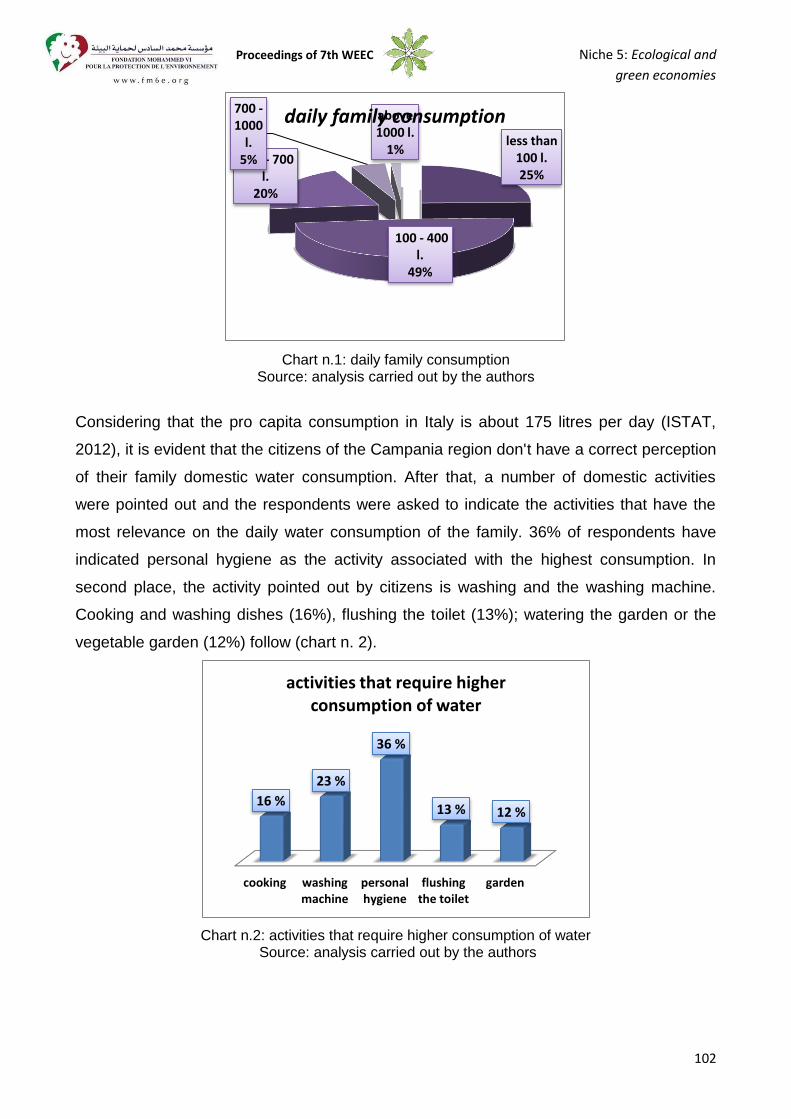
Proceedings of 7th WEEC Niche 5: Ecological and
green economies
102
Chart n.1: daily family consumption
Source: analysis carried out by the authors
Considering that the pro capita consumption in Italy is about 175 litres per day (ISTAT,
2012), it is evident that the citizens of the Campania region don't have a correct perception
of their family domestic water consumption. After that, a number of domestic activities
were pointed out and the respondents were asked to indicate the activities that have the
most relevance on the daily water consumption of the family. 36% of respondents have
indicated personal hygiene as the activity associated with the highest consumption. In
second place, the activity pointed out by citizens is washing and the washing machine.
Cooking and washing dishes (16%), flushing the toilet (13%); watering the garden or the
vegetable garden (12%) follow (chart n. 2).
Chart n.2: activities that require higher consumption of water
Source: analysis carried out by the authors
less than 100 l. 25%
100 - 400 l.
49%
400 - 700 l.
20%
700 - 1000
l. 5%
above 1000 l.
1%
daily family consumption
cooking washingmachine
personalhygiene
flushingthe toilet
garden
16 %
23 %
36 %
13 % 12 %
activities that require higher consumption of water
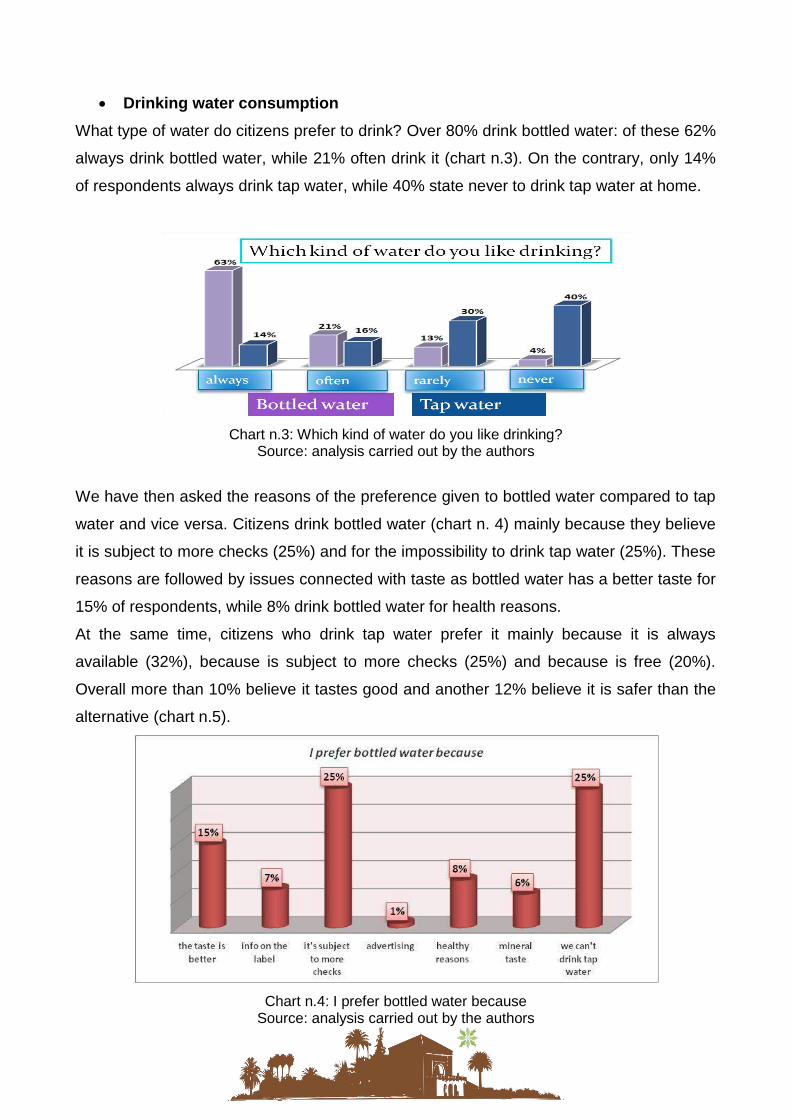
Drinking water consumption
What type of water do citizens prefer to drink? Over 80% drink bottled water: of these 62%
always drink bottled water, while 21% often drink it (chart n.3). On the contrary, only 14%
of respondents always drink tap water, while 40% state never to drink tap water at home.
Chart n.3: Which kind of water do you like drinking?
Source: analysis carried out by the authors
We have then asked the reasons of the preference given to bottled water compared to tap
water and vice versa. Citizens drink bottled water (chart n. 4) mainly because they believe
it is subject to more checks (25%) and for the impossibility to drink tap water (25%). These
reasons are followed by issues connected with taste as bottled water has a better taste for
15% of respondents, while 8% drink bottled water for health reasons.
At the same time, citizens who drink tap water prefer it mainly because it is always
available (32%), because is subject to more checks (25%) and because is free (20%).
Overall more than 10% believe it tastes good and another 12% believe it is safer than the
alternative (chart n.5).
Chart n.4: I prefer bottled water because
Source: analysis carried out by the authors
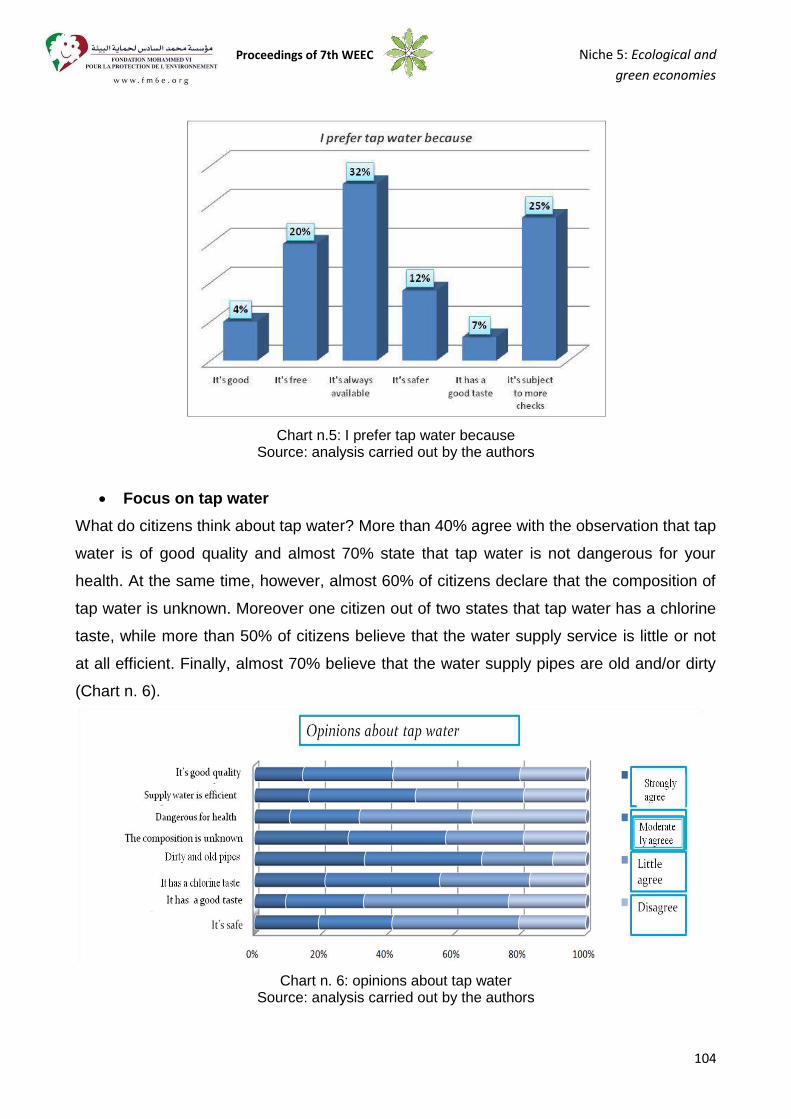
Proceedings of 7th WEEC Niche 5: Ecological and
green economies
104
Chart n.5: I prefer tap water because
Source: analysis carried out by the authors
Focus on tap water
What do citizens think about tap water? More than 40% agree with the observation that tap
water is of good quality and almost 70% state that tap water is not dangerous for your
health. At the same time, however, almost 60% of citizens declare that the composition of
tap water is unknown. Moreover one citizen out of two states that tap water has a chlorine
taste, while more than 50% of citizens believe that the water supply service is little or not
at all efficient. Finally, almost 70% believe that the water supply pipes are old and/or dirty
(Chart n. 6).
Chart n. 6: opinions about tap water
Source: analysis carried out by the authors
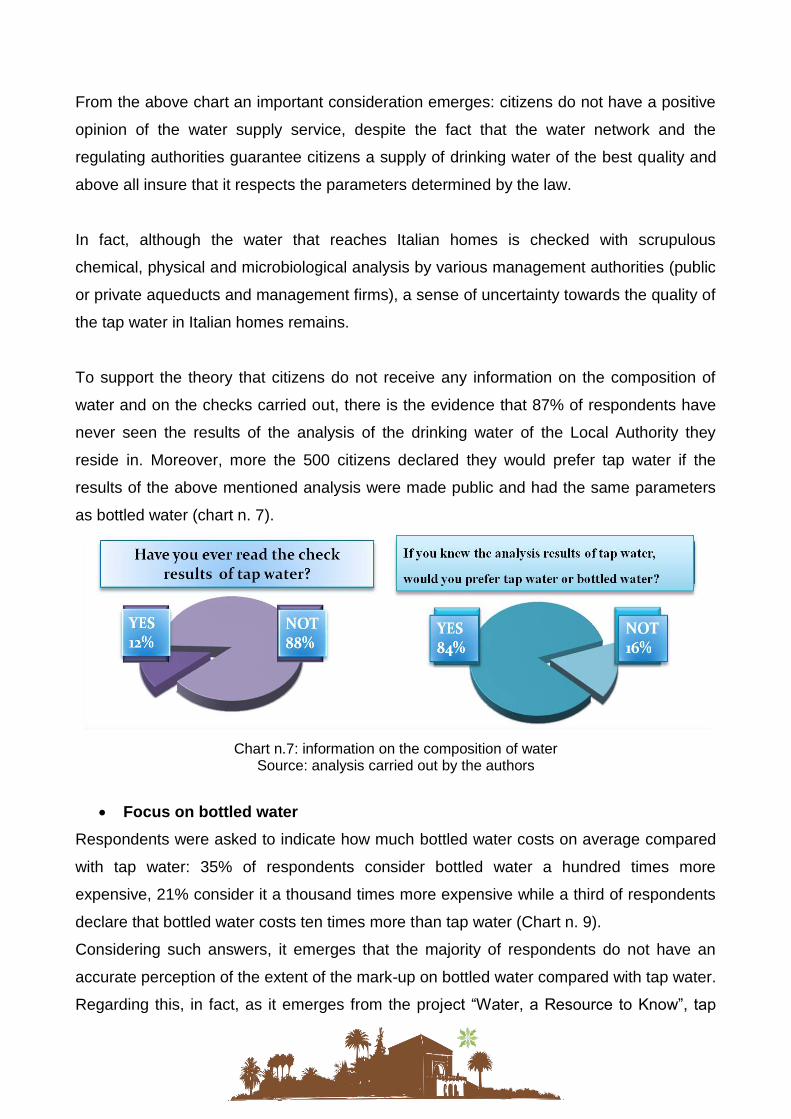
From the above chart an important consideration emerges: citizens do not have a positive
opinion of the water supply service, despite the fact that the water network and the
regulating authorities guarantee citizens a supply of drinking water of the best quality and
above all insure that it respects the parameters determined by the law.
In fact, although the water that reaches Italian homes is checked with scrupulous
chemical, physical and microbiological analysis by various management authorities (public
or private aqueducts and management firms), a sense of uncertainty towards the quality of
the tap water in Italian homes remains.
To support the theory that citizens do not receive any information on the composition of
water and on the checks carried out, there is the evidence that 87% of respondents have
never seen the results of the analysis of the drinking water of the Local Authority they
reside in. Moreover, more the 500 citizens declared they would prefer tap water if the
results of the above mentioned analysis were made public and had the same parameters
as bottled water (chart n. 7).
Chart n.7: information on the composition of water
Source: analysis carried out by the authors
Focus on bottled water
Respondents were asked to indicate how much bottled water costs on average compared
with tap water: 35% of respondents consider bottled water a hundred times more
expensive, 21% consider it a thousand times more expensive while a third of respondents
declare that bottled water costs ten times more than tap water (Chart n. 9).
Considering such answers, it emerges that the majority of respondents do not have an
accurate perception of the extent of the mark-up on bottled water compared with tap water.
Regarding this, in fact, as it emerges from the project “Water, a Resource to Know”, tap
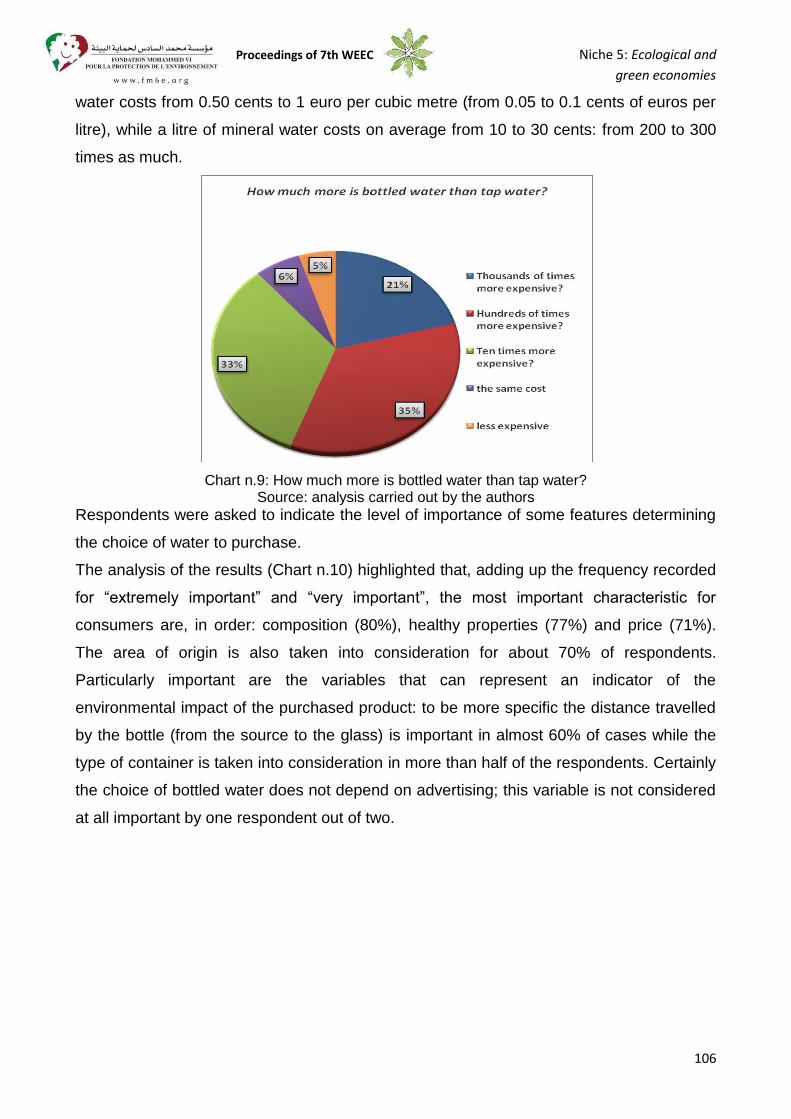
Proceedings of 7th WEEC Niche 5: Ecological and
green economies
106
water costs from 0.50 cents to 1 euro per cubic metre (from 0.05 to 0.1 cents of euros per
litre), while a litre of mineral water costs on average from 10 to 30 cents: from 200 to 300
times as much.
Chart n.9: How much more is bottled water than tap water?
Source: analysis carried out by the authors Respondents were asked to indicate the level of importance of some features determining
the choice of water to purchase.
The analysis of the results (Chart n.10) highlighted that, adding up the frequency recorded
for “extremely important” and “very important”, the most important characteristic for
consumers are, in order: composition (80%), healthy properties (77%) and price (71%).
The area of origin is also taken into consideration for about 70% of respondents.
Particularly important are the variables that can represent an indicator of the
environmental impact of the purchased product: to be more specific the distance travelled
by the bottle (from the source to the glass) is important in almost 60% of cases while the
type of container is taken into consideration in more than half of the respondents. Certainly
the choice of bottled water does not depend on advertising; this variable is not considered
at all important by one respondent out of two.
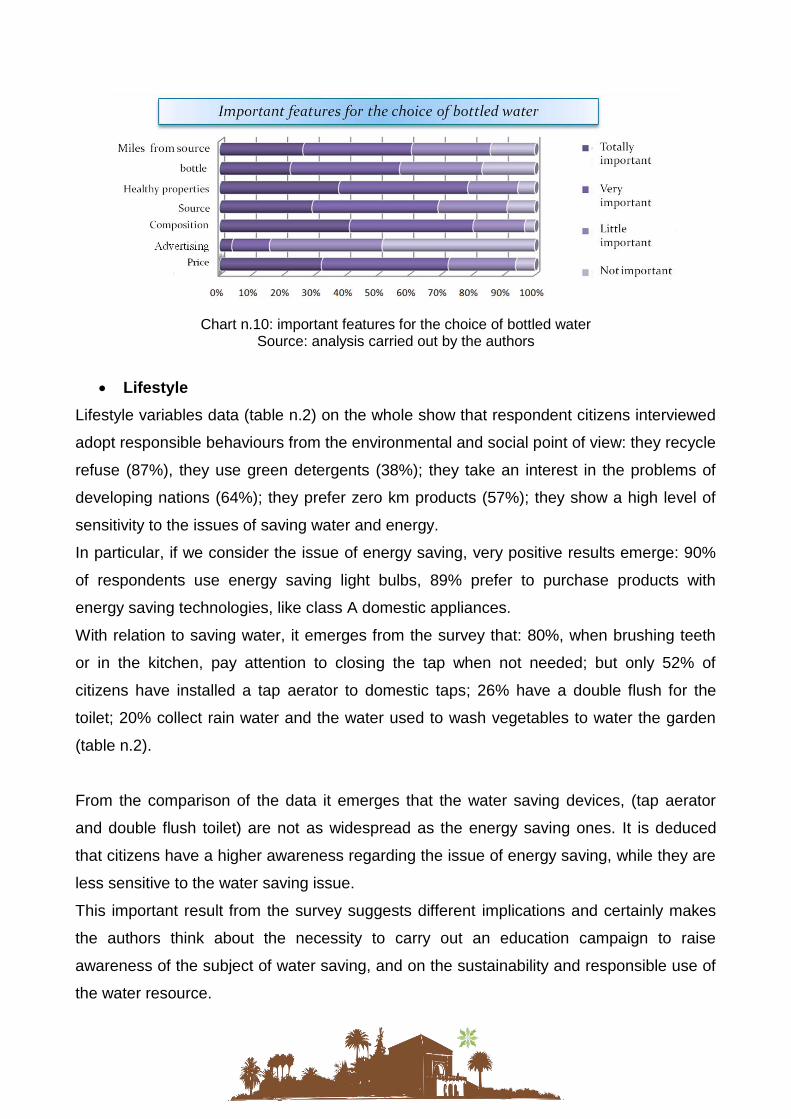
Chart n.10: important features for the choice of bottled water
Source: analysis carried out by the authors
Lifestyle
Lifestyle variables data (table n.2) on the whole show that respondent citizens interviewed
adopt responsible behaviours from the environmental and social point of view: they recycle
refuse (87%), they use green detergents (38%); they take an interest in the problems of
developing nations (64%); they prefer zero km products (57%); they show a high level of
sensitivity to the issues of saving water and energy.
In particular, if we consider the issue of energy saving, very positive results emerge: 90%
of respondents use energy saving light bulbs, 89% prefer to purchase products with
energy saving technologies, like class A domestic appliances.
With relation to saving water, it emerges from the survey that: 80%, when brushing teeth
or in the kitchen, pay attention to closing the tap when not needed; but only 52% of
citizens have installed a tap aerator to domestic taps; 26% have a double flush for the
toilet; 20% collect rain water and the water used to wash vegetables to water the garden
(table n.2).
From the comparison of the data it emerges that the water saving devices, (tap aerator
and double flush toilet) are not as widespread as the energy saving ones. It is deduced
that citizens have a higher awareness regarding the issue of energy saving, while they are
less sensitive to the water saving issue.
This important result from the survey suggests different implications and certainly makes
the authors think about the necessity to carry out an education campaign to raise
awareness of the subject of water saving, and on the sustainability and responsible use of
the water resource.
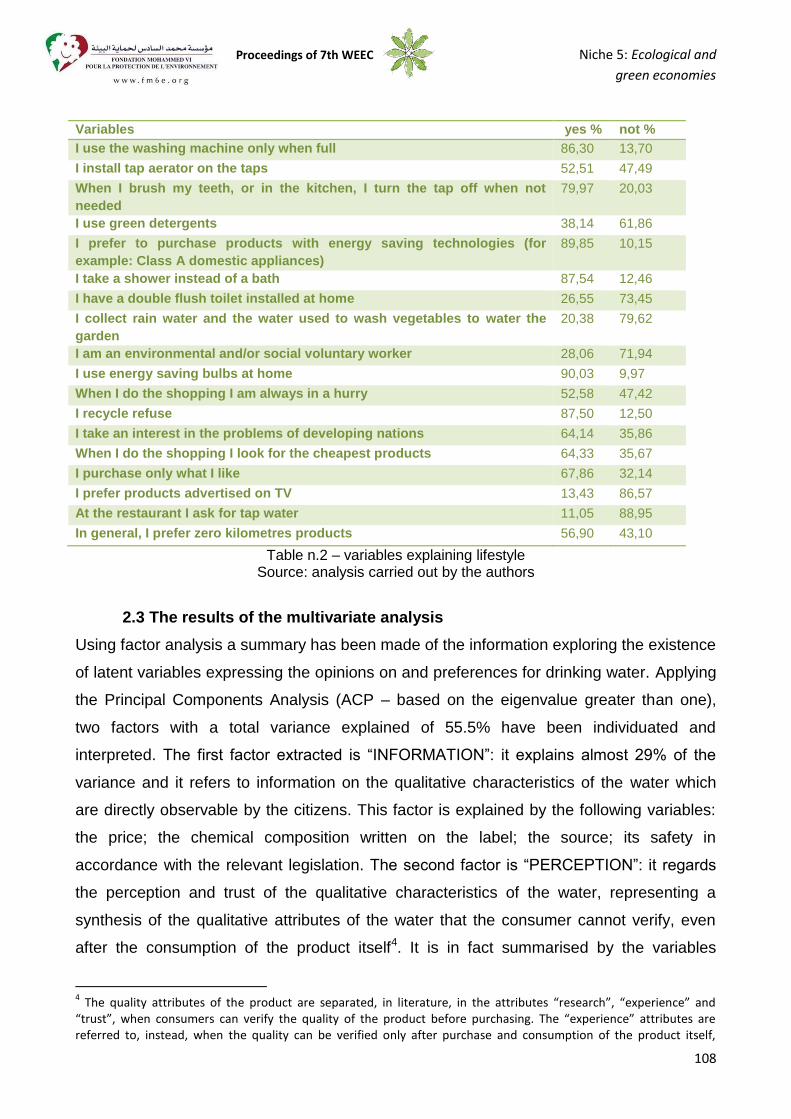
Proceedings of 7th WEEC Niche 5: Ecological and
green economies
108
Variables yes % not % I use the washing machine only when full 86,30 13,70
I install tap aerator on the taps 52,51 47,49
When I brush my teeth, or in the kitchen, I turn the tap off when not needed
79,97 20,03
I use green detergents 38,14 61,86
I prefer to purchase products with energy saving technologies (for example: Class A domestic appliances)
89,85 10,15
I take a shower instead of a bath 87,54 12,46
I have a double flush toilet installed at home 26,55 73,45
I collect rain water and the water used to wash vegetables to water the garden
20,38 79,62
I am an environmental and/or social voluntary worker 28,06 71,94
I use energy saving bulbs at home 90,03 9,97
When I do the shopping I am always in a hurry 52,58 47,42
I recycle refuse 87,50 12,50
I take an interest in the problems of developing nations 64,14 35,86
When I do the shopping I look for the cheapest products 64,33 35,67
I purchase only what I like 67,86 32,14
I prefer products advertised on TV 13,43 86,57
At the restaurant I ask for tap water 11,05 88,95
In general, I prefer zero kilometres products 56,90 43,10
Table n.2 – variables explaining lifestyle Source: analysis carried out by the authors
2.3 The results of the multivariate analysis
Using factor analysis a summary has been made of the information exploring the existence
of latent variables expressing the opinions on and preferences for drinking water. Applying
the Principal Components Analysis (ACP – based on the eigenvalue greater than one),
two factors with a total variance explained of 55.5% have been individuated and
interpreted. The first factor extracted is “INFORMATION”: it explains almost 29% of the
variance and it refers to information on the qualitative characteristics of the water which
are directly observable by the citizens. This factor is explained by the following variables:
the price; the chemical composition written on the label; the source; its safety in
accordance with the relevant legislation. The second factor is “PERCEPTION”: it regards
the perception and trust of the qualitative characteristics of the water, representing a
synthesis of the qualitative attributes of the water that the consumer cannot verify, even
after the consumption of the product itself4. It is in fact summarised by the variables
4 The quality attributes of the product are separated, in literature, in the attributes “research”, “experience” and
“trust”, when consumers can verify the quality of the product before purchasing. The “experience” attributes are referred to, instead, when the quality can be verified only after purchase and consumption of the product itself,
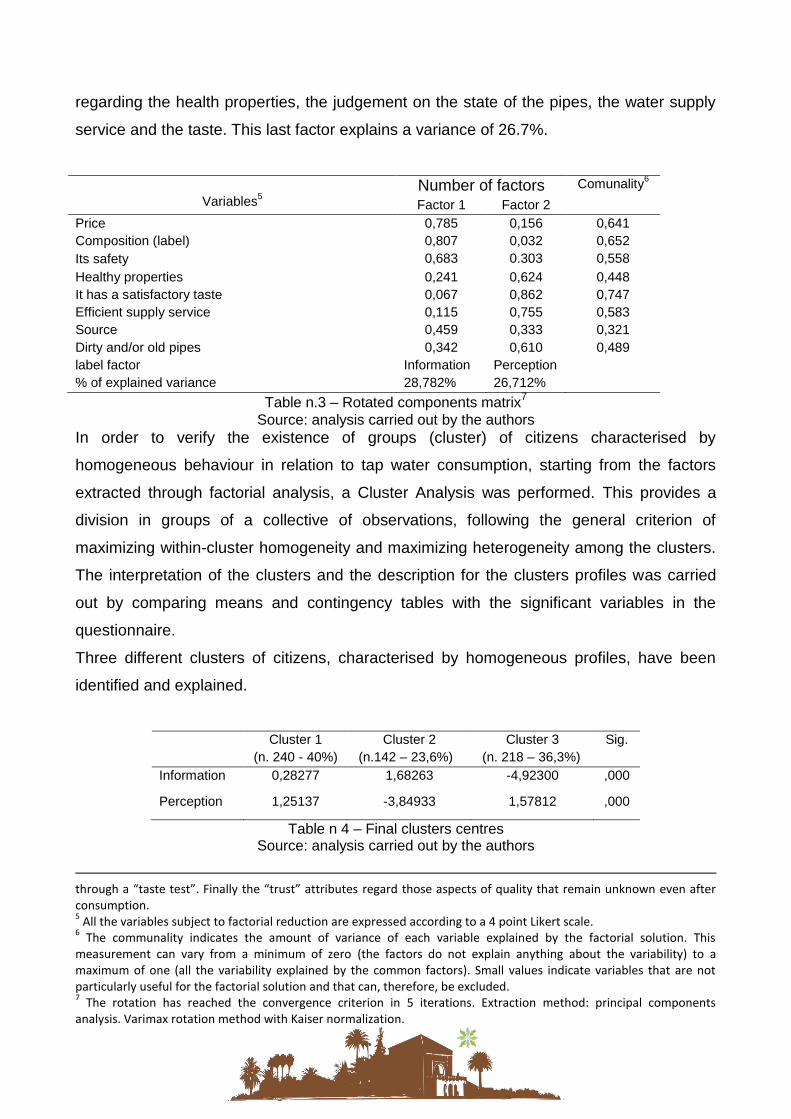
regarding the health properties, the judgement on the state of the pipes, the water supply
service and the taste. This last factor explains a variance of 26.7%.
Variables5
Number of factors Comunality6
Factor 1 Factor 2 Price 0,785 0,156 0,641 Composition (label) 0,807 0,032 0,652 Its safety 0,683 0.303 0,558 Healthy properties 0,241 0,624 0,448 It has a satisfactory taste 0,067 0,862 0,747 Efficient supply service 0,115 0,755 0,583 Source 0,459 0,333 0,321 Dirty and/or old pipes 0,342 0,610 0,489 label factor Information Perception % of explained variance 28,782% 26,712%
Table n.3 – Rotated components matrix7 Source: analysis carried out by the authors
In order to verify the existence of groups (cluster) of citizens characterised by
homogeneous behaviour in relation to tap water consumption, starting from the factors
extracted through factorial analysis, a Cluster Analysis was performed. This provides a
division in groups of a collective of observations, following the general criterion of
maximizing within-cluster homogeneity and maximizing heterogeneity among the clusters.
The interpretation of the clusters and the description for the clusters profiles was carried
out by comparing means and contingency tables with the significant variables in the
questionnaire.
Three different clusters of citizens, characterised by homogeneous profiles, have been
identified and explained.
Cluster 1 (n. 240 - 40%)
Cluster 2 (n.142 – 23,6%)
Cluster 3 (n. 218 – 36,3%)
Sig.
Information 0,28277 1,68263 -4,92300 ,000
Perception 1,25137 -3,84933 1,57812 ,000
Table n 4 – Final clusters centres Source: analysis carried out by the authors
through a “taste test”. Finally the “trust” attributes regard those aspects of quality that remain unknown even after consumption. 5 All the variables subject to factorial reduction are expressed according to a 4 point Likert scale.
6 The communality indicates the amount of variance of each variable explained by the factorial solution. This
measurement can vary from a minimum of zero (the factors do not explain anything about the variability) to a maximum of one (all the variability explained by the common factors). Small values indicate variables that are not particularly useful for the factorial solution and that can, therefore, be excluded. 7 The rotation has reached the convergence criterion in 5 iterations. Extraction method: principal components
analysis. Varimax rotation method with Kaiser normalization.
Proceedings of 7th WEEC Niche 5: Ecological and
green economies
110
Cluster 1 – The Disinterested
The disinterested cluster is the largest, as it includes 40% of the sample. The cluster
includes young people between 31 and 40 years of age (30% of the cases), with a high
level of education (42%) and married (45%). In relation to lifestyle, the disinterested are
characterised by a low degree of involvement in environmental, social and ethical issues
and by a hedonistic component of the question.
The cluster shows scarce information on water consumption in relation to the different
home activities. The disinterested drink bottled water because they believe it is impossible
to drink tap water; to this, in fact, they associate not only a low quality level and a chlorine
smell but also the consideration that the chemical composition of the water is unknown. In
fact the disinterested state not to know which authority carries out the analysis of tap
water. Bottled water is chosen on the bases of source and a real perception of the mark-up
of bottled water compared to tap water is not recorded.
Cluster 2 – The Aware
It is mainly male and makes up about 23% of respondents. This is the only group who
prefers to drink tap water because it is subject to more checks compared to bottled water,
it is always available and of good quality. When purchasing bottled water, the choice is
based mainly on the price.
A high level of attention on saving water completes the cluster's profile: the aware, in fact,
have installed both the double flush toilet and the “tap aerator” on the taps at home.
For the aware, water is a resource to protect. They are characterised both by a correct
perception of water consumption and a good level of information on the issues regarding
tap water. The cluster's profile is completed by a high level of interest in environmental,
social and ethical issues: environmental and/or social voluntary work (51%); use of green
detergents (30%); preference for Zero km products (42%).
Cluster 3 – The sceptical
They represent 36% of respondents. A good percentage are female, from 41 to 60 years
of age. They drink bottled water mainly because they believe it is subject to more checks
and has a better taste (32% and 24% respectively). Moreover, when choosing bottled
water, the cluster is guided mainly by the health properties printed on the label.
The sceptical are characterised by a low level of involvement in the conscious use of the
water resource: they show an incorrect perception of the amounts of water used daily by
the family for the different domestic activities and a scarce knowledge of the activities that
are more relevant for water consumption. Their opinions on tap water are not positive: the
sceptical, in fact, believe that the water supply service is not efficient and also that the
water pipes are old and/or dirty. Regarding lifestyle, this cluster is also characterised by a
higher awareness about energy saving compared to saving water and by a sufficient
interest in voluntary work and environmental, social and ethical issues.
The analysis of the clusters has highlighted the existence of groups of citizens who are
characterized by homogeneous behaviour; each group expressing a particular attitude
towards “the water board”. If the aware group shows a good inclination towards public
water, this is due not only to more information on the checks carried out but also to the
sensitivity to the issue of saving water.
On the other hand, the disinterested are characterised by the indifference to the public
water issue: this indifference is seen both in the lack of interest towards the amounts of
water used and in the purchase of bottled water for reasons we can attribute to habit.
Finally, the cluster of the sceptical expresses a negative opinion of the public water supply
and this is reflected in the scarce attention towards a conscious use of this resource.
In conclusion, it can be stated that “information” and “perception” represent the key word to
make citizens aware of the fact that the protection of water resources represents an ethical
value and the consumption of the same has to respond to responsibility criteria.
3. Drink water in campania
Italy imposes precise limits in defining drinking water, or water destined for human
consumption. These limitations regard a series of parameters, reported in “attachment I
parts A and B, of Dlgs 31/2001”. Only by analysing the water it is possible to ascertain the
actual respect of the limitations imposed and therefore the potability of the water.
The same decree defines, in article 2, as water destined for human consumption: water
treated or not treated, destined to be drank, for the preparation of food and drink, or for
other domestic uses, regardless of its source, being provided through a distribution
network, tankers, in bottle or containers; […]
Proceedings of 7th WEEC Niche 5: Ecological and
green economies
112
Article 4, instead, defines the general obligations connected with the distribution of water
destined for human consumption: the water destined for human consumption has to be
safe and clean, must not contain micro organisms and parasites nor other substances, in
quantities or concentrations that constitute a potential danger for human health, apart from
that established by articles 13 and 16, it has to satisfy the minimum requirements in parts
A and B of the attachment I; it has to comply with that established in the provisions
adopted in article 14, clause 1 […]
The law states that water destined for human consumption is safe if it does not contain
micro organisms and parasites, nor other substances in quantities or concentrations that
constitute a potential danger for health, satisfy the minimum requirements specified by
microbiological and chemical parameters, comply with the indicator parameters. In general
the main sources of water contamination are represented by: deterioration during water
treatment and distribution or release of substances by pipes and/or tanks; release of
substances by natural geological sediments; industrial pollution; anthropogenic factors.
The legislation in force in Italy regarding the quality of the water destined for human
consumption guarantees, in fact, deep and frequent checks on the 62 parameters of
physical, chemical and bacteriological quality indicated to define its potability, the limit
values of which, established to protect health, have been identified based on the World
Health Organisation recommendations. To guarantee more transparency and safeguards
for the citizens, there are by law two types of checks: one carried out by the “integrated
water service agency” and one by the “local health authority” (ASL) in collaboration with
the regional environmental protection agencies, with expertise in the area.
In Campania the agencies in charge of checking water quality do not efficiently publicize
the results of the checks to its citizens. In order to have analysis and data on the quality of
tap water available in the province of Caserta, a direct analysis has been carried out in 20
different areas of the province.
3.1 Investigation into the quality of drinking water in the province of caserta.
This part of the TVB research is focused on the quality of tap water in 20 local authorities
in the province of Caserta using the six-sigma. Considering that the direct survey has
highlighted citizens' lack of trust in the checks carried out by the appointed bodies,
Legambiente have acquired independent data: thanks to the co-operation of the company
SEA, in February 2011 n.20 samples have been collected and analysed. SEA confirms
that the parameters analysed are within the limits of the law.
Legambiente have identified:
- 2 distinct macro-areas (high and low SoV1);
- 2 types of sub-areas (major – minor urbanization SoV2) for a total of 4, and have
selected, for each sub-area;
- 5 local authorities in which a sample from domestic or public taps has been collected
(SoV3).
To weigh the variability of instant sampling/samples, 50% of SEA parameters have been
compared with the respective values released by ARPAC, available since 2009: the SPC
result (stable, predictable and consistent) proves a statistically expected, normal variability
(I-MR charts methods). In order to use only parameters that the two labs have analysed in
a “similar” way, the MSE (measurement system evaluation methods) of ARPAC vs Sea-
Legambiente results it has excluded non acceptable differences (2009 vs 2011).
Overall, the results of the analysis 2009 vs 2011 per macro-areas do not show differences,
apart from the anionic component, which shows a decrease (trend) in concentrations in the
local authorities of area 4 (Aversana-Atellana): these values are on average, halved. The
software (minitab ver15) indicates as discriminant indicators: calcium, chlorides, sulphates,
nitrates, potassium, sodium, hardness and total trihalomethanes. We use box-plot
diagrams for a graphic synthesis of the evaluations.
In the boxes the concentrations of 5 local authorities in the different 4 macro-areas are
compared, the results that can be partially aggregated are ringed separately:
- chlorides: area 2, Cancello e Arnone nearly three times the average; area 3, S. Nicola La
Strada nearly 4 times the average;
- sodium: area 2, Cancello e Arnone nearly four times the average; area 3, S. Nicola la
Strada nearly three times the average;
- sulphates: area 3, S. Nicola la Strada nearly double the average; for the nitrates: area 2,
Sessa Aurunca, concentration nearly three times the average;
- potassium: anomaly of macro-area 3 vs 4;
- arsenic: macro-area 2, Villa Literno below the limit of reversibility and Sessa Aurunca
with a value of 1.5 times higher.
The software suggests a comparison between Arpa data against SEA data for two
indicators: hardness and sulphates. Clustering the data in local authority – year – macro-
area, the visual perception (trend) is increasing from 1 as opposed to 4.
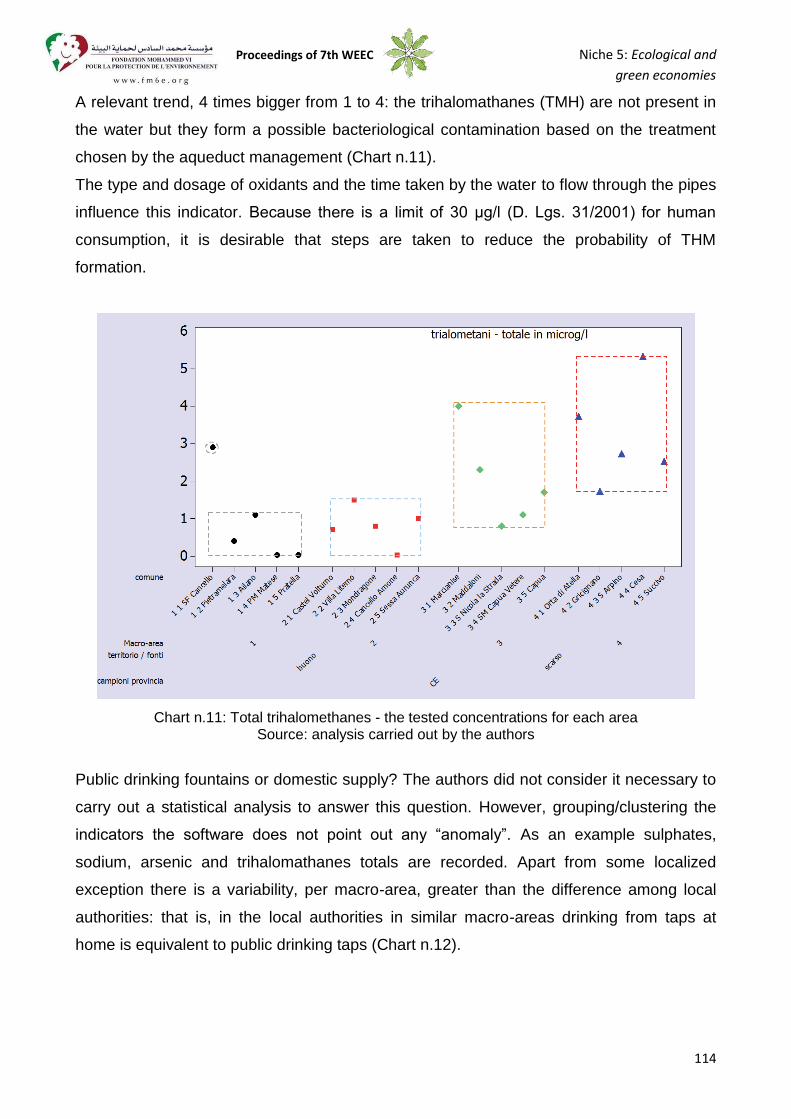
Proceedings of 7th WEEC Niche 5: Ecological and
green economies
114
A relevant trend, 4 times bigger from 1 to 4: the trihalomathanes (TMH) are not present in
the water but they form a possible bacteriological contamination based on the treatment
chosen by the aqueduct management (Chart n.11).
The type and dosage of oxidants and the time taken by the water to flow through the pipes
influence this indicator. Because there is a limit of 30 μg/l (D. Lgs. 31/2001) for human
consumption, it is desirable that steps are taken to reduce the probability of THM
formation.
Chart n.11: Total trihalomethanes - the tested concentrations for each area
Source: analysis carried out by the authors
Public drinking fountains or domestic supply? The authors did not consider it necessary to
carry out a statistical analysis to answer this question. However, grouping/clustering the
indicators the software does not point out any “anomaly”. As an example sulphates,
sodium, arsenic and trihalomathanes totals are recorded. Apart from some localized
exception there is a variability, per macro-area, greater than the difference among local
authorities: that is, in the local authorities in similar macro-areas drinking from taps at
home is equivalent to public drinking taps (Chart n.12).
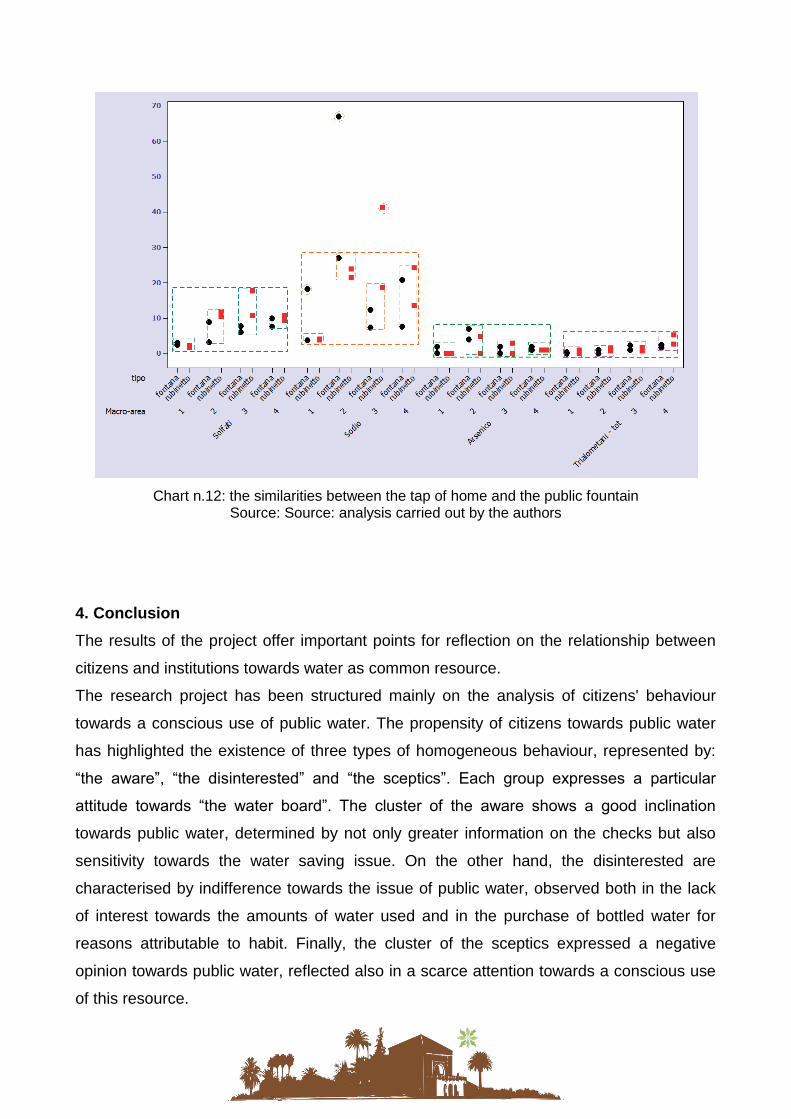
Chart n.12: the similarities between the tap of home and the public fountain
Source: Source: analysis carried out by the authors
4. Conclusion
The results of the project offer important points for reflection on the relationship between
citizens and institutions towards water as common resource.
The research project has been structured mainly on the analysis of citizens' behaviour
towards a conscious use of public water. The propensity of citizens towards public water
has highlighted the existence of three types of homogeneous behaviour, represented by:
“the aware”, “the disinterested” and “the sceptics”. Each group expresses a particular
attitude towards “the water board”. The cluster of the aware shows a good inclination
towards public water, determined by not only greater information on the checks but also
sensitivity towards the water saving issue. On the other hand, the disinterested are
characterised by indifference towards the issue of public water, observed both in the lack
of interest towards the amounts of water used and in the purchase of bottled water for
reasons attributable to habit. Finally, the cluster of the sceptics expressed a negative
opinion towards public water, reflected also in a scarce attention towards a conscious use
of this resource.
Proceedings of 7th WEEC Niche 5: Ecological and
green economies
116
From the survey, however it emerged that “information” and “perception” are the key
features to make citizens aware that the protection of water resources represents an
ethical value and the consumption of the same has to answer to the standards of
responsibility. When choosing to use tap water the results are more significantly based on
what citizens perceive empirically, that is based on the senses and sensations, regardless
of analytical information of the water characteristics, which were found to be made more or
less available to them. A particularly important result, in fact, is shown by the answers to
the questionnaire on “what type of water people prefer to drink” and on “why people prefer
bottled water or tap water”. The strong prevalence of the use of bottled water (preferred by
83% of the sample) resulted to be essentially the consequence of the presumption,
deriving indeed from empirical evaluations, that it is subject to more checks and therefore
safer. In fact the turbidity, the colour, the smell and the taste, the so called organoleptic
characteristics of water, when present and undesired, even if only occasionally (like, for
example, when doing maintenance on the pipework), are considered among the main
factors that make citizens suspicious of tap water. This dispels the myth that heavy
advertising by the producers of bottled water is able to make people prefer it over tap
water, while it is more plausible to think that advertising can mainly influence the choice of
a specific brand compared to others, when it is the only alternative to tap water that
presents (even occasionally) undesired organoleptic characteristics.
What is necessary, therefore, to counter the established bad habits, is on one hand to start
an information and sensitisation campaign to make known the characteristics of tap water
and the techniques and behaviour to use it in a responsible way, on the other to
operationalize the Integrated Water Services, so that the necessary investments in
infrastructures and management can be made, thus allowing an improvement in the taste
of the tap water.
References
Bianchi D., Conte G. (2012). Acqua: bene comune, responsabilità di tutti. Milano IT.
Edizioni Ambiente.
Ciafani S., Zampetti G.,Buonauro G. (2008). Un Paese in bottiglia. Roma IT:
Legambiente
Istituto Nazionale di Statistica (2013). Noi Italia, 100 statistiche per capire il Paese
in cui viviamo, Retrieved from http://noi-italia.istat.it/
Martinelli L. (2010) L’acqua è una merce. Milano. IT: Altraeconomia
Martinelli L. (2011). Imbrocchiamola! Dal rubinetto alle minerali, piccola guida al
consumo critico dell'acqua. Milano. IT: Altraeconomia
Musolesi A., Nosvelli M. (2004). Domanda e stili di consumo, dell'acqua domestica:
un'analisi econometrica su dati Panel comunali. Economia delle fonti di energia e
dell’ambiente, 55, 115 - 138.
Pascale P. (2011). “Ti Voglio Bere”. Stili di consumo e qualità dell’acqua di ribinetto
nella provincia di Caserta”. Retrieved from
http://issuu.com/geofilos/docs/tvb_ti_voglio_bere_legambientegeofilos_caserta
Zampetti G., Mancini M., e Verardi F., Martinelli L., Raitano P. (2013). Acque in
bottiglia, un’imbarazzante storia all’italiana. Retrieved from
http://www.legambiente.it/contenuti/dossier/il-business-delle-acque-bottiglia
Proceedings of 7th WEEC Niche 5: Ecological and
green economies
118
Socioenvironmental diagnosis with small familiar farmers
Perception about the socioenvironmental problems in Guarani Aquifer’s recharge
area
André Santachiara Fossaluza, School of Sciences, Bauru campus, Unesp; Maria de
Lourdes Spazziani, Department of Education, Institute of Biosciences, Botucatu campus,
Unesp
Abstract
Guarani Aquifer in Botucatu/SP, Brazil is an area with socioenvironmental problems. The
project “Giant Guarani” (Gigante Guarani) was created to overcome them. In its first steps,
a study on Environmental Education with familiar farmers was conducted to discover the
socioenvironmental problems using the focal group methodology to interview the people.
The problems are siltation of the rivers, decrease in water quality and level, losses in
riparian forests, expansions of monocultures and others. Next actions must provide
educational support to help the farmers’ facing the problems.
Introduction
This work is part of a bigger project named “Giant Guarani” (Gigante Guarani, in
Portuguese), organized by a net a coworkers in the region of Botucatu/SP, Brazil. It had
the environmental education as its basis and focused on rural communities, a public
school and in the surrounding communities.
We based our work on a concept of environmental education to sustainability, which has
risen in neoliberal and consumerist society based on an infinite material development
which depredates the environment in all its parts (biological, cultural, political, economical
and ethical) (Gonçalves, 2007). Thus, the environmental education may be defined as
permanent process of learning based of the respect to all forms of life and that affirms
values and actions which contribute to the human and social transformation and to the
ecological conservation, stimulating the building of socially fair and ecologically balanced
societies which preserve the relation of interdependency and diversity (NGOs’
International Forum, 1992).
Tozoni-Reis (2006) brought a history of the therm. According to this work, a key moment to
the environmental education to sustainability is the “Treaty on Environmental Education for
Sustainable Societies and Global Responsibility”, created at the NGOs’ International
Forum in 1992, event that happened in parallel with the United Nations Conference on
Environment and Development (Eco-92). The Treaty brings a definition which contrasts to
the one of education to sustainable development:
“We consider that environmental education for equitable sustainability is a continuous
learning process based on respect for all life. Such education affirms values and actions
which contribute to human and social transformation and ecological preservation. It fosters
ecologically sound and equitable societies that live together in interdependence and
diversity. This requires individual and collective responsibility at local, national and
planetary level.”
(NGOs’ International Forum, 1992)
Based on that, we aimed to conduct a socioenvironmental diagnosis by mapping the
subjects’ perception on land use and occupation, native vegetation and their housing
areas. This was essential to plan decisions to guide the actions that will happen hereafter
in the project. The identification of the subjects’ perception upon the environment they live
is essential to take decisions in such a project.
Material and methods
The area of the work has a great importance to Brazil because of the Aquifer Guarani. This
aquifer, focus of the project, is one of the largest water reservoirs worldwide and lies
beneath the surface in Brazil, Paraguay, Uruguay and Argentina (Figure 1). It covers
1,200,000 km², with a volume of about 40,000 km³, a thickness of between 50 m and 800
m and a maximum depth of about 1,800 m. The project happened in rural communities
along the Alambari and Capivara Rivers, located in Botucatu/SP and Anhembi/SP, an
important aquifer’s recharge area.
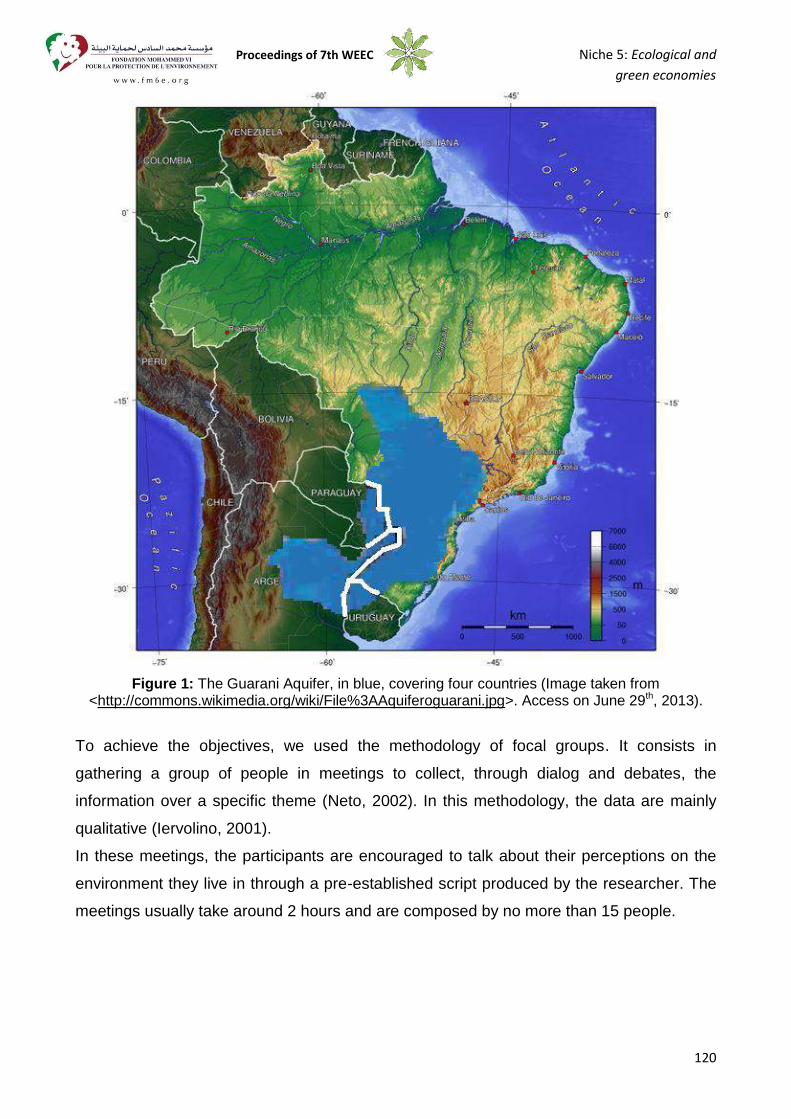
Proceedings of 7th WEEC Niche 5: Ecological and
green economies
120
Figure 1: The Guarani Aquifer, in blue, covering four countries (Image taken from
<http://commons.wikimedia.org/wiki/File%3AAquiferoguarani.jpg>. Access on June 29th, 2013).
To achieve the objectives, we used the methodology of focal groups. It consists in
gathering a group of people in meetings to collect, through dialog and debates, the
information over a specific theme (Neto, 2002). In this methodology, the data are mainly
qualitative (Iervolino, 2001).
In these meetings, the participants are encouraged to talk about their perceptions on the
environment they live in through a pre-established script produced by the researcher. The
meetings usually take around 2 hours and are composed by no more than 15 people.
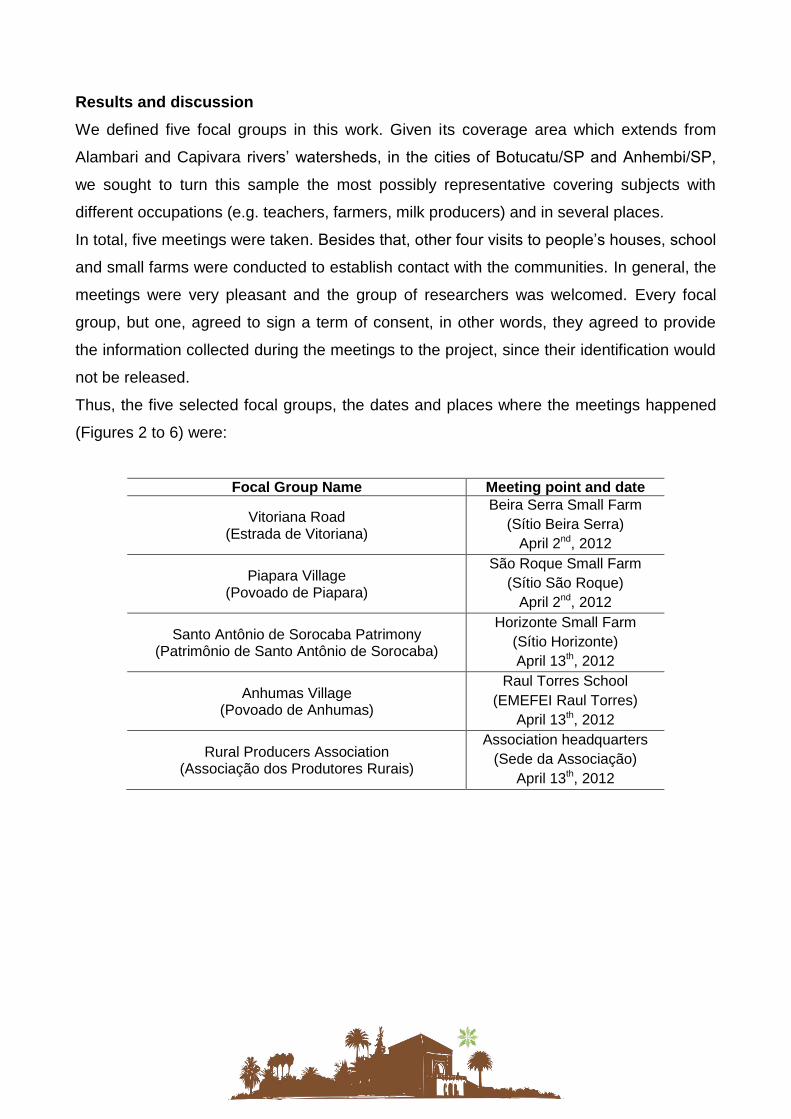
Results and discussion
We defined five focal groups in this work. Given its coverage area which extends from
Alambari and Capivara rivers’ watersheds, in the cities of Botucatu/SP and Anhembi/SP,
we sought to turn this sample the most possibly representative covering subjects with
different occupations (e.g. teachers, farmers, milk producers) and in several places.
In total, five meetings were taken. Besides that, other four visits to people’s houses, school
and small farms were conducted to establish contact with the communities. In general, the
meetings were very pleasant and the group of researchers was welcomed. Every focal
group, but one, agreed to sign a term of consent, in other words, they agreed to provide
the information collected during the meetings to the project, since their identification would
not be released.
Thus, the five selected focal groups, the dates and places where the meetings happened
(Figures 2 to 6) were:
Focal Group Name Meeting point and date
Vitoriana Road (Estrada de Vitoriana)
Beira Serra Small Farm (Sítio Beira Serra)
April 2nd, 2012
Piapara Village (Povoado de Piapara)
São Roque Small Farm (Sítio São Roque)
April 2nd, 2012
Santo Antônio de Sorocaba Patrimony (Patrimônio de Santo Antônio de Sorocaba)
Horizonte Small Farm (Sítio Horizonte) April 13th, 2012
Anhumas Village (Povoado de Anhumas)
Raul Torres School (EMEFEI Raul Torres)
April 13th, 2012
Rural Producers Association (Associação dos Produtores Rurais)
Association headquarters (Sede da Associação)
April 13th, 2012
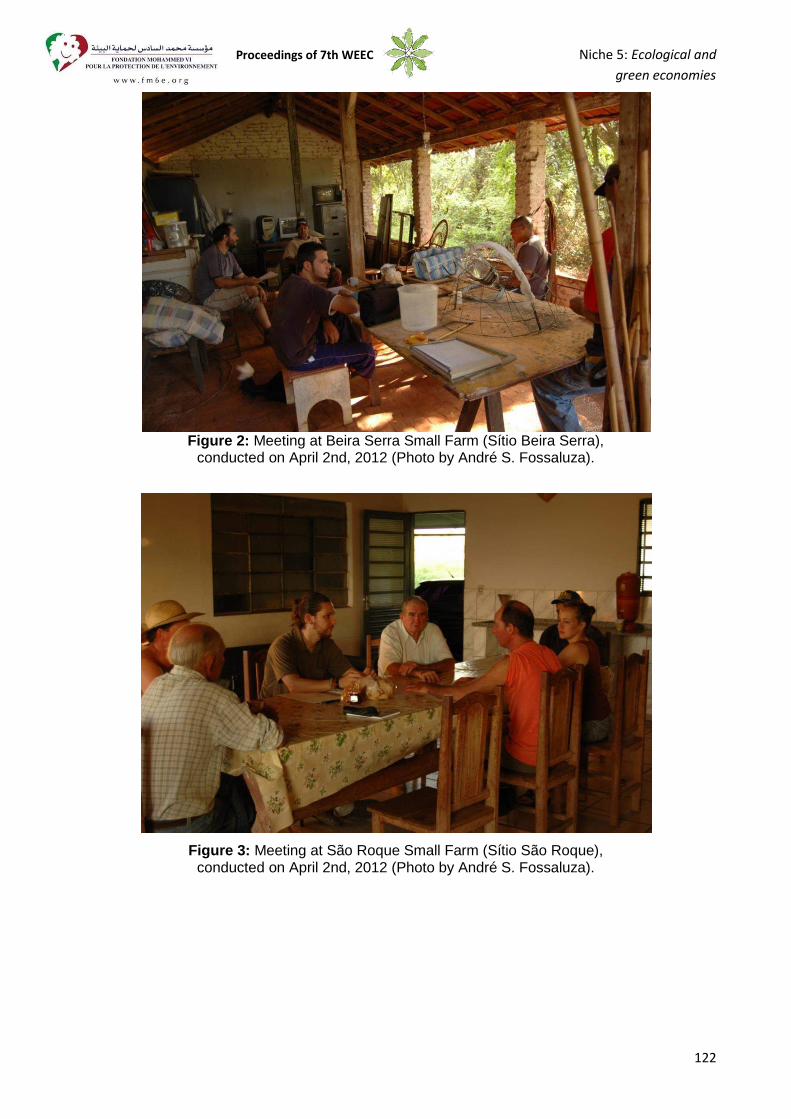
Proceedings of 7th WEEC Niche 5: Ecological and
green economies
122
Figure 2: Meeting at Beira Serra Small Farm (Sítio Beira Serra),
conducted on April 2nd, 2012 (Photo by André S. Fossaluza).
Figure 3: Meeting at São Roque Small Farm (Sítio São Roque),
conducted on April 2nd, 2012 (Photo by André S. Fossaluza).
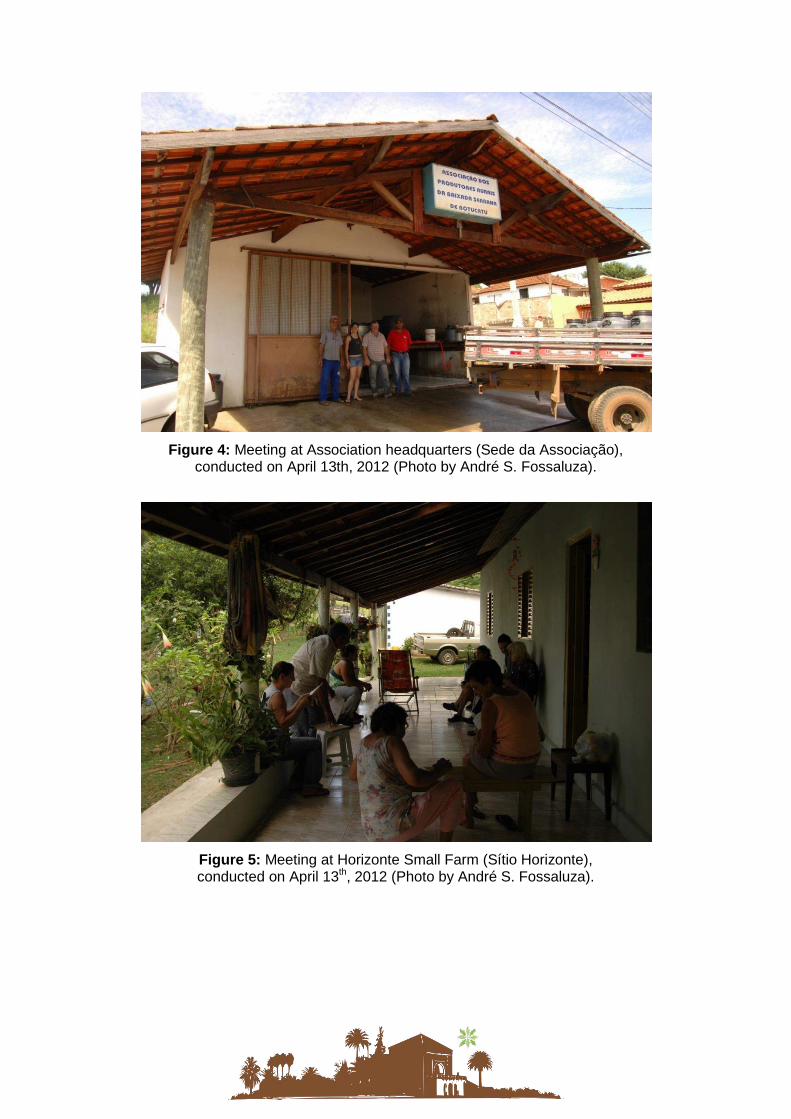
Figure 4: Meeting at Association headquarters (Sede da Associação),
conducted on April 13th, 2012 (Photo by André S. Fossaluza).
Figure 5: Meeting at Horizonte Small Farm (Sítio Horizonte), conducted on April 13th, 2012 (Photo by André S. Fossaluza).
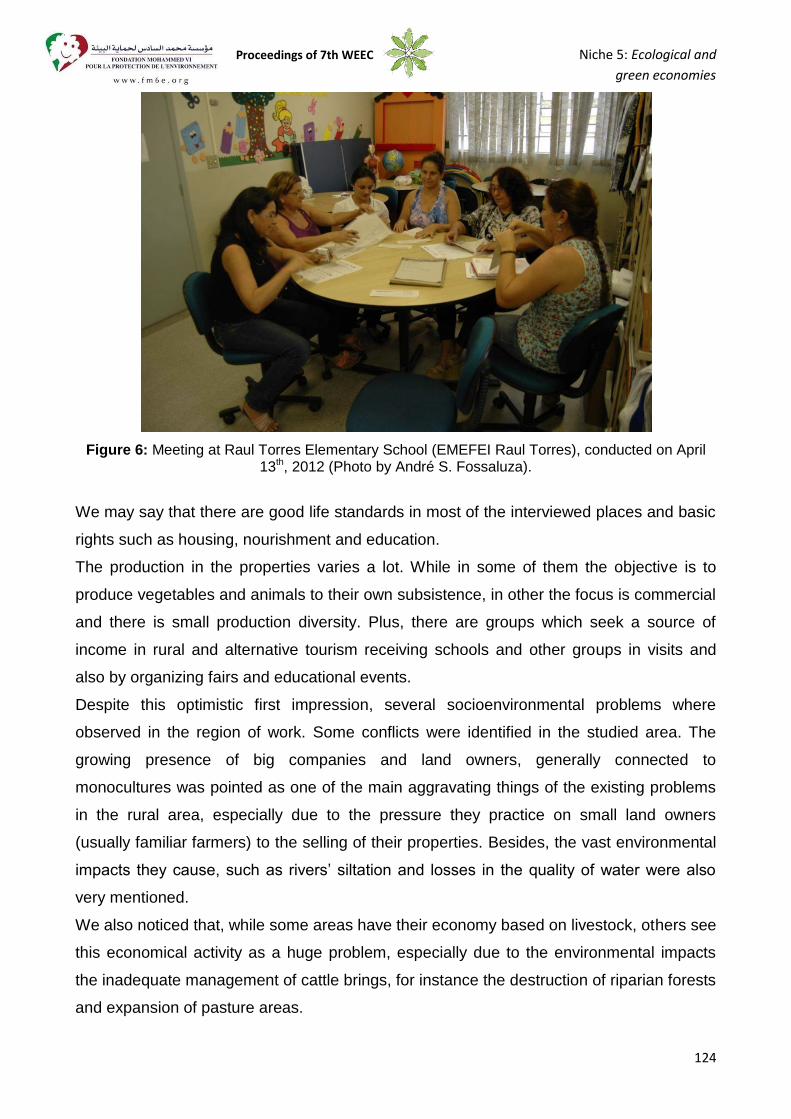
Proceedings of 7th WEEC Niche 5: Ecological and
green economies
124
Figure 6: Meeting at Raul Torres Elementary School (EMEFEI Raul Torres), conducted on April
13th, 2012 (Photo by André S. Fossaluza).
We may say that there are good life standards in most of the interviewed places and basic
rights such as housing, nourishment and education.
The production in the properties varies a lot. While in some of them the objective is to
produce vegetables and animals to their own subsistence, in other the focus is commercial
and there is small production diversity. Plus, there are groups which seek a source of
income in rural and alternative tourism receiving schools and other groups in visits and
also by organizing fairs and educational events.
Despite this optimistic first impression, several socioenvironmental problems where
observed in the region of work. Some conflicts were identified in the studied area. The
growing presence of big companies and land owners, generally connected to
monocultures was pointed as one of the main aggravating things of the existing problems
in the rural area, especially due to the pressure they practice on small land owners
(usually familiar farmers) to the selling of their properties. Besides, the vast environmental
impacts they cause, such as rivers’ siltation and losses in the quality of water were also
very mentioned.
We also noticed that, while some areas have their economy based on livestock, others see
this economical activity as a huge problem, especially due to the environmental impacts
the inadequate management of cattle brings, for instance the destruction of riparian forests
and expansion of pasture areas.
Furthermore, we also identified the following socioenvironmental problems in the region:
- Absence of correct treatment of human manure;
- Discontinuity of the project in rural extension;
- Reduction of the water level in water bodies;
- Rural exodus, especially in young people;
- Population aging;
- Expansion of monocultures (especially sugarcane, eucalyptus, pine trees and oranges);
- Expansion of pastures and cattle;
- Lack of financing and technical support to agroecology;
- Complicated environmental laws which do not support small familiar farmers;
- Bad conditions of the roads;
- Inappropriate waste management in urban communities that surround the rural area;
- Progressive loss of riparian forests;
- Fires;
- Inappropriate use of agrochemical substances.
Although the region is quite diverse and large, water is constant problem and is related to
a plenty of other points. Even knowing Guarani Aquifer was not directly cited on the
interviews, its and other water bodies’ conservation is perceived as one of essential
objectives to the inhabitants. The emotional connection they have with river and streams is
very strong and deep and their growing degradation, especially after the 1970’s, has
brought a lot of concern to the population.
The siltation of water bodies and the loss in the quality of water were the major mentioned
and are directly attached to the losses in the volume of water and riparian forests.
According to the interviewed population, the main responsible for this scenario is the
expansion of large monoculture properties, especially the plantations of eucalyptus, pine
tree, sugarcane and oranges, which have not respected the boundaries established by the
environmental laws and have consumed high amounts of water. The absence of adequate
treatment to human manure and the lack of policies to install treatment and collecting
devices is another item mentioned that is linked to the theme water.
The presence of large properties in the surrounding area was also related to the
indiscriminate use of agrochemical substances, population aging and to rural exodus, this
especially observed in young people. According to the participants, the big land owners
are main responsible for the use of agrochemical substances once small familiar farmers
prefer not to use them due to their damage to the environment and human health.
Proceedings of 7th WEEC Niche 5: Ecological and
green economies
126
Besides, the pressure these big land owners produce has caused a growing exodus of
young people from the rural area, mainly because of the purchasing of ancient small
familiar lands or by the recruitment of workforce to work in the monocultures. Attracted by
the offers of better incomes and disillusioned by the hard conditions they would have to
face in small farms, just a few young people still live in the rural area currently.
Another problem mentioned by the participant was the environmental legislation which is
considered hard to comprehend and interpret. Moreover, it was classified as to tough to
small familiar farmers, who have not received adequate technical assistance to provide the
correct management of their properties. Many of the farmers also said the focus of the
supervision conducted by the environmental police is not correct, since most of the
environmental problems are caused by big land owners, who have rarely paid for the evils
they have caused.
Other punctual problems were mentioned, such as the discontinuity of rural extension
projects and the lack of financing and technical assistance to the agroecological transition.
In accordance with some of the interviewed people (especially the ones that firstly resisted
to join the project), a lot of activities developed by non-governmental organization (NGOs)
or even by public universities have the serious problem of discontinuity and lose the
opportunities to bring solutions to the rural area. They mentioned situations when the
researchers collected information with the community but never came back to present the
results or suggest improvements to the life standards.
The fires were said to be a big problem in only one of the interviewed groups. However,
we suggest they may be studied more carefully once they have happened more frequently
lately. This has brought some prejudices to the production and to the recovery of native
forests.
The bad condition of the rural road and inadequate waste management in the surrounding
urban communities were also noticed as problems and show the increasing relations
between urban and rural areas, which need to be better studied and conducted.
Although some things were not mentioned by the interviewed people, some situations
need to be better analyzed, such as the inexistence of rural schools, closed after the
expansion of scholar buses used to take the children and teenagers from their houses to
schools in the urban area. This may be linked to the growing rural exodus of young people,
once they suffer a lot of influence of cosmopolitan habits and traditions and lose the
affective connection to their families’ beliefs.
When the theme of the interviews was the Guarani Aquifer, we perceived, in general, a
superficial knowledge which did not connected the activities developed in the properties to
the its conservation. Despite that, when the interviewed people received some information
about the aquifer and its importance from the researchers they showed big enthusiasm
and wanted to comprehend more it dynamics and extension and also would like to know
which actions should be taken to improve its quality and conservation.
So, we may now say the next step of the Project “Giant Guarani” must have the
environmental education as a guiding axis by bringing scientific knowledge about the
aquifer to the inhabitants of by the construction of a critical consciousness which allows
them to face the socioenvironmental problems presented.
Finally, the project must seek the planning of continuous actions with the small familiar
farmers, public basic schools which receive the population from the rural area and also
with big land owners and companies. To guide these future actions and provide a better
and easier comprehension of the socioenvironmental problems analyzed and the
connections among them, we suggest the use of the following conceptual guide:
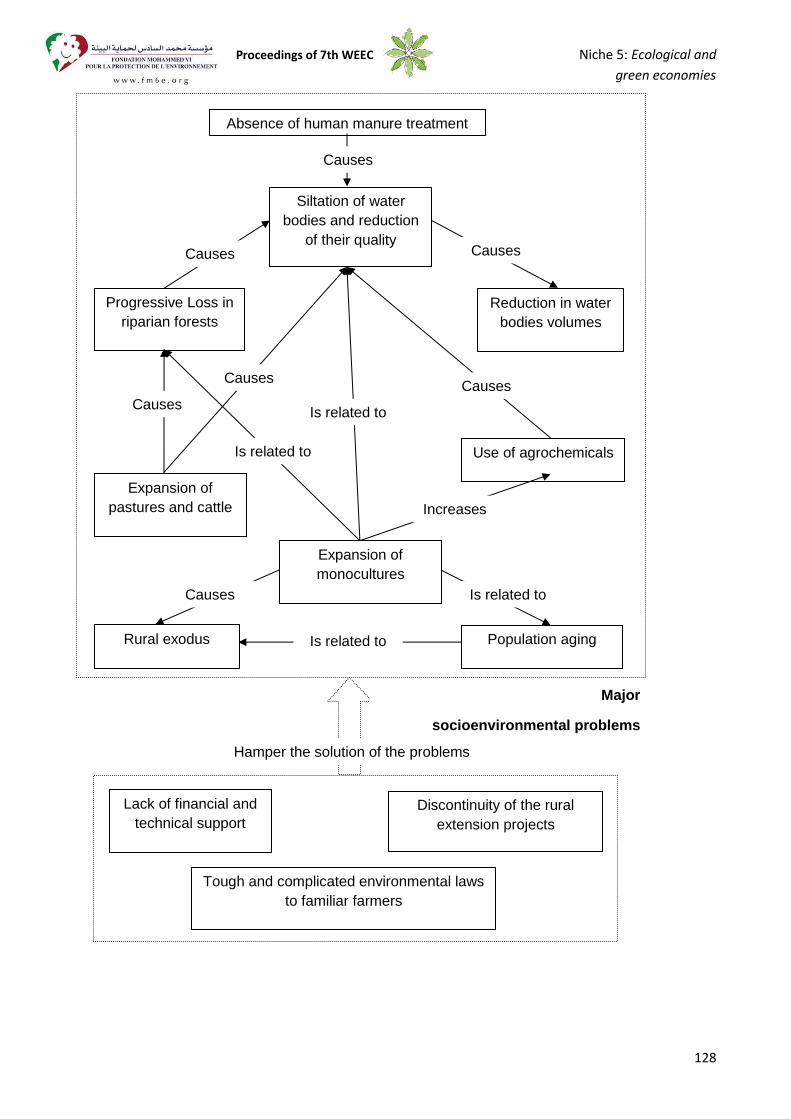
Proceedings of 7th WEEC Niche 5: Ecological and
green economies
128
Absence of human manure treatment
Siltation of water bodies and reduction
of their quality
Progressive Loss in riparian forests
Reduction in water bodies volumes
Expansion of pastures and cattle
Use of agrochemicals
Expansion of monocultures
Rural exodus Population aging
Causes
Causes Causes
Causes
Causes
Causes
Is related to
Increases
Is related to
Causes Is related to
Is related to
Lack of financial and technical support
Discontinuity of the rural extension projects
Tough and complicated environmental laws to familiar farmers
Hamper the solution of the problems
Major
socioenvironmental problems
Conclusion
With the data we collected, we may now say the project must plan continuing actions with
small familiar farmers, public schools and also big land owners to have some success.
We also conclude that the situation of the region is quite complex and requires a lot of
attention. The subject’s perceptions on the environment they live in are mostly negative
and their perspectives to the future are not good. Besides that, the little knowledge about
the aquifer brigs the need to perform works in environmental education with these farmers
and the other subjects who play an important role in the region.
Bibliographic References
IERVOLINO, S.A. & PELICIONI, M.C.F. (2001). A utilização do grupo focal como
metodologia qualitativa na promoção da saúde. Revista da Escola de Enfermagem
da USP, v. 35, n.2, p.115-21, jun, 2001.
NETO, O.C., MOREIRA, M.R. & SUCENA, L.F.M. (2002). Grupos Focais e
Pesquisa Social Qualitativa: o debate orientado como técnica de investigação.
Proceedings from XIII Encontro da Associação Brasileira de Estudos
Populacionais. Ouro Preto, Minas Gerais, Brasil.
NGOs’ International Forum. Treaty on Environmental Education for Sustainable
Societies and Global Responsibility. (1992). Retrieved from:
http://www.stakeholderforum.org/fileadmin/files/Earth_Summit_2012/1992_treaties/
Treaty_on_Environmental_Education_for_Sustainable_Societies_and_Global_Resp
onsibility.pdf.
TOZONI-REIS, M.F.C. (2006) Temas ambientais como “temas geradores”:
contribuições para uma metodologia educativa ambiental crítica, transformadora e
emancipatória. Educar, Curitiba, n. 27, p. 93-110.
Proceedings of 7th WEEC Niche 5: Ecological and
green economies
130
La imagen acerca de la sostenibilidad/insostenibilidad en empresas de
economía social
Estudio de ideas previas
Chiara Scalabrino, Universidad de Cádiz - José Mª Oliva, Departamento de Didáctica de
las Ciencias, Facultad de CC. de la Educación, Universidad de Cádiz
RESUMEN
Hay numerosos e interconectados problemas socio-económico-ambientales y a pesar de
que se hable de “problemáticas ambientales” oficialmente desde 1962, de “limites del
desarrollo” desde 1972, de “desarrollo sostenible” desde 1987, se ha avanzado poco
hacia un modelo de producción y consumo más sostenible.
Premiso esto, visto que la difusión del consumo responsable depende también de la
disponibilidad en el mercado de bienes y servicios diseñados para prevenir y reducir sus
impactos sociales y ambientales, hemos enfocado el estudio sobre el rol de la empresa en
el perseguimiento de la sostenibilidad.
Desde esta perspectiva los esfuerzos del sector privado en España se podrían resumir en
el balance de casi una década de difusión de la filosofía de la Responsabilidad Social
Empresarial (RSE). Aunque existan muchas excepciones, sigue siendo para muchas
empresas una cuestión, en el fondo, básicamente de imagen y de reputación.
La compleja natura de los desafíos de la sostenibilidad requiere nuevos planteamientos
en las metodologías educativas y en el aprendizaje a lo largo de toda la vida, así que la
finalidad del estudio ha sido delinear, según algunas cooperativas de la Provincia de
Cádiz, su imagen cognitiva y afectiva de la sostenibilidad/insostenibilidad del sistema
económico de producción y consumo en el cual operan, con la idea de que los resultados
puedan contribuir a un planteamiento eficaz de cursos de sensibilización y formación
dirigidos a profesionales de empresas, con la aspiración de que la EA puede contribuir a
facilitar la interiorización de los valores de la sostenibilidad para la difusión de estrategias
de sostenibilidad y de Responsabilidad Social Empresarial, más autenticas y genuinas.
En particular, ya que desarrollar el pensamiento sistémico da a los aprendices de todas
las edades el potencial de maximizar la aplicación de sus diferentes experiencias de
aprendizaje y permite entender más profundamente nuestro complejo y inter-conectado
mundo, de la concepción de sostenibilidad del grupo de participantes, se ha intentado
enfocar el pensamiento sistémico, la complejidad y las motivaciones a la actuación para la
reducción de los impactos ambientales y sociales de su organización.
ABSTRACT
The complex nature of sustainability challenges calls for new approaches to long life
learning and education methodologies. Developing the ability to think systemically gives
learners of all ages the potential to maximize the application of their diverse learning
experiences and contribute to better understand our complex inter-connected world.
The aim of the study has been exploring, according to some cooperatives of the Province
of Cadiz, their cognitive and affective image of sustainability and of the unsustainability of
the consumption and production economic system in which they operate. Related purpose,
the exploration of their motivations to take action for the reduction of the environmental
and social impacts of their organization.
In particular the objective has been to focus system thinking and complexity in the
conception of sustainability of the group of participants, with the idea that the results of the
research could contribute to the design of effective professionals awareness and training
courses, with the belief that Environmental Education can contribute to facilitate the
spreading of authentic and genuine Enterprise Social Responsibility (ESR) strategies and
actions for Sustainability in the production sector.
I. INTRODUCCIÓN Y CONTEXTO
Hay numerosos y interconectados problemas sociales, naturales y económico a los cuales
nos enfrentamos hoy, en torno a los que se ha avanzado poco desde el punto de vista de
un modelo de producción y consumo más respetuoso de las personas y la naturaleza. Ello
a pesar de:
Proceedings of 7th WEEC Niche 5: Ecological and
green economies
132
que se hable de “problemáticas ambientales” oficialmente desde 19621, de
“Limites del desarrollo” desde 19722, de “desarrollo sostenible” desde 19873;
las numerosas declaraciones de urgencia y manifiestos hechos desde numerosos
organismos internacionales, nacionales y locales;
que expertos de nivel mundial proponen interesantes soluciones, complejas en su
actuación.
La propuesta de este estudio surge de la consideración de la importancia del rol de la
empresa en el desarrollo de la idea de sostenibilidad y de una serie de constataciones
que derivan de lecturas y experiencias profesionales que delinean el siguiente contexto:
1. La Educación Ambiental tradicionalmente tiende a dirigirse más a niños que a
adultos y más a consumidores que a productores, a pasar de que la difusión de
estilos de vida sostenibles y del consumo responsable depende también de la
disponibilidad en el mercado de bienes y servicios con reducido impacto.
2. Es muy escasa, todavía, la oferta de productos de reducido impacto
medioambiental y social en tiendas y supermercados de Andalucía.
3. Los esfuerzos del sector privado en España se podrían resumir en el balance de
casi una década de difusión de la filosofía de la Responsabilidad Social
Empresarial (RSE)4. A este propósito se conviene con Moreno Izquierdo (2011)
que la RSE todavía constituye una cuestión marcadamente minoritaria y
acentuadamente focalizada en la gran empresa. Aunque existan muchas
excepciones, sigue siendo para muchas empresas una cuestión, en el fondo,
básicamente de imagen y de reputación, y sigue sin llegar de forma significativa a
las Pequeñas y Mediana Empresas (PYMES), que constituyen la inmensa mayoría
del tejido empresarial español.
1 Algunos hacen coincidir el nacimiento de la conciencia ambiental con la publicación en 1962 del libro “Primavera
silenciosa” de Rachel Carson, en lo cual la bióloga revela a la opinión pública las consecuencias del abuso de pesticidas. 2 El Informe “Los límites del crecimiento” (Meadows et al., 1972), encargado al MIT por el Club de Roma, denuncia la
insostenibilidad de la idea de crecimiento infinito. 3 Año de publicación del “Informe Brundtland” (“Nuestro futuro común”), donde la Comisión Mundial sobre Medio
Ambiente y Desarrollo definió oficialmente el término “desarrollo sostenible”. 4 Definición de RSE de la Comunicación de la Comisión al Parlamento Europeo, al Consejo, al comité económico y
social europeo y al comité de las regiones - COM(2011) 681: “la responsabilidad de las empresas por su impacto en la sociedad”. Definición del Libro Verde (2001) de la Unión Europea: “Integración voluntaria, por parte de las empresas, de la preocupaciones sociales y medioambientales en sus operaciones comerciales y sus relaciones con sus interlocutores”.
De hecho según el Informe 2011 de Forética, la red global de organizaciones y
profesionales implicados en el desarrollo de la Responsabilidad Social, en España
prácticamente la totalidad (97,3%) de las empresas medianas y grandes ya están
familiarizadas con el concepto de RSE, mas sólo un 60% de las pequeñas lo están.
4. El capítulo dedicado a la situación española de “A Guide to CSR in Europe” (“Una
guía a la RSC en Europa”) publicada en 2009 por CSR Europe, una red
empresarial europea para la Responsabilidad Social Corporativa, afirma que
“Según los cinco grupos de trabajo creados en el Consejo Estadal, existen 5 áreas
de desarrollo llave para España. Estas prioridades incluyen […] la integración de la
Responsabilidad Social Corporativa en la educación”, y sigue más adelante con
“Los mayores retos son la integración de la RSC en la sensibilización de
consumidores y PYMES”.
También a nivel autonómico, en la Estrategia Andaluza de Educación Ambiental
edición 2006, se manifiesta la importancia del rol de la empresa en contribuir al
cambio necesario para permitir el bienestar de nuestra sociedad y nuestros
descendientes, ya que “el tejido empresarial andaluz tiene una enorme importancia
desde la perspectiva ambiental tanto por la cantidad de recursos materiales y de
energía que consume, como por el impacto ambiental que tienen muchas de las
actividades que realizan” y en su introducción con respecto a la RSE se afirma que
“la responsabilidad social corporativa de la empresa es un paso singular en el
camino hacia la sostenibilidad de la gestión empresarial, aumentando de forma
paulatina la presencia de lo medioambiental en las organizaciones sindicales y del
sector”.
5. CEPES, la Confederación Empresarial Española de Economía Social5, en su
posicionamiento institucional ante la RSE sostiene que “Dadas las características
de las empresas de Economía Social, se puede afirmar, que son en sí mismas,
ejemplos privilegiados de economías socialmente responsables. De alguna manera
se podría decir que son precursoras de la RSE”.
5 Para Economía Social podemos entender “toda actividad económica, de carácter privado, basada en la asociación de
personas en entidades de tipo democrático y participativo, con primacía de las aportaciones personales y de trabajo sobre las de capital" (D. Javier Morillas, profesor de Estructura Económica de la Universidad de San Pablo-CEU) o “toda actividad económica basada en la asociación de personas en entidades que apuestan por un funcionamiento democrático y participativo, tanto en la gestión como en el reparto de los excedentes" (CEPES).
Proceedings of 7th WEEC Niche 5: Ecological and
green economies
134
Por todo eso, se ha considerado interesante plantear un estudio sobre los temas de la
‘Sostenibilidad y Responsabilidad Social’ y de la ‘educación, sensibilización y
formación’ en el ámbito de las empresas de economía social, sector constituido en
Andalucía casi enteramente por PYMES y que se supone conlleva muchos de los valores
de la sostenibilidad en su esencia y en su propia filosofía empresarial, ya que representa
una forma de emprender que se caracteriza por: "organización democrática", "predominio
de la persona por encima del capital", "reparto de beneficios/resultados con criterio
colectivo", "especialmente solidaria con el entorno" y "provocadora de cohesión social”.
Así las cosas, el estudio que aquí se expone pretende analizar la imagen que desde las
empresas de economía social se tiene acerca de la sostenibilidad/insostenibilidad, desde
la premisa previa que dicha imagen influye de una forma decisiva a distintos niveles del
funcionamiento de la empresa en estos asuntos.
II. MARCO TEÓRICO Y ANTECEDENTES
La educación a lo largo de toda la vida
Frente a los numerosos desafíos del porvenir, la educación constituye un instrumento
indispensable para que la humanidad pueda progresar hacia los ideales de paz, libertad y
justicia social.
La “Educación durante toda la vida”, o “Educación permanente”, es una de las llaves de
acceso al siglo XXI, debe ser una estructuración continua de la persona humana de su
conocimiento y sus aptitudes, de su facultad de juicio. La Educación debe estructurarse
en torno a cuatro aprendizajes fundamentales que en el transcurso de la vida serán para
cada persona, los pilares del conocimiento: aprender a conocer, aprender a hacer,
aprender a vivir juntos, aprender a ser (Delors J. et al. 1996). Estas premisas tienen unas
implicaciones muy importantes desde el punto de vista del aprendizaje y desarrollo de los
profesionales que trabajan en las empresas, que requerirían de una formación continua
en los aspectos más relacionados con su trabajo diario, como también en el desarrollo de
conocimientos y valores ciudadanos relevantes para su vida cotidiana y para contribuir
desde su profesión a una sociedad mejor y de un futuro sostenible.
El desarrollo del pensamiento formal
El concepto de medio se forma durante la infancia para evolucionar a lo largo de la
educación primara, secundaria y de toda la vida. Los textos de sendas Orientaciones
Didácticas para la Educación Ambiental en Educación Primaria y Educación Secundaria
del Programa de Educación Ambiental «ALDEA» de la Agencia del Medio Ambiente,
perteneciente en 1992, año de su publicación, a la Consejería de Educación y Ciencia de
la Junta de Andalucía, se hace referencia en la evolución de las concepciones de los
niños de Educación Primaria, a cuatro formulaciones posibles, no como fases rígidas si no
flexibles en la construcción del concepto de medio:
Fase 1. El medio indiferenciado;
Fase 2. El medio como escenario;
Fase 3. El medio como recurso;
Fase 4. El medio como conjunto de sistemas que se relacionan (interacción).
En cambio en el texto de Educación Secundaria, se organiza la información sobre la
forma en que el alumno construye su concepción del medio, atendiendo a un cambio del
ámbito del conocimiento cotidiano, al ámbito del conocimiento científico, pasando de una
visión del medio próximo vivido por el alumno, a otra aditiva y analítica del medio, para
terminar en una visión sistémica del medio (Fase 5).
En la Figura 1. la representación grafica del desarrollo de la concepción sistémica del
mundo que se encuentra en el texto de segundaria.
La figura describe la transición de una concepción de medio como conjunto de elementos
y relaciones a otra que lo concibe como organización de interacciones. Los rectángulos y
las flechas nos permiten representar esquemáticamente los pasos necesarios para la
evolución a la concepción de medio como sistema.
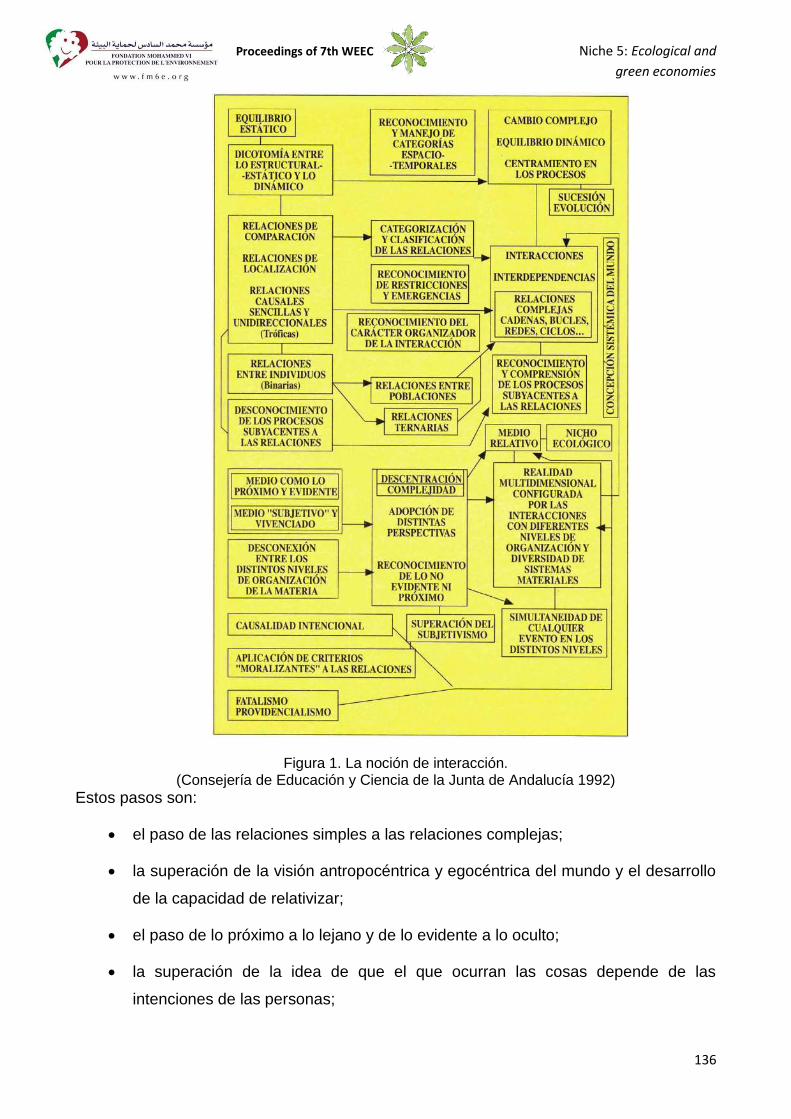
Proceedings of 7th WEEC Niche 5: Ecological and
green economies
136
Figura 1. La noción de interacción. (Consejería de Educación y Ciencia de la Junta de Andalucía 1992)
Estos pasos son:
el paso de las relaciones simples a las relaciones complejas;
la superación de la visión antropocéntrica y egocéntrica del mundo y el desarrollo
de la capacidad de relativizar;
el paso de lo próximo a lo lejano y de lo evidente a lo oculto;
la superación de la idea de que el que ocurran las cosas depende de las
intenciones de las personas;
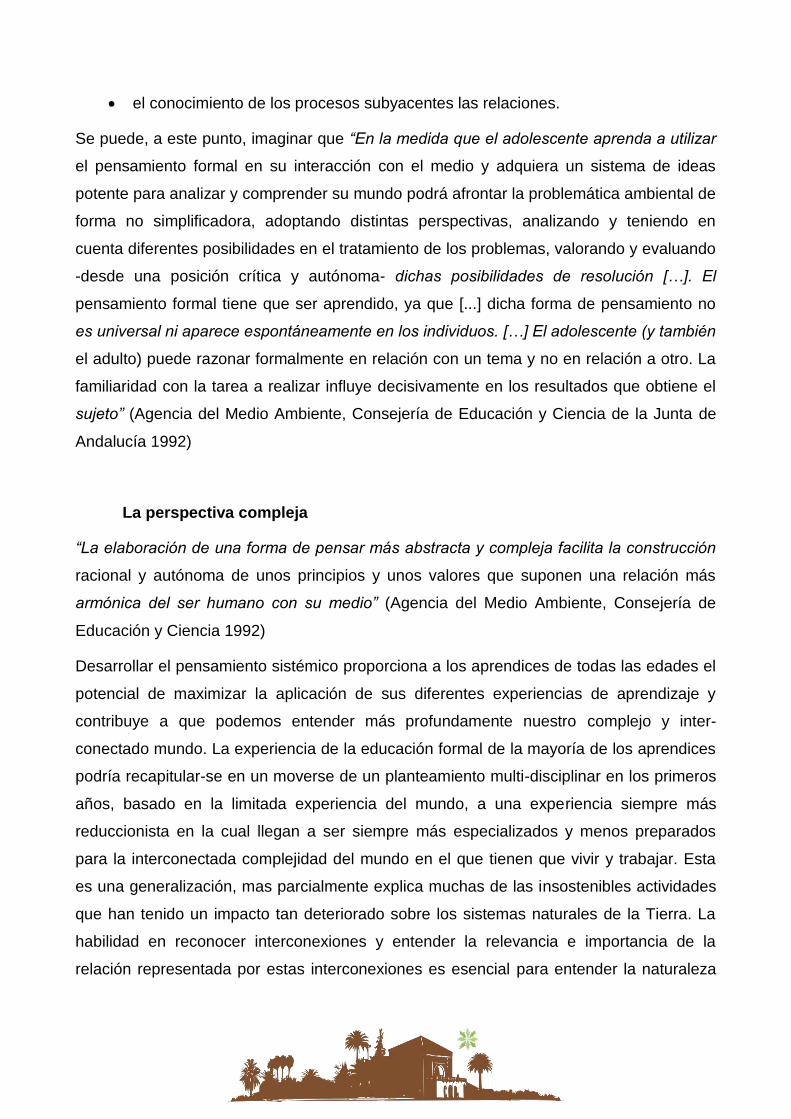
el conocimiento de los procesos subyacentes las relaciones.
Se puede, a este punto, imaginar que “En la medida que el adolescente aprenda a utilizar
el pensamiento formal en su interacción con el medio y adquiera un sistema de ideas
potente para analizar y comprender su mundo podrá afrontar la problemática ambiental de
forma no simplificadora, adoptando distintas perspectivas, analizando y teniendo en
cuenta diferentes posibilidades en el tratamiento de los problemas, valorando y evaluando
-desde una posición crítica y autónoma- dichas posibilidades de resolución […]. El
pensamiento formal tiene que ser aprendido, ya que [...] dicha forma de pensamiento no
es universal ni aparece espontáneamente en los individuos. […] El adolescente (y también
el adulto) puede razonar formalmente en relación con un tema y no en relación a otro. La
familiaridad con la tarea a realizar influye decisivamente en los resultados que obtiene el
sujeto” (Agencia del Medio Ambiente, Consejería de Educación y Ciencia de la Junta de
Andalucía 1992)
La perspectiva compleja
“La elaboración de una forma de pensar más abstracta y compleja facilita la construcción
racional y autónoma de unos principios y unos valores que suponen una relación más
armónica del ser humano con su medio” (Agencia del Medio Ambiente, Consejería de
Educación y Ciencia 1992)
Desarrollar el pensamiento sistémico proporciona a los aprendices de todas las edades el
potencial de maximizar la aplicación de sus diferentes experiencias de aprendizaje y
contribuye a que podemos entender más profundamente nuestro complejo y inter-
conectado mundo. La experiencia de la educación formal de la mayoría de los aprendices
podría recapitular-se en un moverse de un planteamiento multi-disciplinar en los primeros
años, basado en la limitada experiencia del mundo, a una experiencia siempre más
reduccionista en la cual llegan a ser siempre más especializados y menos preparados
para la interconectada complejidad del mundo en el que tienen que vivir y trabajar. Esta
es una generalización, mas parcialmente explica muchas de las insostenibles actividades
que han tenido un impacto tan deteriorado sobre los sistemas naturales de la Tierra. La
habilidad en reconocer interconexiones y entender la relevancia e importancia de la
relación representada por estas interconexiones es esencial para entender la naturaleza
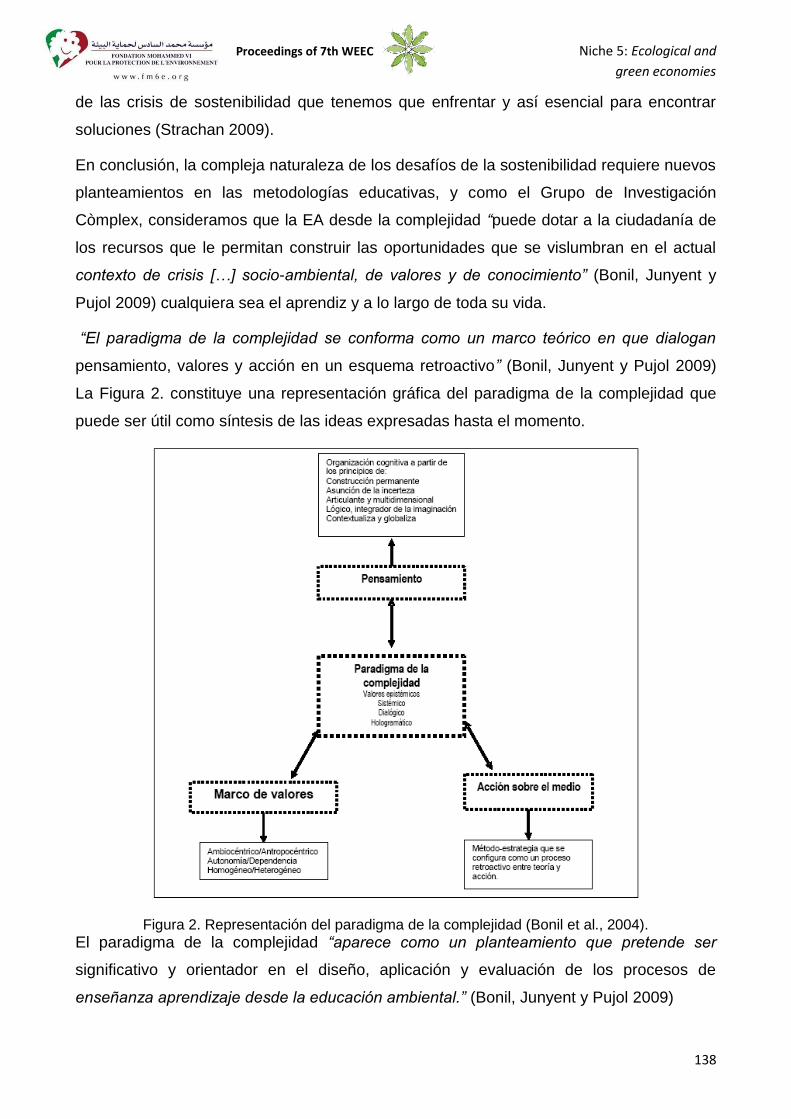
Proceedings of 7th WEEC Niche 5: Ecological and
green economies
138
de las crisis de sostenibilidad que tenemos que enfrentar y así esencial para encontrar
soluciones (Strachan 2009).
En conclusión, la compleja naturaleza de los desafíos de la sostenibilidad requiere nuevos
planteamientos en las metodologías educativas, y como el Grupo de Investigación
Còmplex, consideramos que la EA desde la complejidad “puede dotar a la ciudadanía de
los recursos que le permitan construir las oportunidades que se vislumbran en el actual
contexto de crisis […] socio-ambiental, de valores y de conocimiento” (Bonil, Junyent y
Pujol 2009) cualquiera sea el aprendiz y a lo largo de toda su vida.
“El paradigma de la complejidad se conforma como un marco teórico en que dialogan
pensamiento, valores y acción en un esquema retroactivo” (Bonil, Junyent y Pujol 2009)
La Figura 2. constituye una representación gráfica del paradigma de la complejidad que
puede ser útil como síntesis de las ideas expresadas hasta el momento.
Figura 2. Representación del paradigma de la complejidad (Bonil et al., 2004). El paradigma de la complejidad “aparece como un planteamiento que pretende ser
significativo y orientador en el diseño, aplicación y evaluación de los procesos de
enseñanza aprendizaje desde la educación ambiental.” (Bonil, Junyent y Pujol 2009)
La Educación para la Sostenibilidad y la empresa
El ARIES (Australian Research Institute in Education for Sustainability) y el Departamento
de medio ambiente y patrimonio del Gobierno australiano (2005) en sus publicaciones
afirman que la Educación para la Sostenibilidad quiere focalizar en proveer los aprendices
con las necesarias habilidades para la actuación personal en promover y manejar la
sostenibilidad.
Hoy en día se entiende que la sostenibilidad es un proceso de gestión adaptativa y
pensamiento sistémico que necesita creatividad, flexibilidad y reflexión crítica. Aprender
para la Sostenibilidad motiva, equipa e involucra, intenta comprometer y empoderar las
personas para implementar cambios sistémicos.
Un aspecto crítico en la Educación para la Sostenibilidad es aprender a motivar y
gestionar el cambio hacia la sostenibilidad desde dentro de organizaciones e instituciones.
“La sostenibilidad no es un objetivo a conseguir para las empresas, más bien un proceso
de aprendizaje en desarrollo. Los educadores necesitan construir la capacidad de las
organizaciones de negocios e industriales de manejar las cuestiones de la sostenibilidad a
un nivel más sistémico y de colaborar con múltiples portadores de intereses para sus
resolución” (Tilbury et al. 2005)
Los obstáculos y las cualidades para la sostenibilidad
Las cuestiones a explorar y el ámbito de este estudio, llevado a cabo con la participación
de empresas cooperativas6 de la provincia de Cádiz, nace de:
1. la sensación de que la formación y sensibilización empresarial en RSE y
sostenibilidad no están empreñadas de ningún aspecto de la Educación para la
Sostenibilidad;
2. la hipótesis de que ‘Los siete errores’, presentados por Bob Doppelt (2003) en su
artículo donde describe los siete motivos por los cuales sólo muy pocas empresas
consiguen adoptar medidas de sostenibilidad eficaces, podría también explicar la
6 La cooperativa es una forma de organización empresarial basada en la estructura y funcionamiento democráticos. Su
actividad se desarrolla atendiendo a los principios cooperativos, aceptados y regulados en los ámbitos autonómico, estatal e internacional: la adhesión voluntaria y abierta de los socios, la gestión democrática, la participación económica de los socios, la educación, formación e información y el interés por la comunidad (http://www.cepes.es/listado.cfm?padre=41&idSeccion=295&idsec=sec_07).
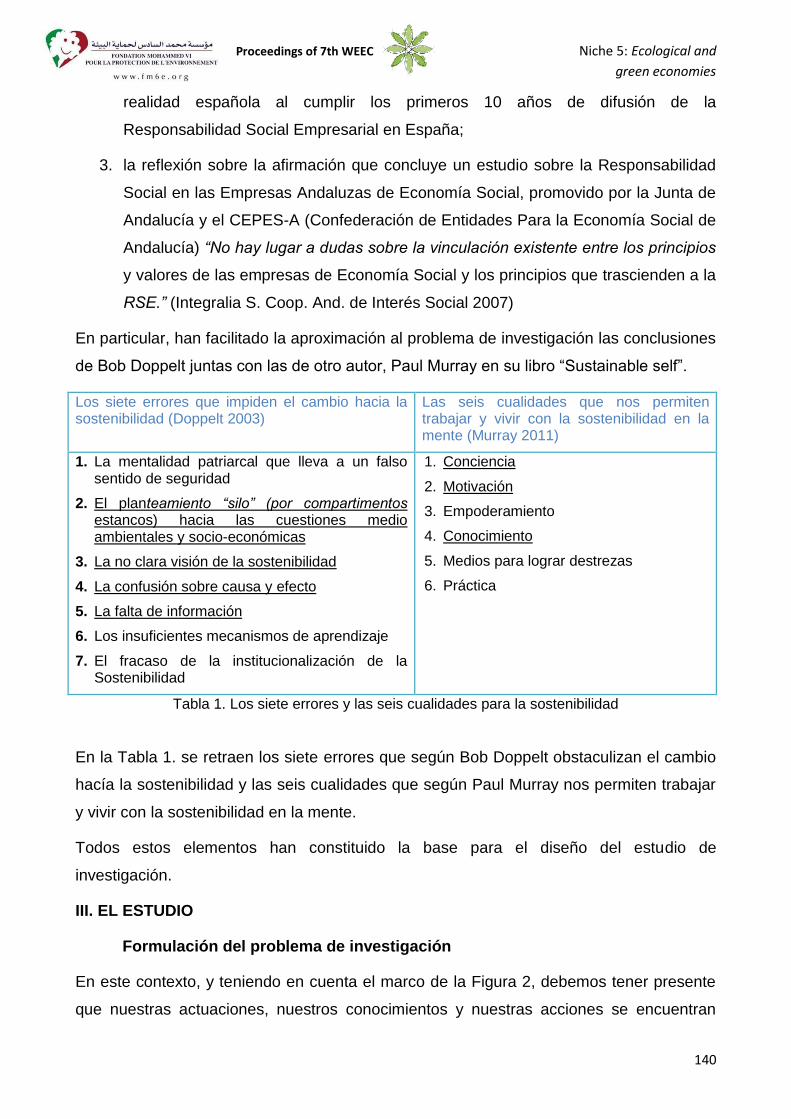
Proceedings of 7th WEEC Niche 5: Ecological and
green economies
140
realidad española al cumplir los primeros 10 años de difusión de la
Responsabilidad Social Empresarial en España;
3. la reflexión sobre la afirmación que concluye un estudio sobre la Responsabilidad
Social en las Empresas Andaluzas de Economía Social, promovido por la Junta de
Andalucía y el CEPES-A (Confederación de Entidades Para la Economía Social de
Andalucía) “No hay lugar a dudas sobre la vinculación existente entre los principios
y valores de las empresas de Economía Social y los principios que trascienden a la
RSE.” (Integralia S. Coop. And. de Interés Social 2007)
En particular, han facilitado la aproximación al problema de investigación las conclusiones
de Bob Doppelt juntas con las de otro autor, Paul Murray en su libro “Sustainable self”.
Los siete errores que impiden el cambio hacia la sostenibilidad (Doppelt 2003)
Las seis cualidades que nos permiten trabajar y vivir con la sostenibilidad en la mente (Murray 2011)
1. La mentalidad patriarcal que lleva a un falso sentido de seguridad
2. El planteamiento “silo” (por compartimentos estancos) hacia las cuestiones medio ambientales y socio-económicas
3. La no clara visión de la sostenibilidad
4. La confusión sobre causa y efecto
5. La falta de información
6. Los insuficientes mecanismos de aprendizaje
7. El fracaso de la institucionalización de la Sostenibilidad
1. Conciencia
2. Motivación
3. Empoderamiento
4. Conocimiento
5. Medios para lograr destrezas
6. Práctica
Tabla 1. Los siete errores y las seis cualidades para la sostenibilidad
En la Tabla 1. se retraen los siete errores que según Bob Doppelt obstaculizan el cambio
hacía la sostenibilidad y las seis cualidades que según Paul Murray nos permiten trabajar
y vivir con la sostenibilidad en la mente.
Todos estos elementos han constituido la base para el diseño del estudio de
investigación.
III. EL ESTUDIO
Formulación del problema de investigación
En este contexto, y teniendo en cuenta el marco de la Figura 2, debemos tener presente
que nuestras actuaciones, nuestros conocimientos y nuestras acciones se encuentran
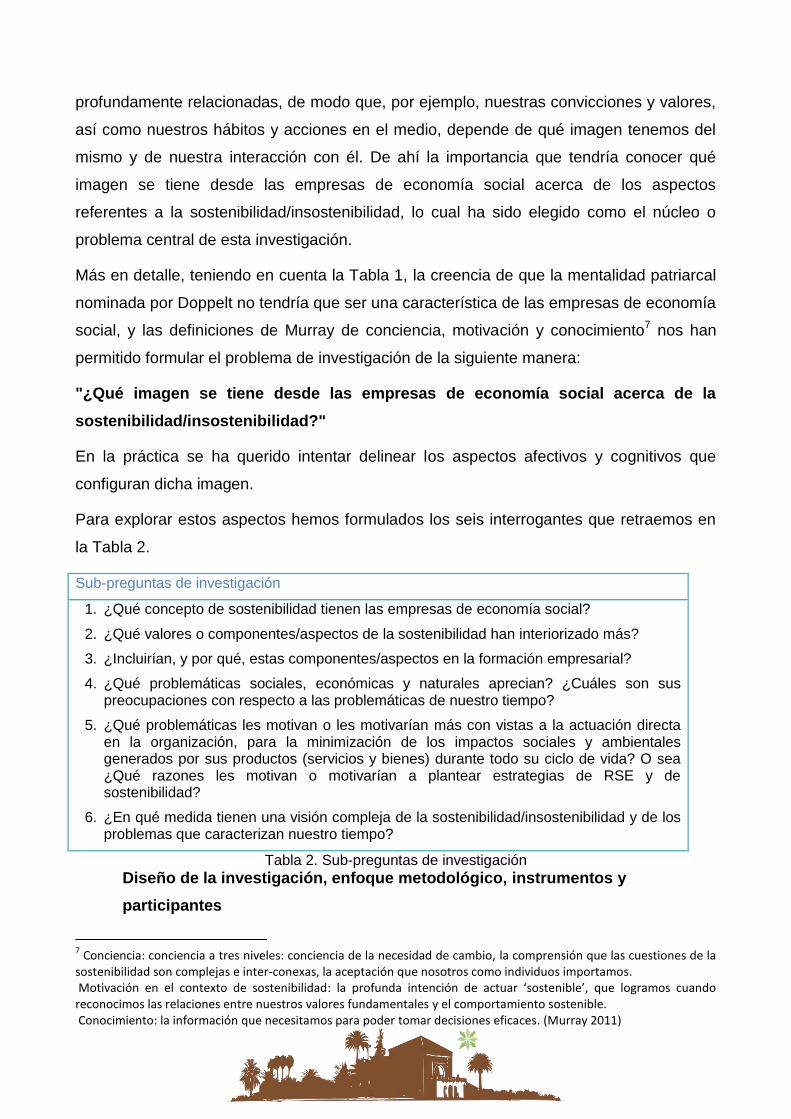
profundamente relacionadas, de modo que, por ejemplo, nuestras convicciones y valores,
así como nuestros hábitos y acciones en el medio, depende de qué imagen tenemos del
mismo y de nuestra interacción con él. De ahí la importancia que tendría conocer qué
imagen se tiene desde las empresas de economía social acerca de los aspectos
referentes a la sostenibilidad/insostenibilidad, lo cual ha sido elegido como el núcleo o
problema central de esta investigación.
Más en detalle, teniendo en cuenta la Tabla 1, la creencia de que la mentalidad patriarcal
nominada por Doppelt no tendría que ser una característica de las empresas de economía
social, y las definiciones de Murray de conciencia, motivación y conocimiento7 nos han
permitido formular el problema de investigación de la siguiente manera:
"¿Qué imagen se tiene desde las empresas de economía social acerca de la
sostenibilidad/insostenibilidad?"
En la práctica se ha querido intentar delinear los aspectos afectivos y cognitivos que
configuran dicha imagen.
Para explorar estos aspectos hemos formulados los seis interrogantes que retraemos en
la Tabla 2.
Sub-preguntas de investigación
1. ¿Qué concepto de sostenibilidad tienen las empresas de economía social?
2. ¿Qué valores o componentes/aspectos de la sostenibilidad han interiorizado más?
3. ¿Incluirían, y por qué, estas componentes/aspectos en la formación empresarial?
4. ¿Qué problemáticas sociales, económicas y naturales aprecian? ¿Cuáles son sus preocupaciones con respecto a las problemáticas de nuestro tiempo?
5. ¿Qué problemáticas les motivan o les motivarían más con vistas a la actuación directa en la organización, para la minimización de los impactos sociales y ambientales generados por sus productos (servicios y bienes) durante todo su ciclo de vida? O sea ¿Qué razones les motivan o motivarían a plantear estrategias de RSE y de sostenibilidad?
6. ¿En qué medida tienen una visión compleja de la sostenibilidad/insostenibilidad y de los problemas que caracterizan nuestro tiempo?
Tabla 2. Sub-preguntas de investigación Diseño de la investigación, enfoque metodológico, instrumentos y
participantes
7 Conciencia: conciencia a tres niveles: conciencia de la necesidad de cambio, la comprensión que las cuestiones de la
sostenibilidad son complejas e inter-conexas, la aceptación que nosotros como individuos importamos. Motivación en el contexto de sostenibilidad: la profunda intención de actuar ‘sostenible’, que logramos cuando reconocimos las relaciones entre nuestros valores fundamentales y el comportamiento sostenible. Conocimiento: la información que necesitamos para poder tomar decisiones eficaces. (Murray 2011)
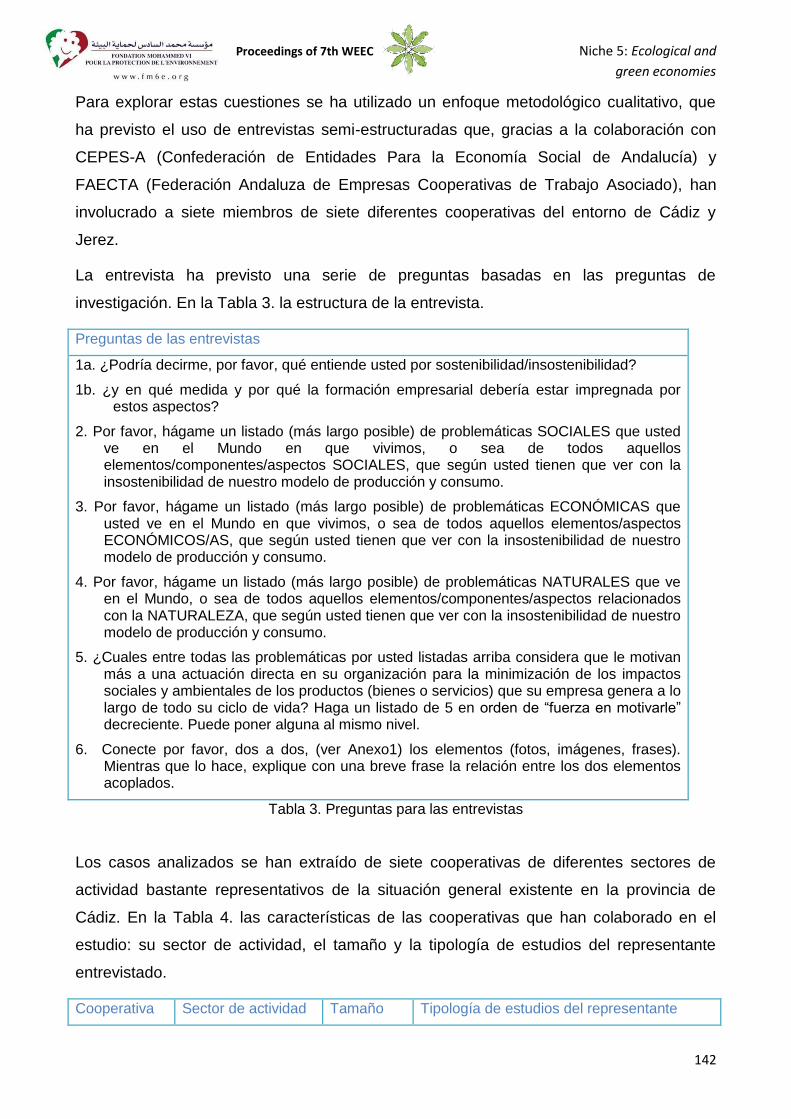
Proceedings of 7th WEEC Niche 5: Ecological and
green economies
142
Para explorar estas cuestiones se ha utilizado un enfoque metodológico cualitativo, que
ha previsto el uso de entrevistas semi-estructuradas que, gracias a la colaboración con
CEPES-A (Confederación de Entidades Para la Economía Social de Andalucía) y
FAECTA (Federación Andaluza de Empresas Cooperativas de Trabajo Asociado), han
involucrado a siete miembros de siete diferentes cooperativas del entorno de Cádiz y
Jerez.
La entrevista ha previsto una serie de preguntas basadas en las preguntas de
investigación. En la Tabla 3. la estructura de la entrevista.
Preguntas de las entrevistas
1a. ¿Podría decirme, por favor, qué entiende usted por sostenibilidad/insostenibilidad?
1b. ¿y en qué medida y por qué la formación empresarial debería estar impregnada por estos aspectos?
2. Por favor, hágame un listado (más largo posible) de problemáticas SOCIALES que usted ve en el Mundo en que vivimos, o sea de todos aquellos elementos/componentes/aspectos SOCIALES, que según usted tienen que ver con la insostenibilidad de nuestro modelo de producción y consumo.
3. Por favor, hágame un listado (más largo posible) de problemáticas ECONÓMICAS que usted ve en el Mundo en que vivimos, o sea de todos aquellos elementos/aspectos ECONÓMICOS/AS, que según usted tienen que ver con la insostenibilidad de nuestro modelo de producción y consumo.
4. Por favor, hágame un listado (más largo posible) de problemáticas NATURALES que ve en el Mundo, o sea de todos aquellos elementos/componentes/aspectos relacionados con la NATURALEZA, que según usted tienen que ver con la insostenibilidad de nuestro modelo de producción y consumo.
5. ¿Cuales entre todas las problemáticas por usted listadas arriba considera que le motivan más a una actuación directa en su organización para la minimización de los impactos sociales y ambientales de los productos (bienes o servicios) que su empresa genera a lo largo de todo su ciclo de vida? Haga un listado de 5 en orden de “fuerza en motivarle” decreciente. Puede poner alguna al mismo nivel.
6. Conecte por favor, dos a dos, (ver Anexo1) los elementos (fotos, imágenes, frases). Mientras que lo hace, explique con una breve frase la relación entre los dos elementos acoplados.
Tabla 3. Preguntas para las entrevistas
Los casos analizados se han extraído de siete cooperativas de diferentes sectores de
actividad bastante representativos de la situación general existente en la provincia de
Cádiz. En la Tabla 4. las características de las cooperativas que han colaborado en el
estudio: su sector de actividad, el tamaño y la tipología de estudios del representante
entrevistado.
Cooperativa Sector de actividad Tamaño Tipología de estudios del representante
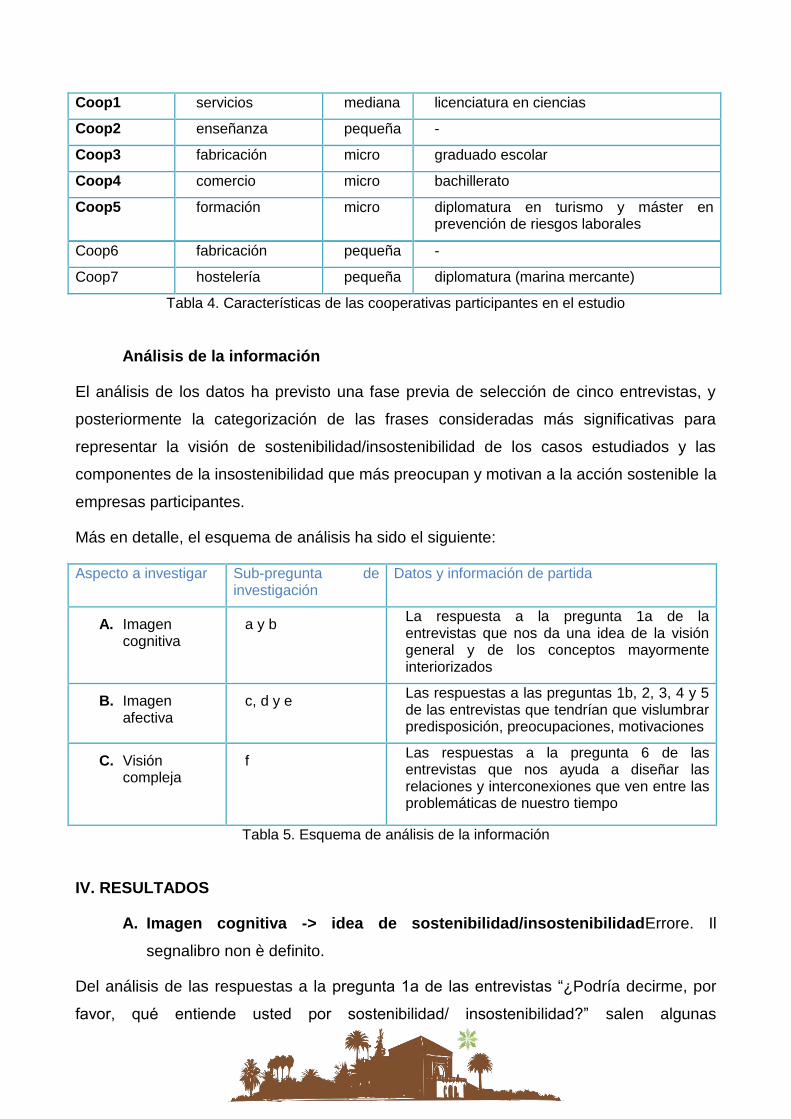
Coop1 servicios mediana licenciatura en ciencias
Coop2 enseñanza pequeña -
Coop3 fabricación micro graduado escolar
Coop4 comercio micro bachillerato
Coop5 formación micro diplomatura en turismo y máster en prevención de riesgos laborales
Coop6 fabricación pequeña -
Coop7 hostelería pequeña diplomatura (marina mercante)
Tabla 4. Características de las cooperativas participantes en el estudio
Análisis de la información
El análisis de los datos ha previsto una fase previa de selección de cinco entrevistas, y
posteriormente la categorización de las frases consideradas más significativas para
representar la visión de sostenibilidad/insostenibilidad de los casos estudiados y las
componentes de la insostenibilidad que más preocupan y motivan a la acción sostenible la
empresas participantes.
Más en detalle, el esquema de análisis ha sido el siguiente:
Aspecto a investigar Sub-pregunta de investigación
Datos y información de partida
A. Imagen cognitiva
a y b La respuesta a la pregunta 1a de la entrevistas que nos da una idea de la visión general y de los conceptos mayormente interiorizados
B. Imagen afectiva
c, d y e Las respuestas a las preguntas 1b, 2, 3, 4 y 5 de las entrevistas que tendrían que vislumbrar predisposición, preocupaciones, motivaciones
C. Visión compleja
f
Las respuestas a la pregunta 6 de las entrevistas que nos ayuda a diseñar las relaciones y interconexiones que ven entre las problemáticas de nuestro tiempo
Tabla 5. Esquema de análisis de la información
IV. RESULTADOS
A. Imagen cognitiva -> idea de sostenibilidad/insostenibilidadErrore. Il
segnalibro non è definito.
Del análisis de las respuestas a la pregunta 1a de las entrevistas “¿Podría decirme, por
favor, qué entiende usted por sostenibilidad/ insostenibilidad?” salen algunas
Proceedings of 7th WEEC Niche 5: Ecological and
green economies
144
consideraciones de tipo general (puntos 1 y 2) y, más en particular, dos matices de la idea
de sostenibilidad (puntos 3):
1. Se percibe un general desconocimiento del significado de sostenibilidad, y una
admisión de esto.
2. Por un lado, en el caso de las dos cooperativas que se ocupan de educación, sale
una idea de sostenibilidad más cercana a las definiciones más oficiales. Es de
evidenciar que el autor de la definición más cercana a la del “Informe Brundtland”
se ocupa de sensibilización ambiental.
Por otro, en el caso de las Coop1 y Coop3, se capta una idea de sostenibilidad más
ligada a la idea de competitividad y perdurabilidad de la empresa o de certificación
y Responsabilidad Empresarial.
3. El límite entre lo “que es” y “para qué” no resulta claro en las respuestas de los
entrevistados. Muchas veces una cosa se confunde con la otra cuando se contesta
al “qué es” con “algo” para conseguir un objetivo, un efecto. Por ej. la sostenibilidad
“es una cosa… para cumplir parámetros…”
Si se hace referencia a los principales conceptos que componen la idea de sostenibilidad
derivados por las definiciones más oficiales de desarrollo sostenible y sobre todo de
consumo sostenible8, o sea:
A1. respetar el equilibrio de los ecosistemas, minimizar el uso de recursos, la
producción de residuos y la contaminación;
A2. satisfacer las necesidades humanas;
A3. favorecer una buena calidad de vida a través de estándares decentes del vivir
cotidiano;
A4. compartir los recursos entre ricos y pobres;
8 Definición propuesta por el Simposio sobre Consumo Sostenible de Oslo: “...el uso de servicios y productos relacionados que respondan a las necesidades básicas y que proporcionen una mejor calidad de vida a la vez que se minimiza el uso de recursos naturales y materiales tóxicos, así como las emisiones de residuos y contaminantes, durante el ciclo de vida del servicio o producto, con el fin de no poner en riesgo las necesidades de las generaciones futuras” (Ministerio del Medio Ambiente Noruego, 1994) En “Enseñar y aprender para un futuro sostenible – un programa multimedia para desarrollo profesional de la UNESCO” (http://www.unesco.org/education/tlsf/mods/theme_c/mod17.html) se afirma que “la definición de Consumo Sostenible es compleja y su definición a veces es difícil de entender […] La mayoría de las definiciones tienen las siguientes características en común: satisfacer las necesidades humanas; favorecer una buena calidad de vida por medio de estándares de vida dignos; compartir los recursos entre ricos y pobres; actuar tomando en cuenta a las generaciones futuras; considerar el impacto “desde la cuña a la tumba” de los productos al consumirlos; minimizar el uso de recursos, los residuos y la contaminación.” (UNESCO, 2011)
A5. actuar con una atención a las generaciones futuras;
A6. promover estilos de vida que deán mayor valor a la cohesión social, a las
tradiciones locales y a los valores no materiales;
A7. concierne a las empresas, los gobiernos, las comunidades, las familias, los
individuos;
A8. otros;
de las respuestas a la primera pregunta de las entrevistas se podría concluir que los
casos en estudio, aparte de su escaso conocimiento sobre el significado de la palabra
‘sostenibilidad’, han englobado en su idea de sostenibilidad principalmente las facetas A1,
A5, mientras que la idea de competitividad y perdurabilidad de la empresa no coincide con
ninguno de los aspectos de la sostenibilidad, más bien puede constituir un efecto de
estrategias de sostenibilidad o una motivación a la actuación sostenible. Veremos más
adelante que profundizando a través de las demás preguntas esta imagen se irá
ampliando y completando con aspectos menos llamativos para ellos.
B. Imagen afectiva -> predisposición, preocupaciones, motivaciones
La imagen afectiva de ‘sostenibilidad’ de los casos estudiados se ha explorado sobre todo
a través del análisis de las respuestas a las preguntas 1b, 2, 3, 4 y 5 de las entrevistas,
que nos han permitido indagar acerca de su predisposición para profundizar en la materia,
sus principales preocupaciones y sus motivaciones con vistas a la actuación en primera
persona y en la empresa.
Con respecto a la pregunta 1b, “¿En qué medida y por qué la formación empresarial
debería estar impregnada por estos aspectos?”, se evidencia una generalizada conciencia
de la necesidad de profundizar en el tema de la ‘sostenibilidad’, aun de forma diferente.
Ninguna de las cooperativas sostiene lo contrario.
Lo que cambia entre las actitudes de los entrevistados, es la razón que cada uno expone
a la hora de justificarlo, la cual refleja también la definición de ‘sostenibilidad’ que ofrecen
en su respuesta a la pregunta anterior. Así que los motivos de su positiva valoración del
tratamiento de los aspectos de la sostenibilidad en la formación empresarial, son para
algunas más ligadas a la durabilidad de la empresa y para otras a los recursos de la
naturaleza.
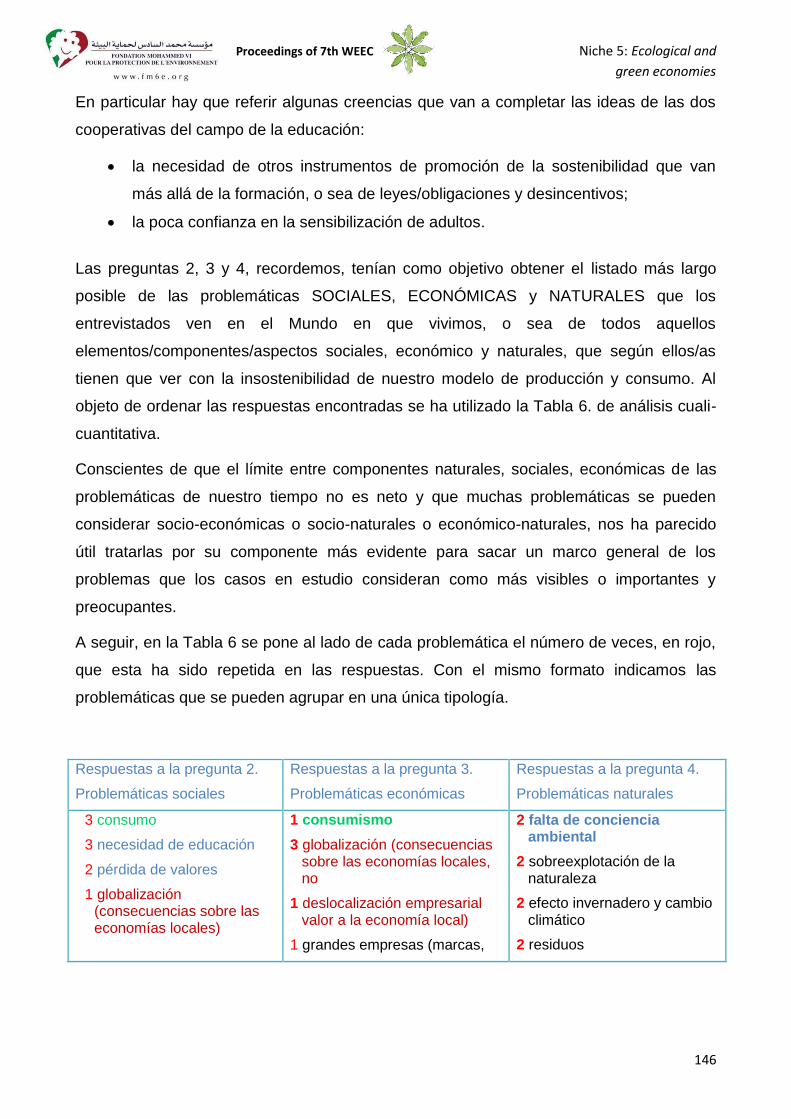
Proceedings of 7th WEEC Niche 5: Ecological and
green economies
146
En particular hay que referir algunas creencias que van a completar las ideas de las dos
cooperativas del campo de la educación:
la necesidad de otros instrumentos de promoción de la sostenibilidad que van
más allá de la formación, o sea de leyes/obligaciones y desincentivos;
la poca confianza en la sensibilización de adultos.
Las preguntas 2, 3 y 4, recordemos, tenían como objetivo obtener el listado más largo
posible de las problemáticas SOCIALES, ECONÓMICAS y NATURALES que los
entrevistados ven en el Mundo en que vivimos, o sea de todos aquellos
elementos/componentes/aspectos sociales, económico y naturales, que según ellos/as
tienen que ver con la insostenibilidad de nuestro modelo de producción y consumo. Al
objeto de ordenar las respuestas encontradas se ha utilizado la Tabla 6. de análisis cuali-
cuantitativa.
Conscientes de que el límite entre componentes naturales, sociales, económicas de las
problemáticas de nuestro tiempo no es neto y que muchas problemáticas se pueden
considerar socio-económicas o socio-naturales o económico-naturales, nos ha parecido
útil tratarlas por su componente más evidente para sacar un marco general de los
problemas que los casos en estudio consideran como más visibles o importantes y
preocupantes.
A seguir, en la Tabla 6 se pone al lado de cada problemática el número de veces, en rojo,
que esta ha sido repetida en las respuestas. Con el mismo formato indicamos las
problemáticas que se pueden agrupar en una única tipología.
Respuestas a la pregunta 2.
Problemáticas sociales
Respuestas a la pregunta 3.
Problemáticas económicas
Respuestas a la pregunta 4.
Problemáticas naturales
3 consumo
3 necesidad de educación
2 pérdida de valores
1 globalización (consecuencias sobre las economías locales)
1 consumismo
3 globalización (consecuencias sobre las economías locales, no
1 deslocalización empresarial valor a la economía local)
1 grandes empresas (marcas,
2 falta de conciencia ambiental
2 sobreexplotación de la naturaleza
2 efecto invernadero y cambio climático
2 residuos
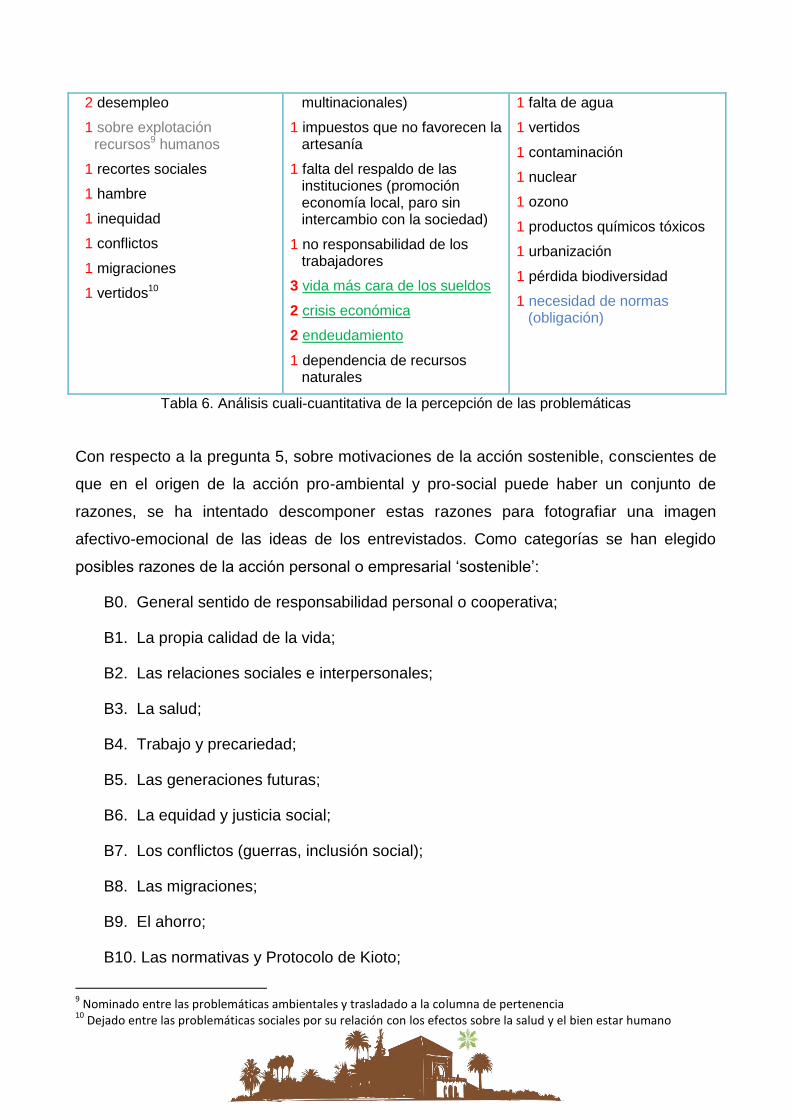
2 desempleo
1 sobre explotación recursos9 humanos
1 recortes sociales
1 hambre
1 inequidad
1 conflictos
1 migraciones
1 vertidos10
multinacionales)
1 impuestos que no favorecen la artesanía
1 falta del respaldo de las instituciones (promoción economía local, paro sin intercambio con la sociedad)
1 no responsabilidad de los trabajadores
3 vida más cara de los sueldos
2 crisis económica
2 endeudamiento
1 dependencia de recursos naturales
1 falta de agua
1 vertidos
1 contaminación
1 nuclear
1 ozono
1 productos químicos tóxicos
1 urbanización
1 pérdida biodiversidad
1 necesidad de normas (obligación)
Tabla 6. Análisis cuali-cuantitativa de la percepción de las problemáticas
Con respecto a la pregunta 5, sobre motivaciones de la acción sostenible, conscientes de
que en el origen de la acción pro-ambiental y pro-social puede haber un conjunto de
razones, se ha intentado descomponer estas razones para fotografiar una imagen
afectivo-emocional de las ideas de los entrevistados. Como categorías se han elegido
posibles razones de la acción personal o empresarial ‘sostenible’:
B0. General sentido de responsabilidad personal o cooperativa;
B1. La propia calidad de la vida;
B2. Las relaciones sociales e interpersonales;
B3. La salud;
B4. Trabajo y precariedad;
B5. Las generaciones futuras;
B6. La equidad y justicia social;
B7. Los conflictos (guerras, inclusión social);
B8. Las migraciones;
B9. El ahorro;
B10. Las normativas y Protocolo de Kioto;
9 Nominado entre las problemáticas ambientales y trasladado a la columna de pertenencia
10 Dejado entre las problemáticas sociales por su relación con los efectos sobre la salud y el bien estar humano
Proceedings of 7th WEEC Niche 5: Ecological and
green economies
148
B11. El cambio climático;
B12. Los recursos naturales, agua, biodiversidad;
B13. El crecimiento de la población mundial;
B15. Crisis de la economía y un mercado falseado;
B14. La competitividad y eco-innovación;
B16. Otros.
En una fase sucesiva se ha asignado a cada frase significativa de las entrevistas una
categoría de pertenencia. Los resultados de este análisis se presentan en la Tabla 7.
con la cual se intenta extraer de forma simplificada, pero más inmediata, el orden de
importancia dado a las diferentes motivaciones expresadas.
La columna de la derecha expresa una valoración neta de la importancia de las razones
de los comportamientos sostenible que aparecen en la columna de la izquierda, al objeto
de hacernos una idea sobre los aspectos más motivadores formulados por las
cooperativas en estudio: arriba los más importantes, abajo aquellos menos cercanos a
su preocupaciones diarias o menos relacionados a su actuación.
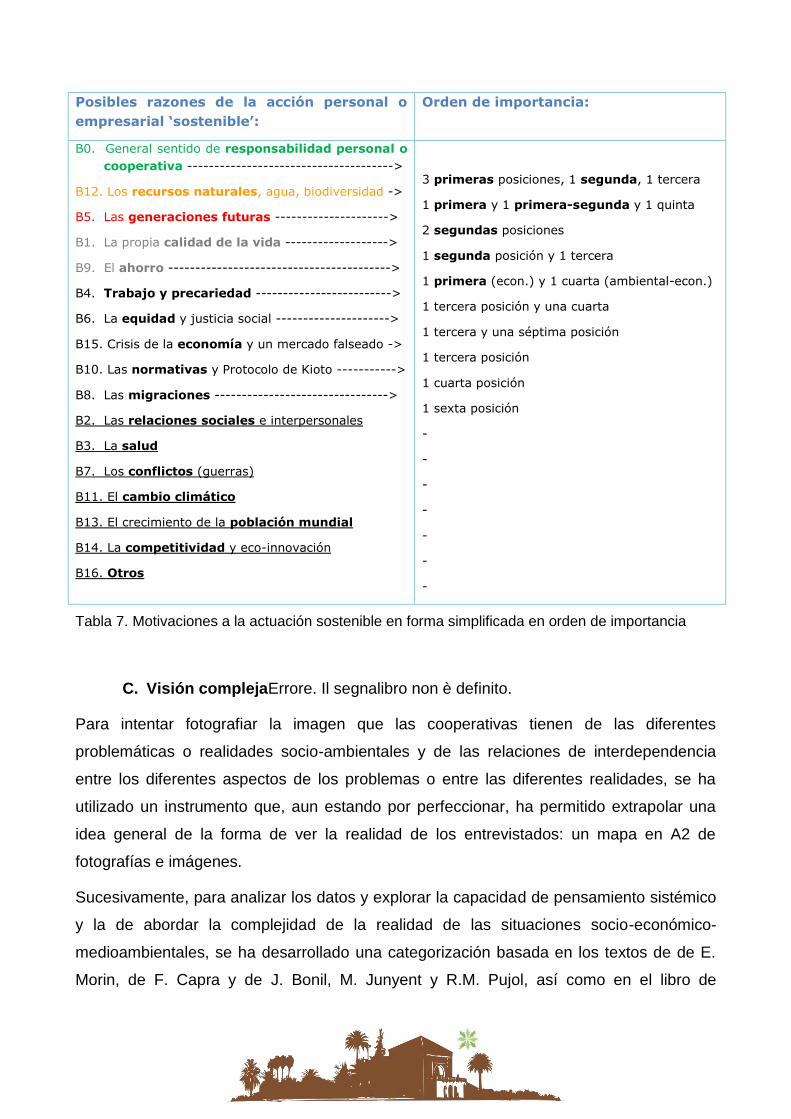
Posibles razones de la acción personal o
empresarial ‘sostenible’:
Orden de importancia:
B0. General sentido de responsabilidad personal o
cooperativa -------------------------------------->
B12. Los recursos naturales, agua, biodiversidad ->
B5. Las generaciones futuras --------------------->
B1. La propia calidad de la vida ------------------->
B9. El ahorro ----------------------------------------->
B4. Trabajo y precariedad ------------------------->
B6. La equidad y justicia social --------------------->
B15. Crisis de la economía y un mercado falseado ->
B10. Las normativas y Protocolo de Kioto ----------->
B8. Las migraciones -------------------------------->
B2. Las relaciones sociales e interpersonales
B3. La salud
B7. Los conflictos (guerras)
B11. El cambio climático
B13. El crecimiento de la población mundial
B14. La competitividad y eco-innovación
B16. Otros
3 primeras posiciones, 1 segunda, 1 tercera
1 primera y 1 primera-segunda y 1 quinta
2 segundas posiciones
1 segunda posición y 1 tercera
1 primera (econ.) y 1 cuarta (ambiental-econ.)
1 tercera posición y una cuarta
1 tercera y una séptima posición
1 tercera posición
1 cuarta posición
1 sexta posición
-
-
-
-
-
-
-
Tabla 7. Motivaciones a la actuación sostenible en forma simplificada en orden de importancia
C. Visión complejaErrore. Il segnalibro non è definito.
Para intentar fotografiar la imagen que las cooperativas tienen de las diferentes
problemáticas o realidades socio-ambientales y de las relaciones de interdependencia
entre los diferentes aspectos de los problemas o entre las diferentes realidades, se ha
utilizado un instrumento que, aun estando por perfeccionar, ha permitido extrapolar una
idea general de la forma de ver la realidad de los entrevistados: un mapa en A2 de
fotografías e imágenes.
Sucesivamente, para analizar los datos y explorar la capacidad de pensamiento sistémico
y la de abordar la complejidad de la realidad de las situaciones socio-económico-
medioambientales, se ha desarrollado una categorización basada en los textos de de E.
Morin, de F. Capra y de J. Bonil, M. Junyent y R.M. Pujol, así como en el libro de
Proceedings of 7th WEEC Niche 5: Ecological and
green economies
150
Orientaciones Didácticas para la Educación Ambiental en Educación Primaria y
Secundaria del Programa de Educación Ambiental «ALDEA».
El resultado ha sido la distinción de dos niveles de acercamiento a una visión sistémica y
compleja de las problemáticas de nuestro tiempo (sociales, naturales y económicas), cada
uno caracterizado por una serie de indicios:
C1. Primera fase de acercamiento a la visión compleja. Indicios de una visión más
simple y menos madura:
visión del medio como recurso, socio-centrismo, reconocimiento problemas, conflictos,
visión utilitarista/mercantilista, visión bucólica, relaciones inmediatas, visión
caracterizada por relaciones causales sencillas y unidireccionales, causalidad final
(conducta con intención), lineal (desplazamiento objetos) y estructura-función (ala-
vuelo, aletas-natación), relaciones de comparación, de uso, localización, igualdad-
desigualdad, de contingencia, elementos y su dimensión espacio-temporal, inmediato,
aparente, próximo y evidente, subjetivo y vivenciado, desconocimiento de los
procesos subyacentes, criterios moralizantes, relaciones entre individuos, cada
relación vista de manera aislada.
C2. Visión sistémica y compleja, caracterizada por:
imagen de la realidad como conjunto de sistemas que se relacionan (físico, social,
biológico etc.), imagen compuesta por relaciones causa-efecto, relaciones dinámicas,
relaciones de interconexión y interdependencia, relaciones de causalidad compleja
(cadenas, bucles, redes, ciclos) y multi-causalidad, recursividad, dilogía, hologramía,
relaciones entre poblaciones, superación del subjetivismo, adopción de distintas
perspectivas, lejano y oculto, comprensión de los procesos subyacentes, capacidad
de considerar varios aspectos simultanea mente, capacidad de seriar, descomponer,
clasificar, de percepción de la compleja trama que constituye un tejido de diferentes
niveles organizativos de la realidad.
La definición de estas dos categorías nos ha permitido ordenar y categorizar el gran
número de relaciones sugeridas por los entrevistados en los mapas de foto de la pregunta
6, donde se pedía conectar dos a dos los elementos expuestos (fotos, imágenes, frases),
explicando con una breve frase la relación establecida internamente en cada pareja.
Ya que todas las relaciones han sido trazadas como relaciones aisladas, casi sin
cadenas, bucles o interdependencia, estas se han podido representar en una tabla de
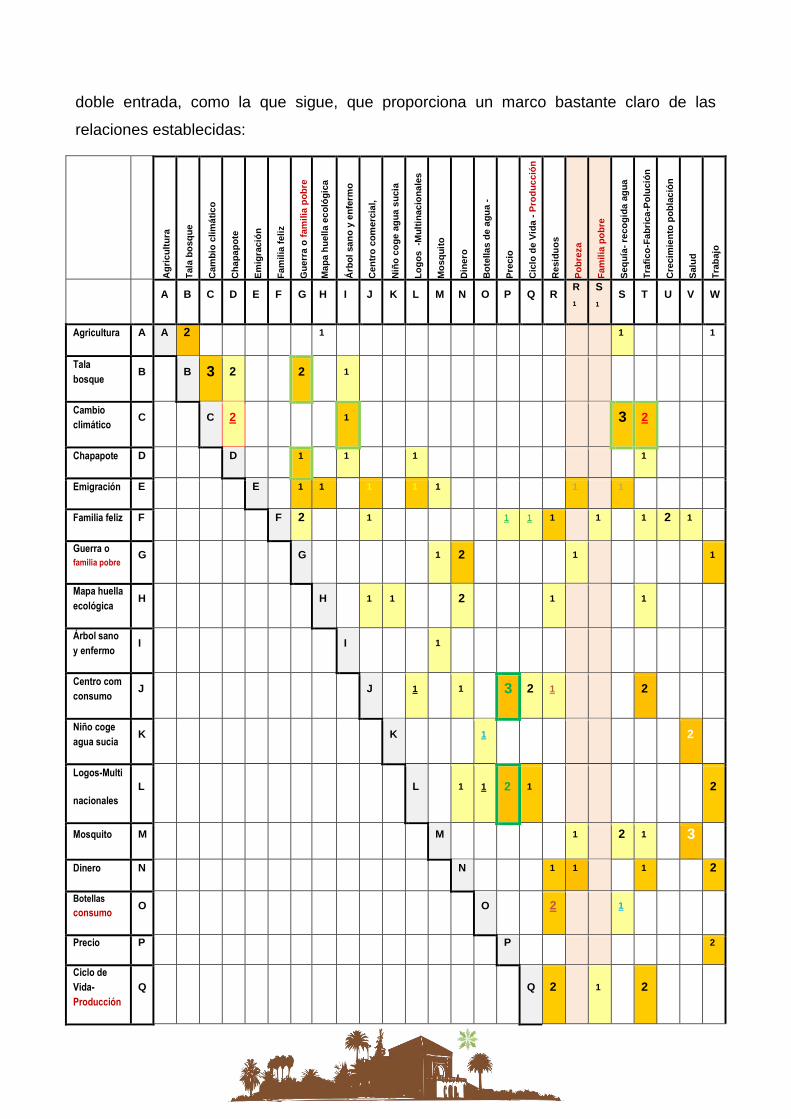
doble entrada, como la que sigue, que proporciona un marco bastante claro de las
relaciones establecidas:
A
gri
cult
ura
Tal
a b
osq
ue
Cam
bio
clim
átic
o
Ch
apap
ote
Em
igra
ció
n
Fam
ilia
feliz
Gu
erra
o f
amili
a p
ob
re
Map
a h
uel
la e
coló
gic
a
Árb
ol s
ano
y e
nfe
rmo
Cen
tro
co
mer
cial
, co
nsu
mo
N
iño
co
ge
agu
a su
cia
Lo
go
s -
Mu
ltin
acio
nal
es
Mo
squ
ito
Din
ero
Bo
tella
s d
e ag
ua
- co
nsu
mo
P
reci
o
Cic
lo d
e V
ida
- P
rod
ucc
ión
Res
idu
os
Po
bre
za
Fam
ilia
po
bre
Seq
uía
- re
cog
ida
agu
a
Tra
fico
-Fab
rica
-Po
luci
ón
Cre
cim
ien
to p
ob
laci
ón
Sal
ud
Tra
baj
o
A B C D E F G H I J K L M N O P Q R
R
1 S
1 S T U V W
Agricultura A A 2 1 1 1
Tala
bosque B B 3 2 2 1
Cambio
climático C C 2 1 3 2
Chapapote D D 1 1 1 1
Emigración E E 1 1 1 1 1 1 1
Familia feliz F F 2 1 1 1 1 1 1 2 1
Guerra o
familia pobre G G 1 2 1 1
Mapa huella
ecológica H H 1 1 2 1 1
Árbol sano
y enfermo I I 1
Centro com
consumo J J 1 1 3 2 1 2
Niño coge
agua sucia K K 1 2
Logos-Multi
nacionales
L L 1 1 2 1 2
Mosquito M M 1 2 1 3
Dinero N N 1 1 1 2
Botellas
consumo O O 2 1
Precio P P 2
Ciclo de
Vida-
Producción
Q Q 2 1 2
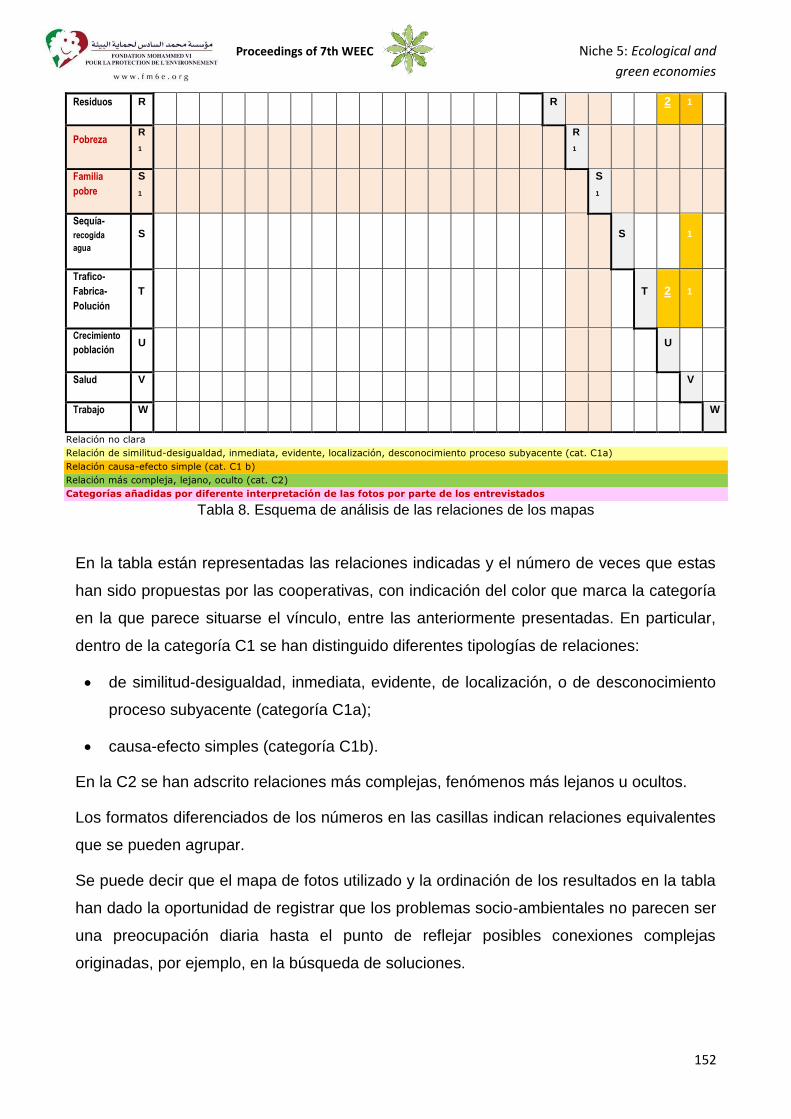
Proceedings of 7th WEEC Niche 5: Ecological and
green economies
152
Residuos R R 2 1
Pobreza R
1
R
1
Familia
pobre
S
1
S
1
Sequía-
recogida
agua
S S 1
Trafico-
Fabrica-
Polución
T T 2 1
Crecimiento
población U U
Salud V V
Trabajo W W
Relación no clara
Relación de similitud-desigualdad, inmediata, evidente, localización, desconocimiento proceso subyacente (cat. C1a)
Relación causa-efecto simple (cat. C1 b)
Relación más compleja, lejano, oculto (cat. C2)
Categorías añadidas por diferente interpretación de las fotos por parte de los entrevistados
Tabla 8. Esquema de análisis de las relaciones de los mapas
En la tabla están representadas las relaciones indicadas y el número de veces que estas
han sido propuestas por las cooperativas, con indicación del color que marca la categoría
en la que parece situarse el vínculo, entre las anteriormente presentadas. En particular,
dentro de la categoría C1 se han distinguido diferentes tipologías de relaciones:
de similitud-desigualdad, inmediata, evidente, de localización, o de desconocimiento
proceso subyacente (categoría C1a);
causa-efecto simples (categoría C1b).
En la C2 se han adscrito relaciones más complejas, fenómenos más lejanos u ocultos.
Los formatos diferenciados de los números en las casillas indican relaciones equivalentes
que se pueden agrupar.
Se puede decir que el mapa de fotos utilizado y la ordinación de los resultados en la tabla
han dado la oportunidad de registrar que los problemas socio-ambientales no parecen ser
una preocupación diaria hasta el punto de reflejar posibles conexiones complejas
originadas, por ejemplo, en la búsqueda de soluciones.
V. CONCLUSIONES
Resumen de los resultadosErrore. Il segnalibro non è definito.
El estudio que presentamos ha nacido del intento de esclarecer cuál es la “imagen que
se tiene desde las empresas de economía social acerca de la
sostenibilidad/insostenibilidad”, y nos ha permitido delinear la visión cognitivo-afectiva
de la sostenibilidad/insostenibilidad que se tiene desde las cooperativas que han
colaborado en la investigación. A continuación se sintetizan los resultados obtenidos
haciendo referencia a las tres dimensiones que han orientado la investigación: la
cognitiva, la afectiva, y la compleja.
Imagen cognitiva: idea de sostenibilidad/insostenibilidad
Se percibe un general desconocimiento del significado de sostenibilidad, cosa admitida
por los propios entrevistados.
Su imagen más espontanea emerge cuando la pregunta se plantea de una forma
completamente abierta, a raíz de la que vincula la idea de sostenibilidad, de un lado, con
el respeto a los recursos naturales y con la herencia que se deja a las generaciones
futuras, y por otro con la competitividad y perdurabilidad de la empresa, convirtiendo este
constructo más en un medio o en una estrategia al servicio de la empresa, que en un fin
en sí mismo.
En general se revela un importante desconocimiento del término, lo que se manifiesta a
través de respuestas descriptivas de corte teleológico que lo elevan al estatus de un fin en
sí mismo.
En otros casos, se evidencia una acepción muy estrecha de esta noción, vinculándose a
campos muy específicos o concretos, como era el caso de aquel sujeto que relacionaba
sostenibilidad solo con el ámbito de la construcción.
La indagación en más profundidad, a través de la descomposición del concepto de
sostenibilidad en su tres componentes (social, económico y natural) por parte del
investigador, ha permitido enriquecer la imagen de este constructo apareciendo nuevos
elementos que no salían a la luz de forma espontánea: guerras, precios, migraciones,
inequidad, salarios.
Proceedings of 7th WEEC Niche 5: Ecological and
green economies
154
Posteriormente, se han extrapolado ulteriores elementos que completan la imagen
cognitiva de sostenibilidad/insostenibilidad de los participantes: desempleo, crisis
económica, hambre.
Estos elementos, sin embargo, parecen quedar desligados de los comportamientos
sostenibles puestos en marcha por una cooperativa, ya que nunca, a pesar de la solicitud
de clarificación por parte del entrevistador, surgieron explicaciones de como las iniciativas
de reducción de impactos alegadas por los entrevistados puedan influir sobre estas
problemáticas.
Esto en general revela un desconocimiento de los procesos subyacentes a ciertos
fenómenos, que viene confirmado por los resultados del análisis de la visión compleja que
veremos después. De hecho, desde el conjunto del análisis de la información, los temas
de la globalización y del cambio climático parecen un poco más conocidos que muchos
otros como los diferentes matices de los problemas del precio de los productos más
sostenibles, de las guerras y de las violaciones de derechos humanos, de la química y de
los derechos en agricultura.
Parecen también bastantes lejanos, conceptos como recursos renovables, emisiones y
diferencias entre países, comercio justo, desertización y otros fenómenos consiguientes al
cambio climático, responsabilidad del productor, potencial de ahorro energético; mientras
que se ignoran casi totalmente nociones como las de huella ecológica y de ciclo de vida
del producto, y sobre todo del potencial de reducción de los impactos de una empresa.
Imagen afectiva: predisposición, preocupaciones, motivaciones
Con respecto a la dimensión afectiva y actitudinal, se han vislumbrado las principales
problemáticas debidas al actual modelo de producción y consumo que, según las
declaraciones, preocupan y motivan los participantes con vistas a plantear estrategias de
reducción de los impactos de su empresa y sus productos.
Se nota una generalizada conciencia de la necesidad de profundizar en el tema de la
‘sostenibilidad’, aunque las justificaciones aportadas son diferentes y confirman las
inquietudes manifestadas en su anterior definición espontanea de ‘sostenibilidad’:
recursos naturales, generaciones futuras y empresa.
Por otro lado, al intento de profundizar del investigador, se evidencia una posible
necesidad difusa de reflexión sobre las razones inconscientes o inexploradas de la
actuación sostenible por parte de los entrevistados, vista la total tendencia a presentar lo
que se hace en la cooperativa para reducir impactos, en lugar del “porqué”. Esto puede
ser explicado también por la necesidad y el orgullo de resaltar los propios esfuerzos.
Con respecto a las problemáticas de nuestro tiempo, las más sentidas aparecen las
cuestiones relacionadas al excesivo consumismo, a la falta de educación y de
valores, a la globalización y a la escasez de recursos económicos. Aspectos todos
ellos que podrían no reflejar su visión objetiva del estado del Mundo, sino que más bien
reflejarían una preocupación muy personal y cotidiana, debida al contexto actual de crisis
de valores y, sobre todo, de la economía.
Las principales razones, declaradas como más motivadoras en la actuación sostenible,
son un sentido general de responsabilidad personal o cooperativa, la necesidad de
proteger los recursos naturales, el respeto para las generaciones futuras, la
generalizada calidad de la vida y el ahorro también económico.
Seguramente existen otros motivos más recónditos, como, por ejemplo, la recuperación
de relaciones sociales e interpersonales perdidas, la salud y el crecimiento de la población
mundial.
Mientras tanto, factores tales como cambio climático, conflictos y competitividad de la
empresa aun, cuando, como se ha visto en el apartado anterior, también se asocian a la
idea de sostenibilidad, parecen tener un menor peso en sus decisiones lo que revela un
posible desconocimiento de la interconexión entre sus comportamientos y algunos de sus
valores.
Finalmente, conviene hacer notar la incomprensión de responsabilidades y
potencialidades de actuación personal, probablemente debida a una falta de conocimiento
o a una creencia de control externo, en el sentido que consideran fuera de su
responsabilidad los problemas que están planteando.
Perspectiva compleja
Para explorar esta componente de la imagen de sostenibilidad/insostenibilidad, se han
observado las relaciones que los participantes ven entre los elementos que influyen en la
sostenibilidad, representados por algunas imágenes de problemáticas o realidades
actuales, en un mapa de imágenes ideado para la ocasión.
Proceedings of 7th WEEC Niche 5: Ecological and
green economies
156
El cuadro que deriva es un conjunto de relaciones aisladas, casi sin cadenas, bucles o
interdependencias. La mayoría son sencillas, de similitud o disimilitud o de causa-efecto
bastante simples. En pocos casos aparecen relaciones menos evidentes o que no fuesen
inmediatas, y solo excepcionalmente se registraron relaciones de interdependencia y
cadenas, casi todos ellas expresados en la entrevista realizada al sensibilizador
ambiental.
Aparecen algunas multi-causalidades y consecuencias múltiples para algunos fenómenos
como el cambio climático y las migraciones, pero no son expresadas directamente. Al
contrario de otros casos, la dificultad de indicar relaciones causa–efecto es muy fuerte y
esto puede reflejar una perspectiva bastante reduccionista.
Además, el “porqué” las problemáticas que parecen más alejadas de nuestros
comportamientos (guerras, migraciones, desigualdades…), son consecuencias de nuestro
modelo de producción y consumo, prácticamente no llega a ser expresado en casi ningún
caso.
En conclusión, si se toma como referencia la definición de “Complejo” derivada de los
textos de Edgar Morin (1999), se puede decir que los problemas socio-económico-
ambientales no parecen ser una preocupación tan profunda y cotidiana para los
participantes, hasta el punto de buscar y explorar soluciones y procesos que pueden
llevar al establecimiento de conexiones más complejas:
“Complexus significa lo que está tejido junto. En efecto, hay complejidad cuando son
inseparables los distintos elementos que contribuyen un todo (como el económico, el
político, el sociológico, el sicológico, el afectivo, el mitológico) y que existe un tejido
interdependiente, interactivo e inter-retroactivo entre el objeto de conocimiento y su
contexto, las partes y el todo, el todo y las partes, las partes entre ellas.” (Morin 1999)
Solamente en el caso de las cuestiones relacionadas con la economía, tan cercanas a
ellos, salen propuestas de soluciones que testimonian una cierta reflexión.
VI. BIBLIOGRAFÍA
AA. VV. (2006). Estrategia Andaluza de Educación Ambiental (EAdEA). Sevilla: Junta de
Andalucía.
Agencia del Medio Ambiente, Consejería de Educación y Ciencia (1992). Orientaciones
Didácticas para la Educación Ambiental en Educación Primaria del Programa de
Educación Ambiental «ALDEA». Sevilla: Junta de Andalucía.
Agencia del Medio Ambiente, Consejería de Educación y Ciencia (1992). Orientaciones
Didácticas para la Educación Ambiental en Educación Secundaria del Programa de
Educación Ambiental «ALDEA». Sevilla: Junta de Andalucía.
Bonil, J., Junyent, M. y Pujol, R.M. (2010). Educación para la Sostenibilidad desde la
perspectiva de la complejidad. Eureka, 7, Número Extraordinario, 198-215.
Capra, F. (1996). La trama de la vida, una nueva perspectiva de los sistemas vivos.
Barcelona: Anagrama
Cañal, P. y Vilches, A. (2009). El rechazo del desarrollo sostenible: ¿una crítica
justificada?. Enseñanza de las Ciencias, Número Extra VIII Congreso Internacional
sobre Investigación en Didáctica de las Ciencias, Barcelona, 676-679
Carson, R. (1962). Silent spring. Houghton Mifflin.
Comisión de las Comunidades Europeas (2001). Libro Verde. Fomentar un marco
europeo para la responsabilidad social de las empresas. Comisión Europea.
Comisión Mundial sobre Medio Ambiente y Desarrollo (1986). Informe Brundtland: Nuestro
futuro común. Naciones Unidas.
CSR Europe (2009). A guide to CSR in Europe: Country Insights by CSR Europe’s
National Partner Organisations. CSR Europe.
Delors, J. et al. (1996). Informe, La educación encierra un tesoro. Paris: UNESCO.
Doppelt, B. (2003). Overcoming the seven sustainability blunders. The systems thinker, 14
(5).
Forética (2011). Informe Forética: Evolución de la Responsabilidad Social de las
empresas en España. Madrid: Autor.
Proceedings of 7th WEEC Niche 5: Ecological and
green economies
158
Integralia S. Coop. And. de Interés Social (2007). Informe La Responsabilidad Social
Empresarial en las Empresas Andaluzas de Economía Social. Junta de Andalucía y
CEPES-A.
Meadows, D.H., Meadows, D.L., Randers, J. y Behrems, W.W. (1972). Los límites del
crecimiento. Informe preparado por el MIT para el Club de Roma. Nueva York:
Universe Books.
Miljövern Departement et, Norwegian Ministry of the Environment (1995). Report, Oslo
Ministerial Roundtable, Miljövern Departement et, Oslo.
Moreno, J. A. (2011). Paisaje después de una década. Diario responsable. Recuperado
febrero 2, 2011 desde
http://www.diarioresponsable.com/buen-gobierno/codigos/12993-paisaje-despues-
de-una-decada.html
Morin, E. (1999). Los siete saberes necesarios para la educación del futuro. Paris:
UNESCO.
Murray, P. (2011). The Sustainable Self: A Personal Approach to Sustainability Education.
Oxford: Earthscan.
Strachan, G. (2009). Systems Thinking: The ability to recognize and analyze the
interconnections within and between systems. Chapter 11 in Stibbe A (ed.) The
Handbook of Sustainability Literacy: Skills for a changing world. Devon: Green
Books.
Tilbury, D., Adams, K. and Keogh, A. (2005). A National Review of Environmental
Education and its Contribution to Sustainability in Australia: Business and Industry
Education. Canberra: Australian Government Department for the Environment and
Heritage and Australian Research Institute in Education for Sustainability (ARIES).
Tilbury, D., Crawley, C. and Berry, F. (2004). Education About and For Sustainability in
Australian Business Schools. Informe preparado por el Australian Research
Institute in Education for Sustainability (ARIES) y el Arup Sustainability para el
Departamento de medio ambiente y patrimonio del Gobierno australiano.
Survay of cost for deployment of sustainability in a residence
The cost difference between a residence and a sustainable conventional residence
William de AraujoThomaz, Federal University of Technology - Toledo, Brazil
Lucia Bressiani, Federal University of Technology - Toledo, Brazil
ABSTRACT
Sustainability in buildings has been the focus of several studies, which are presented ways
to incorporate it in homes, highlighting the benefits obtained. But for many it is still
unknown and their misinterpretation. Some believe that to have a sustainable residence is
necessary to use techniques that involve high costs. Or just link sustainability with rusticity
and environments with excess plants. Thus, this paper aims to present concepts of
sustainability that could be inserted into a residence presenting costs compared to a
residence sustainable system.
1. INTRODUCTION
The current scenario where the planet is an environmental crisis reveals worrying. This
can be verified through the global effects, such as climate change, the depletion of natural
resources, pollution of water, soil and air. In this context, the construction industry
contributes to this scenario, because in the whole process consumes energy and natural
resources, generating pollution and waste that are released in the wild.
The sector was not concerned with specific techniques and improved since that would
meet the basic human accuracies in the past. However, over the years, not only the simple
buildings, but also the urbanization of cities and constitutions required a qualification most
appropriate construction method.
As a result, it is possible to see several initiatives to adopt practices and construction
processes that contribute to greater sustainability in the construction industry.
After the Brundtland Report (1987), the existing techniques began to be improved and new
ones began to appear, mainly because of the incentive for study and research in the world,
for the formation of the current parameters on environmental issues.
Thus, knowing the importance sustainable building and its relationship between man/
environment, this paper aims to expose the issue of sustainability in construction through a
survey of the cost to implement the same in a residence. The paper attempts to insert
Proceedings of 7th WEEC Niche 5: Ecological and
green economies
160
concepts that do not require sophisticated techniques, showing that it is possible to insert
sustainability concepts even through the planning of more efficient equipment.
2. SUSTAINABILITY AND SUSTAINABLE DEVELOPMENT
After discussions in 1960 and 1970 resulted in a forecast catastrophic for the planet's
future, if the developmental pattern remained on the mold of the current time, it was
necessary to conduct research related to the environment correlating with the
development. Thus emerged the first comments on sustainability and consequently reports
regarding, among them, the Brundtland Report: Our Common Future (1987), which
included the concept of sustainable development more accepted today. However,
according to Guimarães (1998), at the Stockholm Conference in 1972 are contained in the
roots of the concept on the topic, which focused on the negative impacts of the
development on the environment.
The concept of sustainability can be summarized to the following sentence: "meet the
needs of the present without compromising the ability of future generations to meet their
own needs" (WCED, 1987, p. 9).
These changes create the need to educate society about the social and environmental
situation in which it is, in order to it can make to participate in defining the course of
development you wish. Also requires thinking strategically the positive and negative
impacts of decisions and actions taken by the company, which means stop to aim only the
economic return and incorporate other dimensions to the evaluation of reality. This leads
us to think about the commitment and responsibility of present generations in relation to
future generations. (CORREA, 2009)
3. SUSTAINABILITY IN BUILDING CONSTRUCTION
According to Correa (2009), in recent years, companies have changed their way of
conducting their work. They aim systems and sustainable solutions that are economically
relevant and viable for the enterprise, engaging in the building industry, since it is a
growing trend in the market.
Among these systems, it is necessary that they are contained in four basic parameters:
Environment adequacy;
Economic viability;
Social justice;
Acceptance cultural.
It is also necessary to have the notion that sustainable construction must be present
throughout the development cycle, from conception to demolition and a breakdown of what
can be done at each stage of the construction, in other words, demonstrating
environmental aspects and impacts and how these items should be worked enables the
enterprise to an idea not only sustainable, but also a sustainable housing. (GUIMARÃES,
1998).
According to Correa (2009), the construction industry has been pressured to incorporate
sustainable practices into their activities. Thus, there is a tendency that the adoption of
these practices becomes increasing. However, the companies need to change the way
you design and manage their construction, and shall include progressively sustainability,
ensuring that in each work are planned relevant and economically viable solutions for the
enterprise.
However, for some companies, the issue of higher costs of sustainable construction is
seen as a barrier (SALGADO, CHATELET, FERNANDEZ, 2012).
According to the authors, in Brazil there is still no standards requiring reductions in energy
consumption and designing buildings more efficient. And perhaps this is the reason for the
slow deployment of sustainable construction in the country.
4. METHODOLOGY
4.1. Case Study
With respect to procedures, this research is characterized as a case study, because
according to Yin (2005), the method is suitable for cases where purports to relate different
aspects of the same phenomenon.
To conduct the case study, first it was selected a project of a residence. The floor plan is
shown in Figure 1.
After project selection, which refers to a residential building, 70m2, changes were made in
it, in order to embed sustainability concepts.
The goal was to insert basic principles of sustainability, to show that it does not require
large investments, and that sustainability can be associated with simple planning more
efficient materials.
The principles of sustainability are focused on some parts of the project, not being
discussed actions of completion, as reuse of waste or the use of raw materials that
contribute to eco-efficiency.
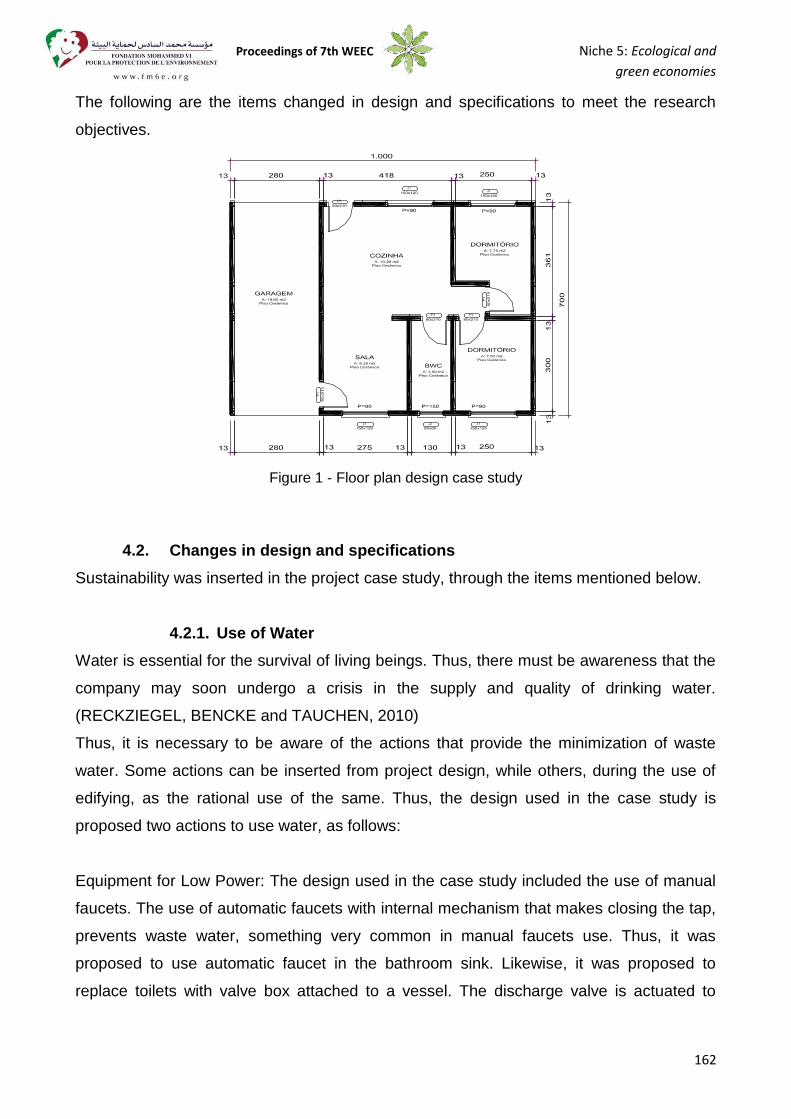
Proceedings of 7th WEEC Niche 5: Ecological and
green economies
162
The following are the items changed in design and specifications to meet the research
objectives.
Figure 1 - Floor plan design case study
4.2. Changes in design and specifications
Sustainability was inserted in the project case study, through the items mentioned below.
4.2.1. Use of Water
Water is essential for the survival of living beings. Thus, there must be awareness that the
company may soon undergo a crisis in the supply and quality of drinking water.
(RECKZIEGEL, BENCKE and TAUCHEN, 2010)
Thus, it is necessary to be aware of the actions that provide the minimization of waste
water. Some actions can be inserted from project design, while others, during the use of
edifying, as the rational use of the same. Thus, the design used in the case study is
proposed two actions to use water, as follows:
Equipment for Low Power: The design used in the case study included the use of manual
faucets. The use of automatic faucets with internal mechanism that makes closing the tap,
prevents waste water, something very common in manual faucets use. Thus, it was
proposed to use automatic faucet in the bathroom sink. Likewise, it was proposed to
replace toilets with valve box attached to a vessel. The discharge valve is actuated to
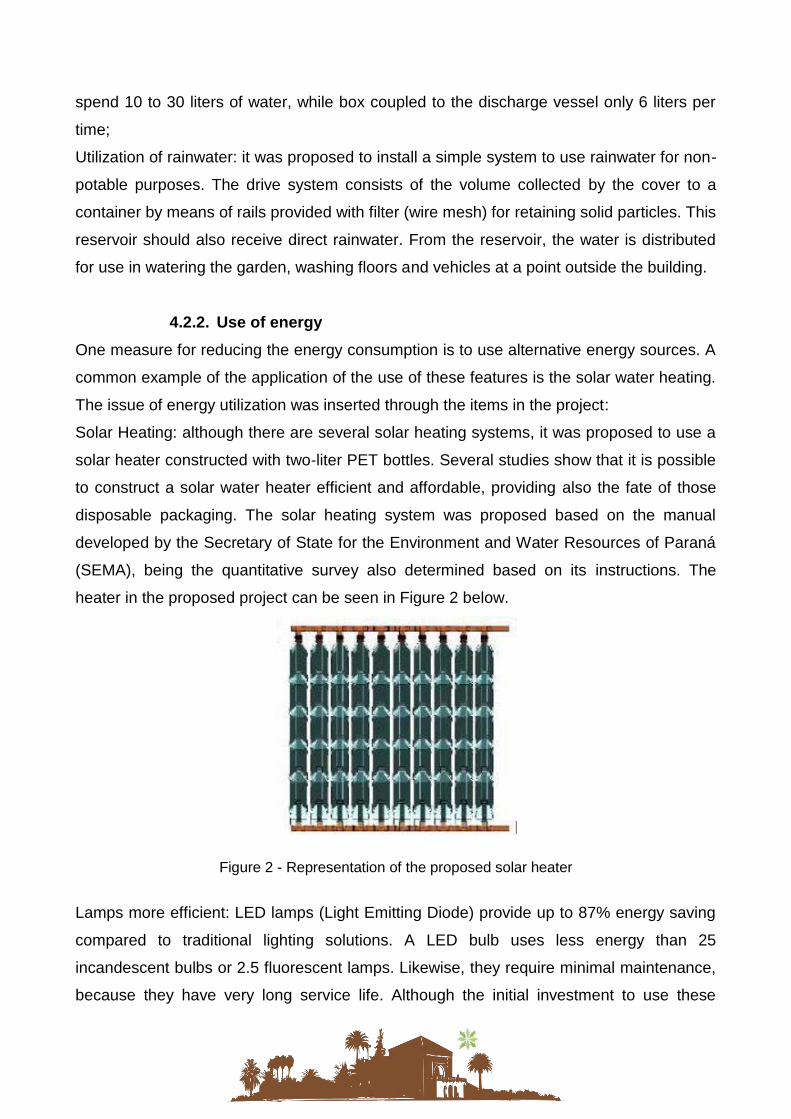
spend 10 to 30 liters of water, while box coupled to the discharge vessel only 6 liters per
time;
Utilization of rainwater: it was proposed to install a simple system to use rainwater for non-
potable purposes. The drive system consists of the volume collected by the cover to a
container by means of rails provided with filter (wire mesh) for retaining solid particles. This
reservoir should also receive direct rainwater. From the reservoir, the water is distributed
for use in watering the garden, washing floors and vehicles at a point outside the building.
4.2.2. Use of energy
One measure for reducing the energy consumption is to use alternative energy sources. A
common example of the application of the use of these features is the solar water heating.
The issue of energy utilization was inserted through the items in the project:
Solar Heating: although there are several solar heating systems, it was proposed to use a
solar heater constructed with two-liter PET bottles. Several studies show that it is possible
to construct a solar water heater efficient and affordable, providing also the fate of those
disposable packaging. The solar heating system was proposed based on the manual
developed by the Secretary of State for the Environment and Water Resources of Paraná
(SEMA), being the quantitative survey also determined based on its instructions. The
heater in the proposed project can be seen in Figure 2 below.
Figure 2 - Representation of the proposed solar heater
Lamps more efficient: LED lamps (Light Emitting Diode) provide up to 87% energy saving
compared to traditional lighting solutions. A LED bulb uses less energy than 25
incandescent bulbs or 2.5 fluorescent lamps. Likewise, they require minimal maintenance,
because they have very long service life. Although the initial investment to use these
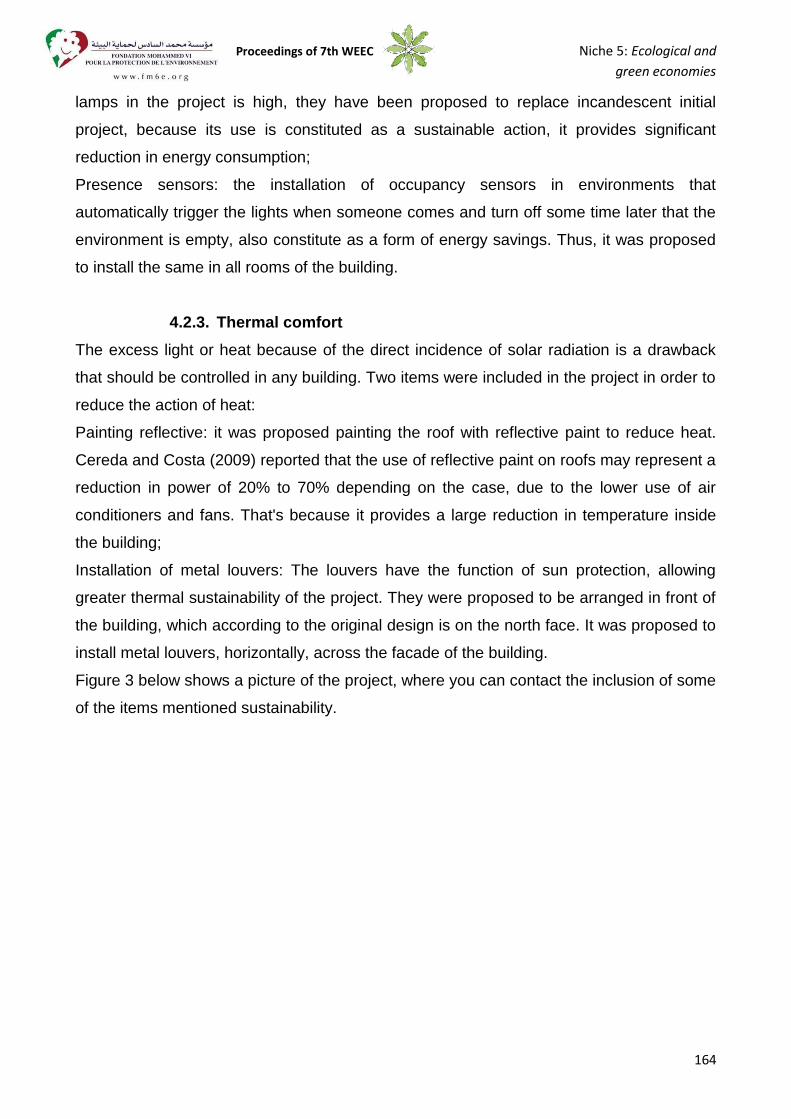
Proceedings of 7th WEEC Niche 5: Ecological and
green economies
164
lamps in the project is high, they have been proposed to replace incandescent initial
project, because its use is constituted as a sustainable action, it provides significant
reduction in energy consumption;
Presence sensors: the installation of occupancy sensors in environments that
automatically trigger the lights when someone comes and turn off some time later that the
environment is empty, also constitute as a form of energy savings. Thus, it was proposed
to install the same in all rooms of the building.
4.2.3. Thermal comfort
The excess light or heat because of the direct incidence of solar radiation is a drawback
that should be controlled in any building. Two items were included in the project in order to
reduce the action of heat:
Painting reflective: it was proposed painting the roof with reflective paint to reduce heat.
Cereda and Costa (2009) reported that the use of reflective paint on roofs may represent a
reduction in power of 20% to 70% depending on the case, due to the lower use of air
conditioners and fans. That's because it provides a large reduction in temperature inside
the building;
Installation of metal louvers: The louvers have the function of sun protection, allowing
greater thermal sustainability of the project. They were proposed to be arranged in front of
the building, which according to the original design is on the north face. It was proposed to
install metal louvers, horizontally, across the facade of the building.
Figure 3 below shows a picture of the project, where you can contact the inclusion of some
of the items mentioned sustainability.
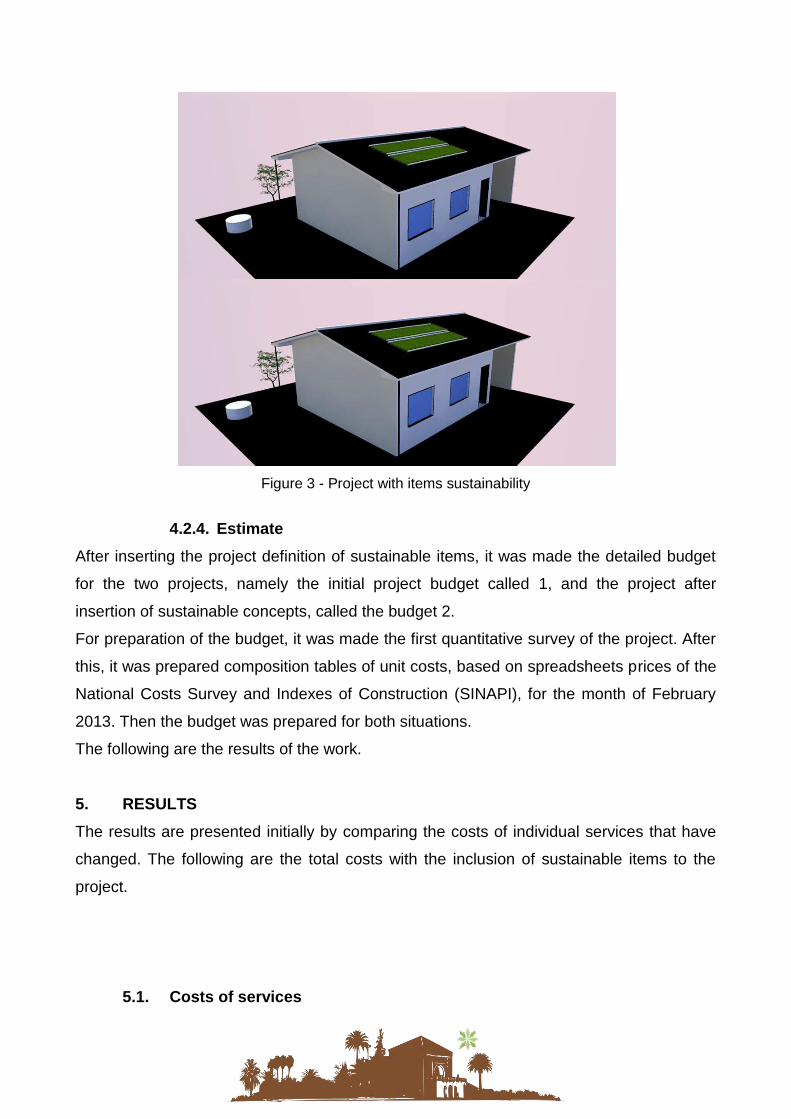
Figure 3 - Project with items sustainability
4.2.4. Estimate
After inserting the project definition of sustainable items, it was made the detailed budget
for the two projects, namely the initial project budget called 1, and the project after
insertion of sustainable concepts, called the budget 2.
For preparation of the budget, it was made the first quantitative survey of the project. After
this, it was prepared composition tables of unit costs, based on spreadsheets prices of the
National Costs Survey and Indexes of Construction (SINAPI), for the month of February
2013. Then the budget was prepared for both situations.
The following are the results of the work.
5. RESULTS
The results are presented initially by comparing the costs of individual services that have
changed. The following are the total costs with the inclusion of sustainable items to the
project.
5.1. Costs of services
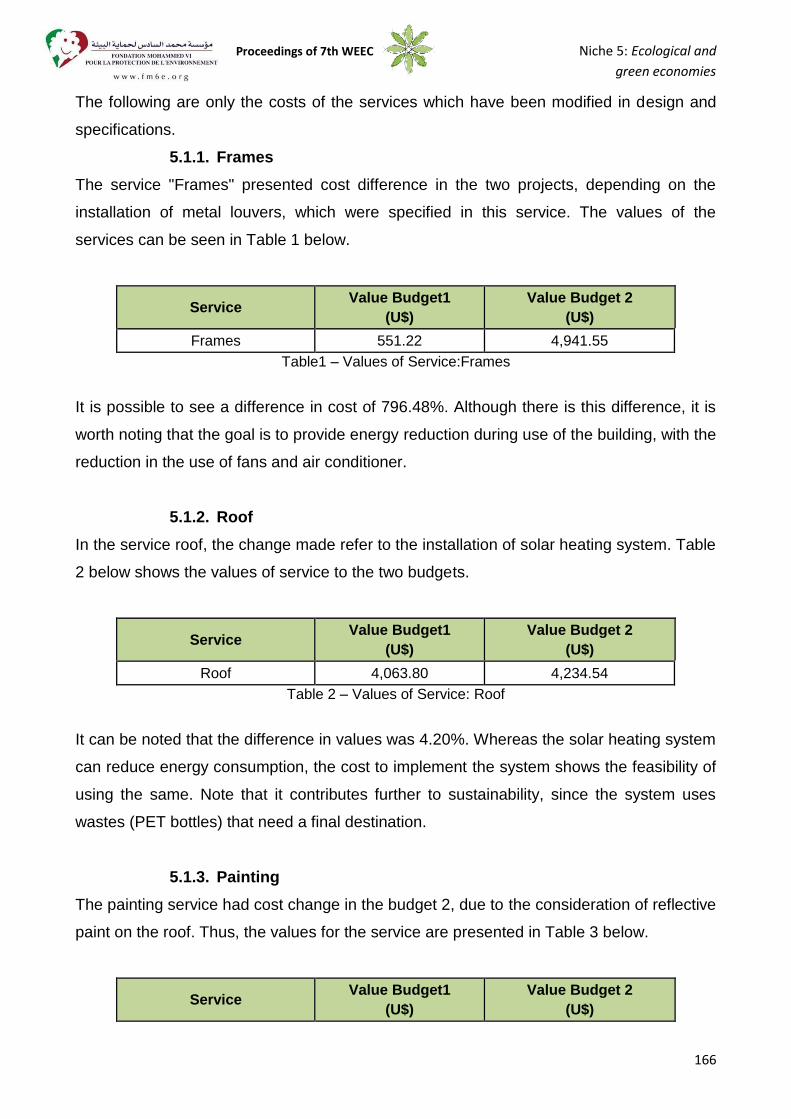
Proceedings of 7th WEEC Niche 5: Ecological and
green economies
166
The following are only the costs of the services which have been modified in design and
specifications.
5.1.1. Frames
The service "Frames" presented cost difference in the two projects, depending on the
installation of metal louvers, which were specified in this service. The values of the
services can be seen in Table 1 below.
Service Value Budget1
(U$) Value Budget 2
(U$)
Frames 551.22 4,941.55 Table1 – Values of Service:Frames
It is possible to see a difference in cost of 796.48%. Although there is this difference, it is
worth noting that the goal is to provide energy reduction during use of the building, with the
reduction in the use of fans and air conditioner.
5.1.2. Roof
In the service roof, the change made refer to the installation of solar heating system. Table
2 below shows the values of service to the two budgets.
Service Value Budget1
(U$) Value Budget 2
(U$)
Roof 4,063.80 4,234.54 Table 2 – Values of Service: Roof
It can be noted that the difference in values was 4.20%. Whereas the solar heating system
can reduce energy consumption, the cost to implement the system shows the feasibility of
using the same. Note that it contributes further to sustainability, since the system uses
wastes (PET bottles) that need a final destination.
5.1.3. Painting
The painting service had cost change in the budget 2, due to the consideration of reflective
paint on the roof. Thus, the values for the service are presented in Table 3 below.
Service Value Budget1
(U$) Value Budget 2
(U$)
Painting 3,945.73 4,356.44 Table 3 – Values of Service: Painting
The painting of the roof represents an additional cost of 10.41%. However, in the same
way that the application of the louvers, it aims to provide future reduction of energy
consumption, due to the reduction of heat provided to the application of paint on the roof.
5.1.4. Electrical installations
The electrical service is presented to show the same variation cost, lighting fixtures using
low consumption and occupancy sensors environments.
Table 4 shows the values for the two situations, in other words, use of incandescent and
without the use of sensors (budget 1) and LED lamps and sensors in all environments
(budget 2).
Service Value Budget1
(U$) Value Budget 2
(U$)
ElectricalInstallations 1,590.65 1,945.53 Table 4 – Values of Service: Electrical Installations
The cost difference (22.31%) is presented due to the high cost of LED lamps. However, it
is worth noting that this is the initial cost, and provide the same energy-saving and have
very long life.
5.1.5. Installations Sewer and Stormwater
The system of harnessing rainwater for non-potable purposes was inserted into the service
facility wastewater and stormwater. Table 5 shows the values for the two situations, one
where the budget does not include use of water.
Service Value Budget1
(U$) Value Budget 2
(U$) InstallationsSewerandStorm
water 688.78 1,757.69
Table5 – Values of Service: Installations Sewer and Stormwater
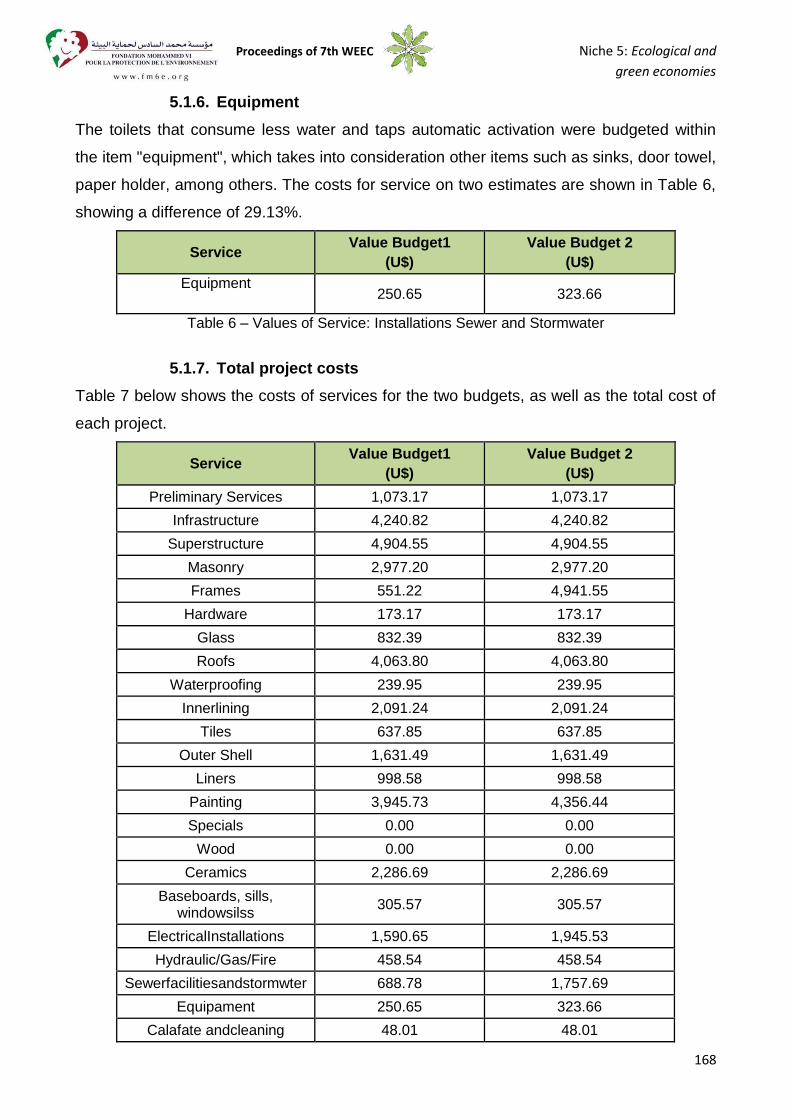
Proceedings of 7th WEEC Niche 5: Ecological and
green economies
168
5.1.6. Equipment
The toilets that consume less water and taps automatic activation were budgeted within
the item "equipment", which takes into consideration other items such as sinks, door towel,
paper holder, among others. The costs for service on two estimates are shown in Table 6,
showing a difference of 29.13%.
Service Value Budget1
(U$) Value Budget 2
(U$) Equipment
250.65 323.66
Table 6 – Values of Service: Installations Sewer and Stormwater
5.1.7. Total project costs
Table 7 below shows the costs of services for the two budgets, as well as the total cost of
each project.
Service Value Budget1
(U$) Value Budget 2
(U$)
Preliminary Services 1,073.17 1,073.17
Infrastructure 4,240.82 4,240.82
Superstructure 4,904.55 4,904.55
Masonry 2,977.20 2,977.20
Frames 551.22 4,941.55
Hardware 173.17 173.17
Glass 832.39 832.39
Roofs 4,063.80 4,063.80
Waterproofing 239.95 239.95
Innerlining 2,091.24 2,091.24
Tiles 637.85 637.85
Outer Shell 1,631.49 1,631.49
Liners 998.58 998.58
Painting 3,945.73 4,356.44
Specials 0.00 0.00
Wood 0.00 0.00
Ceramics 2,286.69 2,286.69
Baseboards, sills, windowsilss 305.57 305.57
ElectricalInstallations 1,590.65 1,945.53
Hydraulic/Gas/Fire 458.54 458.54
Sewerfacilitiesandstormwter 688.78 1,757.69
Equipament 250.65 323.66
Calafate andcleaning 48.01 48.01
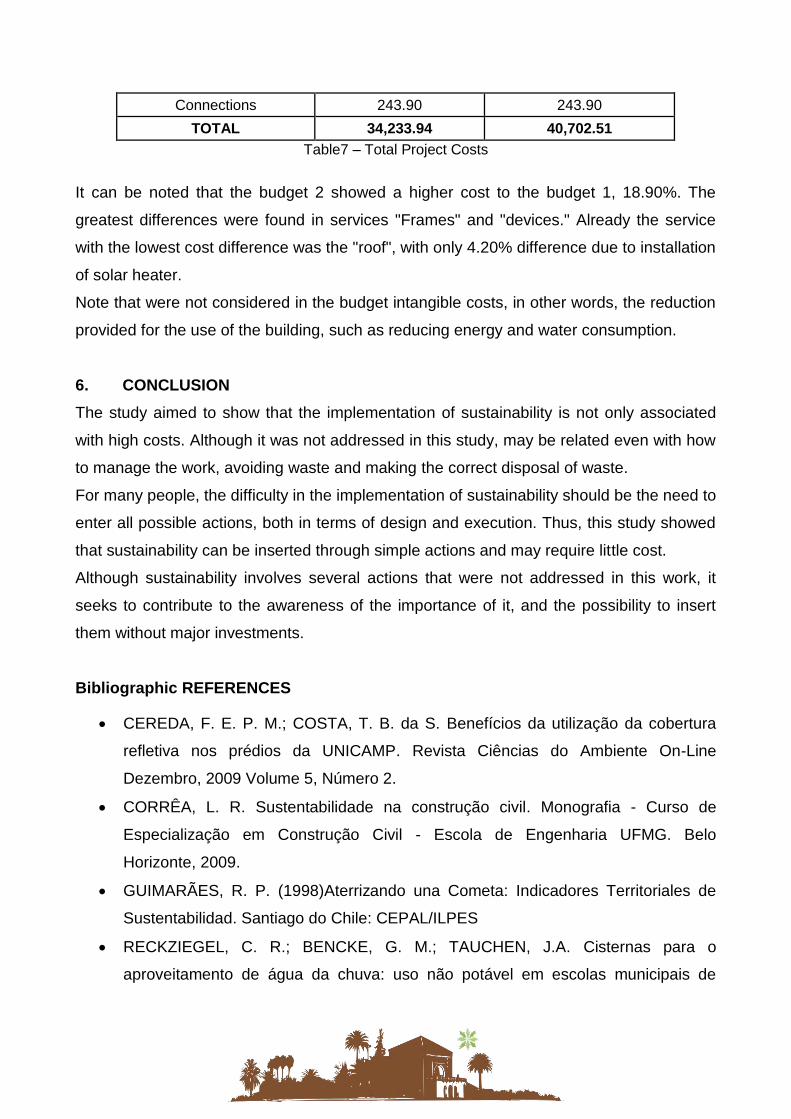
Connections 243.90 243.90
TOTAL 34,233.94 40,702.51 Table7 – Total Project Costs
It can be noted that the budget 2 showed a higher cost to the budget 1, 18.90%. The
greatest differences were found in services "Frames" and "devices." Already the service
with the lowest cost difference was the "roof", with only 4.20% difference due to installation
of solar heater.
Note that were not considered in the budget intangible costs, in other words, the reduction
provided for the use of the building, such as reducing energy and water consumption.
6. CONCLUSION
The study aimed to show that the implementation of sustainability is not only associated
with high costs. Although it was not addressed in this study, may be related even with how
to manage the work, avoiding waste and making the correct disposal of waste.
For many people, the difficulty in the implementation of sustainability should be the need to
enter all possible actions, both in terms of design and execution. Thus, this study showed
that sustainability can be inserted through simple actions and may require little cost.
Although sustainability involves several actions that were not addressed in this work, it
seeks to contribute to the awareness of the importance of it, and the possibility to insert
them without major investments.
Bibliographic REFERENCES
CEREDA, F. E. P. M.; COSTA, T. B. da S. Benefícios da utilização da cobertura
refletiva nos prédios da UNICAMP. Revista Ciências do Ambiente On-Line
Dezembro, 2009 Volume 5, Número 2.
CORRÊA, L. R. Sustentabilidade na construção civil. Monografia - Curso de
Especialização em Construção Civil - Escola de Engenharia UFMG. Belo
Horizonte, 2009.
GUIMARÃES, R. P. (1998)Aterrizando una Cometa: Indicadores Territoriales de
Sustentabilidad. Santiago do Chile: CEPAL/ILPES
RECKZIEGEL, C. R.; BENCKE, G. M.; TAUCHEN, J.A. Cisternas para o
aproveitamento de água da chuva: uso não potável em escolas municipais de
Proceedings of 7th WEEC Niche 5: Ecological and
green economies
170
Horizontina. 1° SAEP – Semana Acadêmica da Engenharia de Produção –
FAHOR. 2010.
SALGADO, M. S.; CHATELET, A.; FERNANDEZ, P. Produção de edificações
sustentáveis: desafios e alternativas. Ambiente Construído, Porto Alegre, v. 12, n.
4, p. 81-99, out./dez. 2012.
Secretaria de Estado do Meio Ambiente e Recursos Hídricos do Paraná (SEMA).
Manual: Aquecedor Solar. 2008.
World Commission on Environment and Development.Report Brundtland: Our
Common Future. ONU, 1987.
YIN, R.(2005) Estudo de Caso. Planejamento e Métodos. Porto Alegre: Bookman.
Study of carbonate concrete
Search for sustainability through compensatory measure
William de AraujoThomaz, Federal University of Technology - Toledo, Brazil
EdnaPossan, Federal University of Latin American Integration - Foz do Iguaçu, Brazil
ABSTRACT
Much has been discussed about the harm arising from the greenhouse effect and possible
solutions to the problem as there is no turning back the development of the planet,
considered the villain of global warming. Attitudes that seek to control and reduce
emissions of carbon dioxide are currently the subject of worldwide research, which seek to
unite technology and sustainability research. One alternative is the CO2 capture and
sequestration. For being a natural process and is directly linked to the construction
industry, the carbonation process was selected for this study.
1. INTRODUCTION
Increased production of goods and services to meet the growing consumption needs of the
world population has contributed to environmental imbalance, especially due to extraction
and processing of raw materials. In this sense, the search for sustainability in production
processes has been incorporated in a more substantial way as a strategic objective for
organizations, including the Construction Industry, considered as one of the biggest
consumers of natural resources of the planet.
The construction sector is not only a substantial consumer of natural resources, but also
highly responsible for global warming since the cement industry itself accounts for about 5
to 8% of global emissions of carbon dioxide (CO2) [1, 2]. Half of these emissions are
caused by the calcination process of calcite (CaCO3) to obtain calcium oxide (CaO)
(CaCO3 → CaO + CO2), which is a major component of clinker, the main compound of
cement. The rest comes from the production
Concrete, basically composed of a mixture of cement, aggregates and water, is the main
raw material consumed in the world, being widely used in engineering works. Its
production also emits greenhouse gases and requires the extraction of high volumes of
rocks for the production of cement and aggregates. However, when compared to other
construction materials, concrete is compatible with the environment; it has the ability to be
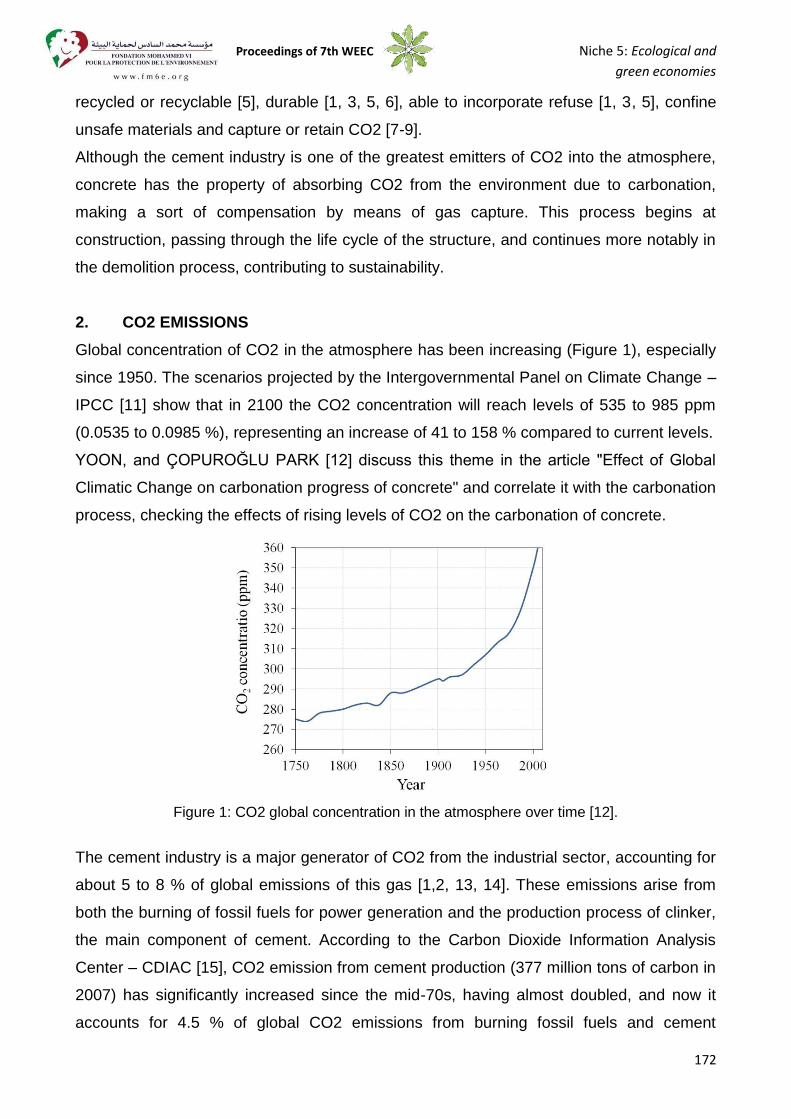
Proceedings of 7th WEEC Niche 5: Ecological and
green economies
172
recycled or recyclable [5], durable [1, 3, 5, 6], able to incorporate refuse [1, 3, 5], confine
unsafe materials and capture or retain CO2 [7-9].
Although the cement industry is one of the greatest emitters of CO2 into the atmosphere,
concrete has the property of absorbing CO2 from the environment due to carbonation,
making a sort of compensation by means of gas capture. This process begins at
construction, passing through the life cycle of the structure, and continues more notably in
the demolition process, contributing to sustainability.
2. CO2 EMISSIONS
Global concentration of CO2 in the atmosphere has been increasing (Figure 1), especially
since 1950. The scenarios projected by the Intergovernmental Panel on Climate Change –
IPCC [11] show that in 2100 the CO2 concentration will reach levels of 535 to 985 ppm
(0.0535 to 0.0985 %), representing an increase of 41 to 158 % compared to current levels.
YOON, and ÇOPUROĞLU PARK [12] discuss this theme in the article "Effect of Global
Climatic Change on carbonation progress of concrete" and correlate it with the carbonation
process, checking the effects of rising levels of CO2 on the carbonation of concrete.
Figure 1: CO2 global concentration in the atmosphere over time [12].
The cement industry is a major generator of CO2 from the industrial sector, accounting for
about 5 to 8 % of global emissions of this gas [1,2, 13, 14]. These emissions arise from
both the burning of fossil fuels for power generation and the production process of clinker,
the main component of cement. According to the Carbon Dioxide Information Analysis
Center – CDIAC [15], CO2 emission from cement production (377 million tons of carbon in
2007) has significantly increased since the mid-70s, having almost doubled, and now it
accounts for 4.5 % of global CO2 emissions from burning fossil fuels and cement
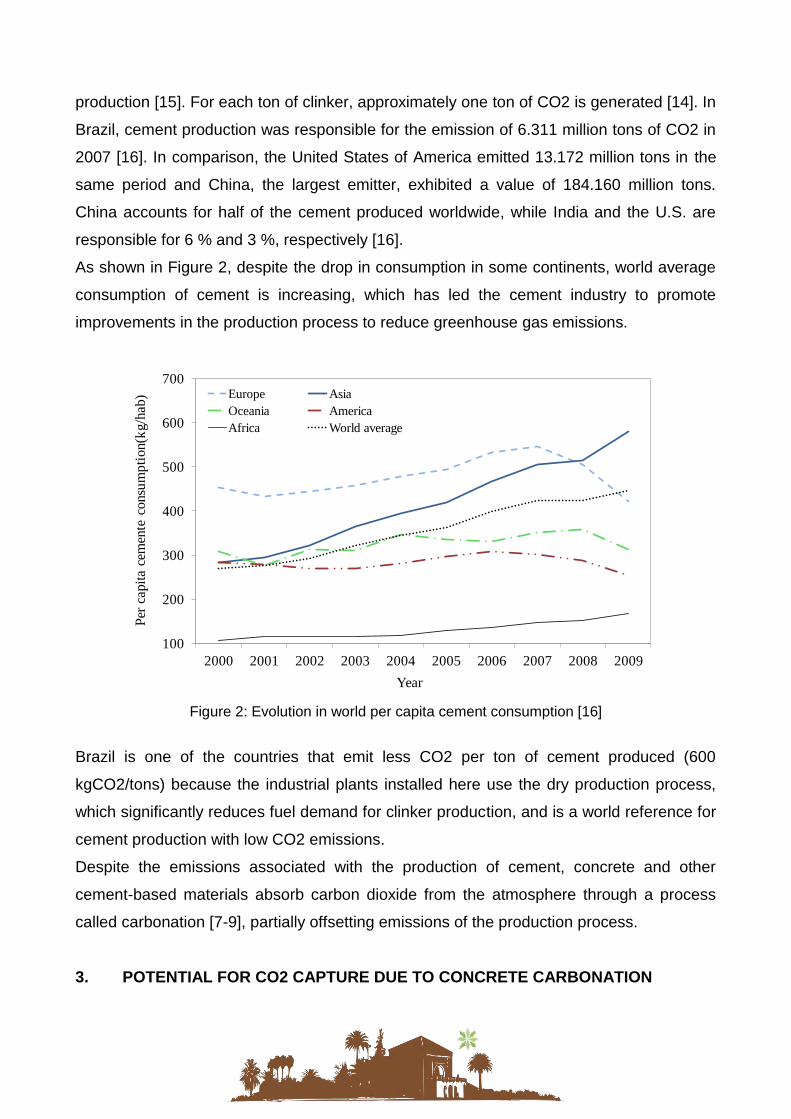
production [15]. For each ton of clinker, approximately one ton of CO2 is generated [14]. In
Brazil, cement production was responsible for the emission of 6.311 million tons of CO2 in
2007 [16]. In comparison, the United States of America emitted 13.172 million tons in the
same period and China, the largest emitter, exhibited a value of 184.160 million tons.
China accounts for half of the cement produced worldwide, while India and the U.S. are
responsible for 6 % and 3 %, respectively [16].
As shown in Figure 2, despite the drop in consumption in some continents, world average
consumption of cement is increasing, which has led the cement industry to promote
improvements in the production process to reduce greenhouse gas emissions.
Figure 2: Evolution in world per capita cement consumption [16]
Brazil is one of the countries that emit less CO2 per ton of cement produced (600
kgCO2/tons) because the industrial plants installed here use the dry production process,
which significantly reduces fuel demand for clinker production, and is a world reference for
cement production with low CO2 emissions.
Despite the emissions associated with the production of cement, concrete and other
cement-based materials absorb carbon dioxide from the atmosphere through a process
called carbonation [7-9], partially offsetting emissions of the production process.
3. POTENTIAL FOR CO2 CAPTURE DUE TO CONCRETE CARBONATION
100
200
300
400
500
600
700
2000 2001 2002 2003 2004 2005 2006 2007 2008 2009
Per
capi
ta c
emen
te c
onsu
mpt
ion(
kg/h
ab)
Year
Europe AsiaOceania AmericaAfrica World average
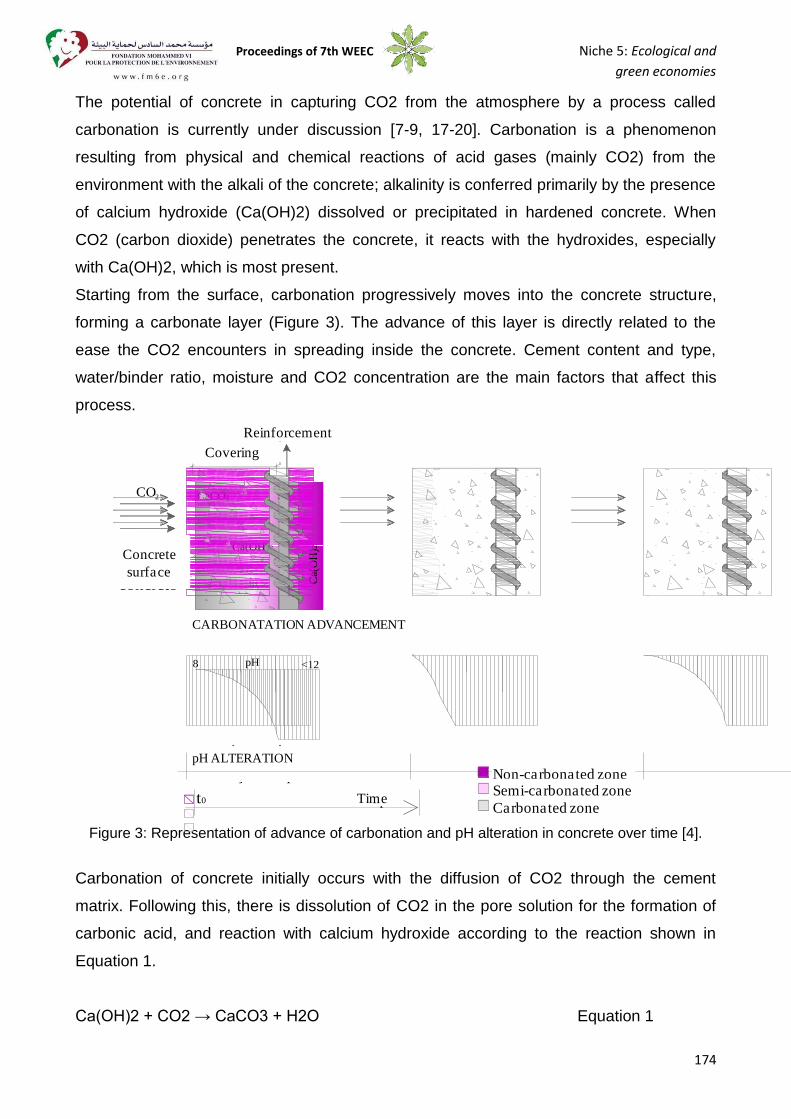
Proceedings of 7th WEEC Niche 5: Ecological and
green economies
174
The potential of concrete in capturing CO2 from the atmosphere by a process called
carbonation is currently under discussion [7-9, 17-20]. Carbonation is a phenomenon
resulting from physical and chemical reactions of acid gases (mainly CO2) from the
environment with the alkali of the concrete; alkalinity is conferred primarily by the presence
of calcium hydroxide (Ca(OH)2) dissolved or precipitated in hardened concrete. When
CO2 (carbon dioxide) penetrates the concrete, it reacts with the hydroxides, especially
with Ca(OH)2, which is most present.
Starting from the surface, carbonation progressively moves into the concrete structure,
forming a carbonate layer (Figure 3). The advance of this layer is directly related to the
ease the CO2 encounters in spreading inside the concrete. Cement content and type,
water/binder ratio, moisture and CO2 concentration are the main factors that affect this
process.
Figure 3: Representation of advance of carbonation and pH alteration in concrete over time [4].
Carbonation of concrete initially occurs with the diffusion of CO2 through the cement
matrix. Following this, there is dissolution of CO2 in the pore solution for the formation of
carbonic acid, and reaction with calcium hydroxide according to the reaction shown in
Equation 1.
Ca(OH)2 + CO2 → CaCO3 + H2O Equation 1
ArmaduraCobrimento
CO
Superfíciedoconcreto
2 CO2 CO2 CO2
pH <128
tempo
t0 t2 tn
CaCO3
Ca(OH)2
zona não carbonatadazona parcialmente carbonatadazona carbonatada
pH <128 pH <128 pH <128
Ca(OH)2
Ca(
OH
)2
Ca(
OH
)2
CaCO3 CaCO3
Ca(OH)2
t1
Avanço da Carbonatação
Alteração do pH do concreto
ArmaduraCobrimento
CO
Superfíciedoconcreto
2 CO2 CO2 CO2
pH <128
tempo
t0 t2 tn
CaCO3
Ca(OH)2
zona não carbonatadazona parcialmente carbonatadazona carbonatada
pH <128 pH <128 pH <128
Ca(OH)2
Ca(
OH
)2
Ca(
OH
)2
CaCO3 CaCO3
Ca(OH)2
t1
Avanço da Carbonatação
Alteração do pH do concreto
ArmaduraCobrimento
CO
Superfíciedoconcreto
2 CO2 CO2 CO2
pH <128
tempo
t0 t2 tn
CaCO3
Ca(OH)2
zona não carbonatadazona parcialmente carbonatadazona carbonatada
pH <128 pH <128 pH <128
Ca(OH)2
Ca(
OH
)2
Ca(
OH
)2
CaCO3 CaCO3
Ca(OH)2
t1
Avanço da Carbonatação
Alteração do pH do concreto
ArmaduraCobrimento
CO
Superfíciedoconcreto
2 CO2 CO2 CO2
pH <128
tempo
t0 t2 tn
CaCO3
Ca(OH)2
zona não carbonatadazona parcialmente carbonatadazona carbonatada
pH <128 pH <128 pH <128
Ca(OH)2
Ca(
OH
)2
Ca(
OH
)2
CaCO3 CaCO3
Ca(OH)2
t1
Avanço da Carbonatação
Alteração do pH do concreto
Tempo
Reinforcement
Covering
Concrete surface
CARBONATATION ADVANCEMENT
pH ALTERATION
ArmaduraCobrimento
CO
Superfíciedoconcreto
2 CO2 CO2 CO2
pH <128
tempo
t0 t2 tn
CaCO3
Ca(OH)2
zona não carbonatadazona parcialmente carbonatadazona carbonatada
pH <128 pH <128 pH <128
Ca(OH)2
Ca(
OH
)2
Ca(
OH
)2
CaCO3 CaCO3
Ca(OH)2
t1
Avanço da Carbonatação
Alteração do pH do concreto
ArmaduraCobrimento
CO
Superfíciedoconcreto
2 CO2 CO2 CO2
pH <128
tempo
t0 t2 tn
CaCO3
Ca(OH)2
zona não carbonatadazona parcialmente carbonatadazona carbonatada
pH <128 pH <128 pH <128
Ca(OH)2
Ca(
OH
)2
Ca(
OH
)2
CaCO3 CaCO3
Ca(OH)2
t1
Avanço da Carbonatação
Alteração do pH do concreto
ArmaduraCobrimento
CO
Superfíciedoconcreto
2 CO2 CO2 CO2
pH <128
tempo
t0 t2 tn
CaCO3
Ca(OH)2
zona não carbonatadazona parcialmente carbonatadazona carbonatada
pH <128 pH <128 pH <128
Ca(OH)2
Ca(
OH
)2
Ca(
OH
)2
CaCO3 CaCO3
Ca(OH)2
t1
Avanço da Carbonatação
Alteração do pH do concreto
ArmaduraCobrimento
CO
Superfíciedoconcreto
2 CO2 CO2 CO2
pH <128
tempo
t0 t2 tn
CaCO3
Ca(OH)2
zona não carbonatadazona parcialmente carbonatadazona carbonatada
pH <128 pH <128 pH <128
Ca(OH)2
Ca(
OH
)2
Ca(
OH
)2
CaCO3 CaCO3
Ca(OH)2
t1
Avanço da Carbonatação
Alteração do pH do concreto
TempoTime
ArmaduraCobrimento
CO
Superfíciedoconcreto
2 CO2 CO2 CO2
pH <128
tempo
t0 t2 tn
CaCO3
Ca(OH)2
zona não carbonatadazona parcialmente carbonatadazona carbonatada
pH <128 pH <128 pH <128
Ca(OH)2
Ca(
OH
)2
Ca(
OH
)2
CaCO3 CaCO3
Ca(OH)2
t1
Avanço da Carbonatação
Alteração do pH do concreto
ArmaduraCobrimento
CO
Superfíciedoconcreto
2 CO2 CO2 CO2
pH <128
tempo
t0 t2 tn
CaCO3
Ca(OH)2
zona não carbonatadazona parcialmente carbonatadazona carbonatada
pH <128 pH <128 pH <128
Ca(OH)2
Ca(
OH
)2
Ca(
OH
)2
CaCO3 CaCO3
Ca(OH)2
t1
Avanço da Carbonatação
Alteração do pH do concreto
ArmaduraCobrimento
CO
Superfíciedoconcreto
2 CO2 CO2 CO2
pH <128
tempo
t0 t2 tn
CaCO3
Ca(OH)2
zona não carbonatadazona parcialmente carbonatadazona carbonatada
pH <128 pH <128 pH <128
Ca(OH)2
Ca(
OH
)2
Ca(
OH
)2
CaCO3 CaCO3
Ca(OH)2
t1
Avanço da Carbonatação
Alteração do pH do concreto
ArmaduraCobrimento
CO
Superfíciedoconcreto
2 CO2 CO2 CO2
pH <128
tempo
t0 t2 tn
CaCO3
Ca(OH)2
zona não carbonatadazona parcialmente carbonatadazona carbonatada
pH <128 pH <128 pH <128
Ca(OH)2
Ca(
OH
)2
Ca(
OH
)2
CaCO3 CaCO3
Ca(OH)2
t1
Avanço da Carbonatação
Alteração do pH do concreto
Tempo
Non-carbonated zoneSemi-carbonated zoneCarbonated zone
ArmaduraCobrimento
CO
Superfíciedoconcreto
2 CO2 CO2 CO2
pH <128
tempo
t0 t2 tn
CaCO3
Ca(OH)2
zona não carbonatadazona parcialmente carbonatadazona carbonatada
pH <128 pH <128 pH <128
Ca(OH)2
Ca(
OH
)2
Ca(
OH
)2
CaCO3 CaCO3
Ca(OH)2
t1
Avanço da Carbonatação
Alteração do pH do concreto
ArmaduraCobrimento
CO
Superfíciedoconcreto
2 CO2 CO2 CO2
pH <128
tempo
t0 t2 tn
CaCO3
Ca(OH)2
zona não carbonatadazona parcialmente carbonatadazona carbonatada
pH <128 pH <128 pH <128
Ca(OH)2
Ca(
OH
)2
Ca(
OH
)2
CaCO3 CaCO3
Ca(OH)2
t1
Avanço da Carbonatação
Alteração do pH do concreto
ArmaduraCobrimento
CO
Superfíciedoconcreto
2 CO2 CO2 CO2
pH <128
tempo
t0 t2 tn
CaCO3
Ca(OH)2
zona não carbonatadazona parcialmente carbonatadazona carbonatada
pH <128 pH <128 pH <128
Ca(OH)2
Ca(
OH
)2
Ca(
OH
)2
CaCO3 CaCO3
Ca(OH)2
t1
Avanço da Carbonatação
Alteração do pH do concreto
ArmaduraCobrimento
CO
Superfíciedoconcreto
2 CO2 CO2 CO2
pH <128
tempo
t0 t2 tn
CaCO3
Ca(OH)2
zona não carbonatadazona parcialmente carbonatadazona carbonatada
pH <128 pH <128 pH <128
Ca(OH)2
Ca(
OH
)2
Ca(
OH
)2
CaCO3 CaCO3
Ca(OH)2
t1
Avanço da Carbonatação
Alteração do pH do concreto
Tempo
Reinforcement
Covering
Concrete surface
CARBONATATION ADVANCEMENT
pH ALTERATION
ArmaduraCobrimento
CO
Superfíciedoconcreto
2 CO2 CO2 CO2
pH <128
tempo
t0 t2 tn
CaCO3
Ca(OH)2
zona não carbonatadazona parcialmente carbonatadazona carbonatada
pH <128 pH <128 pH <128
Ca(OH)2
Ca(
OH
)2
Ca(
OH
)2
CaCO3 CaCO3
Ca(OH)2
t1
Avanço da Carbonatação
Alteração do pH do concreto
ArmaduraCobrimento
CO
Superfíciedoconcreto
2 CO2 CO2 CO2
pH <128
tempo
t0 t2 tn
CaCO3
Ca(OH)2
zona não carbonatadazona parcialmente carbonatadazona carbonatada
pH <128 pH <128 pH <128
Ca(OH)2
Ca(
OH
)2
Ca(
OH
)2
CaCO3 CaCO3
Ca(OH)2
t1
Avanço da Carbonatação
Alteração do pH do concreto
ArmaduraCobrimento
CO
Superfíciedoconcreto
2 CO2 CO2 CO2
pH <128
tempo
t0 t2 tn
CaCO3
Ca(OH)2
zona não carbonatadazona parcialmente carbonatadazona carbonatada
pH <128 pH <128 pH <128
Ca(OH)2
Ca(
OH
)2
Ca(
OH
)2
CaCO3 CaCO3
Ca(OH)2
t1
Avanço da Carbonatação
Alteração do pH do concreto
ArmaduraCobrimento
CO
Superfíciedoconcreto
2 CO2 CO2 CO2
pH <128
tempo
t0 t2 tn
CaCO3
Ca(OH)2
zona não carbonatadazona parcialmente carbonatadazona carbonatada
pH <128 pH <128 pH <128
Ca(OH)2
Ca(
OH
)2
Ca(
OH
)2
CaCO3 CaCO3
Ca(OH)2
t1
Avanço da Carbonatação
Alteração do pH do concreto
TempoTime
ArmaduraCobrimento
CO
Superfíciedoconcreto
2 CO2 CO2 CO2
pH <128
tempo
t0 t2 tn
CaCO3
Ca(OH)2
zona não carbonatadazona parcialmente carbonatadazona carbonatada
pH <128 pH <128 pH <128
Ca(OH)2
Ca(
OH
)2
Ca(
OH
)2
CaCO3 CaCO3
Ca(OH)2
t1
Avanço da Carbonatação
Alteração do pH do concreto
ArmaduraCobrimento
CO
Superfíciedoconcreto
2 CO2 CO2 CO2
pH <128
tempo
t0 t2 tn
CaCO3
Ca(OH)2
zona não carbonatadazona parcialmente carbonatadazona carbonatada
pH <128 pH <128 pH <128
Ca(OH)2
Ca(
OH
)2
Ca(
OH
)2
CaCO3 CaCO3
Ca(OH)2
t1
Avanço da Carbonatação
Alteração do pH do concreto
ArmaduraCobrimento
CO
Superfíciedoconcreto
2 CO2 CO2 CO2
pH <128
tempo
t0 t2 tn
CaCO3
Ca(OH)2
zona não carbonatadazona parcialmente carbonatadazona carbonatada
pH <128 pH <128 pH <128
Ca(OH)2
Ca(
OH
)2
Ca(
OH
)2
CaCO3 CaCO3
Ca(OH)2
t1
Avanço da Carbonatação
Alteração do pH do concreto
ArmaduraCobrimento
CO
Superfíciedoconcreto
2 CO2 CO2 CO2
pH <128
tempo
t0 t2 tn
CaCO3
Ca(OH)2
zona não carbonatadazona parcialmente carbonatadazona carbonatada
pH <128 pH <128 pH <128
Ca(OH)2
Ca(
OH
)2
Ca(
OH
)2
CaCO3 CaCO3
Ca(OH)2
t1
Avanço da Carbonatação
Alteração do pH do concreto
Tempo
Non-carbonated zoneSemi-carbonated zoneCarbonated zone
[Ca2+ + CO22- → CaCO3]
There are then reactions with silicates (Equation 2) and aluminates (Equation 3).
3CaO.2SiO2.3H2O + 3CO2 → 3CaCO3 +2SiO2 + 3H2O Equation 2
4CaO.2Al2O3.13H2O + 4CO2 → 4CaCO3 +2Al(OH)3 + 10H2O Equation 3
The main compound carbonated by carbon dioxide is calcium hydroxide (Ca(OH)2),
however, potassium hydroxide (KOH), sodium hydroxide (NaOH) and alkali metal silicates
may also be carbonated.
One of the results from this reaction is the reduction in pH of the concrete to a value less
than or equal to 9, which usually has a value greater than or equal to 12.5 [10]. Another
result of this reaction is capturing of CO2 from the atmosphere, forming calcium carbonate
(CaCO3), which holds carbon dioxide in the concrete structure, removing it from the
atmosphere, in an inverse process to cement production, as shown by the simplified
reaction in Equation 4.
CaCO3 → +CaO + CO2 Equation 4
About 19% of carbon dioxide produced during the manufacture of cement is reabsorbed by
concrete during its life cycle through this process [18]. Carbonation occurs at a slow rate
during the useful life of buildings, but it accelerates after building demolition. In all,
carbonation results in an uptake corresponding to 45 percent of the emissions through
calcinations [17]. However, there is disagreement in the literature regarding the
uptake/capture potential of CO2 due to concrete carbonation. According to a study in
Norway, Jacobsen and Jahren [19] estimated that 16 % of CO2 emissions in cement
production are reabsorbed by the concrete due to carbonation during its life cycle. Garda
[20] reports that 7.6 % of emitted CO2 can be absorbed. In a study conducted in Denmark
[8] for 100 years of perspective considering the demolition of a structure, it was estimated
that because of carbonation concrete can uptake up to 57 % of CO2 emissions in cement
production. If structure demolition is not considered, this value is reduced to 24 %.
These differences found in the literature are due to the various factors that influence the
phenomenon of concrete carbonation (such as compressive strength, exposure
Proceedings of 7th WEEC Niche 5: Ecological and
green economies
176
environment, cement content, cement type, structure age, among others) and are
dependent on the methodology employed by researchers. Thus, each structure and region
require specific studies for these estimates.
4. CONCLUSION
The chemical compound that triggers the phenomenon of concrete carbonation is well
known, easily found in urban centers. A good example are the tunnels and viaducts. In
these environments, the concrete is exposed to high concentrations of carbon dioxide
(CO2). This carbon dioxide penetrates the pores of the concrete, diluted in moisture
present in the structure and shape compound called carbonic acid (H2CO3).
Although the cement industry is one of the greatest emitters of CO2 into the atmosphere,
concrete has the property of absorbing CO2 from the environment due to carbonation,
making a sort of compensation by means of gas capture. This process begins at
construction, passing through the life cycle of the structure, and continues more notably in
the demolition process, contributing to sustainability.
Bibliographic REFERENCES
[1] Mehta PK (2001). Reducing the environmental impact of concrete: concrete can be
durable and environmentally friendly. Concrete international; 61-66.
[2] Ali MB, Saidur R, Hossain MS. A review on emission analysis in cement industries.
Renewable and Sustainable Energy Reviews 2011; 15: 2252-2261.
[3] Isaia GC, Gastaldini ALG. Environmental and economic perspectives of the concrete
with high mineral addition content: a case study. RevistaAmbienteConstruído, 2004; 4: 19-
3.
[4] Possan, E. Modeling of carbonation and the service life prediction of concrete
structures at an urban environment. Doctorate Thesis in Civil Engineering: Federal
University of Rio Grande doSul, Porto Alegre, 2010. [In Portuguese].
[5] Lovato PS, Possan E, Dal Molin DCC, Masuero AB, Ribeiro JL. Modeling of
mechanical properties and durability of recycled aggregate concretes.Constructions and
building Materials 2012; 26: 437–447.
[6] Neville AM (2011). Properties of Concrete.5th Edition. Harlow: Pearson
[7] Gajda J. Miller FM. Concrete as a Sink for Atmospheric Carbon Dioxide: a Literature
review and estimation of CO2 absorption by Portland Cement Concrete. PCA, Chicago,
R&D Serial no. 2255, 2000.
[8] Pade C, Guimaraes M. The CO2 uptake of concrete in a 100 year perspective.Cement
and Concrete Research 2007; 37: 1384–1356.
[9] Galan I, Andrade C, Mora P, Sanjuan MA. Sequestration of CO2 by concrete
carbonation.Environmental Science & Technology 2010; 44: 3181–3186.
[10] Parrott LJ. A review of carbonation in reinforced concrete. Waterford: Building
Research Establishment, UK, 1987.
[11] IPCC - Climate change 2007: the physical science basis -Summary for policymakers.
Intergovernmental Panel on Climate Change, Geneva, 2007.
[12] Yoon In-S, Çopuroğlu O, Park Ki-B. Effect of global climatic change on carbonation
progress of concrete.AtmosphericEnvironment 2007; 41: 7274-7285.
[13] PNMC - National Plan about Climate Change 2008. Federal Government
Interministerial Committee about Climate Change.December 2008 – Decree nº 6.263,
November 21st, 2007.[In Portuguese].
[14] Mehta PK. Society, sustainability, and the global concrete industry. Lecture given at
the 51º Concrete Brazilian Congress - IBRACON, Curitiba, Brazil 2009.
[15] CDIAC: Carbon Dioxide Information Analysis Center. National Cement Production
Estimates: 1950 – 2007, 2007. Available in http://cdiac.ornl.gov/.
[16] SNIC: National Syndicate of Cementer Industry. AnnualReport 2010. Rio de Janeiro,
SNIC; 2011. [In Portuguese].
[17] Nässén J. Hedenus F, Karlsson S, Holmberg J. Concrete vs. wood in buildings: an
energy system approach. Building and Environment 2012; 51: 361-369.
[18] Naik TR, Kumar R. Global warming and cement-based materials. UWM Center for By-
Products Utilization. This first edition is being published at the Second International
Conference on Sustainable Constructions Materials and Technologies, Ancona, Italy,
2010.
[20] Jacobsen S, Jahren P. Binding of CO2 by Carbonation of Norwegian OPC Concrete.
CANMET/ACI International Conference on Sustainability and Concrete Technology, Lyon,
2002.
Proceedings of 7th WEEC Niche 5: Ecological and
green economies
178
ح ش١ ج١ ح شكخ١ ح ف٠ ش ح ر خي ش ح ح ش ١ سحعش خ د سي هحوذ خ ش ١ ح :ش ١ ح خ ح ش ك ي ك خ :ت س ح ر رخ دؿخ
.ءخع١ ح ح ح -ش٠ ح خ ح ح ش خ
خ ح ١ ٠ ح ش١ م١ ح ح ف١ ش ١ ا ى ح ش١ خف ح ش٠ عخ خ خ٠ خي ،ف٠ ش ح ؿ خي
ح ح( ش ١ ح خ رخ ش١ ج١ ح شكخ١ ح خق ش٠ ف ش ح ش١ كخ١ ح خ ١ رؿخ خ ش ١ ح ح ٠ ف١ ،) ش ك خ ف غخ أ م صخد ش١ ك ل حؿ ش٠ ح ش١ خ
خ خ ، ش٠ لم فك ش ح ش ١ ش ١ ك١ ش خي ح لخفؿ ، ىخ ح ١ صخ ؟ ج١ ح ح خ ر خص م ،شج١ ح خففش ح أص
خق شكخ١ حش ش ١١ ،شج١ ح خفؿ ؿ ح ش ١ خ ح شكخ١ ح ف ح شكخ١ ح ٠ ح ح
ح ،شف١ فش س ا رخإل خ ح ح ش ١ ح ش ١ ح ف ش خ ح خك١ ح ح صخد ش ح ل حؿ خ٠ ح . خ١ خ
ش خي اك ١ ح ش١ ج١ ح شكخ١ ح ش صخد أ ى خ خ ، ج١ ح حال خففش ح ف خي د
خي ح ، ج١ ح صخ ح خ ر خص م ،شج١ ح خففش ح أص ،شج١ ح خفؿ خق شكخ١ ح
س ح خ .ش ح ح ش ١ ح ف ش خ ح خك١ ح ح خ خ م ر ش١ ج١ ح شكخ١ حعك ح ؿ ٠ ا خ : فش ف ، خف ع
، ر شم١ ح غ ف ف ك خ ح م١ ح خ٠ حال خ ١ رم حألخ ك ،شج١ ف خ ش١ ج١ ح ش ف ح ا الف
ك حسد ح ش٠ خ ح ش١ م١ ح ح ش١ خف ح ش ١ ح ش ١ ح ف ش خ خ ش ح .ش س ش ٠ خش خي ١ :1 سحعش ح
ح سحعش م ك ح ر ش خ١ خ ش١ ج١ ح شكخ١ ح ع ش ١ ١ ح
ر خي ش ١ ح خ ح دحخ ش ح حي ف٠ ش ح ، ف خ ١ رب خ الع ح ح ر : شد ح خ
ح .ش ١ ح ١ رب ش ١ ح ح س ش ٠ خش( ق ا خ ف )1 ش عخء ١ خ .) P.A.T ( خك١ ح حالع خي
خ ح ف حخ،١ ش١ ج١ ح شكخ١ ح ش خ خف ح شرش شكخ١ ح
ق خالي شد رخ ش١ ج١ ح ش عخء Source : image Shuttle Radar Topography Mission2010
لم ف خك١ ح حالع خي حالؿ حال صخد ح ش ح ح ش ١ ح ك١ ح خ . ج١ ش :ش ١ ح خ رخ ش١ ج١ ح شكخ١ ح -1 ال خ ؟ أ ى
خ أ :ش١ ج١ ح شكخ١ ح 1 - 1 حف خ خد . ح ش ح ش١ ج١ ح شكخ١ ح ١ ش ح ف ح م ٠ ، ح ك ش ١ م ح خ٠ ر
ح ك١ لم ف ح ح شم١ ح ش١ ؿخرر فخ ح م ح ٠ ا ،شج١ خف ش١ ج١ ح شكخ١ رخ م ح
فش ص خ ش٠ ش ر ك خ ء ألحلك رخ ١ ح ك ح ر ش١ كخ١ ح حل ح ش ح خق ش رخ ش١ أعخع ش م
خ أ ش١ ج١ ح شكخ١ ش : ح رخ حإلخالي فخ خ ح ج١ ح ش ص ح خ حإل فخ ف ش ش ص خ ق ح
سع ع ع ٠ خ ش١ ج١ ح شكخ١ خ .خ ١ ف لم ح ح ك١ ح شكخ١ ح ١ ر ك شج١ ر ش١ خ خ ١ ر صخد ص خ ح ١ حالؿ ش٠ حال
حألعخ ح ش١ خ
.خ ١ م حي، ح خ حالع ش ١ أ ١ ح ح ش١ أؿ ش ١ ح خ ح ك خ ح ش٠
خؿ خ١ كح ١١ ح ىخ ح . ١ خ خدح خففش
خ ؿ خك١ ح ح ش١ ٠ أ ح خ حالؿ ح ك ؿ ا ض أ م ر ، ج١ سح ح ف فش خ
خال ح . خؿ ش ١١ ر ك ح شم ٠ خ ف 2 - 1 :ش ١ ح خ ح
ة تراث حواي ح م١ ح شحع ح ش٠ خ ك :ال خي، خف صش ح ش١ غخع ح ٠ شحع ح خخ ك ش، حلك ح ش٠ خ
حأل ش ش١ خ٠ خ ح . ، ح ش٠ ١ ح ف ة نوي ت ة ال صادي ت ية االق تواع خء ا شعخ١ ع ش : واالج ش ١ ح ا ش ١ ح خ ح
صخد حالؿ ش٠ حال ش١ خ خ لخفؿ شم٠ ر ش ش ١ ح ش حسد ح خ ١ ش ح حالع غالي ش ؿ ش١ ر
خي، ١ ع م خي ح خ ي خ ف خ ح . خك١ ح
ضاء ن ف قذي ت لوهة ل وع عووم ال ل عخءح ش ١ ح خ ح :ل ح ح ش خ ح ك حأل ش أ خ
ح ح حق أ شف خ ،شم١ ح ك ش ء شج١ رخ ك أ ٠ ح خ خ ش ح حالع م ؿ أ خ خ ش ح خ ال
شف خ ش ح ح ، ح أ ىخ ح كخ رخ خ ح ١ ش خ ح ش٠ حإل ح خ شق
ح ... ش٠ ش ح تزهات ون ضاءات ال ة ف تجرب ل عخءح ش ١ ح خ ح :ل خسد، ي ح ا حد ش١ ف١ ك
ح شحد ١ خففش م أ ٠ خ ، ١ ر خ ١ خففش ح ف ش ١ خ شم٠ ش ش ١ ح خ ح ا خق ش
ش ءح .ش١ خ اؿسعش ش ش١ خف ش١ م١ -2 ح دحخ ش١ ج١ ح شكخ١ ح خ
:ش ١ ح خ : خ الع ح ح -1 - 2
خء ا فش ) PNTLS ) خ ح ح ص سع ر 2004 ش ع ش ١ ح ١ ا ١ ر ى خ ، 60000 خكش ر لخ ؿ غك ع٠ ، ف خ خ ،ش٠ ش خ
لخ ؿ ع ش ر ف خ ١ إل خ لخ ؿ ع ، 80% ح ١ إل خ ح ف ش ر خ ، % 20 ش ر
، 20000 د س ش ٠ خش( ش 2 .) س ١ ف ) : PNTLS ) خ ح ح ١ أ . ١١ ١
ك فخ ح ف ٠ حأل ي ف ح - 1 ف ح ش٠ خ ح ح ٠ ش ح شر ح ؿ ٠ حإل . خ ح خي ح ش ١ ف ٠ خ ح ف ح - 2 ع ح ح ح ع ح . حل صخد - ١
ض خ الع ش م٠ خ خ، ش١ م١ ح ،ش١ ج١ ح شكخ١ ح خ خ خ ح( خ ح خء ح ش، ١ ح ش ف خ
خ ، ح ف خسح خ ،ش١ م١ ١ ش١ خ ح ،)... ش ١ ح ١ ح ش ح ش١ خ٠ خ ح ش خ( ش١ خف
ح ح خ م ح شحع ؿ ،)... ش ١ ح خفش خ ف ح خ٠ ش خ اكصخ خ ١ أؿ خ ١ خ ف ش
س ش ٠ خ ش ح( ،ش١ ج١ ح شكخ١ ح خ ا 3 .) س ش ٠ خش . خ الع ح رخ ش١ ج١ ح شكخ١ ح :3
س ش ٠ خش خ الع ح ح ك١ :2 ح خ ١ ح ش٠ ش٠ 2006 ش رخ ح - صلش ح خسرش خرخ
Proceedings of 7th WEEC Niche 5: Ecological and
green economies
180
Source : PROGRAMME D’USAGE PUBLIC parc National de Talassemtan (MAROC)
chafchaouen et le travaille sur le terrain
:ش ١ ح ح ح 2 - 2 ش ح عخك ش ١ ح ح ح ٠ع ح ١ ح شد رخ ش ١ ح ش ٠
خفش 150 ، س ش ٠ خش( ر ،) 4 خكش خ ى خ ، 48460 ر ش ى خ 19000
ش ر خرك .ش٠ ر ح خ ١ ش ١ خ ح ش١ خرخ خء ا صلش ح خسرش أل ، 2004 ش ع حف
: ف ح م١ ح شحع ح فخ ح - 1 ش، خف
ؿ ١ ح ش ك ١ ١ .ش خ ش١ ع ش
حسد ح ف١ - 2 ح ش١ م١ ح ا ال خ١ كخ١ ع خف١ ش١ خف ش١ ش ،خ٠ شر خ ١ ح ح ، ح شحع ح ش ١ ر ١
خ ٠ أ ٠ ف١ ر ش، ١ ح ش ١ ح ف خ خدسح رب خي ف ش خ ح ش٠ خ ك ك شج١ خ، س ش ٠ خش( ادحس 5 .)
س ش ٠ خش .ش ١ ح ح رخ ش١ ج١ ح شكخ١ ح :5 س ش ٠ خش ش ١ ح ح ح ك١ :4
ح خ ١ ح ش٠ ش٠ :ص ح 2011 ش رخ ح - صلش ح خسرش خرخ ح خ ١ ح ش٠ ش٠ :ص ح 2011 ش رخ ح - صلش ح خسرش خرخ
ق خالي خ الع ش ١ ح دحخ خك١ ح حإل حد ش ١ ك 3- ش ) P.A.T :) ق -1 - 3 ش ) P.A.T (: حأل ىش ح حف :
ق ؿخء ش عخء سإ ) PAT ( خك١ ح حالع خي ر ،ش١ كخ١ ح 2010 ش٠ خ ح د أؿ ح خك١
ح ح ح ١ م ح أ ش، ش ح شكخ١ ٠ ض ح خ حال خع٠ ي ف ش٠ رخ د س ح أ خ ، حإل ش ١ ح شكخ١ ح د شد ح ر شخ ٠ خ ؿ ٠ ح ش١ لش رخش .... ش٠ ص
ق ح ش س حلك ح أ خ ا عخءح ك رخ ع خي ح ش١ كخ١ ح ش رخأل م ح ش ٠ ك خ ك ر ش حأل ك م ٠ ٠ ؿ حش ح ش٠ ا ش ف خ ش١ ج١ ا صح عخءح ر أ ، خ ارح ع خي ش ٠ خك١ ع ح
خ د خ٠ م ح ش١ ى ح حأل د . شر ح ش ح ق ١ ش ح ف ح م ٠ ش عخء : شد رخ ) PAT ( خك١ ح حالع خي
ح خ ح ح ١ م ح خك١ ح ح د - ش، خ ش١ ك خ - ؿ ، خك١ ح ح ك٠ أؿ ش٠ ١ م ح ش١ كخ١ ح
ع رخ ش١ كخ١ ح ش حأل ٠ - ش ح شحن أعخ ش، ١ ح ش خ ح ا حلك ٠ ش ح - ضح ١ ح رح ش١ ج١ ح شكخ١ ح خ خصش، ح
ل - خ ش١ خ حالؿ ش١ م ح ١ خ ش٠ ش خ ء ر ش ،ش٠ ش ح ش كخ١ ع حسح ك ح ١ ش١
،خ١ كخ١ ع م٠ حخد - خي حال خ ا ح م١ ح ك خف ع ح ١ أؿ خ ك خ ش ، ٠ خ س ح
خفح . عخ
لم - ح ح ك١ ش ح شكخ١ ح د ك٠ ش ش٠ ح شكخ١ ح ش ١ ف .ش٠ لم حف حأل ك١ ه ش ا ٠ أ ٠ ح ش ح ش ح حد ف ح شق ح ش١ خ
ء ح ىخ شد حص خ خ ح شرخء، حفك ح ش١ حص خ خ ح ش حال ش ١ ١ م خ رخ خ ح حأل ش ش١ خ٠ خ ....ش٠
ا شحن ح ش ١ ح ش خ ح ر ءح ١ خ ح رخ ش ش خ ش ١ ا خ ف ح ك ح شح خ١ خ ص
حالؿ ش١ خف ح ع خ ك ح ش ش١ خ خ ح ح ف ش١ ف ح ر ة ك٠ خ ح ح ،ك٠ خ ش١ ف ح ة ر م
خ خ م ٠ ح خس ح م ح . خس ح ش١ ر صحس رخ ؿم خ م خق ح ش١ ح شحن ٠ ح ١ خ ح ك ١ ؿ ا
خ م٠ أ ف، ح خي ح م . ح خ الع ر خك١ ح حإل حد ش ١ ك -2 - 3 :ش ١
ح ٠ ش٠ خ ق ح ش س حلك، ح أ س ح صح م خق ح ش١ ح خسرش س خالي ،ش١ خ
خ م٠ خي، ح م ح خ ١ ح( شحن خرخ ، خ خ م ٠ ح ١ خ ح ش ا ف، ح م ٠ ح أ
س ح ش١ خ حالؿ ش ١ ح خال ،ش١ شحر ح حإلدح .) ح ك ع ح ش خ خ ح شق رخ ج١ ح ا حد ر ، خ ش ح ح خ ء ش٠ ، 25 أ ش ا خ د ح خ ح ف ١ ، ش١ حألخ ر ش٠ خك١ ع ح 15 ش ش٠
شحد ؿ ، ح س ش ٠ خش( فش .) 6 ف ا ا خ عخ ح ش١ .ش١ ج١ ح شكخ١ ح خل ح
ش ح ح د ش ١ ح ح خ أ فش 6 ا ش٠ ش١ كخ١ ح حسح ح ا ا خخ ش ش ح ح ر
شحد ؿ س ش ٠ خش( ، ح ح 7 .) س ش ٠ خش إل حد :6 . خ الع ح رخ خك١ ح ح
Source : PROGRAMME D’USAGE PUBLIC parc National de Talassemtan (MAROC)
chafchaouen et le travaille sur le terrain س ش ٠ خ ش ح .ش ١ ح - ح رخ خك١ ح حإل حد :7
ح خ ١ ح ش٠ ش٠ :ص ح 2011 ش رخ ح - صلش ح خسرش خرخ صش خال
فش٠ ح خ الع م ش ش ١ ش١ خف ش١ م١ ش ١ خ خ ١ ١
ح .ش١ ج١ ح شكخ١ ح إل حد شم١ ا ش رخ ح خ الع ر ح خك١ ح ح ش ح ح خ ء ر خالي ش ١
١١ ش٠ح ش١ كخ١ ح حسح ح رخكخ خ كش شح ي ح خ ٠ ... حالع ق أ م ش عخء حالع خي صش خ ، ك ا ) P.A.T ( خك١ ح لم ف ف خ . خ الع ر خخ ش ١ ح ك١
ع ح ح ع ح ر حل صخد - ١ خ خم٠ ح خك١ ح م خق ح ش ١ خي ح ر . س ؿك خ ش رخ ٠ ح ف ا رخألعخ س ٠ ش خ ش ح ١ خ ح ادح خخصش ، ٠
لخد ص ح أش ح ح ش٠ ح ٠ ش ق ح ١ ف ش خ ح ش ١ ح خ١ م ش ٠ ش ح ف ...
خك١ ح حؿ ح . ١ رخ
ش ش١ ج١ ح شكخ١ ح خ ح ك ش ، ١ ح ص سعش، ح ١ رم ى ر خ ٠ خ خ ح ك ف
ش ح خ ش٠ ح ص خ ح دحخ ر ح ش١ خ ح عخ ف خ أ خرخ ، لخ ح خ ش٠ ش ح خ ، ح شج١ ح ش٠ خخصش ف حف فشم٠ ح ف١ ح ف ح خ ، ١ ح ش١ د
ح ش رخ خي ، ١ ح . خ الع ر أ ش
لم ا حف أ ك١ خ١ خ ش١ ج١ ح شكخ١ ح خالي ش ١ ح خ رخ ش ح ح ش ١ ح ٠ أ ٠
ه ش ا ح ش ح ش ح حد ف ح شق ح ش١ ء ح ىخ خ شد حص خ خ ح شرخء،
حفك ح ش١ حص خ خ ح ش حال ش ١ ١ م خ رخ خ حأل ش ش١ خ٠ خ ح شحن ....ش٠ ح رخ ا ح ش ١ ح ش خ ح ر ءح ١ خ ش ش خ ش ١ ا خ ف ح ك ح خ١ خ ص ح شح
حالؿ ش١ خف ش١ خ ع خ ك ح ش خ ح ح ،ك٠ خ ح ف ش١ ف ح ر ة ك٠ خ ح ف ح ة ر م
ح ش١ ش١ ر
Proceedings of 7th WEEC Niche 5: Ecological and
green economies
182
١١ خس ح .شح ، خ الع ش ١ ش ١ ح خ رخ ش١ ج١ ح شكخ١ ح خ ش رخ ؿ م أ
د ف خ خال شم١ ح خ ش١ حسد ح ح ،ش١ م١ ح خ ش ١ ح خفش حأل ش
خ ش ١ شح ك ك ش حأل خ ح .ش١ ش ح ح شكخ١ ح أ ش٠ ش ١ خ ح شكخ١ ح
ح ح م١ ح ١ م ف ج١ ح رخ ١ خ م ٠ ك ح خدسح ح أ ا خف ح ح ك .شف١ ف ح شكخ١ ح ح
شحف ١ ١ ح :خ١ يل سواع ح ء ح خسلخ ، خ٠ ل خ شد، رخ ش١ كخ١ ح ش ١ ح :) 2009 ( عوراى ا
- م ح دح ش ، خ حأل ش ح ش رخ ، ح
بذ رحواى ع اري ال ذك خال ح ا حد ش خ : شد رخ ش١ ف٠ ش ح شكخ١ ح :) 2008 - 2007 ( ال ح ي ف١ أع فخ٠ ر ش١ كخ١
خ ١ ح شق س ح ١ ر . ش١ كخ١ ح ش ١ ح ف خ ش ؿخ ،خ١ شحف ح ف ش ١ ح خ ح – خ
ش ر ، حي هحوذ بذالو ع خ، :ف٠ ش ح ش ر ش١ كخ١ ح ح :) 2005 ( ال خق حل خ ش٠ ح
ل .ش حإلع ح ح ي ح خ ١ خ ٠ د'' ح ل . ٠ حإلد ف٠ ش ح ش ؿخ ''ف٠ ش ح ش ف ش ح ح ش ١
سي هحوذ ي ضح ١ 2011 ( ت خ ر . ف خ ١ رب ش ١ ح ش ١ ح خق ش١ ج١ ح شكخ١ ح خد ١ سحعش ح ش٠ :)
ع ش ح ح دحد٢ ح ش ١ ر خ ح ح ح -ش٠ ح خ ح ح ش ؿخ .ش٠ ح- ش ١ خ حإل م .ءخع١
س ون ي ي بون ع ح ش ١ ح ر خك ش١ كخ١ ح شج١ ح :) 2009 ( إك خ ىخعخ ح شج١ ح خ ر .ش ١ ١ سحعش ح ش٠
خد ع ش ح حك ح شج١ ش١ خ ١ ح ف خ ؿ حأل ي ش رخ , .ر لي ي ل خ ثواى ال خسرش :) 2008 - 2007 ( ع شحف ح ش ١ دح خس ح ١ خ ح خ خ ش ش١ ؿ
ش٠ خر ح ش٠ خر ح كخ خد ١ ر .ش ١ ح خ ف خ ١ رب ع ش ح ح - ح خ ح ش رخ خ بذ سالم ع ال
ي وون وي حسد ح ا حد :) 1998 - 1997 ( ال ،)حأل ع ف٠ ش ح( ش١ شر ح خ س ش ر ش ١ ح خ ح ش ؿخ ،خ١ شحف ح ف خ ١ م ح سحعخ ح در ١ ر ش رخ ، ح أ حي- خ
RAMOU Hassan ( 2005): «Le tourisme durable et le montagnes au maroc, le cas du parc
national de Toubkal et du S.I.B.E du Saghro»; Thèse de doctorat Nationale en géographie,
Université Mohammed V- Agdal, Faculté des Lettres et des Sciences Humaines Rabat,
Département de géographie, (Inédite).
TAMSAMANI Mohammed (1998): Le Rif occidental dans le développement touristique de
la péninsule de Tanger (Maroc); In le tourisme au Maghreb, diversification du produit et
développement local et régional, Actes du 5ème Colloque maroco- allemand, Tanger, p.p
201-213.
MONKACHI Hassan (1996): «Le rôle du tourisme dans le développement local du Haut
Atlas Central Marocain» ; Thèse de doctorat de géographie ; Aix-en- Provence juin,
(Inédite).

KAOUASS Hamid (2009): Aménagement et urbanisation du littoral d’Al Hoceima.
Mémoire pour l’obtention du Master en géomatique et aménagement du littoral. Université
Mohammed premier— Oujda. ’’Stratégie de développement du tourisme rural’’(2002)
:Etude préparée pour le Ministere de l’economie des finances de la privatisation du
tourisme DIRECTION DES AMENAGEMENTS ET DES INVESTISSEMENTS par (OMT)
et (PNUD).
ح خ ١ ح ش٠ ش٠ __ش رخ رخ صلش ح خسرش خرخ
Proceedings of 7th WEEC Niche 5: Ecological and
green economies
184
Pagos por servicios ambientales:
¿Una opción viable para el financiamento del derrollo sostenible en Venezuela?
VLADIMIR JOSÉ VALERA MEJÍAS
Universidad Metropolitana ([email protected])
RESUMEN
En Venezuela las políticas ambientales han estado más relacionadas con el uso de
instrumentos regulatorios que con el uso de instrumentos de mercado; sin embargo no se
ha impedido que sigan los procesos de degradación y contaminación ambiental. Dada las
condiciones ambientales de Venezuela y las oportunidades que generan los instrumentos
económicos como los Pagos por Servicios Ambientales (PSA), la presente investigación
analiza los factores que inciden en la aplicación de PSA en el país, como fuente de
recursos económicos para financiar las acciones encaminadas a un desarrollo sostenible.
I.- INTRODUCCIÓN.
Las políticas ambientales deben complementarse con el uso de ciertos instrumentos,tanto
de comando y control como económicos para lograr sus objetivos de uso racional,
defensa y protección del ambiente; sin embargo una comparación de los instrumentos
económicoscon respecto a las medidas regulatorias, demuestran que los primeros son
más efectivos ycontribuyen a modificar los estilos de desarrollo existentes para alcanzar la
sustentabilidad (Sterner, 2007).
Dentro de estos instrumentos económicos están los Pagos por Servicios Ambientales
(PSA), definidos como transacciones voluntarias en la que los actores que proveen un
servicio ambiental son compensados económicamente por los beneficiarios del mismo
(Wunder, 2005) Los PSA promueven el desarrollo sustentable a través de la conservación
de las áreas naturales y ecosistemas que generan servicios ambientales y constituye una
alternativa viable y sustentable de ingresos económicos para las poblaciones que se
ubican en áreas con gran potencial ambiental.
En Venezuela las políticas ambientales han estado más relacionadas con el uso de
instrumentos de comando y control siendo muy poco el uso que se ha dado a los
instrumentos de mercado; aunado a ello se observa que tal política no ha impedido que
sigan los procesos de deforestación y de contaminación ambiental, pérdida de
biodiversidad y de áreas naturales, afectando aun más la fragilidad y estado de muchos
ecosistemas y su capacidad de proveer servicios ambientales.
Dada las condiciones ambientales de Venezuela y las oportunidades que generan los
instrumentos económicos como los PSA, se plantea la presente investigación de tipo
cualitativa, donde se pretende analizar los elementos y estructuras sociales, políticas,
institucionales, económicas, ambientales, que inciden en la aplicación o rechazo de los
esquemas de pago por servicios ambientales en el país, como fuente de recursos
económicos para financiar las acciones encaminadas al uso racional, conservación y
defensa de la naturaleza en procura de un desarrollo sustentable.
II.- DESARROLLO.
II.1- Fundamentos teóricos
En los tiempos actuales estamos siendo testigos presenciales de profundos cambios
ambientales adversos que están ocurriendo a nivel planetario como consecuencias de las
actividades antrópicas; entre estos se incluye aumento de la deforestación y
ladesertificación de los suelos, pérdida de especies y de la biodiversidad, contaminación
del aire, agua y suelo, la degradación de la capa de ozono, entre otros (MEA; 2005). A su
vez, la naturaleza responde ante tales acciones del hombre con fenómenos tales como el
cambio climático que incide en una mayor frecuencia de eventos naturales extremos
como tormentas, huracanes, aludes torrenciales, campos menos fértiles para la
agricultura, proliferación de vectores transmisores de enfermedades y en general pérdidas
económicas y de bienestar para la población.
Los cambios planetarios antes mencionados obedecen a que lamentablemente la
sociedad, desde una perspectiva antropocéntrica y economicista, ha asumido que la
naturaleza proporciona bienes y servicios ambientales en cantidades ilimitadas, siendo
considerados como bienes públicos o de acceso libre que no tienen un precio de
mercado, dándole así un mal uso a los mismos, llevándolos a su degradación y en
muchos casos a su extinción.
Por otro lado se ha reconocido que los patrones de producción y consumo, así como los
modelos de desarrollo de las naciones, son en parte responsables de la crisis planetaria
Proceedings of 7th WEEC Niche 5: Ecological and
green economies
186
ambiental, y para resolver esta situación se requiere que la humanidad en su conjunto,
cambie la forma de concebir el desarrollo como un mecanismo para generar mayor
producción de bienes y servicios, por un modelo en que además de la variable de
crecimiento económico tome en cuenta la preservación de la base de los recursos
naturales, sustento de la producción de bienes; y del mejoramiento de los condiciones
sociales de la población, lo que se ha llamado como desarrollo sustentable.
La presión de las actividades del hombre sobre el ambiente es de tal magnitud que según
la opinión de muchos expertos, la supervivencia y el bienestar humano dependerán del
éxito que se pueda alcanzar, al hacer que el desarrollo sustentable pase a ser una ética
mundial (Cuenca, 2006).Este enfoque señala también la necesidad de un cambio total en
el sentido de darle a la naturaleza el valor intrínseco que ésta tiene; así mismo la
perspectiva económica no debe descuidarse porque ella podría proveer información sobre
las causas y consecuencias de la degradación ambiental y brindar algunas ideas para la
formulación y establecimiento de mejores políticas públicas para proteger el ambiente. En
efecto muchos problemas ambientales son consecuencia de las externalidades, como por
ejemplo los efectos de la contaminación industrial, los cuales podrían resolverse en parte
con el uso de instrumentos o incentivos de mercado que se incluyan en las políticas
públicas (Coase, 1960, citado por Vargas, 2008); así mismo el papel del cambio
tecnológico y los cambios estructurales que afectan las economías demuestra que las
políticas ambientales son necesarias para ordenar o dirigir la relación crecimiento
económico y desarrollo ambiental.
Las políticas ambientales hacen uso de medidas o instrumentos para luchar contra la
contaminación y degradación ambiental, las cuales tradicionalmente se han clasificado en
dos grandes grupos: las medidas regulatorias de comando y control, y los instrumentos
económicos (San Martín y García, 2008). Entre las primeras, las principales medidas
serían el establecimiento de estándares en los procesos de producción o consumo y la
prohibición de usar determinadas sustancias o tecnologías contaminantes, mientras que
entre los instrumentos económicos se podrían mencionar los impuestos, los subsidios, los
sistemas de depósitos reembolsables, los pagos por servicios ambientales o los permisos
de emisión negociables, entre otros.
El problema para los países que desean establecer políticas ambientales, radica en que la
definición o selección de instrumentos es un proceso complejo, especialmente en países
en desarrollo, ya que involucra muchos intereses y factores políticos, económicos,
sociales y culturales en conflicto, por lo que difícilmente puede haber una política común
óptima para todos los grupos de la sociedad (Sterner, 2007). En tal sentido cobra
importancia que en los procesos de evaluación de las políticas públicas se tomen en
cuenta los aspectos de eficiencia, efectividad de costos, pero también los de ingreso,
equidad y pobreza, especialmente para tratar de seleccionar instrumentos de una manera
más objetiva.
Una comparación de los instrumentos de mercado con respecto a las medidas
regulatorias, demuestran que los primeros son más efectivos, minimizan los costos
agregados de lograr cierto nivel de protección ambiental y proveen incentivos dinámicos
para la adopción de tecnologías más económicas y eficientes(Sterner, 2007), todo
cónsono con el desarrollo Sustentable y los criterios de eficiencia y equidad. No obstante
de estas ventajas, los instrumentos basados en el mercado se han usado menos
frecuentemente que los estándares de comando y control, especialmente en los países en
vías de desarrollo.
Para Gabaldón (2006) los instrumentos económicos coadyuvan a modificar los estilos de
desarrollo existentes para alcanzar la sustentabilidad, ya que son complementos de
políticas públicas y medidas de carácter regulatorio compatibles con las economías de
mercado, dirigidas a modificar comportamientos de diferentes actores.
Dentro de los instrumentos económicos como se mencionó anteriormente, están los
Pagos por Servicios Ambientales o PSA, definidos como transacciones voluntarias en la
que los actores que proveen un servicio ambiental como secuestro de carbono,
conservación de la biodiversidad, protección de suelos y aguas, paisaje, entre otros; son
compensados económicamente por los beneficiarios del mismo, siempre y cuando el
proveedor garantice su suministro a través de ciertas prácticas y acciones. Básicamente
el objetivo principal del PSA es el de promover el desarrollo sustentable a través de la
conservación de las áreas naturales y ecosistemas que generan servicios ambientales,
tomando en cuenta que generalmente éstos son percibidos como gratuitos y afectados de
manera negativa hasta su agotamiento, siendo considerados claros ejemplos de bienes
Proceedings of 7th WEEC Niche 5: Ecological and
green economies
188
públicos, pero también de fallas de mercado, para lo cual se requiere de medidas que
puedan resolver estos problemas (Casas y Martínez, 2008).
La venta de servicios ambientales constituye una alternativa viable y sustentable de
ingresos económicos para las poblaciones, generalmente pobres, que se ubican en áreas
rurales con gran potencial de recurso naturales, y constituye una forma de retribuir en
parte a quienes protegen y promueven el mejoramiento de los procesos naturales
(Espinoza et al, 1999). Según la Organización de los Estados Americanos (OEA), hasta el
año 2008 se habían implementado más de 400 proyectos de pago por servicios
ambientales en todo el continente americano, como mecanismos innovadores para la
gestión de recursos naturales basados en el mercado (Casas y Martínez, 2008).
II.2.- El caso venezolano.
En Venezuela las políticas ambientales del Estado, tradicionalmente han estado más
relacionadas con el uso de instrumentos legales que contemplan mecanismos de
comando y control, tales como planes de ordenamiento territorial, establecimiento de
estándares de calidad ambiental, etc., que con el uso de instrumentos de mercado; sin
embargo y a pesar de haber obtenido logros importantes, como por ejemplo el que más
del 55% del territorio nacional esté bajo la figura de áreas protegidas, generando bienes y
servicios como genes, oportunidades recreacionales, captura de gases de efecto
invernadero, estabilización del clima global y regional, formación y protección de suelos,
retención de nutrientes, mantenimiento de los ecosistemas y la protección de la capacidad
de los ecosistemas para recuperarse frente a perturbaciones, entre otros (Andrade, 2009);
esto no ha impedido que sigan ocurriendo procesos de deforestación y de contaminación
ambiental, pérdida de biodiversidad y de áreas naturales, afectando aun más la fragilidad
y estado de muchos ecosistemas y su capacidad de proveer servicios ambientales.
El país tiene una tasa de deforestación de 1,1% interanual (MARN et al, 2005), lo cual
está generando pérdida de biodiversidad y afectación de muchos ecosistemas
importantes, especialmente en toda la zona al norte del Orinoco como en los estados
Portuguesa, Cojedes, Yaracuy y en las cordilleras Andina, Central y Oriental, además
existen graves problemas de contaminación ambiental por causa de la producción y
consumo de energía, descargas de efluentes domésticos e industriales no tratados a
cuerpos de agua naturales, manejo inadecuado de desechos, la existencia de sistemas
agropecuarios ineficientes que hace un uso excesivo de agroquímicos, entre otros
factores antrópicos que ponen en riesgo la estabilidad de los ecosistemas venezolanos y
que no han podido ser resueltos a pesar del amplio marco legal ambiental que rige en el
país, haciendo pensar que se requiere la adopción de reformas políticas e institucionales
tal como lo señala el informe de la evaluación de los ecosistemas del milenio (MEA, 2005)
El país no cuenta con experiencias sobre pago por servicios ambientales que pudiesen
contribuir a la conservación y uso sustentable de ecosistemas y recursos, además de
mejorar los niveles de ingresos, disminuir los niveles de pobreza y mejorar la calidad de
vida especialmente de las poblaciones rurales, en sintonía con un desarrollo sustentable.
Pérez (2006) investigó las pocas experiencias que se habían dado, como intentos en la
aplicación de los esquemas de pago por servicios ambientales en el país, principalmente
en la cordillera andina y en las áreas áridas y semiáridas de los estados Lara y Falcón,
señalando que aun cuando existen condiciones para la aplicación de PSA en estas zonas,
tales esquemas no están contemplados como política nacional y por lo tanto carecen del
apoyo del Estado; siendo la razón principal que a nivel de las instituciones
gubernamentales, existe un claro desconocimiento sobre las ventajas y limitaciones de
estos esquemas y por lo tanto se hacen juicios sin una buena fundamentación.
El Centro Internacional de Investigaciones Forestales (CIFOR) con el apoyo de la
Universidad de los Andes (ULA), llevó a cabo un trabajo sobre el potencial de aplicar
Pagos por Servicios Ambientales en Venezuela, específicamente se enfocaron sobre
servicios hídricos, determinando que algunas zonas del país en la cuales sería posible la
aplicación de este instrumentos eran las cuencas del río Pereño y la Jabonosa en el
Estado de Táchira, las cuencas de los ríos Tocuyo y Yacambú ubicados en la cordillera
andina, la cuenca del río Coro en el estado Falcón, la cuenca del río Calderas en el
Estado de Barinas y la Cuenca del Río Neverí en los estados de Sucre y Anzoátegui
(Blanco et al, 2006)
El trabajo conjunto de CIFOR y la ULA también analizó en el año 2006 el contexto
institucional y legal que existía para entonces en Venezuela para la implementación de
esquemas de PSA, señalando que el país contaba con una experiencia previa que podía
tomarse como plataforma para éstos mecanismos siempre y cuando se hicieran ajustes
Proceedings of 7th WEEC Niche 5: Ecological and
green economies
190
correspondiente; esa experiencia fue el programa de subsidio conservacionista
implementado desde el año 1960 y que posteriormente se pasó a denominarse
Infraestructura Social Conservacionista para el Desarrollo Endógeno, el cual consistía en
el otorgamiento por parte del Estado, de un subsidio a los productores agrícolas con lo
cual se buscaba propiciar la producción agrícola y a su vez la conservación y
aprovechamiento sustentable de los recursos naturales, mediante la implantación de
prácticas agronómicas, forestales, mecánicas y/o estructurales como la reforestación,
construcción de terrazas, drenajes, surcos para riego, entre otras (Blanco et al,2006).
Pérez (2006) identificó como prioritario en Venezuela, al servicio de protección del recurso
hídrico, relacionado con la protección y manejo de los bosques de las cuencas
proveedoras de agua, la reducción de la frecuencia de inundaciones y reducción de la
erosión y los procesos de sedimentación aguas abajo, debido a que es un servicio que
tiene claramente identificado a sus usuarios. En el caso de otros servicios como secuestro
de carbono, conservación de la biodiversidad o paisaje, la falta de información sobre los
mismos o las dificultades que entrañan su negociación hacen difícil su inclusión como
parte de un programa de PSA en el país.
En el marco jurídico venezolano existen elementos que pueden utilizarse como la base
jurídica para el establecimiento de PSA, por ejemplo en la Ley de gestión de la diversidad
biológica (2008), se menciona que causan derechos compensatorios, las acciones de
conservación de la biodiversidad y de sus servicios ambientales y que las mismas deben
retribuirse económicamente de manera equitativa, mediante incentivos crediticios y
tributarios como por ejemplo el otorgamiento de créditos con tasas especiales y la
exoneración de un porcentaje del pago del impuesto sobre la renta.
Sin embargo las condiciones para el financiamiento de la conservación de los recursos
naturales en Venezuela son cada día más precarias poniendo en riesgo su propia
sustentabilidad. Por ejemplo el presupuesto del Instituto Nacional de Parques
(INPARQUES), organismo adscrito al Ministerio del Poder Popular para el Ambiente
(MINAMB), cuya función es la administración y manejo de los Parques Nacionales y
Monumentos Naturales en Venezuela es muy limitado, lo que incide en su capacidad
operativa, especialmente en las actividades de vigilancia y supervisión para prevenir
ilícitos ambientales, así como para garantizar el mantenimiento de estos importantes
ecosistemas, su diversidad biológica y servicios ambientales generados. Adicionalmente
en la mayoría de los Parques y Monumentos Nacionales por políticas del Estado, se dejó
de cobrar desde el año 2005, tarifas de entrada a los visitantes de los mismos y en los
pocos que existe un ingreso por actividades turísticas como en los parques Morrocoy,
Canaima, Cueva del Guácharo y los Roques, los recursos obtenidos no se reinvierten en
actividades de conservación ambiental de los mismos o en programas de manejo y/o la
actualización del ordenamiento de dichos Parques Nacionales, sino que se utilizan para
compensar el déficit presupuestario del Instituto (Andrade, 2009).
Actualmente la situación no es diferente a pesar de contar con una Ley Orgánica del
Ambiente (2006) que señala en los artículo 102 y 103, que el Estado venezolano
establecerá los incentivos económicos y fiscales que se otorgarán a las personas
naturales y jurídicas que efectúen inversiones para conservar el ambiente con el objeto,
entre otros, de promover el empleo de sistemas de gestión ambiental y prácticas
conservacionistas; sin embargo tales incentivos no se han definido ya que faltan leyes
especiales que los desarrollen.
Desde el año 2006 cuando se realizó el trabajo de CIFOR-ULA (Blanco et al, 2006) hasta
en la actualidad el marco jurídico e institucional venezolano en materia ambiental ha
variado considerablemente, por ejemplo se publicó la nueva Ley Orgánica del Ambiente
que se hizo mención en el párrafo anterior, se publicaron leyes especiales que pueden
tener incidencia en la aplicación de esquemas de PSA como la Ley de Aguas (2007) y La
Ley de Bosques y Gestión Forestal (2008) única norma en el país que menciona de
manera explícita en concepto de Pago por servicios Ambientales; adicionalmente el
Estado a través del MINAMB inició en el año 2006 un programa social denominado Misión
Árbol el cual busca la recuperación, conservación y uso sustentable de los bosques,
conjuntamente con el mejoramiento de la calidad de vida de las poblaciones que hacen
uso de los mismos.
La Misión Árbol es nuevamente una transformación del programa de Infraestructura Social
Conservacionista para el Desarrollo Endógeno, ya que a través del financiamiento u
otorgamiento de subvenciones a los denominados comités conservacionistas, procura que
con la participación de las comunidades se establezcan viveros comunales y se realicen
reforestaciones con fines protectores, agroforestales y comerciales-industriales, como
Proceedings of 7th WEEC Niche 5: Ecological and
green economies
192
estrategia de manejo integral y uso sustentable de las cuencas hidrográficas (MINAMB,
2012).
Sin embargo siguen existiendo elementos para no considerar a la Misión Árbol como un
esquema de PSA, ya que el subsidio que se otorga no está asociado a la provisión de
servicio ambiental en particular y los recursos económicos los provee directamente el
Estado sin aportes de posibles beneficiarios como lo serían por ejemplo, las empresas
hidrológicas y comunidades que se abastecen de agua potable, desaprovechando esta
fuente de ingresos con lo cual el programa pudiera masificarse aún más.
También existen deficiencias en el marco legal ambiental que deben superarse, como que
actualmente es el estado es el que compensa al que realiza labores de conservación
ambiental y no se obliga al pago por los servicios ambientales disfrutados por los
usuarios, como mecanismo para retribuir económicamente, al proveedor de los servicios
ambientales, por su labor de conservación(Andrade, 2009). Otro factor importante a tomar
en cuenta es el que señala Blanco et al(2006); en cuanto a que en Venezuela hay cierta
resistencia a nivel del sector gubernamental al concepto de Pago por Servicios
Ambientales ya que lo asocian a una postura neoliberal, por tal motivo las instituciones
prefieren hablar de Compensación por Servicios Ambientales (CSA), para evitar el sentido
mercantilista que puedan tener los PSA.
III.- CONCLUSIONES
Dada las condiciones ambientales de Venezuela, existen excelente oportunidades para la
implementación de esquemas de PSA como una opción importante de acceso a recursos
económicos para llevar a cabo planes, programas y/o proyectos para la conservación y
uso sustentable de sus recursos naturales; sin embargo para que ello sea efectivo,
primero se deberá superar la existencia de elementos o estructuras sociales, políticas e
institucionales que dificultan su entendimiento y aplicación en el país; de lo contrario el
Gobierno seguirá formulando y ejecutando, políticas y programas orientados a la
protección, defensa y/o aprovechamiento de los recursos naturales basados en
instrumentos de comando y control, que si bien pueden brindar resultados positivos
también tienen sus limitaciones, como la obtención de recursos económicos para lograr la
sostenibilidad en el tiempo de tales políticas.
III.- REFERENCIAS BIBLIOGRÁFICAS
Andrade; Rafael (2009). Pago por Servicios Ambientales en Áreas Protegidas en América
Latina. Informe País Venezuela. Programa FAO/OAPN. 31p. disponible en
http://www.fao.org/alc/legacy/fao-oapn/pdf/pago26.pdf, recuperado el 17/10/2012.
Blanco, Javier; Wunder, Sven; Sabogal, Javier. (2006) Potencialidades de Implementación
de Esquemas de Pagos por Servicios Ambientales en Venezuela. CIFOR-
ECOVERSA. Indonesia. 60p. Disponible en
http://www.cifor.org/pes/publications/pdf_files/CIFOR-Ecoversa.pdf, recuperado el
17/10/2012.
Casas, Adriana y Martínez, Rodrigo (2008). Marcos Legales para el pago por servicios
ambientales en América Latina y el Caribe: Análisis de ocho países. Organización
de Estados Americanos. Washington. 44p.
Cuenca, Roberto E. 2006. ¿La bioética en la educación ambiental?. Importancia de la
bioética para el desarrollo sustentable. Colombia Médica 37(4)299-307
Espinoza, Nelson; Gatica, Javier, Smyle, James (1999) El pago de servicios ambientales y
el desarrollo Sustentable en el medio rural. Serie de publicaciones RUTA. IICA. San
José, Costa Rica. 58p.
Gabaldón, Arnoldo J. (2006) Desarrollo Sustentable. La salida de América Latina. Grijalbo.
Caracas. 489p.
Ley de Aguas (2007). República Bolivariana de Venezuela. Gaceta Oficial Nº 38.595 del
02/01/07.
Ley de Bosques y Gestión Forestal (2008). República Bolivariana de Venezuela. Gaceta
Oficial Nº 38.946 del 5/6/2008.
Ley de Gestión de la Diversidad Biológica (2008). República Bolivariana de Venezuela.
Gaceta Oficial Nº 39.070 del 01/12/08.
Ley Orgánica del Ambiente (2006). República Bolivariana de Venezuela. Gaceta Oficial N°
5.833 extraordinario del 22 /12/06.
Millennium Ecosystem Assessment (2005) Evaluación de los Ecosistemas del Milenio
Informe de Síntesis. Borrador final. 43p. Disponible en
http://www.maweb.org/documents/document.439.aspx.pdf, consultado el
26/02/2010.
Ministerio del Ambiente y de los Recursos Naturales, Programa de las Naciones Unidas,
Fondo Mundial para el Ambiente (2005). Primera comunicación de cambio
climático. República Bolivariana de Venezuela. 164p.
Proceedings of 7th WEEC Niche 5: Ecological and
green economies
194
Pérez Roas, José (2006). La experiencia venezolana en esquemas de pago por servicios
ambientales. Informe para el proyecto CI-CIFOR sobre la factibilidad de PSA en el
Corredor Norandino. CIDIAT. Mérida. 135p. Disponible en
http://www.cifor.org/pes/publications/pdf_files/venezuela_experience.pdf.
recuperado el 17/10/2012.
San Martín González, E.; García, J. (2008). Análisis económico del cambio climático: de
Kioto a Bali. Economía de la energía. 2008(842):45-64
Sterner, Thomas (2007). Instrumentos de política económica para el manejo del ambiente
y los recursos naturales. CATIE. Costa Rica. 560p.
Vargas Hernández, José G. (2008). Economía política ambiental global e internacional.
DELOS: Desarrollo Local Sustentable. 1(1)1:18, disponible en:
www.eumed.net/rev/delos/01/, consultado el 23/04/2010
Wunder, S. (2005). Pagos por servicios ambientales. Principios básicos esenciales.
CIFOR, Occasional paper, N° 42.
Política medioambiental:
La educación medioambiental
María Rosa Vázquez Rodríguez
Facultad de Ciencias Jurídicas y Sociales - Universidad Rey Juan Carlos - Spain
Resumen
Las Administraciones Públicas disponen de distintos instrumentos para procurar el control
medioambiental. La elección del instrumento más adecuado dependerá en cada caso
particular de las circunstancias, así como de la naturaleza del problema ambiental de que
se trate. Por medio de la educación ambiental las administraciones públicas tienen un
instrumento fundamental para fomentar el respeto al entorno. Se ilustra con varios
ejemplos de buenas prácticas en educación ambiental.
1. INTRODUCCIÓN
El medio ambiente juega una serie de funciones en la economía: es la fuente fundamental
de recursos, el sistema natural ofrece servicios relacionados con el disfrute del medio
ambiente y es receptor de residuos en las actividades de producción y consumo (Pearce
& Turner, 1990).
Todas estas funciones son funciones económicas porque todas tienen un valor económico
positivo, si las vendiéramos y compráramos en el mercado, todas tendrían precios
positivos; así un parque tiene un valor económico, o cualquier otro bien natural; los
peligros vienen del mal uso del medio ambiente porque no reconocemos los precios
positivos de estas funciones económicas.
Como todos sabemos la economía se ocupa solamente de los recursos escasos. La
utilización racional de los recursos naturales adquiere importancia por su escasez e
incluso agotamiento. El objetivo de una sociedad es maximizar su bienestar a partir de
unos determinados recursos escasos. El mercado no siempre puede conseguir este
objetivo, ya que en algunos casos existen fallos de mercado, tales como el coste externo;
en estos casos la asignación de recursos productivos no se realiza de modo eficiente por
parte del mercado, ya que se están produciendo o consumiendo una cantidad mayor de
recursos naturales de la que sería deseable desde el punto de vista del bienestar global
de la sociedad (Pearce & Turner, 1990). En estos casos se requiere la intervención
pública para cumplir el objetivo anteriormente referidode maximizar el bienestar social.
Proceedings of 7th WEEC Niche 5: Ecological and
green economies
196
Por lo tanto, el medio ambiente tiene importancia en la economía, y con una utilización
más racional de los recursos naturales, se consigue, un mayor bienestar económico-
social, y se contribuye a crear riqueza económica; de ahí la importancia que tienen las
políticas públicas que afectan al medio ambiente.
1.1 INTERVENCIÓN ESTATAL
El estado se erige como regulador de todos los bienes comunes: espacio radioeléctrico,
carreteras, minas, ríos, playas etc.
Los poderes públicos, tienen una finalidad de interés general, cuyo objetivo es ofrecer
bienes y servicios a la colectividad; su condición de regulador de los bienes comunes se
legitima en razón del interés público. Además los poderes públicos tienen un mandato
constitucional de protección del medio ambiente; así tanto en la constitución española
como en la constitución de otros países de nuestro entorno, se encomienda la protección
del medio ambiente a los ciudadanos en general y a los poderes públicos en particular.
En el ámbito de la Unión Europea, con el Tratado de la Unión Europea (TUE) el medio
ambiente adquiere rango de política dentro de la Unión Europea. Una de las
características de la política medio ambiental es su carácter de transversabilidad, es decir,
el objetivo de protección de medio ambiente debe integrarse en la definición y en la
realización de todas las políticas públicas, en todas las actuaciones. Así, cuando se
construye una carretera no solamente se tiene que considerar el aspecto técnico sino que
también el ambiental. Otro ejemplo sería la educación.
La administración tiene como objetivo genérico la protección ambiental. Este objetivo
justifica las acciones (intervención) de la administración sobre todas aquellas actividades
que tienen impacto ambiental significativo
2. INSTRUMENTOS DE POLÍTICA MEDIOAMBIENTAL
La política medioambiental es aquella política pública que tiene como objetivo prevenir la
aparición de la contaminación y de cualquier actividad económica que resulte perjudicial
para el medio natural, si bien no se ciñe únicamente a este aspecto, sino que también
busca la preservación de la biodiversidad y los recursos naturales.
Para dar cumplimiento a la política ambiental, los diferentes poderes públicos, disponen
de múltiples instrumentos para procurar el control medioambiental de las actividades
productivas y de consumo; dentro de estos instrumentos se distingue:
2.1 INSTRUMENTOS LEGISLATIVOS
Los instrumentos legislativos consisten en regulaciones legales o de planificación que
dictan un determinado comportamiento a seguir, limitando o prohibiendo la emisión de
agentes contaminantes (gases, líquidos tóxicos, ruidos), restringiendo la actividad en
términos geográficos y/o temporales (por ejemplo, estableciendo máximo número de
plazas hoteleras o estableciendo número máximo de visitantes en un determinado lugar),
otorgando autorizaciones (Permisos y licencias), normas que obligan o prohíben
determinadas actuaciones (por ejemplo la urbanización de ciertas zonas de alto valor
ecológico, o la Ley de costas que regula las playas y territorios adyacentes), o cuotas o
moratorias establecidas. El incumplimiento lleva a multas o sanciones, que tienen un
efecto disuasorio.
2.2 INSTRUMENTOS ECONÓMICOS
Dentro de los instrumentos económicos se pueden distinguir varias medidas tales como
infraestructura, medidas de política fiscal o de compra o contratación pública.
2.2.1 INSTRUMENTOS INDIRECTOS
Toda la actividad humana tiene un impacto ambiental y también todas las políticas
públicas tienen impactos ambientales, los poderes públicos son los que deciden que
obras se van a llevar a cabo.
Así, la administración entre estas medidas puede
1. incurrir en inversiones o gastos para el suministro de infraestructuras (transporte
público, recogida de residuos, sistema de tratamiento de aguas residuales, etc.).
2. las medidas de protección y/o conservación de lugares de interés (parques nacionales
y naturales, monumentos históricos, etc.) o
3. las decisiones relativas al ordenamiento y gestión del territorio.
Con respecto a este último apartado, corresponde al estado la ordenación y gestión del
territorio, determinar el espacio para peatones en las ciudades, determinar qué espacios
pueden ser destinados a uso residencial, o, determinar que espacios, debido a su
singularidad o valor ecológico, deben ser protegidos. Dentro de las zonas de protección
se encuentran las zonas costeras, tales como playas y dunas, ríos. Hay un
reconocimiento institucional del valor de los bienes naturales de la costa, con unos
objetivos específicos de protección.
Proceedings of 7th WEEC Niche 5: Ecological and
green economies
198
La protección no siempre significa intervención; algunas veces la mejor protección es la
no intervención.
2.2.2 CRITERIOS AMBIENTALES INCORPORADOS EN CONTRATACIÓN
PÚBLICA
La compra y contratación pública se estima que constituye el 16 % del PIB de la U.E. Esta
es una gran porción del mercado que las distintas autoridades públicas pueden utilizar
para impulsar criterios de sostenibilidad ambiental al incluir el criterio ambiental en los
procesos de contratación y renovación de servicios y obras, considerando no sólo sus
aspectos técnicos o económicos, sino también sus aspectos ambientales.
La administración es libre de elegir lo que se va a adquirir, y puede especificar clausulas
de ejecución del contrato, es decir, cómo tiene que llevarse a cabo.
Así, a la hora de adquirir un producto o servicio, las administraciones pueden tener en
cuenta criterios como el ahorro de recursos, energía o agua; la reducción en la generación
de residuos, requerir un tipo de productos o materiales determinados, por ejemplo exigir el
uso de materiales reciclados para una determinada obra, que los proveedores de obras y
servicios estén en posesión de un sistema de gestión ambiental o que los productos
adquiridos estén certificados con ecoetiquetas.
En la fase de selección del contratista, un contratista podría quedar excluido de la
contratación pública por haber cometido infracciones a la legislación ambiental.
2.2.3 MEDIDAS DE POLÍTICA FISCAL
Entre los instrumentos económicos están las medidas de política fiscal. Los instrumentos
económicos son aquellos que actúan sobre los costes y los beneficios de los agentes
económicos y buscan modificar los comportamientos de los sujetos en sentido favorable
al medio ambiente.
Por medio de la política fiscal, el estado tiene un gran margen de maniobra para influir en
la economía de los agentes económicos, actuando ya sea por el lado de gasto o de los
ingresos. Por medio de los ingresos públicos los poderes públicos gravarán o penalizarán
las conductas que se quiere erradicar; y por medio de los gastos públicos premiarán una
conducta favorable al medio ambiente.
Así, los poderes públicos pueden otorgar ayudas y subvenciones para inversiones en
mejoras tecnológicas; otras medidas fiscales para el control de la contaminación
contempladas en el ordenamiento tributario son las constituidas principalmente por los
beneficios fiscales, tales como las exenciones, deducciones y rebaja en el tipo de
gravamen, que suponen la renuncia a parte de los ingresos públicos; al beneficiario se le
exige que tenga una conducta favorable al medio ambiente.
La Unión Europea aporta fondos para financiar las mejoras del medio ambiente por medio
de diferentes programas; el instrumento financiero LIFE+ financia medidas que
contribuyen al desarrollo, la aplicación y actualización de la política y la legislación
comunitaria de medio ambiente.
Los tributos están articulados en torno al principio quien contamina paga, otros tributos
pretenden incrementar el coste en el uso de un recurso; se pretende con ello
desincentivar o modificar las conductas. Los impuestos tienen una función correctiva
importante, pues al gravar la actividad productiva y contaminante, es de suponer que la
empresa tenderá a reducir esta actividad.
Por ejemplo, por medio de la política fiscal se consigue reducir las emisiones de gases de
efecto invernadero. Quien hace una agresión al medio ambiente debe pagar. En cualquier
caso; no hay dinero que page la contaminación generada y es mejor prevenir la
contaminación.
2.2.4 LOS PERMISOS NEGOCIABLES Y EL CUMPLIMIENTO DEL
PROTOCOLO DE KIOTO
El origen de los permisos de emisión negociables, como instrumento económico para
proteger y mejorar el entorno natural, se encuentra en la necesidad de reducir las
emisiones a la atmósfera realizadas por determinadas industrias con el objetivo de cumplir
los compromisos alcanzados en el protocolo de Kioto.
2.3 INSTRUMENTOS VOLUNTARIOS O DE MERCADO
La U.E. establece que los poderes públicos de los diferentes países miembros de la U.E.
tienen la obligación de incitar al mercado a actuar a favor del medio ambiente mediante
instrumentos voluntarios o de mercado.
Los instrumentos voluntarios o de mercado se basan en la creciente conciencia
medioambiental de la población, que demanda un mayor consumo de productos y
servicios que no perjudiquen al medio ambiente, esta categoría de instrumentos pretende
que sea el propio mercado el que se autorregule, otorgando una ventaja competitiva a las
Proceedings of 7th WEEC Niche 5: Ecological and
green economies
200
empresas con un comportamiento medio ambiental responsable y dejando fuera del
mercado o en desventaja a aquellas que no lo tengan.
Estos instrumentos pretenden integrar el factor medioambiental en la organización de la
empresa, permitiendo que la organización identifique y controle los aspectos ambientales
significativos y sus impactos e identifique opciones para reducir el consumo de recursos o
de energía.
Las ventajas económicas para las empresas son que la producción de productos
ecológicos puede contribuir a su diferenciación con el resto de productos, siempre que el
consumidor lo sepa apreciar.
Los consumidores no tienen en casa un laboratorio para conocer si una determinada
empresa y otros organismos tienen un comportamiento favorable al medio ambiente, por
eso tiene que haber un organismo competente de la administración que certifique si esa
empresa está o no cumpliendo con la legislación ambiental.
Dentro de los instrumentos de mercado, hay instrumentos que hacen énfasis en el
producto, otros hacen énfasis en el proceso productivo, otros instrumentos tienen carácter
preventivo, otros carácter correctivo.
2.4 LOS INSTRUMENTOS DE EDUCACIÓN
Los poderes públicos disponen de varios instrumentos para conseguir el control
medioambiental. La elección del instrumento más adecuado dependerá en cada caso
particular de las circunstancias, así como de la naturaleza del problema ambiental de que
se trate. Además de los instrumentos legislativos, económicos y de mercado,
anteriormente vistos, los poderes públicos tienen otros instrumentos para procurar el
control medioambiental, tales como la educación ambiental.
Por medio de la educación ambiental, las administraciones públicas tienen un instrumento
fundamental para fomentar el respeto al entorno.
Dentro de la educación se distingue entre educación reglada y no reglada. En España es
obligatoria la educación ambiental en la educación primaria y secundaria, esta figura no
solo como asignatura sino que tiene carácter transversal, eso significa que los valores de
protección al medio ambiente tienen que estar presentes en todas las asignaturas, que
deben convertirse no en una asignatura más, sino en la base de desarrollo de las demás
materias.
La incorporación de la Educación Ambiental en el currículo escolar supone el
reconocimiento, desde el Sistema Educativo, del papel que juega el medio ambiente en la
sociedad, a la vez que es una respuesta a las demandas que se vienen haciendo a la
educación.
No basta con introducir en los documentos curriculares el medio ambiente, sino que hay
que vivir la protección del medio ambiente practicando con el ejemplo de manera que la
forma en la que la institución utiliza los recursos y gestiona los residuos no puede
contravenir los principios de sostenibilidad.
En el caso de que la educación se realice en instituciones de enseñanza superior la
contribución más positiva que una universidad puede hacer para un futuro más sostenible
es a través de sus estudiantes, que serán los responsables de tomar decisiones en el
futuro. De esta manera, el reto para la institución es el de desarrollar en los estudiantes la
habilidad de tomar decisiones que tomen en consideración los principios de sostenibilidad,
debido a la trascendencia económica y social de La universidad como responsable de la
formación de futuras generaciones,
Con el Espacio Europeo de Educación Superior (EEES) los nuevos requerimientos
medioambientales en todos los sectores son cada vez mayors y más específicos.
Por lo tanto las universidades, y todo el sistema educativo en general juega un papel
importante en la concienciación medioambiental.
La política medioambiental de una institución de enseñanza superior debe contemplar la
colaboración con autoridades locales, suministradores y organizaciones en relación con
metas medioambientales compartidas. Es importante considerar que la política
medioambiental no debe quedar aislada sino que debe ser compatible con otras políticas.
La educación ambiental no reglada pretende la concienciación de empresarios, turistas y
población en general sobre los problemas ambientales asociados a la actividad
económica y las formas de colaborar en su reducción. Estas iniciativas incluyen
actividades de sensibilización y difusión de información, educación y formación
profesional.
Una de las características de las buenas prácticas es que son un modelo y pueden ser
replicados en la gestión de otros recursos naturales, y que muchas de las consideraciones
de estos programas sirvan igualmente como reflexión para la gestión de otros recursos
naturales.
Como ejemplos de buenas prácticas son las campañas de sensibilización en España son
la “Campaña Pirineos Limpios” (sensibilización ambiental de los turistas sobre los
problemas derivados del abandono de basuras en el medio natural). Otro ejemplo son las
campañas de educación para prevención de incendios en el monte. El programa “Muévete
Proceedings of 7th WEEC Niche 5: Ecological and
green economies
202
Verde” de la Ciudad de Madrid pretende difundir las buenas prácticas en Movilidad
Sostenible, con repercussion en dicha ciudad. Otras campañas que traten de sensibilizar
a la población sobre el vertido incontrolado de residuos urbanos (materia orgánica, papel,
vidrio,...) en el litoral marino, conocer su toxicidad y por lo tanto su correcta manipulación.
Todas estas medidas correctoras de los programas de educación ambiental citadas
anteriormente ni se consideran ni muy costosas ni muy difíciles.
3. CONCLUSIÓN
Una buena gestión medio ambiental es creadora de riqueza. Los poderes públicos tienen
un gran margen de maniobra para la protección del medio ambiente. La elección del
instrumento más adecuado dependerá en cada caso particular de las circunstancias, así
como de la naturaleza del problema de que se trate. Así no siempre la solución de un
problema ambiental implica una infraestructura o legislación, sino en algunos casos para
determinados problemas la educación ambiental puede ser tan efectiva como el
establecimiento de un impuesto ecológico.
La protección no siempre implica intervención, en algunos casos la mejor protección es la
no intervención.
BIBLIOGRAFIA
Austin, D. (1999) Economic Instruments for Pollution Control and Prevention – A
Brief Overview World Resources Institute. http://pdf.wri.org/incentives_austin.pdf
Buñuel González, M (1999) El uso de Instrumentos económicos en la Política del
Medio Ambiente. Consejo Económico y Social.
Fernández-Bolaños Valentín, A. (1998) Incidencia de la Política ambiental en la
actividad económica. Universidad Complutense de Madrid
Ley 2/2011, de 4 de marzo, de Economía Sostenible. (B.O.E. 5 de marzo de 2011).
Ley 30/2007, de 30 de octubre, de Contratos del Sector Público (B.O.E. 31 de
octubre de 2007).
Manual para la formación en medio ambiente. Editorial Lex Nova 2008
OECD (1997), Evaluating Economic Instruments for Environmental Policy, OECD,
Paris, France.
ORDEN PRE/116/2008, de 21 de enero, se aprueba el Plan de Contratación
Pública Verde de la Administración General del Estado y sus Organismos Públicos, y
las Entidades Gestoras de la Seguridad Social. (BOE de 31 de enero de 2008.)
Pearce, David & K. Turner, (1990) Economics of Natural Resources and the
Environment, Harvester Wheatsheaf, Hertfordshire, U.K.
Plata Suárez, J. y Martín Teixé G. (2007) Pasado, presente y futuro de la
Educación Ambiental en la formación inicial del profesorado. Revista electrónica
interuniversitaria de formación del profesorado.
Program “Muévete Verde”. The City of Madrid
Sixth Environment Action Programme. www.europa.eu
VILLAMIL SERRANO, A. y MATIES GARCÍA, J. (2011) Política económica del
medio ambiente. Editorial Universitaria Ramón Areces.
Proceedings of 7th WEEC Niche 5: Ecological and
green economies
204
Intégration des préoccupations environnementales dans le Projet
Arboriculture Fruitière (cas de la chaîne de valeur du palmier dattier)
YAHYAOUI Abdelaziz, FLSH, Université Cadi Ayyad Marrakech
Résumé
Le projet Arboriculture Fruitière est un projet de développement agricole, inscrit dans le
PilierII du Plan Maroc Vert, centré sur quatre filières : le palmier dattier dans les zones
oasiennes et l’olivier, l’amandier et le figuier dans les zones de montagnes et PMH au
niveau national. Il a bénéficié d’un don américain dans le cadre de Compact de Millenium
Challenge Account (MCA).
Un des aspects fondamentaux de ce projet est sa composante transversale à savoir
l’environnement et le genre. Ma communication s’attardera sur l’intégration des
préoccupations environnementales dans la chaine de valeur du palmier dattier, depuis la
conception du projet et comment cette composante est perçue sur terrain et quelle sont
les difficultés de communication sur les aspects environnementaux (rareté de l’eau, perte
de biodiversité, pollution des milieux, désertification, changements climatiques).
Le volet transversal environnement est présent sur toute la chaine : en amont de l’activité
à travers le choix du profil variétal noble et tolérant à la maladie du Bayoud qui a décimé
les 2/3 du patrimoine phoenicicole des oasis marocaines. Dans l’utilisation des traitements
phytosanitaires et l’obligation de rationnaliser ces traitements pour ne pas nuire aux
ressources en eaux déjà rare et à la micro faune et aux sols. En aval de la chaine,
l’utilisation de la phosphine dans les traitements post récolte est crucial et soulève
beaucoup de question environnementale : ce substitut de bromure de Méthyle gaz nocif
pour la couche d’ozone présente encore des défis quant aux résidus dans les dattes
fumuguées et le danger inhérent à son utilisation par un personnel non qualifié. Il sera
procédé aussi dans le cadre de projet à la mise en place des unités de conditionnement
des dattes et il faut se préoccuper des atteintes possibles des déchets solides et liquides
de ces unités sur les milieux (air, eau, sol, biodiversité) et quelle utilisation des ressources
(eau et énergie) et quelle possibilité d’atténuation des nuisances?
Le troisième volet d’intervention du projet est les projets pilotes pour femmes. En effet la
plupart des projets qui ont reçu l’aval d’un financement concernent la valorisation des
produits et des sous produits du palmier dattier. Comment cette valorisation participe à la
sauvegarde de la biodiversité oasienne et la valorisation des déchets comme compost ou
unités fourragères pour la race D’man.
Introduction
Le projet Arboriculture Fruitière (PAF) est un projet de développement agricole, inscrit
dans la stratégie du Plan Maroc Vert (PilierII/agriculture solidaire) du Ministère de
l’Agriculture et de la Pêche Maritime. Centré sur quatre filières : le palmier dattier dans les
zones oasiennes et l’olivier, l’amandier et le figuier dans les zones de montagnes et de
Petite et Moyenne Hydraulique (PMH). Il a bénéficié d’un don de 340 millions de Dollars
des Etats Unies d’Amérique dans le cadre de Compact Millenium Challenge Account
(MCA).
L’objectif du PAF est l’augmentation de la productivité et la compétitivité des quatre filières
arboricoles (olivier, amandier, figuier et palmier dattier), l’amélioration de la croissance
ainsi que la réduction de la pauvreté dans les zones de montagnes et oasiennes.
I- Composantes du Projet Arboriculture Fruitière
Un des aspects fondamentaux de projet PAF est sa composante transversale à savoir
l’environnement. Ainsi ce dernier volet a été intégré dans toute la chaîne du palmier
dattier : en amont de l’activité à travers le choix du profil variétal noble et tolérant à la
maladie du Bayoud qui a décimé les 2/3 du patrimoine phoenicicole des oasis marocaines,
dans l’utilisation des traitements phytosanitaires et l’obligation de rationnaliser ces
traitements pour ne pas nuire aux ressources en eaux déjà rare et à la micro faune et aux
sols. En aval de la chaine par l’utilisation de la phosphine dans les traitements post
récolte. Ce volet relatif à la fumigation des dattes est crucial et soulève beaucoup de
question environnementale. Ce substitut de bromure de Méthyle gaz détruisant la couche
d’ozone présente encore des défis quant aux résidus dans les dattes fumiguées et le
danger inhérent à son utilisation par un personnel non qualifié.
Dans le cadre de projet, la mise en place des unités de conditionnement des dattes est
préoccupant de part les atteintes possibles des déchets solides et liquides de ces unités
sur les milieux (air, eau, sol et biodiversité) et quelle utilisation des ressources (eau et
énergie) et quelle possibilité d’atténuation des nuisances ?
Proceedings of 7th WEEC Niche 5: Ecological and
green economies
206
La troisième composante de PAF est les projets pilotes pour femmes. En effet la plupart
des projets qui ont reçu l’aval d’un financement de MCA concernent la valorisation des
produits et sous produits du palmier dattier. Comment cette valorisation participe à la
sauvegarde de la biodiversité oasienne et la valorisation des déchets comme compost ou
unités fourragères.
Zone d’intervention du PAF
Le projet Arboriculture Fruitière composante oasienne est mis en œuvre dans six
provinces de sud marocain : Figuig, Errachidia, Tinghir, Ouarzazate, Zagora et Tata, sur
une superficie de 15 756 ha, ce qui représente 35,8 % des palmeraies du Maroc.
Les activités du PAF
Le Projet PAF comporte les principales activités suivantes :
L’amélioration de l'infrastructure d'irrigation, incluant le revêtement et la
réhabilitation des canaux d’irrigation et des seuils de dérivation, des bassins de
stockage et des stations de pompage, les travaux d’aménagement de sources et de
khettaras;
La réhabilitation de palmeraies, y compris, le nettoyage des touffes et la fertilisation
du palmier dattier
La fourniture et la plantation de 282 500 vitro-plants et de 60 000 rejets de palmiers
dattiers
L’appui technique, l’encadrement et la formation des agriculteurs et jeunes sur
l’itinéraire technique du palmier dattier ainsi que leurs organisations
professionnelles de premier et second ordre sur les aspects financiers, gestion
managerielle, marketing, comptabilité et accès aux services financiers;
L’appui technique, le conseil et le développement des plans d'affaires pour les
unités de conditionnement des dattes, les équipements d'emballage et
d'entreposage au froid
Le développement des services associés au secteur de l’Arboriculture Fruitière.
II- Aspects méthodologiques d’intégration de l’environnement dans le Projet
Arboriculture Fruitière
L’intégration de l’environnement est une réponse aux préoccupations
environnementales du Projet Arboriculture Fruitière (PAF) et de Millenium Challenge
Corporation (MCC) exprimées dans le cadre d’une évaluation environnementale
stratégique (EES) qui a débouché sur des plans d’actions. C’est aussi une recherche de la
conformité des activités du projet avec la législation nationale en matière de
l’environnement et le besoin de se conformer avec les engagements du Maroc au niveau
international (le Maroc est signataire de plus de 60 conventions environnementales).
L’impact des activités du Projet Arboriculture Fruitière sur l’environnement comprend
l’impact sur l’environnement naturel d’un site (eau, air sol et biodiversité) et de ses
alentours et sur les êtres humains dépendant de cet environnement. Il prend en
considération les effets sur la propriété culturelle, les populations autochtones et les
déplacements de population involontaires, ainsi que les impacts sur la santé et la sécurité
des êtres humains. Il peut également comprendre les impacts provoqués, indirects, et
cumulatifs considérables et les effets raisonnablement prévisibles qui peuvent être
associés à, ou dépendants du projet.
De ce fait, un projet susceptible de représenter un impact négatif considérable pour
l’environnement, la santé, ou la sécurité est défendu de recevoir les fonds de MCC. Il est à
rappeler que les effets indésirables du projet sont évalués par des études d’impact et
d’évaluation environnementale stratégique (EES).
En plus des exigences du bailleur du fonds le MCC, le Maroc est engagé dans une
politique environnementale volontaire avec pour objectif: l’amélioration du cadre de vie des
populations locales et la promotion de développement durable. Pour concrétiser ces
interventions dans le domaine environnemental, Le Maroc a mis en place sa stratégie
nationale d’environnement et développement durable délinée actuellement en plusieurs
programmes qui touchent les différents milieux (eau, sol, air, littoral, oasis, montagne et
diversité biologique). Cette stratégie a identifié des problèmes majeurs liés à la pollution
de l’eau, l’érosion des sols et la désertification.
La prise de conscience des enjeux environnementaux s’est traduite au Maroc aussi par la
promulgation d’un arsenal juridique qui englobe la protection des animaux et des
végétaux, de même que des espèces en voie d’extinction, la protection des zones
humides et des habitats d’importance, à la protection du patrimoine culturel et naturel
mondial, à l’usage des produits phytosanitaires, et à la production de matières organiques
Proceedings of 7th WEEC Niche 5: Ecological and
green economies
208
polluantes et persistantes (POPs). Ci-dessous les textes importants promulgués les
dernières années :
Loi cadre sur l’environnement
Loi sur les Etudes d’Impact
Loi sur la pollution de l’air
Loi sur les déchets solides
Loi sur l’eau
Charte nationale sur l’environnement et le développement durable
III- Résultats de l’intégration de l’environnement dans le PAF
Au départ, nous avons réalisé des diagnostics participatifs avec les populations dans
les périmètres d’intervention du PAF. Ces diagnostics font ressortir une multitude de
problèmes environnementaux dont souffrent les oasis objet d’intervention de projet, ainsi
les problèmes suivants sont identifiés:
Les pressions urbaines et touristiques engendrées par un fort
développement immobilier interfèrent avec les vocations agricoles des
terrains (agriculture ou urbanisme)
La modification du mode de vie traditionnel et du patrimoine culturel, plus
spécifiquement le recours aux motopompes qui menacent la pérennité de la
ressource en eau;
L’ensablement, l’érosion et la perte de couvert végétal qui sont tous inter-
reliés, accentués par les sécheresses qui provoquent la désertification et la
perte de parcelles cultivables;
Les eaux usées et de lessive dont l’utilisation à des fins d’irrigation présente
un risque bactériologique pour la santé humaine, les cultures et pour le
bétail;
La salinisation des sols qui provoque l’abandon des parcelles agricoles;
Les décharges sauvages qui provoquent le déplacement vers l’aval des
déchets en période de crue.
A l’occasion des ateliers de diagnostics nous avons pris conscience de la difficulté de
communiquer sur les aspects environnementaux, les agriculteurs considèrent ces
préoccupations comme un luxe. A l’inverse de ce sentiment d’incompréhension, les
agriculteurs sont conscients des dangers qui guettent les ressources en eau et sont prêts
à s’investir dans la reconversion des systèmes d’irrigation et adopter les techniques de
goutte à goutte.
Les manifestations violentes des risques naturels (récurrence des crues et sécheresses)
dans le sud-est marocain reviennent souvent dans les discussions avec les agriculteurs et
se posent la question sur les dégâts causés par ces manifestations à leurs parcelles
(sapement des berges ) et leurs biens. Ils proposent que le projet prospecte les pistes de
solutions possibles et la mise en place des projets pilotes à l’instar des projets pilotes pour
les femmes.
Les agriculteurs ont exprimés leurs attentes en matière de sauvegarde de la ressource en
eau, ils souhaitent que l’accompagnement du projet se matérialise par des actions
concrètes sur le terrain sans pour autant se soucier des montages financiers de ces
actions.
Sensibilisation et mise à niveau environnemental des équipes de
projet
Pour mettre à niveau les équipes de projet sur les aspects environnementaux, une
formation générale est proposée aux équipes avec pour objectif de les sensibiliser sur les
défis qui menacent les milieux environnementaux. Ainsi plusieurs volets sont évoqués: la
problématique environnementale au niveau mondial et les défis des changements globaux
qui pèsent sur la planète notamment les changements climatiques. Comment ces
problèmes se déclinent au niveau national et quels sont leurs impacts au niveau des
périmètres d’intervention du projet (sécheresses récurrentes et crues dévastatrices). Le
rappel des composantes de la démarche environnementale Etat Pression Réponse Impact
(EPRI) adoptée pour l’élaboration du Rapport National sur l’Etat de l’Environnement.
Quels sont les problèmes environnementaux qui touchent notre pays et quels sont les
milieux touchés. Dans la perspective d’initier des projets pilotes dans le domaine de
l’environnement, une formation sur le montage du projet et les approches de
développement (notamment l’approche participative) a été prodiguée aux animateurs de
projet.
Proceedings of 7th WEEC Niche 5: Ecological and
green economies
210
D’autres aspects environnementaux sont développés avec les équipes de zones, ils
sont relatifs au management environnemental, l’utilisation des produits phytosanitaires, la
rationalisation de l’utilisation de l’eau à la parcelle, la valorisation des déchets.
Les fiches individuelles par agriculteurs
Dans un souci d’avoir une situation de référence en matière environnementale, la
fiche individuelle d’agriculteur proposée intègre des aspects environnementaux en amont
et en aval de la chaîne de valeur de la filière du palmier dattier : ainsi après dépouillement
des fiches remplies on a des éléments tangibles sur les aspects suivants:
Typologie des écosystèmes oasiens (monoculture, deux étages, trois étages)
Contraintes du foncier (petites exploitations dispersées)
l’utilisation des produits phytosanitaires (fumier organique, engrais et pesticides)
dans les différents périmètres
Source de la ressource en eau (superficielle ou souterraine)
Le mode d’irrigation adopté (traditionnel, moderne ou pompage) (gravitaire ou
localisé)
Profil variétal dominant dans les oasis (biodiversité oasienne)
Compétitivité entre les différentes espèces arboricoles
Valorisation des qualités mauvaises de la datte en tant qu’aliment de bétail
Utilisation ou non des bonnes techniques culturales.
Au deuxième passage à la fin de projet PAF, nous aurons des renseignements sur
l’évolution des indicateurs environnementaux. Cette situation de référence servira aussi à
construire des indicateurs de suivi évaluation environnementale du projet.
IV- Intégration des aspects environnementaux en amont de la chaîne (cas de
nettoyage des touffes et de la récolte)
A partir des diagnostics préliminaires réalisés dans les différents périmètres
d’intervention du projet, il s’avère que l’infestation de dattes aux champs et dans les
locaux de stockage fait perdre aux agriculteurs 40% de la récolte et par la même occasion
elle participe à l’effondrement des revenus des agriculteurs dans les oasis. Pour
sensibiliser les agriculteurs à l’importance d’adopter les bonnes pratiques en matière de
récolte pour minimiser les dégâts et respecter les exigences environnementales. Ces
préoccupations sont intégrées dans les modèles de formations : récolte, nettoyage des
touffes, traitements phytosanitaires en adoptant une approche basée sur la sensibilisation
dans un cadre participatif des agriculteurs ainsi que le renforcement des capacités des
équipes de zone en matière de l’approche environnementale.
Dans ce contexte il est demandé aux formateurs lors de leurs différentes interventions de
rappeler le rôle déterminant de la phoeniciculture en matière environnementale: on est
dans un espace en équilibre précaire, fragile sur le quel sont exercées plusieurs pressions
ce qui met en péril cet équilibre fragile. Rappeler aussi que l’oasis est une forme
d’adaptation dans un milieu aride à saharien hostile qui connait des mutations profondes
qui risque de rendre sa dégradation irréversible.
L’occasion de la récolte des dattes est propice pour le nettoyage des touffes. Cette
dernière opération génère des déchets qui sont utilisés dans la lutte contre l’ensablement.
Après le tri de la récolte, les dattes issues des mauvais khalts sont utilisées comme
aliment de bétail.
Il est apparu que les méthodes traditionnelles de récolte sont à la base de beaucoup de
problème en matière environnementale notamment la perte de la ressource : ainsi une
grande partie des dattes jetées d’en haut du palmier dattier finissent dans les touffes. Les
1ère pluies d’automne apportent une humidité abondante qui participe à la pourriture des
dattes laissées dans les touffes (interceptées aux nivaux des Cornaff et des Fibrilliums).
Cette situation est à la base de plusieurs atteintes au pied mère (khamej), la baisse de la
qualité du fruit et la fréquence des attaques des ravageurs et les souillures.
L’opération d’élagage des rejets est l’occasion d’utilisation des palmes des jeunes rejets
comme aliment de bétail, bois de feu ou comme compost après broyage. Ce qui permettra
d’apporter une partie de la matière organique dont aura besoin le palmier dattier. On peut
aussi utiliser les produits d’élagage pour la confection des produits artisanaux (coffins,
chwari, tapis, nattes)
Ensachage des régimes est l’occasion d’éviter l’attaque de la pyrale, le khamej et autres
champignons notamment les acarioses, déplodia et maladies qui affectent les dattes au
stade de maturation et au stockage (augmentation des dattes pourries).
Proceedings of 7th WEEC Niche 5: Ecological and
green economies
212
Parmi les bonnes pratiques préconisées en plus de l’ensachage des régimes, le
ramassage des sacs utilisés pour la protection des régimes en conformité avec la loi 28 00
sur la gestion des déchets solides.
Pour limiter l’infestation des dattes, les agriculteurs doivent être sensibilisés aux bonnes
pratiques de transport des dattes dans des moyens qui respectent les règles d’hygiène : la
propreté, le non mélange des dattes infestées et dattes saines, ne pas laisser les dattes
dans les champs et nettoyage des touffes des restes des dattes.
La phase de fumigation est cruciale pour le respect des exigences environnementales.
Auparavant, la fumigation se faisait au Bromure de Méthyle. Ce gaz toxique, est tenu
responsable de la destruction de la couche d’ozone et la communauté scientifique a
développé des alternatives au bromure de méthyle sous forme de traitements physique et
biologique pour limiter l’infestation de la datte par la pyrale et autres acariens. Les
formateurs sont tenus de rappeler le danger pour l’environnement et l’homme de recourir
au Bromure de Mytyle dans la fumigation des dattes.
V- Intégration de l’environnement en aval de la chaine de valeur du palmier
dattier
La mise en place des unités de conditionnement des dattes dans les périmètres
d’intervention de projet PAF, se fait dans le respect des préoccupations environnementale
et sociale. Ainsi pour l’environnement on se préoccupe des impacts des unités de
conditionnement des dattes sur les milieux avoisinants et ressources naturelles (eau, air,
sol), en plus des impacts directs sur la santé et sécurité des êtres humains (riverains ou
employés des unités). Les impacts provoqués par l’unité de conditionnement, peuvent être
directs ou indirects et peuvent présenter un danger sur l’environnement (pollution), et la
population (risque de contamination).
Il est prescrit dans le compact de MCA pourvoyeur de fonds qu’en cas de danger, les
impacts négatifs doivent être atténués par des mesures de mitigation afin de minimiser les
atteintes aux milieux et sur la population.
Pour le cas des unités de conditionnement, les impacts attendus directs ou indirects sont
positifs et sont relatifs à la valorisation et le conditionnement des dattes à travers un
processus industriel adéquat ou la datte sera fumigée, triée, lavée, glucosée, séchée et
mise en cartons avant d’être stockée dans des unités frigorifiques et mise sur le marché.
Néanmoins, d’autres aspects environnementaux sont à prospecter notamment l’utilisation
des ressources en eau et en énergie ainsi que le sort des effluents des unités de
conditionnement des dattes sur les milieux récepteurs (eau, sol). Ainsi les activités du
projet ne doivent pas occulter les aspects liés à la préservation des ressources et ce à
travers une utilisation rationnelle des eaux et l’utilisation des énergies renouvelables dans
les unités. En effet, le sud marocain jouit d’une capacité solaire importante qu’il faut mettre
à contribution dans l’approvisionnement de l’unité en énergie propre. Les unités doivent
faire l’objet d’un suivi en ce qui concerne les effluents liquides générés et s’ils ne
représentent pas d’impacts négatifs sur la ressource en eau déjà rare dans les oasis, ainsi
que sur les ressources en sol proche du site d’installation des unités de conditionnement.
Des audits environnementaux peuvent être envisagés pour la suite de la mise en œuvre
des unités si les déchets s’avèrent importants, ce qui n’est pas le cas actuellement.
Les activités des unités de conditionnement sont en général non consommatrices des
quantités importantes des eaux de même qu’elles ne sont pas productrices des eaux polluées
en comparaison avec d’autres activités industrielles. Les eaux usées peuvent parvenir justes
des blocs sanitaires, du lavage des caisses, de l’assainissement du sol et des murs et des
opérations industrielles simples entre autre le lavage des dattes sèches, le glucosage, etc.
Pour les eaux usées produites des unités, ces dernières doivent être raccordées au réseau
public d’assainissement, s’il existe. Dans le cas ou ce type d’infrastructure n’est pas
disponible, la mise en place des fosses septiques seront indispensable dans un endroit
approprié. La fosse septique devra être élaborée dans les règles de l’art et devra disposer
d’une capacité suffisante pour accumuler toute les eaux usée le long de la campagne
agricole.
Un autre aspect environnemental crucial qui doit faire l’objet d’un suivi rigoureux : il s’agit
de la fumigation de la datte, les pertes post récoltes importantes exigent la fumigation de
la datte par le phostoxin. Cette opération doit se faire dans le respect des exigences de
sécurité humaine et par la suite recherché des alternatives peu couteuse et efficace pour
l’éradication de la pyrale de datte dans le respect des principes de la lutte intégrée
Proceedings of 7th WEEC Niche 5: Ecological and
green economies
214
notamment l’ensachage des régimes. Les agriculteurs doivent être sensibilisés aux
bonnes pratiques de transport des dattes par des moyens et dans des conditions qui
respectent les règles d’hygiène, la propreté, le non mélange des dattes infestées et dattes
saines, ne pas laisser les dattes dans les champs dans les touffes du palmier et le
nettoyage des champs des restes des dattes après récolte.
Pour le genre, il fait référence aux impacts potentiels des unités mises en œuvre dans le
cadre de projet PAF sur la situation des femmes et de la population vivant dans le territoire
de projet. Il y est question aussi d’évaluation des retombées des unités en matière
d’emplois et en général, les effets induits par les unités sur l’économie locale. Il faut
rappeler que les espaces oasiens qui constituent le territoire sur lequel sont installées ces
unités, sont des territoires marginaux, fragiles de par leurs situations environnementales et
sociales et parfois enclavés. Ces spécificités territoriales doivent nous amener à réfléchir
d’une façon intégrée sur les impacts potentiels des unités installées dans le cadre du
projet arboriculture fruitière composante oasienne. Un premier constat est que le projet
PAF s’inscrit dans l’objectif général du compact à savoir la réduction de la pauvreté au
Maroc (espaces oasiens) par le biais de la croissance économique. Cette dernière ne peut
se faire que par la stimulation de la croissance économique via l’augmentation de la
production et l’amélioration de la qualité des produits mis sur le marché, notamment dans
les secteurs à fort potentiels (le dattier dans le cas des oasis). Cette augmentation aura
des impacts positifs sur les revenus des femmes et stimulera la création d’emplois laissant
entrevoir un avenir meilleur pour ces populations au lieu de la réalité difficile, marginalité et
exode rural qu’elle vive et permettra de baisser les taux de pauvreté dans plusieurs
communes ciblées par le projet PAF (plus de 30%) ; taux déjà élevé dans les oasis de
sud. La mise en place des unités de conditionnement des dattes permettra une
diversification des revenus des femmes et l’amélioration de leurs conditions économiques
et sociales par l’augmentation de leurs revenus à travers la création d’emplois dans les
unités. Cette initiative permettra aussi de développer des compétences nouvelles chez les
femmes et l’ancrage de l’activité féminine dans la chaîne de valeur du palmier dattier.
La diversification des activités des femmes aura des impacts positifs sur leurs revenus et
ainsi sur leur autonomie financière au sein de leurs familles. Ainsi que l’augmentation du
taux d’employabilité des femmes et la consolidation de leur pouvoir économique et
décisionnel et l’amélioration de leurs capacités managerielle et organisationnelle dans le
cadre d’OPA de premier ordre (Coopérative) et de second ordre (Groupement d’Intérêt
Economique).
VI- Intégration de l’environnement dans les projets pilotes destinés aux
femmes
L’impact environnemental, social, sécurité et santé fait référence aux impacts positifs et
négatifs ainsi que les mesures de mitigation des projets mis en œuvre par le PAF
(composante oasis). Nous essayerons dans cette section à titre d’exemple de mettre en
exergue l’impact du projet «Unité de conditionnement des dattes » de la Coopérative
Féminine Attakadoum/Hart Elyamine/Toudghra Soufla/Tinghir sur l’environnement naturel
du site de l’installation du projet et de ses alentours et sur la santé et la sécurité des êtres
humains. Ces impacts provoqués par le projet peuvent être directs ou indirects, et peuvent
présenter un danger sur l’environnement. Dans ce cas de figure les impacts négatifs
doivent être atténué par des mesures de mitigation afin de minimiser les atteintes aux
milieux et sur la population. Ainsi, et prenant en compte la taille moyenne du projet, les
impacts attendus sur l’environnement sont positifs et sont relatifs à la valorisation des
produits de la datte à travers la mise en place d’une unité de conditionnement ou la datte
sera triée, fumigée et mise en carton avant d’être stockée dans une unité frigorifique.
Cette unité permettra une diversification des revenus des femmes (impact social) et
l’amélioration de leurs conditions économiques et sociales par l’augmentation de leurs
revenus (création des postes d’emploi.
Les autres aspects environnementaux sont relatifs à l’utilisation des ressources en eau et
de l’énergie ainsi que le sort des déchets liquides et solides de l’unité de conditionnement
de la datte sur les milieux récepteurs (eau, sol et air). Ainsi les activités du projet ne
doivent pas occulter les aspects liés à la préservation des ressources et ce à travers une
utilisation rationnelle des ressources en eaux, et l’utilisation des énergies renouvelables
dans l’unité. En effet le sud marocain jouit d’un gisement solaire important qu’il faut mettre
à contribution dans l’approvisionnement de l’unité en énergie propre. L’unité doit faire
l’objet d’un suivi concernant les effluents liquides et solides générés par le processus de
fabrication et s’ils ne représentent pas des impacts négatifs sur la ressource en eau déjà
rare dans l’oasis de Toudghra en général et le périmètre de Hart Elyamine en particulier et
sur les ressources en sol proche du site d’installation de l’unité de conditionnement.
Proceedings of 7th WEEC Niche 5: Ecological and
green economies
216
Des audits environnementaux et des plans de gestion des déchets peuvent être envisagés
pour la suite de la mise en œuvre du projet si les déchets de l’unité s’avèrent importants et
leurs impacts sur les milieux sont nocifs. Un autre aspect environnemental crucial doit faire
l’objet d’un suivi rigoureux il s’agit de la fumigation de la datte, les pertes post récoltes
importantes exigent la fumigation de la datte par le phostoxin. Cette opération doit se faire
dans le respect des exigences de sécurité humaine et par la suite rechercher des
alternatives peu couteuse et efficace pour l’éradication de la pyrale de datte (procédé
thermique).
Ainsi, les impacts socio-économiques attendus de ce projet sont positifs et sont relatifs à
la mise en place d’une unité de conditionnement de la datte à Hart Elyamine. Cette
dernière permettra d’améliorer la qualité de la datte et par la même occasion les chances
de sa commercialisation. L’unité par les emplois directs et indirects crées augmentera les
revenus des femmes impliquées directement dans les projets et de la population locale
touchés indirectement par les retombées positifs du projet. Ainsi que la diversification des
revenus des femmes et l’amélioration de leurs conditions économiques et sociales par
l’augmentation de leurs revenus par la création des postes d’emploi nouveaux dans l’unité
mise en œuvre dans le cadre des projets destinés aux femmes. Ces initiatives permettront
de développer des compétences managerielles nouvelles chez les femmes, l’ancrage de
l’activité féminine dans la chaine de valeur du palmier dattier, la valorisation des savoirs
locaux et le rôle de la femme rurale en matière d'innovation de diverses utilisations des
produits du palmier dattier (les recettes à base de dattes, la pharmacopée traditionnelle,
et la confection de divers autres produits artisanaux à usage domestique et agricole).
La diversification des activités des femmes aura des impacts positifs sur leurs revenus et
ainsi sur leur autonomie financière au sein de leurs familles.
La mise en œuvre des projets pilotes permettra de créer l’environnement favorable à la
dynamisation de la filière dattière et le taux d’employabilité des femmes, ainsi que la
consolidation de leur pouvoir économique et décisionnel et augmentera leurs capacités
organisationnelle dans le cadre d’OPA de premier ordre (Coopérative) et de second ordre
(Groupement d’Intérêt Economique).
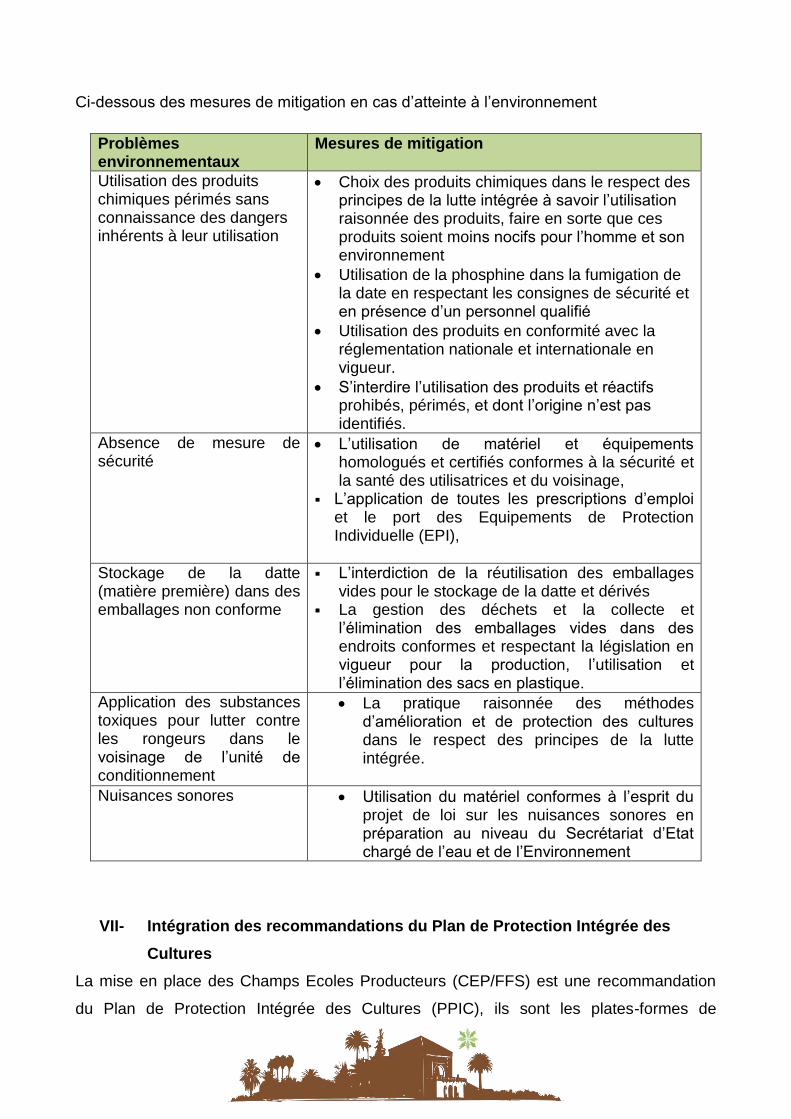
Ci-dessous des mesures de mitigation en cas d’atteinte à l’environnement
Problèmes environnementaux
Mesures de mitigation
Utilisation des produits chimiques périmés sans connaissance des dangers inhérents à leur utilisation
Choix des produits chimiques dans le respect des principes de la lutte intégrée à savoir l’utilisation raisonnée des produits, faire en sorte que ces produits soient moins nocifs pour l’homme et son environnement
Utilisation de la phosphine dans la fumigation de la date en respectant les consignes de sécurité et en présence d’un personnel qualifié
Utilisation des produits en conformité avec la réglementation nationale et internationale en vigueur.
S’interdire l’utilisation des produits et réactifs prohibés, périmés, et dont l’origine n’est pas identifiés.
Absence de mesure de sécurité
L’utilisation de matériel et équipements homologués et certifiés conformes à la sécurité et la santé des utilisatrices et du voisinage,
L’application de toutes les prescriptions d’emploi et le port des Equipements de Protection Individuelle (EPI),
Stockage de la datte (matière première) dans des emballages non conforme
L’interdiction de la réutilisation des emballages vides pour le stockage de la datte et dérivés
La gestion des déchets et la collecte et l’élimination des emballages vides dans des endroits conformes et respectant la législation en vigueur pour la production, l’utilisation et l’élimination des sacs en plastique.
Application des substances toxiques pour lutter contre les rongeurs dans le voisinage de l’unité de conditionnement
La pratique raisonnée des méthodes d’amélioration et de protection des cultures dans le respect des principes de la lutte intégrée.
Nuisances sonores Utilisation du matériel conformes à l’esprit du
projet de loi sur les nuisances sonores en préparation au niveau du Secrétariat d’Etat chargé de l’eau et de l’Environnement
VII- Intégration des recommandations du Plan de Protection Intégrée des
Cultures
La mise en place des Champs Ecoles Producteurs (CEP/FFS) est une recommandation
du Plan de Protection Intégrée des Cultures (PPIC), ils sont les plates-formes de
Proceedings of 7th WEEC Niche 5: Ecological and
green economies
218
vulgarisation des bonnes pratiques en matière de lutte intégrée (LI) et de fertilisation
raisonnée (FR) des spéculations arboricoles concernées par le Projet Arboriculture
Fruitière (PAF), composante oasienne. L’adoption des bonnes pratiques répond au souci
d’une mise en œuvre durable des activités de projet et une gestion rationnelle des produits
phytosanitaires et de fertilisation des sols dans le respect des principes de base de la lutte
intégrée.
Mise en place des Champs Ecoles Producteurs (FFS/CEP)
Dans un souci d’assurer le transfert des savoirs faire de paysan à paysan dans le domaine
de l’utilisation des produits phytosanitaires destinés au palmier dattier et cultures sous-
adjacentes dans les palmeraies et de la lutte intégrée, les CEP constituent des espaces
d’échange sur les écosystèmes agricoles, les maladies et ravageurs du Palmier dattier, les
techniques de fertilisation, les traitements chimiques, la fumigation des dattes, la lutte
biologique et la lutte intégrée. Ces interventions regroupées dans le suivi de l’état de santé
des palmeraies et des interventions pour minimiser les impacts négatifs des ravageurs et
insectes sur le palmier dattier doivent tenir compte de la fragilité des milieux oasiens.
Le Champ-Ecole-Producteurs s’organise donc autour d’un groupe structuré composé de
30 à 40 agriculteurs (producteurs) dans les CEP du palmier dattier, qui se rencontrent
régulièrement 1 fois par quinzaine au cours d’une saison culturale (cycle) dans leur propre
champ (périmètre ou parcelle d’apprentissage), pour apprendre à résoudre les problèmes
relatifs à la gestion de leur milieu et leurs exploitations, suivant un programme
préalablement élaboré par eux-mêmes, avec l’accompagnement d’un facilitateur (ou
animateur) utilisant des outils et méthodes d’éducation non formelle des adultes.
Au niveau pédagogique, le concept de Champs Ecoles Producteurs (CEP) introduit la
notion fondamentale de «participation», d’« implication» des agriculteurs ». En reléguant
au passé les démonstrations dirigistes de la recherche agronomique et l’approche «top-
down» de la vulgarisation agricole. Le CEP incite l’agriculteur (producteur) à s’investir
dans le protocole mis en place, le force à observer, à raisonner et lui apprend à être
capable d’imaginer des solutions de manière autonome. Il s’agit d’apprendre à l’agriculteur
à avoir une indépendance d’opinion basée sur le raisonnement, l’observation et la
comparaison.
Les sessions de formation sont d’une durée de 2h à 2h30 par quinzaine pour ne pas
alourdir le temps des agriculteurs qui doit être consacré à la production et le travail des
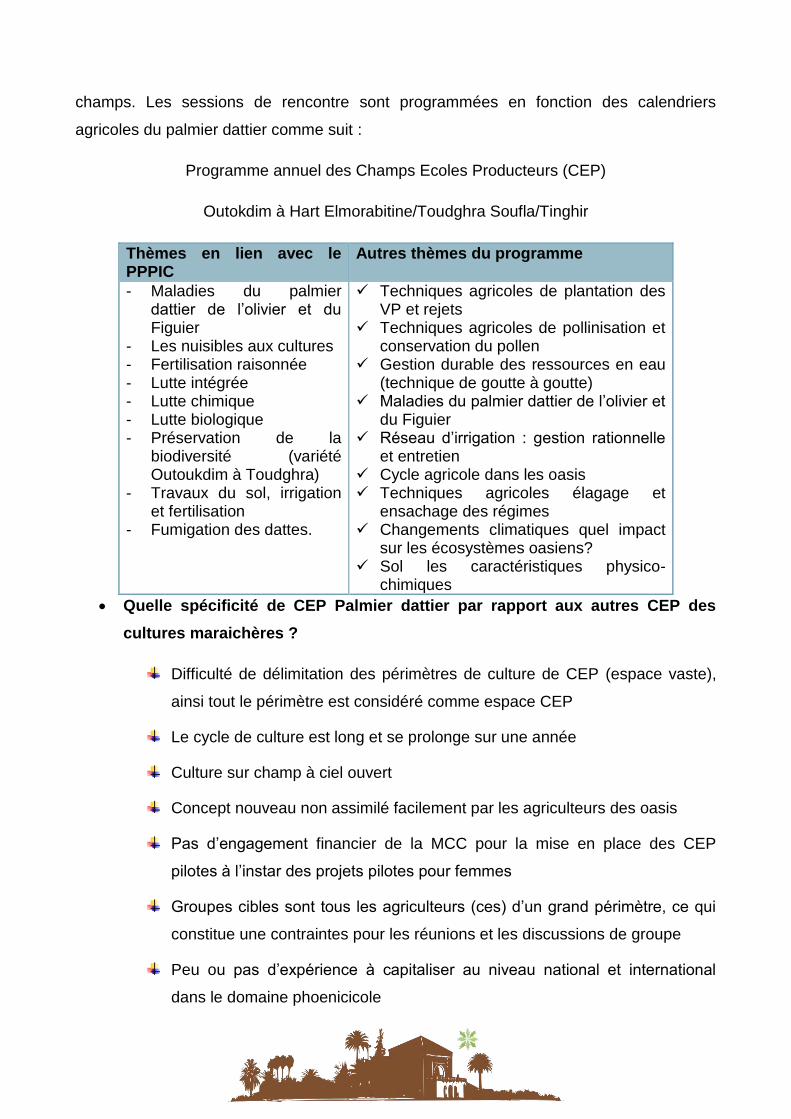
champs. Les sessions de rencontre sont programmées en fonction des calendriers
agricoles du palmier dattier comme suit :
Programme annuel des Champs Ecoles Producteurs (CEP)
Outokdim à Hart Elmorabitine/Toudghra Soufla/Tinghir
Thèmes en lien avec le PPPIC
Autres thèmes du programme
- Maladies du palmier dattier de l’olivier et du Figuier
- Les nuisibles aux cultures - Fertilisation raisonnée - Lutte intégrée - Lutte chimique - Lutte biologique - Préservation de la
biodiversité (variété Outoukdim à Toudghra)
- Travaux du sol, irrigation et fertilisation
- Fumigation des dattes.
Techniques agricoles de plantation des VP et rejets
Techniques agricoles de pollinisation et conservation du pollen
Gestion durable des ressources en eau (technique de goutte à goutte)
Maladies du palmier dattier de l’olivier et du Figuier
Réseau d’irrigation : gestion rationnelle et entretien
Cycle agricole dans les oasis Techniques agricoles élagage et
ensachage des régimes Changements climatiques quel impact
sur les écosystèmes oasiens? Sol les caractéristiques physico-
chimiques Quelle spécificité de CEP Palmier dattier par rapport aux autres CEP des
cultures maraichères ?
Difficulté de délimitation des périmètres de culture de CEP (espace vaste),
ainsi tout le périmètre est considéré comme espace CEP
Le cycle de culture est long et se prolonge sur une année
Culture sur champ à ciel ouvert
Concept nouveau non assimilé facilement par les agriculteurs des oasis
Pas d’engagement financier de la MCC pour la mise en place des CEP
pilotes à l’instar des projets pilotes pour femmes
Groupes cibles sont tous les agriculteurs (ces) d’un grand périmètre, ce qui
constitue une contraintes pour les réunions et les discussions de groupe
Peu ou pas d’expérience à capitaliser au niveau national et international
dans le domaine phoenicicole
Proceedings of 7th WEEC Niche 5: Ecological and
green economies
220
Difficulté de faire des observations par un groupe d’agriculteurs parce que la
partie haute du palmier n’est accessible qu’à un nombre très limité des
adhérents de CEP
Les deux écoles sont installées pour répondre aux recommandations de
l’évaluation environnementale et sociale, notamment sa composante Plan de
Protection et de Production Intégrées des Cultures (PPIC)
Les partenaires de projet sont limités aux agriculteurs de la CEP et leurs
organisations professionnelles.
Conclusion
Difficultés de communiquer sur les aspects environnementaux dans les zones
oasiennes
La maladie du Bayoud continue de faire des ravages dans la phoeniciculture
marocaine malgré les mesures de précaution prises par les agriculteurs
Les aspects phytosanitaires ne sont encore maitrisés
Des défis énormes attendent les oasis marocaines (aléas climatiques,
changements climatiques, désertification, salinisation des sols, manque d’eau et
perte de biodiversité
Durabilité et pérennisation des interventions du projet PAF au-delà de septembre
2013 et l’arrêt des financements de MCC
Opportunités à saisir : dynamisation des organisations professionnelles agricoles et
leur intégration au marché national et international, utilisation des énergies
renouvelables dans le pompage et dans les unités de valorisation et de
conditionnement des dattes, certification et labellisation l’agriculture oasienne
comme agriculture biologique.