Filled elastomer mechanics and polymer dynamics ...Filled elastomer mechanics and polymer dynamics...
50
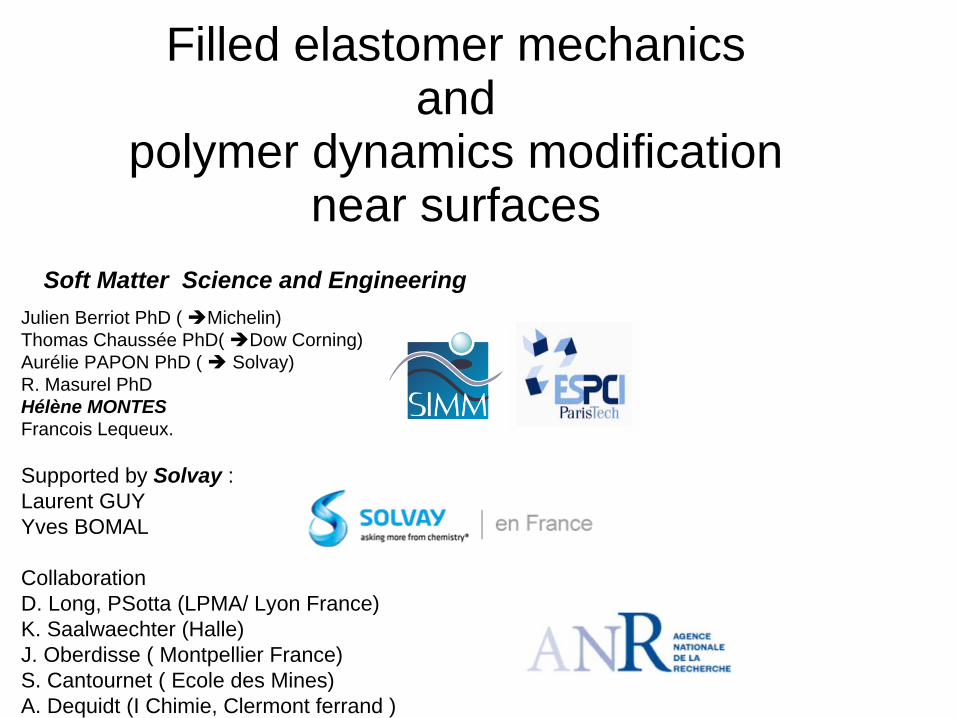
Filled elastomer mechanics and polymer dynamics modification near surfaces Julien Berriot PhD ( Michelin) Thomas Chaussée PhD( Dow Corning) Aurélie PAPON PhD ( Solvay) R. Masurel PhD Hélène MONTES Francois Lequeux. Supported by Solvay : Laurent GUY Yves BOMAL Collaboration D. Long, PSotta (LPMA/ Lyon France) K. Saalwaechter (Halle) J. Oberdisse ( Montpellier France) S. Cantournet ( Ecole des Mines) A. Dequidt (I Chimie, Clermont ferrand ) Soft Matter Science and Engineering
Transcript of Filled elastomer mechanics and polymer dynamics ...Filled elastomer mechanics and polymer dynamics...
Filled elastomer mechanics and
polymer dynamics modification near surfaces
Julien Berriot PhD ( Michelin)Thomas Chaussée PhD( Dow Corning)Aurélie PAPON PhD ( Solvay)R. Masurel PhDHélène MONTESFrancois Lequeux.
Supported by Solvay : Laurent GUYYves BOMAL
CollaborationD. Long, PSotta (LPMA/ Lyon France)K. Saalwaechter (Halle)J. Oberdisse ( Montpellier France)S. Cantournet ( Ecole des Mines)A. Dequidt (I Chimie, Clermont ferrand )
Soft Matter Science and Engineering
Usually here
This afternoon
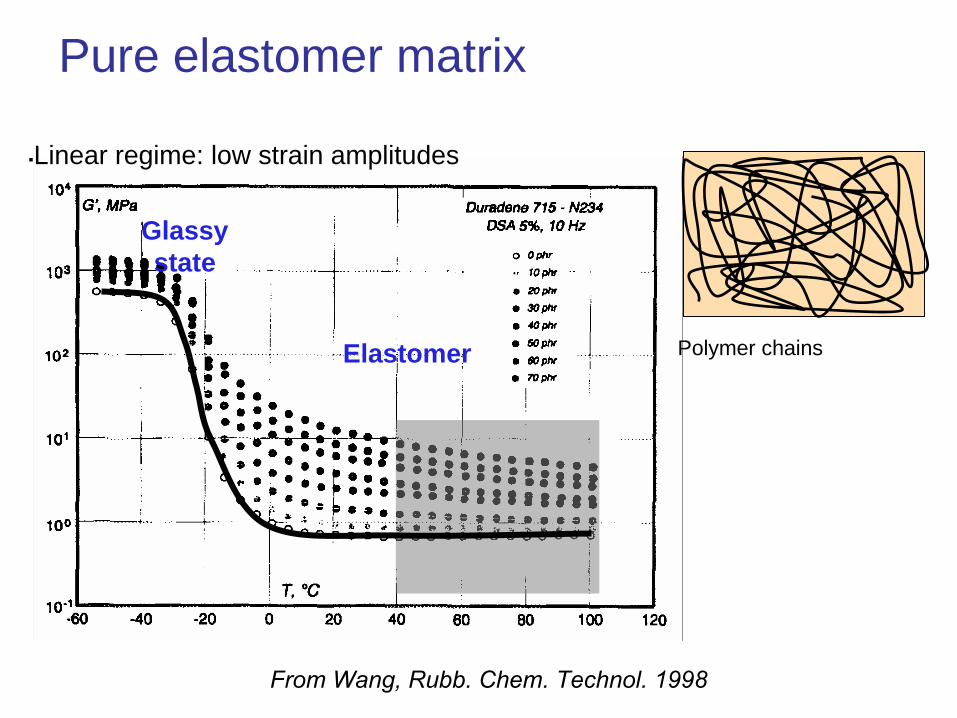
Glassy state
Elastomer Polymer chains
Pure elastomer matrix
Linear regime: low strain amplitudes
From
Wang, Rubb. Chem. Technol. 1998
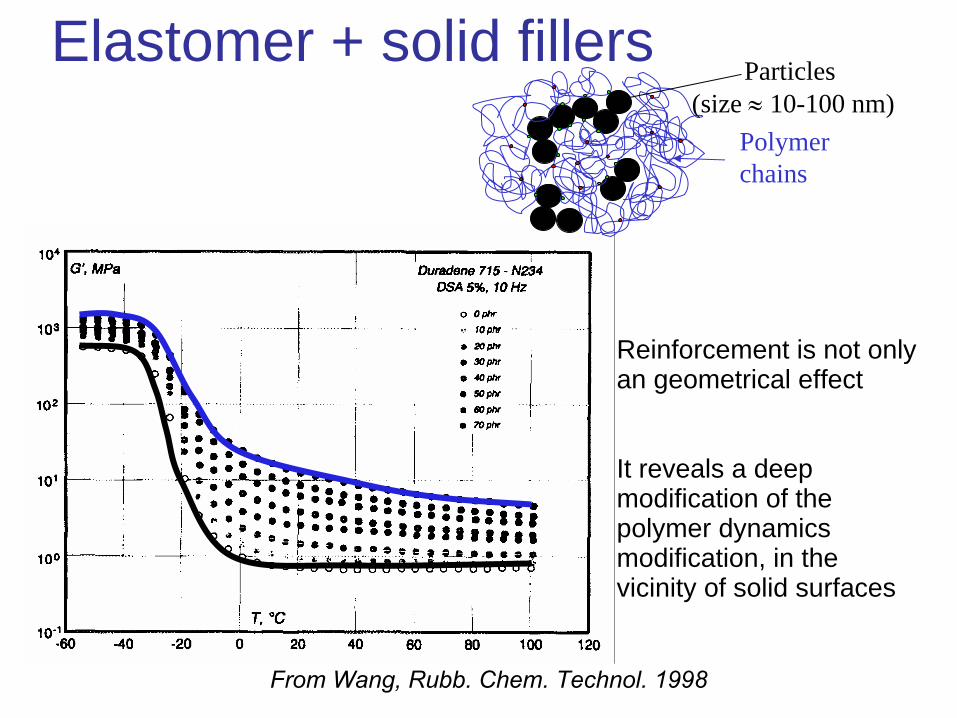
Elastomer + solid fillersParticles
(size
10-100 nm)Polymer chains
Reinforcement is not only an geometrical effect
It reveals a deep modification of the polymer dynamics modification, in the vicinity of solid surfaces
From
Wang, Rubb. Chem. Technol. 1998

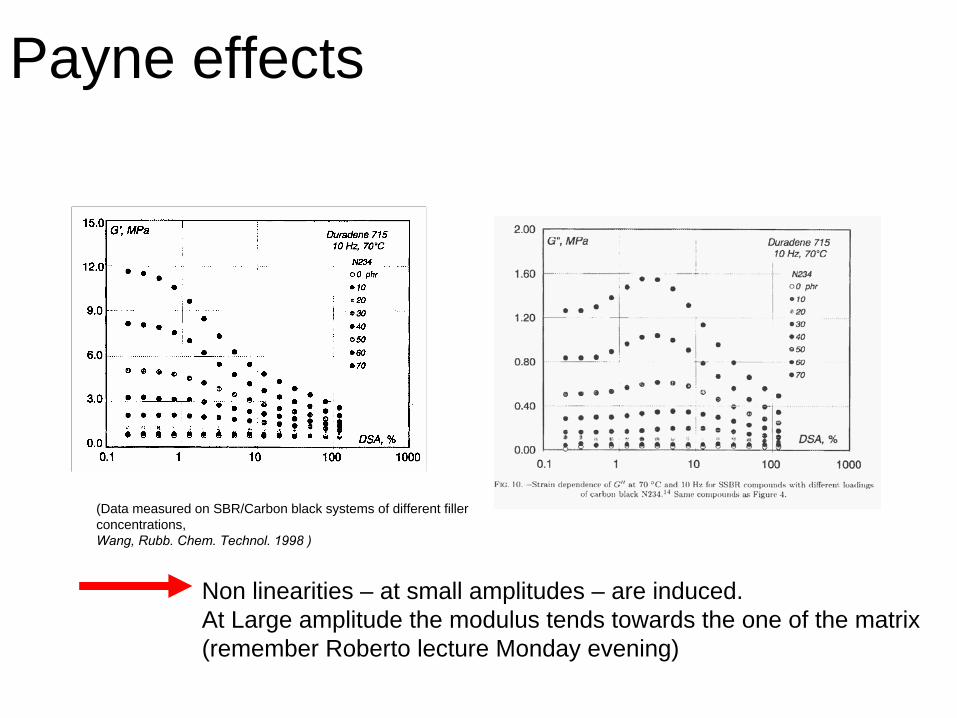
Payne effects
1.0
0.5
0.0
-0.5
-1.09876543210
Time (s)
-1.0
-0.5
0.0
0.5
1.0
9876543210temps
Stationary Regime : ~sinusoidal response
Time (s)
Reinforced elastomer
2
3
4
5
678
106
2
G' (
Pa)
0.1 1 10 100 (%)
Si = 0.2
Non reinforced matrix
Non linearities – at small amplitudes – are induced
(Data measured on SBR/Carbon black systems of different filler concentrations, Wang, Rubb. Chem. Technol. 1998 )
Montes H, Lequeux F, Berriot J Macromol.36 8107 (2003)
Payne effects
Non linearities – at small amplitudes – are induced.At Large amplitude the modulus tends towards the one of the matrix(remember Roberto lecture Monday evening)
(Data measured on SBR/Carbon black systems of different filler concentrations, Wang, Rubb. Chem. Technol. 1998 )
Mechanical data indicate that the polymer dynamics is modified by the embedding of particles.
This well know results is at the origin of numerous papers.
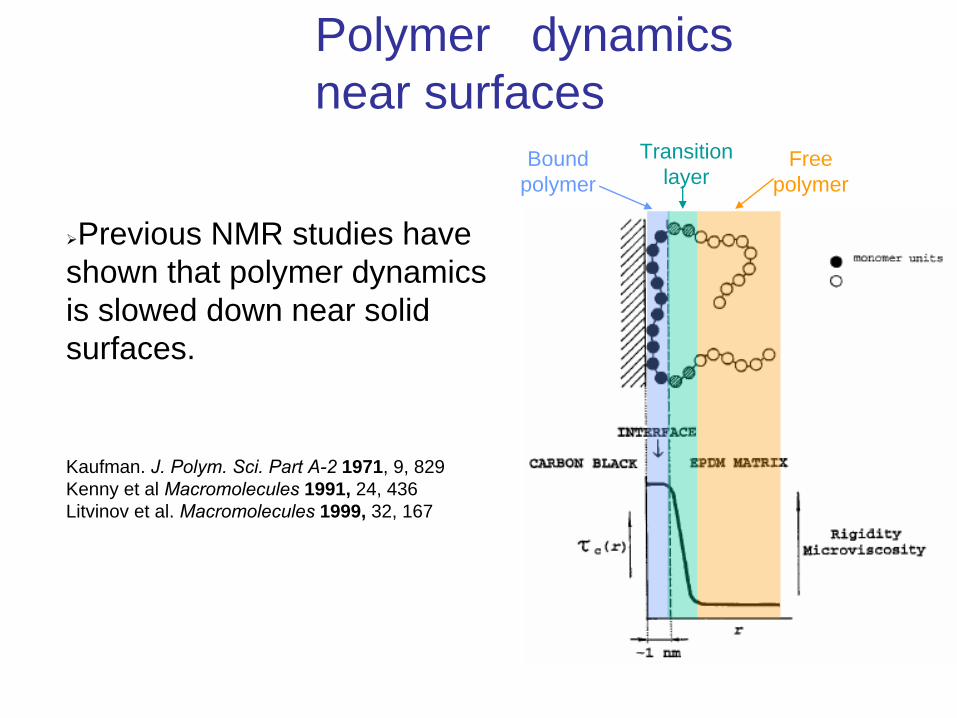
Bound polymer
Transition layer
Free polymer
Kaufman. J. Polym. Sci. Part A-2
1971, 9, 829 Kenny et al Macromolecules
1991, 24, 436Litvinov et al. Macromolecules
1999, 32, 167
Previous NMR studies have shown that polymer dynamics is slowed down near solid surfaces.
Polymer dynamics near surfaces

There some indications that the “immobilized” ou “bound” polymer may be glassy, indeed by Struik ( 1976) in his book :
The clearest evidence is that filled rubbers age like glasses, above their glass transition.
However this observations was completely forgotten ( or rejected) by the whole community for decades,
Until ~2000
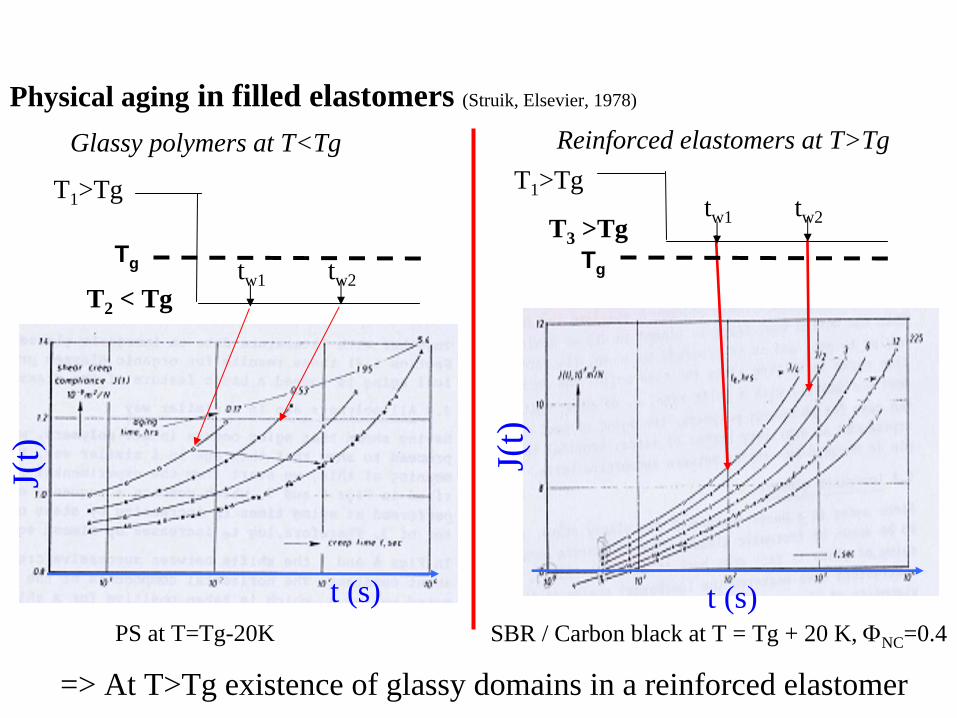
Physical aging in filled elastomers (Struik, Elsevier, 1978)
Glassy polymers at T<Tg
=> At T>Tg existence of glassy domains in a reinforced elastomer
PS at T=Tg-20K
T1 >Tg
T2 < Tgtw1 tw2
Tg
t (s)
Reinforced elastomers at T>Tg
SBR / Carbon black at T = Tg + 20 K, NC =0.4t (s)
T1 >Tg
T3 >Tgtw1 tw2
Tg
J(t)
J(t)
There some indications that the “immobilized” ou “bound” polymer may be glassy, indeed by Struik ( 1976) in his book :
The clearest evidence is that filled rubbers age like glasses, above their glass transition.
However this observations was completely forgotten ( or rejected) by the whole community for decades,
Until ~2000
Substrate
Polymer d
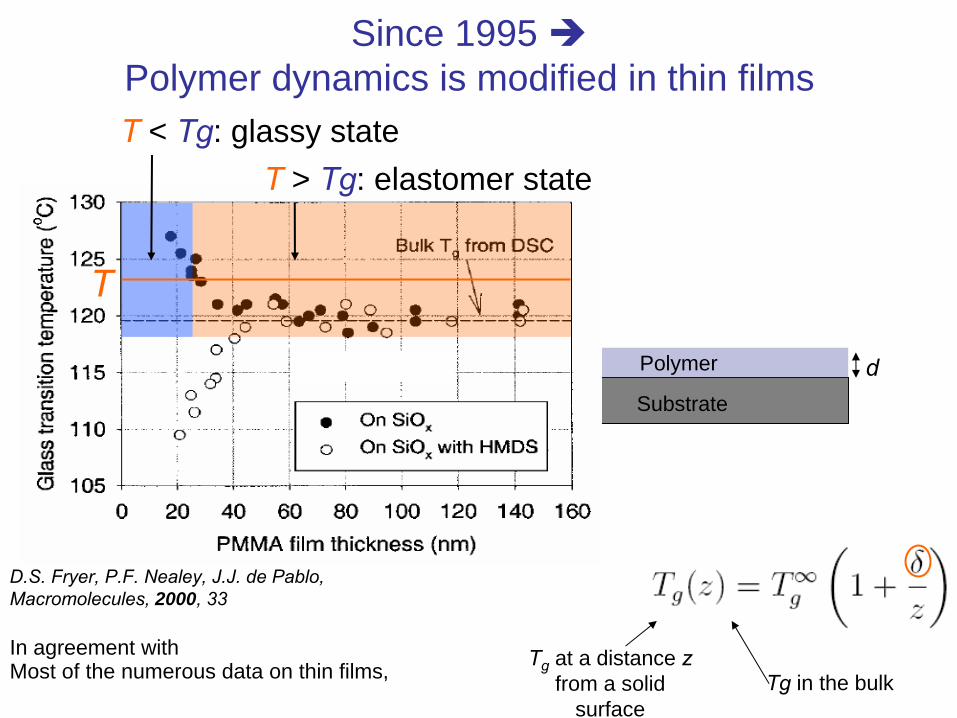
D.S. Fryer, P.F. Nealey, J.J. de Pablo, Macromolecules, 2000, 33
Since 1995 Polymer dynamics is modified in thin films
weakinteraction
T
T
> Tg: elastomer stateT < Tg: glassy state
In agreement withMost of the numerous data on thin films, Tg
in the bulkTg
at a distance z
from a solid surface
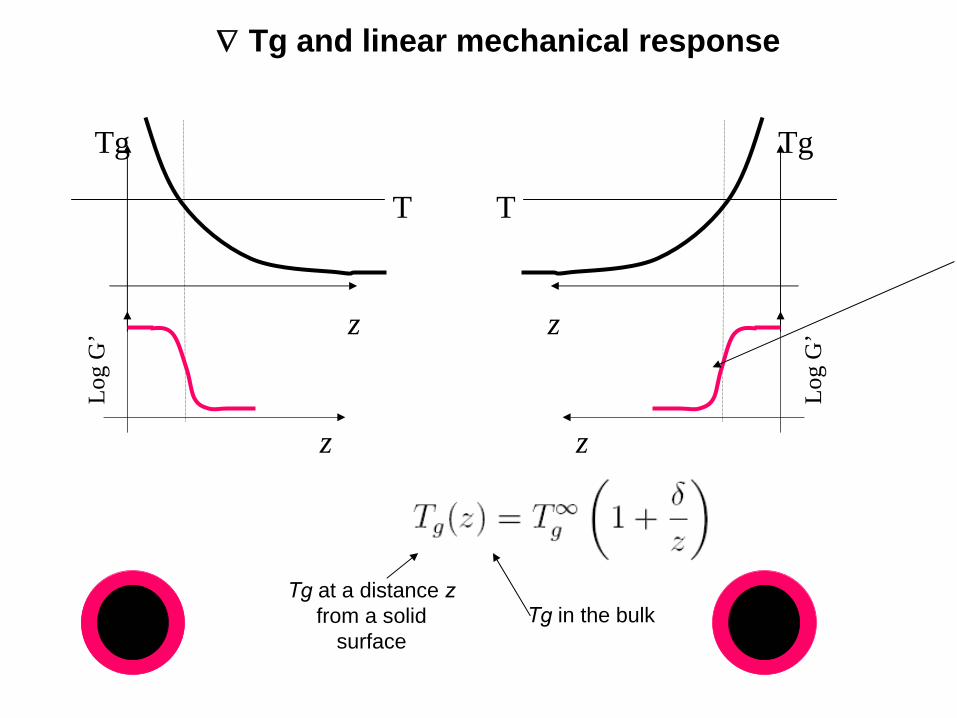
z
Tg
T
Log
G’
z
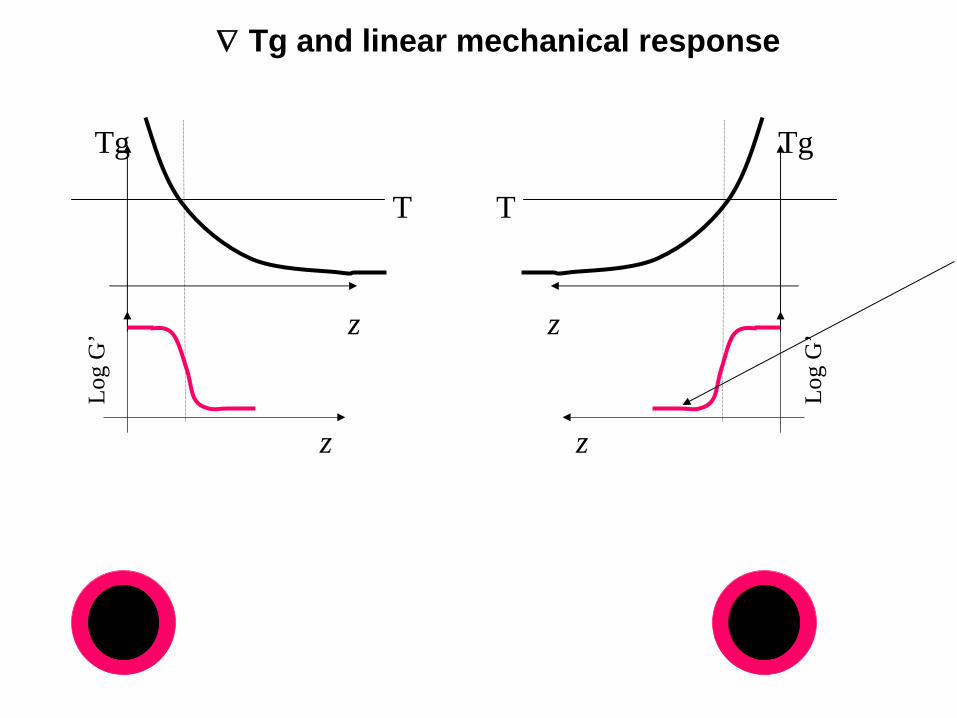
Tg and linear mechanical response
z
Tg
T
Log
G’
z
Tg
in the bulkTg
at a distance z
from a solid surface
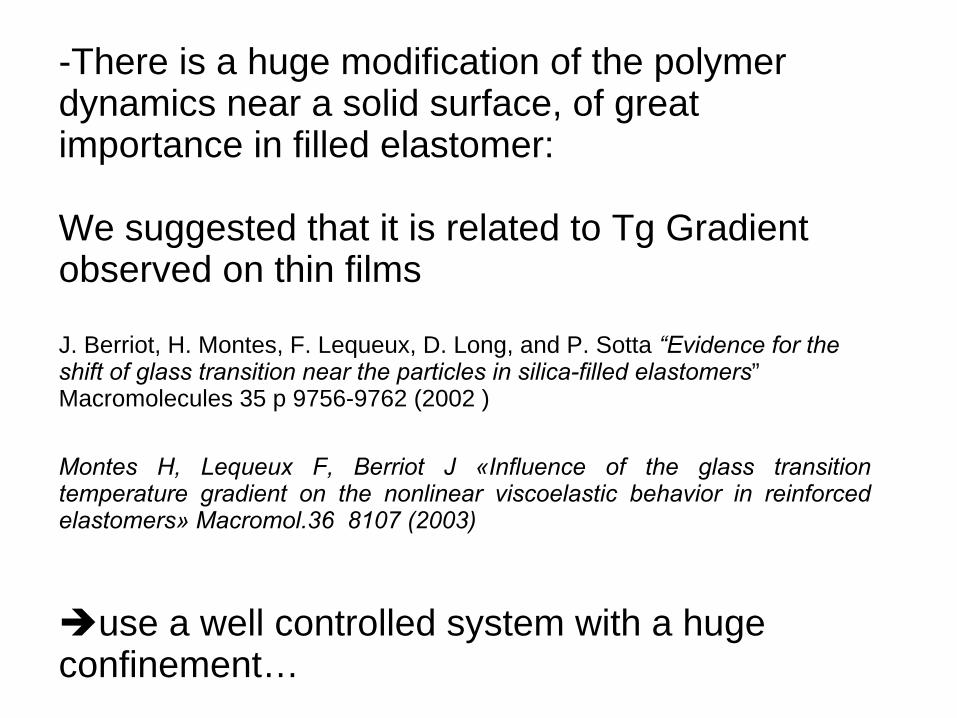
-There is a huge modification of the polymer dynamics near a solid surface, of great importance in filled elastomer:
We suggested that it is related to Tg Gradient observed on thin films
J. Berriot, H. Montes, F. Lequeux, D. Long, and P. Sotta “Evidence for the shift of glass transition near the particles in silica-filled elastomers” Macromolecules 35 p 9756-9762 (2002 )
Montes H, Lequeux F, Berriot
J «Influence of the glass transition temperature gradient on the nonlinear viscoelastic behavior in reinforced elastomers» Macromol.36 8107 (2003)
use a well controlled system with a huge confinement…
15
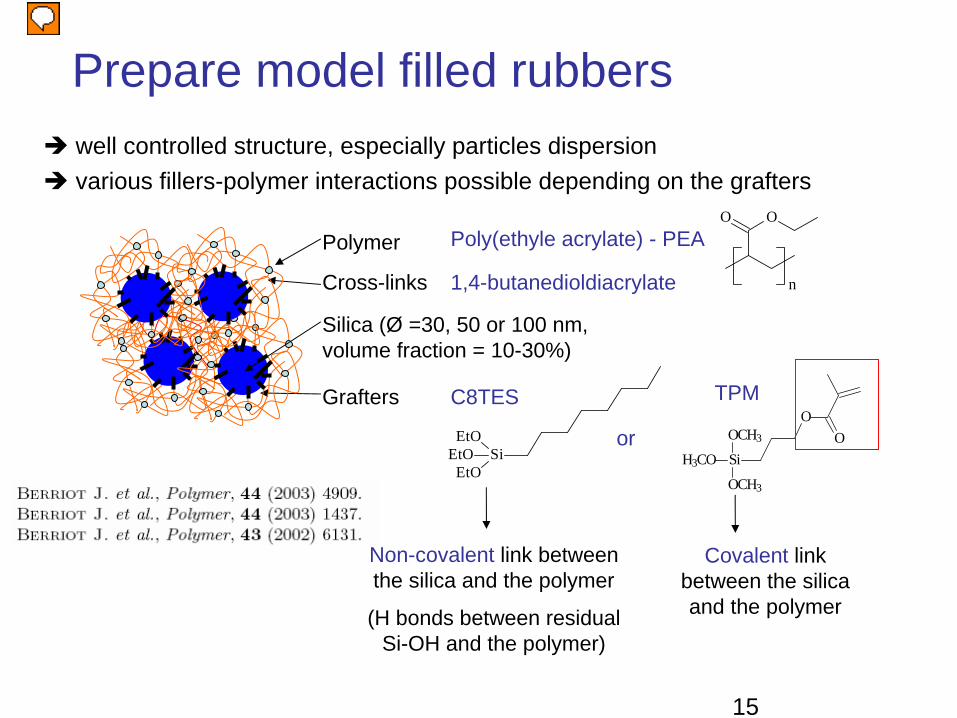
well controlled structure, especially particles dispersion various fillers-polymer interactions possible depending on the grafters
EtOEtO
EtOSi
Silica (Ø =30, 50 or 100 nm, volume fraction = 10-30%)
Grafters
Cross-links
PolymerOO
n
Poly(ethyle acrylate) - PEA
C8TES
SiH3CO
OCH3
OCH3
OO
TPM
Non-covalent link between the silica and the polymer
(H bonds between residual Si-OH and the polymer)
Covalent link between the silica and the polymer
Prepare model filled rubbers
or
1,4-butanedioldiacrylate
Présentateur
Commentaires de présentation
Vérifier réticulant
Make series of samples with various volume fraction of silica ( up to 25%, various diameter of silica (30 nm to 100 nm), various grafters, various stabilities)
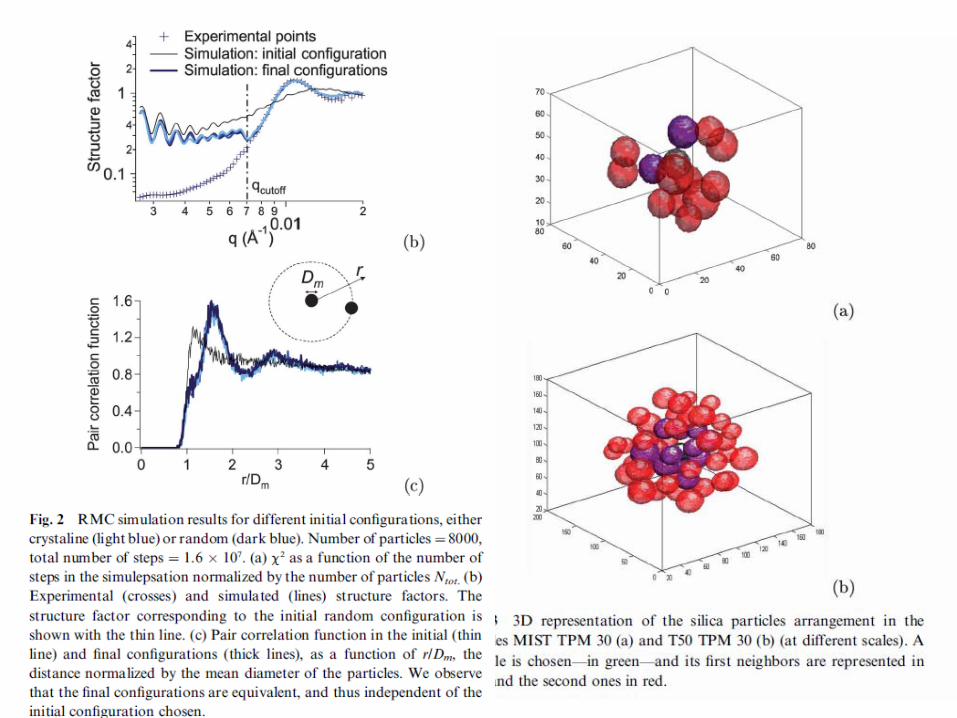
Measure the structure factor of the silica particles by small angle neutrons scattering
Reconstruct by Inverse Monte Carlo the pair distribution of the silica particles ( with J. Oberdisse)
For each samples
about 10 years of work (initial idea of Lucien Monnerie
in 1995)
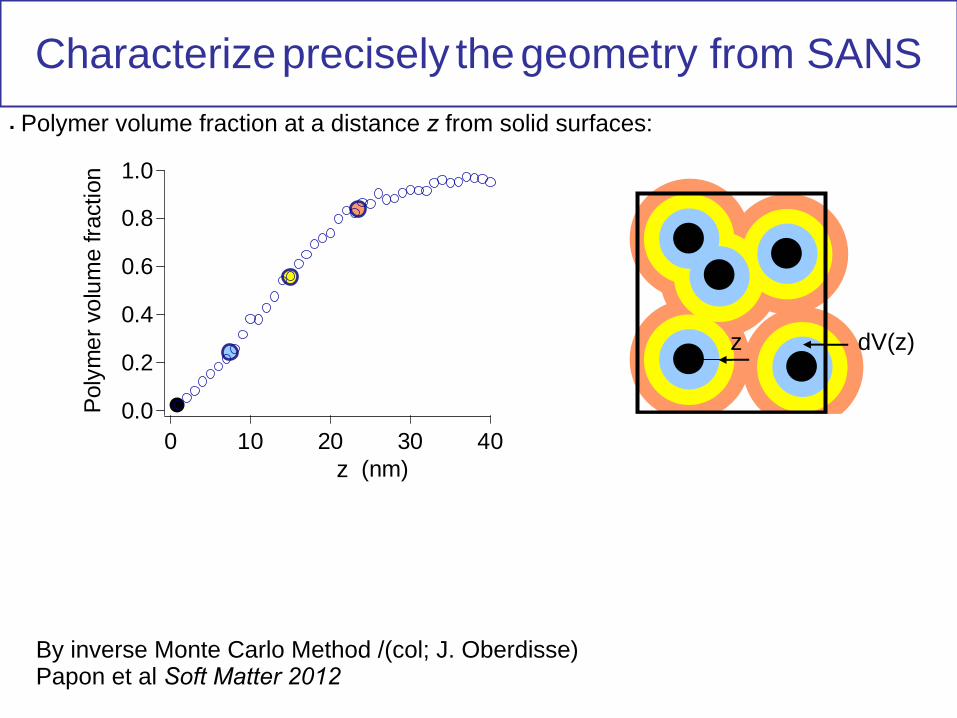
z dV(z)
Polymer volume fraction at a distance z
from solid surfaces:
1.0
0.8
0.6
0.4
0.2
0.0Poly
mer
vol
ume
fract
ion
403020100Thickness (nm)z
By inverse Monte Carlo Method /(col; J. Oberdisse)Papon et al Soft Matter
2012
Characterizeprecisely thegeometry from SANS
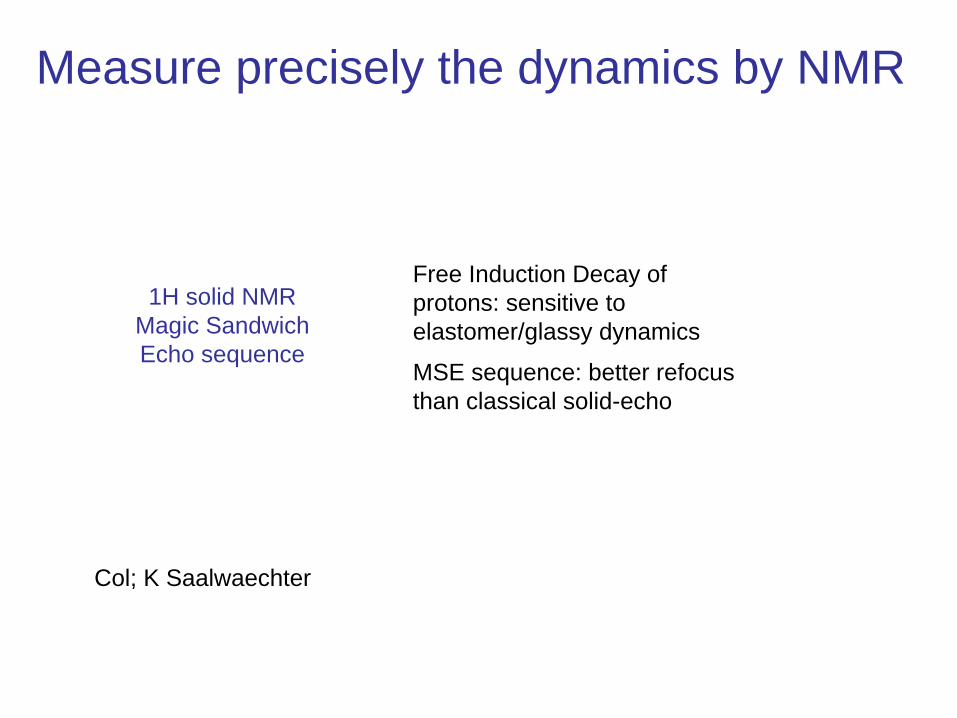
1H solid NMR Magic Sandwich Echo sequence
Free Induction Decay of protons: sensitive to elastomer/glassy dynamics
MSE sequence: better refocus than classical solid-echo
Col; K Saalwaechter
Measure precisely the dynamics by NMR
20
4
68
0.1
2
4
68
1
Nor
mal
ized
inte
nsity
0.100.080.060.040.020.00Time (ms)
4
68
0.1
2
4
68
1
Nor
mal
ized
inte
nsity
0.100.080.060.040.020.00Time (ms)
4
68
0.1
2
4
68
1
Nor
mal
ized
inte
nsity
0.100.080.060.040.020.00Time (ms)
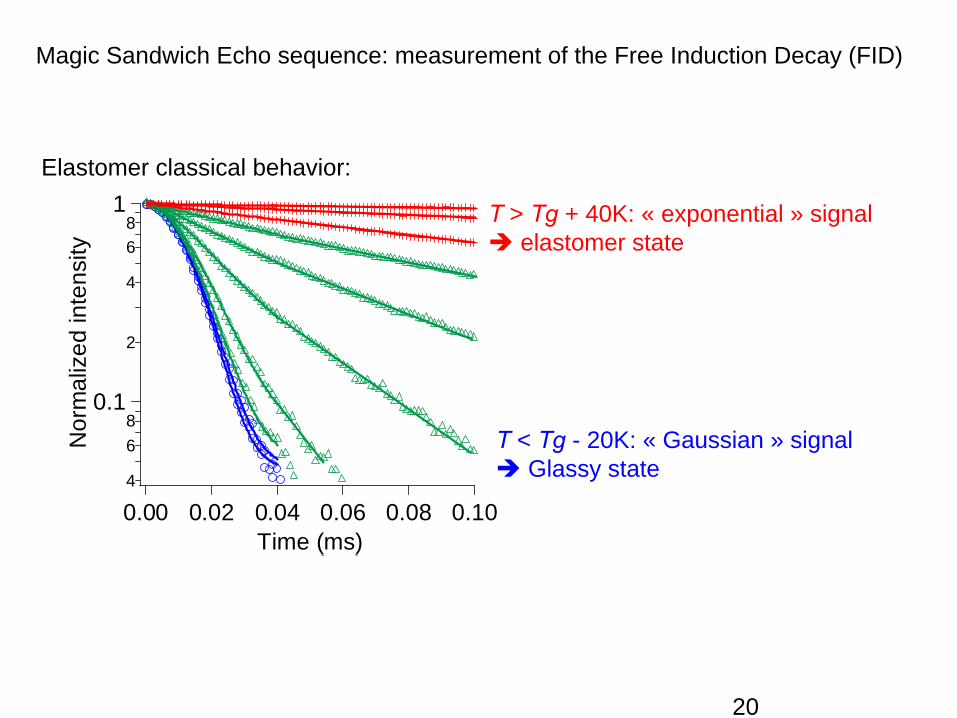
T
> Tg
+ 40K: « exponential » signal elastomer state
T
< Tg
- 20K: « Gaussian » signal Glassy state
Magic Sandwich Echo sequence: measurement of the Free Induction Decay (FID)
Elastomer classical behavior:
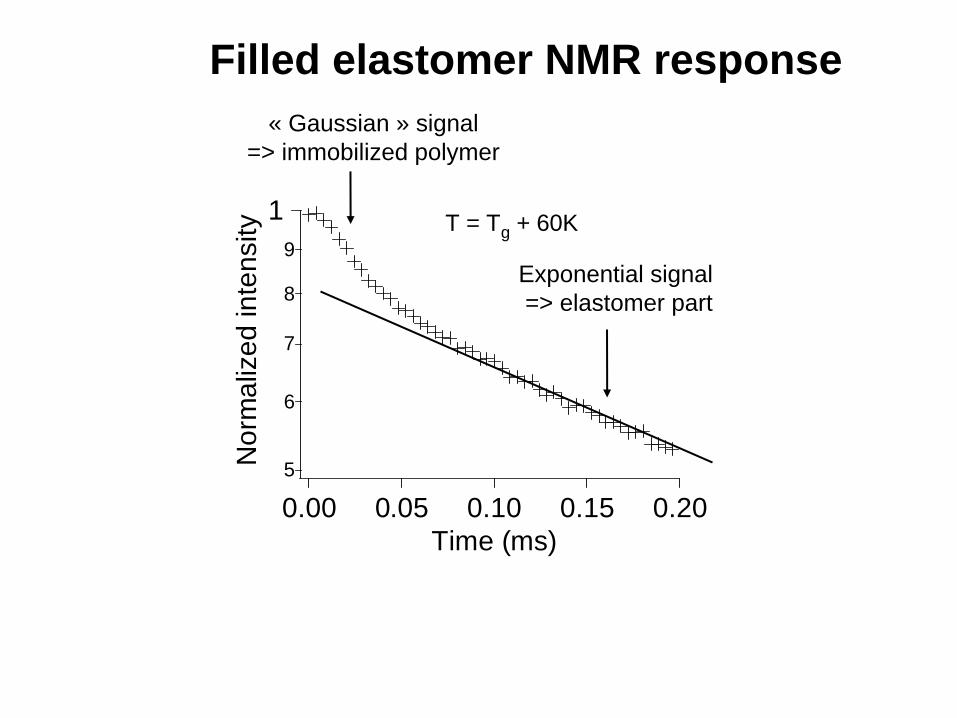
Exponential signal => elastomer part
« Gaussian » signal=> immobilized polymer
5
6
7
8
9
1N
orm
aliz
ed in
tens
ity
0.200.150.100.050.00Time (ms)
T50 C8TES 44%T = Tg + 60K
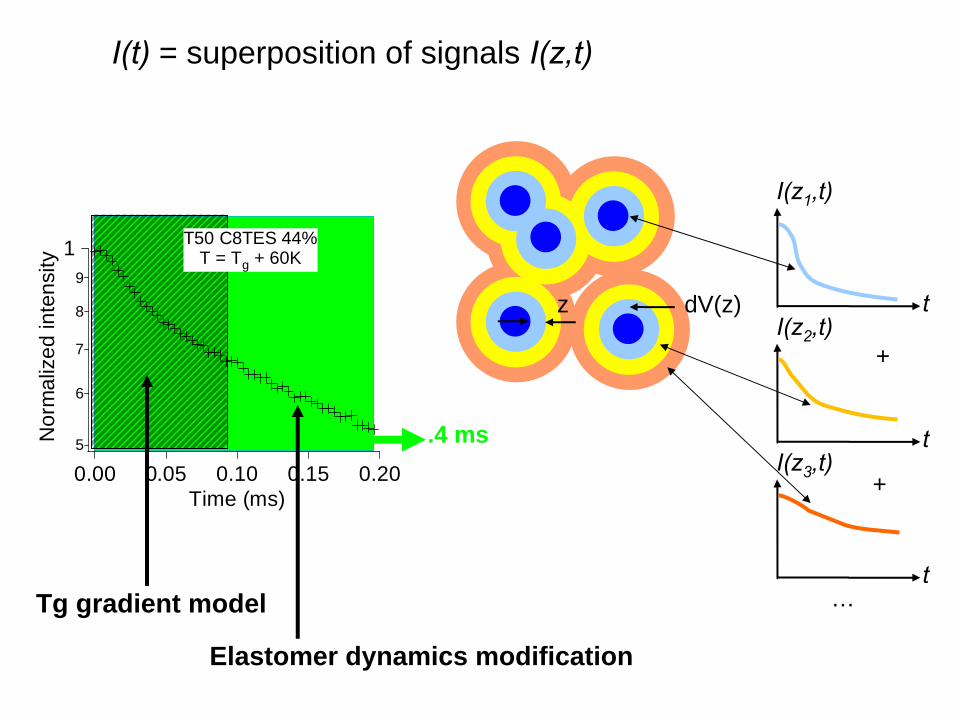
Filled elastomer NMR response
z dV(z)
5
6
7
8
9
1
Nor
mal
ized
inte
nsity
0.200.150.100.050.00Time (ms)
T50 C8TES 44%T = Tg + 60K
I(t)
= superposition of signals I(z,t)
t
I(z1
,t)
t
I(z2
,t)
t
I(z3
,t)
+
+
…Tg gradient model
Elastomer dynamics modification
.4 ms
(Long D., Lequeux F. EPJE
2001)
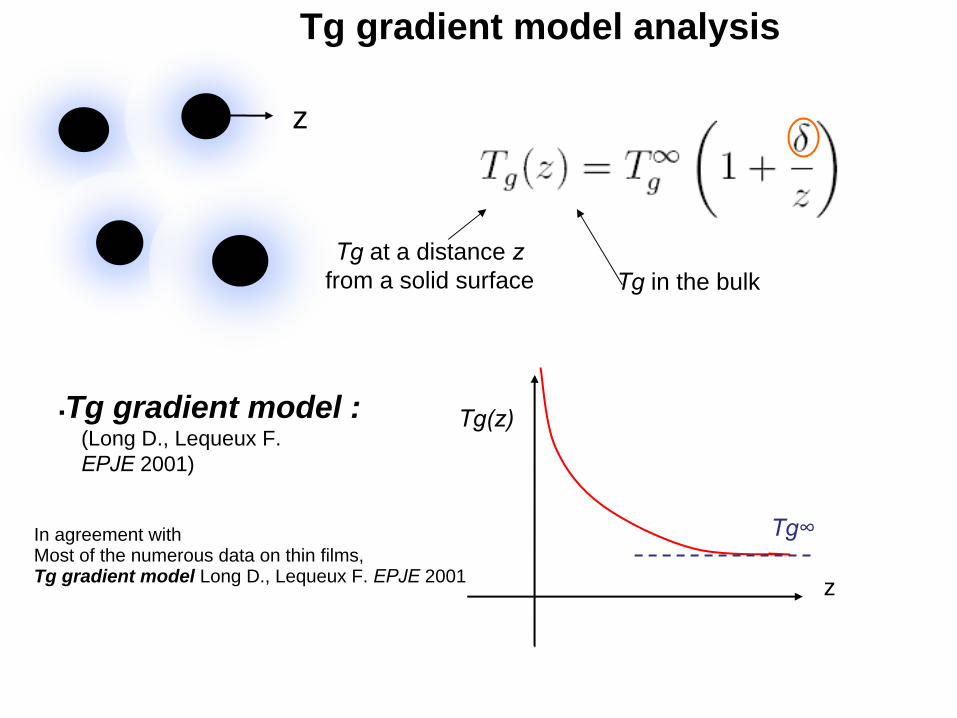
Tg gradient model :
z
z
Tg(z)
Tg∞
Tg
in the bulkTg
at a distance z
from a solid surface
Tg gradient model analysis
In agreement withMost of the numerous data on thin films,Tg gradient model Long D., Lequeux F. EPJE
2001
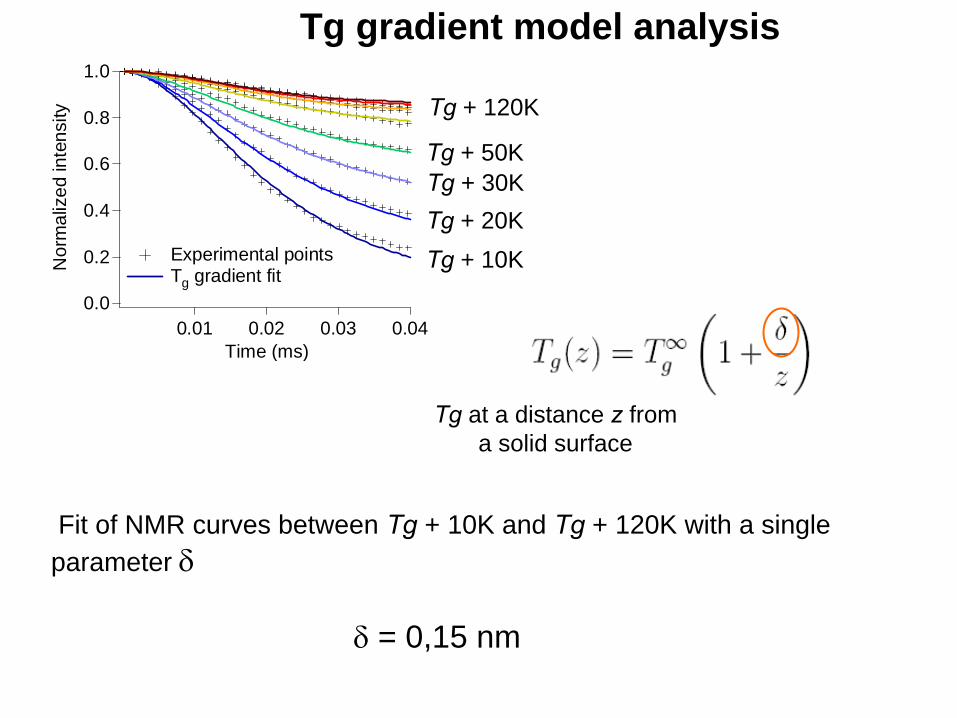
Fit of NMR curves between Tg
+ 10K and Tg
+ 120K with a single parameter
= 0,15 nm
1.0
0.8
0.6
0.4
0.2
0.0
Nor
mal
ized
inte
nsity
0.040.030.020.01Time (ms)
Experimental points Tg gradient fit
Tg
+ 10K
Tg
+ 50K
Tg
+ 120K
Tg
+ 30KTg
+ 20K
Tg
at a distance z
from a solid surface
Tg gradient model analysis
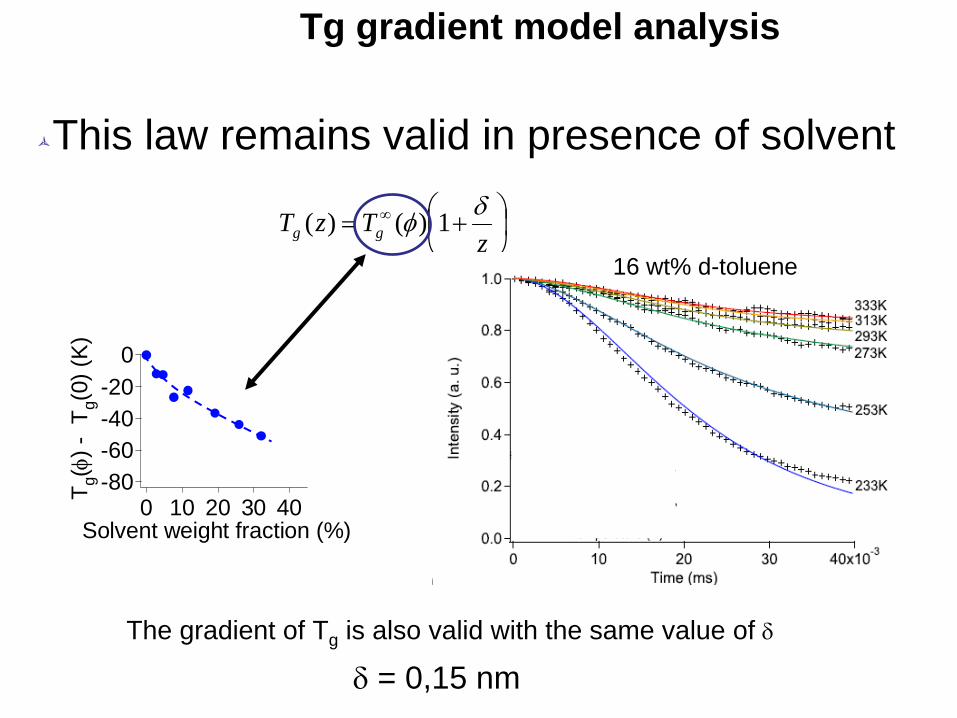
This law remains valid in presence of solvent
The gradient of Tg is also valid with the same value of
= 0,15 nm
zTzT gg
1)()(
-80-60-40-20
0
T g()
- T
g(0)
(K)
403020100Solvent weight fraction (%)
16 wt% d-toluene
Tg gradient model analysis
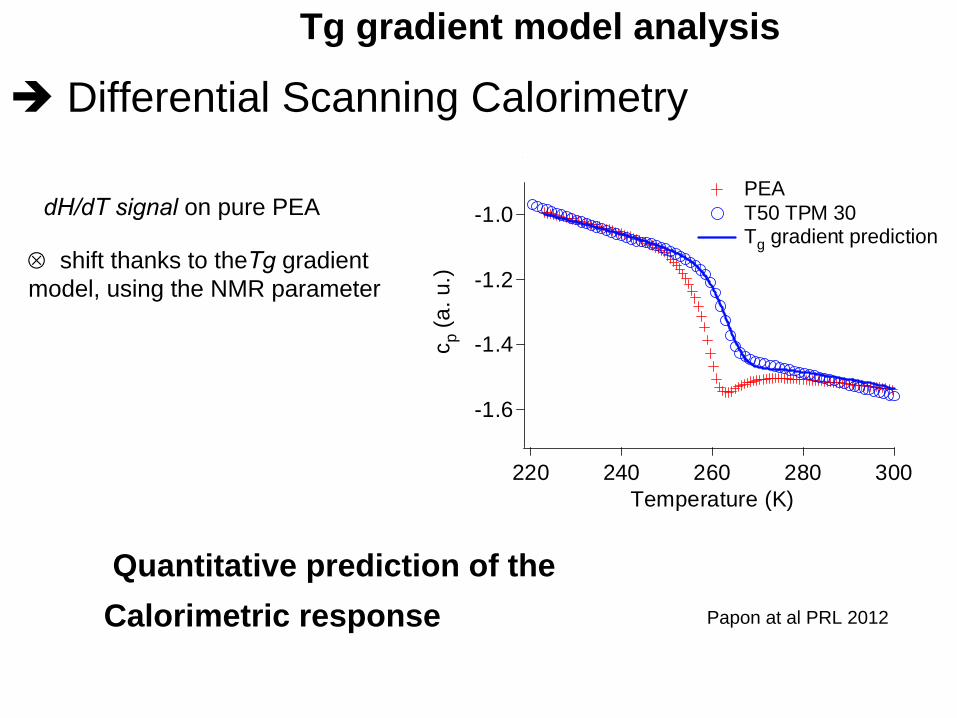
Differential Scanning Calorimetry
dH/dT
signal
on pure PEA
-1.6
-1.4
-1.2
-1.0
c p (a
. u.)
300280260240220Temperature (K)
PEA
-1.6
-1.4
-1.2
-1.0
c p (a
. u.)
300280260240220Temperature (K)
PEA Tg gradient prediction
-1.6
-1.4
-1.2
-1.0
c p (a
. u.)
300280260240220Temperature (K)
PEA T50 TPM 30 Tg gradient prediction
shift thanks to theTg
gradient
model, using the NMR parameter
Quantitative prediction of theCalorimetric response Papon at al PRL 2012
Tg gradient model analysis
- One parameter description fast glassy relaxation near surfaces from Tg to Tg +100K ( as measured by NMR)
-With the same parameter : quantitative prediction of the solvent effect on confinement
-With the same parameter : prediction of the DSC (calorimetric) response
Tg gradient model analysis
4
68
0.1
2
4
68
1
Nor
mal
ized
inte
nsity
0.100.080.060.040.020.00Time (ms)
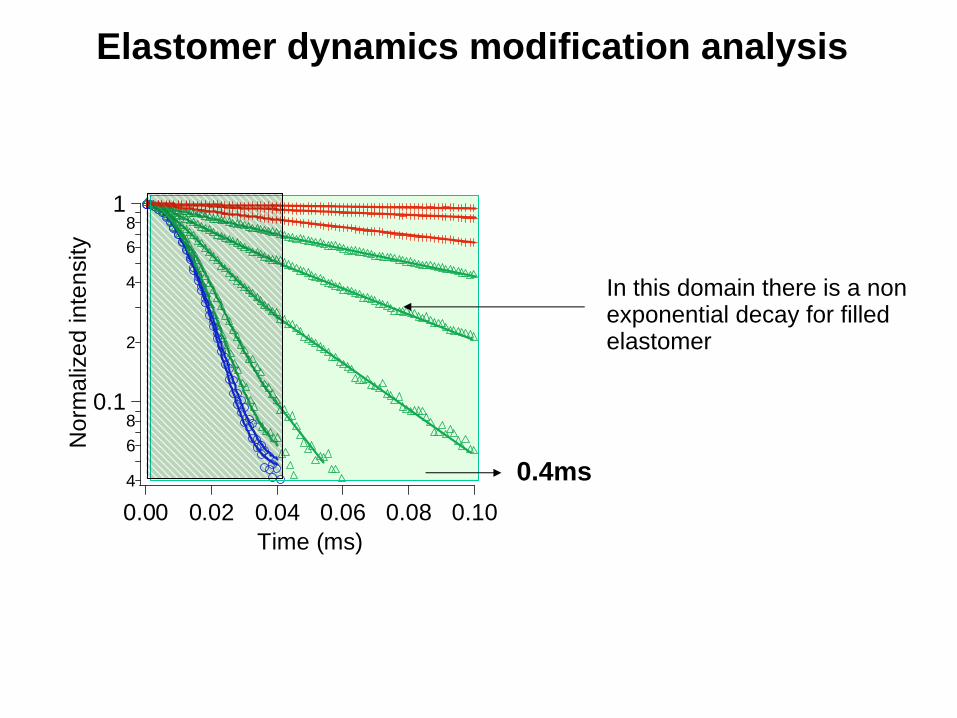
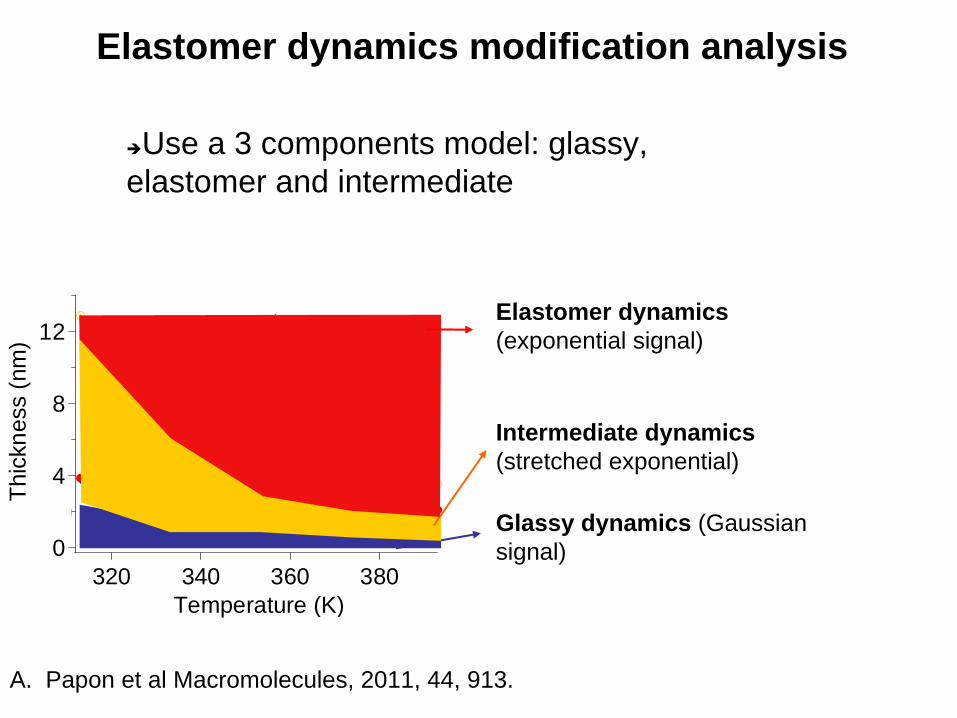
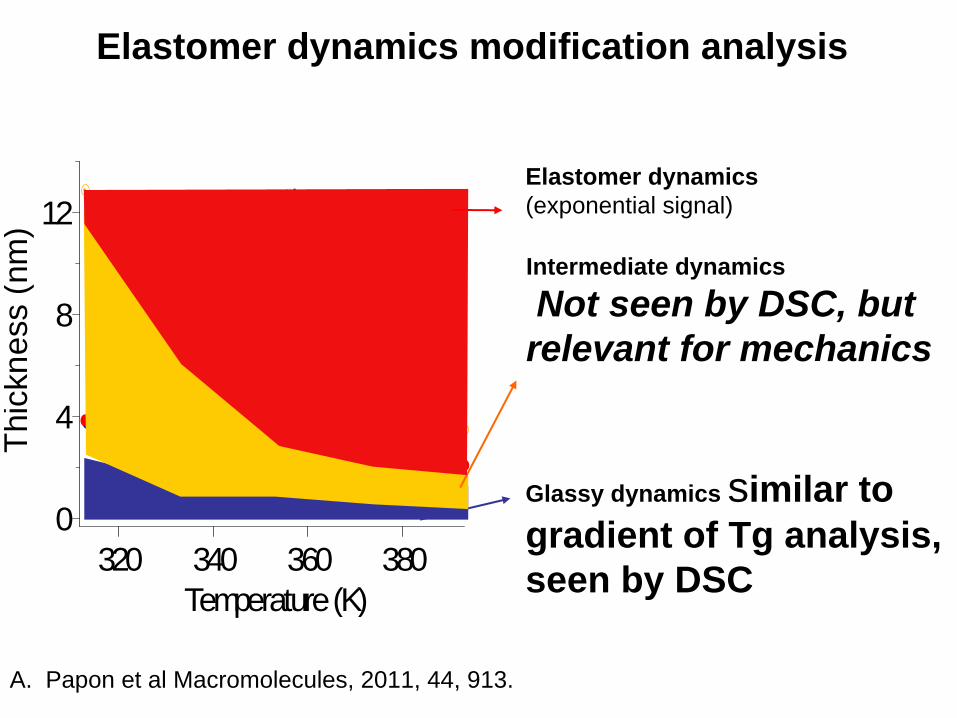
Elastomer dynamics modification analysis
In this domain there is a non exponential decay for filled elastomer
0.4ms
12
8
4
0
Thic
knes
s (n
m)
380360340320Temperature (K)
Tg gradient model e
3 components fit eg eimm
e0 Glassy dynamics (Gaussian signal)
Elastomer dynamics (exponential signal)
Intermediate dynamics(stretched exponential)
Use a 3 components model: glassy, elastomer and intermediate
A. Papon et al Macromolecules, 2011, 44, 913.
Elastomer dynamics modification analysis
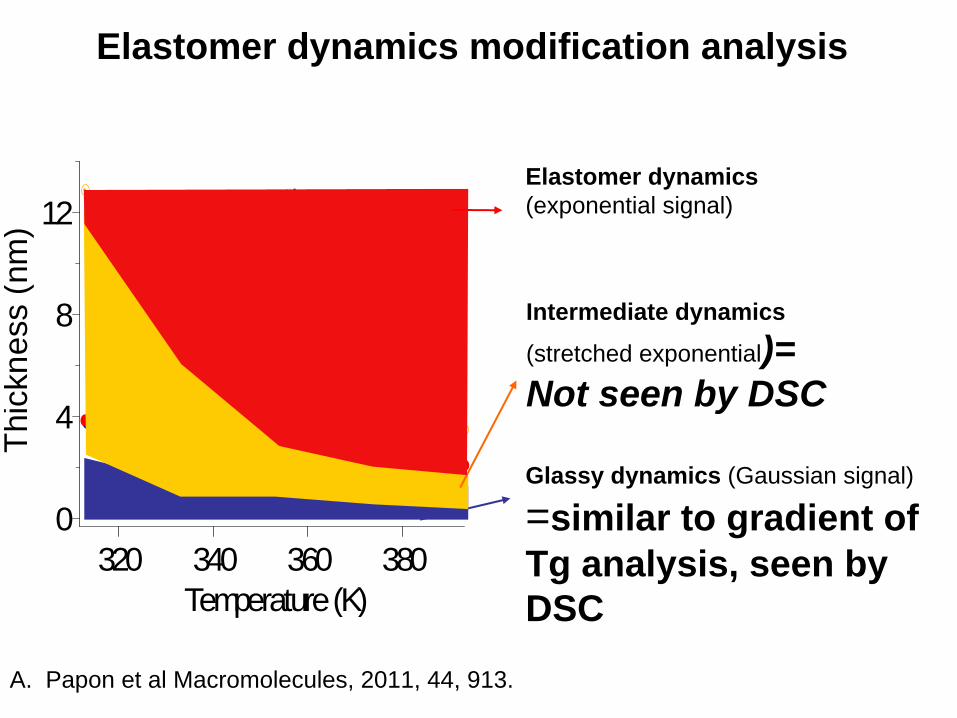
12
8
4
0
Thic
knes
s (n
m)
380360340320Temperature (K)
Tg gradient model e
3 components fit eg eimm
e0 Glassy dynamics (Gaussian signal)
=similar to gradient of Tg analysis, seen by DSC
Elastomer dynamics (exponential signal)
Intermediate dynamics
(stretched exponential)= Not seen by DSC
A. Papon et al Macromolecules, 2011, 44, 913.
Elastomer dynamics modification analysis
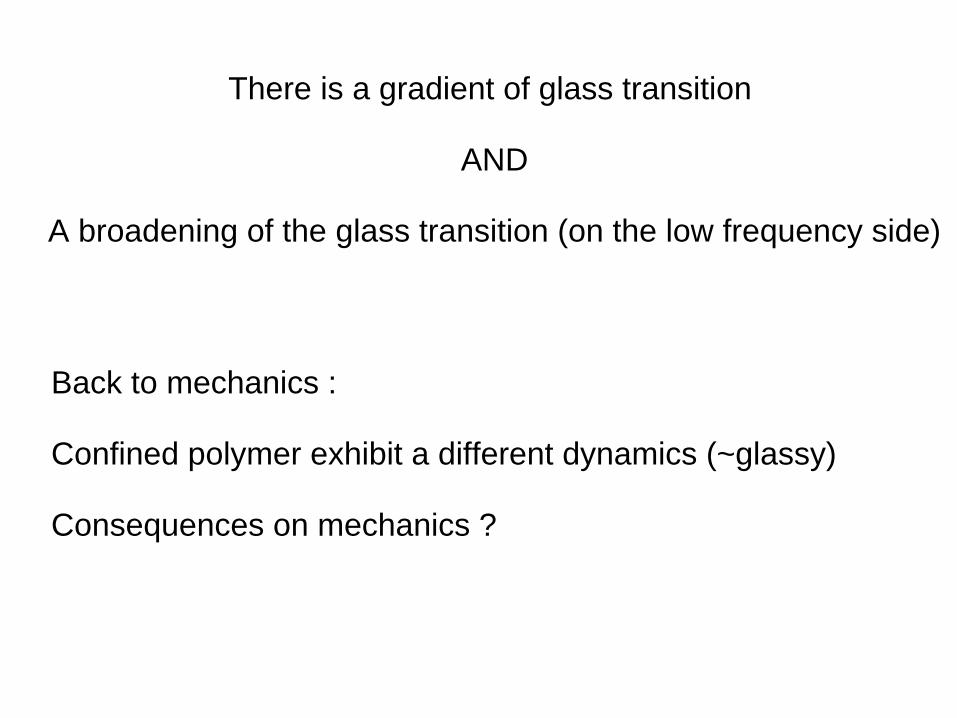
There is a gradient of glass transition
AND
A broadening of the glass transition (on the low frequency side)
Back to mechanics :
Confined polymer exhibit a different dynamics (~glassy)
Consequences on mechanics ?
z
Tg
T
Log
G’
z
Tg and linear mechanical response
z
Tg
T
Log
G’
z
68
0.1
2
4
68
1
2
S ( q
)
12 3 4 5 6 7
102
qDmean (Å-1)
68
0.1
2
4
68
1
2
S (
q )
12 3 4 5 6
102 3 4
qDmean ( Å-1)
68
0.1
2
4
68
1
2
S (
q )
12 4 6 8
102 4
qDmean ( Å-1 )
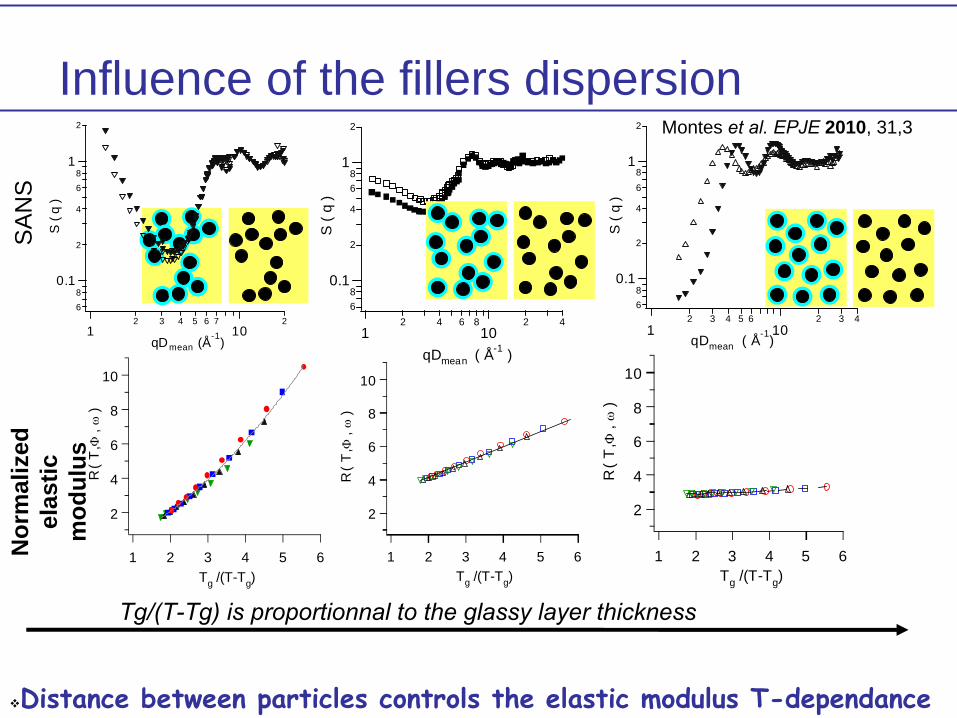
Montes et al.
EPJE
2010, 31,3
SA
NS
Nor
mal
ized
elas
ticm
odul
usInfluence of the fillers dispersion
Distance between
particles
controls
the
elastic
modulus
T-dependance
10
8
6
4
2
R( T
,,
)
654321Tg /(T-Tg)
10
8
6
4
2
R( T
,,
)
654321Tg /(T-Tg)
10
8
6
4
2
R( T
,,
)
654321Tg /(T-Tg)
Tg/(T-Tg) is proportionnal
to the glassy layer thickness
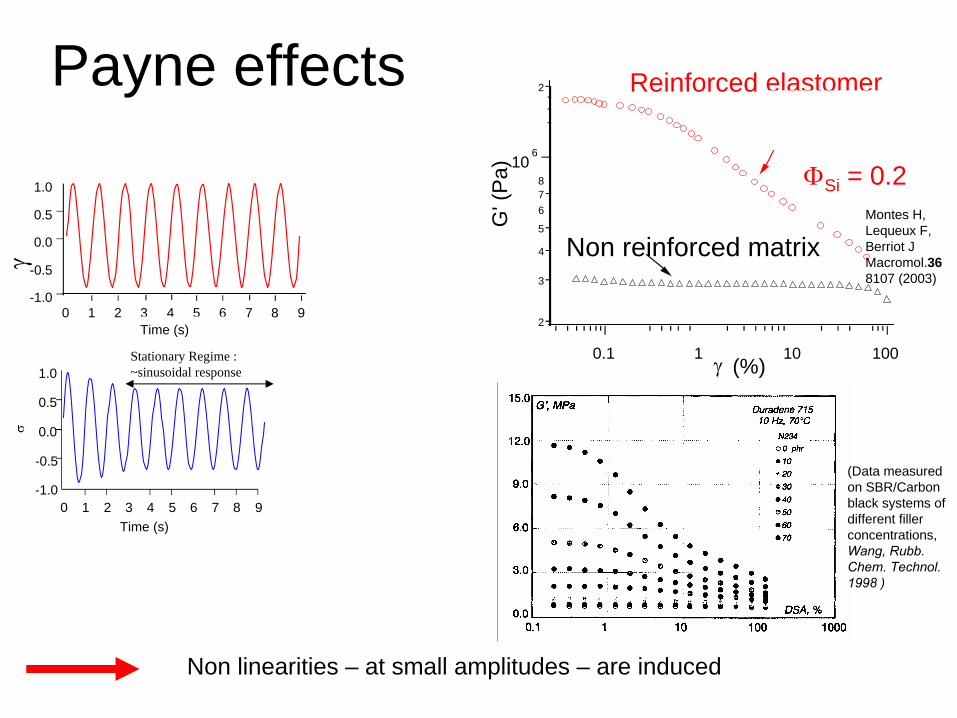
Payne effects
1.0
0.5
0.0
-0.5
-1.09876543210
Time (s)
-1.0
-0.5
0.0
0.5
1.0
9876543210temps
Stationary Regime : ~sinusoidal response
Time (s)
Reinforced elastomer
2
3
4
5
678
106
2
G' (
Pa)
0.1 1 10 100 (%)
Si = 0.2
Non reinforced matrix
Non linearities – at small amplitudes – are induced
(Data measured on SBR/Carbon black systems of different filler concentrations, Wang, Rubb. Chem. Technol. 1998 )
Montes H, Lequeux F, Berriot J Macromol.36 8107 (2003)
68
0.1
2
4
68
1
2
S ( q
)
12 3 4 5 6 7
102
qDmean (Å-1)
2.0
1.6
1.2
0.8
G' (
MP
a )
0.12 4 6
12 4 6
102
(%)
2.0
1.6
1.2
0.8
G' (
MP
a )
0.12 4 6
12 4 6
102
(%)
2.0
1.6
1.2
0.8
G' (
MP
a )
0.12 4 6
12 4 6
102
(%)
68
0.1
2
4
68
1
2
S (
q )
12 3 4 5 6
102 3 4
qDmean ( Å-1)
68
0.1
2
4
68
1
2
S (
q )
12 4 6 8
102 4
qDmean ( Å-1 )
SA
NS
Mec
hani
cs
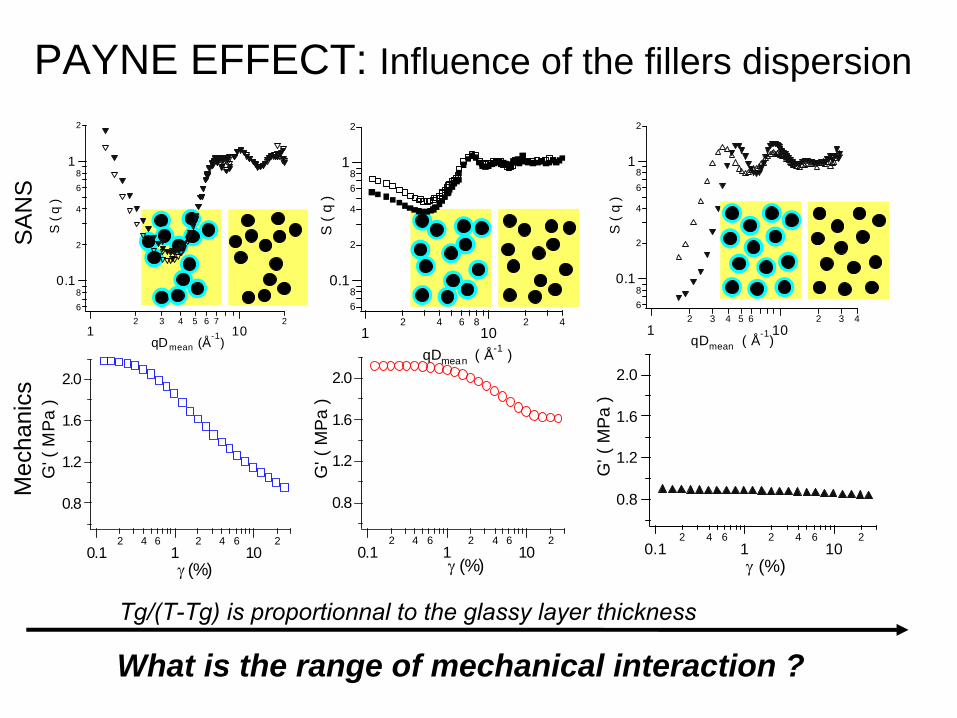
PAYNE EFFECT: Influence of the fillers dispersion
What is the range of mechanical interaction ?
Tg/(T-Tg) is proportionnal
to the glassy layer thickness
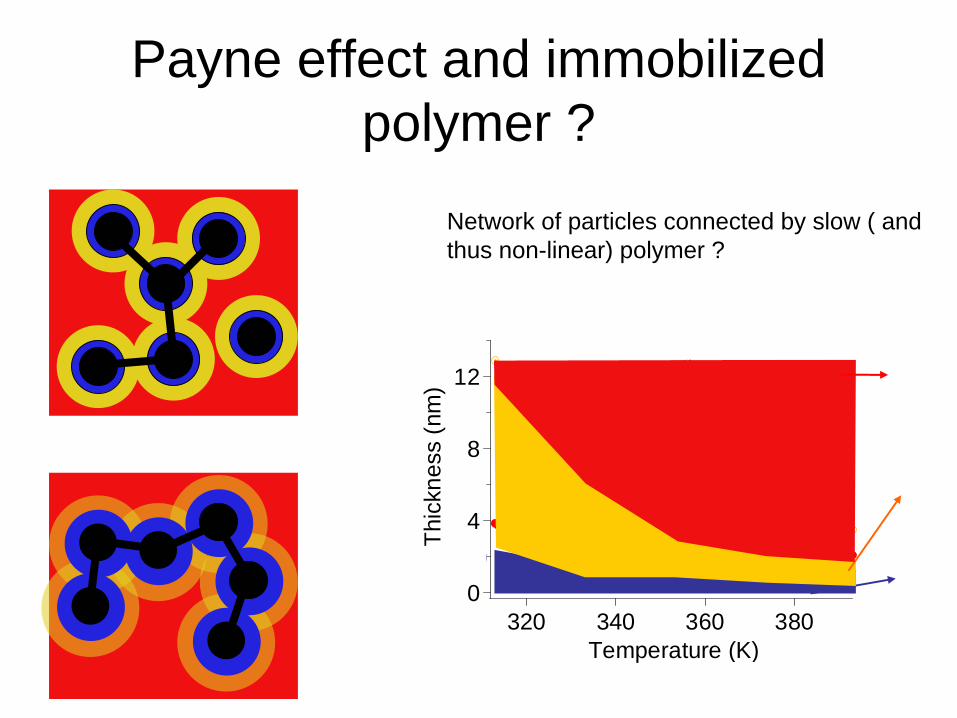
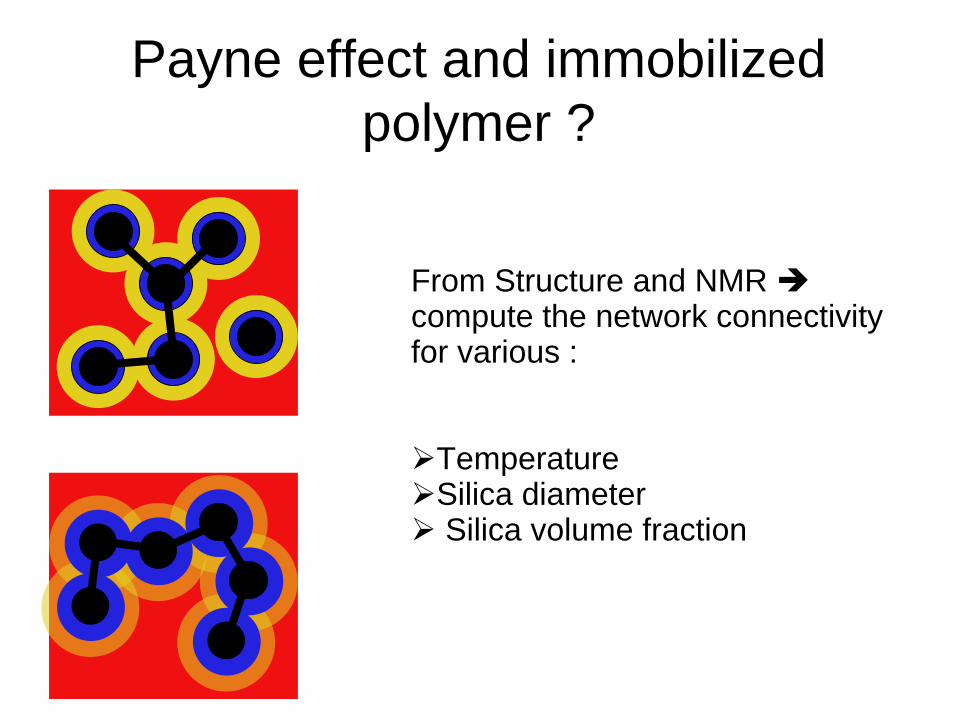
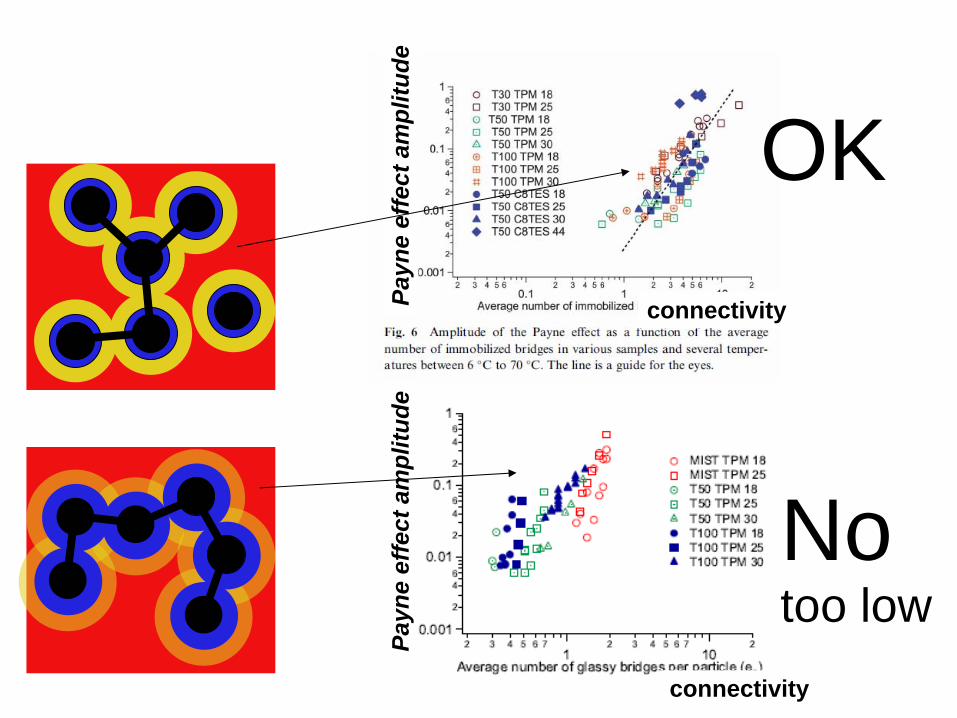
Payne effect and immobilized polymer ?
Network of particles connected by slow ( and thus non-linear) polymer ?
12
8
4
0
Thic
knes
s (n
m)
380360340320Temperature (K)
Tg gradient model e
3 components fit eg eimm
e0
Payne effect and immobilized polymer ?
From Structure and NMR compute the network connectivity
for various :
TemperatureSilica diameter Silica volume fraction
Payn
e ef
fect
ampl
itude
Payn
e ef
fect
ampl
itude
connectivity
connectivity
Notoo low
OK
12
8
4
0
Thic
knes
s (n
m)
380360340320Temperature (K)
Tg gradient model e
3 components fit eg eimm
e0Glassy dynamics similar to gradient of Tg analysis, seen by DSC
Elastomer dynamics (exponential signal)
Intermediate dynamics
Not seen by DSC, but relevant for mechanics
A. Papon et al Macromolecules, 2011, 44, 913.
Elastomer dynamics modification analysis
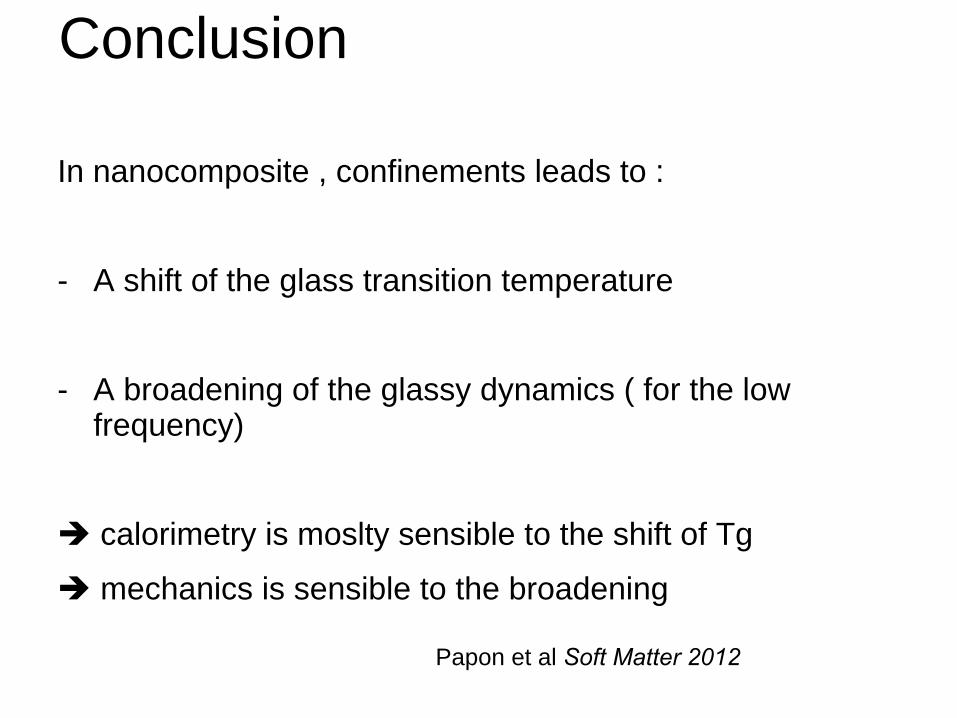
Conclusion
In nanocomposite , confinements leads to :
- A shift of the glass transition temperature
- A broadening of the glassy dynamics ( for the low frequency)
calorimetry is moslty sensible to the shift of Tg
mechanics is sensible to the broadening
Papon et al Soft Matter
2012
Understanding the dynamics near the particles
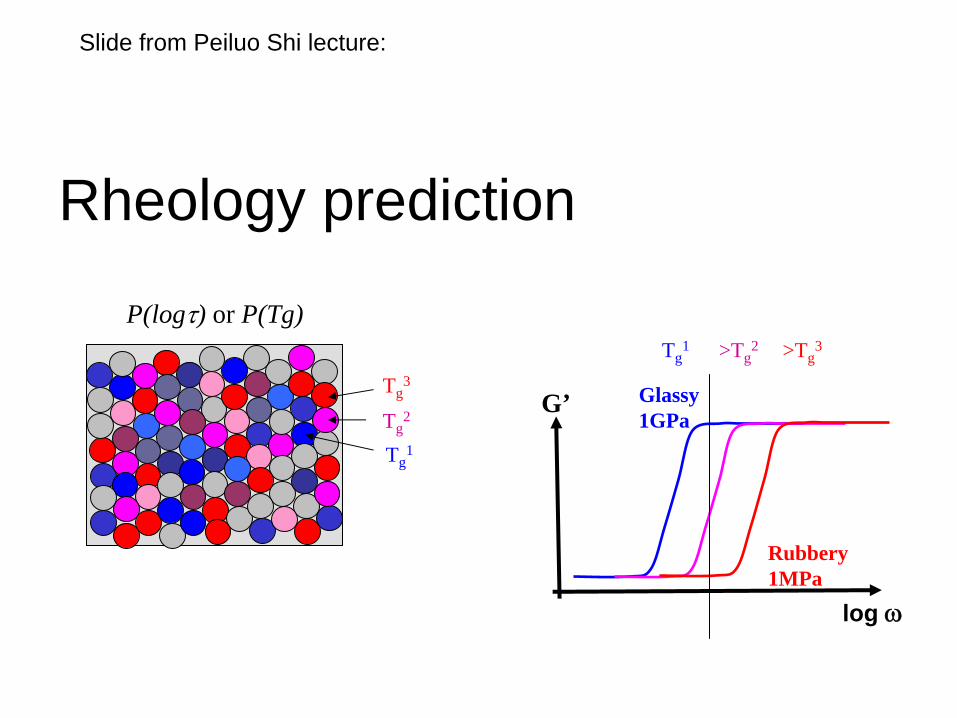
Rheology prediction
log
G’ Glassy 1GPa
Rubbery 1MPa
P(log) or P(Tg)
Tg1
Tg3
Tg2
Tg1 >Tg
2 >Tg3
Slide from Peiluo Shi lecture:
Fast Domains
Slow domains
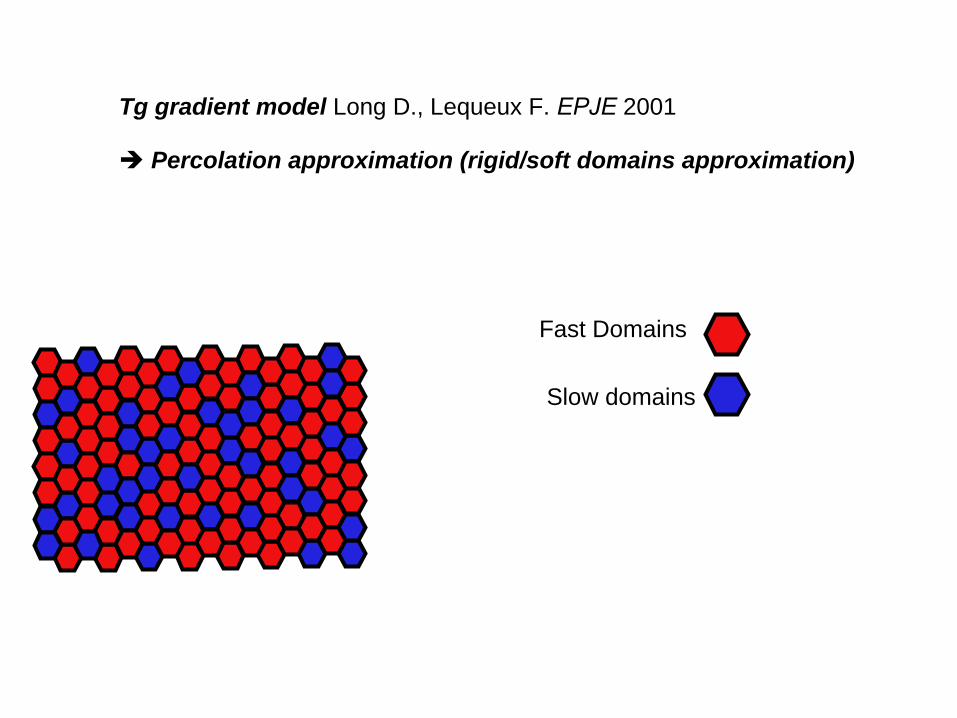
Tg gradient model Long D., Lequeux F. EPJE
2001
Percolation approximation (rigid/soft domains approximation)
Fast Domains
Slow domains
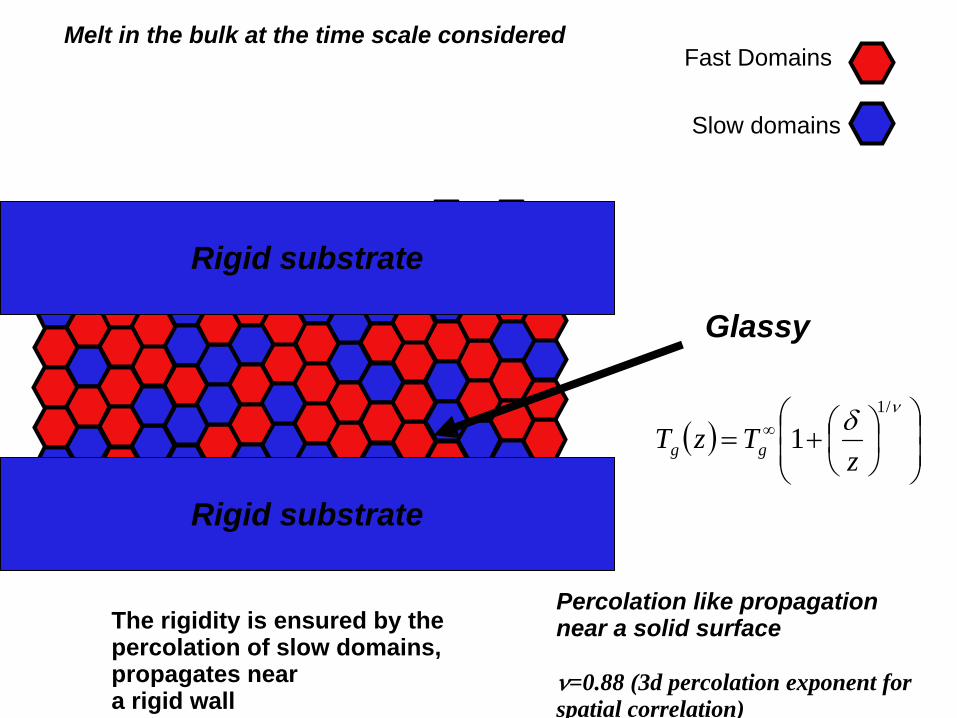
The rigidity is ensured by the percolation of slow domains, propagates neara rigid wall
Melt in the bulk at the time scale considered
Rigid substrate
Glassy
Percolation like propagation near a solid surface
=0.88 (3d percolation exponent for spatial correlation)
/1
1z
TzT gg
Rigid substrate
Beyond the rigid/soft domains approximation:
A. Dequidt lecture
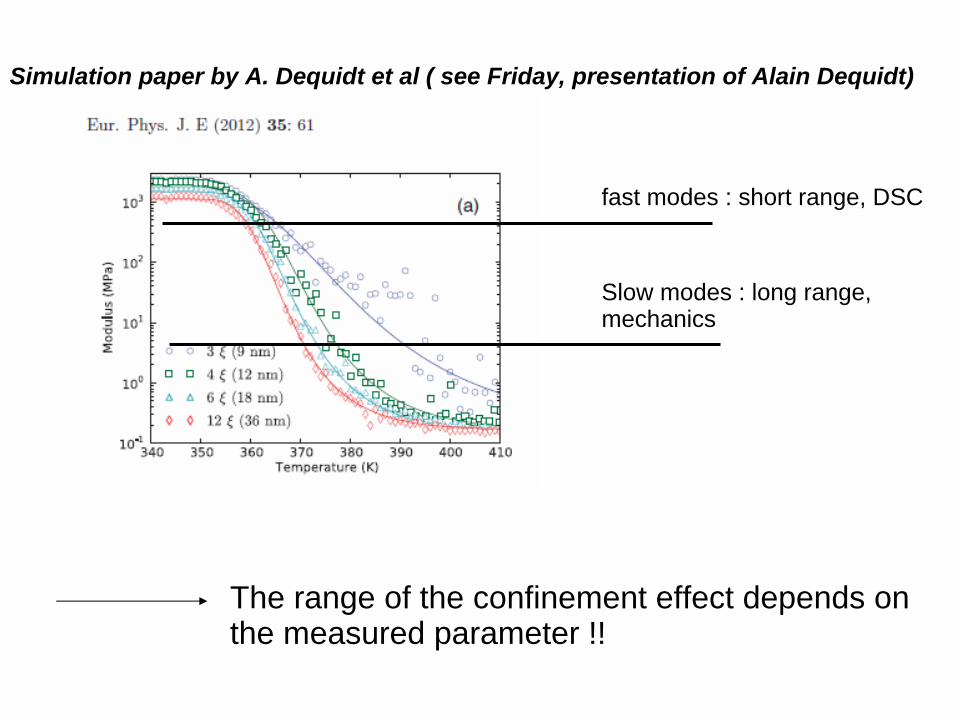
Simulation paper by A. Dequidt et al ( see Friday, presentation of Alain Dequidt)
The range of the confinement effect depends on the measured parameter !!
fast modes : short range, DSC
Slow modes : long range, mechanics

12
8
4
0
Thic
knes
s (n
m)
380360340320Temperature (K)
Tg gradient model e
3 components fit eg eimm
e0Glassy dynamics similar to gradient of Tg analysis, seen by DSC
Elastomer dynamics (exponential signal)
Intermediate dynamics
Not seen by DSC, but relevant for mechanics
A. Papon et al Macromolecules, 2011, 44, 913.
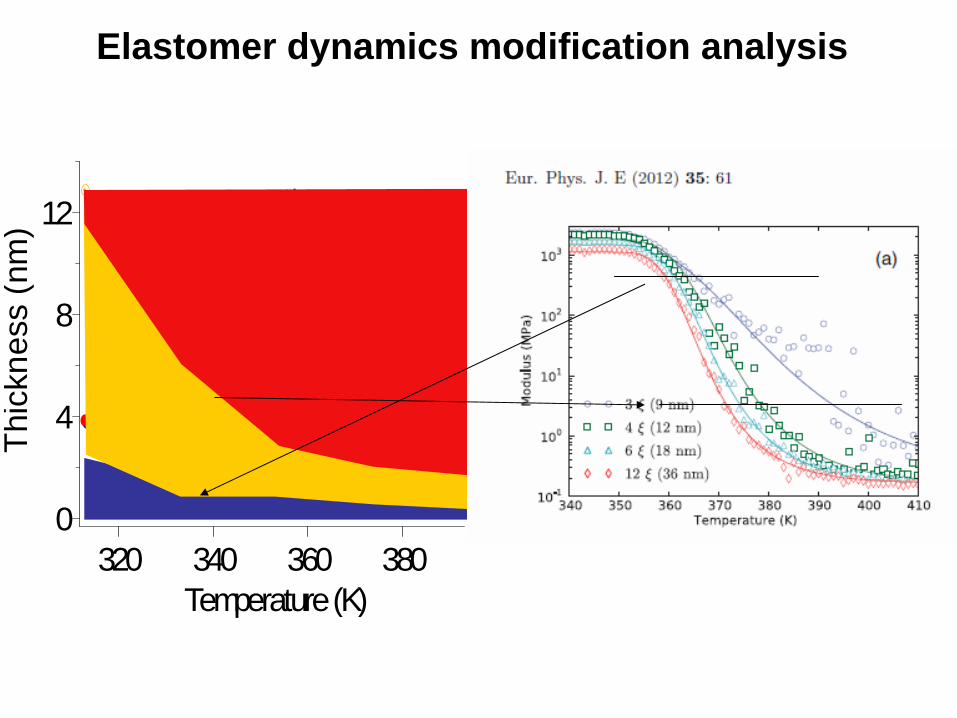
Elastomer dynamics modification analysis
12
8
4
0
Thic
knes
s (n
m)
380360340320Temperature (K)
Tg gradient model e
3 components fit eg eimm
e0
Elastomer dynamics modification analysis
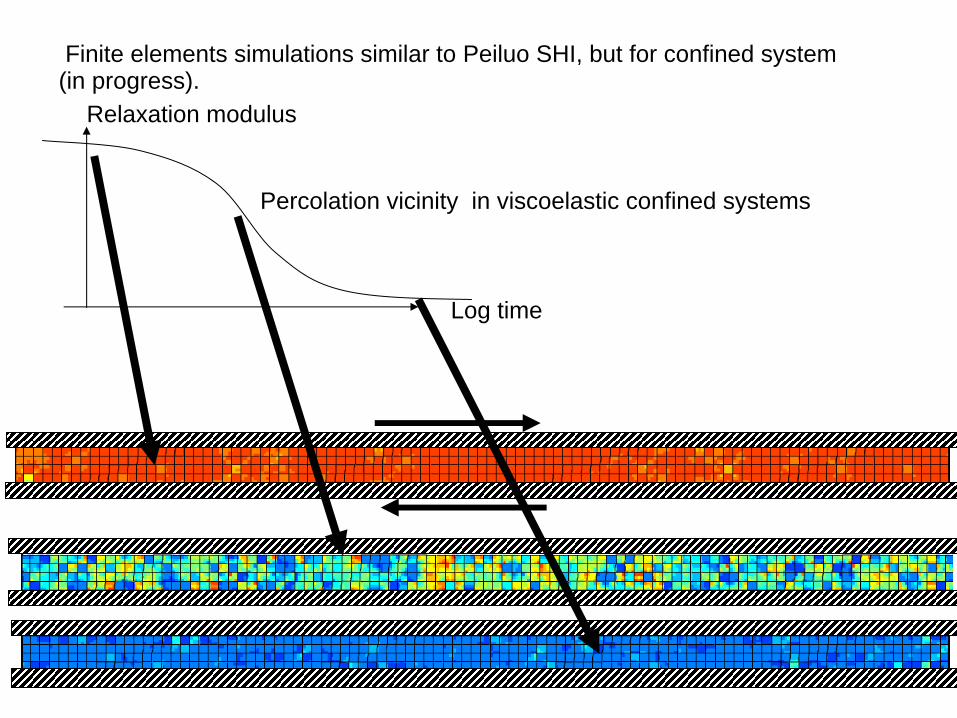
Finite elements simulations similar to Peiluo SHI, but for confined system (in progress).
Log time
Relaxation modulus
Percolation vicinity in viscoelastic confined systems
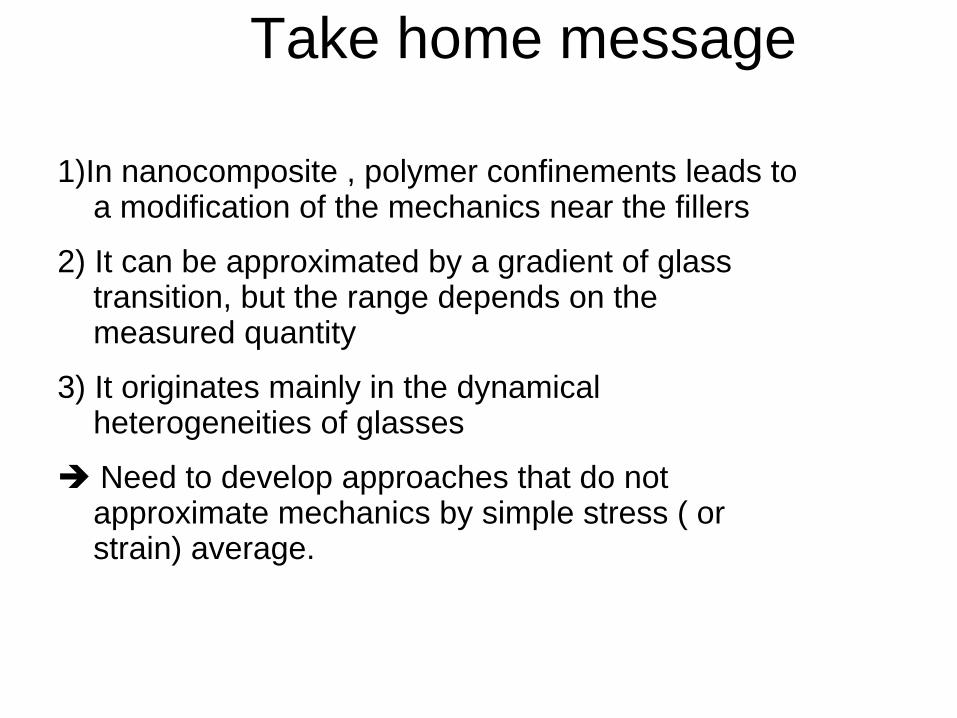
Take home message
1)In nanocomposite , polymer confinements leads to a modification of the mechanics near the fillers
2) It can be approximated by a gradient of glass transition, but the range depends on the measured quantity
3) It originates mainly in the dynamical heterogeneities of glasses
Need to develop approaches that do not approximate mechanics by simple stress ( or strain) average.