
Figure 7-2 A Sample of Filled Format for Fire Station
27
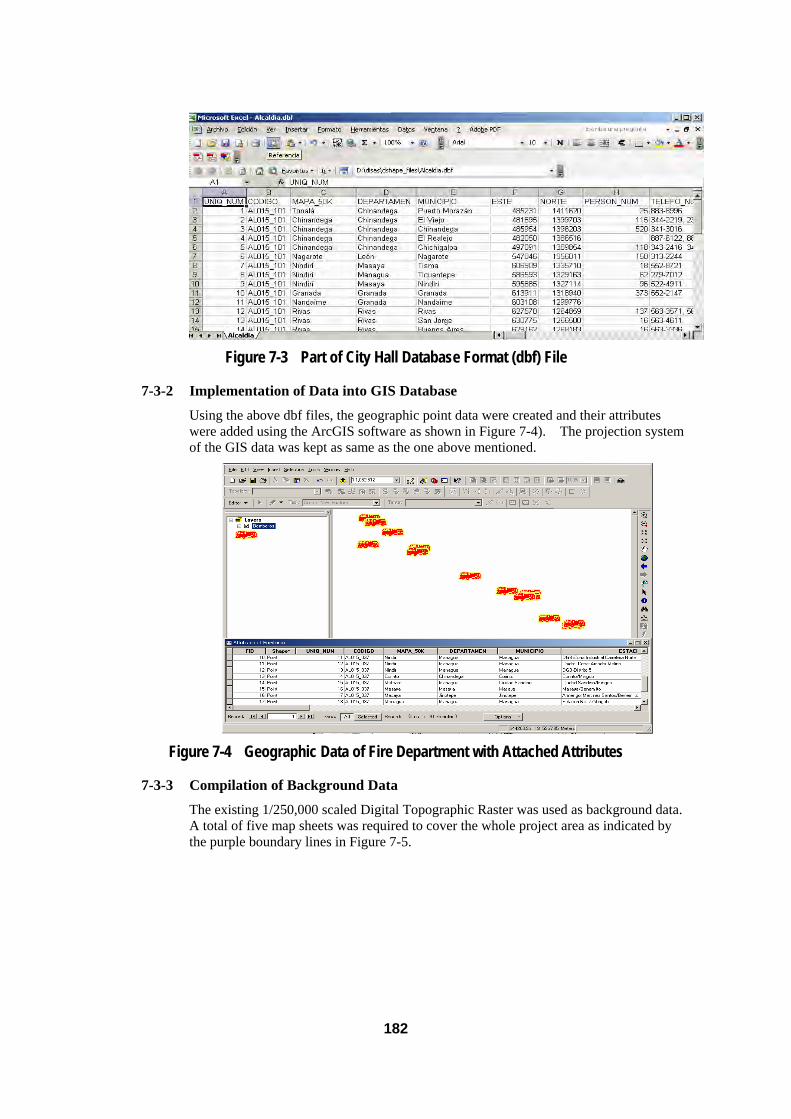
181 Latitud 12 39 41 1,399,696.29 Longitud 87 10 2 481,841.90 Remarks Cuerpo de Bomberos Nombre del Área / Mapa 1:50 000 Chinandega Nombre del Municipio/Ciudad El Viejo Localización Nombre de la Estación Cuerpo de Bomberos Voluntarios El Viejo Tipo Principal * Estación Número de Teléfono 8935438 Nombre del Oficial Jefe Cmdte. Dionisio José López Rubí Número de Vehículos de Emegencia 1 Número de Ambulancias 1 (Mal estado) Número de Bomberos 47 Número de otros Vehículos Especiales 1 (Mal estado) Número de Cisternas 2 (1 En mal estado) Número de Foto-2 Visión Cercana * Número de Foto-1 Visión Completa * Figure 7-2 A Sample of Filled Format for Fire Station 7-3 Processing of Collected Data Once all the work items of collecting the data in the field were accomplished, the data were proc- essed in the office of INETER. The collected data were taken into Microsoft Excel files and saved in the Excel file format. These digital data were frequently used for the verifications and corrections of the data on the formats filled in field survey. The format is useful as a reference in the future. 7-3-1 Transferring the Data to Database Format Using the Microsoft Excel program, the tabulated data were transferred to a database format with .dbf extension which was compatible with the format used in ArcGIS. In this process, the geographic coordinates (Latitude and Longitude) was converted into UTM coordinates(Northing and Easting) with the parameters of UTM zone 16, Spheroid WGS84, and the unit of length was converted into meters. Also, in the .dbf format ta- ble, the path to photographs was input in a separate column which was designated to use as linkage to each facility on display. Generally, each site has two photos; one with its overall view (Photo of the Site), and the other to cover the surrounding area or to focus on the close view of the facility (Nearby photo). Sometimes, the names of the actual items in the database files were too long to fill into the GIS database format. In such a case, they were abbreviated. Hence, it was required to prepare a data dictionary of key- words used for particular items in ArcGIS to make correspond to true item names.
Transcript of Figure 7-2 A Sample of Filled Format for Fire Station

181
Latitud 12 39 41 1 ,399,696 .29
Longitud 87 10 2 481,841 .90
R em arks
C uerpo de B om beros
N om bre del Área / M apa 1:50 000 Chinandega
N om bre del M unicip io/C iudad E l V iejo
Localización
N om bre de la E stación Cuerpo de B om beros V oluntarios E l V iejo
T ipo P rincipal * E stación
N úm ero de T eléfono 8935438
N om bre del O ficia l Jefe Cm dte. D ionisio José López Rubí
N úm ero de V ehículos de E m egencia 1
N úm ero de A m bulancias 1 (M al estado)
N úm ero de B om beros 47
N úm ero de o tros V ehículos E speciales 1 (M al estado)
N úm ero de C isternas 2 (1 E n m al estado)
N úm ero de Foto-2 V isión Cercana *
N úm ero de Foto-1 V isión Com pleta *
Figure 7-2 A Sample of Filled Format for Fire Station
7-3 Processing of Collected Data Once all the work items of collecting the data in the field were accomplished, the data were proc-essed in the office of INETER. The collected data were taken into Microsoft Excel files and saved in the Excel file format. These digital data were frequently used for the verifications and corrections of the data on the formats filled in field survey. The format is useful as a reference in the future.
7-3-1 Transferring the Data to Database Format
Using the Microsoft Excel program, the tabulated data were transferred to a database format with .dbf extension which was compatible with the format used in ArcGIS. In this process, the geographic coordinates (Latitude and Longitude) was converted into UTM coordinates(Northing and Easting) with the parameters of UTM zone 16, Spheroid WGS84, and the unit of length was converted into meters. Also, in the .dbf format ta-ble, the path to photographs was input in a separate column which was designated to use as linkage to each facility on display. Generally, each site has two photos; one with its overall view (Photo of the Site), and the other to cover the surrounding area or to focus on the close view of the facility (Nearby photo). Sometimes, the names of the actual items in the database files were too long to fill into the GIS database format. In such a case, they were abbreviated. Hence, it was required to prepare a data dictionary of key-words used for particular items in ArcGIS to make correspond to true item names.
182
Figure 7-3 Part of City Hall Database Format (dbf) File
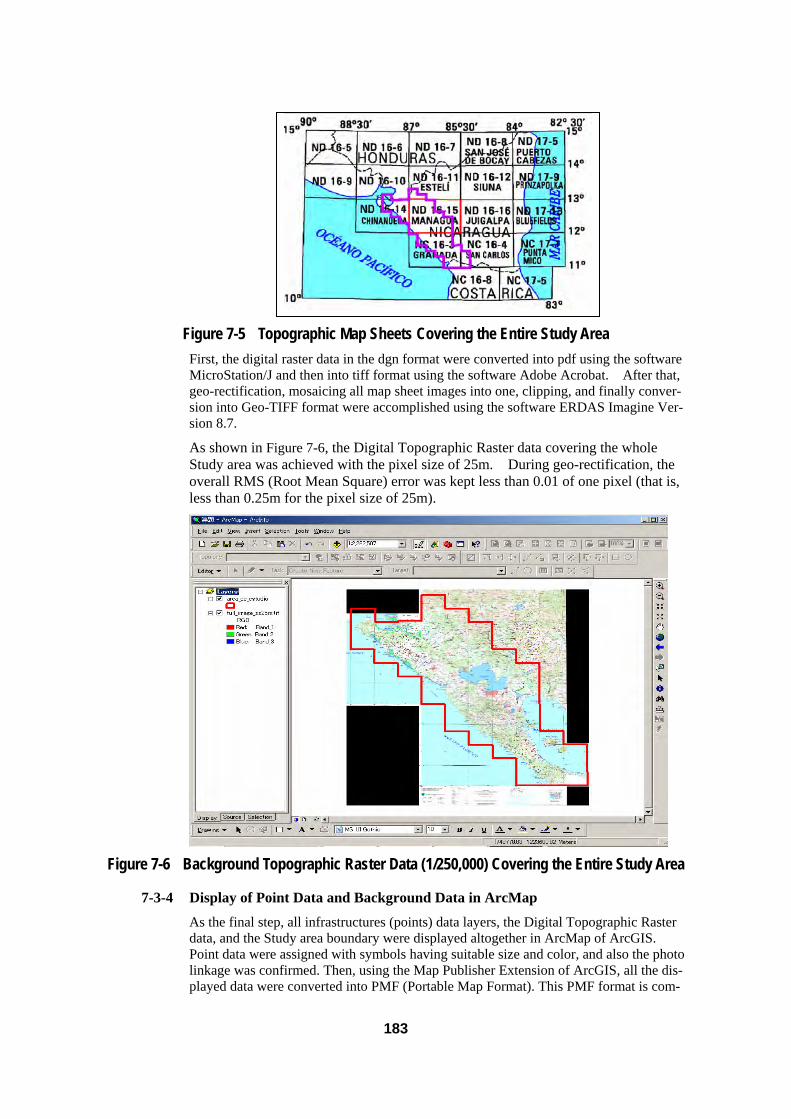
7-3-2 Implementation of Data into GIS Database
Using the above dbf files, the geographic point data were created and their attributes were added using the ArcGIS software as shown in Figure 7-4). The projection system of the GIS data was kept as same as the one above mentioned.
Figure 7-4 Geographic Data of Fire Department with Attached Attributes
7-3-3 Compilation of Background Data
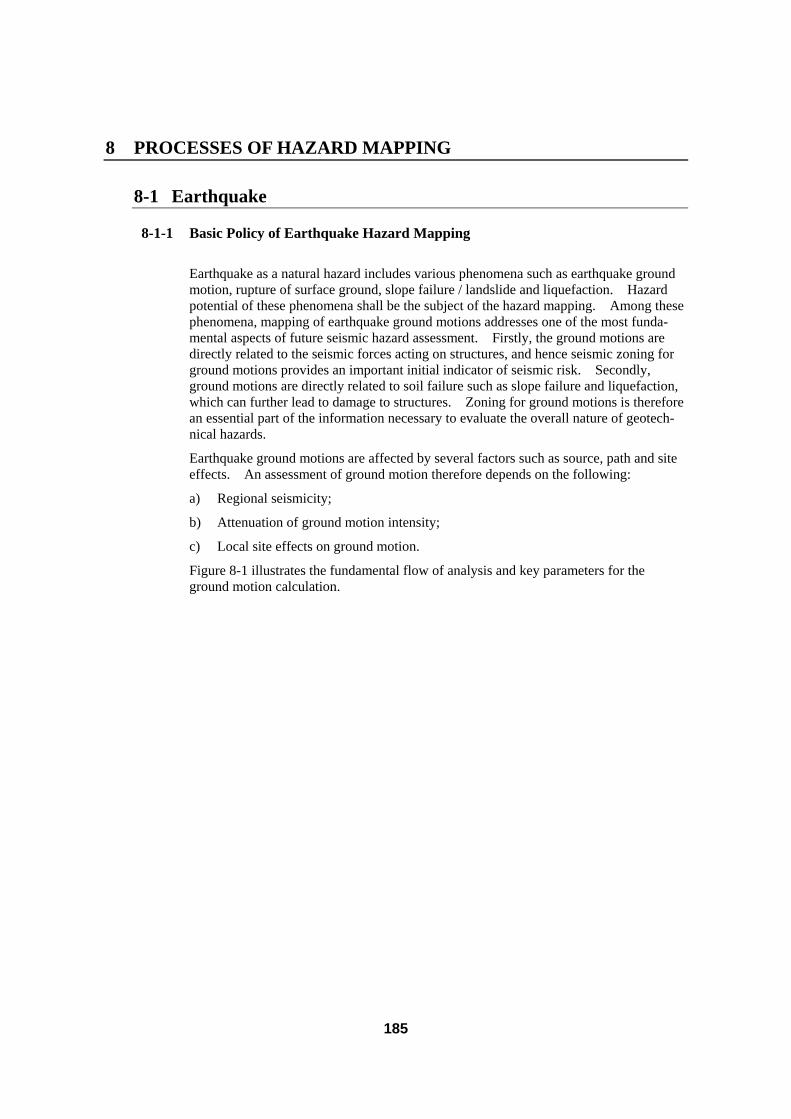
The existing 1/250,000 scaled Digital Topographic Raster was used as background data. A total of five map sheets was required to cover the whole project area as indicated by the purple boundary lines in Figure 7-5.
183
Figure 7-5 Topographic Map Sheets Covering the Entire Study Area First, the digital raster data in the dgn format were converted into pdf using the software MicroStation/J and then into tiff format using the software Adobe Acrobat. After that, geo-rectification, mosaicing all map sheet images into one, clipping, and finally conver-sion into Geo-TIFF format were accomplished using the software ERDAS Imagine Ver-sion 8.7.
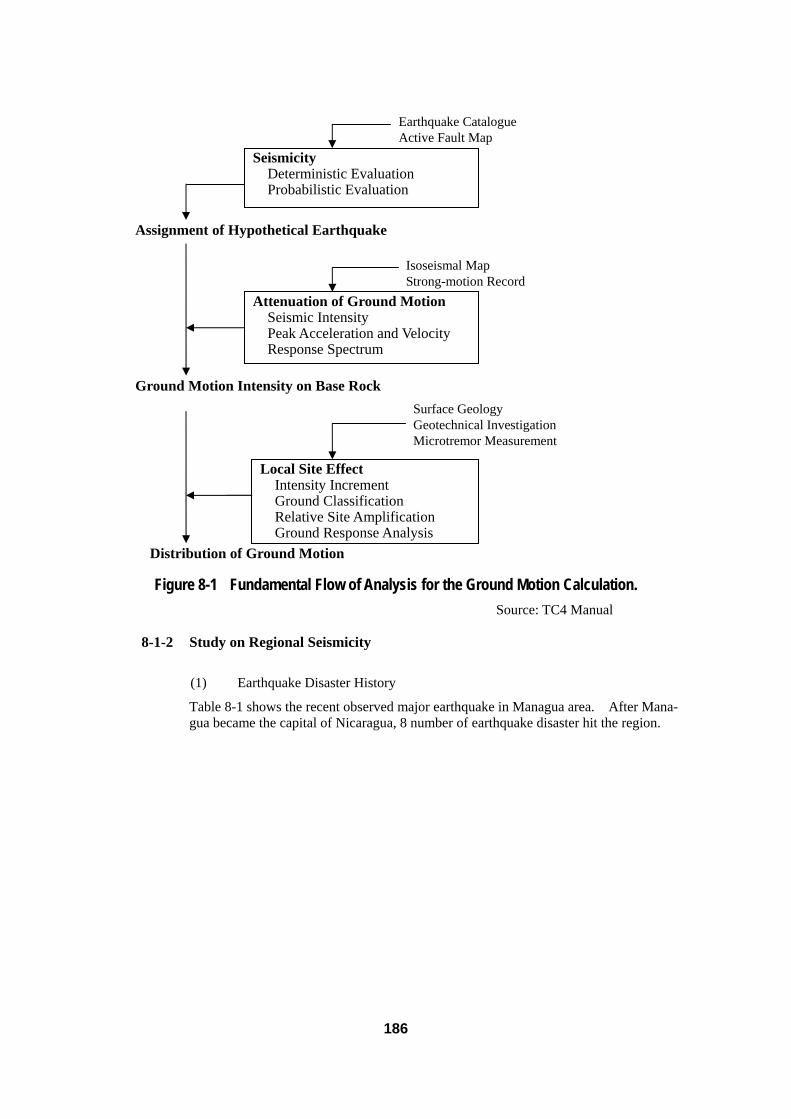
As shown in Figure 7-6, the Digital Topographic Raster data covering the whole Study area was achieved with the pixel size of 25m. During geo-rectification, the overall RMS (Root Mean Square) error was kept less than 0.01 of one pixel (that is, less than 0.25m for the pixel size of 25m).
Figure 7-6 Background Topographic Raster Data (1/250,000) Covering the Entire Study Area
7-3-4 Display of Point Data and Background Data in ArcMap
As the final step, all infrastructures (points) data layers, the Digital Topographic Raster data, and the Study area boundary were displayed altogether in ArcMap of ArcGIS. Point data were assigned with symbols having suitable size and color, and also the photo linkage was confirmed. Then, using the Map Publisher Extension of ArcGIS, all the dis-played data were converted into PMF (Portable Map Format). This PMF format is com-

184
patible with ArcReader of ArcGIS as shown in Figure 7-7. The figure on the right dis-plays the whole Study area and the bottom right figure shows the disaster mitigation re-lated facilities existing around the city LEON.
Figure 7-7 GIS Database of Infrastructures for Disaster Mitigation The above system can display all the information by clicking the middle part of the fea-turing symbol. Similarly, the attached photo (image) will appear when either Hyperlink button or information button is hit and then a desired photo item is clicked.
185
8 PROCESSES OF HAZARD MAPPING
8-1 Earthquake
8-1-1 Basic Policy of Earthquake Hazard Mapping
Earthquake as a natural hazard includes various phenomena such as earthquake ground motion, rupture of surface ground, slope failure / landslide and liquefaction. Hazard potential of these phenomena shall be the subject of the hazard mapping. Among these phenomena, mapping of earthquake ground motions addresses one of the most funda-mental aspects of future seismic hazard assessment. Firstly, the ground motions are directly related to the seismic forces acting on structures, and hence seismic zoning for ground motions provides an important initial indicator of seismic risk. Secondly, ground motions are directly related to soil failure such as slope failure and liquefaction, which can further lead to damage to structures. Zoning for ground motions is therefore an essential part of the information necessary to evaluate the overall nature of geotech-nical hazards.
Earthquake ground motions are affected by several factors such as source, path and site effects. An assessment of ground motion therefore depends on the following:
a) Regional seismicity;
b) Attenuation of ground motion intensity;
c) Local site effects on ground motion.
Figure 8-1 illustrates the fundamental flow of analysis and key parameters for the ground motion calculation.
186
Figure 8-1 Fundamental Flow of Analysis for the Ground Motion Calculation.
Source: TC4 Manual
8-1-2 Study on Regional Seismicity
(1) Earthquake Disaster History
Table 8-1 shows the recent observed major earthquake in Managua area. After Mana-gua became the capital of Nicaragua, 8 number of earthquake disaster hit the region.
Seismicity Deterministic Evaluation Probabilistic Evaluation
Attenuation of Ground Motion Seismic Intensity Peak Acceleration and Velocity Response Spectrum
Earthquake Catalogue Active Fault Map
Isoseismal Map Strong-motion Record
Surface Geology Geotechnical Investigation Microtremor Measurement
Local Site Effect Intensity Increment Ground Classification Relative Site Amplification Ground Response Analysis
Distribution of Ground Motion
Ground Motion Intensity on Base Rock
Assignment of Hypothetical Earthquake

187
Table 8-1 Major Earthquake in Managua Area
Year Month Day Time (GMT) Lat Lon M Depth Managua Note
1853
Managua became capital of Nica-ragua.
1885 10 11 21:30 Local VII Strongly felt in Managua. Minor damage. 6 victims.
1898 4 29 22:30 Local 12.4 86.9 VII-VIII Felt entire Nicaragua. Two events ?1916 2 27 20:20:48 12.0 90.0 7.3 Shallow IV
1926 11 5 7:55:38 12.3 85.8 7.2 135 km VII-VIII Some victims in Managua. About half of the houses were damaged.
1931 3 31 16:02:21 13.2 85.7 5.5 Shallow VIII Death of 2000, several thousand injured. 35,000 homeless. $30 mil-lion of loss.
1958 11 14 15:22:08 12.4 86.4 ? 7 km V-VI
1968 1 4 10:03:57 12.1 86.3 4.6 5 km VIII Moderate damage in Managua. 300 houses in colonia centroamerica were inhabitable.
1972 12 23 6:29:42 12.4 86.1 6.2 5 km VIII-IX
Destruction was 80 % in the center and 60 % in the peripheral area of the city. Death between 8000 and 9000. Material loss reached to $1 billion.
Grases J., 1990, Terremotos Destructores del Caribe 1502-1990, UNESCO-Red Latinoamericana y del Caribe de Centros de Ingenieria Sismica
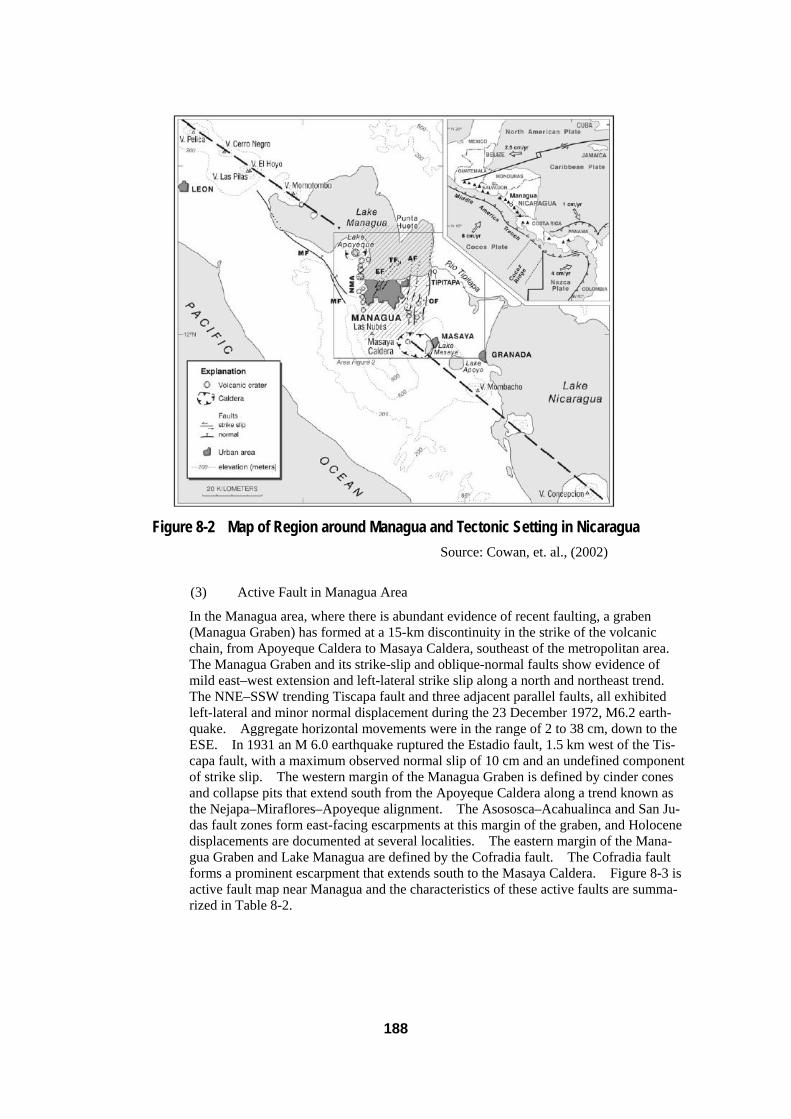
(2) Tectonic Setting of the Region
Seismicity of Nicaragua is mainly caused by the Cocos Plate subducting under the North American Plate. The maximum observed earthquake generated by the subduction was 8.0. The general seismic and tectonic feature of Nicaragua is typical Benioff zone of earthquakes dipping inland from the trench. There is an obvious shallow seismic activ-ity associated with the volcanic zone, where the more destructive earthquakes occurred. The Nicaragua Depression (Graben), lowland parallel to the coast line includes the ma-jority of the volcanic centers in Nicaragua. This lowland is a basin covered with thick sedimentary deposits of alluvial and volcanic soil. The alignment of the volcanoes is offset at 3 places. The most interesting for the Study is near Managua offset. Within and near the boundary of the Graben, several fault system have been observed. Along the edges of the depression, dip-slip faults are observed. The most prominent faults are NE strike while NW, NS and EW striking faults are known. The 1972 Managua earthquake occurred on the NE striking Tiscapa fault and the motion was left lateral strike slip. Near Managua, there are several parallel NE striking faults and the 1931 earthquake also occurred on one of these faults close to the 1972 earthquake. Map of region around Managua and tectonic setting in Nicaragua is shown in Figure 8-2.
188
Figure 8-2 Map of Region around Managua and Tectonic Setting in Nicaragua Source: Cowan, et. al., (2002)
(3) Active Fault in Managua Area
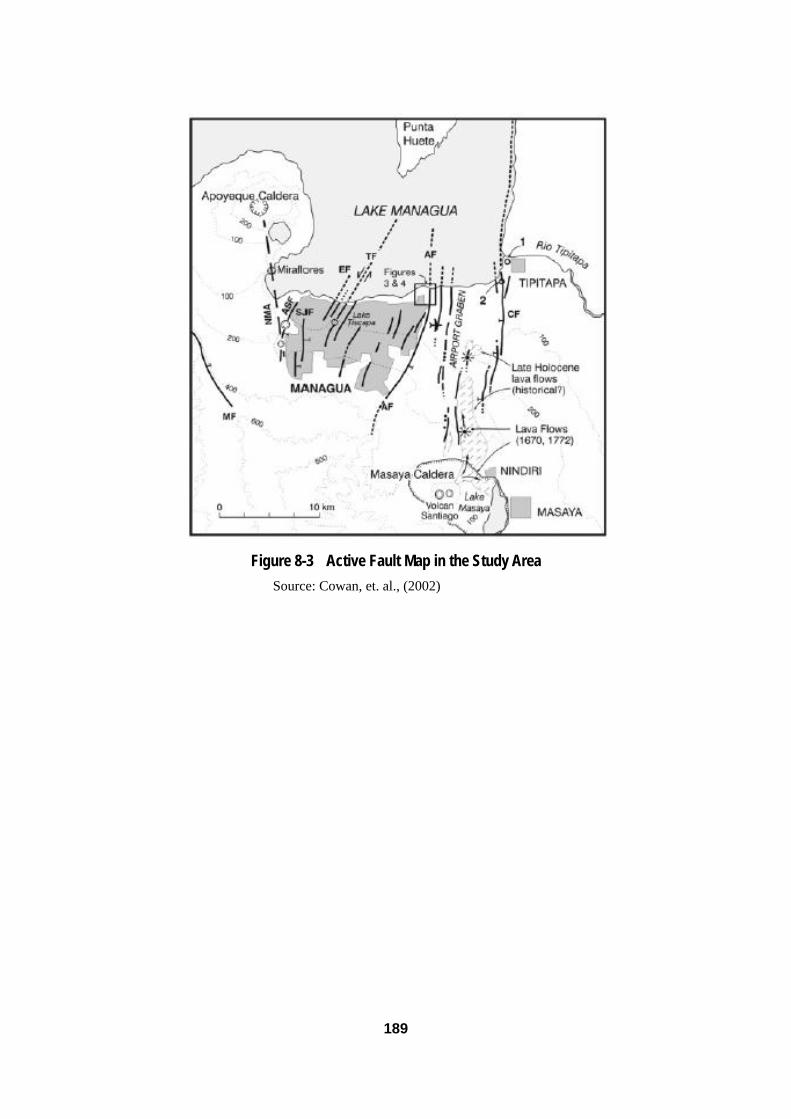
In the Managua area, where there is abundant evidence of recent faulting, a graben (Managua Graben) has formed at a 15-km discontinuity in the strike of the volcanic chain, from Apoyeque Caldera to Masaya Caldera, southeast of the metropolitan area. The Managua Graben and its strike-slip and oblique-normal faults show evidence of mild east–west extension and left-lateral strike slip along a north and northeast trend. The NNE–SSW trending Tiscapa fault and three adjacent parallel faults, all exhibited left-lateral and minor normal displacement during the 23 December 1972, M6.2 earth-quake. Aggregate horizontal movements were in the range of 2 to 38 cm, down to the ESE. In 1931 an M 6.0 earthquake ruptured the Estadio fault, 1.5 km west of the Tis-capa fault, with a maximum observed normal slip of 10 cm and an undefined component of strike slip. The western margin of the Managua Graben is defined by cinder cones and collapse pits that extend south from the Apoyeque Caldera along a trend known as the Nejapa–Miraflores–Apoyeque alignment. The Asososca–Acahualinca and San Ju-das fault zones form east-facing escarpments at this margin of the graben, and Holocene displacements are documented at several localities. The eastern margin of the Mana-gua Graben and Lake Managua are defined by the Cofradia fault. The Cofradia fault forms a prominent escarpment that extends south to the Masaya Caldera. Figure 8-3 is active fault map near Managua and the characteristics of these active faults are summa-rized in Table 8-2.
189
Figure 8-3 Active Fault Map in the Study Area Source: Cowan, et. al., (2002)

190
Table 8-2 Details of Active Faults
Source: Cowan, et. al., (2002)

191
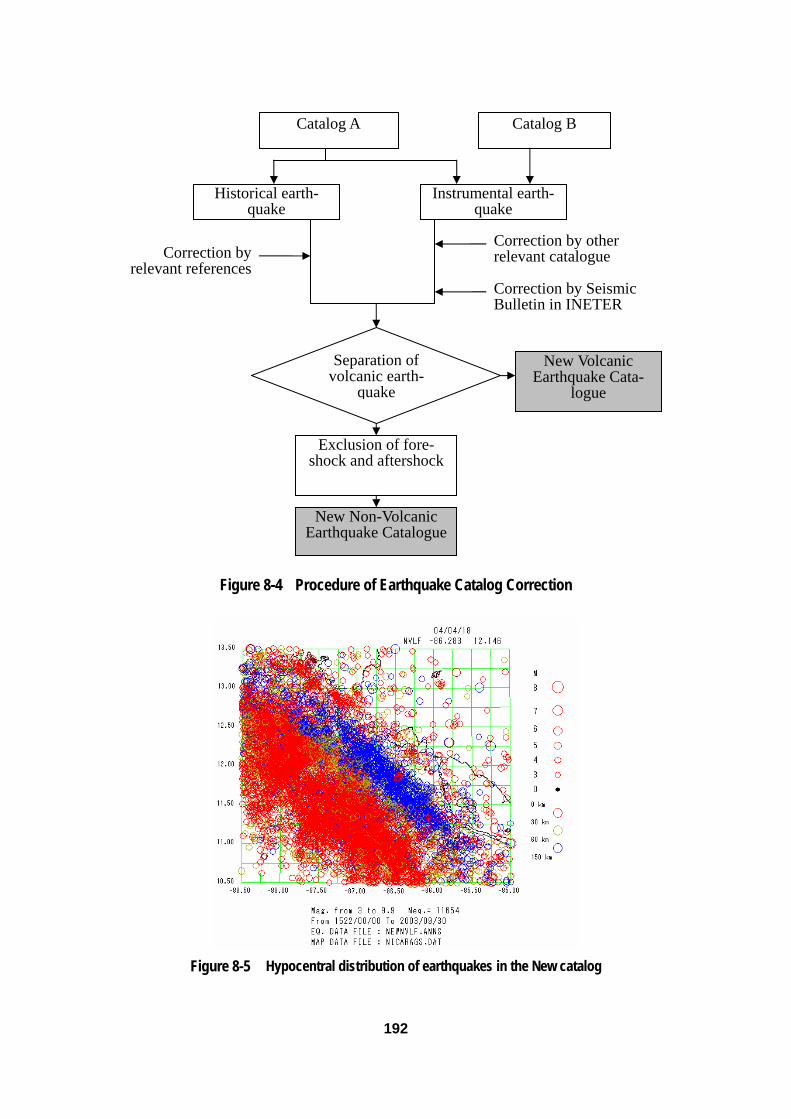
(4) Improvement of Earthquake Catalogue
Following earthquake catalogues are collected and studied:
a) Historical earthquake catalogue by INETER (1505 - 1992; hereafter called Catalog A)
b) Instrumental earthquake catalogue by INETER (1993 - 2001; hereafter called Cata-log B)
c) INETER Boletines Sismologicos (1995 - 2003/09/309) d) ANSS composite earthquake catalog since 1898 - present e) NEIC/USGS ・ NEIC/USGS(PDE) 1979 – present ・ Significant Worldwide Earthquakes (2150B.C. - 1994 A.D.) ・ Mexicco, Central America, Carribean (1900 - 1979) f) CMT-solution catalog by Harvard University
Among these catalogues, a) and b) are the most comprehensive. Therefore these Cata-logs A and B were selected as the base catalog. Other catalogues shown above were used for estimating the historical seismic disaster at the Managua study area in combina-tion with candidate ground motion attenuation curves. Following correction and modi-fication were performed on the base Catalogs A and B.
1) Locations and magnitudes of damaging earthquakes from 1520-1973 in the Catalog A were corrected by the Catalog by Leeds (1974).
2) The Instrumental Earthquakes from 1995 to the present in the above Catalog B were replaced by those in the Seismic Bulletins published by INETER.
3) The earthquakes designated as having an epicenter location error larger than 5 km were all excluded from the earthquakes occurred during 1995 to the present.
4) Volcanic events are separated by excluding the events within the particular radius from the location of historical volcano and focal depth less than 7 km.
5) Events following the main shocks of intermediate to large earthquakes (Mmix lar-ger than 6.0 and depth shallower than 60) and clearly considered as the aftershocks of these main shocks were excluded.
Figure 8-4 illustrates the procedure of correction and modification of the catalogues. Figure 8-5 shows the hypocentral distribution of earthquakes by new earthquake catalog.
192
Figure 8-4 Procedure of Earthquake Catalog Correction
Figure 8-5 Hypocentral distribution of earthquakes in the New catalog
Catalog A Catalog B
Historical earth-quake
Instrumental earth-quake
Correction by relevant references
Correction by Seismic Bulletin in INETER
Exclusion of fore-shock and aftershock
Separation of volcanic earth-
quake
Correction by other relevant catalogue
New Volcanic Earthquake Cata-
logue
New Non-Volcanic Earthquake Catalogue
193
8-1-3 Determination of Scenario Earthquake
Based on the above studies and discussions with experts of the Counterpart, it was de-cided that the deterministic approach would be adopted for the simulation of the seismic motion caused by the active faults and volcanoes. Probabilistic base rock motion also adopted for 100 years return period. Following three (3) types of earthquakes are con-sidered, and finally 5 kinds of scenario earthquakes are estimated and determined.
(1) Earthquake by Active Fault
Estadio and Tiscapa Fault are already moved recently. Following two faults those exist in the east of Managua city are modeled.
- Aeropuerto Fault
- Cofradia Fault
From Figure 8-3 which was compiled by USGS, the surface trace of the faults are as-sumed by two straight line each. The north extension of these two faults can not be observed at the north shoreline of Lake Managua. Therefore, the north end of these faults are probably in Lake Managua. From the view points of the scenario earthquake, we assumed that the north ends of these two faults are extended to the north shoreline of Lake Managua. The magnitudes of these scenario earthquakes are determined through the empirical formula by Donald L. Wells et. al (1994).
(2) Volcanic Earthquake
The largest earthquakes that occurred around following active volcanoes are modeled. Through the study of newly developed volcanic earthquake catalogue, it is found that the magnitude of volcanic earthquakes larger than 5.5 should be reduced 0.5 to 1.0 after the analysis by Dr. Katayama.
- Apoyeque M=6.0 (1852 year)
- Masaya M=6.0 (1772 year)
The location of the scenario earthquake models of the active faults and volcanoes are shown in Figure 8-6. The parameters of these scenarios are tabulated in Table 8-3.
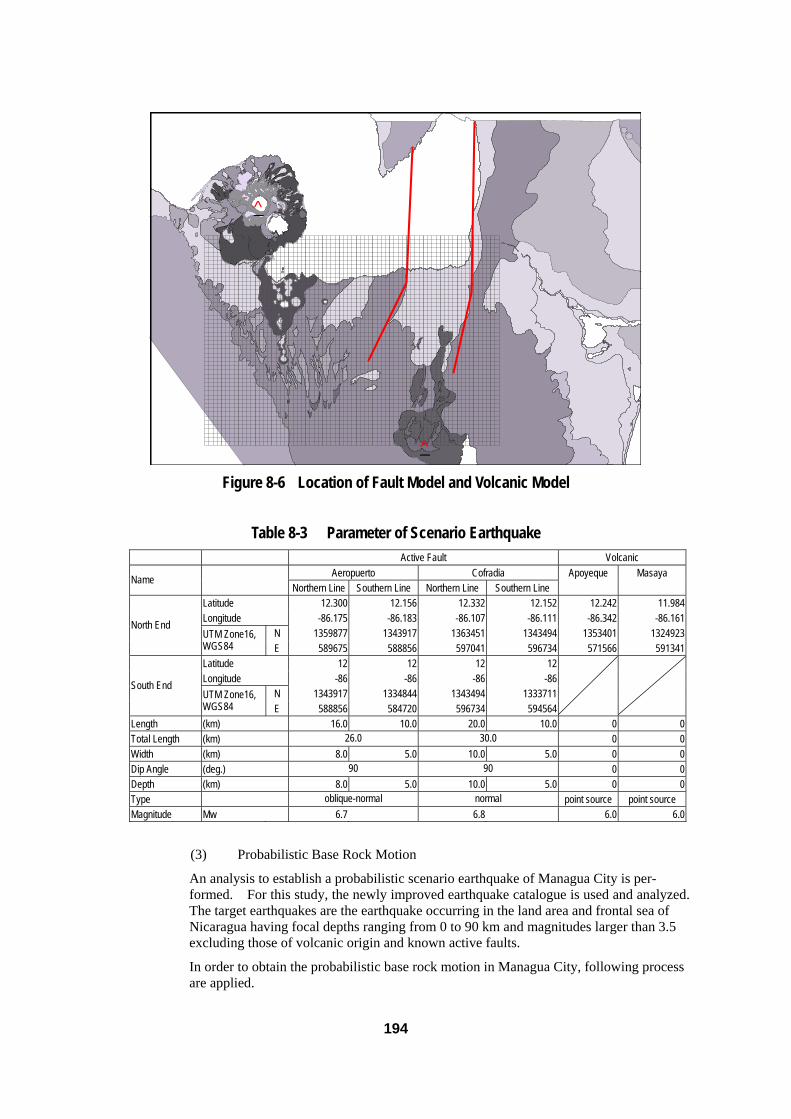
194
_̂
_̂
Figure 8-6 Location of Fault Model and Volcanic Model
Table 8-3 Parameter of Scenario Earthquake Active Fault Volcanic
Aeropuerto Cofradia Apoyeque Masaya Name Northern Line Southern Line Northern Line Southern Line Latitude 12.300 12.156 12.332 12.152 12.242 11.984 Longitude -86.175 -86.183 -86.107 -86.111 -86.342 -86.161
N 1359877 1343917 1363451 1343494 1353401 1324923 North End
UTM Zone16, WGS84 E 589675 588856 597041 596734 571566 591341 Latitude 12 12 12 12 Longitude -86 -86 -86 -86
N 1343917 1334844 1343494 1333711 South End
UTM Zone16, WGS84 E 588856 584720 596734 594564
Length (km) 16.0 10.0 20.0 10.0 0 0 Total Length (km) 26.0 30.0 0 0 Width (km) 8.0 5.0 10.0 5.0 0 0 Dip Angle (deg.) 90 90 0 0 Depth (km) 8.0 5.0 10.0 5.0 0 0 Type oblique-normal normal point source point source Magnitude Mw 6.7 6.8 6.0 6.0
(3) Probabilistic Base Rock Motion
An analysis to establish a probabilistic scenario earthquake of Managua City is per-formed. For this study, the newly improved earthquake catalogue is used and analyzed. The target earthquakes are the earthquake occurring in the land area and frontal sea of Nicaragua having focal depths ranging from 0 to 90 km and magnitudes larger than 3.5 excluding those of volcanic origin and known active faults.
In order to obtain the probabilistic base rock motion in Managua City, following process are applied.
195
(a) B-value analysis
From the analysis, generally standard value of approximately 1.0 is obtained in case that events having moment magnitude less than 4.5 are excluded. Therefore, for the prob-abilistic analysis, events of Mw<4.5 are eliminated.
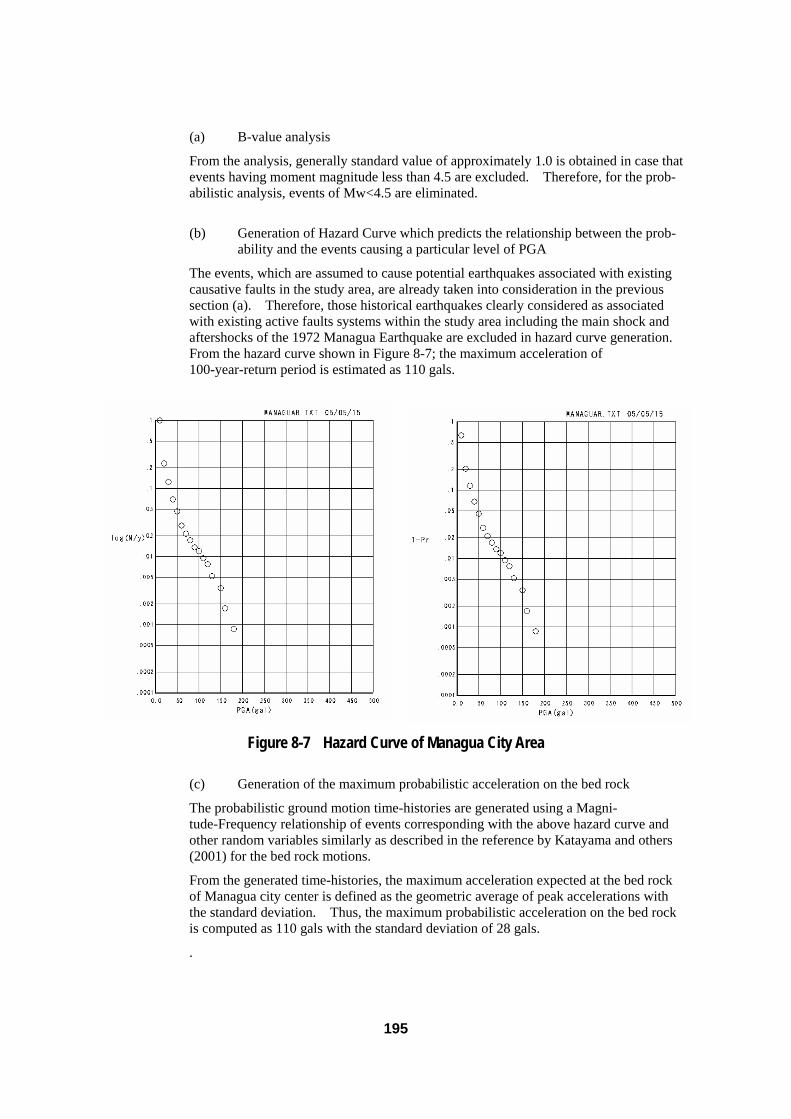
(b) Generation of Hazard Curve which predicts the relationship between the prob-
ability and the events causing a particular level of PGA
The events, which are assumed to cause potential earthquakes associated with existing causative faults in the study area, are already taken into consideration in the previous section (a). Therefore, those historical earthquakes clearly considered as associated with existing active faults systems within the study area including the main shock and aftershocks of the 1972 Managua Earthquake are excluded in hazard curve generation. From the hazard curve shown in Figure 8-7; the maximum acceleration of 100-year-return period is estimated as 110 gals.
Figure 8-7 Hazard Curve of Managua City Area
(c) Generation of the maximum probabilistic acceleration on the bed rock
The probabilistic ground motion time-histories are generated using a Magni-tude-Frequency relationship of events corresponding with the above hazard curve and other random variables similarly as described in the reference by Katayama and others (2001) for the bed rock motions.
From the generated time-histories, the maximum acceleration expected at the bed rock of Managua city center is defined as the geometric average of peak accelerations with the standard deviation. Thus, the maximum probabilistic acceleration on the bed rock is computed as 110 gals with the standard deviation of 28 gals.
.

196
8-1-4 Selection of Attenuation Formula
Some empirical attenuation laws for maximum ground motions are tested whether they can properly explain the past historical disaster and recorded ground motion intensities at Managua city. In selection of attenuation laws, laws which were used in the past for the seismic hazard of Managua, and laws which are the most current and considered as conceivably appropriate in light of characteristics of earthquake source region in and around Nicaragua including Managua city were selected.
The following three types of attenuation laws and application procedures were selected:
1) Sherdan and Turnner (GSHAP 1999)
This attenuation law has been used in the seismic hazard analysis of Central America and also of Managua city and the result is shown in INETER’s Web site. This attenua-tion law consists from two different empirical formula; one is adopted from the paper by Joyner and Boore(1981) which is applied to the events occurring in the upper crust of continental slab and the other is considered as built by the authors and applied to the events occurring at the interface between the subducting plate and continental crust and also to the events within subducting plate (deep earthquakes of depth up to 250 km).
2) Campbell (1989)
This formula is built with the aim to be applied to small to medium magnitude earth-quakes of very shallow depth defined by the local magnitude ML and therefore consid-ered a good candidate attenuation law for those earthquakes of volcanic origin which usually occur in very shallow depth and with small magnitude such as those detected in Managua. This law assumes the point source in calculating the source-site distance.
3) Combined formula of Joyner and Boore (1981) and Young et al (1997)
This formula is newly developed by the following scheme of combined formula pro-posed by Sherdan and Turnner (GSHAP 1999). But the first and second attenuation law were replaced by those given by Joyner and Boore (1981) and Young et al (1997), which are tractable in professional papers for the method and data used. Especially the latter empirical law has been built using some strong records obtained at earthquakes occurred in Central and South America. The application rule of this attenuation law is similar to the previous one by Sherdan and Turnner (GSHAP 1999).
Using these laws, expected maximum acceleration and MM Intensity at Managua by historical earthquakes from the Significant Earthquake Catalog compiled by ANSS (Advanced Seismic System; USGS) were calculated and compared with the reported disaster records. Detailed procedure and result of the study are presented in the 2-1 Earthquake in Manual 2 Hazard Mapping. Non-volcanic and volcanic events were re-spectively calculated their maximum accelerations by these candidate laws. Finally, it is concluded that the new combined Joyner-Boore and Young law is considered as ap-propriately applicable to the recorded accelerations of both non-volcanic and volcanic events. The equation is expressed as follows:
For the events whose focal depth is shallower than 15 km,
)3.7(00255.)3.7(log249.02.1log 2222 +−+−+−= DDMwA ,
and for the events whose focal depth is deeper than 15 km,
FDeRMwA Mw 00607.)7818.1ln(552.2414.12418.0 554.1 ++−+=
TZ3846.+
where D : horizontal distance to surface projection of fault (km)

197
0=TZ for interface events
1=TZ for intra-slab events
)4(105.0 −∗= MwRD
if 37>RD ; 37=RD
)( 221 FDDR +=
if RDR < ; RDR =1
if RDR ≥ RDRR −=1
Here, conversion rule of Magnitudes used to finally obtain the Moment Magnitude Mw is as follows:
From ML to Ms: 63.0/)8.001.08.0( 2 −−= MLMLMs
From Mb to Ms: 95.374.1 −= MbMs
From Ms to Mw: if 6.6≤Ms then 43.23/2 += MsMw ,
and if 6.6>Ms then MsMw = .
When the type of M is unknown, M is assumed as Ms.
Log a= -1.02 + 0.249 M - log R - 0.00255 R
Where
a: peak ground acceleration (G)
M: moment magnitude
R2 = d2 + 7.32
d: horizontal distance to surface projection of fault (km)
8-1-5 Ground Model for Subsurface Amplification
(1) Topography of Study Area
Most of the city of Managua is on a surface dipping a gentle degree towards the north. A several north flowing drains flow into Lake Managua. All are small and maximum depth of valley is less than 20 m in the city. In southern part of the Study area, deeper valley is common in the hill area lying west of Masaya Caldera. The gently north dip-ping surface of Managua city is interrupted in several places by low hills. Most of them are clearly recent volcanic origin. Tiscapa in the center of the city, the hill en-closing Lake Asosoca on the west, and the Nejapa pits southwest of Managua are exam-ples. This surface appears to be graded to Masaya Caldera and other volcanic centers.
The southern part of Study area shows steep hilly topography continued from the Mat-eare mountains which show quite clear lineament of Mateare fault ranging NW to SE. Town of El Crucero is located on the crossing point of the Mateare Mountains and the Managua mountains and on relatively gentle hilly topography around 900 m elevation. The Managua Mountains stretch towards east from the town El Crucero, also show clear lineament and peter out in Managua Graben near Masaya. Ridges of east part of the Managua Mountains are very thin and steep. Figure 8-8 is the existing topographical map of the Study area.
198
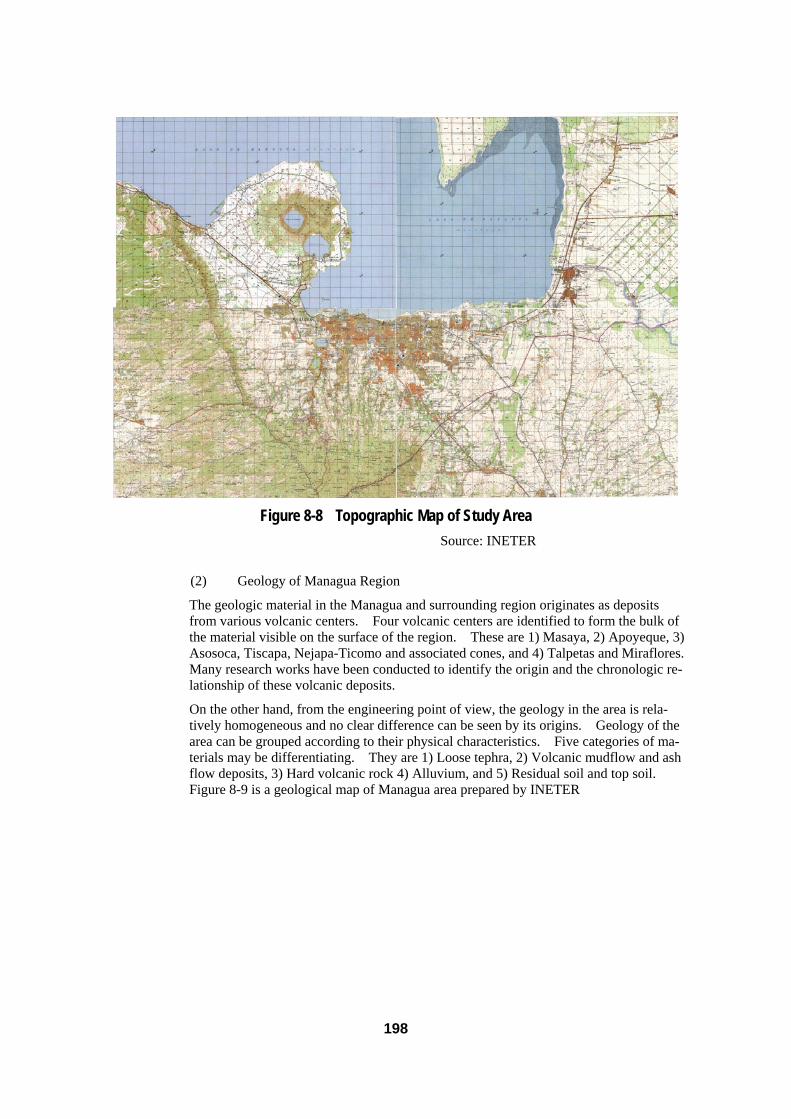
Figure 8-8 Topographic Map of Study Area
Source: INETER
(2) Geology of Managua Region
The geologic material in the Managua and surrounding region originates as deposits from various volcanic centers. Four volcanic centers are identified to form the bulk of the material visible on the surface of the region. These are 1) Masaya, 2) Apoyeque, 3) Asosoca, Tiscapa, Nejapa-Ticomo and associated cones, and 4) Talpetas and Miraflores. Many research works have been conducted to identify the origin and the chronologic re-lationship of these volcanic deposits.
On the other hand, from the engineering point of view, the geology in the area is rela-tively homogeneous and no clear difference can be seen by its origins. Geology of the area can be grouped according to their physical characteristics. Five categories of ma-terials may be differentiating. They are 1) Loose tephra, 2) Volcanic mudflow and ash flow deposits, 3) Hard volcanic rock 4) Alluvium, and 5) Residual soil and top soil. Figure 8-9 is a geological map of Managua area prepared by INETER

199
0 4 8 12 162Kilometers
Legend
<all other values>
LITOLOGIA
Agua
Andesita
Andesita y toba
Areniscas, Tobas, Margas, Lutitas
Basalto
Basalto y toba
Bloques de lava, toba y suelo
Dacita
Escoria
Escoria, Tobas, Basalto
Escorias, cenizas y lavas
Ignimbrita
Lava, tobas y p・ez
P・ez
Sedimentos
Sedimentos coluviales
Sedimentos lacustres
Toba ciner咜ica
Toba de P・ez (P・ez Apoyo)
Tobas ciner咜icas
Tobas ciner咜icas y escorias
Tobas soldadas
Tobas y suelos
Tobas, escoria y lavas
Tobas, p・ez y escorias
-
Figure 8-9 Geological Map of the Study Area
Source: INETER
(3) Compilation of Existing Geological Data
Geological data is compiled based on existing 170 boreholes data. The almost all borehole data is located on the central Managua city area. In the meanwhile, there is not any borehole data on the other area. Therefore, ground characteristics of the area except Managua city area is estimated based on the Managua city area’s data.
Four geological profiles are prepared in East-West direction and three profiles in South-North direction based on the existing surface geological map with the existing borehole data. Location of these profiles is shown on Figure 8-10. The grid system that is determined on the preceding paragraph and location of the existing boreholes are also shown on the Figure. Examples of the profiles are shown on Figure 8-11.

200
AB
C
D
1 2 3
Figure 8-10 Location of Geological Profiles
Profile C
E-12 E-1 F-34 F-35F-36
F-2 G-1
G-3 G-4G-5
H-1 H-2 H-4 H-5
Fault
0 1 2 3km
(m)
Fault
88 8
8
8
53
56
32
7
363
5 3
4
65
4 3
2 3
5
BasaltTuff, Pumice, Scoria
AluviumTuff, Pumice, Scoria
Aluvium
30405060708090
100110120
130140150160170180190200
2010
0
30405060708090
100110120
130140150160170180190200
01020
Figure 8-11 Example of Geological Profile (Profile C)
201
Profile 2
0 1 2 3km
(m)
F-15
Lake
B-8
B-12
B-7
B-9
B-6
B-20
8
8
8
8
8
8
8
5
5
4
3
5
4
5
3
5
5
5
3
30405060708090
100110120
130140150160170180190200
01020
210220
230240250260270280290300310320
330340350360
370380390400410420
430440450460
30405060708090
100110120
130140150160170180190200
2010
0
210220
230240250260270280290300310320
330340350360
370380390400410420
430440450460
Tuff, Pumice, Scoria
B-19
F-1 F-36
F-20
F-21
Figure 8-12 Example of Geological Profiles (Profile 2)
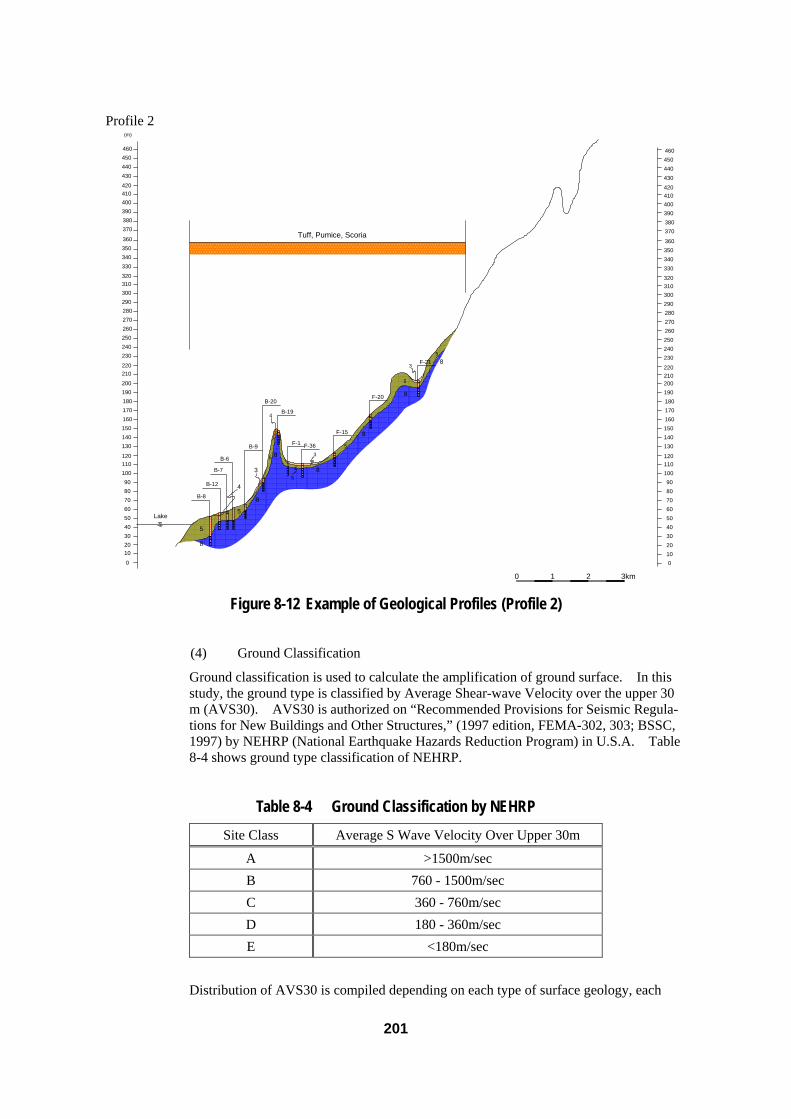
(4) Ground Classification
Ground classification is used to calculate the amplification of ground surface. In this study, the ground type is classified by Average Shear-wave Velocity over the upper 30 m (AVS30). AVS30 is authorized on “Recommended Provisions for Seismic Regula-tions for New Buildings and Other Structures,” (1997 edition, FEMA-302, 303; BSSC, 1997) by NEHRP (National Earthquake Hazards Reduction Program) in U.S.A. Table 8-4 shows ground type classification of NEHRP.
Table 8-4 Ground Classification by NEHRP Site Class Average S Wave Velocity Over Upper 30m
A >1500m/sec B 760 - 1500m/sec C 360 - 760m/sec D 180 - 360m/sec E <180m/sec
Distribution of AVS30 is compiled depending on each type of surface geology, each

202
type of soil that is observed on the boring core samples and each depth of distribution of Shear-wave velocity. Figure 8-13 shows distribution of the AVS30 of borehole point on each type of surface geology.
Distribution of AVS30 depending on Each Surface Geology
0
100
200
300
400
500
600
700
800
0 1 2 3 4
AV
S30
(m/s
ec)
1: Sedimentos (Quaternary)2: Tobas, Pomez y Escorias3: Escoria, Tobas, Basalto
Surface Geology
Figure 8-13 Distribution of AVS30 on Each Type of Surface Geology
As the result of the study, the following points are recognized.
As the distribution of the average Shear-wave velocity of each layer that is specified as seven layers based on the existing borehole data, there are not distinctive features except few locations.
AVS30 of almost all existing borehole data shows from Vs=500m/sec to 700m/sec, which is corresponded to C class in NEHRP classification (refer to Table 8-4). Therefore, AVS30 will be irrelevant to surface geological type in the study area.
There are locally some boreholes showing Vs of 300m/sec (it is corresponded to D class in NEHRP classification) on old crater at 1 km north from Asososca Lake.
The layer that is considered as base rock is found on average 10m depth on almost all borehole points. The base rock layer at the borehole point showing Vs=300m/sec is found deeper than 30m. Therefore, Vs of this point is lower than other borehole points.
The cross section shows that the slope angle increases from the Managua Lake to the mountain area. However AVS30 is not changed by the landform.
No relevance was found between distribution of surface geology and geological strati-graphy of existing borehole data.
Thus, the preparation of the ground model by the distribution of the surface geology is found difficult. Therefore, the ground type is not classified to apply for the NEHRP classification by the geological information, but by geographic information.
(5) Ground Model
Ground type is classified five types as Lower plane, Middle plane, Hill area, Mountain
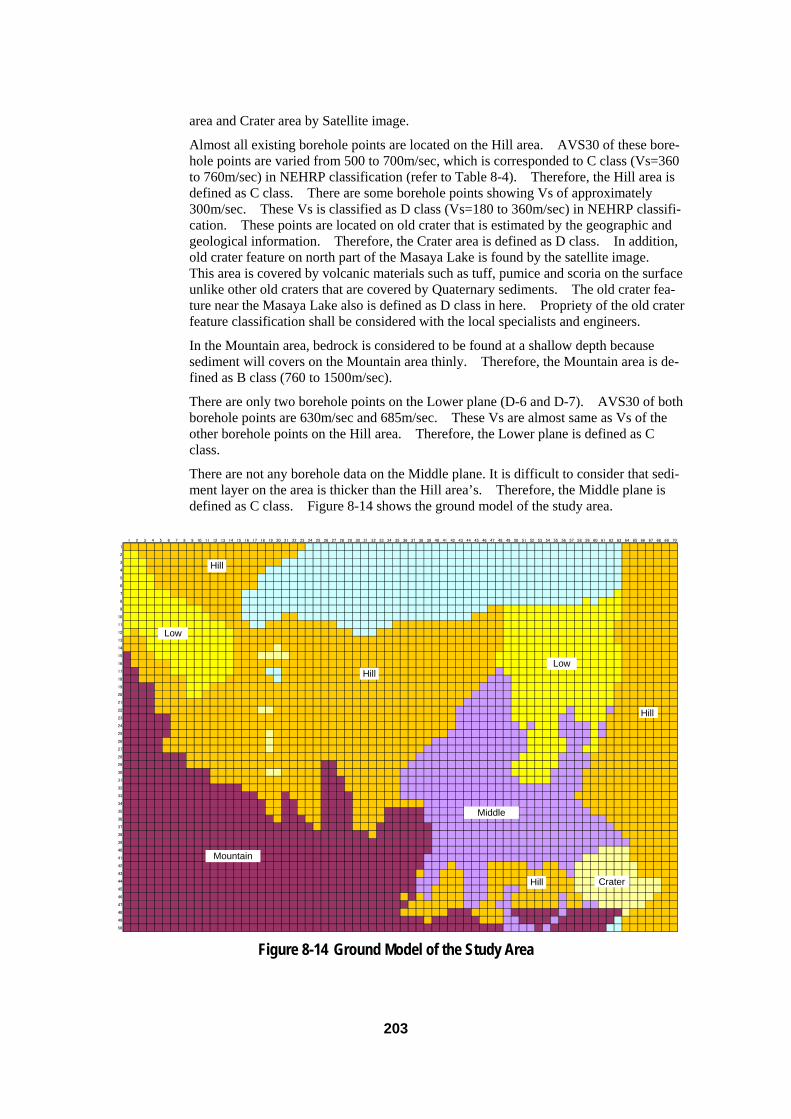
203
area and Crater area by Satellite image.
Almost all existing borehole points are located on the Hill area. AVS30 of these bore-hole points are varied from 500 to 700m/sec, which is corresponded to C class (Vs=360 to 760m/sec) in NEHRP classification (refer to Table 8-4). Therefore, the Hill area is defined as C class. There are some borehole points showing Vs of approximately 300m/sec. These Vs is classified as D class (Vs=180 to 360m/sec) in NEHRP classifi-cation. These points are located on old crater that is estimated by the geographic and geological information. Therefore, the Crater area is defined as D class. In addition, old crater feature on north part of the Masaya Lake is found by the satellite image. This area is covered by volcanic materials such as tuff, pumice and scoria on the surface unlike other old craters that are covered by Quaternary sediments. The old crater fea-ture near the Masaya Lake also is defined as D class in here. Propriety of the old crater feature classification shall be considered with the local specialists and engineers.
In the Mountain area, bedrock is considered to be found at a shallow depth because sediment will covers on the Mountain area thinly. Therefore, the Mountain area is de-fined as B class (760 to 1500m/sec).
There are only two borehole points on the Lower plane (D-6 and D-7). AVS30 of both borehole points are 630m/sec and 685m/sec. These Vs are almost same as Vs of the other borehole points on the Hill area. Therefore, the Lower plane is defined as C class.
There are not any borehole data on the Middle plane. It is difficult to consider that sedi-ment layer on the area is thicker than the Hill area’s. Therefore, the Middle plane is defined as C class. Figure 8-14 shows the ground model of the study area.
1 2 3 4 5 6 7 8 9 10 11 12 13 14 15 16 17 18 19 20 21 22 23 24 25 26 27 28 29 30 31 32 33 34 35 36 37 38 39 40 41 42 43 44 45 46 47 48 49 50 51 52 53 54 55 56 57 58 59 60 61 62 63 64 65 66 67 68 69 70
1
2
3
4
5
6
7
8
9
10
11
12
13
14
15
16
17
18
19
20
21
22
23
24
25
26
27
28
29
30
31
32
33
34
35
36
37
38
39
40
41
42
43
44
45
46
47
48
49
50
Hill
Hill
Hill
Mountain
Middle
Low
Low
CraterHill
Figure 8-14 Ground Model of the Study Area

204
8-1-6 Development of Simulation Software
The flow chart of seismic hazard simulation is shown on Figure 8-15.
Fau ltM odels
500m gridDatabase
ScenarioEarthquakes
SubsurfaceG roundM odel
Database
G eom orphologica l D ata
BaserockM otion
Database
A m plificationM odule
SurfaceM otion
Database
O ff-line
O ff-lineBaserock M otion
M odule
Figure 8-15 Flow Chart of Seismic Hazard Simulation
In the chart, “Base rock Motion Module” and “Amplification Module” are called as simulation software. Base rock Motion Module calculates attenuation. Meanwhile, Amplification Module calculates amplification of the ground surface.
As described in Section 8-1-4, the following formulas are used to calculate attenuation.
In case of earthquake by active fault or volcano, the following formula (Joyner and
Boore (1981)) is applied.
205
(km) plane rupture theof projection surface the todistance horizontalclosest :magnitudemoment :
(g)on accelerati :
3.700255.03.7log249.002.1)log( 2222
DMA
DDMA +−+−+−=
In case of probabilistic earthquake, the attenuation formula is not applied. Bed rock
motion for amplification calculation is equally set as 138 gals for all grids.
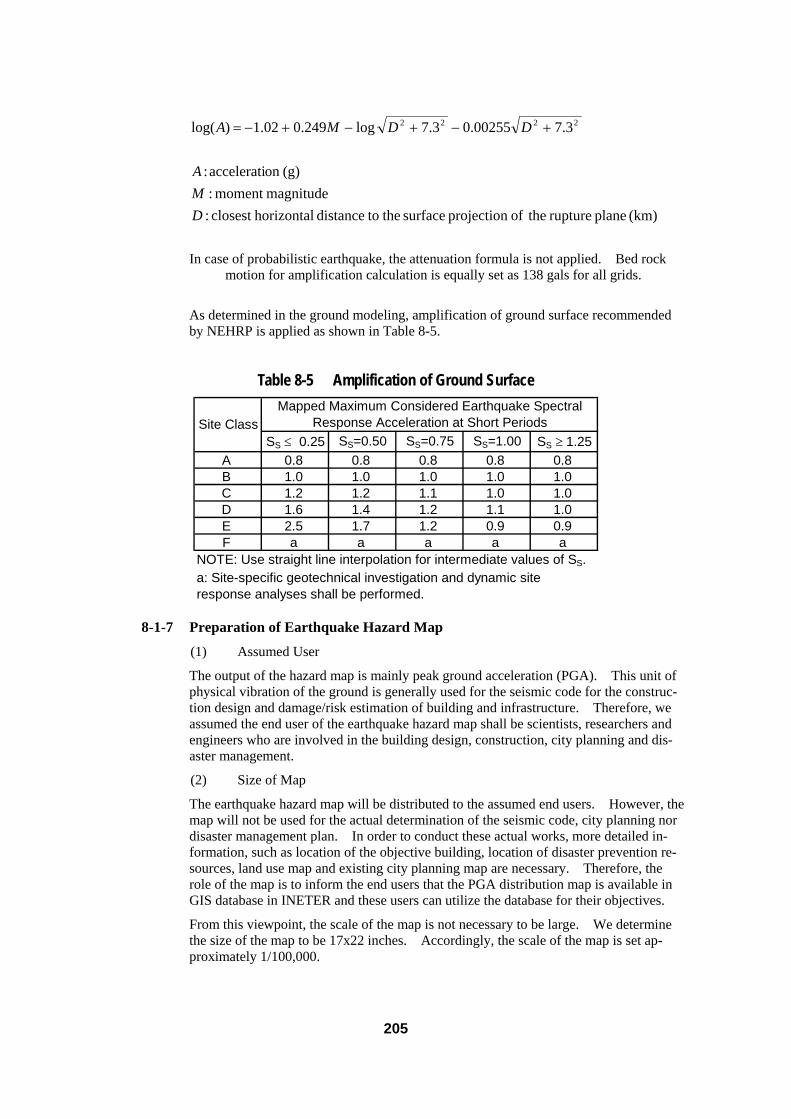
As determined in the ground modeling, amplification of ground surface recommended by NEHRP is applied as shown in Table 8-5.
Table 8-5 Amplification of Ground Surface
SS ≤ 0.25 SS=0.50 SS=0.75 SS=1.00 SS ≥ 1.25A 0.8 0.8 0.8 0.8 0.8B 1.0 1.0 1.0 1.0 1.0C 1.2 1.2 1.1 1.0 1.0D 1.6 1.4 1.2 1.1 1.0E 2.5 1.7 1.2 0.9 0.9F a a a a a
Mapped Maximum Considered Earthquake SpectralResponse Acceleration at Short PeriodsSite Class
a: Site-specific geotechnical investigation and dynamic siteresponse analyses shall be performed.
NOTE: Use straight line interpolation for intermediate values of SS.
8-1-7 Preparation of Earthquake Hazard Map
(1) Assumed User
The output of the hazard map is mainly peak ground acceleration (PGA). This unit of physical vibration of the ground is generally used for the seismic code for the construc-tion design and damage/risk estimation of building and infrastructure. Therefore, we assumed the end user of the earthquake hazard map shall be scientists, researchers and engineers who are involved in the building design, construction, city planning and dis-aster management.
(2) Size of Map
The earthquake hazard map will be distributed to the assumed end users. However, the map will not be used for the actual determination of the seismic code, city planning nor disaster management plan. In order to conduct these actual works, more detailed in-formation, such as location of the objective building, location of disaster prevention re-sources, land use map and existing city planning map are necessary. Therefore, the role of the map is to inform the end users that the PGA distribution map is available in GIS database in INETER and these users can utilize the database for their objectives.
From this viewpoint, the scale of the map is not necessary to be large. We determine the size of the map to be 17x22 inches. Accordingly, the scale of the map is set ap-proximately 1/100,000.

206
(3) Contents of Hazard Map
Based on the above assumption of the end users, following contents are determined through the discussion with the counterpart.
- Distribution of peak ground acceleration (PGA)
- Earthquake source parameters
- Adopted attenuation formula
- Meaning of PGA in terms of seismic intensity.
The meaning of PGA is not easy to understand for the end users except the seismic de-sign engineer. Therefore, a description of the PGA in terms of the seismic intensity (MMI) is presented in the map. The seismic intensity (MMI) scale is based on human observation of shaking and damage during an earthquake. The relation of seismic in-tensity and physical parameters of seismic waves, such as acceleration, velocity and spectral intensity, is studied by many researchers. In the map, the consideration of Trifunac and Brady (1975) is adopted. The relation between PGA and MMI is shown in Figure 8-16.
Figure 8-16 Relation between Peak Ground Acceleration (PGA) and Seismic Intensity (MMI)
Source: Trifunac and Brady (1975)
(4) Example of Hazard Map
Figure 8-17 shows an example of earthquake hazard map which is in case of Cofradia Fault.

207
Figure 8-17 Example of Earthquake Hazard Map (Cofradia Fault)
In addition to the map shown in Figure 8-17, four other scenarios are mapped and printed 500 copies each, thus 2,500 sheets total.
Reference Manual for Zonation on Seismic Geotechnical Hazards (Revised Version) (1999), Technical Committee
for Earthquake Geotechnical Engineering, TC4, ISSMGE Shah, H., et. al, (1975), A Study of Seismic Risk for Nicaragua, Part I, The John A. Blume Earthquake
Research Center, Department of Civil Engineering, Stanford University. Brown, Jr., R.D., Ward, P. L., Plafkeret, G., (1973), Geologic and Seismologic Aspects of the Managua,
Nicaragua, Earthquake of December 23, 1972, Geologic Survey Professional Paper 838. Schmoll, H., Krushensky, R., Dobrovolny, E. (1975), Geologic Considerations for Redevelopment
Planning of Managua, Nicaragua, Following the 1972 Earthquake, Geologic Survey Professional Paper 914.
Hernandez, Z., Atakan, K., Havskov, J. (1994), Seismicity and Tectonics near Managua, Nicaragua, Institute of Solid Earth Physics, University of Bergen, Norway.
Bermudez,W. M., Blandon, E. N. (1992), Geological Framework of Earthquake Occurrence in Nicara-gua, Central America, Journal of the Geological Society of Japan, Vol. 98, No.2, P. 165-176.
Cowan, H., et. al. (2002), Late Holocene Earthquakes on the Aeropuerto Fault, Managua, Nicaragua, Bulletin of Seismological Society of America, Vol. 92, No. 5, pp. 1694-1707
Cowan, H., et. al. (2000), Map and Database of Quaternary Faults in the Vicinity of Managua, Nicara-gua, U.S. Department of the Interior, U.S. Geological Survey.
Kaye M. Shedlock and James G. Tanner, Seismic Hazard Map of the Western Hemisphere, External Project Mexico-C.America-Carribean-America (PAIGH-IDRC)