
Ficci frames 2015,
49
-
Upload
vaibhav-dalvi -
Category
Marketing
-
view
62 -
download
1
Transcript of Ficci frames 2015,

Overall Industry Size (INR Bn)*
2008 2009 2010 2011 2012 2013 2014
Growth in 2014
over 2013
2015P 2016P 2017P 2018P 22019PCAGR(2014-2019P)
Television 241.0 257.0 297.0 329.0 370.1 417.2 474.9 13.8% 543.2 631.2 739.6 854.6 975.5 15.5%
Print 172.0 175.2 192.9 208.8 224.1 243.1 263.4 8.3% 284.5 307.1 331.9 358.0 386.8 8.0%
Film 104.4 89.3 83.3 92.9 112.4 125.3 126.4 0.9% 136.3 155.6 170.7 186.3 204.0 10.0%
Radio 8.4 8.3 10.0 11.5 12.7 14.6 17.2 17.6% 19.6 22.3 27.0 32.7 39.5 18.1%
Music 7.4 7.8 8.6 9.0 10.6 9.6 9.8 2.3% 10.4 12.0 14.2 16.9 18.9 14.0 %
Out of Home 16.1 13.7 16.5 17.8 18.2 19.3 22.0 14.0% 24.4 27.1 29.6 32.2 35.1 9.8 %
Animation and VFX
17.5 20.1 23.7 31.0 35.3 39.7 44.9 13.1% 51.0 58.7 68.5 80.6 95.5 16.3%
Gaming 7.0 8.0 10.0 13.0 15.3 19.2 23.5 22.4% 27.5 31.8 35.4 40.0 45.8 14.3%
Digital Advertising
6.0 8.0 10.0 15.4 21.7 30.1 43.5 44.5% 62.5 84.0 115.3 138.2 162.5 30.2%
Total 580 587 652 728 821 918 1,026 11.7% 1159 1330 1532 1740 1964 13.9%
Source: KPMG analysis and industry discussions
Indian Media and Entertainment : Industry size & Projections
Overall Industry Size (INR Bn)*
2008 2009 2010 2011 2012 2013 2014
Growth in 2014
over 2013
2015P 2016P 2017P 2018P 2019PCAGR(2014-2019P)
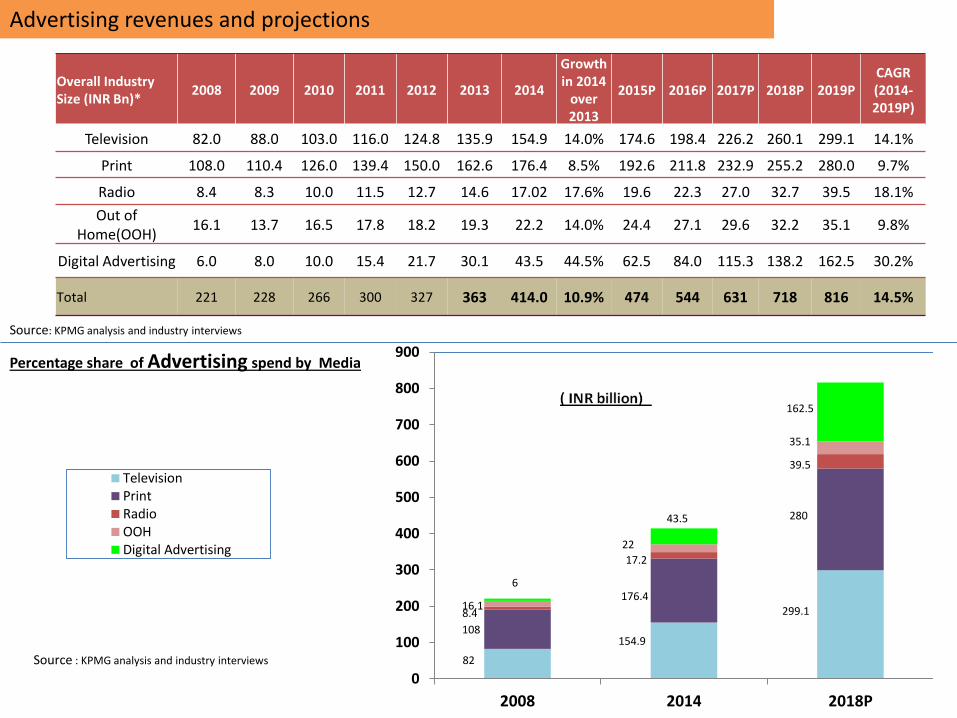
Television 82.0 88.0 103.0 116.0 124.8 135.9 154.9 14.0% 174.6 198.4 226.2 260.1 299.1 14.1%
Print 108.0 110.4 126.0 139.4 150.0 162.6 176.4 8.5% 192.6 211.8 232.9 255.2 280.0 9.7%
Radio 8.4 8.3 10.0 11.5 12.7 14.6 17.02 17.6% 19.6 22.3 27.0 32.7 39.5 18.1%
Out of Home(OOH)
16.1 13.7 16.5 17.8 18.2 19.3 22.2 14.0% 24.4 27.1 29.6 32.2 35.1 9.8%
Digital Advertising 6.0 8.0 10.0 15.4 21.7 30.1 43.5 44.5% 62.5 84.0 115.3 138.2 162.5 30.2%
Total 221 228 266 300 327 363 414.0 10.9% 474 544 631 718 816 14.5%
82
154.9
299.1
108
176.4
280
8.4
17.2
39.5
16.1
22
35.1
6
43.5
162.5
0
100
200
300
400
500
600
700
800
900
2008 2014 2018P
TelevisionPrintRadioOOHDigital Advertising
Source : KPMG analysis and industry interviews
Source: KPMG analysis and industry interviews
Percentage share of Advertising spend by Media
Advertising revenues and projections
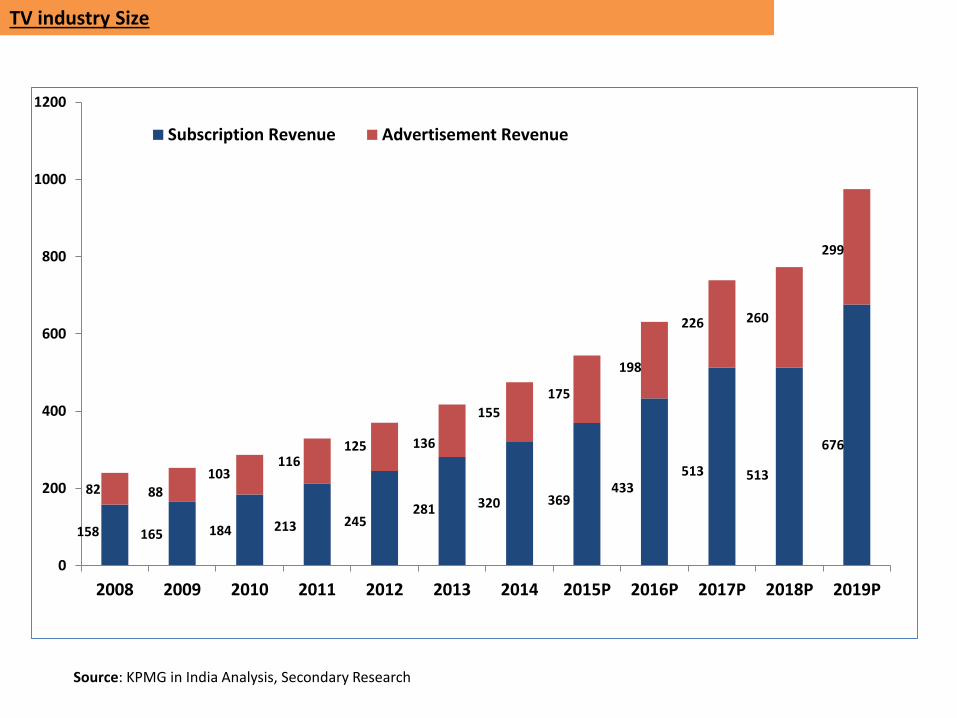
158 165 184 213 245281 320 369
433513 513
676
82 88103
116125 136
155
175
198
226 260
299
0
200
400
600
800
1000
1200
2008 2009 2010 2011 2012 2013 2014 2015P 2016P 2017P 2018P 2019P
Subscription Revenue Advertisement Revenue
Source: KPMG in India Analysis, Secondary Research
TV industry Size

Source: KPMG Analysis, Secondary Research
161
168
196
80%
82%
90%
74%
79%
84%
89%
94%
99%
0
50
100
150
200
250
2013 2014 2019p
TV House holds Paid C&S Penetration of Tv Household %2
INR
Bill
ion
Source: KPMG Analysis, Secondary Research
% P
erce
nta
ge
TV households and C&S penetration of TV households

65 74 69 68 7055
275
5 5
5
619 25
29
45
67
85 9094
28
31
3437
4048 61 72
7476
8
8
99
10
1111
1212
12
0
20
40
60
80
100
120
140
160
180
200
2010 2011 2012 2013 2014E 2015P 2016P 2017P 2018P 2019P
Analog Cable Digital cable DTH Other Digital
105119
C&S subscribers by platform
Source: KPMG Analysis, Secondary ResearchNote : (1)DTH figures are net of chum
(2) Figures are rounded to the nearest integer and may not add up exactly to column totals

125 136155
175198
226260
2995769
7590
114
145
174
201
0
100
200
300
400
500
600
2012 2013 2014E 2015p 2016p 2017p 2018p 2019p
Ad Revenues Sub Revenues
INR
Bill
ion
Source: KPMG in India analysis, Industry discussions conducted by KPMG in India
% P
erce
nta
ge
Broadcaster Industry size

31.2%
17.9%
13.6%
7.3%
3.2%
3.7%
3.7%
3.7%
2.4% 1.8%
1.3%
0.9%0.1%
9.4%
Viewership share by genre - 2014
Hindi GEC
Regional GEC
Hindi Movies
Kids
Music
Regional News
Regional Movies
Hindi News
Sports
Regional Music
Infotainment
English Entertainment
English News
Other
Viewership share by genre - 2014
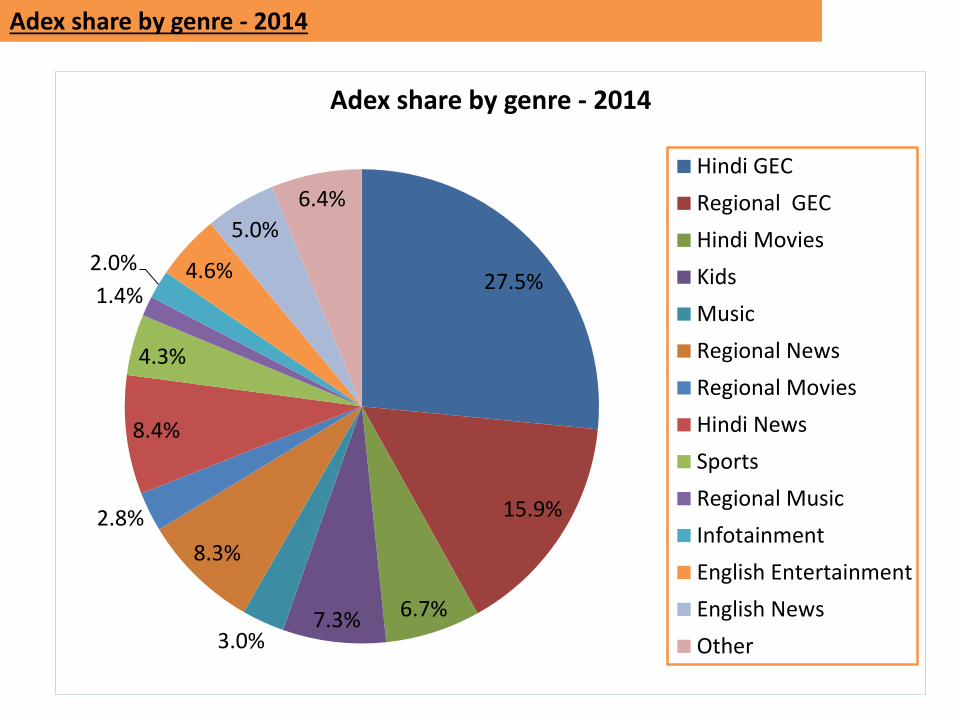
27.5%
15.9%
6.7%7.3%3.0%
8.3%
2.8%
8.4%
4.3%
1.4%
2.0% 4.6%
5.0%
6.4%
Adex share by genre - 2014
Hindi GEC
Regional GEC
Hindi Movies
Kids
Music
Regional News
Regional Movies
Hindi News
Sports
Regional Music
Infotainment
English Entertainment
English News
Other
Adex share by genre - 2014
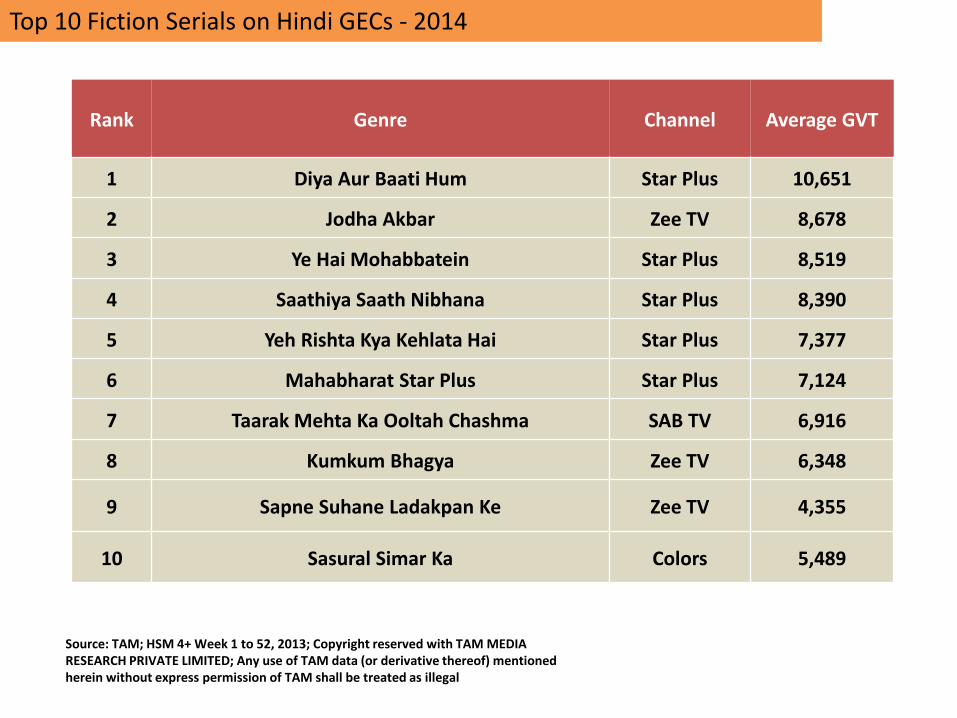
Rank Genre Channel Average GVT
1 Diya Aur Baati Hum Star Plus 10,651
2 Jodha Akbar Zee TV 8,678
3 Ye Hai Mohabbatein Star Plus 8,519
4 Saathiya Saath Nibhana Star Plus 8,390
5 Yeh Rishta Kya Kehlata Hai Star Plus 7,377
6 Mahabharat Star Plus Star Plus 7,124
7 Taarak Mehta Ka Ooltah Chashma SAB TV 6,916
8 Kumkum Bhagya Zee TV 6,348
9 Sapne Suhane Ladakpan Ke Zee TV 4,355
10 Sasural Simar Ka Colors 5,489
Source: TAM; HSM 4+ Week 1 to 52, 2013; Copyright reserved with TAM MEDIA RESEARCH PRIVATE LIMITED; Any use of TAM data (or derivative thereof) mentioned herein without express permission of TAM shall be treated as illegal
Top 10 Fiction Serials on Hindi GECs - 2014

Rank Genre Channel Average GVT
1 Comedy Nights With Kapil Colors 7,090
2 India's Got Talent 5 Colors 6,829
3 Fear Factor Khatron Ke Khiladi Colors 6,107
4 Dance India Dance Little Masters 3 Zee TV 4,978
5 Bigg Boss 8 Colors 4,837
6 Jhalak Dikhhla Jaa Colors 4,521
7 Dance India Dance 4 Zee TV 4,095
8 Kaun Banega Crorepati Sony 3,511
9 Nach Baliye 6 Star Plus 1,470
10 Made In India Star Plus 1,315
Top 10 Non-Fiction Serials on Hindi GECs - 2014
Source: TAM; HSM 4+ Week 1 to 52, 2013; Copyright reserved with TAM MEDIA RESEARCH PRIVATE LIMITED; Any use of TAM data (or derivative thereof) mentioned herein without express permission of TAM shall be treated as illegal
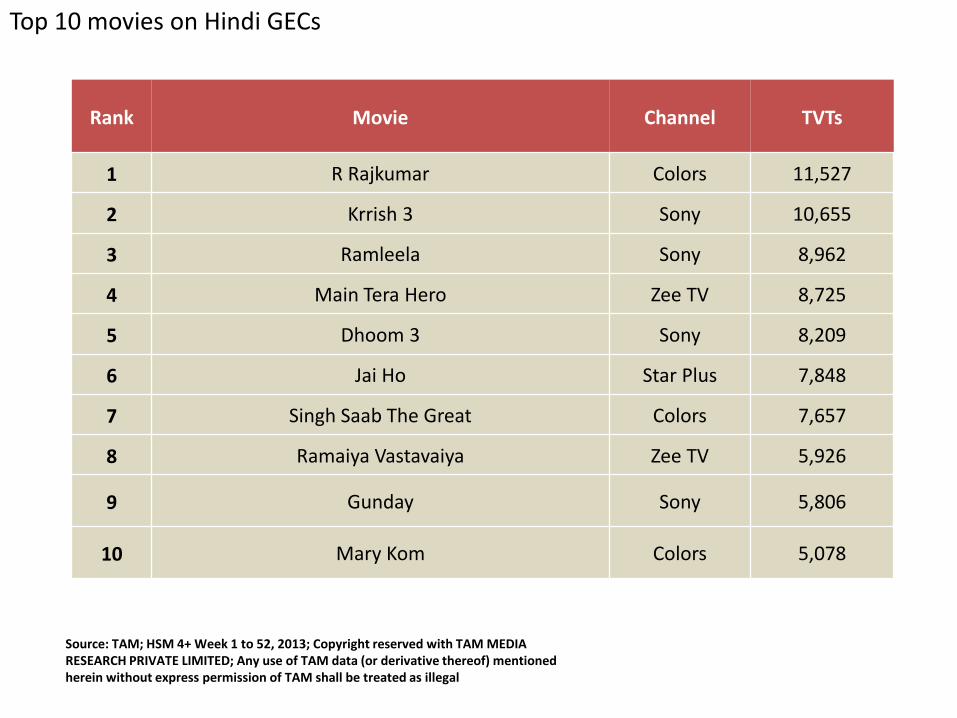
Rank Movie Channel TVTs
1 R Rajkumar Colors 11,527
2 Krrish 3 Sony 10,655
3 Ramleela Sony 8,962
4 Main Tera Hero Zee TV 8,725
5 Dhoom 3 Sony 8,209
6 Jai Ho Star Plus 7,848
7 Singh Saab The Great Colors 7,657
8 Ramaiya Vastavaiya Zee TV 5,926
9 Gunday Sony 5,806
10 Mary Kom Colors 5,078
Top 10 movies on Hindi GECs
Source: TAM; HSM 4+ Week 1 to 52, 2013; Copyright reserved with TAM MEDIA RESEARCH PRIVATE LIMITED; Any use of TAM data (or derivative thereof) mentioned herein without express permission of TAM shall be treated as illegal

24.0%
24.0%
14.1%
12.1%
11.7%
5.3%
1.2%
1.1% 0.6% 2.4%
Viewership share of regional channels
Tamil
Telegu
Marathi
Kannada
Bangali
Malyalam
Gujrathi
Oriya
Bhojpuri
Others
Viewership share of regional channels - 2014
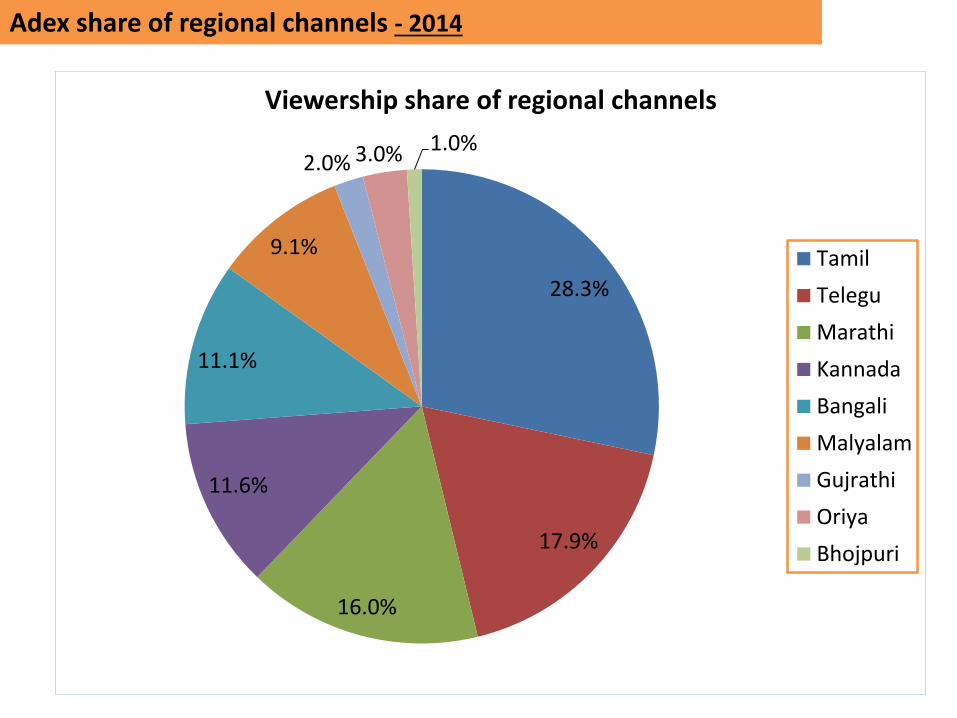
28.3%
17.9%
16.0%
11.6%
11.1%
9.1%
2.0% 3.0% 1.0%
Viewership share of regional channels
Tamil
Telegu
Marathi
Kannada
Bangali
Malyalam
Gujrathi
Oriya
Bhojpuri
Adex share of regional channels - 2014

Source: KPMG India analysis and industry discussions
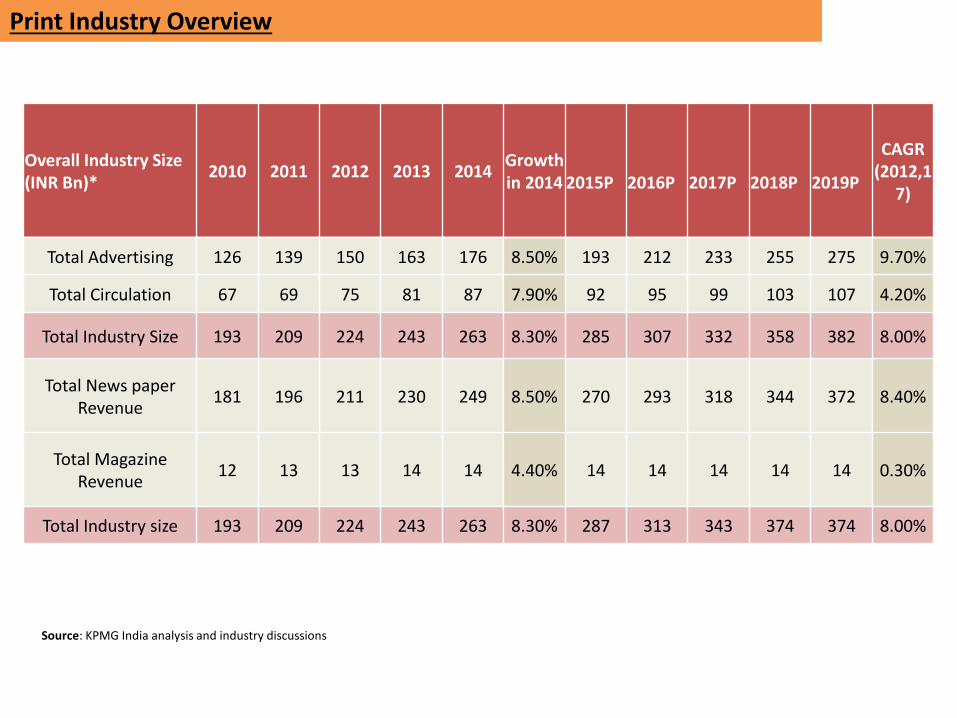
Print Industry Overview
Overall Industry Size (INR Bn)*
2010 2011 2012 2013 2014Growthin 2014 2015P 2016P 2017P 2018P 2019P
CAGR (2012,1
7)
Total Advertising 126 139 150 163 176 8.50% 193 212 233 255 275 9.70%
Total Circulation 67 69 75 81 87 7.90% 92 95 99 103 107 4.20%
Total Industry Size 193 209 224 243 263 8.30% 285 307 332 358 382 8.00%
Total News paper Revenue
181 196 211 230 249 8.50% 270 293 318 344 372 8.40%
Total Magazine Revenue
12 13 13 14 14 4.40% 14 14 14 14 14 0.30%
Total Industry size 193 209 224 243 263 8.30% 287 313 343 374 374 8.00%

Source: KPMG India analysis and industry discussions
Print Industry : Long term growth looks promising
INR billion 2010 2011 2012 2013 2014Growthin 2014
2015P 2016P 2017P 2018P 2019P CAGR
(2014,17)
English market 79 83 86 91 96 5.2% 101 105 109 113 118 4.2%
Advertising 53 57 59 62 65 4.8% 32 33 33 34 35 4.9%
Circulation 26 26 27 29 31 6.0% 69 72 76 80 83 2.4%
Hindi Market 58 62 68 75 83 10.5% 92 100 109 120 131 9.4%
Advertising 37 41 45 50 54 9.8% 60 67 75 83 92 11.2%
Circulation 21 22 24 26 29 12.0% 31 33 35 36 38 5.6%
Vernacular Market 56 63 69 76 84 9.8% 92 102 113 125 138 10.5%
Advertising 36 42 46 51 57 11.8% 64 72 82 92 104 13.0%
Circulation 20 21 24 26 27 6.0% 29 30 31 33 34 4.6%
Total Print Market 193 209 224 243 263 8.3% 284 307 332 358 387 8.0%

37%31%
32%35%
31% 34%
0%
20%
40%
60%
80%
100%
120%
2013 2018P
English Hindi Vernacular
Print advertising advertisement Volume Language (% share)
Source : KPMG Analysis, industry Discussions
63 65 67 67 67
37 35 33 33 33
0
20
40
60
80
100
120
2009 2010 2011 2012 2013
Advertising Circulation
Advertising and Circulation revenue share
Source : TAM Media Research PVT LTD &KPMG Analysis, industry Discussions

Correlation between GDP and print advertising revenue growth
Source : KPMG Analysis, industry Discussions
Note: While advertising revenue has been estimated for a calendar year, GDP growth has been calculated for the financial year
The Indian print industry continuedits journey at a steady rate in 2014with most players strengtheningtheir presence in the existingmarkets, and consolidating theirexisting operations. The structure ofthe Indian print industry continuesto be highly fragmented with bothnational and regional players presentin the market.The industry’s growth is directlyrelated to the macroeconomicconditions prevailing in the country.Post general elections in 2014, theformation of a stable government atthe centre generated optimism inthe country. This boosted investors’confidence in the otherwise shakyeconomy. During the April – June2014 quarter, the FICCI BusinessConfidence Index (BCI) rose to a 15-quarter high of 72.7 points from 49points a year earlier. Themacroeconomic stability seems tohave facilitated the growth in theprint industry

Number of registered newspapers and periodical (in 000’)
Source: The Registrar of Newspaper for India, Annual report 2013-14
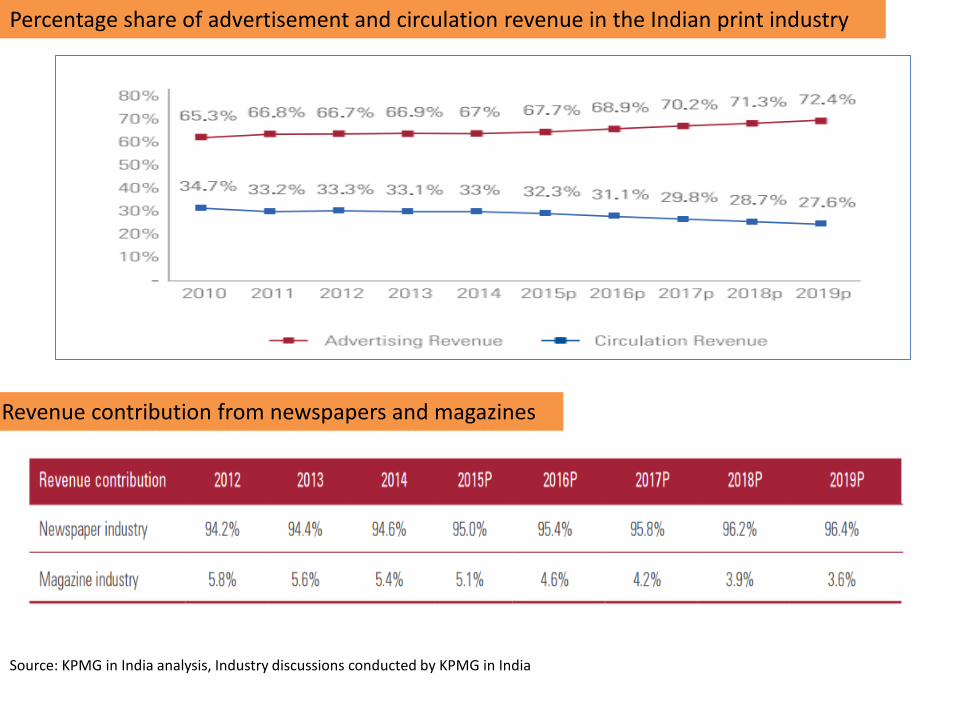
Percentage share of advertisement and circulation revenue in the Indian print industry
Source: KPMG in India analysis, Industry discussions conducted by KPMG in India
Revenue contribution from newspapers and magazines

New publications registered in FY14
Source: The Registrar of Newspaper for India, Annual report 2013-14

Big spenders on print
Source: Pitch Madison reports

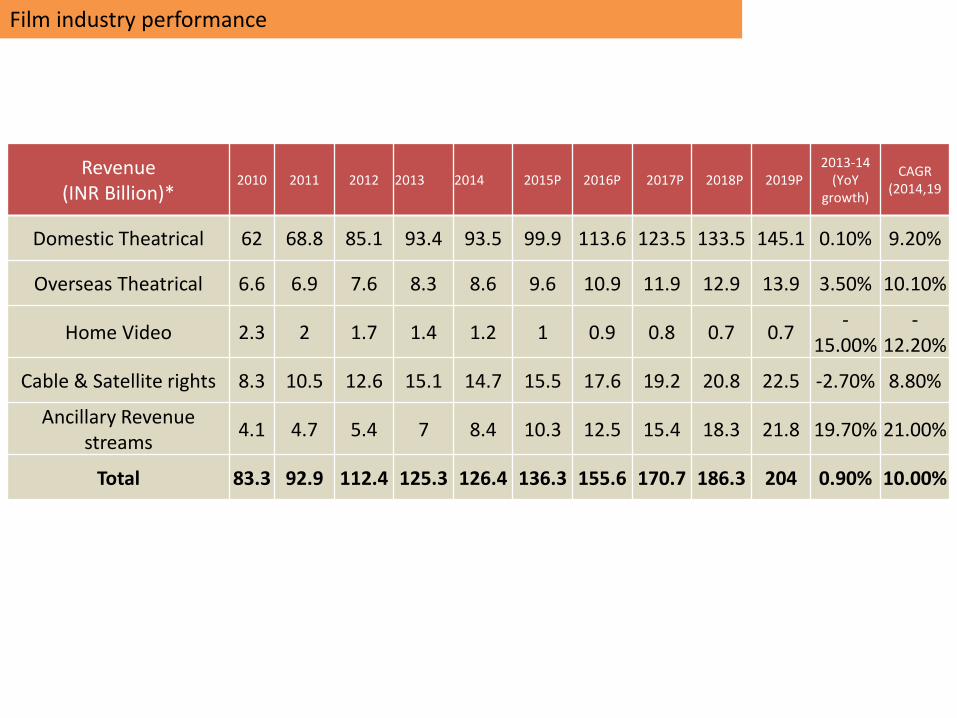
Film industry performance
Revenue (INR Billion)*
2010 2011 2012 2013 2014 2015P 2016P 2017P 2018P 2019P2013-14
(YoY growth)
CAGR (2014,19
Domestic Theatrical 62 68.8 85.1 93.4 93.5 99.9 113.6 123.5 133.5 145.1 0.10% 9.20%
Overseas Theatrical 6.6 6.9 7.6 8.3 8.6 9.6 10.9 11.9 12.9 13.9 3.50% 10.10%
Home Video 2.3 2 1.7 1.4 1.2 1 0.9 0.8 0.7 0.7-
15.00%-
12.20%
Cable & Satellite rights 8.3 10.5 12.6 15.1 14.7 15.5 17.6 19.2 20.8 22.5 -2.70% 8.80%
Ancillary Revenue streams
4.1 4.7 5.4 7 8.4 10.3 12.5 15.4 18.3 21.8 19.70% 21.00%
Total 83.3 92.9 112.4 125.3 126.4 136.3 155.6 170.7 186.3 204 0.90% 10.00%
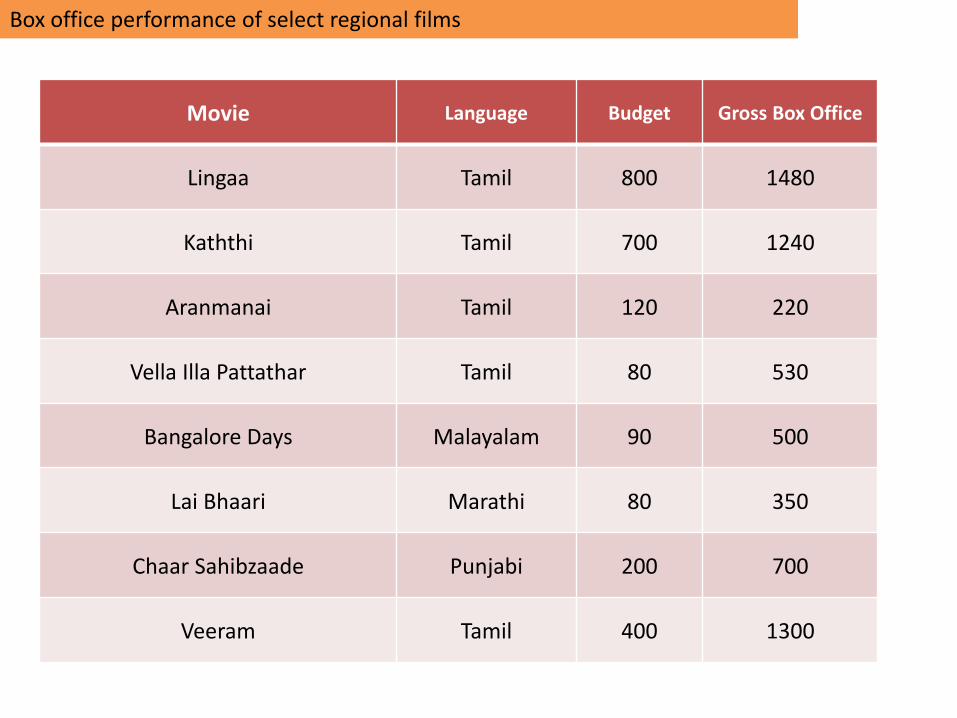
Box office performance of select regional films
Movie Language Budget Gross Box Office
Lingaa Tamil 800 1480
Kaththi Tamil 700 1240
Aranmanai Tamil 120 220
Vella Illa Pattathar Tamil 80 530
Bangalore Days Malayalam 90 500
Lai Bhaari Marathi 80 350
Chaar Sahibzaade Punjabi 200 700
Veeram Tamil 400 1300

Domestic Box Office revenue – India, China (in USD billion)
1.11
1.1
1.4
1.6
1.8
0.9
1.5
2
2.7
3.5
4.7
0
0.5
1
1.5
2
2.5
3
3.5
4
4.5
5
2009 2010 2011 2012 2013 2014
India China
Source: Ent Group report, China film industry report 2013-2014, KPMG in India analysis


210
272
337
402469
528
20
22
25
27
30
32
0
100
200
300
400
500
600
2014E 2015P 2016P 2017P 2018P
Wireless connections Wireline Connections
Million Connections
India internet connections, 2014(E) – 2019 (P)
Note: TRAI restated the numbers for broadband and wired internet subscribers last year. In line with this we have restated our projections
Source: KPMG in India analysis
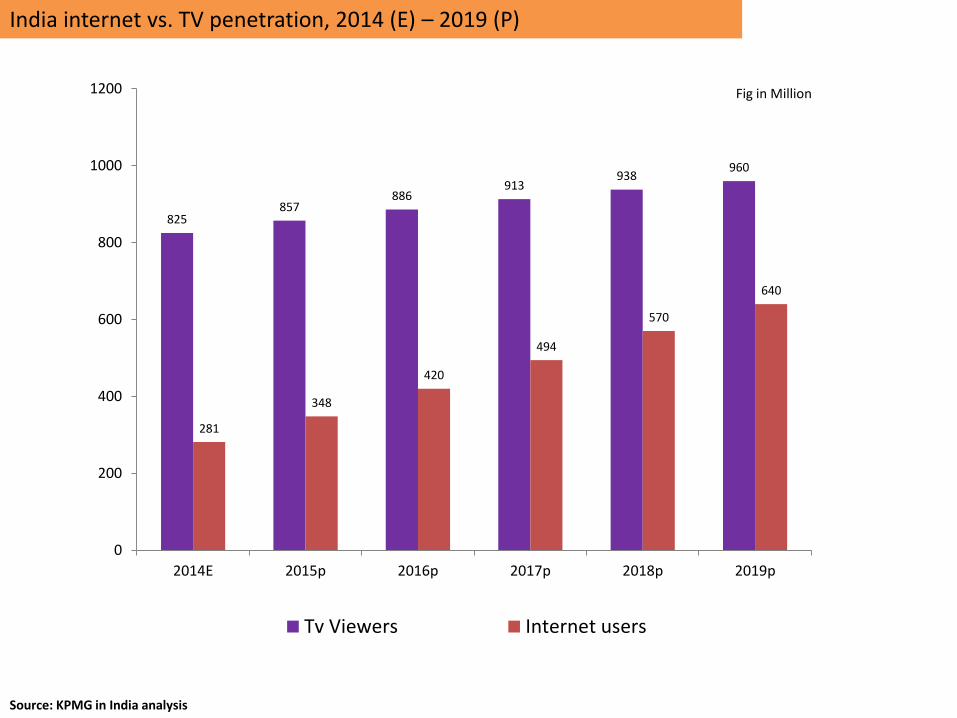
India internet vs. TV penetration, 2014 (E) – 2019 (P)
825857
886913
938960
281
348
420
494
570
640
0
200
400
600
800
1000
1200
2014E 2015p 2016p 2017p 2018p 2019p
Tv Viewers Internet users
Source: KPMG in India analysis
Fig in Million
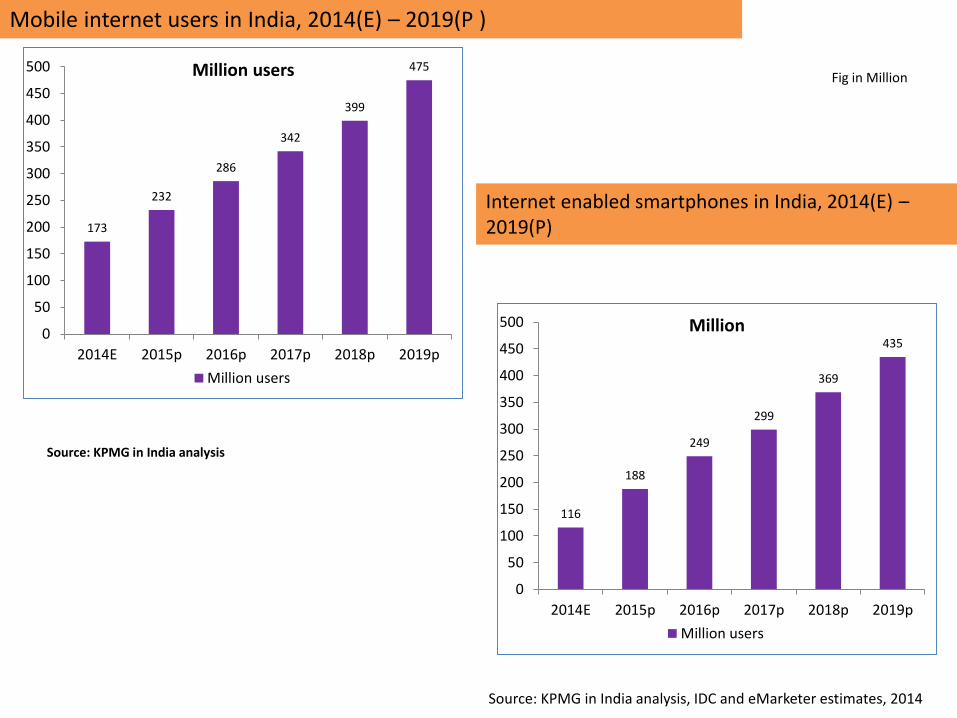
Mobile internet users in India, 2014(E) – 2019(P )
173
232
286
342
399
475
0
50
100
150
200
250
300
350
400
450
500
2014E 2015p 2016p 2017p 2018p 2019p
Million users
Million users
Source: KPMG in India analysis
Fig in Million
Internet enabled smartphones in India, 2014(E) –2019(P)
116
188
249
299
369
435
0
50
100
150
200
250
300
350
400
450
500
2014E 2015p 2016p 2017p 2018p 2019p
Million
Million users
Source: KPMG in India analysis, IDC and eMarketer estimates, 2014
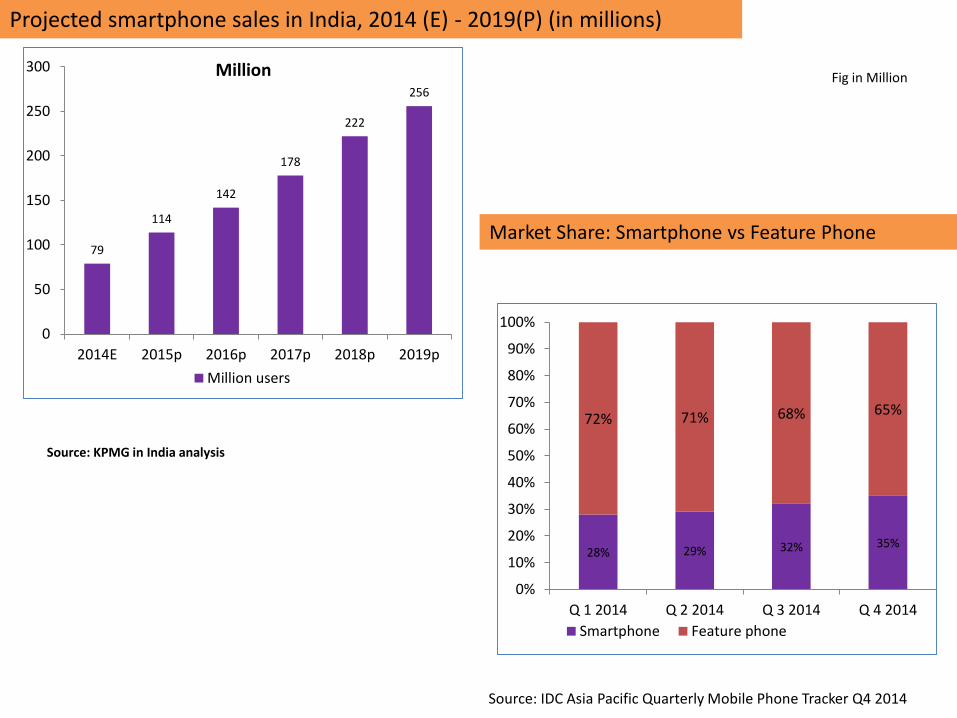
Projected smartphone sales in India, 2014 (E) - 2019(P) (in millions)
79
114
142
178
222
256
0
50
100
150
200
250
300
2014E 2015p 2016p 2017p 2018p 2019p
Million
Million users
Source: KPMG in India analysis
Fig in Million
Market Share: Smartphone vs Feature Phone
28% 29% 32% 35%
72% 71% 68% 65%
0%
10%
20%
30%
40%
50%
60%
70%
80%
90%
100%
Q 1 2014 Q 2 2014 Q 3 2014 Q 4 2014
Smartphone Feature phone
Source: IDC Asia Pacific Quarterly Mobile Phone Tracker Q4 2014

Digital advertising market in India, 2014 (E) – 2019(P) (in INR billions)
38
54.80
72.40
98.60
116.10
135.40
5
7.70
11.60
16.80
22.10
27.10
0
20
40
60
80
100
120
140
160
180
2014 E 2015 P 2016 P 2017 P 2018 P 2019 P
Desktop Advertising Mobile Advertising
Source: IDC Asia Pacific Quarterly Mobile Phone Tracker Q4 2014
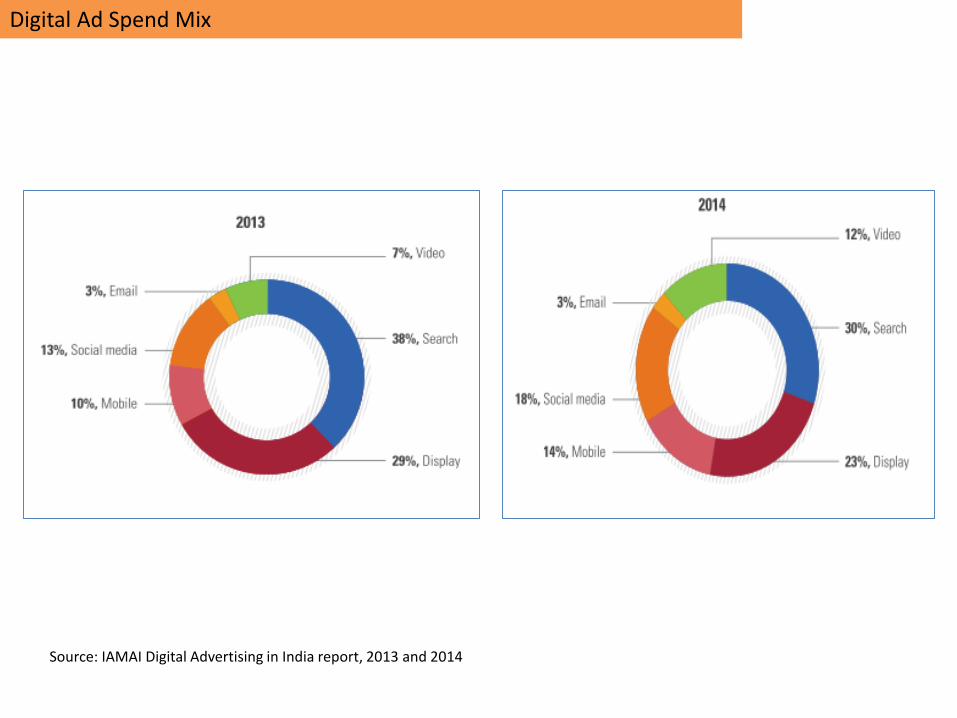
Digital Ad Spend Mix
Source: IAMAI Digital Advertising in India report, 2013 and 2014
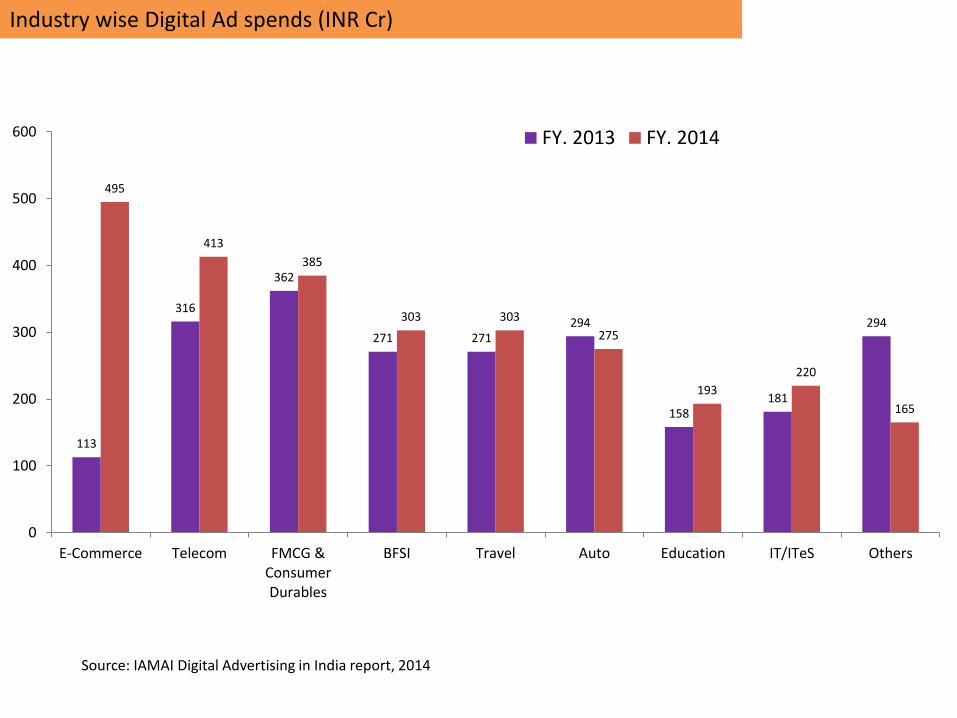
113
316
362
271 271294
158181
294
495
413
385
303 303
275
193
220
165
0
100
200
300
400
500
600
E-Commerce Telecom FMCG &ConsumerDurables
BFSI Travel Auto Education IT/ITeS Others
FY. 2013 FY. 2014
Industry wise Digital Ad spends (INR Cr)
Source: IAMAI Digital Advertising in India report, 2014

Percentage of adults using social media platforms globally
Global gender-wise distribution of adults using social media platforms
Source: Pew Research Center’s combined omnibus survey, September 2014
Source: Pew Research Center’s combined omnibus survey, September 2014
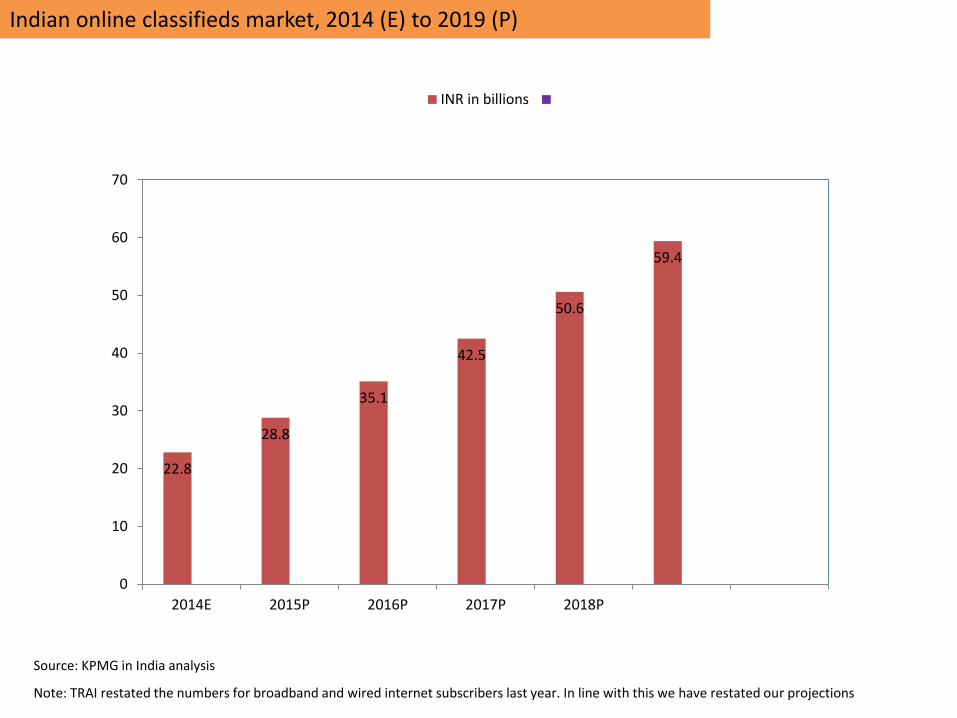
22.8
28.8
35.1
42.5
50.6
59.4
0
10
20
30
40
50
60
70
2014E 2015P 2016P 2017P 2018P
INR in billions
Indian online classifieds market, 2014 (E) to 2019 (P)
Note: TRAI restated the numbers for broadband and wired internet subscribers last year. In line with this we have restated our projections
Source: KPMG in India analysis
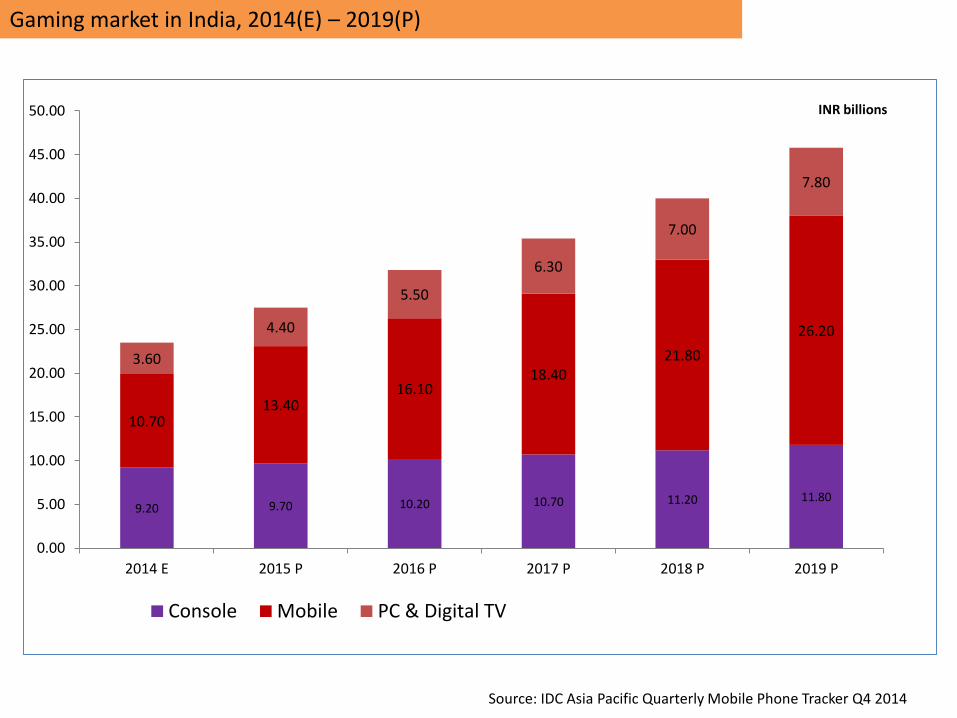
Gaming market in India, 2014(E) – 2019(P)
9.20 9.70 10.20 10.70 11.20 11.80
10.7013.40
16.1018.40
21.80
26.20
3.60
4.40
5.50
6.30
7.00
7.80
0.00
5.00
10.00
15.00
20.00
25.00
30.00
35.00
40.00
45.00
50.00
2014 E 2015 P 2016 P 2017 P 2018 P 2019 P
Console Mobile PC & Digital TV
INR billions
Source: IDC Asia Pacific Quarterly Mobile Phone Tracker Q4 2014
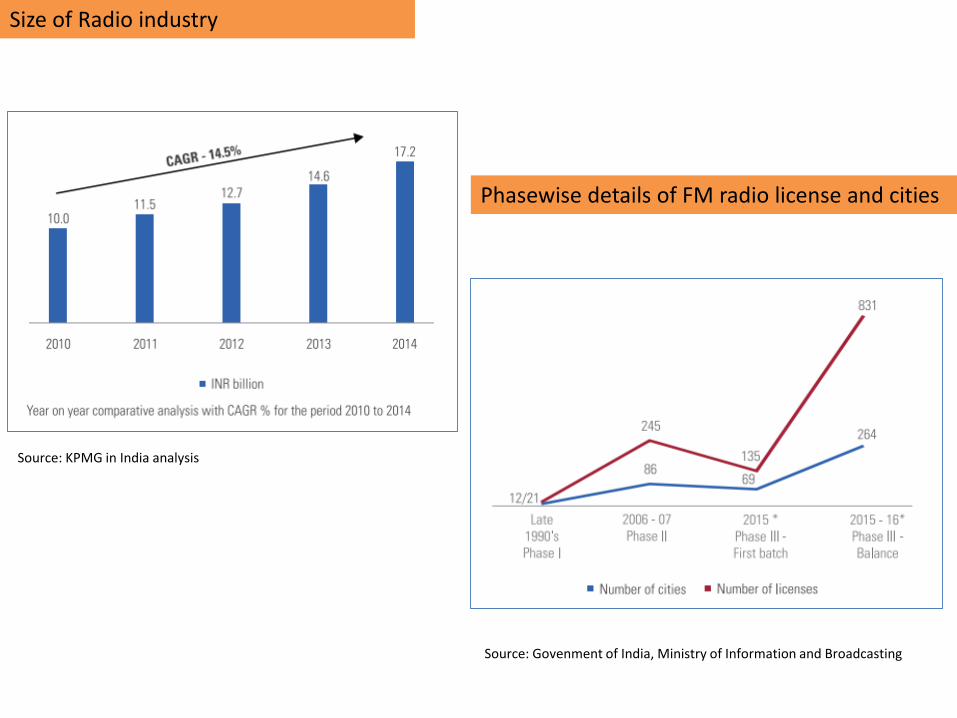
Size of Radio industry
Phasewise details of FM radio license and cities
Source: Govenment of India, Ministry of Information and Broadcasting
Source: KPMG in India analysis

Geographical expansion
Source: Industry discussions conducted by KPMG in India, KPMG in India analysis

Listernership on the go & Time spent on radio
Source: Copyright reserved with TAM MEDIA RESEARCH PVT. LTD. any use of TAM Data or (derivative thereof) mentioned herein without express permission of TAM shall be treated as illegal. RAM covers 4 metros only (Mum, Delhi, Kol & Bglr). TG : Persons, 12yrs+, All SECs’; Markets : 4 Metros


Size of Animation, VFX and Post production industry in India
Source: KPMG in India analysis and Industry discussions conducted by KPMG in India
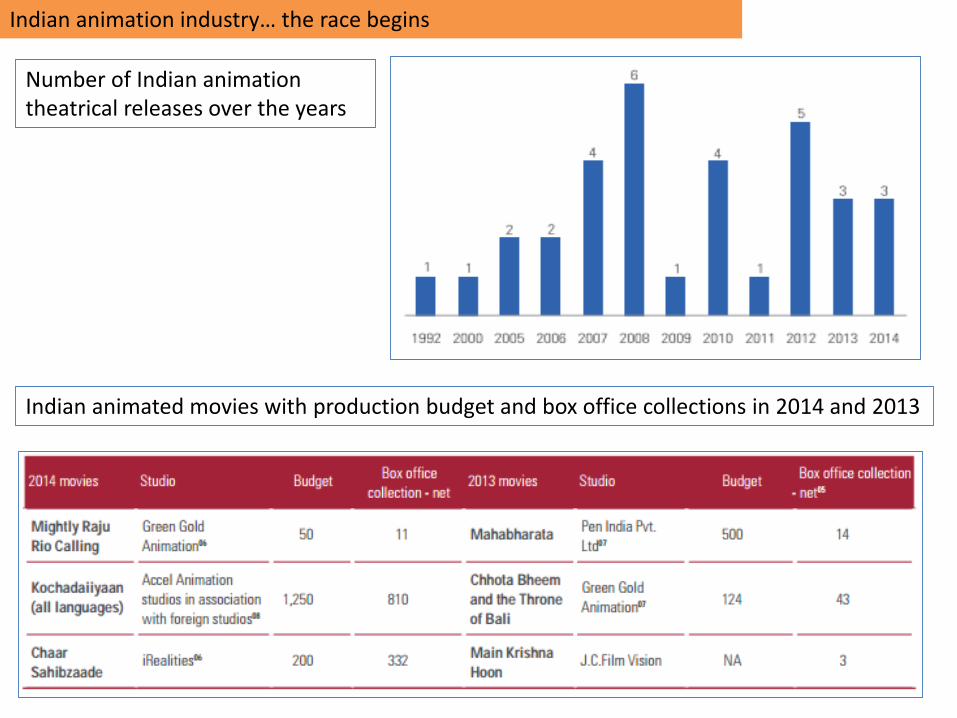
Indian animation industry… the race begins
Number of Indian animation theatrical releases over the years
Indian animated movies with production budget and box office collections in 2014 and 2013
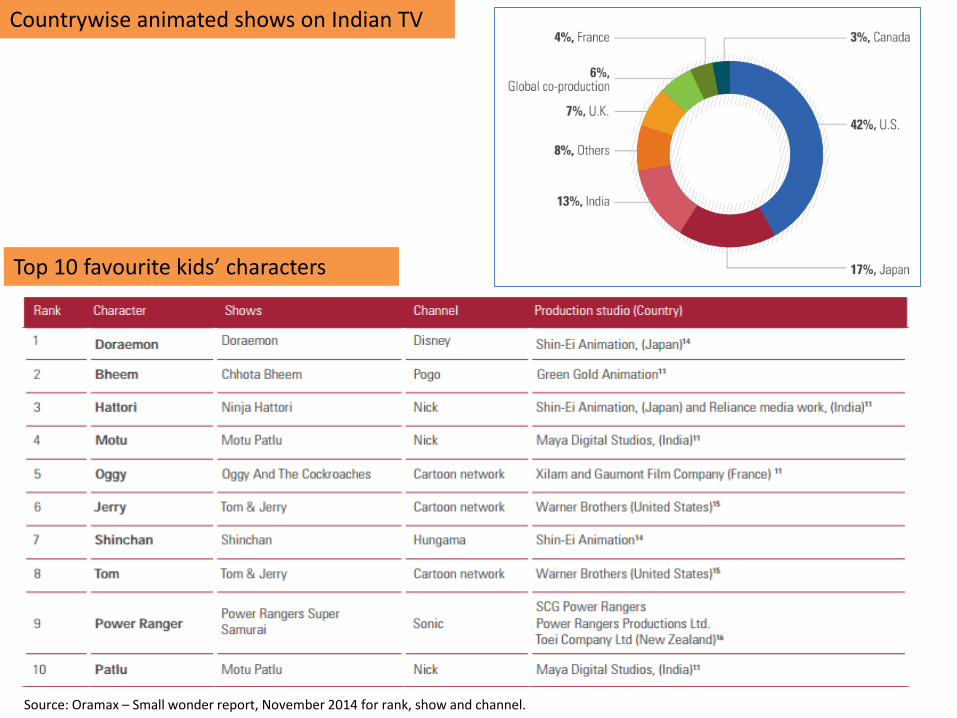
Countrywise animated shows on Indian TV
Top 10 favourite kids’ characters
Source: Oramax – Small wonder report, November 2014 for rank, show and channel.
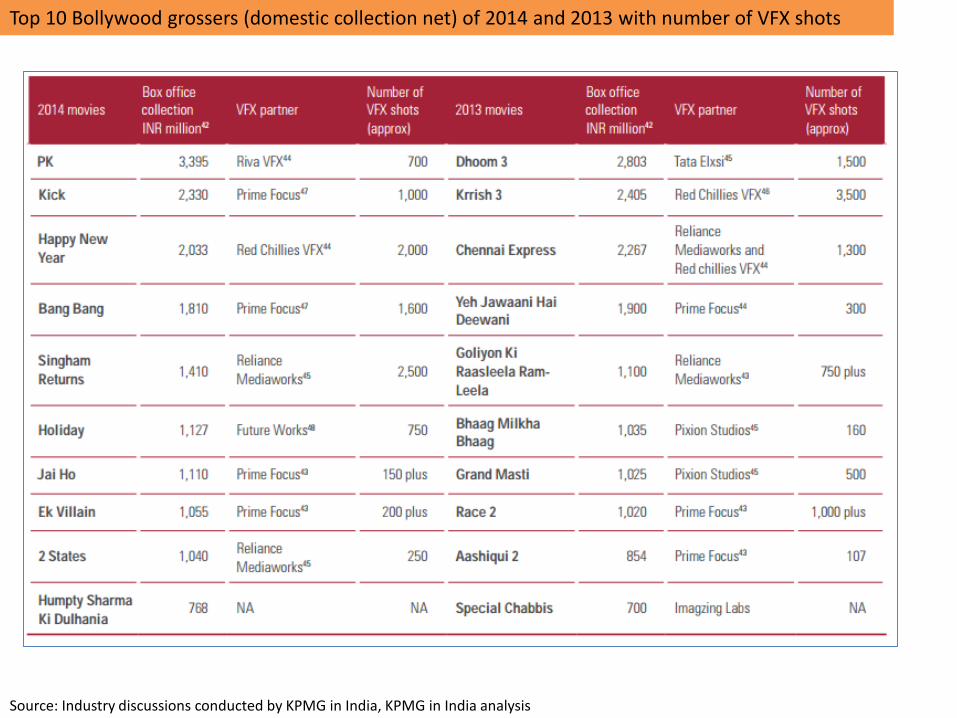
Top 10 Bollywood grossers (domestic collection net) of 2014 and 2013 with number of VFX shots
Source: Industry discussions conducted by KPMG in India, KPMG in India analysis
Thank YouSource: FICCI-KPMG Indian Media and Entertainment Industry Report 2015
Prepared By: Vaibhav Dalvi
Contact: 9004786586Email: [email protected]