FEA Information Inc. Global News & Technical Information … · 2004. 11. 3. · Global News &...
24
FEA Information Inc. Global News & Technical Information Dedicated to the Global Engineering Community LEAP ALTAIR-ITALY DYNAMAX ANSYS-CHINA DYNALIS GISSETA DYNAmore FLOTREND KOSTECH ERAB THEME MFAC CAD-FEM Prof Genarro Monacelli Dr. David Benson Dr. Alexey I. Borovkov Dr. Ted Belytchko Dr. Taylan Altan Dr. Bhavin V. Mehta Prof. Ala Tabiei
Transcript of FEA Information Inc. Global News & Technical Information … · 2004. 11. 3. · Global News &...
FEA Information Inc. Global News & Technical Information
Dedicated to the Global Engineering Community
LEAP ALTAIR-ITALY DYNAMAX ANSYS-CHINA DYNALIS GISSETA DYNAmore FLOTREND KOSTECH ERAB THEME MFAC CAD-FEM Prof Genarro Monacelli Dr. David Benson Dr. Alexey I. Borovkov Dr. Ted Belytchko Dr. Taylan Altan Dr. Bhavin V. Mehta Prof. Ala Tabiei
FEA Information Inc. Global News & Industry Information Issue February 2002
2____________________________________________________________________________ Livermore Software Technology Corp. www.lstc.com
�
� �
��
�
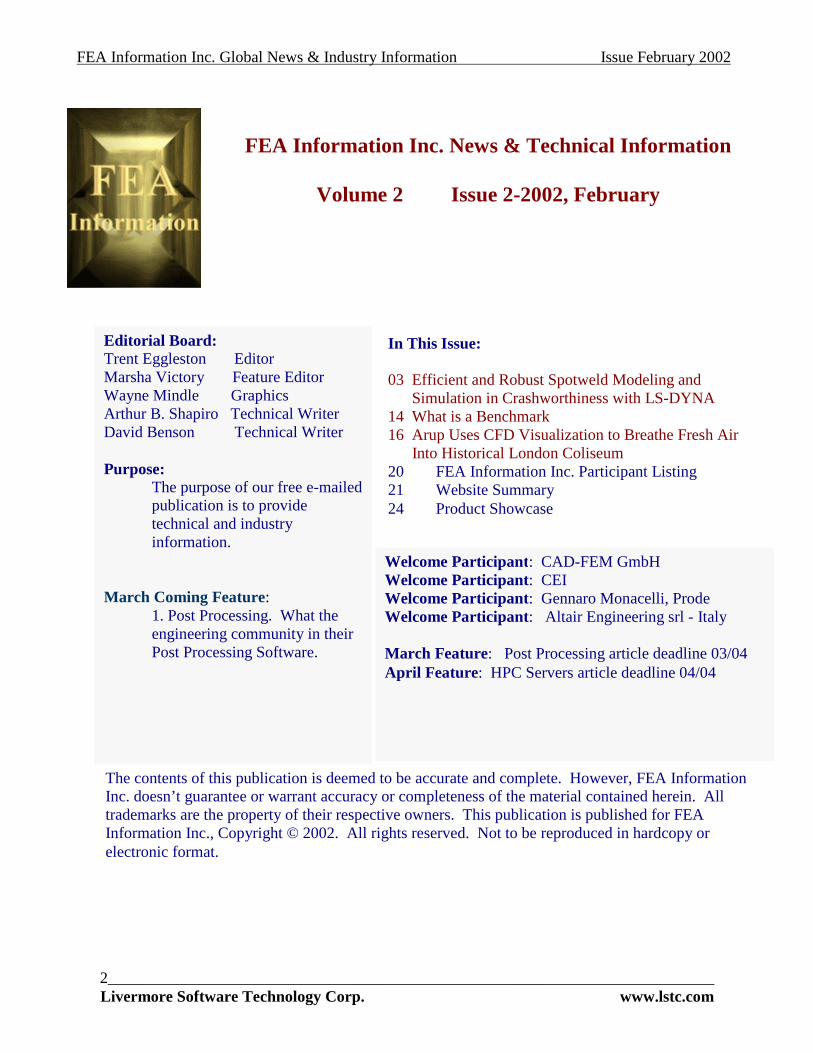
FEA Information Inc. News & Technical Information
Volume 2 Issue 2-2002, February �
�
�
��
�
�
�
�
�
�
�
�
�
�
�
�
�
�
�
�
�
�
�
�
�
�
�
�
�
�
�
�
�
�
�
�
�
�
�
�
�
�
�
�
�
�
�
�
�
�
�
�
Editorial Board: Trent Eggleston Editor Marsha Victory Feature Editor Wayne Mindle Graphics Arthur B. Shapiro Technical Writer David Benson Technical Writer Purpose:
The purpose of our free e-mailed publication is to provide technical and industry information.
March Coming Feature: 1. Post Processing. What the engineering community in their Post Processing Software.
In This Issue: 03 Efficient and Robust Spotweld Modeling and
Simulation in Crashworthiness with LS-DYNA 14 What is a Benchmark 16 Arup Uses CFD Visualization to Breathe Fresh Air Into Historical London Coliseum 20 FEA Information Inc. Participant Listing 21 Website Summary 24 Product Showcase
Welcome Participant: CAD-FEM GmbH Welcome Participant: CEI Welcome Participant: Gennaro Monacelli, Prode Welcome Participant: Altair Engineering srl - Italy March Feature: Post Processing article deadline 03/04 April Feature: HPC Servers article deadline 04/04
The contents of this publication is deemed to be accurate and complete. However, FEA Information Inc. doesn’t guarantee or warrant accuracy or completeness of the material contained herein. All trademarks are the property of their respective owners. This publication is published for FEA Information Inc., Copyright © 2002. All rights reserved. Not to be reproduced in hardcopy or electronic format.
FEA Information Inc. Global News & Industry Information Issue February 2002
3____________________________________________________________________________ The Japan Research Institute Ltd. www.jri.co.jp
Efficient and Robust Spotweld Modeling and Simulation in Crashworthiness with LS-DYNA
Karl Schweizerhof, Werner Schmid, DYNAmore GmbH, Stuttgart, Germany e-mail: [email protected]
NOTE: All Graphics are at the end of the article
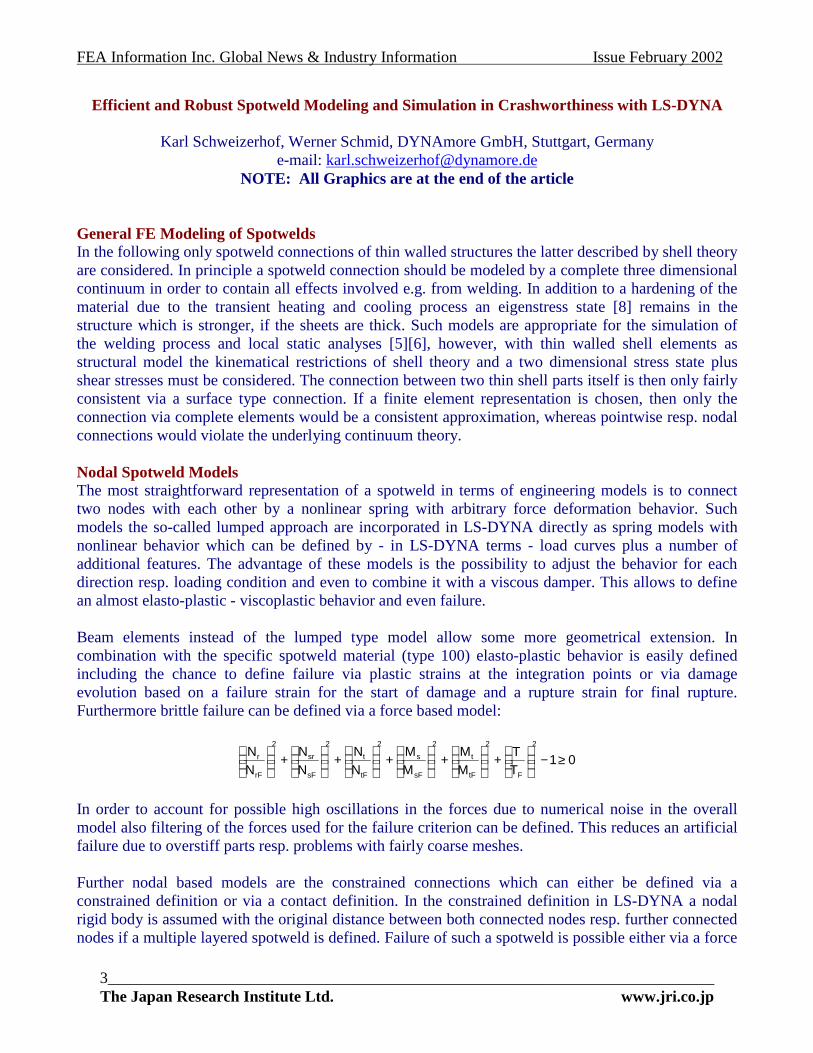
General FE Modeling of Spotwelds In the following only spotweld connections of thin walled structures the latter described by shell theory are considered. In principle a spotweld connection should be modeled by a complete three dimensional continuum in order to contain all effects involved e.g. from welding. In addition to a hardening of the material due to the transient heating and cooling process an eigenstress state [8] remains in the structure which is stronger, if the sheets are thick. Such models are appropriate for the simulation of the welding process and local static analyses [5][6], however, with thin walled shell elements as structural model the kinematical restrictions of shell theory and a two dimensional stress state plus shear stresses must be considered. The connection between two thin shell parts itself is then only fairly consistent via a surface type connection. If a finite element representation is chosen, then only the connection via complete elements would be a consistent approximation, whereas pointwise resp. nodal connections would violate the underlying continuum theory. Nodal Spotweld Models The most straightforward representation of a spotweld in terms of engineering models is to connect two nodes with each other by a nonlinear spring with arbitrary force deformation behavior. Such models the so-called lumped approach are incorporated in LS-DYNA directly as spring models with nonlinear behavior which can be defined by - in LS-DYNA terms - load curves plus a number of additional features. The advantage of these models is the possibility to adjust the behavior for each direction resp. loading condition and even to combine it with a viscous damper. This allows to define an almost elasto-plastic - viscoplastic behavior and even failure. Beam elements instead of the lumped type model allow some more geometrical extension. In combination with the specific spotweld material (type 100) elasto-plastic behavior is easily defined including the chance to define failure via plastic strains at the integration points or via damage evolution based on a failure strain for the start of damage and a rupture strain for final rupture. Furthermore brittle failure can be defined via a force based model:
01222222
≥−
+
+
+
+
+
FtF
t
sF
s
tF
t
sF
sr
rF
r
TT
MM
MM
NN
NN
NN
In order to account for possible high oscillations in the forces due to numerical noise in the overall model also filtering of the forces used for the failure criterion can be defined. This reduces an artificial failure due to overstiff parts resp. problems with fairly coarse meshes. Further nodal based models are the constrained connections which can either be defined via a constrained definition or via a contact definition. In the constrained definition in LS-DYNA a nodal rigid body is assumed with the original distance between both connected nodes resp. further connected nodes if a multiple layered spotweld is defined. Failure of such a spotweld is possible either via a force

FEA Information Inc. Global News & Industry Information Issue February 2002
4____________________________________________________________________________ Livermore Software Technology Corp. www.lstc.com
based criterion taking the normal and the shear force into account. This is similar to the quadratic criterion for the specific spotweld material described above:
01,
≥−
+
m
FShear
Shear
n
tF
t
NN
NN
In addition a plastic strain based failure is possible using the strains of the elements assigned to the connected nodes. If the contact definition is used to connect nodes, a penalty based approach - tie-break-nodes - is taken and failure is defined in the same fashion. For connected surfaces a similar approach - tie-break-surfaces - can be used with the same failure criterion but based on stresses in the contact surface. The disadvantage of the brittle failure behavior is that it introduces artificial stress waves into the structure which in many cases cause further unrealistic responses. Straightforward rigid body connections of the constrained and contact based approach often lead to a somehow locally artificially stiffened structure which is more pronounced in coarser meshes; thus using real beam elements with specific spotweld material appears to be the best choice for nodal connections concerning the rigidity. A minor disadvantage of the latter is the short length of the beam which results in a high frequency. However, the frequencies can be reduced by mass scaling which mostly does not affect the real inertial behavior of the global structure. Single nodal connections, however, are in principle in contradiction to continuum theories and in addition are often the source of excitations of the hourglass modes which are possible with the mostly used efficient hourglass-controlled elements [2]. Such kinematics are most pronounced, if single spotwelds are considered or if in regular meshes all spotwelds are located at the same position within elements. If clusters of spotwelds occur in a model a more continuous connection is obtained and the model looses some of the disadvantages.
Mesh Independent Connection and Mesh Dependency of Results An important feature for the flexible connection of nodes is the feature to remain independent from the location of the nodes of the FE mesh to some extent concerning the location of the connection by using the connection between additional nodes which are not mesh nodes but constrained to elements of the surfaces. This feature may reduce the hourglass excitation, if the nodes are more in the interior of the elements describing the surfaces. In addition, by constraining the connection nodes to the interior of the specimen elements the size of the spotweld is - due to the shape functions of the standard linear elements - artificially increased to almost the size of the connected surface elements. Thus a dominant mesh dependency - dependency of the location of the node within the elements - of the results is obtained, unless very fine meshes are chosen. This effect is studied in detail in the numerical examples presented in [1].
Torsional Resistance In standard shell theory there is naturally no resistance against rotations around the normal. However, by the single beam connection of the nodal spotwelds rotations around the normal occur, and it is desirable that the single beam - a model for the 3D spotweld - should also carry over a torsional
FEA Information Inc. Global News & Industry Information Issue February 2002
5____________________________________________________________________________ The Japan Research Institute Ltd. www.jri.co.jp
moment. Some models, however, including further constructions are possible; for a discussion of the various limitations which usually preclude the use of such models, see [1]. An approach to avoid both - artificial stiffening as well as high modeling effort - is the use of contact type s7 in LS-DYNA (SPOTWELD WITH TORSION)[4], where some torsional resistance can be defined for the nodes by forces acting in the plane of the elements. However, such forces are hard to control resp. validate and it has shown to be fairly difficult to achieve a certain robustness within more sophisticated models. In addition the forces are applied only to the nodes of the element containing the spotweld node, thus the problem of mesh dependency is again obvious.
Continuum Elements as Spotwelds Though models such as the contact shell set proposed by Schmid/Klamser [7] remove some mesh dependency, the problem of torsional resistance remains and the necessary effort is substantial. For the rather fine meshes used in the automotive industry with shell element size of about 4 mm or less, it appears to be a very efficient and effective alternative to use continuum elements directly as spotwelds. One element appears to be sufficient for the representation of some quantities, such as the stiffness in normal and shear direction and the general geometrical extension necessary to provide the correct resistance e.g. within a folding process. However, such simple elements are not able to represent bending properly, neither torsion is well represented. As bending is not a serious problem for realistically loaded spotwelds it must be noted that for proper action in torsion some further adjustment may be needed. Clearly fully underintegrated elements with one point integration only lead often to strong hourglassing thus the selectively reduced integrated solid elements are suggested and are used in all examples below. From an efficiency point of view the solid element with Belytschko/Bindeman [10] stabilization is recommended, which has proven to provide stable and reliable results. With the use of anisotropic material a fairly good adjustment to many experiments is possible. In the limit – with further mesh refinement - an automatic mesh size independence is achieved, as the side length of the continuum element is chosen identical to the diameter of the spotweld. Mass scaling may be advisable for coarser meshes. If the stiffness of the single continuum element by reducing its elastic moduli is chosen such that failure occurs predominantly in the elements harboring the spotweld, the real physical behavior is most closely simulated.
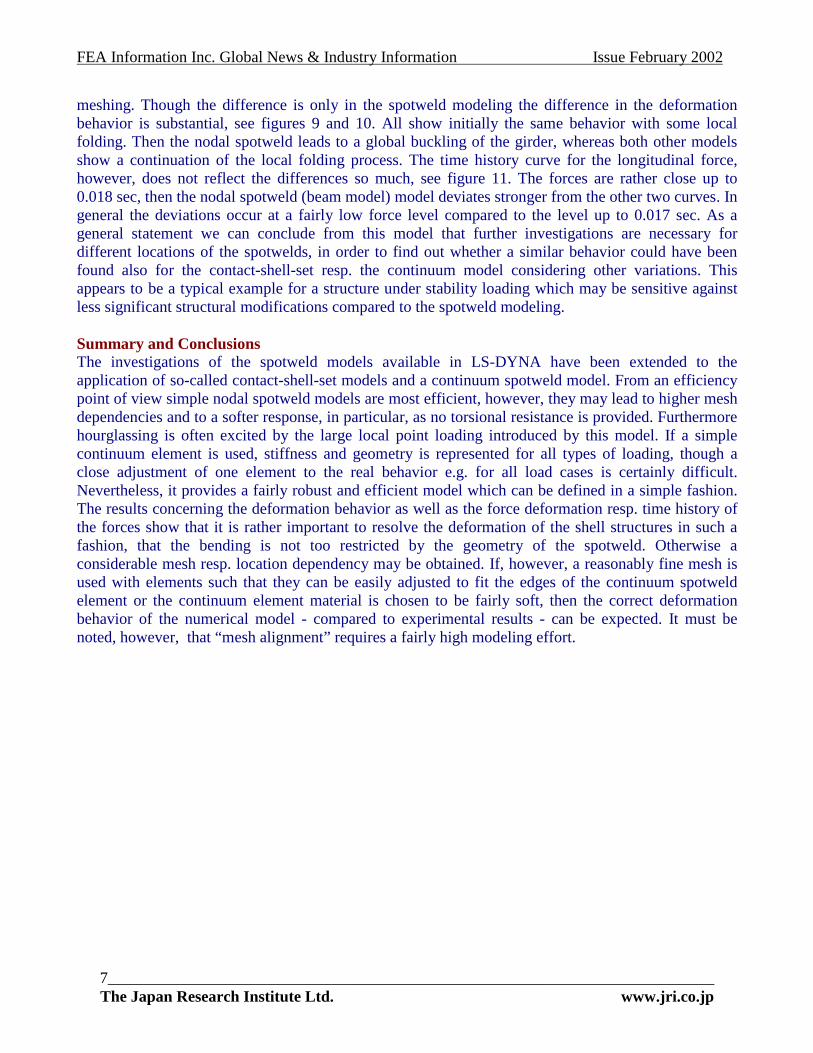
Numerical Investigations on Single Spotweld Connections The general model is taken as given in figure 2 left; the vertical walls of the specimen are taken as rigid, whereas the horizontal part is flexible. The loading is by a velocity profile; in order to avoid artificial impulses a smooth transition from zero to the final loading velocity is achieved over a short period of 0.1 ms. Unless further indicated the final loading velocity is rather low with 1 m/s.
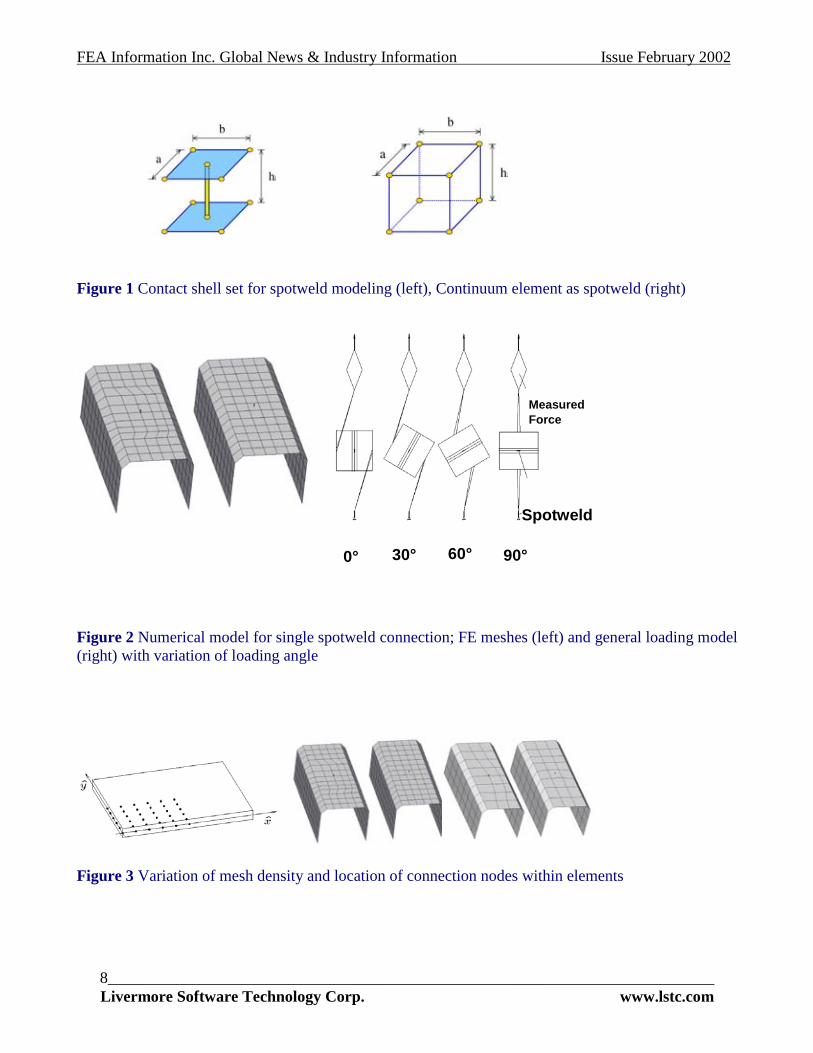
Variation of mesh density and relative location of nodes In order to show the mesh and location dependency of the various models for single spotwelds a number of parametric studies with different locations of a node in the element as indicated in figure 3 is performed. In addition the element size is varied. Further studies include a change in the element type from the hourglass controlled elements with full underintegration [2] to the assumed-shear strain elements [3][4] in order to check the hourglass sensitivity. The deformation pattern - not shown - is in general almost completely identical for both element types, however, the hourglass energy is - as expected - visibly important for the underintegrated elements, as the hourglass modes carry some
FEA Information Inc. Global News & Industry Information Issue February 2002
6____________________________________________________________________________ Livermore Software Technology Corp. www.lstc.com
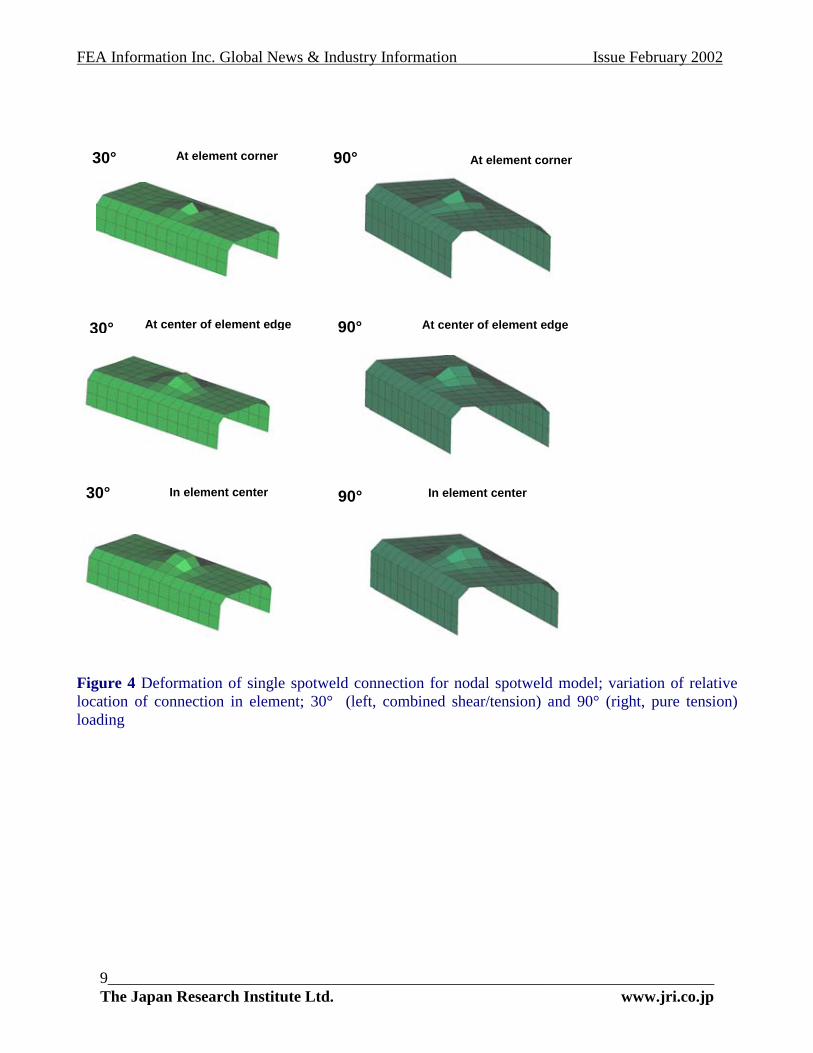
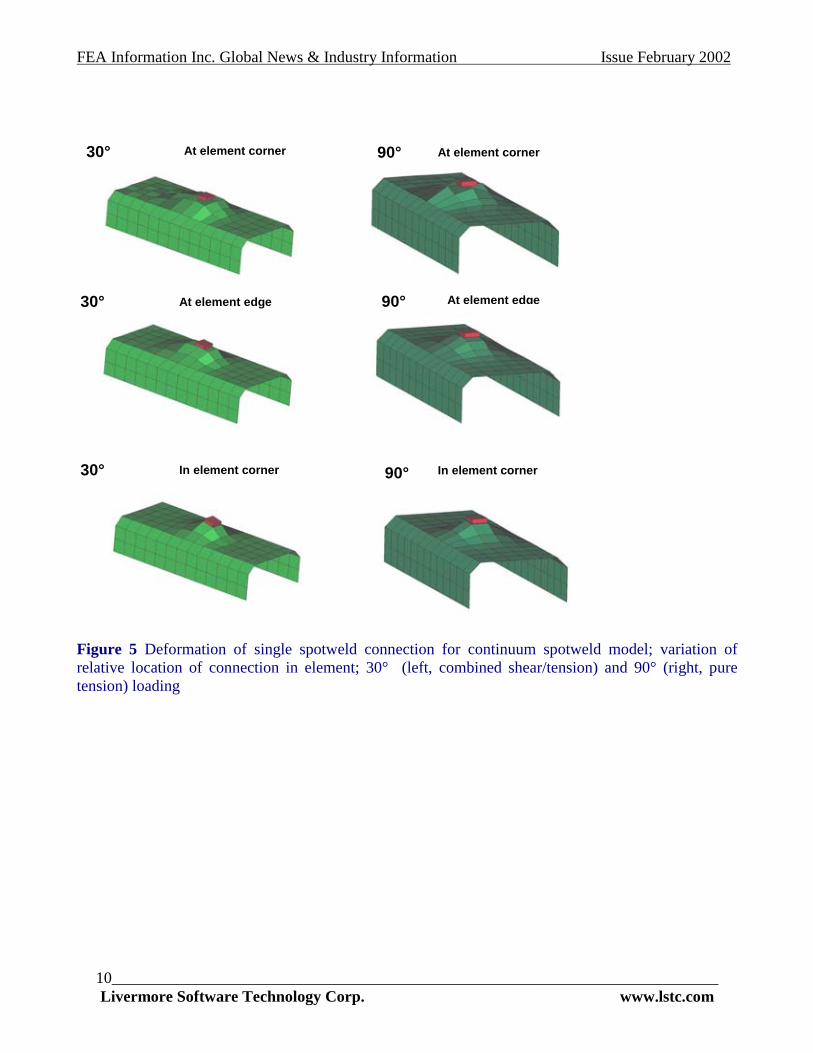
loading. The effect of the varying spotweld location on the deformation of the shell model is depicted in figure 4 for 30° and 90° loading and the Belytschko-Tsay elements [2]. It becomes clear that the forces computed in the analyses are also affected. For the same meshes of the specimen the continuum element as spotweld was used. The comparison for the 30° shear/tension and the 90° pure tension case in figure 5 shows some difference in the results, in particular the continuum element results in a smoother deformation pattern with higher rigidity in general.
If failure is considered for the connected thin walls, the assumed shear strain elements have proven to be more robust in the numerical simulations due to their higher stiffness than the fully underintegrated Belytschko-Tsay elements with stiffness control.
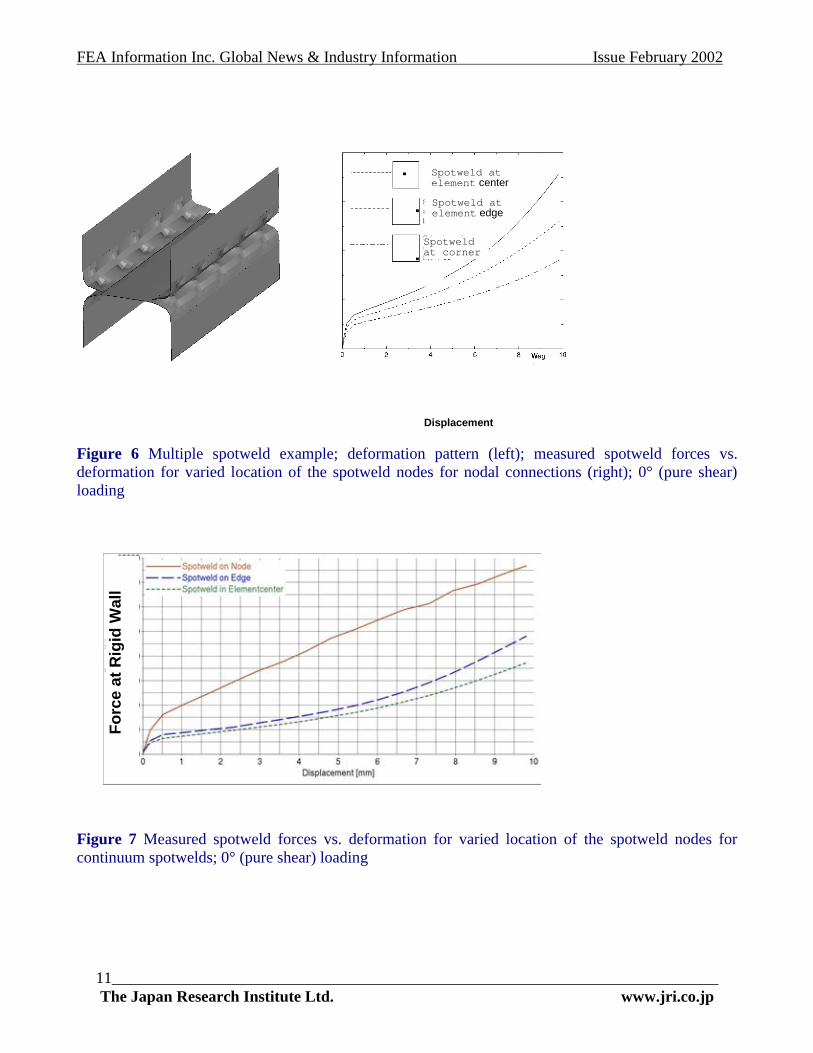
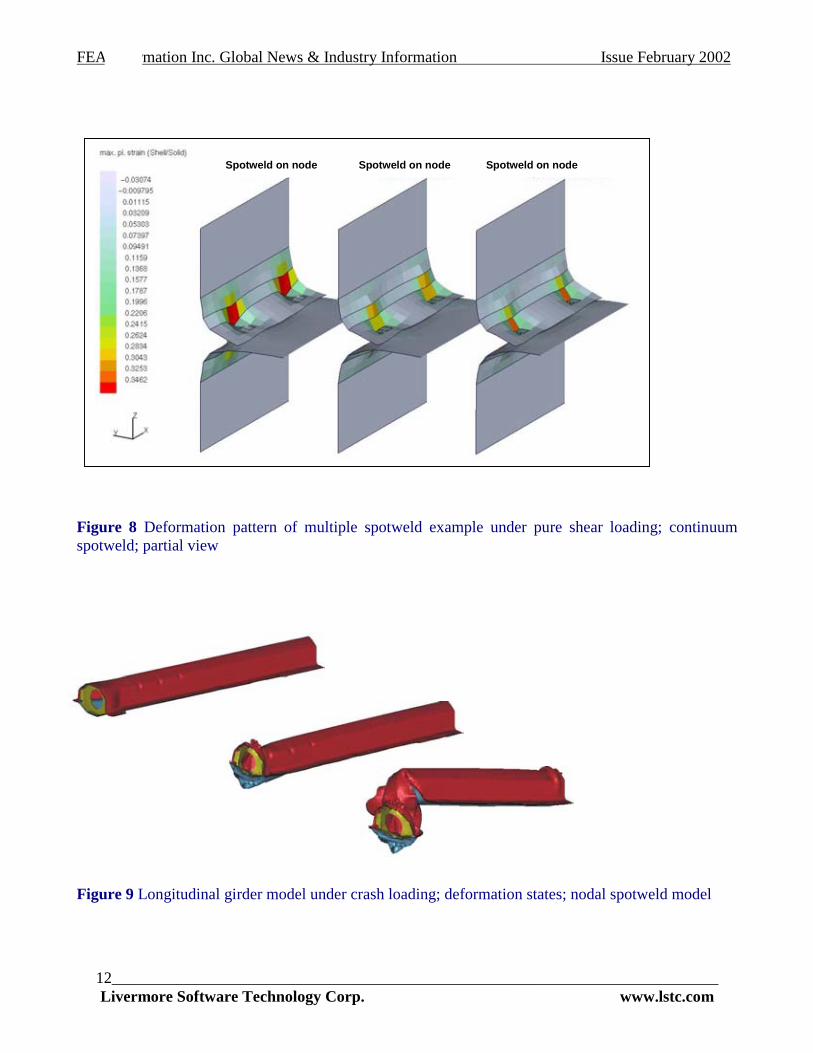
Multiple Spotweld Connections At a first look it is expected that for parts connected by many spotwelds the difference in the results will not depend so much on the location of the spotwelds with reference to the mesh of the specimen. Thus a study is performed comparing nodal spotweld and continuum spotwelds for the so-called H-test example, see figure 6, with two rows of five evenly spaced spotwelds under pure shear loading. The loading is applied in the same fashion as for the single spotweld example and increased from rest to v = 1 m/s within 0.1 ms. In addition the influence of the shell element type - Bel./Tsay or assumed strain interpolation - on the results was investigated. The latter did not show any significant difference in the results. However, the location of the nodal spotwelds still has a major influence, as is visible in figure 7. If continuum spotwelds are used, then this influence is considerably reduced for the two cases, if the element is either in contact with a full element or with two elements over an edge, see figure 5. However, some differences are still present, as the geometry of the spotweld introduces a different rigidity with each variation relative to the mesh. This, of course, would disappear with very fine meshes for the spotweld itself and the contacting surfaces, but for crashworthiness models coarse meshes with one element per spotweld are a more realistic model. The mesh influence is particularly large for the case, if the element is in contact with four elements, thus a node of the mesh of the specimen is at the center of the surface of the continuum element. Then a rather large rigidity is introduced into the structure for this particular, fairly coarse mesh. The latter effect becomes more visible, if the deformation pattern is examined in more detail. In figure 8 a partial view of the deformed structure is given; the stiffening effect of the particular position, if four elements on each side are in contact with the spotweld continuum element, becomes obvious. A cure to this effect would be a refinement of the mesh of the specimen such that the edges of the shell elements would be at the edges of the continuum element.
Girder Type Structure under Crashworthiness Loading In order to show the influence of the spotweld modeling on the global behavior of a structure a girder similar to a longitudinal girder of an automotive structure is used for comparison purposes of all three spotweld models discussed above. In the numerical model the girder is fixed on one side and is impacted on the other side by a rigid wall of about 600 kg moving with 40 km/h. In all models the connected parts of the girder are meshed without considering the location of the spotwelds. The latter were added after the meshing with constraining nodes to the contact surfaces independent of their
FEA Information Inc. Global News & Industry Information Issue February 2002
7____________________________________________________________________________ The Japan Research Institute Ltd. www.jri.co.jp
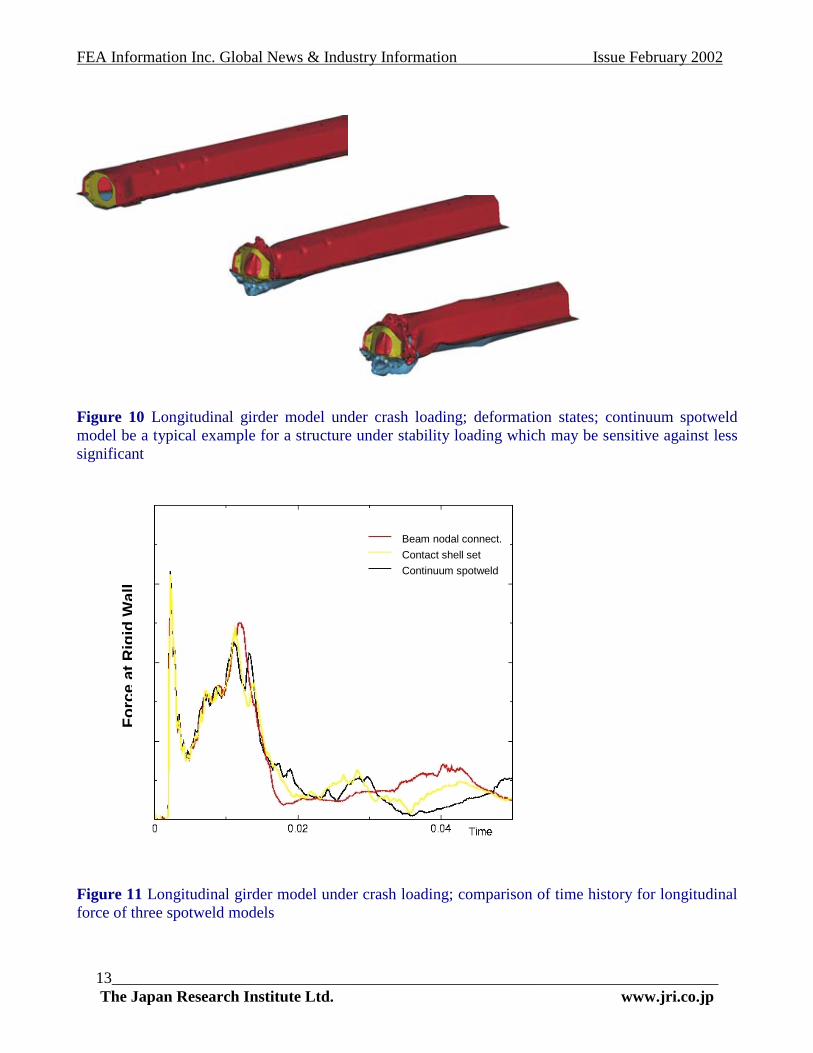
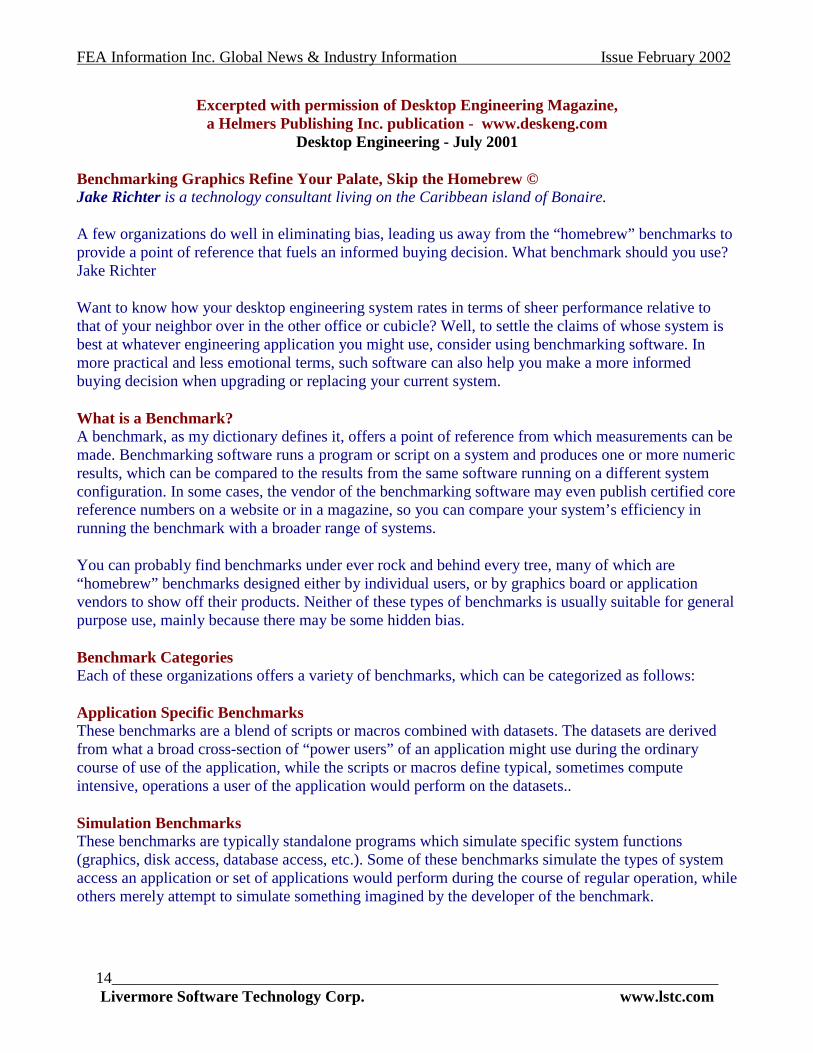
meshing. Though the difference is only in the spotweld modeling the difference in the deformation behavior is substantial, see figures 9 and 10. All show initially the same behavior with some local folding. Then the nodal spotweld leads to a global buckling of the girder, whereas both other models show a continuation of the local folding process. The time history curve for the longitudinal force, however, does not reflect the differences so much, see figure 11. The forces are rather close up to 0.018 sec, then the nodal spotweld (beam model) model deviates stronger from the other two curves. In general the deviations occur at a fairly low force level compared to the level up to 0.017 sec. As a general statement we can conclude from this model that further investigations are necessary for different locations of the spotwelds, in order to find out whether a similar behavior could have been found also for the contact-shell-set resp. the continuum model considering other variations. This appears to be a typical example for a structure under stability loading which may be sensitive against less significant structural modifications compared to the spotweld modeling. Summary and Conclusions The investigations of the spotweld models available in LS-DYNA have been extended to the application of so-called contact-shell-set models and a continuum spotweld model. From an efficiency point of view simple nodal spotweld models are most efficient, however, they may lead to higher mesh dependencies and to a softer response, in particular, as no torsional resistance is provided. Furthermore hourglassing is often excited by the large local point loading introduced by this model. If a simple continuum element is used, stiffness and geometry is represented for all types of loading, though a close adjustment of one element to the real behavior e.g. for all load cases is certainly difficult. Nevertheless, it provides a fairly robust and efficient model which can be defined in a simple fashion. The results concerning the deformation behavior as well as the force deformation resp. time history of the forces show that it is rather important to resolve the deformation of the shell structures in such a fashion, that the bending is not too restricted by the geometry of the spotweld. Otherwise a considerable mesh resp. location dependency may be obtained. If, however, a reasonably fine mesh is used with elements such that they can be easily adjusted to fit the edges of the continuum spotweld element or the continuum element material is chosen to be fairly soft, then the correct deformation behavior of the numerical model - compared to experimental results - can be expected. It must be noted, however, that “mesh alignment” requires a fairly high modeling effort.
FEA Information Inc. Global News & Industry Information Issue February 2002
8____________________________________________________________________________ Livermore Software Technology Corp. www.lstc.com
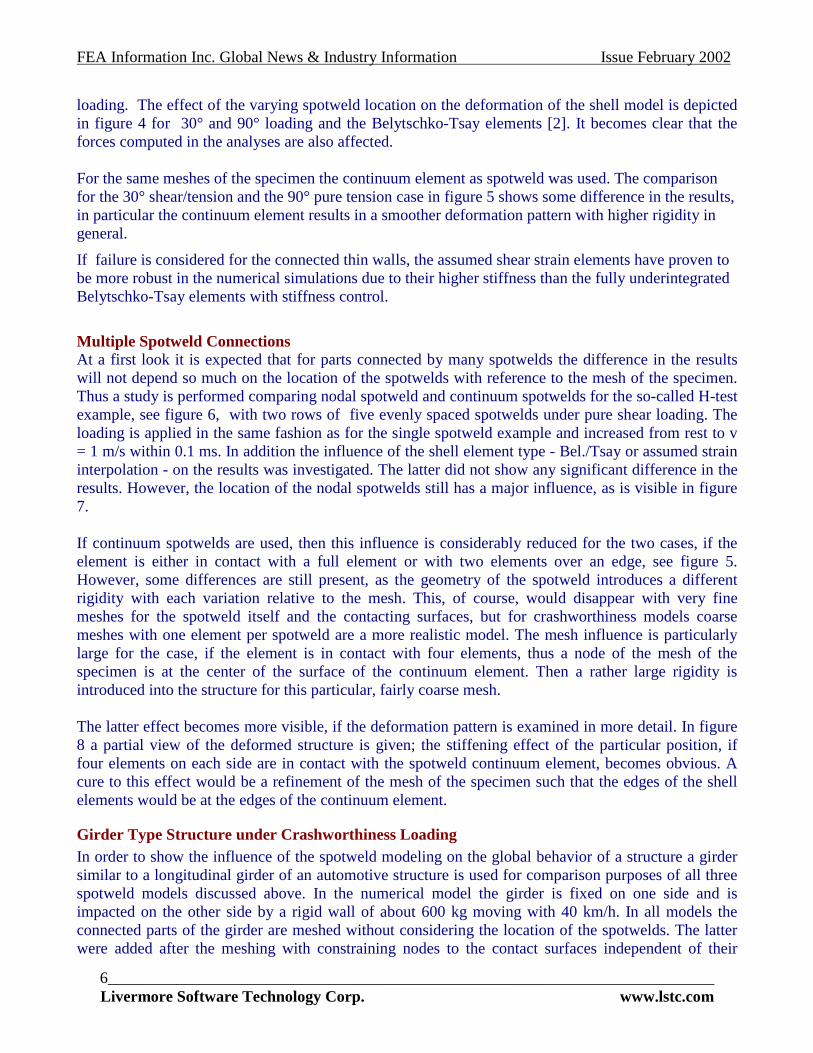
Figure 1 Contact shell set for spotweld modeling (left), Continuum element as spotweld (right) Figure 2 Numerical model for single spotweld connection; FE meshes (left) and general loading model (right) with variation of loading angle Figure 3 Variation of mesh density and location of connection nodes within elements
30° 0°
90°
Spotweld
Measured Force
60°
FEA Information Inc. Global News & Industry Information Issue February 2002
9____________________________________________________________________________ The Japan Research Institute Ltd. www.jri.co.jp
Figure 4 Deformation of single spotweld connection for nodal spotweld model; variation of relative location of connection in element; 30° (left, combined shear/tension) and 90° (right, pure tension) loading
30° 90°
90° At center of element edge
At element corner
In element center 30° In element center 90°
At element corner
At center of element edge 30°
FEA Information Inc. Global News & Industry Information Issue February 2002
10____________________________________________________________________________ Livermore Software Technology Corp. www.lstc.com
Figure 5 Deformation of single spotweld connection for continuum spotweld model; variation of relative location of connection in element; 30° (left, combined shear/tension) and 90° (right, pure tension) loading
90° 30°
30° 90°
At element edge
In element corner
At element edge
In element corner
At element corner At element corner 90° 30°
FEA Information Inc. Global News & Industry Information Issue February 2002
11____________________________________________________________________________ The Japan Research Institute Ltd. www.jri.co.jp
Figure 6 Multiple spotweld example; deformation pattern (left); measured spotweld forces vs. deformation for varied location of the spotweld nodes for nodal connections (right); 0° (pure shear) loading Figure 7 Measured spotweld forces vs. deformation for varied location of the spotweld nodes for continuum spotwelds; 0° (pure shear) loading
Displacement
Spotweld at element center
Spotweld at element edge
Spotweld at corner
Fo
rce
at R
igid
Wal
l
FEA Information Inc. Global News & Industry Information Issue February 2002
12____________________________________________________________________________ Livermore Software Technology Corp. www.lstc.com
Figure 8 Deformation pattern of multiple spotweld example under pure shear loading; continuum spotweld; partial view Figure 9 Longitudinal girder model under crash loading; deformation states; nodal spotweld model
Spotweld on node Spotweld on node Spotweld on node
FEA Information Inc. Global News & Industry Information Issue February 2002
13____________________________________________________________________________ The Japan Research Institute Ltd. www.jri.co.jp
Figure 10 Longitudinal girder model under crash loading; deformation states; continuum spotweld model be a typical example for a structure under stability loading which may be sensitive against less significant Figure 11 Longitudinal girder model under crash loading; comparison of time history for longitudinal force of three spotweld models
Fo
rce
atR
igid
Wal
l
Beam nodal connect.
Contact shell set
Continuum spotweld
FEA Information Inc. Global News & Industry Information Issue February 2002
14____________________________________________________________________________ Livermore Software Technology Corp. www.lstc.com
Excerpted with permission of Desktop Engineering Magazine, a Helmers Publishing Inc. publication - www.deskeng.com
Desktop Engineering - July 2001
Benchmarking Graphics Refine Your Palate, Skip the Homebrew © Jake Richter is a technology consultant living on the Caribbean island of Bonaire.
A few organizations do well in eliminating bias, leading us away from the “homebrew” benchmarks to provide a point of reference that fuels an informed buying decision. What benchmark should you use? Jake Richter
Want to know how your desktop engineering system rates in terms of sheer performance relative to that of your neighbor over in the other office or cubicle? Well, to settle the claims of whose system is best at whatever engineering application you might use, consider using benchmarking software. In more practical and less emotional terms, such software can also help you make a more informed buying decision when upgrading or replacing your current system.
What is a Benchmark? A benchmark, as my dictionary defines it, offers a point of reference from which measurements can be made. Benchmarking software runs a program or script on a system and produces one or more numeric results, which can be compared to the results from the same software running on a different system configuration. In some cases, the vendor of the benchmarking software may even publish certified core reference numbers on a website or in a magazine, so you can compare your system’s efficiency in running the benchmark with a broader range of systems.
You can probably find benchmarks under ever rock and behind every tree, many of which are “homebrew” benchmarks designed either by individual users, or by graphics board or application vendors to show off their products. Neither of these types of benchmarks is usually suitable for general purpose use, mainly because there may be some hidden bias.
Benchmark Categories Each of these organizations offers a variety of benchmarks, which can be categorized as follows:
Application Specific Benchmarks These benchmarks are a blend of scripts or macros combined with datasets. The datasets are derived from what a broad cross-section of “power users” of an application might use during the ordinary course of use of the application, while the scripts or macros define typical, sometimes compute intensive, operations a user of the application would perform on the datasets..
Simulation Benchmarks These benchmarks are typically standalone programs which simulate specific system functions (graphics, disk access, database access, etc.). Some of these benchmarks simulate the types of system access an application or set of applications would perform during the course of regular operation, while others merely attempt to simulate something imagined by the developer of the benchmark.
FEA Information Inc. Global News & Industry Information Issue February 2002
15____________________________________________________________________________ The Japan Research Institute Ltd. www.jri.co.jp
Primitive Benchmarks These benchmarks make no real attempt to simulate much of anything. They simply try to execute a selection of primitive operations as quickly as possible. For example, a primitive graphics benchmark may try and draw one million triangles of a given size or range of sizes to see how quickly a graphics board can pump them out. A primitive disk benchmark would perform a series of writes or reads.
(There can be a fine line between the bottom end of what I call a “simulation benchmark” and the top end of a “primitive benchmark”.)
Suitability of Benchmarks Is one particular type of benchmark better than another? It depends on what you want to test.
For testing raw performance of a peripheral, a primitive benchmark is the best option, although I need to add that raw performance of a peripheral is rather meaningless since the performance of a peripheral is stymied by other system components—the CPU, system memory speed and quantity, disk access, graphics hardware—in practical use of the peripheral.
Primitive benchmarks were commonly used in the early days of graphics board marketing because vendors found they could get impressive looking results. After all, who wouldn’t be swayed by a board that could draw three million triangles per second, especially when the next “best” board could only do two and half million? But now they have fallen out of favor because the numbers they produce have no relation to actual real-use performance. As such, primitive benchmarks have become less and less popular.
Application benchmarks try to take the operation of the whole system into account. However, one drawback of application benchmarks is that you generally need to have the application installed in order to run the benchmark; this could get costly, considering how expensive seats of certain engineering applications are, for example.
For specific applications, however, an application benchmark is the best generic way to determine relative performance of a system with that application.
Simulation benchmarks are something of a compromise. They don’t require the actual application, but they also don’t take into account the operation of other peripherals. In fact, they can be seen as a primitive benchmark where the sequence of operations executed for a peripheral test is tailored after what might occur during the use of an application.
Conclusion Benchmarking software, in particular application benchmarking software, has evolved into a useful tool for comparing relative performance of systems and performance-critical peripherals. It’s important to keep in mind that the way that a benchmark tests a system and application may not be the way you use a system and application. While these benchmarks will undoubtedly help steer you to a finalist group of well-performing system configurations, consider running your own “test” on systems you are considering buying. Use the system and application the way you normally would, to see if you can perceive a performance difference. If you can find an accommodating systems vendor, this effort may save you a chunk of change and get you the best bang for your proverbial buck.
FEA Information Inc. Global News & Industry Information Issue February 2002
16____________________________________________________________________________ Livermore Software Technology Corp. www.lstc.com
Reprinted with permission of CEI, ARUP, Erin Hatfield, 2002
Arup Uses CFD Visualization to Breathe Fresh Air Into Historical London Coliseum
by Erin Hatfield
LONDON, March 29, 2001 - During its nearly 100-year history, the London Coliseum has played host to many forms of entertainment, including horse races, musicals, varieties, cinema and finally the English National Opera. But while the Coliseum continually reinvented itself as a venue, its infrastructure fell behind the times.
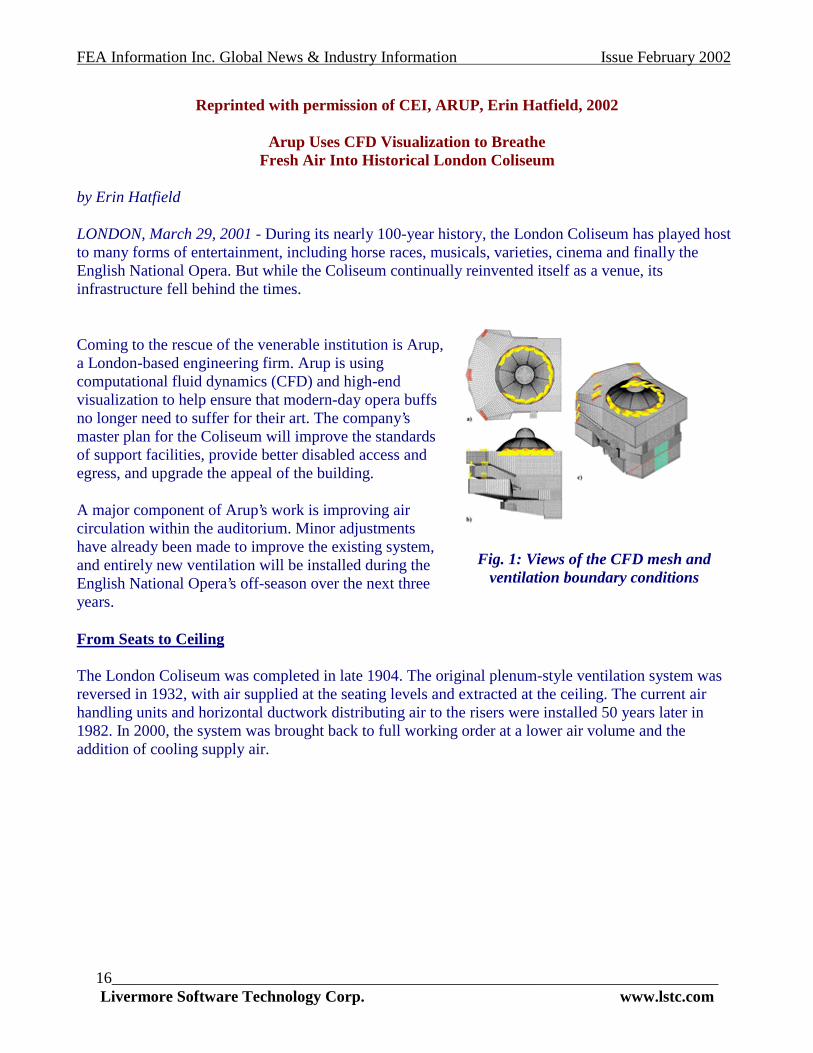
Coming to the rescue of the venerable institution is Arup, a London-based engineering firm. Arup is using computational fluid dynamics (CFD) and high-end visualization to help ensure that modern-day opera buffs no longer need to suffer for their art. The company’s master plan for the Coliseum will improve the standards of support facilities, provide better disabled access and egress, and upgrade the appeal of the building.
A major component of Arup’s work is improving air circulation within the auditorium. Minor adjustments have already been made to improve the existing system, and entirely new ventilation will be installed during the English National Opera’s off-season over the next three years.
From Seats to Ceiling
The London Coliseum was completed in late 1904. The original plenum-style ventilation system was reversed in 1932, with air supplied at the seating levels and extracted at the ceiling. The current air handling units and horizontal ductwork distributing air to the risers were installed 50 years later in 1982. In 2000, the system was brought back to full working order at a lower air volume and the addition of cooling supply air.
Fig. 1: Views of the CFD mesh and
ventilation boundary conditions

FEA Information Inc. Global News & Industry Information Issue February 2002
17____________________________________________________________________________ The Japan Research Institute Ltd. www.jri.co.jp
Arup’s new design is a direct inverse of the 1932 system. Air is supplied via nozzle banks in the domed ceiling. This creates a swirling airflow within the auditorium that doesn’t affect the quality of acoustics. Air is extracted at the back of the seating regions, creating proper ventilation of the entire space.
Arup’s CFD study took approximately five weeks to complete. STAR-CD software from Computational Dynamics Ltd. (London, UK) was used for CFD testing and EnSight software from CEI (Apex, N.C., USA) was used for 3D visualization. STAR-CD solved the momentum, mass and energy equations needed to predict detailed temperature distribution and air movement
within the auditorium. Animation capabilities within EnSight enabled engineers to see the invisible forces of airflow and conduct experiments that would be too costly and difficult to do in the real world.
Making the Case for Better Air
The computational domain for Arup’s ventilation study contained approximately 550,000 cells and represented the main auditorium with seating in the stalls, dress circle, upper circle and balcony, orchestra pit and boxes.
Arup used three CFD case scenarios to measure air velocity and temperature gradients. Results from STAR-CD were loaded into EnSight, where animated particle trace paths were used to visualize air flow within the auditorium. Predicted air velocities were plotted on bounding surfaces for the audience-occupied zones and along a streamline for particle traces.
"The air movement is very complex," says Darren Woolf, fluid dynamicist at Arup. "It’s driven by jet momentum, air temperature differentials (buoyancy), and wall-to-air temperature differentials that vary spatially and in magnitude. We needed to understand all of these these factors and their various influences in order to improve the design of the system. We also needed to communicate our results. EnSight enabled us to create live demonstration materials and animations that convey the information in a way that’s easy to understand."
In all three cases, air produced from the nozzles was set at 17ºC (63ºF). A convective heat load equivalent to 35W per person for the total 2,364-person occupancy was applied, giving engineers a feel for the atmosphere of the Coliseum under peak conditions. Lighting and other stage effects were not
Fig. 2: Occupied zones (and ventilation
boundaries)
Fig. 3: Views of air movement with
temperatures from the dome (Case 3)
FEA Information Inc. Global News & Industry Information Issue February 2002
18____________________________________________________________________________ Livermore Software Technology Corp. www.lstc.com
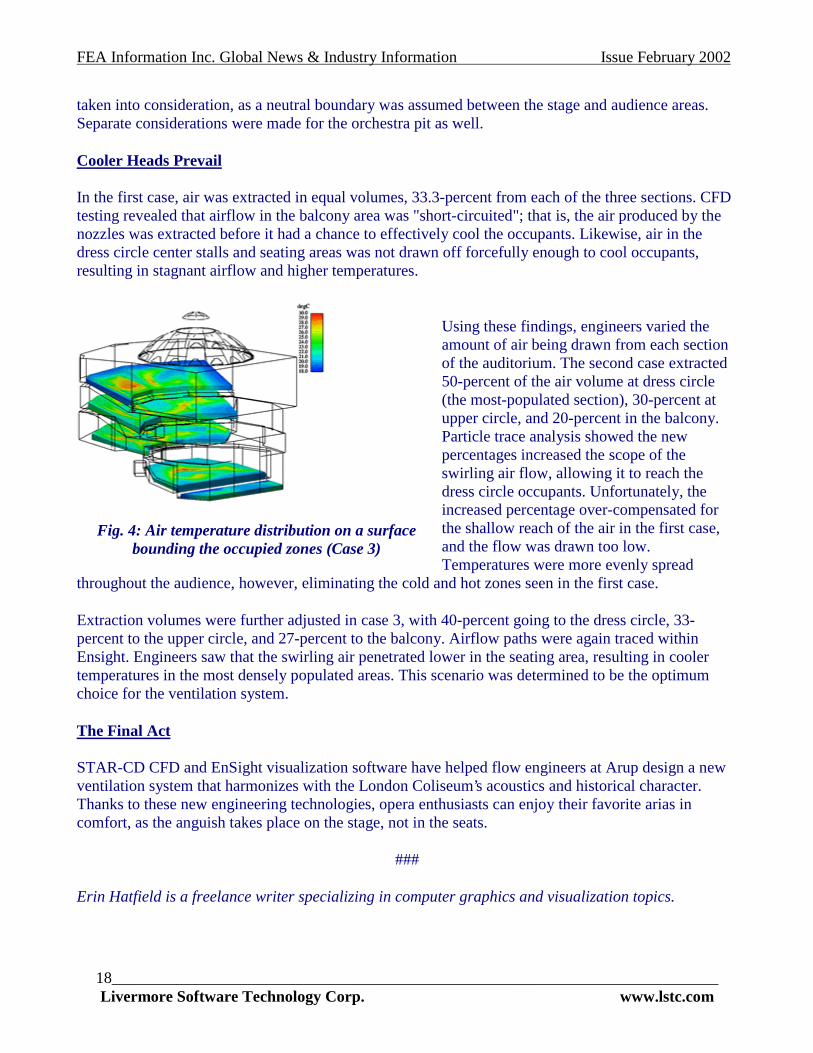
taken into consideration, as a neutral boundary was assumed between the stage and audience areas. Separate considerations were made for the orchestra pit as well.
Cooler Heads Prevail
In the first case, air was extracted in equal volumes, 33.3-percent from each of the three sections. CFD testing revealed that airflow in the balcony area was "short-circuited"; that is, the air produced by the nozzles was extracted before it had a chance to effectively cool the occupants. Likewise, air in the dress circle center stalls and seating areas was not drawn off forcefully enough to cool occupants, resulting in stagnant airflow and higher temperatures.
Using these findings, engineers varied the amount of air being drawn from each section of the auditorium. The second case extracted 50-percent of the air volume at dress circle (the most-populated section), 30-percent at upper circle, and 20-percent in the balcony. Particle trace analysis showed the new percentages increased the scope of the swirling air flow, allowing it to reach the dress circle occupants. Unfortunately, the increased percentage over-compensated for the shallow reach of the air in the first case, and the flow was drawn too low. Temperatures were more evenly spread
throughout the audience, however, eliminating the cold and hot zones seen in the first case.
Extraction volumes were further adjusted in case 3, with 40-percent going to the dress circle, 33-percent to the upper circle, and 27-percent to the balcony. Airflow paths were again traced within Ensight. Engineers saw that the swirling air penetrated lower in the seating area, resulting in cooler temperatures in the most densely populated areas. This scenario was determined to be the optimum choice for the ventilation system.
The Final Act
STAR-CD CFD and EnSight visualization software have helped flow engineers at Arup design a new ventilation system that harmonizes with the London Coliseum’s acoustics and historical character. Thanks to these new engineering technologies, opera enthusiasts can enjoy their favorite arias in comfort, as the anguish takes place on the stage, not in the seats.
###
Erin Hatfield is a freelance writer specializing in computer graphics and visualization topics.
Fig. 4: Air temperature distribution on a surface
bounding the occupied zones (Case 3)

FEA Information Inc. Global News & Industry Information Issue February 2002
19____________________________________________________________________________ The Japan Research Institute Ltd. www.jri.co.jp
FEA Information News Previously Showcased Archived on the site on the News Page
FEA Information Site Additions: Added AVI #25: Calibration test of the leg impactor used for pedestrian safety Added Chapt. 2: Crashworthiness Engineering with LS-DYNA by Paul A. Du Bois Added Websites: LS-DYNA Germany – LS-DYNA Russia. Added New Participant: CEI Computational Engineering International Added New Participant: CAD-FEM GmbH
January 07
Software JRI JMAG Software MSC Linux MSC Linux Distributor DYNAmore Located in Germany
January 14
Software ETA Dynaform Hardware SGI SGI Octane 2 Distributor LEAP Located in Australia
January 20
Software: Oasys, Ltd. Application - Nuclear Software EASi-Engineering EASi-Crash Distributor CADFEM Located in Germany
January 28
Software: CEI EnSight Software Fujitsu Notebooks P Series Distributor MFAC Located in Canada
FEA Information Inc. Global News & Industry Information Issue February 2002
20____________________________________________________________________________ Livermore Software Technology Corp. www.lstc.com
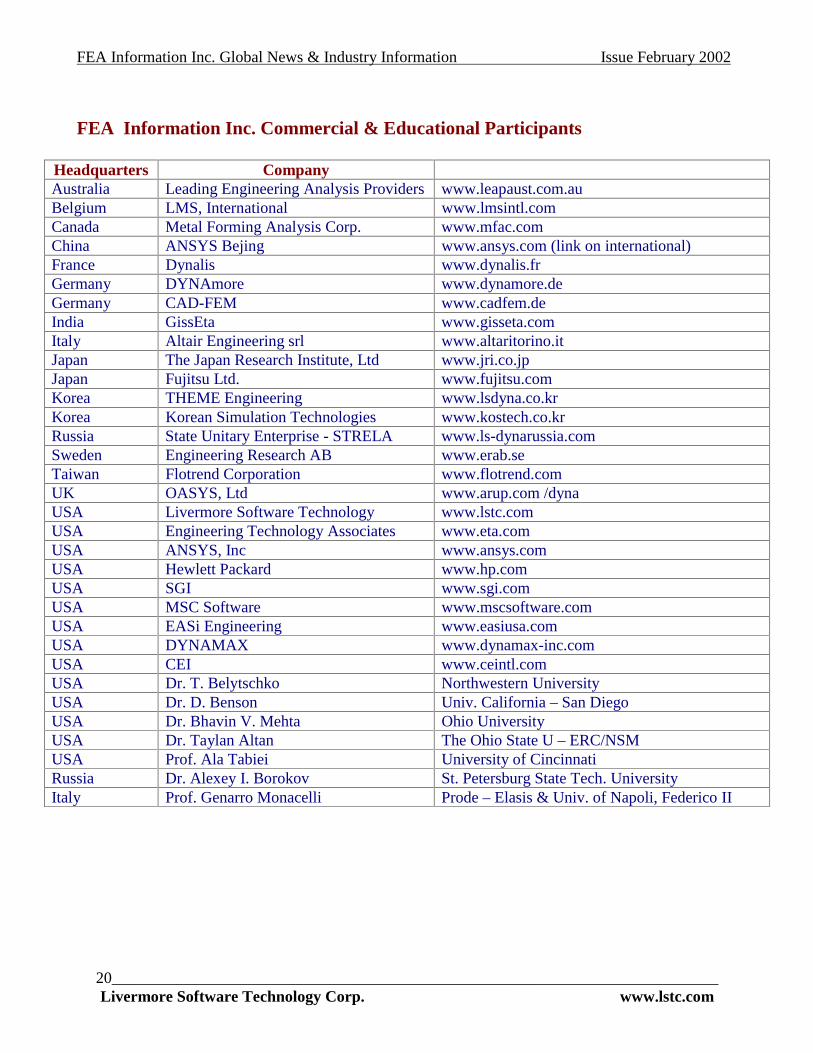
FEA Information Inc. Commercial & Educational Participants
Headquarters Company Australia Leading Engineering Analysis Providers www.leapaust.com.au Belgium LMS, International www.lmsintl.com Canada Metal Forming Analysis Corp. www.mfac.com China ANSYS Bejing www.ansys.com (link on international) France Dynalis www.dynalis.fr Germany DYNAmore www.dynamore.de Germany CAD-FEM www.cadfem.de India GissEta www.gisseta.com Italy Altair Engineering srl www.altaritorino.it Japan The Japan Research Institute, Ltd www.jri.co.jp Japan Fujitsu Ltd. www.fujitsu.com Korea THEME Engineering www.lsdyna.co.kr Korea Korean Simulation Technologies www.kostech.co.kr Russia State Unitary Enterprise - STRELA www.ls-dynarussia.com Sweden Engineering Research AB www.erab.se Taiwan Flotrend Corporation www.flotrend.com UK OASYS, Ltd www.arup.com /dyna USA Livermore Software Technology www.lstc.com USA Engineering Technology Associates www.eta.com USA ANSYS, Inc www.ansys.com USA Hewlett Packard www.hp.com USA SGI www.sgi.com USA MSC Software www.mscsoftware.com USA EASi Engineering www.easiusa.com USA DYNAMAX www.dynamax-inc.com USA CEI www.ceintl.com USA Dr. T. Belytschko Northwestern University USA Dr. D. Benson Univ. California – San Diego USA Dr. Bhavin V. Mehta Ohio University USA Dr. Taylan Altan The Ohio State U – ERC/NSM USA Prof. Ala Tabiei University of Cincinnati Russia Dr. Alexey I. Borokov St. Petersburg State Tech. University Italy Prof. Genarro Monacelli Prode – Elasis & Univ. of Napoli, Federico II

FEA Information Inc. Global News & Industry Information Issue February 2002
21____________________________________________________________________________ The Japan Research Institute Ltd. www.jri.co.jp
FEA Information Inc. Application Websites Sites open are highlighted in red
I have listed below the names of the engineering websites under FEA Information Inc. The red ones are now operational. I will be opening the others during 2002 with general and technical information about the specific engineering application.
If you are able to assist me with general or technical information about any engineering site listed below to share with the engineering community please contact Marsha Victory at [email protected] -
The following is in Alphabetical Order
2D Meshing www.2dmeshing.com
3D Meshing www.3dmeshing.com
ATB Model www.atbmodel.com
Auto Meshing www.automeshing.com
Auto-Acoustics-Vibration www.auto-acoustics-vibration.com
CAE Analysis www.caeanalysis.com
CAE Information www.caeinformation.com
CAE Resources www.caeresources.com
Composite Models (will be on line 04/01/02) www.compositemodels.com
Computational Dynamics www.computationaldynamics.com
Computational Fluid Dynamics www.computationalfluiddynamics.com
Computational Structural Dynamics www.computationalstructuraldynamics
Computer Aided Engineering www.computeraidedengineering.com
Computer Aided Testing www.computeraidedtesting.com
Crash Optimization www.crashoptimization.com
Crash-Analysis www.crash-analysis.com
Drop Testing www.droptesting.com
Eulerian Formulation www.eulerianformulation.com
Euler-Lagrange www.euler-lagrange.com
Explicit FEA www.explicitfea.com
Explicit Finite Element www.explicitfiniteelement.com
Explicit Transient Dynamics www.explicittransientdynamics.com
FEA Information www.feainformation.com

FEA Information Inc. Global News & Industry Information Issue February 2002
22____________________________________________________________________________ Livermore Software Technology Corp. www.lstc.com
FEA Publications www.feapublications.com
FEA Simulation www.feasimulation.com
FEA Technology www.featechnology.com
Finite Element www.finiteelement.net
Fluid-Structure Interaction www.fluid-structureinteraction.com
Geomaterial Modeling www.geomaterialmodeling.com
Geometric Software Solutions www.geometricsoftwaresolutions.com
Heat Transfer Analysis www.heattransferanalysis.com
Hexmesh www.hexmesh.com
HPC Servers www.hpcservers.com
Impact-Dynamics www.impact-dynamics.com
Implicit FEA www.implicitfea.com
Implicit Finite Element www.implicitfiniteelement.com
Knowledge Based Engineering www.knowledgebasedengineering.com
Lagrangian Formulation www.lagrangianformulation.com
Linear Structural Analysis www.linearstructuralanalysis.com
Linux For PC www.linuxforpc.com
Linux For Servers www.linuxforservers.com
LS-DYNA www.ls-dyna.com
LS-OPT www.ls-opt.com
Manufacturing Automation www.manufacturingautomation.com
Massively Parallel Computers www.massivelyparallelcomputers.com
Material Forming www.materialforming.com
Mesh Generating www.meshgenerating.com
Meshless Methods www.meshlessmethods.com
Metal Forming Simulation www.metalformingsimulation.com
Noise Vibration Engineering www.noisevibrationengineering.com
Nonconformal www.nonconformal.com
Occupant Safety www.occupantsafety.com
Simulation Aided Design www.simulationaideddesign.com
Simulation Based Design www.simulationbaseddesign.com
Sparse Solvers www.sparsesolvers.com
Structural Crashworthiness www.structuralcrashworthiness.com

FEA Information Inc. Global News & Industry Information Issue February 2002
23____________________________________________________________________________ The Japan Research Institute Ltd. www.jri.co.jp
Super-Plastic www.super-plastic.com
Tetmesh www.tetmesh.com
Tube Hydroforming www.tubehydroforming.com
Turbulence Modeling www.turbulencemodeling.com
Under Water Shock Analysis www.underwatershockanalysis.com
Virtual Hybrid Prototype www.virtualhybridprototype.com
Virtual Prototype Testing www.virtualprototypetesting.com
Warhead Analysis www.warheadanalysis.com
FEA Information Inc. Global News & Industry Information Issue February 2002
24____________________________________________________________________________ Livermore Software Technology Corp. www.lstc.com
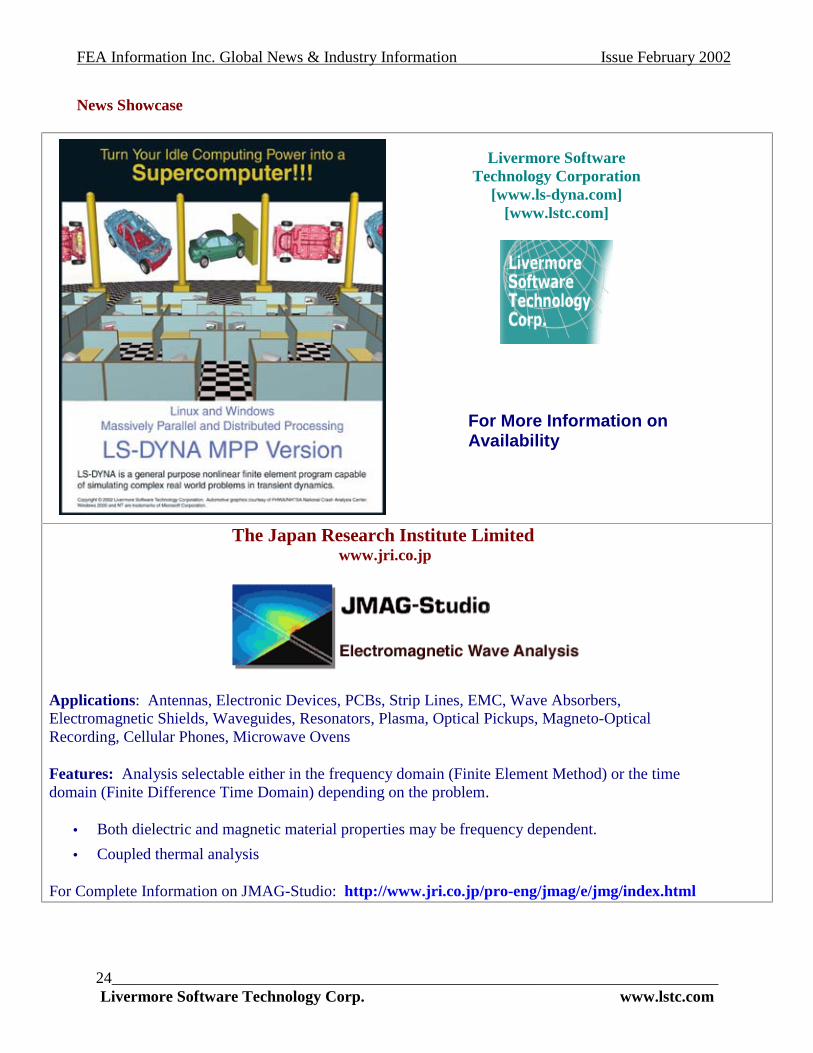
News Showcase
The Japan Research Institute Limited www.jri.co.jp
Applications: Antennas, Electronic Devices, PCBs, Strip Lines, EMC, Wave Absorbers, Electromagnetic Shields, Waveguides, Resonators, Plasma, Optical Pickups, Magneto-Optical Recording, Cellular Phones, Microwave Ovens
Features: Analysis selectable either in the frequency domain (Finite Element Method) or the time domain (Finite Difference Time Domain) depending on the problem.
• Both dielectric and magnetic material properties may be frequency dependent.
• Coupled thermal analysis
For Complete Information on JMAG-Studio: http://www.jri.co.jp/pro-eng/jmag/e/jmg/index.html
Livermore Software Technology Corporation
[www.ls-dyna.com] [www.lstc.com]
For More Information on Availability