ETHIOPIA - document.linknca.comdocument.linknca.com/159/.../catDoc229/nca_ethiopia... · Fedis...
74
ETHIOPIA EAST HARARGHE ZONE, FEDIS AND KERSA WOREDAS Publication : September 2014 Photo : © Agnès Varraine-Leca FINAL REPORT
Transcript of ETHIOPIA - document.linknca.comdocument.linknca.com/159/.../catDoc229/nca_ethiopia... · Fedis...
ETHIOPIAEAST HARARGHE ZONE, FEDIS AND KERSA WOREDAS
Publication : September 2014
Photo : © Agnès Varraine-Leca
FINAL
REPORT
De formation initiale en anthropologie de la santé, j’ai dével-oppé, au cours de mes diverses expériences, mon champ de compétences techniques mais aussi de gestion de pro-jet. Au travers des collaborations avec les agences des Nations Unies, les ONG, les COREVIH et les associations locales, j’ai développé une approche de recherche-action sur des sujets liés à l’épidémie due au VIH, la nutrition et la santé communautaire. Cette démarche a concilié enquêtes qualitatives socio-culturelles, recommandations opéra-tionnelles, formations et renforcement des capacités, suivi et évaluation d’actions mises en place principalement en Afrique, Caraïbes et France. Ce parcours repose sur des convictions et une éthique professionnelle dans la lutte contre les inégalités en santé et la discrimination et une attention soutenue au rapport de genre
The author :Carine MagenLink NCA Expert

ACF East Hararghe Nutrition Causal Analysis Report Page 1
Carine Magen, Health Anthropologist, and ACF team, Ethiopia mission
11/1/2014
Action Contre La Faim_ Ethiopia mission
Nutritional Causal Analysis East Hararghe Zone, Fedis and Kersa Woredas, Ethiopia, August, 2014

ACF East Hararghe Nutrition Causal Analysis Report Page 2
LIST OF ACRONYMS
ARI Acute Respiratory Infection BCG Bacillus Calmette Guerin CBN Community Based Nutrition CGC Charcher, Gololicha zone (Coffee, Khat, Maize) CVG Khat, Vegetable CI Confidence Interval CMAM Community-based Management of Acute Malnutrition CDR Crude Death Rate CHD Community Health Day CLTS Community Led Total Sanitation CSB Corn Soya Blended food DE Design Effect DPPO Disaster Preparedness and Prevention Office DRMFSS Disaster Risk Management and Food Security Sector ENA Emergency Nutrition Assessment ENCU Emergency Nutrition Coordination Unit EPI Extended Programme of Immunization ETB Ethiopian Birr FGD Focus Group Discussion GAM Global Acute Malnutrition GBG Gursum and Babile zone (sorghum, maize, haricot bean) HH Households HRF Humanitarian Response Fund IGA Income generating activities IMC International Medical Corps IYCF Infant and Young Child Feeding MAM Moderate Acute Malnutrition MNC Mother with Malnourished Child MUAC Mid-Upper Arm Circumference NCA Nutrition Causal Analysis NNP National Nutrition program NCHS National Centre for Health Statistics ODPPC Oromiya Disaster Prevention and Preparedness Commission OTP Out-Patient Therapeutic Program PPS Probability Proportional to Population Size PLW Pregnant & Lactating Women PSNP Productive Safety Net Program RHB Regional Health Bureau SAM Severe Acute Malnutrition SC Stabilization Centre SMART Standardized Monitoring and Assessment during Relief and Transition SMS Sorghum, maize, Khat SPSS Satirical Package for Social Scientists SD Standard Deviation TFP Therapeutic Feeding Program TSFP Targeted Supplementary Feeding Program U5 Under five (years of age) U5MR Under-five Mortality Rate UNICEF United Nations Children’s Fund WBP Wheat, Barley, Potato WFP World Food Programme WHO World Health Organization WHZ Weight for height Z-score WAZ Weight for Age Z-score
ACF East Hararghe Nutrition Causal Analysis Report Page 3
ACKNOWLEDGEMENTS
First and foremost, ACF Ethiopia appreciated the Federal ENCU, Oromiya and East Hararghe zone DPPO and Health Bureau for the support provided for the success of this Nutrition Causal Analysis study.
ACF would also like to extend its appreciation to Kersa and Fedis woredas DPPO and health offices for their support and provision of vital information for the input of this NCA study.
ACF would like to take this opportunity to recognize the supervisors’ and enumerators’ role in collecting the data.
The study data could not have been obtained without the cooperation of the respective kebele and village leaders; hence, ACF wishes to thank the individual families who allowed the study team members to finalize this exercise.
The financial support of HRF through UNOCHA for implementation of the study is gratefully acknowledged.
Finally, ACF’s appreciation goes to all of those who directly or indirectly contributed to the success of this study especially the NCA teams on the ground.
ACF East Hararghe Nutrition Causal Analysis Report Page 4
EXECUTIVE SUMMARY
This report presents the process and results of the Nutrition Causal Analysis (NCA) study undertaken in East Hararghe zone of Ethiopia. The objective of this study was to provide a greater level of understanding of the possible causes of acute malnutrition of children 6 - 59 months in 3 livelihood zones in two districts / woredas (Fedis and Kersa) of East Harerghe Zone (Oromia Region).
The methodology followed the stages developed by ACF which include: - An expert workshop to develop and prioritize a set of local causal hypotheses of undernutrition. - A nutrition SMART survey - A quantitative investigation of key risk factors through a questionnaire adapted from the expert
workshop
- A qualitative inquiry, including a bibliographical review and a field investigation, of community perceptions, practices and constraints
Main results:
Anthropometric measurements of the SMART study showed that the assessed areas presented a high prevalence of malnutrition. The point prevalence of global acute malnutrition (GAM) was estimated at 12.0% (95% C.I:8.9 - 16.1%) for all the study area (Fedis and Kersa woredas), with SAM 1.3% (95% C.I: 0.5 - 3.2%) (using NCHS, 1977). 0.2 % of children were identified as having nutritional bi-lateral pitting edema.
Kersa presented a GAM rate of 7.5% (4.3-12.8 95% CI) with SAM rate of 0.8% (0.2-3.1 95% CI), and edema 0%. Fedis presented higher indicators, with GAM rate of 15.3% (10.4-21.9 95% CI) and SAM rate of 1.7% (0.5-5.6 95% CI).
Data revealed that boys are slightly more affected by malnutrition than girls, with higher GAM rates in Kersa (boys 8.9%, girls 6.2%), and higher SAM rates among boys in Fedis (boys 2.2%, girls 1.2%). Younger children (6 to 17 months) are more affected by severe acute malnutrition, while children 18-29 months are more affected by moderate malnutrition in both woredas.
Some common family practices could explain these data, such as additional drinks before age of 6 months (to relieve abdominal cramps or to make the “little boys” stronger), or hierarchical organization of meals which is not favoring children, among others. Exclusive breastfeeding is known but little practiced; several situations push women to sudden weaning, for example, a new pregnancy; women also think that contraceptive use will damage the quality of their breastfeeding milk. Poor access to drinking water is a major factor in some areas (especially in Fedis woreda) and access to water is also a determinant for food safety and hygiene practices in households.
Food insecurity and utilization of available resources have an impact on feeding patterns of children but also on women’s daily workload as they are not available enough to take care of their children. The sale and consumption of khat constitute a risk factor worsening malnutrition in this area: women’s workload increased because of the sale of khat; the nutritional status of pregnant mothers who chew khat predisposes the child to be born underweight which predisposes to diseases and malnutrition. Additionally, in the studied area, pregnant women mentionned many food restrictions (fruits, meats, certain vegetables) to ensure a delivery without complications. This voluntary anorexia is worsened when the mother consumes khat since loss of appetite is one of its major effects.
Despite the work of the HEWs (health extension wokers) to raise awareness on malnutrition treatment availability, this remains deficient and leads families to use harmful traditional medicine practices instead of timely going to health facilities. This tendency is increased by the irregularity of distribution and use of Plumpy Nut and the risk of refusal of admission of the child in the programs at the beginning of the disease. Moreover, moderate malnutrition is not always detected by community/health workers, according to the families.
Underlying causes of malnutrition in this area have to be understood broadly and aspects related to the social structure of the community, the inadequacy of some infrastructures (road accessibility), gender relationship, intra-family social organization, etc., have to be considered.
ACF East Hararghe Nutrition Causal Analysis Report Page 5
Table of Contents
LIST OF ACRONYMS .............................................................................................. 2 ACKNOWLEDGEMENTS ........................................................................................... 3 EXECUTIVE SUMMARY ............................................................................................ 4 1. Introduction ................................................................................................ 7 2. Context ...................................................................................................... 7
2.1 Livelihood Zones ....................................................................................... 10 3. Objectives of the study ................................................................................. 13 4. NCA Methodology ........................................................................................ 13
4.1 Overview of the NCA Approach ..................................................................... 13 4.2 Methodology of quantitative survey ............................................................... 15
4.2.1 Area of coverage ................................................................................. 15 4.2.2 Survey design ...................................................................................... 15 4.2.3 The Survey Population ........................................................................... 16 4.2.4 Sample size ........................................................................................ 16 4.2.5 Clusters............................................................................................. 17 4.2.6 Sampling Procedure of Cluster and Household Selection ................................. 17 4.2.7 Selection of household .......................................................................... 18 4.2.8 Data Collection Methods ........................................................................ 18 4.2.9 Anthropometric measurements ................................................................ 18 4.2.10 Training and Supervision ....................................................................... 19 4.2.11 Data Collection Tools .......................................................................... 19 4.2.12 Organization and Management of the Survey .............................................. 20 4.2.13 Data Quality Control............................................................................ 20 4.2.14 Data Analysis ..................................................................................... 20
4.3 Methodology of Qualitative Survey ................................................................ 20 4.3.1 Sampling ........................................................................................... 20 4.3.2 Collection of Qualitative Data ................................................................. 21
4.4 Limitations of the Study ............................................................................. 21 5. Partnership and Communication ...................................................................... 21 6. The Hypothesis Candidates ............................................................................ 22 7. Nutritional Context / Seasonality of Malnutrition ................................................. 22 8. Findings .................................................................................................... 24
8.1 SMART Survey Results ................................................................................. 24 8.2 Food Security ........................................................................................... 27
8.2.1 Climatic change ................................................................................... 30 8.2.2 Coping Mechanism / Season .................................................................... 31 8.2.3 Khat / Chat ........................................................................................ 32 8.2.4 Problem in Quantity and Quality of Food .................................................... 33
8.3 Nutritional Status of Mothers Pregnant/Lactating .............................................. 34 8.4 Diseases Associated .................................................................................... 35 8.5 WASH ..................................................................................................... 36 8.6 Improper Identification of Target Groups ........................................................ 38 8.7 Low Household Income ................................................................................ 39 8.8 Health Services / Sanitary Environment........................................................... 39
8.8.1 Nutrition program ................................................................................ 41 8.8.2 Traditional Healers ............................................................................... 42 8.8.3 Self-Medication ................................................................................... 43 8.8.4 Private Sector ..................................................................................... 43
8.9 Workload / Availability for Children ............................................................... 43 8.10 Care / Feeding Practices ............................................................................ 46
8.10.1 Breastfeeding .................................................................................... 47 8.10.2 Feeding Habits in Family ...................................................................... 49
8.11 Lack of Awareness on Malnutrition ............................................................... 50 8.11.1 Representations in Community ............................................................... 50 8.11.2 Plumpy Nut ....................................................................................... 51 8.11.3 Lack of Knowledge/Awareness on Malnutrition in all Sectors .......................... 52
8.12 Family Planning / Birth Spacing ................................................................... 52 8.13 Socio-Cultural ......................................................................................... 54

ACF East Hararghe Nutrition Causal Analysis Report Page 6
8.13.1 Gender ............................................................................................ 54 8.13.2 Social Organization ............................................................................. 54
8.14 Inadequate Infrastructure .......................................................................... 55 8.15 Families with/without malnourished children and differences among woredas ......... 56
9. Conclusion ................................................................................................ 58 10. Preliminary recommendations ..................................................................... 60 11. Bibliography ........................................................................................... 63
To enhance readability of the report, excerpts from the literature review are framed in blue;
excerpts of the testimonies recorded in the field are framed in orange.

ACF East Hararghe Nutrition Causal Analysis Report Page 7
1. Introduction
The poor nutritional status of children and women has been a serious problem in Ethiopia for many years. Acute and chronic malnutrition are most prevalent, with half of Ethiopian children chronically malnourished and one in ten wasted; the 2011 EDHS
1 estimated the national prevalence of stunting
among children at 44.4%, the prevalence of underweight at 28.7% and wasting at 9.7%. Until recently, the broad multi-sectorial factors contributing to malnutrition had been insufficiently emphasized, with the focus placed on addressing food security as the primary means to address nutritional insecurity.
Reports of persistence of high rate of acute malnutrition in certain specific areas of East Hararghe, led the Technical Working Group (TWG) within the Emergency Nutrition Coordination Unit (ENCU) in Addis Ababa to request an analysis of the causes of malnutrition in East Hararghe zone. Indeed, this zone benefits from the support of several partners to tackle malnutrition. The HEW are in charge of diffusing malnutrition prevention programs, detecting and treating non complicated cases of SAM, and referring malnourished children with complications to of health centers’ stabilization centers. Health zone authorities expressed that the geographic coverage of nutritional programs now reached 100% and the national nutrition program has been revised recently in June 2013. All these efforts improved the overall nutritional situation of Ethiopian children:
“In Ethiopia, between 2000 and 2011, rates of stunting among children under 5 decreased from an estimated 57 per cent to 44 per cent.” UNICEF, key facts and figures on nutrition, April 2013
International NGO partners intervene in our study zone to support the work undertaken by local public health authorities. Despite the progress made, pockets of high malnutrition still persist. A governmental classification based on systematic tracking every 3 months (hotspot classification) makes it possible to identify the most vulnerable zones regarding malnutrition. The hotspot classification takes into account 5 main criteria to define vulnerability to malnutrition: health and nutrition (outbreaks, TFP admissions, etc.); agriculture (poor crop condition, water and/or pasture shortage, etc.); market (sale of productive livestock, increase of staple food over previous month; water for human consumption (high non-functionality rate of existing water schemes, poor quality of water, etc.) and education (high damage on school infrastructures, more than 10 days’ school closure for a significant number of schools, etc.). It is within this framework that the 2 woredas (Fedis and Kersa) included in the study were classified “hot spot 1” in September 2013, and Fedis was still “hot spot 1” in February 2014, while Kersa was classified level 2 at that time.
Concerning the annual evolution of malnutrition in East Hararghe zone, figures communicated by the public health authorities indicate a clear seasonal variation of the number of admissions in the health centers: the period from April-May until August seems most problematic, with high malnutrition admission rates among children.
To better understand the nutritional situation of children, it seemed necessary to lead a rigorous investigation of the underlying causes of malnutrition in the area. For this, and following ACF’s methodology, the study concentrated on populations sharing the same livelihood zones; three `livelihood zones' were chosen (covering most of the population); they are present in two woredas, Fedis and Kersa. Based on UNICEF conceptual framework of malnutrition, the study presented here is the result of the analysis of potential causes of undernutrition according to the methodology developed by ACF and its scientific partners (IRD - Institut de Recherche et de Development, Tufts University).
This study will be useful for public health actors and their multi-sectorial partners to adjust nutritional programs to specificities of the context of intervention and to families’ experiences in this area regarding underlying causes of malnutrition.
2. Context
East Hararghe (EH) is within the Ethiopian Region of Oromiya. EH is bordered in the southwest by the Shebelle River which separates it from Bale mountains, in the west by West Hararghe, in the north by Dire Dawa and in the north and east by the Somali Region. The Harare Region is an enclave inside
1 Ethiopia Demographic and Health Survey (EDHS), 2011
ACF East Hararghe Nutrition Causal Analysis Report Page 8
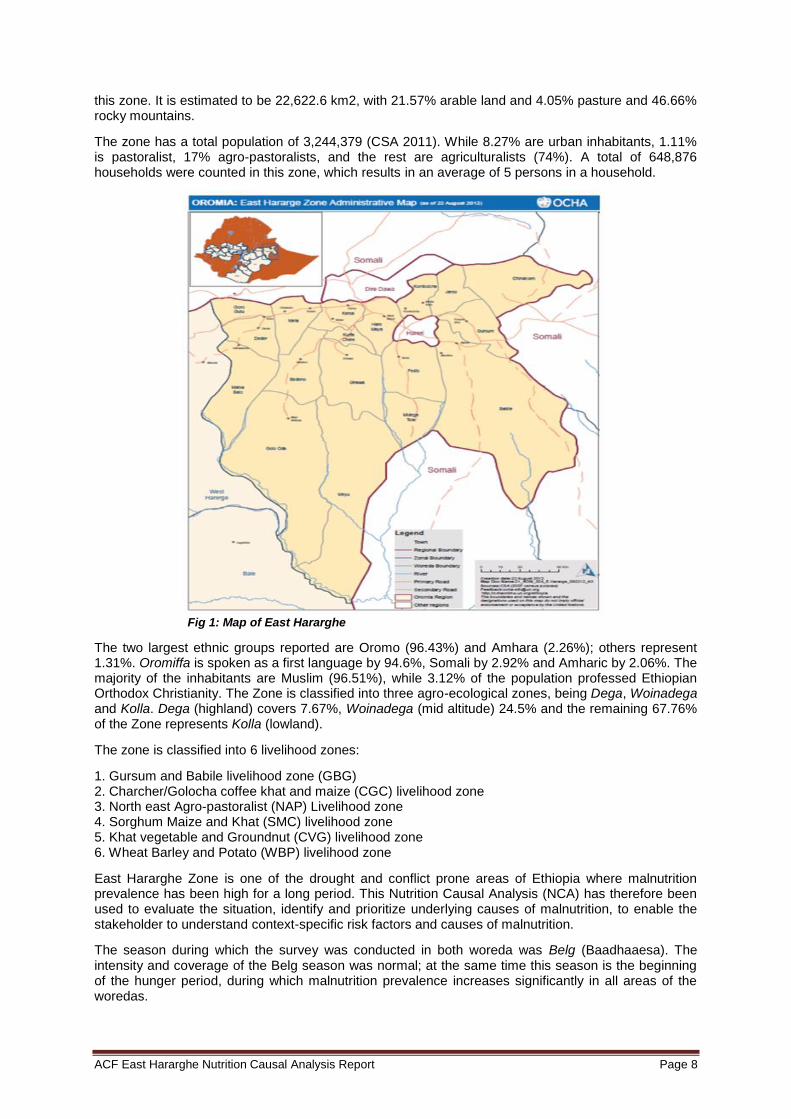
this zone. It is estimated to be 22,622.6 km2, with 21.57% arable land and 4.05% pasture and 46.66% rocky mountains.
The zone has a total population of 3,244,379 (CSA 2011). While 8.27% are urban inhabitants, 1.11% is pastoralist, 17% agro-pastoralists, and the rest are agriculturalists (74%). A total of 648,876 households were counted in this zone, which results in an average of 5 persons in a household.
Fig 1: Map of East Hararghe
The two largest ethnic groups reported are Oromo (96.43%) and Amhara (2.26%); others represent 1.31%. Oromiffa is spoken as a first language by 94.6%, Somali by 2.92% and Amharic by 2.06%. The majority of the inhabitants are Muslim (96.51%), while 3.12% of the population professed Ethiopian Orthodox Christianity. The Zone is classified into three agro-ecological zones, being Dega, Woinadega and Kolla. Dega (highland) covers 7.67%, Woinadega (mid altitude) 24.5% and the remaining 67.76% of the Zone represents Kolla (lowland).
The zone is classified into 6 livelihood zones:
1. Gursum and Babile livelihood zone (GBG) 2. Charcher/Golocha coffee khat and maize (CGC) livelihood zone 3. North east Agro-pastoralist (NAP) Livelihood zone 4. Sorghum Maize and Khat (SMC) livelihood zone 5. Khat vegetable and Groundnut (CVG) livelihood zone 6. Wheat Barley and Potato (WBP) livelihood zone
East Hararghe Zone is one of the drought and conflict prone areas of Ethiopia where malnutrition prevalence has been high for a long period. This Nutrition Causal Analysis (NCA) has therefore been used to evaluate the situation, identify and prioritize underlying causes of malnutrition, to enable the stakeholder to understand context-specific risk factors and causes of malnutrition.
The season during which the survey was conducted in both woreda was Belg (Baadhaaesa). The intensity and coverage of the Belg season was normal; at the same time this season is the beginning of the hunger period, during which malnutrition prevalence increases significantly in all areas of the woredas.
ACF East Hararghe Nutrition Causal Analysis Report Page 9
Major Belg crops in the zone are sorghum and maize with haricot beans, groundnut, khat and coffee widely cultivated. The total planted area for major crops, maize, sorghum, wheat and groundnut, contributes more than 90% of total crop production. Belg crops (2013) were adversely affected as they faced reduced moisture stress at the critical flowering and seed-setting period. Root crops, used as gap filling, suffered early blight and were also badly affected.
Livestock rearing is also important in the zone. Currently there is no shortage of pasture in most of the woredas. However, due to the poor rain (2013) most of the ponds in the lowland woredas were not recharged. As a result, some herders travel more than seven hours to the permanent rivers in search of water. This is commonly practiced in Fedis woreda. Following the good availability of pasture and water, animal productivity and body condition was improving (October, 2013).
Although there was a low supply of food grains to the local market, the price of major food crops was stable; however, prices are high compared to most markets in the region. The supply of staple cereals being sourced from other markets started earlier than normal this year. The price of maize and sorghum increased significantly with maize costing 700 to 750 ETB/ quintal.
The two woredas selected to be surveyed from the zone were Fedis and Kersa.
Fedis
Fedis woreda is bordering Babbile woreda in the East, Haremaya, Kurfa Calle Gurowa woredas in the west, Midega Tola in the South and Harare region in the North. The capital city of the woreda is located at 539 km south of Addis Ababa and 24km to the West of Harar town, which is the capital city of East Hararghe zone.
The total population is estimated to be 133,382 persons, of which the estimated urban population is 26,575 and estimated rural population is 127,877. Oromo are predominant by almost 100%. Most of the Fedis woreda populations is Muslim.
The woreda contains 19 rural kebeles and the altitude ranges from 1,050 to 2,118 meters above sea level. The livelihood of the population is 93.8% agro-pastoralist and the remaining 6.2% are urban dwellers. The cereal crops most commonly grown are Sorghum, Maize, Wheat, Barley and Groundnuts. Khat and Vegetables are the known cash crops. Cattle, goat and sheep are among the livestock species reared by the community. The woreda is both Meher and Belg dependent. Both rainy seasons are the ones which are very crucial in determining the production, water and pasture availability. Normally, Belg rains go from April to June and Meher rains go from May to August. The total area of land in the woreda is 110,502 hectares out of which 23,230 hectare are cultivated. The average land holding per household is reported to be 1.2 hectare/household. Soil degradation, erratic rainfall and farmland fragmentation contribute to lowered productivity in the area. Households are constrained by small land holdings, high price of inputs, inadequate credit services and lack of plow oxen. As the GBG livelihood zone is food deficit every year, the food gap is covered by food aid amounting to 15-25% for the poorest households.
Kersa
Kersa woreda is bordering Haromaya woreda in the East, Kurfa Calle woreda in the south, Dire Dawa City administration in the north and Meta Woreda in the West. The capital city of the woreda is located at 478km south of Addis Ababa and 42km to the West of Harar Town which is the capital city of East Hararghe zone.
The total population is estimated to be 199,601 persons, of which estimated urban population is 12,306 and estimated rural population is 187,293. Oromo are predominant by almost 100%. Most of the Kersa woreda populations is Muslim. The woreda contains 35 rural kebeles and the altitude ranges from 1,550 to 2,800 meters above sea level.
The livelihood of the population is 93.8% Agro-pastoralist and the remaining 6.2% are urban dwellers. The cereal crops most commonly grown are Sorghum, Maize, Wheat, Barley and Pulses in their order of importance. Khat and Vegetables are the known cash crops. Cattle, goat and sheep are among the livestock species reared by the community.
The woreda is both Meher and Belg dependent. Both rainy seasons are the ones which are very crucial in determining the production, water and pasture availability. Normally, Belg rains go from April to June and Meher rains go from May to August. The total area of land in the woreda is 54,494
ACF East Hararghe Nutrition Causal Analysis Report Page 10
hectares out of which 20,734 hectare are cultivated. The average land holding per household is reported to be 0.6 hectare/household. The main economic activities are food crop production, cash crop (khat) production and livestock production. The most important crops sold are khat, potatoes and onions. Wealth in the zone is determined by land size, livestock and other asset holdings.
2.1 Livelihood Zones
The study took place in different livelihood zones from the two woredas. The aim was to determine the connection between livelihood and food insecurity and to identify certain zones in which children are more exposed to malnutrition than in others. Essentially, the NCA methodology takes into account a homogeneous population (though different vulnerable groups are selected) sharing similar livelihood zones in order to extrapolate results and compare similar underlying causes.
The agro-ecological zone has a negative and significant effect on wasting. It was also hypothesized that the agro ecology location could be a proxy indicator for access to higher-level health care facilities and other socio economic variables. The prevalence of the survey result indicates that there was higher proportion of wasting in lowlands as compared to midland areas. Similarly, the regression analysis showed that significant association of wasting with lowland. In Prevalence of Wasting and Its Associated Factors of Children among 6-59 Months Age in Guto Gida District
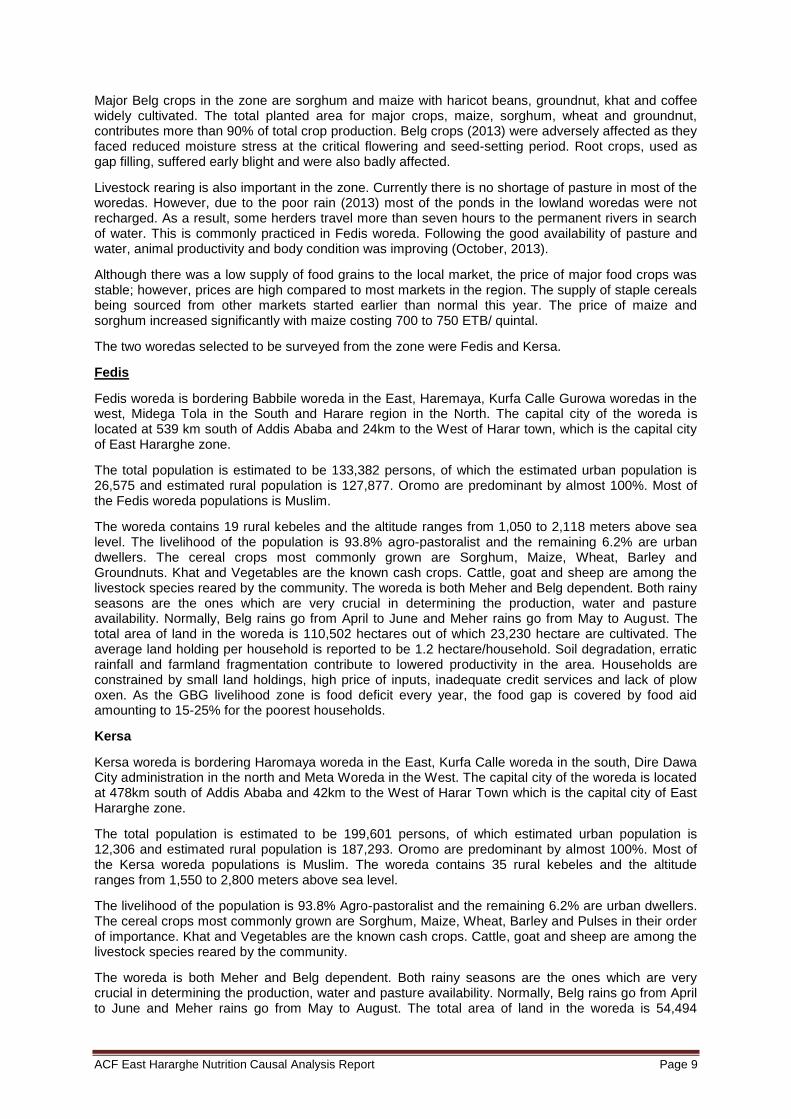
Khat Vegetable (CVG) Livelihood Zone, KERSA
The main economic activities are food crop production, cash crop (khat) production and livestock production. There are two rainy seasons: the short rainy season (Belg) extends from March to May and the main rainy season (Meher) extends from July to September. The zone is moderately productive, with a food deficit every year. The most important crops sold are khat, potatoes and onions. Food distribution in this zone either does not exist or is insignificant. Khat is traded in the months of April to May and September to October for rain fed farms. When there are frosts, all wealth group support each other to minimize its effect on the livelihood of the people. Wealth in the zone is determined by land size, livestock and other asset holdings.
Figure 2: CVG Livelihood zone2
Gursum and Babile Groundnut (GBG) Livelihood Zone (Fedis)
Erer and Hameresa rivers and the historical city of Harar are found in this zone. Soil degradation, erratic rainfall and farmland fragmentation contribute to lowered productivity in the area. The zone
2Oromiya Region Livelihood Profiles. Livelihood Integration Unit. Government of Ethiopia: Disaster Management & Food
Security Sector MOARD, USAID, July 2010
ACF East Hararghe Nutrition Causal Analysis Report Page 11
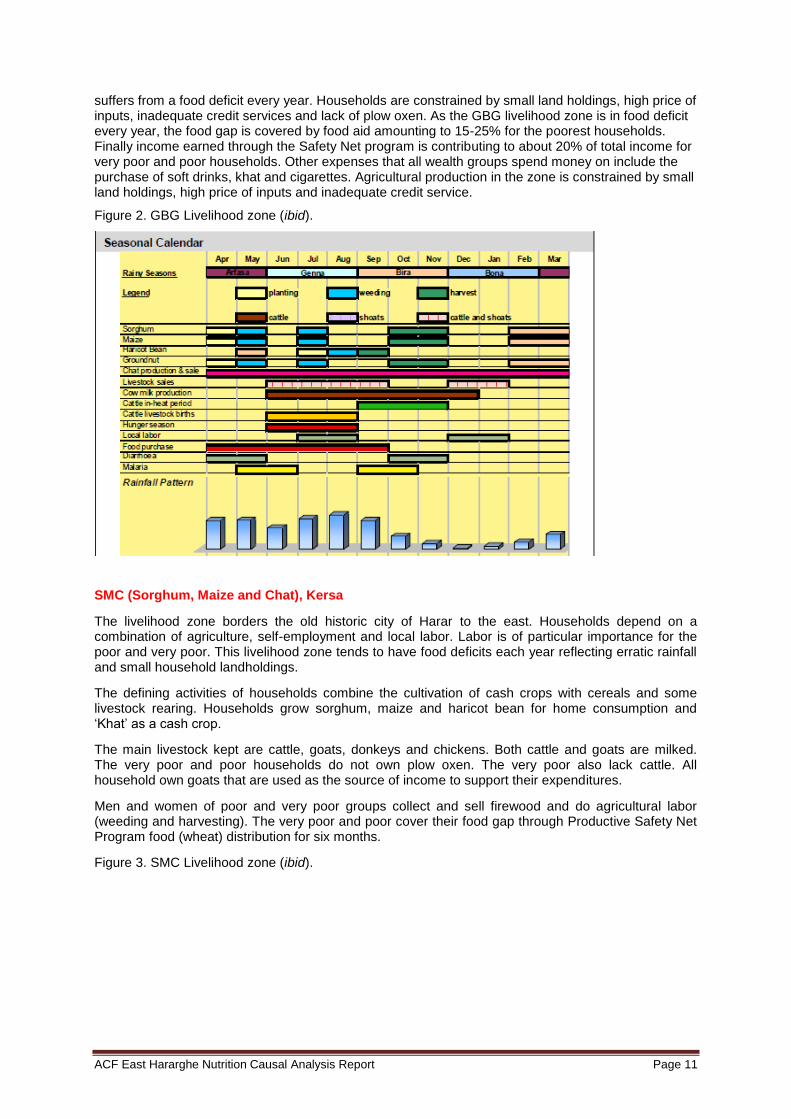
suffers from a food deficit every year. Households are constrained by small land holdings, high price of inputs, inadequate credit services and lack of plow oxen. As the GBG livelihood zone is in food deficit every year, the food gap is covered by food aid amounting to 15-25% for the poorest households. Finally income earned through the Safety Net program is contributing to about 20% of total income for very poor and poor households. Other expenses that all wealth groups spend money on include the purchase of soft drinks, khat and cigarettes. Agricultural production in the zone is constrained by small land holdings, high price of inputs and inadequate credit service.
Figure 2. GBG Livelihood zone (ibid).
SMC (Sorghum, Maize and Chat), Kersa
The livelihood zone borders the old historic city of Harar to the east. Households depend on a combination of agriculture, self-employment and local labor. Labor is of particular importance for the poor and very poor. This livelihood zone tends to have food deficits each year reflecting erratic rainfall and small household landholdings.
The defining activities of households combine the cultivation of cash crops with cereals and some livestock rearing. Households grow sorghum, maize and haricot bean for home consumption and ‘Khat’ as a cash crop.
The main livestock kept are cattle, goats, donkeys and chickens. Both cattle and goats are milked. The very poor and poor households do not own plow oxen. The very poor also lack cattle. All household own goats that are used as the source of income to support their expenditures.
Men and women of poor and very poor groups collect and sell firewood and do agricultural labor (weeding and harvesting). The very poor and poor cover their food gap through Productive Safety Net Program food (wheat) distribution for six months.
Figure 3. SMC Livelihood zone (ibid).
ACF East Hararghe Nutrition Causal Analysis Report Page 12
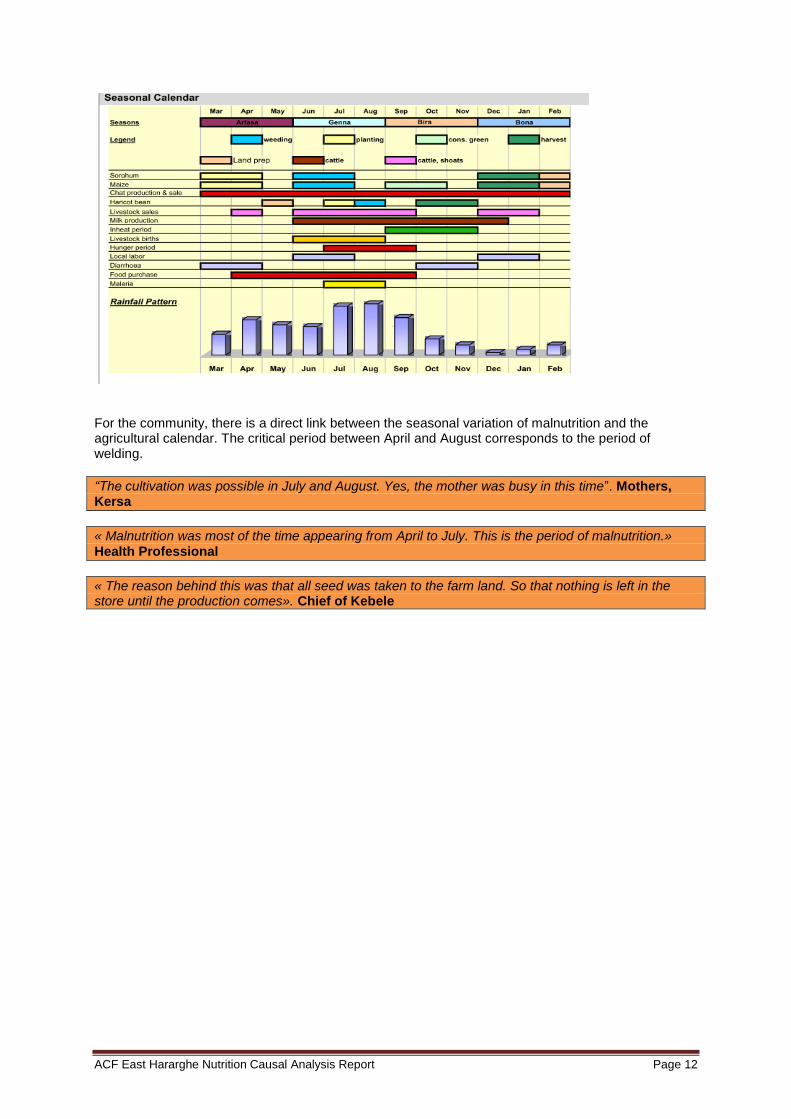
For the community, there is a direct link between the seasonal variation of malnutrition and the agricultural calendar. The critical period between April and August corresponds to the period of welding.
“The cultivation was possible in July and August. Yes, the mother was busy in this time”. Mothers, Kersa
« Malnutrition was most of the time appearing from April to July. This is the period of malnutrition.» Health Professional
« The reason behind this was that all seed was taken to the farm land. So that nothing is left in the store until the production comes». Chief of Kebele
ACF East Hararghe Nutrition Causal Analysis Report Page 13
3. Objectives of the study
Main Objective of the study
To identify main causes of child under-nutrition, in particular wasting of children age 6-59 months in three livelihood zones in East Hararghe
- The 3 livelihood zones are :
o SMC: Sorghum, Maize and Khat,
o CVG: Khat, Vegetable and Groundnut,
o GBG: Gursum, Babile, Ground nut livelihood zones,
- The study was conducted in two woredas: Kersa and Fedis
- See ‘study area’ section for rationale behind selecting this area.
Specific Objectives of the study
1. To develop an ‘emic’ (local) definition and understanding of good nutrition, malnutrition and the believed causes of under-nutrition within the target population
2. To understand how the community prioritizes risk factors of under-nutrition, according to: a) which factors are believed to cause under-nutrition, b) which causes are believed to be most prevalent, c) which causes are believed to have the most serious effects
3. To identify seasonal and historical trends in under-nutrition
4. To determine which causal pathways are likely to explain most under-nutrition cases in the area
5. To determine which sets of risk factors and pathways are likely to be most modifiable by stakeholders within a given context
4. NCA Methodology
4.1 Overview of the NCA Approach
An NCA is a structured, participatory, holistic, multi-sectoral study, based on the UNICEF causal framework, to build a case for nutrition causality in a local context.
Structured – the steps of the methodology are precisely defined and have all been tested in the field.
Participatory – the study is giving a real opportunity to national technical experts as well as caregivers in the community to express their opinion on the causes of undernutrition, and to discuss, review and finally to validate the conclusions of the study.
Holistic – undernutrition is here studied globally to avoid a sectoral approach, and to highlight the inter-relations between risk factors.
Multi-sectoral - a nutrition causal analysis (NCA) investigates and presents a 'multi-sectoral' overview of the contributing factors affecting nutritional status within a given community.
Based on the UNICEF Conceptual Framework - the NCA methodology uses the UNICEF framework to identify potential risk factors of under-nutrition.
Building a case for nutrition causality – the core exercise of an NCA is to identify and rank causal hypotheses by order of importance.
In a local context - causes of under-nutrition are often different from one location to another. The purpose of the methodology is to go beyond generic interventions by identifying really context specific causes in order to propose adequate solutions.
ACF East Hararghe Nutrition Causal Analysis Report Page 14
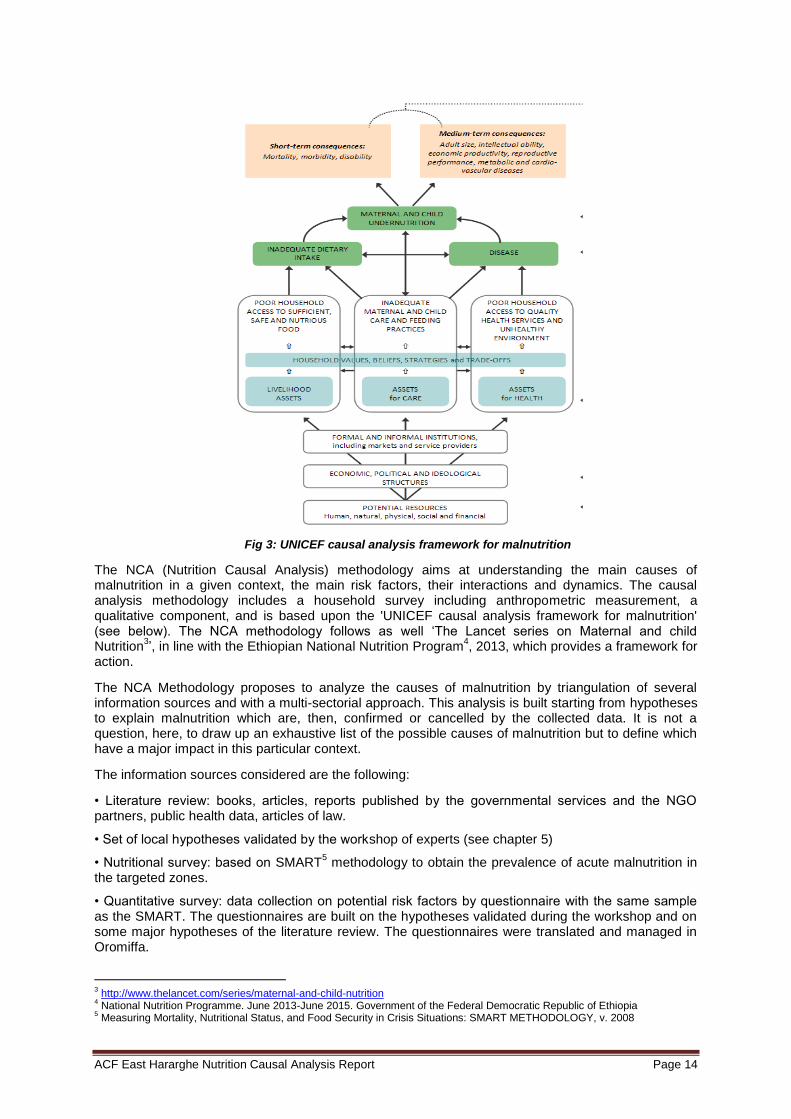
Fig 3: UNICEF causal analysis framework for malnutrition
The NCA (Nutrition Causal Analysis) methodology aims at understanding the main causes of malnutrition in a given context, the main risk factors, their interactions and dynamics. The causal analysis methodology includes a household survey including anthropometric measurement, a qualitative component, and is based upon the 'UNICEF causal analysis framework for malnutrition' (see below). The NCA methodology follows as well ‘The Lancet series on Maternal and child Nutrition
3’, in line with the Ethiopian National Nutrition Program
4, 2013, which provides a framework for
action.
The NCA Methodology proposes to analyze the causes of malnutrition by triangulation of several information sources and with a multi-sectorial approach. This analysis is built starting from hypotheses to explain malnutrition which are, then, confirmed or cancelled by the collected data. It is not a question, here, to draw up an exhaustive list of the possible causes of malnutrition but to define which have a major impact in this particular context.
The information sources considered are the following:
• Literature review: books, articles, reports published by the governmental services and the NGO partners, public health data, articles of law.
• Set of local hypotheses validated by the workshop of experts (see chapter 5)
• Nutritional survey: based on SMART5 methodology to obtain the prevalence of acute malnutrition in
the targeted zones.
• Quantitative survey: data collection on potential risk factors by questionnaire with the same sample as the SMART. The questionnaires are built on the hypotheses validated during the workshop and on some major hypotheses of the literature review. The questionnaires were translated and managed in Oromiffa.
3 http://www.thelancet.com/series/maternal-and-child-nutrition
4 National Nutrition Programme. June 2013-June 2015. Government of the Federal Democratic Republic of Ethiopia
5 Measuring Mortality, Nutritional Status, and Food Security in Crisis Situations: SMART METHODOLOGY, v. 2008

ACF East Hararghe Nutrition Causal Analysis Report Page 15
• Qualitative survey: semi-directive interviews and focus group with key informants, observations. The interviews and the focus groups are recorded using a voice-recorder, then translated and transcribed.
Complementarity between qualitative and quantitative components
While a quantitative survey is well-suited to answering questions of ‘how many’, ‘which’ and ‘what’, qualitative methods are comparatively better suited to exploring the ‘how’ and ‘why’ of malnutrition causality. While quantitative methods can objectively assess malnutrition status and the prevalence of known risk factors, qualitative methods can uncover the community’s own conceptualization of malnutrition, the degree to which it is perceived to be a problem, and what it perceives to be the relevant causes. This emic information may be as or more important to designing effective responses. Thus, the qualitative and quantitative components are intended to generate complementary data.
The Qualitative Inquiry can be carried out either before, during, or after the quantitative survey. ACF recommends implementing the qualitative inquiry concurrently with the quantitative survey, which will help to economize on time and, if qualitative informants are selected from among those communities where the survey is carried out, help to ensure a set of perspectives from a variety of local areas.
4.2 Methodology of quantitative survey
The survey was conducted within a total of 15 days (from April 23rd
– May 9th
2014). The actual time of data collection includes Saturday and holidays (no Sundays).
4.2.1 Area of coverage
This nutritional survey covered the smallest geographical unit (village or cluster) found in 54 rural kebeles in the woreda (19 in Fedis and 35 in Kersa). The 54 rural kebeles were also divided into 648 (330 from Kersa and 318 for Fedis) smaller sub-divisions or cluster. These 648 clusters were included in the selection, out of these, 60 clusters were randomly selected using ENA for SMART software, November 2011 version.
Fig.4 Study area chosen based on livelihood zone (1.GBG, 2.CVC, 3.NAP, 4.SMC, 5.CVG, 6.WBP)
4.2.2 Survey design
The study design was cross-sectional and followed the fourteen key steps in conducting SMART anthropometric surveys. The SMART survey setup was used in this study since it can not only provide
ACF East Hararghe Nutrition Causal Analysis Report Page 16
a detailed understanding of the scale and severity of humanitarian crisis, but can also be the basis for an integrated methodology for assessing nutritional status in emergencies. A combination of random, systematic and two-stage cluster sampling techniques was used to select the smallest study units. We used the friendly and free software ENA
6 to plan our survey and select clusters. A two-stage cluster
sampling with probability proportional to size (PPS) was applied to select clusters. Children aged 6 to 59 months were measured with MUAC, weight (measured to the nearest 0.1kg) and height (measured to the nearest 0.1cm) and were also checked for nutritional bilateral edema. Contextual information was collected at each household and community level and also secondary information was collected at woreda level from sector offices to supplement the anthropometric data and contextual risk factors for malnutrition.
4.2.3 The Survey Population
The target population for the survey was children 6-59 months of age. Anthropometric measurements (weight, height, MUAC) and clinical diagnosis of bilateral pitting edema were conducted among this age group.
4.2.4 Sample size
Based on previous nutrition survey results conducted in the woredas an estimated GAM of 10% prevalence was considered for planning for both woreda, as previous nutrition survey information indicated that the Design effect was ranging from 1.2 to 1.5. Hence, the maximum 1.5% design effect was considered for this cluster sampling. A proportion of 15% under five children of the total population was taken. A 3.5% desired precision was also considered for the planning. Average household size of 5 was considered. A proportion of 90% were also considered for children from 6-59 months from the total under five. After relevant information is feed in ENA, it calculates the sample size based on the following formula:
n= [t²XpXq] X DEFF
d²
Where:
n = sample size
t = linked to 95% confidence interval for cluster sampling (2.045)
p = expected prevalence (fraction of 1)
q = 1- p (expected non-prevalence)
d = relative desired precision
DEFF = Design Effect
Then ENA will automatically convert the number of children found for the sample size into a number of household, following the formula below:
Nº HH= Nº of children
(Average HH* % of under 5*(0.9))
Where:
Nº HH = sample size in terms of households
Nº children = sample size in terms of children
HH size = average household size
% of under 5 = proportion of under 5 years-old children in the population
0.9 = fraction of 6-59 months children within the under 5 age category
After number of household is identified, final sample size has been calculated considering Non Respondent Rates (NRR) which accounts for households that could be either absent, not accessible, refuse to be surveyed, or any other reason that prevent survey teams from surveying a selected
6 ENA for SMART, 2013
ACF East Hararghe Nutrition Causal Analysis Report Page 17
household. For this survey 10% non-respondents were considered and the calculation was done as follows using ENA:
Final Nº= Number of HH needed
1-NRR
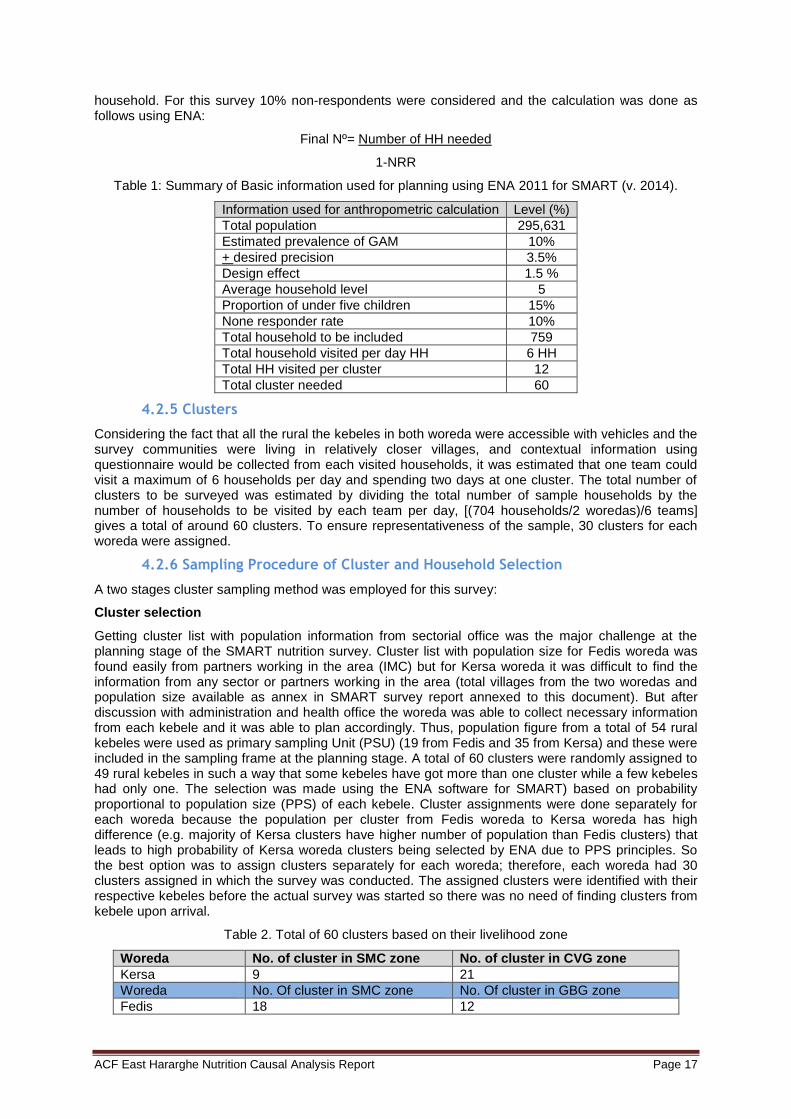
Table 1: Summary of Basic information used for planning using ENA 2011 for SMART (v. 2014).
Information used for anthropometric calculation Level (%)
Total population 295,631
Estimated prevalence of GAM 10%
+ desired precision 3.5%
Design effect 1.5 %
Average household level 5
Proportion of under five children 15%
None responder rate 10%
Total household to be included 759
Total household visited per day HH 6 HH
Total HH visited per cluster 12
Total cluster needed 60
4.2.5 Clusters
Considering the fact that all the rural the kebeles in both woreda were accessible with vehicles and the survey communities were living in relatively closer villages, and contextual information using questionnaire would be collected from each visited households, it was estimated that one team could visit a maximum of 6 households per day and spending two days at one cluster. The total number of clusters to be surveyed was estimated by dividing the total number of sample households by the number of households to be visited by each team per day, [(704 households/2 woredas)/6 teams] gives a total of around 60 clusters. To ensure representativeness of the sample, 30 clusters for each woreda were assigned.
4.2.6 Sampling Procedure of Cluster and Household Selection
A two stages cluster sampling method was employed for this survey:
Cluster selection
Getting cluster list with population information from sectorial office was the major challenge at the planning stage of the SMART nutrition survey. Cluster list with population size for Fedis woreda was found easily from partners working in the area (IMC) but for Kersa woreda it was difficult to find the information from any sector or partners working in the area (total villages from the two woredas and population size available as annex in SMART survey report annexed to this document). But after discussion with administration and health office the woreda was able to collect necessary information from each kebele and it was able to plan accordingly. Thus, population figure from a total of 54 rural kebeles were used as primary sampling Unit (PSU) (19 from Fedis and 35 from Kersa) and these were included in the sampling frame at the planning stage. A total of 60 clusters were randomly assigned to 49 rural kebeles in such a way that some kebeles have got more than one cluster while a few kebeles had only one. The selection was made using the ENA software for SMART) based on probability proportional to population size (PPS) of each kebele. Cluster assignments were done separately for each woreda because the population per cluster from Fedis woreda to Kersa woreda has high difference (e.g. majority of Kersa clusters have higher number of population than Fedis clusters) that leads to high probability of Kersa woreda clusters being selected by ENA due to PPS principles. So the best option was to assign clusters separately for each woreda; therefore, each woreda had 30 clusters assigned in which the survey was conducted. The assigned clusters were identified with their respective kebeles before the actual survey was started so there was no need of finding clusters from kebele upon arrival.
Table 2. Total of 60 clusters based on their livelihood zone
Woreda No. of cluster in SMC zone No. of cluster in CVG zone
Kersa 9 21
Woreda No. Of cluster in SMC zone No. Of cluster in GBG zone
Fedis 18 12
ACF East Hararghe Nutrition Causal Analysis Report Page 18
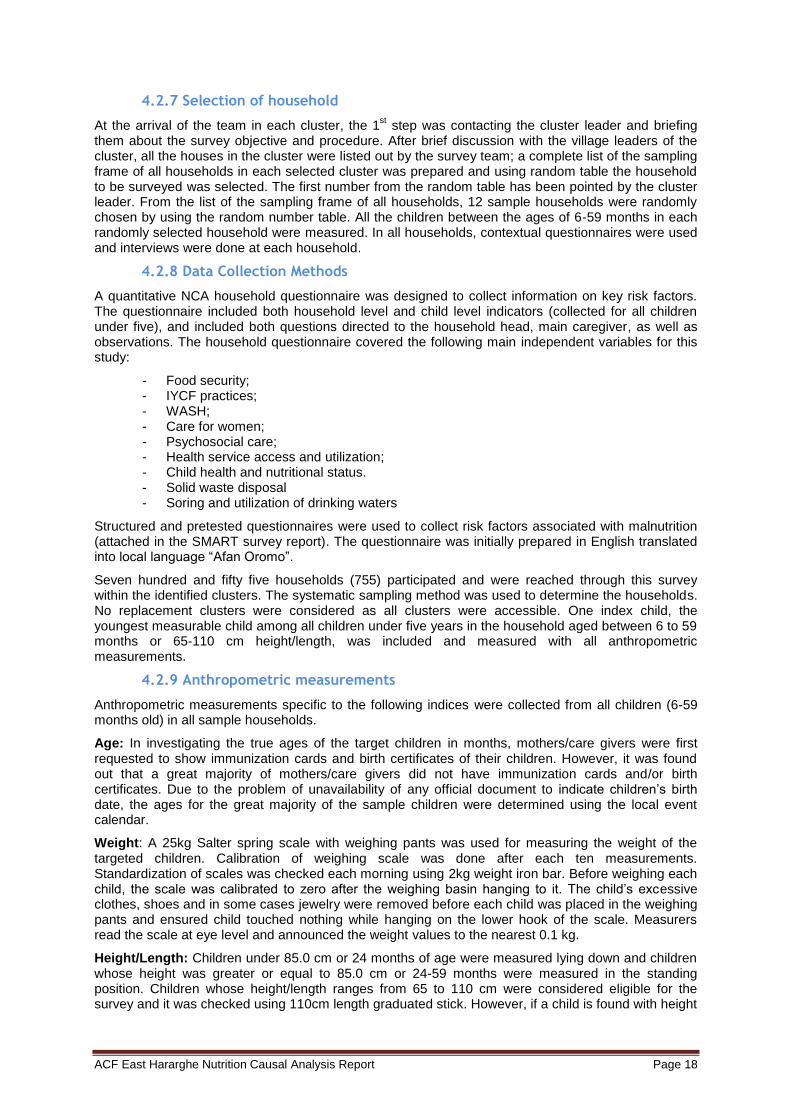
4.2.7 Selection of household
At the arrival of the team in each cluster, the 1st step was contacting the cluster leader and briefing
them about the survey objective and procedure. After brief discussion with the village leaders of the cluster, all the houses in the cluster were listed out by the survey team; a complete list of the sampling frame of all households in each selected cluster was prepared and using random table the household to be surveyed was selected. The first number from the random table has been pointed by the cluster leader. From the list of the sampling frame of all households, 12 sample households were randomly chosen by using the random number table. All the children between the ages of 6-59 months in each randomly selected household were measured. In all households, contextual questionnaires were used and interviews were done at each household.
4.2.8 Data Collection Methods
A quantitative NCA household questionnaire was designed to collect information on key risk factors. The questionnaire included both household level and child level indicators (collected for all children under five), and included both questions directed to the household head, main caregiver, as well as observations. The household questionnaire covered the following main independent variables for this study:
- Food security; - IYCF practices; - WASH; - Care for women; - Psychosocial care; - Health service access and utilization; - Child health and nutritional status. - Solid waste disposal - Soring and utilization of drinking waters
Structured and pretested questionnaires were used to collect risk factors associated with malnutrition (attached in the SMART survey report). The questionnaire was initially prepared in English translated into local language “Afan Oromo”.
Seven hundred and fifty five households (755) participated and were reached through this survey within the identified clusters. The systematic sampling method was used to determine the households. No replacement clusters were considered as all clusters were accessible. One index child, the youngest measurable child among all children under five years in the household aged between 6 to 59 months or 65-110 cm height/length, was included and measured with all anthropometric measurements.
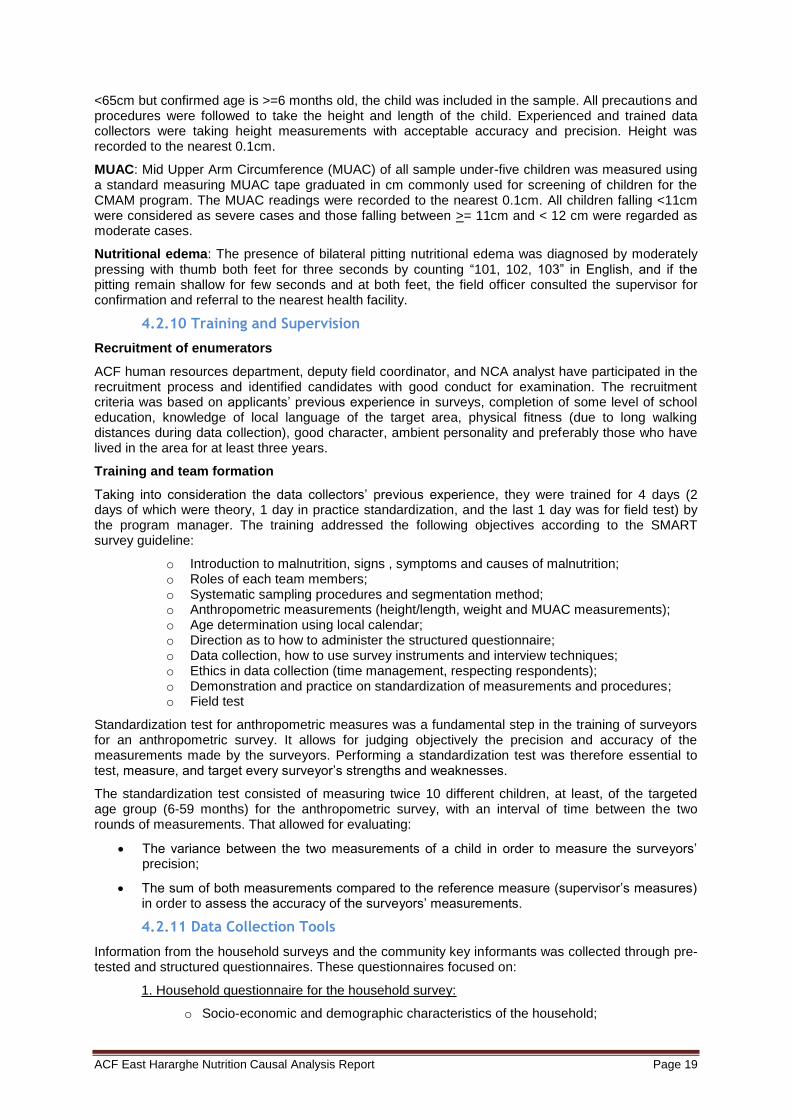
4.2.9 Anthropometric measurements
Anthropometric measurements specific to the following indices were collected from all children (6-59 months old) in all sample households.
Age: In investigating the true ages of the target children in months, mothers/care givers were first requested to show immunization cards and birth certificates of their children. However, it was found out that a great majority of mothers/care givers did not have immunization cards and/or birth certificates. Due to the problem of unavailability of any official document to indicate children’s birth date, the ages for the great majority of the sample children were determined using the local event calendar.
Weight: A 25kg Salter spring scale with weighing pants was used for measuring the weight of the targeted children. Calibration of weighing scale was done after each ten measurements. Standardization of scales was checked each morning using 2kg weight iron bar. Before weighing each child, the scale was calibrated to zero after the weighing basin hanging to it. The child’s excessive clothes, shoes and in some cases jewelry were removed before each child was placed in the weighing pants and ensured child touched nothing while hanging on the lower hook of the scale. Measurers read the scale at eye level and announced the weight values to the nearest 0.1 kg.
Height/Length: Children under 85.0 cm or 24 months of age were measured lying down and children whose height was greater or equal to 85.0 cm or 24-59 months were measured in the standing position. Children whose height/length ranges from 65 to 110 cm were considered eligible for the survey and it was checked using 110cm length graduated stick. However, if a child is found with height
ACF East Hararghe Nutrition Causal Analysis Report Page 19
<65cm but confirmed age is >=6 months old, the child was included in the sample. All precautions and procedures were followed to take the height and length of the child. Experienced and trained data collectors were taking height measurements with acceptable accuracy and precision. Height was recorded to the nearest 0.1cm.
MUAC: Mid Upper Arm Circumference (MUAC) of all sample under-five children was measured using a standard measuring MUAC tape graduated in cm commonly used for screening of children for the CMAM program. The MUAC readings were recorded to the nearest 0.1cm. All children falling <11cm were considered as severe cases and those falling between >= 11cm and < 12 cm were regarded as moderate cases.
Nutritional edema: The presence of bilateral pitting nutritional edema was diagnosed by moderately pressing with thumb both feet for three seconds by counting “101, 102, 103” in English, and if the pitting remain shallow for few seconds and at both feet, the field officer consulted the supervisor for confirmation and referral to the nearest health facility.
4.2.10 Training and Supervision
Recruitment of enumerators
ACF human resources department, deputy field coordinator, and NCA analyst have participated in the recruitment process and identified candidates with good conduct for examination. The recruitment criteria was based on applicants’ previous experience in surveys, completion of some level of school education, knowledge of local language of the target area, physical fitness (due to long walking distances during data collection), good character, ambient personality and preferably those who have lived in the area for at least three years.
Training and team formation
Taking into consideration the data collectors’ previous experience, they were trained for 4 days (2 days of which were theory, 1 day in practice standardization, and the last 1 day was for field test) by the program manager. The training addressed the following objectives according to the SMART survey guideline:
o Introduction to malnutrition, signs , symptoms and causes of malnutrition; o Roles of each team members; o Systematic sampling procedures and segmentation method; o Anthropometric measurements (height/length, weight and MUAC measurements); o Age determination using local calendar; o Direction as to how to administer the structured questionnaire; o Data collection, how to use survey instruments and interview techniques; o Ethics in data collection (time management, respecting respondents); o Demonstration and practice on standardization of measurements and procedures; o Field test
Standardization test for anthropometric measures was a fundamental step in the training of surveyors for an anthropometric survey. It allows for judging objectively the precision and accuracy of the measurements made by the surveyors. Performing a standardization test was therefore essential to test, measure, and target every surveyor’s strengths and weaknesses.
The standardization test consisted of measuring twice 10 different children, at least, of the targeted age group (6-59 months) for the anthropometric survey, with an interval of time between the two rounds of measurements. That allowed for evaluating:
The variance between the two measurements of a child in order to measure the surveyors’ precision;
The sum of both measurements compared to the reference measure (supervisor’s measures) in order to assess the accuracy of the surveyors’ measurements.
4.2.11 Data Collection Tools
Information from the household surveys and the community key informants was collected through pre-tested and structured questionnaires. These questionnaires focused on:
1. Household questionnaire for the household survey:
o Socio-economic and demographic characteristics of the household;
ACF East Hararghe Nutrition Causal Analysis Report Page 20
o Water and environmental sanitation; o Immunization status of under five children; o Illness among under five children and treatment of illness; o Anthropometric (weight/height/length and MUAC) measurements; o Pre and post natal care practice of mothers; o Breast feeding practices; o Complementary feeding practices; o Children dietary diversity score; o Food consumption score.
2. Community key informant discussion:
o Main food sources; o Unusual migration status; o Livestock and food security conditions; o Human epidemics; o Market prices.
4.2.12 Organization and Management of the Survey
The survey was led by one nutrition program manager and two supervisors with relevant and rich experiences in the area of conducting standard nutrition survey in light of the SMART methodology. The composition included a nutrition specialist with the role of an overall coordinator to oversee, guide and ensure the quality of the survey.
The field survey team was composed of 4 team leaders (one with two teams) and 16 data collectors who could speak the local language (Oromiffa). In addition, in each selected village, a local guide was hired from the survey community to facilitate the entire process of the survey in the selected villages.
4.2.13 Data Quality Control
The data quality was given due attention throughout the process, from data collection, data entry, checking, cleaning and analysis. It was done by checking outliers and missing data values in order to make optimal use of the data collected. The skill of quality data collection was tested during the pre-testing stage as a mean to see the gap in knowledge among the enumerators. The Statistical Package for Social Sciences (SPSS) version 16 and SMART plausibility check were used for data cleaning and checking outliers. The collected data were checked at field level first and then screened every evening by SMART computer software on accuracy, precision of measurement, digit preferences and feedbacks. Data quality was checked based on the distribution of the following data: sex ratio between male and female, number of flagged data that was out of the SMART range, missing data entry and digit preference, skewness, and kurtosis. The data was then communicated with enumerators the next day which helped the survey team continually upgrade their performance on a daily basis.
4.2.14 Data Analysis
Two data clerks were recruited and each day the supervisors submitted the anthropometric and HH questionnaire data to the data clerks who entered the data. Plausibility of the anthropometry data was checked using the ENA/SMART software 2011 (v. 2014). SMART flags were used for exclusion of z-scores from observed mean which is in the range of: WHZ -3 to 3. Double entries were checked usually based on the NCHS weight for Height z- score reference there was no flagged record. Overall sex ratio in the plausibility exhibited ratio of 1.1 which means both boys and girls were equally represented in the sample.
4.3 Methodology of Qualitative Survey
In the case of acute malnutrition, it appeared essential to capture the social and cultural elements which took part in food insecurity in the area (access to land, husbandries, dietary habits…) and have a direct link with malnutrition. Other important aspects were related to pregnancy, childbirth weight and the “general good health” of children. Testimonies collected during the study facilitated an understanding of pathways between different causes and their impact on children’s nutritional status; they also allowed to take the collective understanding of malnutrition into account.
The investigation was led on the basis of a hypothetical-deductive method, proceeding into three phases: 1/ bibliographical review, 2/ initial expert’s workshop and definition of a set of local hypotheses, 3/ confrontation of the hypotheses to the field.
ACF East Hararghe Nutrition Causal Analysis Report Page 21
4.3.1 Sampling
The sampling for this type of study is a “dynamic sampling” which adapts according to the elements collected in the field.
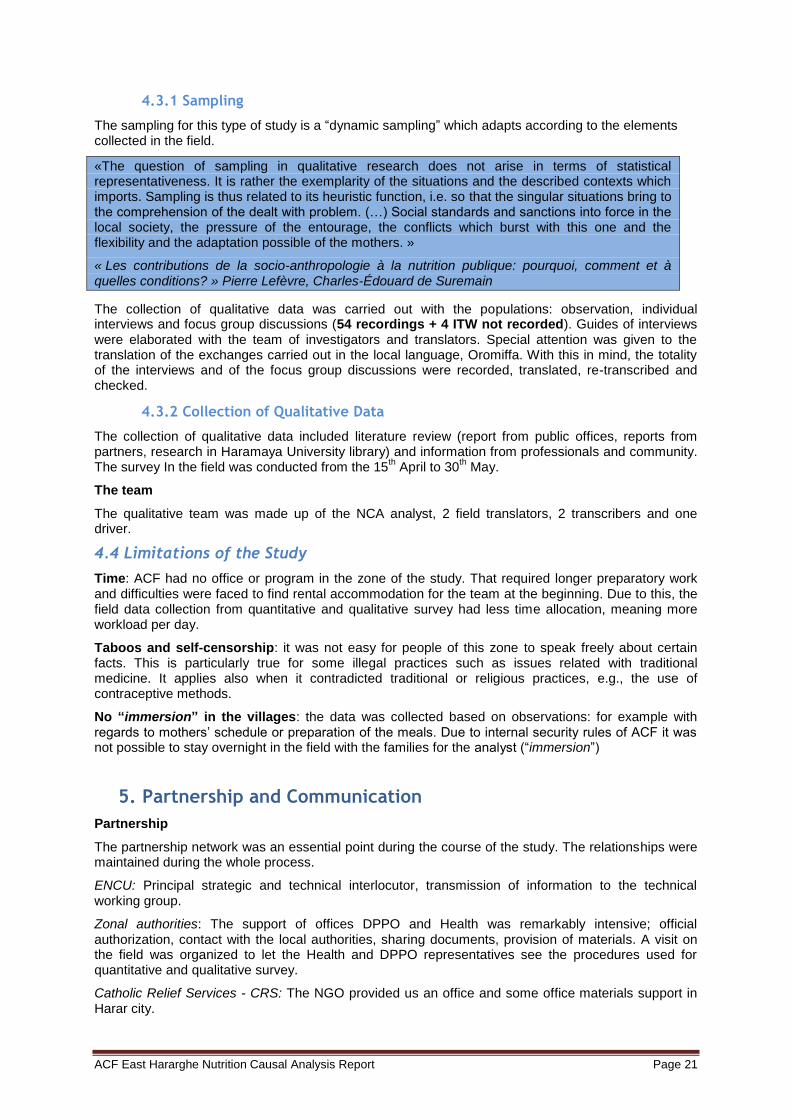
«The question of sampling in qualitative research does not arise in terms of statistical representativeness. It is rather the exemplarity of the situations and the described contexts which imports. Sampling is thus related to its heuristic function, i.e. so that the singular situations bring to the comprehension of the dealt with problem. (…) Social standards and sanctions into force in the local society, the pressure of the entourage, the conflicts which burst with this one and the flexibility and the adaptation possible of the mothers. »
« Les contributions de la socio-anthropologie à la nutrition publique: pourquoi, comment et à quelles conditions? » Pierre Lefèvre, Charles-Édouard de Suremain
The collection of qualitative data was carried out with the populations: observation, individual interviews and focus group discussions (54 recordings + 4 ITW not recorded). Guides of interviews were elaborated with the team of investigators and translators. Special attention was given to the translation of the exchanges carried out in the local language, Oromiffa. With this in mind, the totality of the interviews and of the focus group discussions were recorded, translated, re-transcribed and checked.
4.3.2 Collection of Qualitative Data
The collection of qualitative data included literature review (report from public offices, reports from partners, research in Haramaya University library) and information from professionals and community. The survey In the field was conducted from the 15
th April to 30
th May.
The team
The qualitative team was made up of the NCA analyst, 2 field translators, 2 transcribers and one driver.
4.4 Limitations of the Study
Time: ACF had no office or program in the zone of the study. That required longer preparatory work and difficulties were faced to find rental accommodation for the team at the beginning. Due to this, the field data collection from quantitative and qualitative survey had less time allocation, meaning more workload per day.
Taboos and self-censorship: it was not easy for people of this zone to speak freely about certain facts. This is particularly true for some illegal practices such as issues related with traditional medicine. It applies also when it contradicted traditional or religious practices, e.g., the use of contraceptive methods.
No “immersion” in the villages: the data was collected based on observations: for example with regards to mothers’ schedule or preparation of the meals. Due to internal security rules of ACF it was not possible to stay overnight in the field with the families for the analyst (“immersion”)
5. Partnership and Communication
Partnership
The partnership network was an essential point during the course of the study. The relationships were maintained during the whole process.
ENCU: Principal strategic and technical interlocutor, transmission of information to the technical working group.
Zonal authorities: The support of offices DPPO and Health was remarkably intensive; official authorization, contact with the local authorities, sharing documents, provision of materials. A visit on the field was organized to let the Health and DPPO representatives see the procedures used for quantitative and qualitative survey.
Catholic Relief Services - CRS: The NGO provided us an office and some office materials support in Harar city.

ACF East Hararghe Nutrition Causal Analysis Report Page 22
Local authorities, health professional and health extension workers, community leaders and families were so supporting and welcoming.
Communication with Regional/Zonal/Woreda Authorities
The regional, zonal and woreda health offices and Oromiya Disaster Preparedness and Prevention Commission (ODPPC) as well as ENCU were engaged in the survey process. The zonal health office and DPPO were well informed and joint supervision to ensure the quality of the study was done with zonal health office and DPPO.
6. Development of Local Causal Hypotheses
The local causal hypotheses to explain the causes of malnutrition were validated by the workshop of experts. The initial workshop is one key step of NCA methodology. It consists of bringing together experts of various technical fields and various levels of intervention. Based on collective thinking, based on the conceptual framework «causal analysis framework for malnutrition» from UNICEF, the workshop must lead to a consensus on the prioritized hypotheses which will be investigated during the study. These hypotheses are the base for building the risk factors questionnaire (quantitative part) and will direct the topics tackled with the community during the qualitative survey.
The NCA workshop was organized on April 3rd, 2014 in Harar town. The 36 participants came from the community, NGO (among them ACF team), UN agencies, University and Government agencies (zonal and federal). The participants were also recognized for their expertise in a field related to malnutrition: social and cultural studies, nutrition, health, food security and WASH, education, among others.
A tool created with the software “Edraw Mind Map” made it possible to guide the work in small groups. Each group had the task to explore specificities of the context taking into consideration factors of vulnerability to malnutrition: socio-cultural, politics, food security, geography, socio-economic, health, WASH and sanitation, nutrition.
In the first step, 25 hypotheses were generated through the guidance of the NCA analyst and based on the literature review. After comprehensive discussion and debate by all participants, each working group prioritized the hypotheses and the following 14 were selected, by consensus, from the previous hypothesis generated by each groups:
1. Care givers’ work load
2. Short birth spacing 3. Feeding habits 4. Lack of awareness on malnutrition 5. Impact of climatic change 6. Low productivity 7. Low utilization of health services 8. Disease 9. Improper identification of target groups (Food aid) 10. Lack of knowledge/awareness on malnutrition in all sectors 11. Inadequate infrastructure 12. Problem related with WASH (Environmental sanitation) 13. Low household income 14. Problem in Quality and quantity of food
7. Nutritional Context / Seasonality of Malnutrition
The prevalence of stunted children in Ethiopia - the percentage of children under five years of age with abnormally low height for their age - is among the highest in the world. An assessment of the causes of malnutrition in Ethiopia, 2005
Malnutrition is not a new health issue in Ethiopia, as this study undertaken in 2005 on the causes of malnutrition indicated. The Government organized a strong response to this problem through the National Nutrition Program (in 2008, and recently revised), which aims to provide treatment for acute
ACF East Hararghe Nutrition Causal Analysis Report Page 23
malnutrition in each kebele. Prevention, testing and orientation of children (and care takers) are carried out by Health Extension Workers. Based on official documents, CMAM and SAM admissions have a tendency to decrease – in national and local data - from 2000 to 2011:
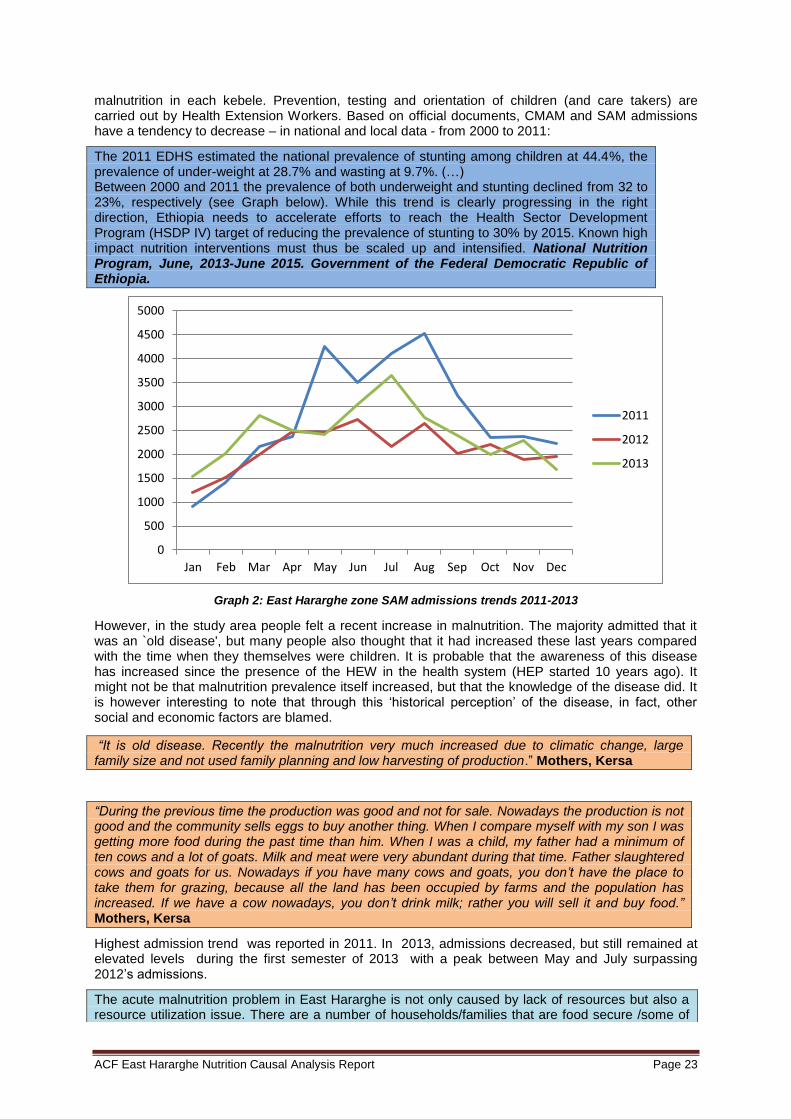
The 2011 EDHS estimated the national prevalence of stunting among children at 44.4%, the prevalence of under-weight at 28.7% and wasting at 9.7%. (…) Between 2000 and 2011 the prevalence of both underweight and stunting declined from 32 to 23%, respectively (see Graph below). While this trend is clearly progressing in the right direction, Ethiopia needs to accelerate efforts to reach the Health Sector Development Program (HSDP IV) target of reducing the prevalence of stunting to 30% by 2015. Known high impact nutrition interventions must thus be scaled up and intensified. National Nutrition Program, June, 2013-June 2015. Government of the Federal Democratic Republic of Ethiopia.
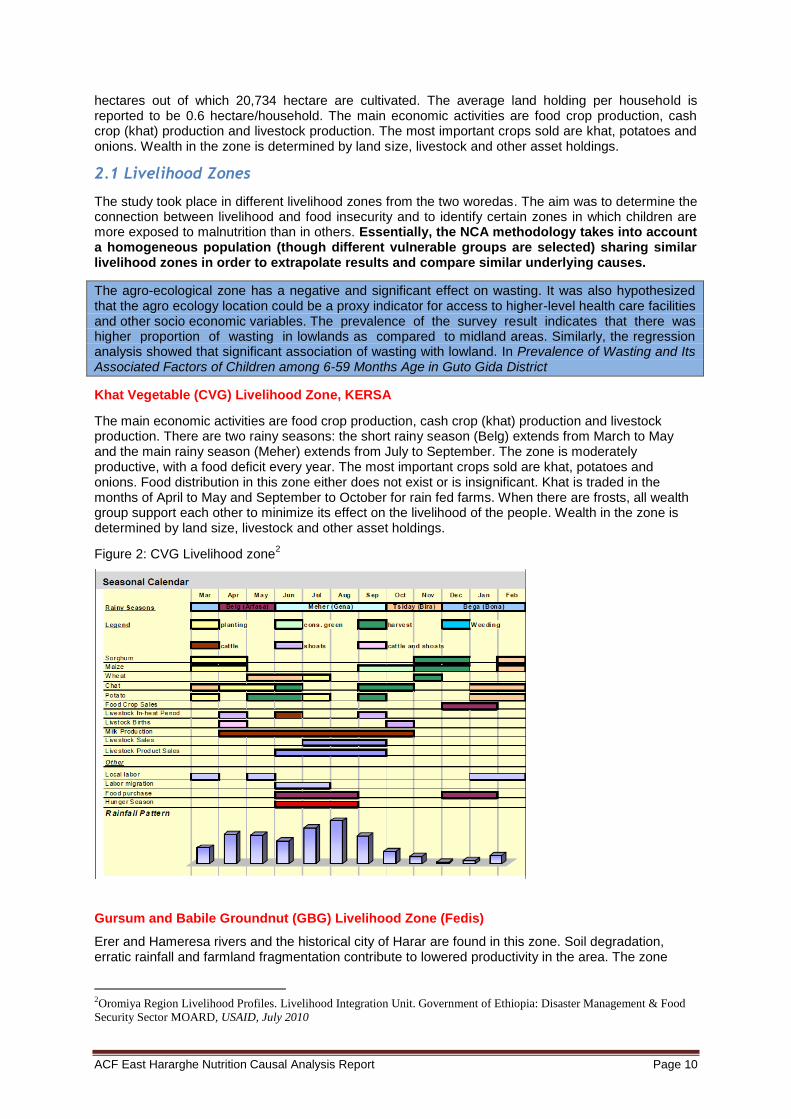
Graph 2: East Hararghe zone SAM admissions trends 2011-2013
However, in the study area people felt a recent increase in malnutrition. The majority admitted that it was an `old disease', but many people also thought that it had increased these last years compared with the time when they themselves were children. It is probable that the awareness of this disease has increased since the presence of the HEW in the health system (HEP started 10 years ago). It might not be that malnutrition prevalence itself increased, but that the knowledge of the disease did. It is however interesting to note that through this ‘historical perception’ of the disease, in fact, other social and economic factors are blamed.
“It is old disease. Recently the malnutrition very much increased due to climatic change, large family size and not used family planning and low harvesting of production.” Mothers, Kersa
“During the previous time the production was good and not for sale. Nowadays the production is not good and the community sells eggs to buy another thing. When I compare myself with my son I was getting more food during the past time than him. When I was a child, my father had a minimum of ten cows and a lot of goats. Milk and meat were very abundant during that time. Father slaughtered cows and goats for us. Nowadays if you have many cows and goats, you don’t have the place to take them for grazing, because all the land has been occupied by farms and the population has increased. If we have a cow nowadays, you don’t drink milk; rather you will sell it and buy food.” Mothers, Kersa
Highest admission trend was reported in 2011. In 2013, admissions decreased, but still remained at elevated levels during the first semester of 2013 with a peak between May and July surpassing 2012’s admissions.
The acute malnutrition problem in East Hararghe is not only caused by lack of resources but also a resource utilization issue. There are a number of households/families that are food secure /some of
0
500
1000
1500
2000
2500
3000
3500
4000
4500
5000
Jan Feb Mar Apr May Jun Jul Aug Sep Oct Nov Dec
2011
2012
2013
ACF East Hararghe Nutrition Causal Analysis Report Page 24
them well off but their children were also acutely malnourished and admitted in selective feeding programs.
Lessons Learnt in Humanitarian Responses in East Hararghe. Meeting held in Addis Ababa (October, 2013), ENCU and East Hararghe Technical Working Group.
“The main lack of food was happening during April, May and June. The main reason was that some of the families had small farm land and immigration of people from place to place to occupy the land. The other problem was shortage of rainfall here. Our area is desert.” Chief of village, Fedis
Seasonal variation: acute child undernutrition = 7.4% in wet and 11.2% in dry season Reference: Seasonal variation in the prevalence of acute undernutrition among children under five years of age in east rural Ethiopia (Kersa). Gudina Egata, 2013.
7
“There is no NGO and governmental organization which supports the poor families. We planted/plough sweet potato to pass the period of lack of food”.
The seasons of malnutrition were during July and August. The solution of this problem was to buy the food/cereals from the market and staying without eating food. During these months the father and children were not able to work. That is why we are seriously affected by malnutrition, because if you don’t have food in the stomach, you can’t work. » FGD Fathers
8. Findings
8.1 SMART Survey Results
Classification of of nutrition situation was based on the national emergency nutrition assessment guideline of 2008. Global acute malnutrition (GAM) (which is the sum of the moderate and severe acute malnutrition) was definedweight for height z-score <-2 and normal children when their weight for height z-score was ≥2. Severe acute malnutrition (SAM) refers to severe malnutrition (weight-for height Z-score <-3). Any child that presented with edema was classified as SAM.
Table 3: Nutrition cut off points Indicators Stage of alert. Ref. “Emergency Nutrition Assessment Guidelines, Ethiopia, 2008”.
Global acute malnutrition prevalence> 20% and/or Severe acute malnutrition prevalence >=5% Critical
Critical Global acute malnutrition prevalence 15-19% and Aggravating factors
Global acute malnutrition prevalence 15-19% Global acute malnutrition prevalence 10-14% and Aggravating factors
Serious
Global acute malnutrition prevalence 10-14% Global acute malnutrition prevalence 5-9% and Aggravating factors Poor
Poor
Global acute malnutrition prevalence 2-9% Typical for a chronically population poor
Typical for chronic nutrition affected area
Anthropometric results (based on NCHS growth reference 1977)
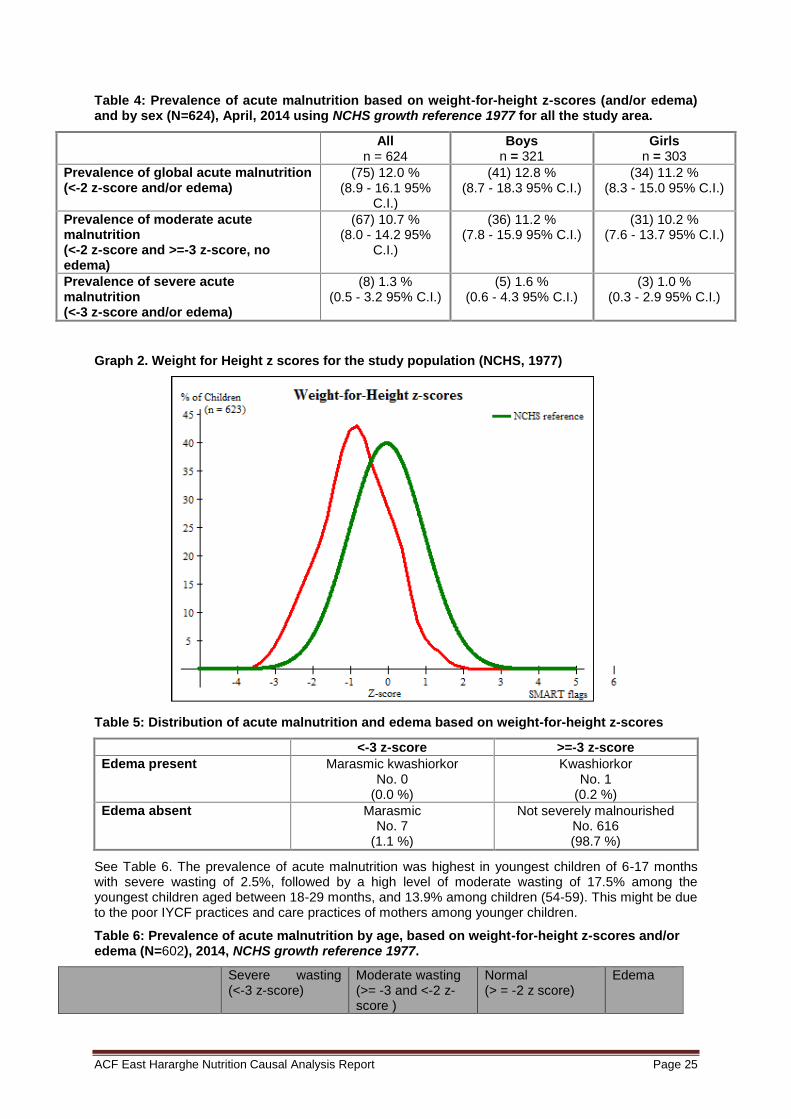
Weight-for-Height (wasting) analysis was done for 694 children (359 from Fedis and 335 from Kersa).The prevalence of global acute malnutrition (GAM) using weight for height z-score was estimated at 12.0% (95% C.I:8.9 - 16.1%) with a severe acute malnutrition rate of 1.3% (95% C.I: 0.5 - 3.2%). 0.2% of the malnourished children were found to have bilateral pitting edema.
The prevalence of GAM among boys (12.8 %)was slightly higher than among girls (11.2 %) and this was significant as well for Kersa, with GAM 8.9% in boys while it was 6.2% in girls. However, in Fedis, boys presented similar rates as in the case of girls, with 15.6% and 15.0% respectively.
7 Egata et al. BMC Public Health 2013, 13:864. http://www.biomedcentral.com/1471-2458/13/864
ACF East Hararghe Nutrition Causal Analysis Report Page 25
Table 4: Prevalence of acute malnutrition based on weight-for-height z-scores (and/or edema) and by sex (N=624), April, 2014 using NCHS growth reference 1977 for all the study area.
All n = 624
Boys n = 321
Girls n = 303
Prevalence of global acute malnutrition (<-2 z-score and/or edema)
(75) 12.0 % (8.9 - 16.1 95%
C.I.)
(41) 12.8 % (8.7 - 18.3 95% C.I.)
(34) 11.2 % (8.3 - 15.0 95% C.I.)
Prevalence of moderate acute malnutrition (<-2 z-score and >=-3 z-score, no edema)
(67) 10.7 % (8.0 - 14.2 95%
C.I.)
(36) 11.2 % (7.8 - 15.9 95% C.I.)
(31) 10.2 % (7.6 - 13.7 95% C.I.)
Prevalence of severe acute malnutrition (<-3 z-score and/or edema)
(8) 1.3 % (0.5 - 3.2 95% C.I.)
(5) 1.6 % (0.6 - 4.3 95% C.I.)
(3) 1.0 % (0.3 - 2.9 95% C.I.)
Graph 2. Weight for Height z scores for the study population (NCHS, 1977)
Table 5: Distribution of acute malnutrition and edema based on weight-for-height z-scores
<-3 z-score >=-3 z-score
Edema present Marasmic kwashiorkor No. 0
(0.0 %)
Kwashiorkor No. 1
(0.2 %)
Edema absent Marasmic No. 7
(1.1 %)
Not severely malnourished No. 616 (98.7 %)
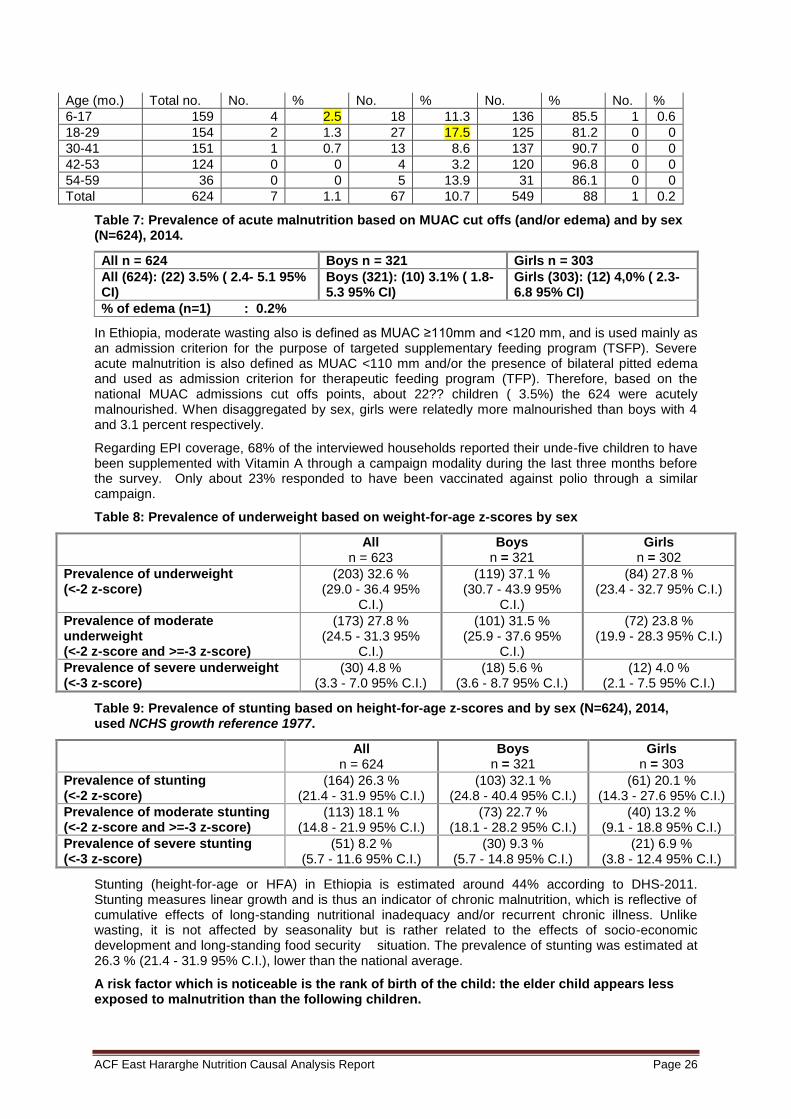
See Table 6. The prevalence of acute malnutrition was highest in youngest children of 6-17 months with severe wasting of 2.5%, followed by a high level of moderate wasting of 17.5% among the youngest children aged between 18-29 months, and 13.9% among children (54-59). This might be due to the poor IYCF practices and care practices of mothers among younger children.
Table 6: Prevalence of acute malnutrition by age, based on weight-for-height z-scores and/or edema (N=602), 2014, NCHS growth reference 1977.
Severe wasting (<-3 z-score)
Moderate wasting (>= -3 and <-2 z-score )
Normal (> = -2 z score)
Edema
ACF East Hararghe Nutrition Causal Analysis Report Page 26
Age (mo.) Total no. No. % No. % No. % No. %
6-17 159 4 2.5 18 11.3 136 85.5 1 0.6
18-29 154 2 1.3 27 17.5 125 81.2 0 0
30-41 151 1 0.7 13 8.6 137 90.7 0 0
42-53 124 0 0 4 3.2 120 96.8 0 0
54-59 36 0 0 5 13.9 31 86.1 0 0
Total 624 7 1.1 67 10.7 549 88 1 0.2
Table 7: Prevalence of acute malnutrition based on MUAC cut offs (and/or edema) and by sex (N=624), 2014.
All n = 624 Boys n = 321 Girls n = 303
All (624): (22) 3.5% ( 2.4- 5.1 95% CI)
Boys (321): (10) 3.1% ( 1.8- 5.3 95% CI)
Girls (303): (12) 4,0% ( 2.3- 6.8 95% CI)
% of edema (n=1) : 0.2%
In Ethiopia, moderate wasting also is defined as MUAC ≥110mm and <120 mm, and is used mainly as an admission criterion for the purpose of targeted supplementary feeding program (TSFP). Severe acute malnutrition is also defined as MUAC <110 mm and/or the presence of bilateral pitted edema and used as admission criterion for therapeutic feeding program (TFP). Therefore, based on the national MUAC admissions cut offs points, about 22?? children ( 3.5%) the 624 were acutely malnourished. When disaggregated by sex, girls were relatedly more malnourished than boys with 4 and 3.1 percent respectively.
Regarding EPI coverage, 68% of the interviewed households reported their unde-five children to have been supplemented with Vitamin A through a campaign modality during the last three months before the survey. Only about 23% responded to have been vaccinated against polio through a similar campaign.
Table 8: Prevalence of underweight based on weight-for-age z-scores by sex
All n = 623
Boys n = 321
Girls n = 302
Prevalence of underweight (<-2 z-score)
(203) 32.6 % (29.0 - 36.4 95%
C.I.)
(119) 37.1 % (30.7 - 43.9 95%
C.I.)
(84) 27.8 % (23.4 - 32.7 95% C.I.)
Prevalence of moderate underweight (<-2 z-score and >=-3 z-score)
(173) 27.8 % (24.5 - 31.3 95%
C.I.)
(101) 31.5 % (25.9 - 37.6 95%
C.I.)
(72) 23.8 % (19.9 - 28.3 95% C.I.)
Prevalence of severe underweight (<-3 z-score)
(30) 4.8 % (3.3 - 7.0 95% C.I.)
(18) 5.6 % (3.6 - 8.7 95% C.I.)
(12) 4.0 % (2.1 - 7.5 95% C.I.)
Table 9: Prevalence of stunting based on height-for-age z-scores and by sex (N=624), 2014, used NCHS growth reference 1977.
All n = 624
Boys n = 321
Girls n = 303
Prevalence of stunting (<-2 z-score)
(164) 26.3 % (21.4 - 31.9 95% C.I.)
(103) 32.1 % (24.8 - 40.4 95% C.I.)
(61) 20.1 % (14.3 - 27.6 95% C.I.)
Prevalence of moderate stunting (<-2 z-score and >=-3 z-score)
(113) 18.1 % (14.8 - 21.9 95% C.I.)
(73) 22.7 % (18.1 - 28.2 95% C.I.)
(40) 13.2 % (9.1 - 18.8 95% C.I.)
Prevalence of severe stunting (<-3 z-score)
(51) 8.2 % (5.7 - 11.6 95% C.I.)
(30) 9.3 % (5.7 - 14.8 95% C.I.)
(21) 6.9 % (3.8 - 12.4 95% C.I.)
Stunting (height-for-age or HFA) in Ethiopia is estimated around 44% according to DHS-2011. Stunting measures linear growth and is thus an indicator of chronic malnutrition, which is reflective of cumulative effects of long-standing nutritional inadequacy and/or recurrent chronic illness. Unlike wasting, it is not affected by seasonality but is rather related to the effects of socio-economic development and long-standing food security situation. The prevalence of stunting was estimated at 26.3 % (21.4 - 31.9 95% C.I.), lower than the national average.
A risk factor which is noticeable is the rank of birth of the child: the elder child appears less exposed to malnutrition than the following children.
ACF East Hararghe Nutrition Causal Analysis Report Page 27
Birth order is also found as important determinant for dietary diversity. Children who were born third had nearly two times more risk to be feed inappropriately compared to children born first.
Dietary Diversity and Meal Frequency Practices among Infant and Young Children Aged 6–23 Months in Ethiopia: A Secondary Analysis of Ethiopian Demographic and Health Survey 2011
« The second, third etc. child was more affected by malnutrition than the senior child because our community give more proper care for the first child and they don’t care about the next children. » Mother, Fedis
8.2 Food Security
Low productivity = Hypothesis 6
Weak food security, particularly inadequate agricultural production, was necessarily felt to be a major cause of malnutrition. The lack of food or money from the sale of cash crop is reflected on food availability for the family. Food security does not systematically imply nutritional good health for children. Compared to intra-househol food distribution, breastfeeding practices, consumed water and other causes analyzed in the NCA, the cause most-commonly related to malnutrition and the most important for the population is: “malnutrition is a disease caused by the lack of food and could be prevented by a greater agricultural production”.
“During the previous time, I have good production but now I have low production. My land is not suitable for sorghum farming. This year I didn’t plant ground nut because I couldn’t get the seed. My husband is with me. We have nothing at our home and it is my family who is helping us.” Mother of MNC, Fedis
Performance of 2013 belg season reported to be better than last year in all zones. However, 2013 belg production anticipated to reduce significantly from the plan as a result of weather related hazards, pest and diseases.
Early cessation of the rain in some woredas of Bale and army worm infestation in pocket areas of Arsi as well as East Hararghe zone anticipated to reduce production considerably.
As a result, a total of 897,332 people will require emergency food assistance in the second half of 2013.
In W/Hararghe and E/Hararghe zones, land preparation and planting were delayed by about two weeks as it was impacted by the late onset of the rains. Despite the late planting, the total area covered with different crops was greater than that of last year and the reference year.
Supply and utilization of agricultural inputs in both zones has been improved compared to that of last year both in quantity and timeliness.
Likewise, Irish potato planted on 3,050 ha of land in the highland areas of Gurawa, Meta, Deder and Melka Belo woredas of E/Hararghe zone has been affected by a disease known as early blight due to the excessive rains
Food Supply prospect for the second half of year, MOA, 2013
Assess the determinants of food security status of the rural household. Methodology (quantitative): calorie acquisition, consumption per adult/per day is used to identify the food secure and food insecure household. Very important cash crops: Chat, fruits, vegetables, coffee
- 70% of the respondent household were food insecure and
- 30% of them were food secure. Significant variables: 1) age of the household head, 2) sex of the HH Head Woman > insecure, 3) HH size, 4) total cropping land in Ha, 5) oxen owned, 6) remittances in Birr (Insignificant variable: education status oh HH)
-In many parts of the Region the current milk production is better than last year and previous years.
ACF East Hararghe Nutrition Causal Analysis Report Page 28
-The overall price increase on food grain is significant compared to the reference year.
Final report on nutrition survey in Fedis woreda, IMC, 2011
The crops planted in the last belg season in 2013 were rated as poor in around one third of the surveyed villages (30.5%). About 23.3% of the community confirmed that the performance of current meher crop was poor due to late start of rains and uneven distribution in some parts, while excess rains was the problem in other parts, and thus, deterioration of household food security was anticipated in the months ahead.
Pasture and water as well as livestock conditions were confirmed to be good to medium by a majority of the communities with few (18.6%) communities where availability of water for livestock was considered to be poor; serious shortage was reported only in some kebeles. Pond water was the main source of water for both livestock and human beings and some of the ponds in some places were anticipated to dry up soon, even within a month’s time and water shortage was expected to occur within a month around December 2013. No epidemics of livestock were reported in the last three months.
An increase in cereal price, especially sorghum, was reported in each surveyed villages and was considered to aggravate the food shortage problem to those households with a significant depletion of household food stock.
“They sell their products rather than consuming in their house. Now the problem in the community is farmers are selling eggs and different vegetables to buy petrol, sugar and salt which has its own effect on malnutrition.” Father
Low productivity of households leads to low food accessibility, utilization, and less amount of food available in the house. This can be concluded to create highly food insecure households. Land scarcity and lack of access to appropriate technology are the main causes of low production that lead the majority of households to facing food insecurity. A household has an average of 0.0279 “timads
8”
of farm land. Beside little farming land availability per household, as the trend showed in the area, the majority of the this farming land wereis covered by cash crop (khat), instead of staple or cereal crops. Hence, the majority of households have poor access to staple food and cannot utilize their own production for food.
Table 10 shows the main production of the reference year. 43.3 % (N=350) of households produce SMC (sorghum, maize and khat) and around 38.5% (N=291) of the households’ production was GBG (Gursum, Babile, Groundnut). WBP (Wheat, barley, potato) (1.5%) and CVG (Khat, vegetables, groundnut) 0.5% are the lowest production of the year in the area. Regarding food security, food purchased from the local markets was the main source of food for 375 (49.6%) of the sampled households during the lean season and for 261 (34.5%) of them in the harvest season. This implies that quite a few households 475 (62.8%) use their own food products during the harvest season, while 356 (47.1%) used their own production as well as their main source of food during the lean season. The rest of the 8 (0.8%) households reported receiving food assistance or donations as their main source of food in the last three months. 1 (0.1%) respondent reported that the main source of food during lean time is exchange of labor to grain and also 3 (0.4%) of the household report that grain remittent borrowing was their main source of food.
Table 10: Main production of this time of year (2013-2014)
Livelihood classification No. of household (N=756) Percentage %
GBG 291 38.7
CGC 94 12.5
SMC 350 46.5
CVG 4 0.5
WPB 11 1.5
Other 2 0.3
Total 752 100.0
Figure 4 below shows the main staple foods of households in the study area, with sorghum (72.9 %) being the most important staple crop. The majority of households obtained their main food through their own production during harvest season; purchase and food assistance were equally important all
8 1timade=1/8 hectare
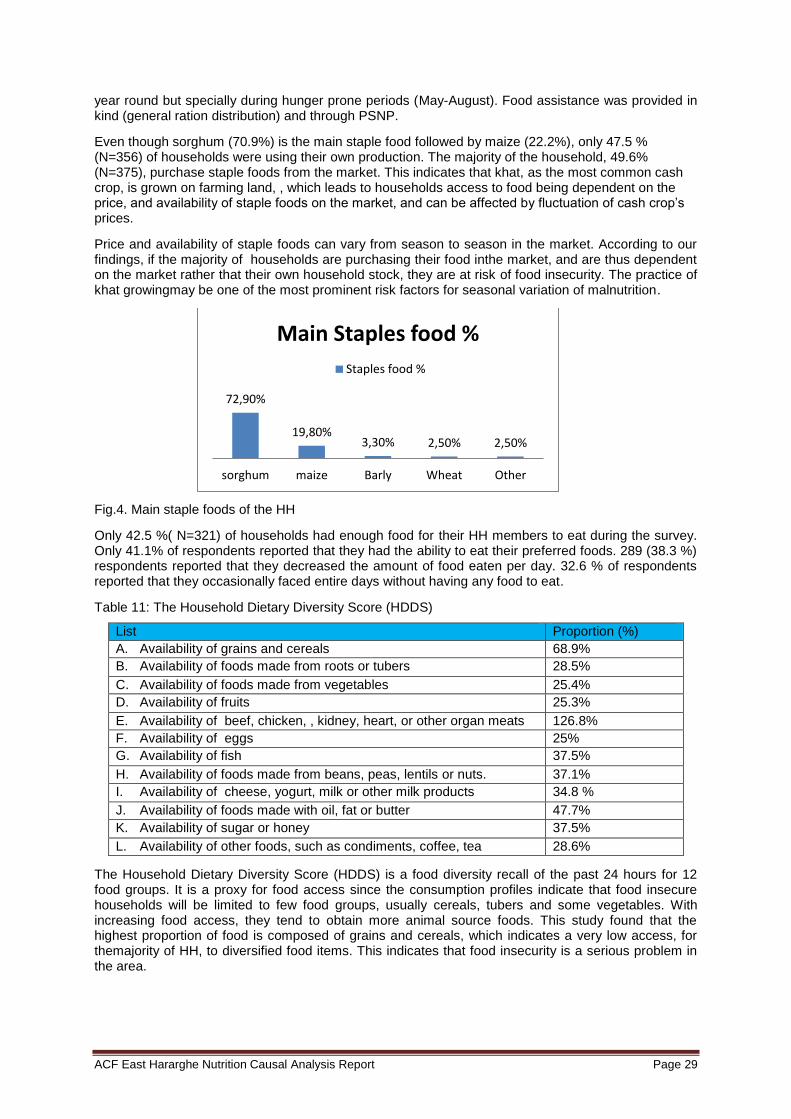
ACF East Hararghe Nutrition Causal Analysis Report Page 29
year round but specially during hunger prone periods (May-August). Food assistance was provided in kind (general ration distribution) and through PSNP.
Even though sorghum (70.9%) is the main staple food followed by maize (22.2%), only 47.5 % (N=356) of households were using their own production. The majority of the household, 49.6% (N=375), purchase staple foods from the market. This indicates that khat, as the most common cash crop, is grown on farming land, , which leads to households access to food being dependent on the price, and availability of staple foods on the market, and can be affected by fluctuation of cash crop’s prices.
Price and availability of staple foods can vary from season to season in the market. According to our findings, if the majority of households are purchasing their food inthe market, and are thus dependent on the market rather that their own household stock, they are at risk of food insecurity. The practice of khat growingmay be one of the most prominent risk factors for seasonal variation of malnutrition.
Fig.4. Main staple foods of the HH
Only 42.5 %( N=321) of households had enough food for their HH members to eat during the survey. Only 41.1% of respondents reported that they had the ability to eat their preferred foods. 289 (38.3 %) respondents reported that they decreased the amount of food eaten per day. 32.6 % of respondents reported that they occasionally faced entire days without having any food to eat.
Table 11: The Household Dietary Diversity Score (HDDS)
List Proportion (%)
A. Availability of grains and cereals 68.9%
B. Availability of foods made from roots or tubers 28.5%
C. Availability of foods made from vegetables 25.4%
D. Availability of fruits 25.3%
E. Availability of beef, chicken, , kidney, heart, or other organ meats 126.8%
F. Availability of eggs 25%
G. Availability of fish 37.5%
H. Availability of foods made from beans, peas, lentils or nuts. 37.1%
I. Availability of cheese, yogurt, milk or other milk products 34.8 %
J. Availability of foods made with oil, fat or butter 47.7%
K. Availability of sugar or honey 37.5%
L. Availability of other foods, such as condiments, coffee, tea 28.6%
The Household Dietary Diversity Score (HDDS) is a food diversity recall of the past 24 hours for 12 food groups. It is a proxy for food access since the consumption profiles indicate that food insecure households will be limited to few food groups, usually cereals, tubers and some vegetables. With increasing food access, they tend to obtain more animal source foods. This study found that the highest proportion of food is composed of grains and cereals, which indicates a very low access, for themajority of HH, to diversified food items. This indicates that food insecurity is a serious problem in the area.
72,90%
19,80% 3,30% 2,50% 2,50%
sorghum maize Barly Wheat Other
Main Staples food %
Staples food %

ACF East Hararghe Nutrition Causal Analysis Report Page 30
Based on the above findings and following discussions, this NCA study thus found that low productivity is a high risk factor of malnutrition, and has a significant association as a cause of acute malnutrition.
Table 12: Indicators for low productivities Indicator N Mean or proportion
Farming land availability per households 755 0.0279 timads
Main production of the HH to be sorghum 755 43.3%
Main staple food to be sorghum 755 72.9%
Main source of staples food by purchasing 755 49.6 %
Household food diversity to be grain and cereals only 755 68.9%
This food insecurity situation has direct consequences on families’ diets. Mothers confirm that they do not prepare special meals for children. Children thus suffer directly from lower availability of food.
(…) that rates of malnutrition increase markedly between 4 and 12 months of age, around the time that infants begin to receive complementary foods in addition to breast milk.
(…) the rest 57% who are not given complementary food are more prone to stunting and wasting.
The proportion of children with adequate dietary diversity in study was 10.8%.
Children who were born third had nearly two times more risk to be feed inappropriately compared to children born first.
This study revealed that children born from the richest households had 74% less chance to have inadequate dietary diversity compared with children from the poorest household
Final Report on Nutrition Survey in Fedis Woreda, IMC, 2011
« There is no special food separately prepared for the children. We ate most of the time injera of sorghum.» Mother
8.2.1 Climatic change
Climate Change = Hypothesis 5
“There is no variety of food. Because we don’t have enough money to buy the variety of food and we buy only the cheap ones. We bought the maize 600 birr per sack. There is a time when the price was increased or decreased. During the past time the price of maize very much increased when compared with this time. The challenges of malnutrition happened before six years ago or increased before six years ago. This is due to a shortage of rainfall and a period of starving.” Mothers, Kersa
Climate change affects poor people in particular, because of their weak adaptive capacities. Development projects of all kinds can strengthen or weaken those capacities. A marginal impact analysis of increasing temperature and precipitation across the four season (winter, spring, summer and fall) was undertaken. Results indicated that a unit increase in temperature during summer and winter would reduce net revenue per hectare by US$177.62 and 464.71 respectively, whereas the marginal impact of increasing precipitation during spring would increase net revenue per hectare by US$225.09. In addition, the study examined the impact of uniform climate scenarios on the net revenue per hectare of Ethiopian farmers. These uniform scenarios include increasing temperature by 2.5ºC and 5ºC; and decreasing precipitation by 7% and 14%. These results indicate that increasing temperature and decreasing precipitation are both damaging to Ethiopian agriculture.
According to this analysis, decreasing precipitation appeared to be more damaging than increasing temperature. For instance, while increasing temperature by 5ºC reduced net revenue per hectare by US$0.00016, reducing precipitation by 14% reduced net revenue per hectare by US$0.39. In general, the above analysis indicates that increasing temperature and decreasing precipitation are both damaging to Ethiopian agriculture. Even though the analysis did not incorporate carbon fertilization effect, or the role of technology and change in prices for the future, significant information for policy
ACF East Hararghe Nutrition Causal Analysis Report Page 31
making can be extracted. (2) Deressa TT. Measuring the Economic Impact of Climate Change on Ethiopian Agriculture : Ricardian Approach. 2007 (September).
As discussed in the above paragraph, we can see that climate change has a high impact on food production in the area. According to the zonal DPPO, both woredas are repeatedly affected by drought, and have been especially so in the last decade. The majority of the communities also responded that they could see more malnutrition in the last 7-8 years because of seasonal variations, and because repeated drought happened in the area.
Yields during the 2013 belg season were reported to be better than last year in all zones. However, 2013 belg production was anticipated to reduce significantly from the plan, as a result of weather related hazards, pest and diseases. In E/Hararghe zone, land preparation and planting were delayed by about two weeks following a late onset of rains. Despite late planting, the total area covered with different crops was greater than that of the previous year and the reference year
9. The majority of
households in the surveyed area used their own production for personal use as foods during harvesting time. 475 (62.8%) households use their own food products only during the harvest season, and during the lean season are forced to purchase their food from the market or get it from other sources. This happens because of low production due to impacts of climate change, which bring changes in seasonal rainfall patterns. Even though around 72.2% of households’ main occupation is farming, each household’s food security was affected by climate change. The impact is that 49.6% of householdes purchased their food from the market, and did not get it from their own production. 42.5 % of households reported that they did not have sufficient food for their household at the time of this survey. Hence, we find that the fact that rains are increasingly unevenly distributed and sporadic, that climate change affects rain patterns, are likely to be a high risk factor of malnutrition.
Table 13. Indicators climate change impact
Indicator N Mean or proportion
Proportion of HH use own production during harvesting time only 755 62.2%
Proportion of HH get food by purchasing 755 49.6%
Proportion of HH with no sufficient food after harvesting period 756 42.5%
8.2.2 Coping Mechanism / Season
When a household faces food insecurity, which might be caused by various reasons, it usually adopts coping strategies. Coping strategies are short-term ways to adapt and adjust to the stress or shock and they almost inevitably lead to a different state of vulnerability.
The Resilience of Rural Ethiopian Livelihoods, A Case Study From Hararghe Zone, Eastern Ethiopia
During difficult periods, coping strategies appear poor. Families who have little goods sell what they can to pass the difficult months. Those who do not have anything to sell seak daily casual work: this could explain why during this season mothers are likely to leave their children for longer periods of time in the village. For the DPPO, one of the indicators to use to measure the urgency of the situation was the number of people who made a temporary migration to earn money. The traditional system of mutual aid (zakkat) can function, but is not enough to cover all needs. Regarding assistance or donations organized by the government or/and NGOs, only 0.8% of the households interviewed benefited from it the 3 months up to when the survey took place. The official data reported that the relief assistance covered around 3% of the households in the two woredas.
“During drought we used what we get from selling vegetables to buy food items. We didn’t have khat previously and we are planting it now.” Mother
“Malnutrition was most frequently attacking people during July and August because the store of food decreased. During this time some NGOs give food aid for the people. There are some NGOs still which provided food for poor families. The poor families obtained the food from NGO every six months. The aid was provided based on the family size and one person was obtaining 15kg for one month. The rich families were supporting the poor families during zakat”. Chief of village, Kersa
9 East Hararghe DPPO
ACF East Hararghe Nutrition Causal Analysis Report Page 32
8.2.3 Khat / Chat
Khat chewing impact on food security = Hypothesis 15
The khat chewing practice, and impacts it can have on food security of the households were also assessed. In 58.2% (N=440) of households both partners (husband and wife) were khat chewers, and in 39.6% (N=299) of households, one of the partners was a khat chewer. In the remaining 2.25% (N=17) ofhouseholds, both partners were non-khat chewers.
85.2% (N=644) of respondents reported that khat chewing had no impact on food security while 6% (N=45) said that khat had an impact on food availability and security. The remaining 8.8% (N=67) had never considered and noticed the impact of khat chewing on their food security. Of those who noticed the impact of khat chewing on food security, 29 (64.44%) respondents reported that khat would affect the food security due to increments in household expenditures and giving priority to khat. The remaining 16 (35.66%) respondents explained that khat would affect food security due to less time spent to work that led to not having sufficient food and not being able to produce a sustainable income and having resources.
Literature, however, indicates that khat chewing can have a serious impact on food security, and it thus is a risk factor that could be highly associated with malnutrition (further study is needed). Khat chewing causes poor appetite: mothers who chew khat during pregnancy would be eating less food and the child born could have a low birth weight, which exposes her/him to malnutrition. The same applies for lactating women, if they had less appetite due to khat chewing, their milk production could be less and the child would get less breast milk and s/he would be predisposed to malnutrition. Some studies showed also that khat contains a substance called cathinone, which inhibits absorption of major micronutrients
10. Hence, we contendthat khat chewing is a high risk factor among
pregnant women and children under five.
Studies of khat chewing during pregnancy suggest that it leads to lowered birth weight, teratogenic effects (i.e. effects that are likely to disturb the growth of the fetus) and increased infant mortality, with such effects thought to be mediated by altered utero-placental blood flow relating to the placenta and the uterus (Mwenda et al. 2003). The breakdown product of cathinone, cathine (nor-pseudoephedrine), is excreted in breast milk and has been traced in the urine of a breast-fed infant with unknown effect (Manghi et al. 2009).
Table 14: Indicators for problem in quantity and quality of foods (khat related)
Indicator N Mean or proportion
Proportion both partners chewed khat 755 58.2%
Proportion of HH notice khat chewing had impact on food security 755 6%
Khat chewing affect food security due to extra expend of cost and priority given for khat
755 64.4%
Impact of khat chewing in food security due less time given for work 755 35.5 %
At the same time, the results show that men’s addiction to chewing khat is an issue to food security because it adds unnecessary costs and only puts more of the work burden on women. National data on khat chewing in Oromiya indicate that 20% of women and 40% of men have ever chewed khat in their lifetime.
A Gender Analysis Study of DFAP-Targeted Food Insecure Woredas in Dire Dawa Administrative Council, Arsi & East Hararghe Zones
Khat is the most important cash crop production in the 2 woredas here-studied. It is easily observable that both social and economic life of the population is centered around this plant. A major source of income for the families, it is also a powerful social element. The interviewed people affirmed that this production largely increased these last years because it was considered as very profitable. Women sold khat every day at the market. Customers bought and consumed the fresh plant daily. Consumers spent between 3 and 4 hours per day chewing. The time of consumption is generally mornings in the
10
Mohamed Ibrahem Kotb El-Sayed and Hatem Al-Kordy Amin. Effect of Catha Edulis on insulin, resistin and cortisol levels in type-2 diabetics and nondiabetics. American Journal of Biochemistry and Biotechnology, 2012, 8 (3), 157-163
ACF East Hararghe Nutrition Causal Analysis Report Page 33
villages and afternoons in urban centers like Harar. It is often a collective time-sharing and the time to discuss and socialize together.
The links between khat and malnutrition were not mentioned by experts during the workshop; it was only concluded after discussion that “khat may have a relation with malnutrition if consumed by the mother during pregnancy”. However, the community testified the opposite: several factors contributed to clarify these links:
The lands used to produce khat extended to the detriment of staple food production, which which would take part in the recurring lack of food in the area and increase households’ dependence on the market to purchase food.
«Moreover, the production is also decreased now compared to the early time which leads to food insecurity to some extent due to covering the land with khat, the cash crop.» Govt Employee
The sale of khat at the market is always the work of the women. They explained why this activity took time for them, several hours per day. While they are in the market, they leave children in the house, as it is difficult to sell in the market if they are accompanied by their children. In this case the elder children take care of babies. In the qualitative study, it seemed common that children did not eat any meal during the absence of their mother. A few mothers said that they used to leave the baby at home starting 2 months of age.
Khat (Catha edulis Forsk), also called “natural amphetamine”, is a psycho-stimulant herb cultivated in East Africa. It contains cathinone, a psychoactive alkaloid, with similar health effects to those of amphetamines. The expected effects are more concentration, euphoria and more energy. All interviewees also recognized that when they consumed khat, they lost their appetite. From discussions with men and women, all agreed that pregnant and lactating mothers chewed too. For the pregnant mothers, chewing supported food restrictions aiming of an easier childbirth. Lactating women noted that their production of breast milk decreased with the consumption of Khat.
«At the beginning of the pregnancy, the mother should eat additional food, but when they chewed chat, they don’t want to eat food (loss of appetite). This is the effect of khat on food.» Health professional
The search for increased financial income from the sale of khat leads farmers to use chemical products to increase their production. From September to December, the production is weaker. Farmers use DDT during this period to help the plants grow bigger. More research on the medical consequences of chewing of khat covered with DDT is needed. The ingestion of DDT by pregnant and lactating mothers could have real consequences on children’s health. Lastly, the use of DDT has environmental consequences and is harmful to other crops.
It seems also common to use the powder distributed to purify drinking water on Khat leaves to fight against pests. That contributes to limit the access to safe drinking water for the families (and their children).
“The DDT applied on the khat can also have contribution in malnutrition because it kills bees when is sprayed on khat leaves leading to low production honey.” Govt Employee
Despite the fact that sale of khat is perceived to be most profitable, not all producers get the same benefit from them. The quality of the khat is what matters. According to the soil where it is cultivated, the produced khat is not sold at the same price. Sometimes it is not sold at all because of its poor quality and is not attractive for the consumers. In this case, farmers produce it for their own consumption.
«The khat is not sold here now. It is very cheap now and the quality of khat was not good.» FGD Mothers
8.2.4 Problem in Quantity and Quality of Food
Problem in quality and quantity of food = Hypothesis 14
Regarding IYCF practices, if a child does not receive the right quantity of food that s/he needs daily according to his/her age, s/he will not grow according to standards as others do. Also, if a child does

ACF East Hararghe Nutrition Causal Analysis Report Page 34
not receive the right quality of food, the same will happen. In our study, although people had access to staple food groups (during the season during which the study took place, at least), the dietary diversity and therefore dietary quality was low. Furthermore, very low consumption of valuable protein sources (animal proteins such as meats, eggs, dairy products) implied low nutritional value of the diet. Even though a high proportion of households had access to staple food, their knowledge on diversification of food remains limited. Hence, the essential nutritional value needed for each individual was not reached and poor nutritional status was expected to be found in households. Only 28.5% of households reported that they had foods prepared from roots or tubers. Only in 25.5% of the households were vegetables available. 25.3% of the respondents had fruit. 26.6% of the respondents had meat and organ meat. Hence less children in the area were getting foods containing high proteins and vitamins. More than 72.9% of the households fed their children, and themselves, food made from sorghum.
Besides low diversification of food in the area, some households did not have sufficient food in quantity to feed their family, even with meals made from common staple foods. Only 42.5% (N=321) of the households had enough food for their HH members to eat during the survey; the remaining 58.5% of surveyed households had no enough food for their HH members to feed themselves. Only 41.1% of the respondents reported that they had the ability to eat their preferred food. 289 (38.3%) of the respondents reported that they had decreased the amount of food eaten per day. 32.6% of the households reported that they encountered days when they had no food to eat.
Therefore, based on the above findings and qualitative data, this NCA study shows that lack of sufficient food in quality and quantity could be having a significant association with malnutrition, and could be a high risk factor for malnutrition.
Table 15: Indicators for problem in quantity and quality of foods
Indicator N Mean or proportion
Availability of food prepared from roots and tubers 755 28.5%
Availability of vegetable 755 25.5%
Availability of meat 755 26.6%
Main staple food to be sorghum 755 72.9%
Event food is not available 755 38.3 %
Household food diversity to be grain and cereals only 755 68.9%
8.3 Nutritional Status of Mothers Pregnant/Lactating
Voluntary anorexia at the end of pregnancy is a very current practice. Mothers worry about complications during childbirth and have many food restrictions aiming to have a small baby. This practice is found in other regions and has been found to have an unquestionable impact on the nutritional status of the mother, the child in utero, and the baby in her/his first years. Fear of complications on the part of mothers can be easily comprehensible, since many are delivering at home: any complication can be mortal for the mother and/or for the child. From the qualitative enquiry, it seems that sometimes health professionals/traditional birth attendants (TBA) who assist the childbirth or make the antenatal consultations still advise to follow the food restrictions to simplify the childbirth at the health center. No taboo or food restriction was evoked for lactating women.
«When we screened, the lactating and pregnant mothers from the total population 60% (647) had the problem of food restriction at the pregnancy. During March, moderate 826 children were affected by the malnutrition. » Health Professional
“Yes, there is some restricted food during pregnancy. There is a food taboo, when some types of food are not eaten by the mothers during the pregnancy like potato, carrot, mango and any other food that can produce obesity in the person. The main reason for the mother not to eat this food is due to the fear of complication during labor.” Mother
“It is the health worker who initially recommended not eating vitamins and vegetable because the child become big and create difficulty during labor.” TBA

ACF East Hararghe Nutrition Causal Analysis Report Page 35
8.4 Diseases Associated
Disease = Hypothesis 8
The Infection-Malnutrition cycle: Undernutrition and infection often occur at the same time because one can lead to another. The level of interaction depends on the infection and the extent of undernutrition but in general, poor nutrition can result in reduced immunity to infection. This can increase the likelihood of an individual getting an infection or increase its duration and/or severity. Infection can result in loss of appetite, increased nutrient requirements and/or decreased absorption of nutrients consumed. This triggers further weight loss and reduced resistance to further infection. This vicious cycle needs to be broken by treatment of infection and improved dietary intake
11.
Children are a highly vulnerable group for both malnutrition and infection. Regardless of the mother’s health status, exclusive breast feeding is recommended and has a big role in prevention of infection among children. According to our study, 17.1% (N=129) of respondents reported that they gave formula milk to their children; children among these households could be more highly vulnerable to infection and in the meantime they could also be more likely to develop malnutrition.
11.7% (N=88) of children in the surveyed area had diarrhea more than 3 times in the 24 hours preceding the survey. This indicates that those 11.7% of children are highly vulnerable to develop malnutrition. Such prevalence of diarrheal disease can be an indication of poor care practices, scarcity of water in the area and poor sanitation in the surveyed woredas.
9.7% of the children had acute respiratory tract infection in the 2 weeks preceding the survey.
So poor environmental sanitation, poor care practices, scarcity of safe water (30.1% of the community use pond water for drinking) and poor child sanitation were determinants of child infection found in the area of study, making them high risk factors of malnutrition.
As discussed in hypothesis 7, low utilization of health services among mothers was found significant. Hence, if the mother did not attend antenatal care during pregnancy, she would be susceptible to infection. The infection during pregnancy can cause malnutrition and this could lead to giving birth to a child with low birth weight. The quantity/quality of the breast milk could also be affected and the nutritional status of the child would deteriorate. Thus, infection among women at reproductive age is seen as a high risk factor of malnutrition among children.
Table 16: Indicators Disease
Indicator N Mean or proportion
Formula feeding 755 17.1%
ANC follow up 755 24%
Children with diarrhea 755 11.7%
Children with ARTI 755 9.7 %
Utilization of pond water for drinking 755 30.1%
“Which are the common diseases among children? Pneumonia; Diarrhea; Malnutrition” Care provider, Fedis
According to the Woreda health office, Pneumonia, intestinal parasite, cough/ARI, diarrhea and malnutrition were the top five causes of child morbidity in the Woreda. Final Report on Nutrition Survey in Fedis Woreda of East Hararghe Zone, Oromiya Regional State, Ethiopia
Diarrhea is due to water problem because the majority of people drink pond water. This diarrheal disease is common during this time of the year.
«Yes, a lot of disease associated with malnutrition. We get the data from the health post special the diarrhea is the most prevalent in this area. Diarrhea is one of the causes of malnutrition.» HEW, Fedis
Lack of clean water was viewed as the main cause of high incidences of diarrhea and other intestinal problems.
11
http://www.unicef.org/nutrition/training
ACF East Hararghe Nutrition Causal Analysis Report Page 36
The World Health Organization (WHO) estimated that in 2002, 56,700 deaths in Ethiopia were attributable to solid fuel (wood and animal dung) use, including the deaths of 50,320 children under five from acute lower respiratory infections.
8.5 WASH
Problem related with WASH (Environmental Sanitation) = Hypothesis 12
“We don’t have water problem. We get the water from the tap. During the dry season we get the water from reservoir.” Mothers, Kersa
“The mothers were leaving the children alone to fetch the water from a very far area, which may take five hours. The child was crying and finally the child got headache. The children were not breastfed while the mothers are out fetching water” Chief of village, Fedis
The access to water and drinking water is often quoted as an important problem but the situation is very variable from one area to another and one season to another.
“We are drinking pond water. We use “wuha agar12
” to purify it but we can’t get it always. We know about water borne disease but nobody is boiling water to drink.” Mothers
«The main problem of this town is inaccessibility of clean water for drinking purposes. The community is getting drinking water from the river. Therefore, the community is exposed to different types of water borne diseases and the polluted water contains worms. Therefore, the people easily get malnutrition. Water problem is the main cause of malnutrition. There is treatment plant of water like “wuha” (water) agar in the kebele but it is not sufficient and accessible to all households.» Chief of village
«Almost all kebeles have scarcity of water except two or three kebeles. But these two or three kebeles only get water from the hand pump during the spring/rain season.» Chief of kebele
Every year some 3.4 million people, mostly children, die from diseases associated with inadequate water supply, sanitation, and hygiene. Over half of the hospital beds in the world are filled with people suffering from water- and sanitation-related diseases. Many diseases are spread from person to person by germs in feces. Some experts believe health problems from poor sanitation can be prevented only if people change their personal habits, or “behaviors,” about staying clean. But this indication often leads to failure because it does not consider the barriers that people face in their daily lives, such as poverty or lack of access to clean water, distance to get it, etc.
Then, when behavior does not change, people are blamed for their own poor health (3). Environmental sanitation looks at improving community health by providing a clean environment and breaking the cycle of disease. It depends on various factors that include hygiene status of the people, types of resources available, innovative and appropriate technologies according to the requirement of the community, socioeconomic development of the country, cultural factors related to environmental sanitation, political commitment, capacity building of the concerned sectors, social factors including behavioral pattern of the community. The main source of drinking water in the area of this survey was pond water which accounts at about 31.1 % and the around 19.5 % of drinking water source is from protected springs. Figure below shows the main source of drinking water in the area.
12
“Wuha Agar”: the name they give to the tablets to potabilize the water
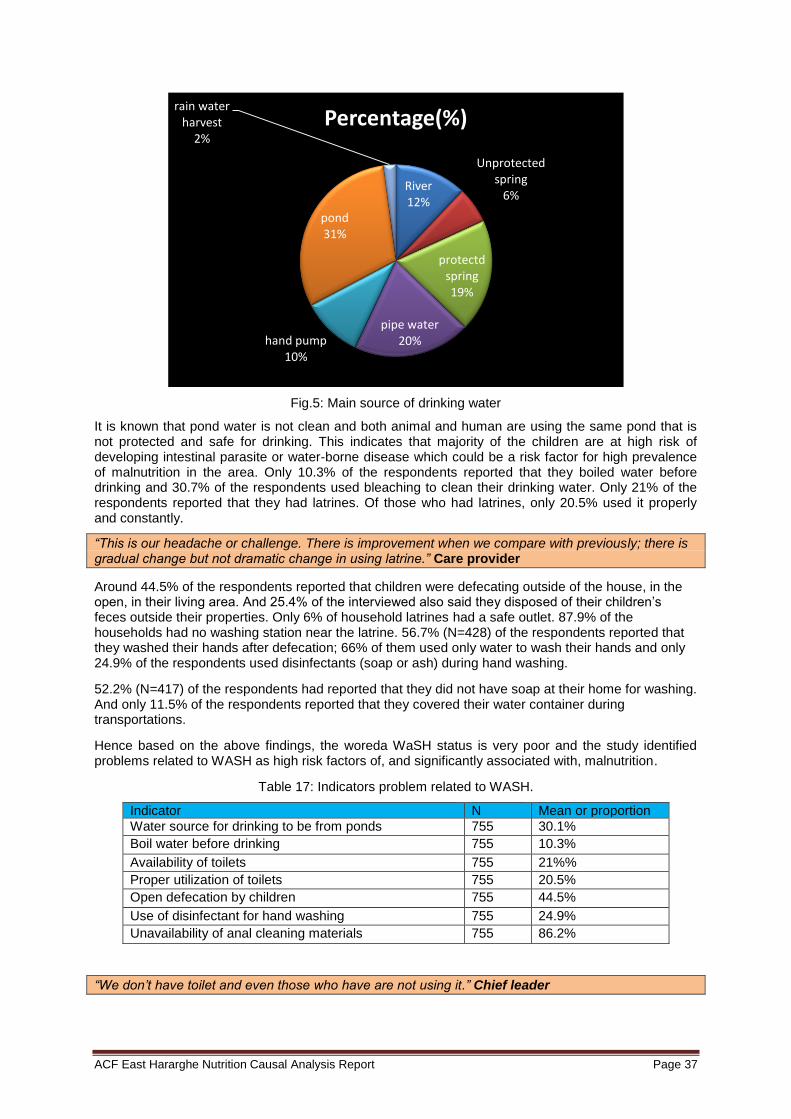
ACF East Hararghe Nutrition Causal Analysis Report Page 37
Fig.5: Main source of drinking water
It is known that pond water is not clean and both animal and human are using the same pond that is not protected and safe for drinking. This indicates that majority of the children are at high risk of developing intestinal parasite or water-borne disease which could be a risk factor for high prevalence of malnutrition in the area. Only 10.3% of the respondents reported that they boiled water before drinking and 30.7% of the respondents used bleaching to clean their drinking water. Only 21% of the respondents reported that they had latrines. Of those who had latrines, only 20.5% used it properly and constantly.
“This is our headache or challenge. There is improvement when we compare with previously; there is gradual change but not dramatic change in using latrine.” Care provider
Around 44.5% of the respondents reported that children were defecating outside of the house, in the open, in their living area. And 25.4% of the interviewed also said they disposed of their children’s feces outside their properties. Only 6% of household latrines had a safe outlet. 87.9% of the households had no washing station near the latrine. 56.7% (N=428) of the respondents reported that they washed their hands after defecation; 66% of them used only water to wash their hands and only 24.9% of the respondents used disinfectants (soap or ash) during hand washing.
52.2% (N=417) of the respondents had reported that they did not have soap at their home for washing. And only 11.5% of the respondents reported that they covered their water container during transportations.
Hence based on the above findings, the woreda WaSH status is very poor and the study identified problems related to WASH as high risk factors of, and significantly associated with, malnutrition.
Table 17: Indicators problem related to WASH.
Indicator N Mean or proportion
Water source for drinking to be from ponds 755 30.1%
Boil water before drinking 755 10.3%
Availability of toilets 755 21%%
Proper utilization of toilets 755 20.5%
Open defecation by children 755 44.5%
Use of disinfectant for hand washing 755 24.9%
Unavailability of anal cleaning materials 755 86.2%
“We don’t have toilet and even those who have are not using it.” Chief leader
River 12%
Unprotected spring
6%
protectd spring 19%
pipe water 20% hand pump
10%
pond 31%
rain water harvest
2%
Percentage(%)
ACF East Hararghe Nutrition Causal Analysis Report Page 38
Pit latrine was available in about 23.6% of the households (…)
The scarcest resource identified was water both for safe drinking and for livestock and agricultural production, especially irrigation. In EH, recurrent droughts of 2009, 2011 and 2012 were specific factors raised in FGDs for this zone. In both zones, women and girls reported traveling on average 1-2 hours a day and in the worst case scenario, up to seven hours with waiting times in line-ups, for fetching water. Women and girls reported traveling on average 1-2 hours a day for fetching water for cleaning and then water for household members and livestock to drink.
A Gender Analysis Study of DFAP-Targeted Food Insecure Woredas in Dire Dawa Administrative Council, Arsi & East Hararghe Zones
8.6 Improper Identification of Target Groups
Improper identification of target groups (Food aid) = Hypothesis 9
“The government is giving food aid, but we did not receive it yet. Those who register only register their relatives. They consider family members, relation with them, and some may bribe them to be registered. It is difficult for the poor to get such aids. But the plumpy nut registration is not based on whether you are relative to those who register or not. Other supplement foods such as ‘fafa” (premix) is also based on being relative or having good relation with those who register. Sometimes, they appoint you, you can’t get the supplies.” Mother of MNC
The problem of inappropriate targeting is understood at 2 levels: the first is identification of malnourished children to refer them to existing programs. Community active case detection is one of the roles of the HEW. It seems that knowledge of moderate malnutrition is insufficient among HEW, as well as timely screening; therefore, malnutrition is identified when it becomes severe, not before.
During the workshop participants also brought up the issue inappropriate targeting of the poorest households which can profit from official support. The community did not seem satisfied with criteria of attribution of assistance.
Mass screening CHD is usually done every three months (EOS) at all levels of kebeles using HEW’s to identify and detect at early stage malnutrition among children under five and PLW. Improper identification and classification of target groups can happen both at kebele level by HEW’s and volunteers, and at HC level by health center staff due to knowledge gap and sometimes poor attention to the established criteria. Wrong referral can occur at mass screening; reassessing and proper diagnosing is essential. Proper identification of target groups would help to act timely and so that proper action is taken. When the child is classified as MAM and if s/he could get appropriate supplementary food, the child would not evolve to SAM. HDAs are the ones who first screen the children and PLW at community level and send them to HP for rescreening and if the criteria are fulfilled the beneficiaries will be enrolled to the appropriate program. Hence, building the capacity of the HDAs will help in identification of beneficiaries appropriately.
Awareness of the community on signs of malnutrition will help also in identifying target groups. 51.1% of respondents reported that they could identify malnutrition. 54.4% of respondents could identify wasting, but only 1.6% of the respondents reported that they could identify nutritional edema. So if the child was not identified properly and timely, s/he could easily deteriorate; e.g. SAM with no complication will develop complication and will need to be admitted in SC. Improper identification of target groups at all levels is a high risk factor of malnutrition.
Table 18: Indicators improper identification of target groups.
Indicator N Mean or proportion
Identification of malnutrition 755 51.1%
Identification of wasting 755 54.4%
Identification of nutritional edema 755 1.6%
A total of 40,096 beneficiaries were targeted under PSNP and receiving cash with the amount of 90 ETB/person/month. Relief food distribution with food basket of 15kg grain, 1.5 pulses and 0.45 vegetable oil person/month was also given to a total of 3, 716 beneficiaries, with blanket supplementary food of 4.5 kg/person/month for all U5 and PW & LM. The OTP service was running in 21 health posts and SC was implemented in 5 health centers by the Woreda health office with the
ACF East Hararghe Nutrition Causal Analysis Report Page 39
support of IMC. The OTP admission was decreasing with no cases of SC at the time of the survey. A Gender Analysis Study of DFAP-Targeted Food Insecure Woredas in Dire Dawa Administrative Council, Arsi & East Hararghe Zones
TSFP was functional in all the 21 Kebele with a monthly basis screening of beneficiaries and provision of 6.25 kg of Famix and 1 liter of vegetable oil /per child/ month. However, out of the total moderately malnourished children identified through the survey, it was only a few (24.1%) who were found to have been registered for TSFP services, indicating very low coverage of the program and there is a need for strengthening of the screening coverage.
Based on FGDs in both zones, common causes of chronic poverty and food insecurity are: erratic and reduced rainfall, lack of access to water for human and animal consumption, high population density and fertility rates, land and natural resource degradation due to continuous utilization and deforestation, limited grazing land making it difficult to maintain or feed livestock, fragmented small land holdings; landlessness; low productivity, and lack of access to productive inputs (i.e. credit, technology, fertilizer, and seed varieties).
Assessing DFAP Maternal, Child & Nutrition (MCHN) Program Outcomes using the LOT Quality Assurance Sampling (LQAS), CRS
8.7 Low Household Income
Low household income = Hypothesis 13
According the qualitative study, people with livestock or some kind of business have been faring better. Also people who have moved to other areas have coped better than those remaining. Migration could be seen as a survival strategy because transfers from the urban-based family members could be an important income source for the rural-based members who look after migrant's children and property. (Dalal-Clayton et al. 2003, 26.) Farmers have coped worst because they are so dependent on water. Also the people without livestock have coped worst. The Resilience of Rural Ethiopia Livelihoods: A case study from Hararghe zone, Eastern Ethiopia
Household income determines the health and wellbeing of the household. Sale of one’s own crop production was only 6.9% in our study; the highest source of income found was selling khat accounting for about 30.1% of household source of income. The second source of income following khat was selling of livestock, which is about 23.7%. Sale of animal products was only 1.1%, and 1.7% of the household income was from fattening. Around 7.5% of the respondents’ income was from selling wood or charcoal, which indicated the scarcity of crops and livestock in the area. Petty trade accounted for about 2% of income and selling of labor was about 7.8% which also indicated the existence of deteriorated and serious household food insecurity that highly aggravated the nutrition situation in both woredas. Availability of farm land was defined as a big asset and source of income for the community; yet an average of 0.0279 timads of farm land were available in the area per family, which is very low and is the major cause of low income for households in the area.
Table 19: Indicators low household income
Indicator N Mean or proportion
Available farmland per HH in timads 755 0.0279 timads
Source of own production 755 6.9%%
Major source of income to be khat 755 30.1%
8.8 Health Services / Sanitary Environment
Low utilization of health services = Hypothesis 7
The Health Extension Program, (HEP) is an innovative, community-based program that was first introduced in Ethiopia in 2003. This program was launched after realizing that the basic health services were not reaching the majority of the population. The objective of HEP is to improve equitable access to mainly preventive health services through community (kebele) based services. These services all have a strong focus on health promotion and preventive health activities, as well as enhancing community health involvement. The principle behind this program is to transfer ownership and responsibility of maintaining health to individual households. Even though health service is accessible to the majority of the community, health seeking behavior among the majority of Ethiopian
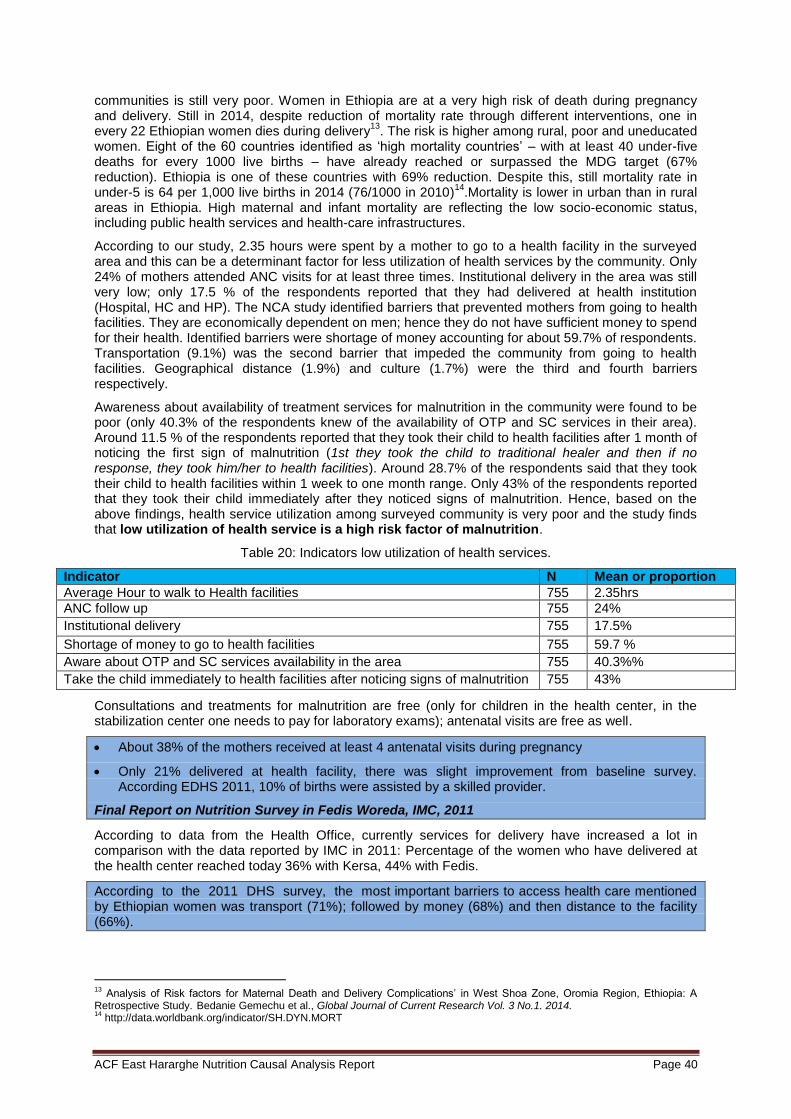
ACF East Hararghe Nutrition Causal Analysis Report Page 40
communities is still very poor. Women in Ethiopia are at a very high risk of death during pregnancy and delivery. Still in 2014, despite reduction of mortality rate through different interventions, one in every 22 Ethiopian women dies during delivery
13. The risk is higher among rural, poor and uneducated
women. Eight of the 60 countries identified as ‘high mortality countries’ – with at least 40 under-five deaths for every 1000 live births – have already reached or surpassed the MDG target (67% reduction). Ethiopia is one of these countries with 69% reduction. Despite this, still mortality rate in under-5 is 64 per 1,000 live births in 2014 (76/1000 in 2010)
14.Mortality is lower in urban than in rural
areas in Ethiopia. High maternal and infant mortality are reflecting the low socio-economic status, including public health services and health-care infrastructures.
According to our study, 2.35 hours were spent by a mother to go to a health facility in the surveyed area and this can be a determinant factor for less utilization of health services by the community. Only 24% of mothers attended ANC visits for at least three times. Institutional delivery in the area was still very low; only 17.5 % of the respondents reported that they had delivered at health institution (Hospital, HC and HP). The NCA study identified barriers that prevented mothers from going to health facilities. They are economically dependent on men; hence they do not have sufficient money to spend for their health. Identified barriers were shortage of money accounting for about 59.7% of respondents. Transportation (9.1%) was the second barrier that impeded the community from going to health facilities. Geographical distance (1.9%) and culture (1.7%) were the third and fourth barriers respectively.
Awareness about availability of treatment services for malnutrition in the community were found to be poor (only 40.3% of the respondents knew of the availability of OTP and SC services in their area). Around 11.5 % of the respondents reported that they took their child to health facilities after 1 month of noticing the first sign of malnutrition (1st they took the child to traditional healer and then if no response, they took him/her to health facilities). Around 28.7% of the respondents said that they took their child to health facilities within 1 week to one month range. Only 43% of the respondents reported that they took their child immediately after they noticed signs of malnutrition. Hence, based on the above findings, health service utilization among surveyed community is very poor and the study finds that low utilization of health service is a high risk factor of malnutrition.
Table 20: Indicators low utilization of health services.
Indicator N Mean or proportion
Average Hour to walk to Health facilities 755 2.35hrs
ANC follow up 755 24%
Institutional delivery 755 17.5%
Shortage of money to go to health facilities 755 59.7 %
Aware about OTP and SC services availability in the area 755 40.3%%
Take the child immediately to health facilities after noticing signs of malnutrition 755 43%
Consultations and treatments for malnutrition are free (only for children in the health center, in the stabilization center one needs to pay for laboratory exams); antenatal visits are free as well.
About 38% of the mothers received at least 4 antenatal visits during pregnancy
Only 21% delivered at health facility, there was slight improvement from baseline survey. According EDHS 2011, 10% of births were assisted by a skilled provider.
Final Report on Nutrition Survey in Fedis Woreda, IMC, 2011
According to data from the Health Office, currently services for delivery have increased a lot in comparison with the data reported by IMC in 2011: Percentage of the women who have delivered at the health center reached today 36% with Kersa, 44% with Fedis.
According to the 2011 DHS survey, the most important barriers to access health care mentioned by Ethiopian women was transport (71%); followed by money (68%) and then distance to the facility (66%).
13
Analysis of Risk factors for Maternal Death and Delivery Complications’ in West Shoa Zone, Oromia Region, Ethiopia: A Retrospective Study. Bedanie Gemechu et al., Global Journal of Current Research Vol. 3 No.1. 2014. 14
http://data.worldbank.org/indicator/SH.DYN.MORT
ACF East Hararghe Nutrition Causal Analysis Report Page 41
A Gender Analysis Study of DFAP-Targeted Food Insecure Woredas in Dire Dawa Administrative Council, Arsi & East Hararghe Zones
”When a child is sick, if we immediately take him to the health facility, the child will be cured and the child will not enter in the OTP programs. But the child is staying at home due to lack of money to pay for the services. We pay for other diseases but not for the malnutrition services.” Fathers, Kersa
8.8.1 Nutrition program
TSFP was operational in all the 21 Kebeles with a monthly basis screening of beneficiaries and provision of 6.25 kg of Famix and 1 liter of vegetable oil /per child/ month. However, out of the total moderately malnourished children identified through the survey, it was only a few (24.1%) who were found to have been registered for TSFP services, indicating very low coverage of the program and there is a need for strengthening of the screening coverage.
Major issues identified by TWG during workshop on 31st October 2013
HEW mentioned that one of the reasons for the cases to increase has been the interruption of target supplementary feeding (TSFP) in October/November. She said that “TSFP minimize severe acute malnutrition, because the children detected early when they are with moderate malnutrition are given FAMIX (“Fafa”) and they will recover. Target supplementary feeding also has a role in minimizing the relapse cases.” (But the interruption was due to absence of the focal person because of maternity
leave).
“I took my child to Haramaya health center and they gave my child syrups. Since there was no improvement I took to health center of Kersa, from where my child got Plumpy-nut.” Mother
«The communities are not satisfied with the services they get from the health facility because the services cannot be reached by every family.» FGD Fathers
“Yes, concerning malnutrition the problem in our kebele is due to health extension workers. Health extension workers exist but are not working appropriately. Once, I received a paper from health center so that our health extensions give us plumpy-nut, but she told me that there is no plumpy-nut. I repeatedly asked weeks after weeks and she told me that she has no plumpy-nut; then after my child become severely ill and I brought him here.” Family of affected child at stabilization center.
0 0 6 3
14
1 0 8
0
10
20
OTP Admission Versus Outcome of Melka HP 205/6
Total admissions (C) CURED(D1)
DEATH(D2)
DEFAULTER (D4) Transfer out(E2) toin-patient

ACF East Hararghe Nutrition Causal Analysis Report Page 42
8.8.2 Traditional Healers
In Ethiopia like others parts of the world, wide use of traditional medicine is attributed to its accessibility and affordability. Research on traditional medicine, First National workshop, July 2003
The traditional healers are given “trust” inherited after centuries. They have also the advantage of being close to the community and less expensive.
“The other human related cause mentioned regarding malnutrition was making traditional health services as priority in treating children’s diseases” Govt Employee
“I take the child to the traditional healer first”, Mother of MNC
The traditional medicine is regulated by governmental laws. Some practices, especially on children, are prohibited. This has had implications in our study while enquiring for issues related with traditional medicine, as people were quite reluctant to answer. However, as it is frequent to see scars of the traditional practices on the body of children, families sometimes agreed to testify sincerely. Depending on the practice used, the link with malnutrition is relatively important.
«The payment of skin burning and uvula cutting were 20 birr and 30 birr respectively. The traditional healers were better than the health facility» Mother of MNC
Traditional medicine is not specifically used when the mothers are sure that it is about malnutrition. Nevertheless, they bring the child as of the first signs of the disease: loss of appetite, vomiting, diarrhea.
« I didn’t work on uvula cutting but my work was to differentiate/diagnose whether children have malnutrition or not. If the children have malnutrition I send them to the health facility. (…) Now I’m doing well and this knowledge was hereditary from my mother. I burn the skin of the child when the child has convulsion. If the child has the problem on the back I burn there, and if s/he has the problem around the chest or stomach I burn there. I am assisting five or six children per week. During the dry season the cases were more prevalent but during the rainy season it decreased. » Traditional Healer
Traditional screening could be a source of confusion for families. In this case, the diagnostic of malnutrition might be very late.
«The families of the children come here before going to the health facility. The healer burns the cover of the coffee and then smell the child; it’s the“fatuma procedure”. After she did this procedure the family brings the child for her to identify whether the child has or not malnutrition. If this child was not in good health we take out the bad tooth... » Traditional Healer
The practices most frequently used are: uvulectomy, burns on the chest, bottom of the belly, bottom of the back, extraction of the bad tooth and more rarely “hudurof”. Several of these practices are used in other African areas (e.g. Chad) where we evidenced that they are an aggravating factor for malnutrition.
«Yes, there is extraction of tooth. The tooth extraction takes place when the children fail to grow or are unable to walk especial during the age of one year. The name of the professional was “Dawo”. They believe there is worm inside the teeth. I tried to take my child to health facility to know whether the child has problem of malnutrition or other problems but my child was not recovered from the problem. Then I took the child to the traditional healer and my child was cured from all the problems» Mother
Indeed, mothers await the end of the traditional treatment which lasts roughly 3 weeks. If the child does not improve, they will bring the child to the health center. The length of 3 weeks of the traditional treatment contributes to the deterioration of the health status of the child.
Traditional practices have risk of infection and cause pain for the child. The child who suffered the cutting of the uvula cannot eat well during several days
“Previously we used to practice “hudurof”, which is done by inserting short wood and rotating inside the anus so that bleeding occurs. Nowadays we are not doing it because we are aware about its harm from health extension workers.” Mother
ACF East Hararghe Nutrition Causal Analysis Report Page 43
P1:“We practice tooth extraction, uvulectomy and burning. We did this only for the sick children during that sickness”. Mother of MNC
P2: “We first try at health center; if there is no improvement we practice uvulectomy, burning or tooth extraction.” Mothers of MNC
“Previously, when the children were malnourished, the family slaughtered a goat, then immediately put the fresh stomach of the goat over the abdomen of the child (“Chuma re’e”). They believe that once the child has been put the goat’s stomach over, the child would recover. Also, if mothers do not give care properly for the child, then the child eats soil. As result of this, the child suffers from stomach distension. This will bring malnutrition.” Chief of village
“It is female children who are more affected, because male get more care than female.” Chief leader
“The community/family gives more care for the first child than the second, third, etc. and also gives more care for boys than girls.” Father
The culture of the family is to give more attention to the boy, but sometimes this might be harmful, as in the case of traditional practices. At the time of the first signs of the disease, parents seek care more quickly for the boy child. This will direct parents to request for traditional treatments, some of which may worsen the illness of the boy child: risk of infection, difficulties for eating, pains etc. This might be a reason for the finding in the SMART survey that boys were slightly more affected by malnutrition than girls.
8.8.3 Self-Medication
Medication by plants was mentioned in the interviews. The most common was to provide butter and water mixed with sugar to relieve abdominal colic of babies. Traditional medicine by plants is not illegal. But mothers more often admitted asking to traditional healers for traditional practices.
“The mothers provide additional food for their child like honey, sugar, water butter during the first six months. When there is abdominal cramp, they will provide butter for the digestion, the butter is a self-medication.” Govt Employee
“I took my child to the health facility after the child became very sick. Since I have no money, I took him to the health facility after I tried in the village with medicinal plants. There are some plants that we learned from our parents which treat such problems. I know that medicine from health facility is better, but the plant medicine can also help to treat if the child has diarrhea and vomiting.” Mother of MNC
8.8.4 Private Sector
The private sector, despite higher prices, can also attract parents. Private clinics provide what the parents think is most effective, like syrups or injections.
«I took my children to private clinic for injection. If by chance your baby passed away, the community criticizes you by saying you didn’t take your child to health facility where you can get injection. Our community has faith in injection. That is why I first take my child to clinic for injection. But, now I understood that I would have brought my child to government health facility and the money paid to the private clinic could be saved and help my child in getting better.» Mother of MNC
8.9 Workload / Availability for Children
Workload of care givers = hypothesis 1
44.7% (N=338) of the caregivers responded that they faced a work overload when they needed to care for their children. 55.3% (N=417) of the respondents reported that they did not have too much of a workload to take care of their children. More than 84.4% of the child care takers were mothers only, while only 0.8% were fathers. The rest of care takers were siblings, grandmothers, and aunts. So we can conclude that women were mostly the care givers for the children. Literature also shows that Ethiopia is one of the countries known for gender inequality. The statistical figures of DHS 2005 clearly show this difference. For instance, regarding literacy, sharp disparity is indicated among women and men even though it is low for both sexes. The proportion of illiterate women (who cannot read a whole sentence) was as high as 76.8 % whereas for men it was 53.3%. By contrast, men are more than
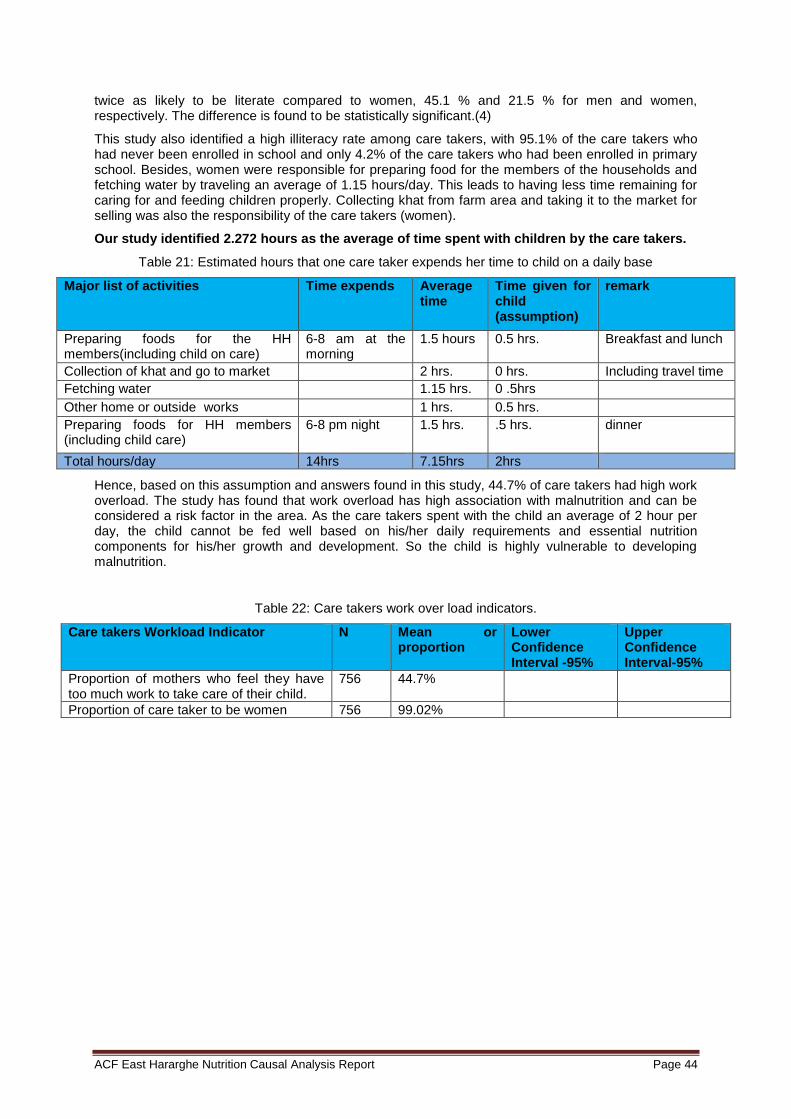
ACF East Hararghe Nutrition Causal Analysis Report Page 44
twice as likely to be literate compared to women, 45.1 % and 21.5 % for men and women, respectively. The difference is found to be statistically significant.(4)
This study also identified a high illiteracy rate among care takers, with 95.1% of the care takers who had never been enrolled in school and only 4.2% of the care takers who had been enrolled in primary school. Besides, women were responsible for preparing food for the members of the households and fetching water by traveling an average of 1.15 hours/day. This leads to having less time remaining for caring for and feeding children properly. Collecting khat from farm area and taking it to the market for selling was also the responsibility of the care takers (women).
Our study identified 2.272 hours as the average of time spent with children by the care takers.
Table 21: Estimated hours that one care taker expends her time to child on a daily base
Major list of activities Time expends Average time
Time given for child (assumption)
remark
Preparing foods for the HH members(including child on care)
6-8 am at the morning
1.5 hours 0.5 hrs. Breakfast and lunch
Collection of khat and go to market 2 hrs. 0 hrs. Including travel time
Fetching water 1.15 hrs. 0 .5hrs
Other home or outside works 1 hrs. 0.5 hrs.
Preparing foods for HH members (including child care)
6-8 pm night 1.5 hrs. .5 hrs. dinner
Total hours/day 14hrs 7.15hrs 2hrs
Hence, based on this assumption and answers found in this study, 44.7% of care takers had high work overload. The study has found that work overload has high association with malnutrition and can be considered a risk factor in the area. As the care takers spent with the child an average of 2 hour per day, the child cannot be fed well based on his/her daily requirements and essential nutrition components for his/her growth and development. So the child is highly vulnerable to developing malnutrition.
Table 22: Care takers work over load indicators.
Care takers Workload Indicator N Mean or proportion
Lower Confidence Interval -95%
Upper Confidence Interval-95%
Proportion of mothers who feel they have too much work to take care of their child.
756 44.7%
Proportion of care taker to be women 756 99.02%
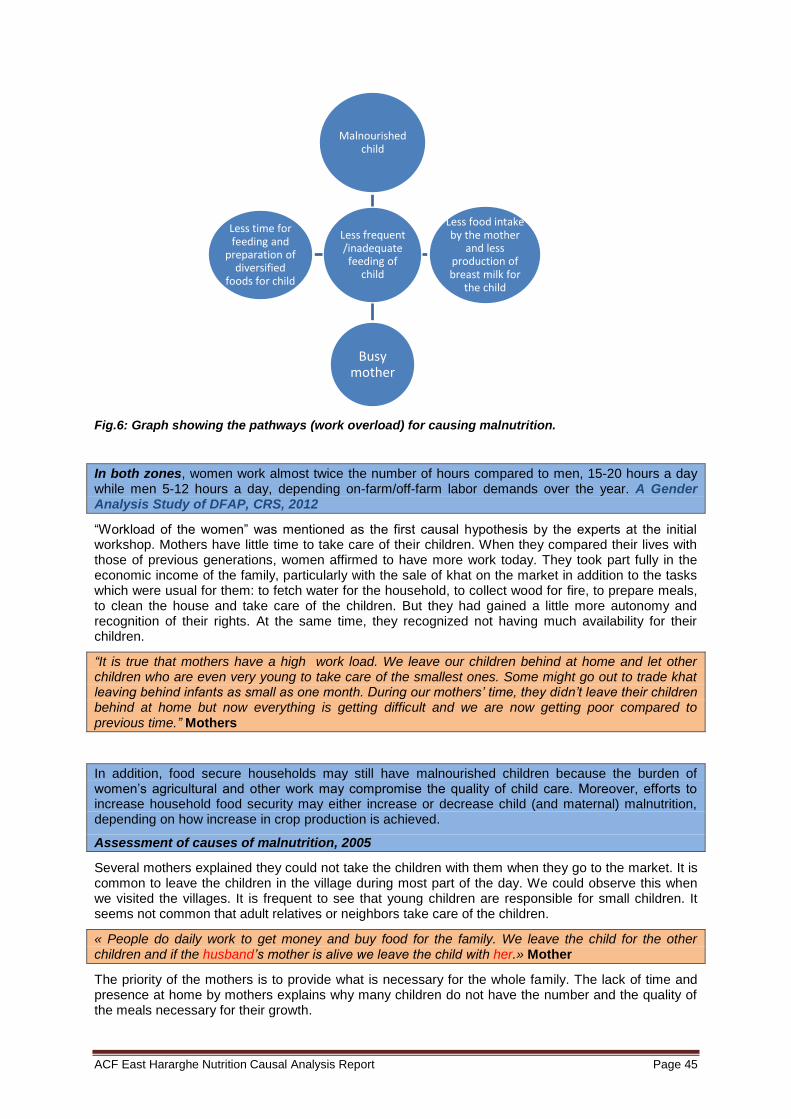
ACF East Hararghe Nutrition Causal Analysis Report Page 45
Fig.6: Graph showing the pathways (work overload) for causing malnutrition.
In both zones, women work almost twice the number of hours compared to men, 15-20 hours a day while men 5-12 hours a day, depending on-farm/off-farm labor demands over the year. A Gender Analysis Study of DFAP, CRS, 2012
“Workload of the women” was mentioned as the first causal hypothesis by the experts at the initial workshop. Mothers have little time to take care of their children. When they compared their lives with those of previous generations, women affirmed to have more work today. They took part fully in the economic income of the family, particularly with the sale of khat on the market in addition to the tasks which were usual for them: to fetch water for the household, to collect wood for fire, to prepare meals, to clean the house and take care of the children. But they had gained a little more autonomy and recognition of their rights. At the same time, they recognized not having much availability for their children.
“It is true that mothers have a high work load. We leave our children behind at home and let other children who are even very young to take care of the smallest ones. Some might go out to trade khat leaving behind infants as small as one month. During our mothers’ time, they didn’t leave their children behind at home but now everything is getting difficult and we are now getting poor compared to previous time.” Mothers
In addition, food secure households may still have malnourished children because the burden of women’s agricultural and other work may compromise the quality of child care. Moreover, efforts to increase household food security may either increase or decrease child (and maternal) malnutrition, depending on how increase in crop production is achieved.
Assessment of causes of malnutrition, 2005
Several mothers explained they could not take the children with them when they go to the market. It is common to leave the children in the village during most part of the day. We could observe this when we visited the villages. It is frequent to see that young children are responsible for small children. It seems not common that adult relatives or neighbors take care of the children.
« People do daily work to get money and buy food for the family. We leave the child for the other children and if the husband’s mother is alive we leave the child with her.» Mother
The priority of the mothers is to provide what is necessary for the whole family. The lack of time and presence at home by mothers explains why many children do not have the number and the quality of the meals necessary for their growth.
Less frequent /inadequate feeding of
child
Malnourished child
Less food intake by the mother
and less production of breast milk for
the child
Busy mother
Less time for feeding and
preparation of diversified
foods for child
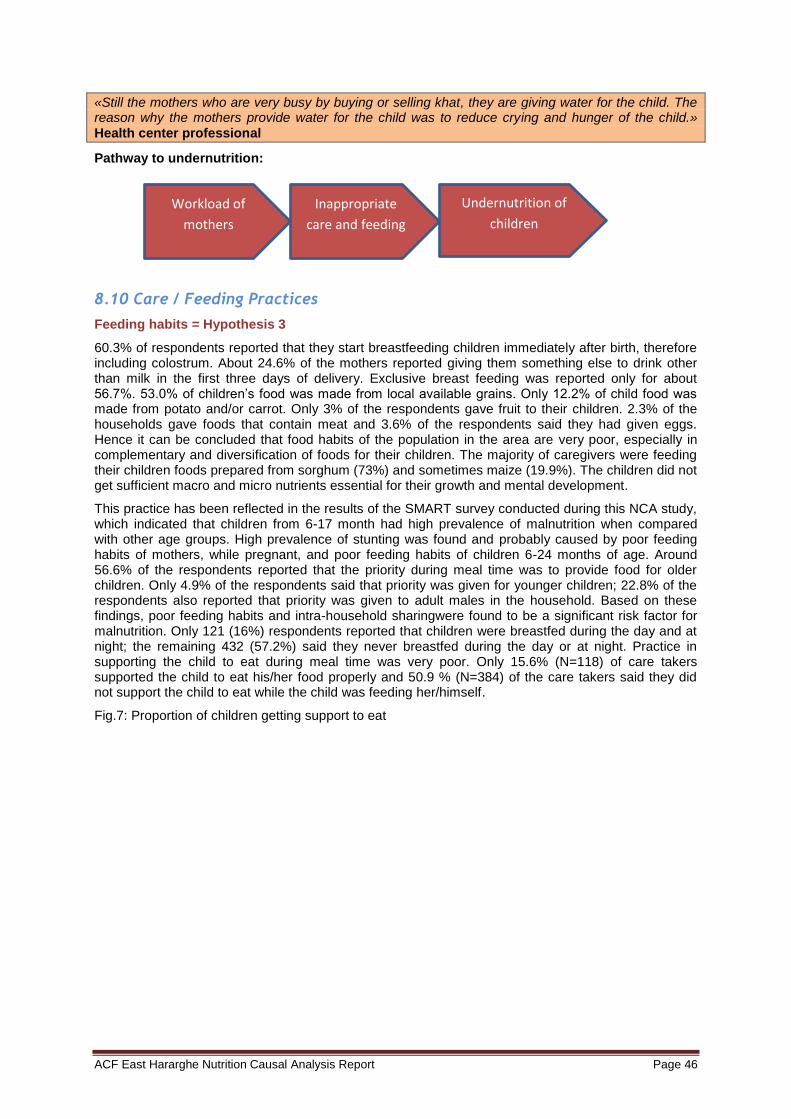
ACF East Hararghe Nutrition Causal Analysis Report Page 46
«Still the mothers who are very busy by buying or selling khat, they are giving water for the child. The reason why the mothers provide water for the child was to reduce crying and hunger of the child.» Health center professional
Pathway to undernutrition:
8.10 Care / Feeding Practices
Feeding habits = Hypothesis 3
60.3% of respondents reported that they start breastfeeding children immediately after birth, therefore including colostrum. About 24.6% of the mothers reported giving them something else to drink other than milk in the first three days of delivery. Exclusive breast feeding was reported only for about 56.7%. 53.0% of children’s food was made from local available grains. Only 12.2% of child food was made from potato and/or carrot. Only 3% of the respondents gave fruit to their children. 2.3% of the households gave foods that contain meat and 3.6% of the respondents said they had given eggs. Hence it can be concluded that food habits of the population in the area are very poor, especially in complementary and diversification of foods for their children. The majority of caregivers were feeding their children foods prepared from sorghum (73%) and sometimes maize (19.9%). The children did not get sufficient macro and micro nutrients essential for their growth and mental development.
This practice has been reflected in the results of the SMART survey conducted during this NCA study, which indicated that children from 6-17 month had high prevalence of malnutrition when compared with other age groups. High prevalence of stunting was found and probably caused by poor feeding habits of mothers, while pregnant, and poor feeding habits of children 6-24 months of age. Around 56.6% of the respondents reported that the priority during meal time was to provide food for older children. Only 4.9% of the respondents said that priority was given for younger children; 22.8% of the respondents also reported that priority was given to adult males in the household. Based on these findings, poor feeding habits and intra-household sharingwere found to be a significant risk factor for malnutrition. Only 121 (16%) respondents reported that children were breastfed during the day and at night; the remaining 432 (57.2%) said they never breastfed during the day or at night. Practice in supporting the child to eat during meal time was very poor. Only 15.6% (N=118) of care takers supported the child to eat his/her food properly and 50.9 % (N=384) of the care takers said they did not support the child to eat while the child was feeding her/himself.
Fig.7: Proportion of children getting support to eat
Workload of
mothers
Inappropriate
care and feeding
Undernutrition of
children

ACF East Hararghe Nutrition Causal Analysis Report Page 47
This study thus recognizes that feeding habits are found to be significantly associated with malnutrition, and are found to be a high risk factor of malnutrition in the area.
Table 23: Feeding habits indicators
Indicator N Mean or proportion
Immediate breast feeding initiation 755 60.3%
Excusive breast feeding 755 56.7%
Main food prepared from sorghum 756 73%
Priority given for younger children during meal time 755 4.9%
Breast feeding at day and night 755 16% %
Children supported to eat 755 15.6%
Average time given for child care per day 755 2.272
8.10.1 Breastfeeding
Colostrum
It seems that messages related to colostrum are well known by families. All the interviewed people stated to know that it is important to quickly breastfeed the child after his/her birth and to give him/her the first milk. Nevertheless, a few beliefs and practices persist. It appears common to give water to drink to the boy who is just born, and cow's milk to the girl, before the first breastfeeding. This practice could contribute to explain the slightly higher vulnerability of boys to malnutrition from the SMART survey. To drink water, often not very safe, may constitute an aggravating factor of malnutrition for the baby boys.
“In this culture, immediately after giving birth the mothers were giving different things depending on the sex of child. If the child was male they are given water (he becomes strong) and if it was female they are given cow milk (she becomes calm).” Traditional Healer
Pathway to under nutrition:
00 0 No Yes
80
60
40
20
0
%
Child gets support to eat
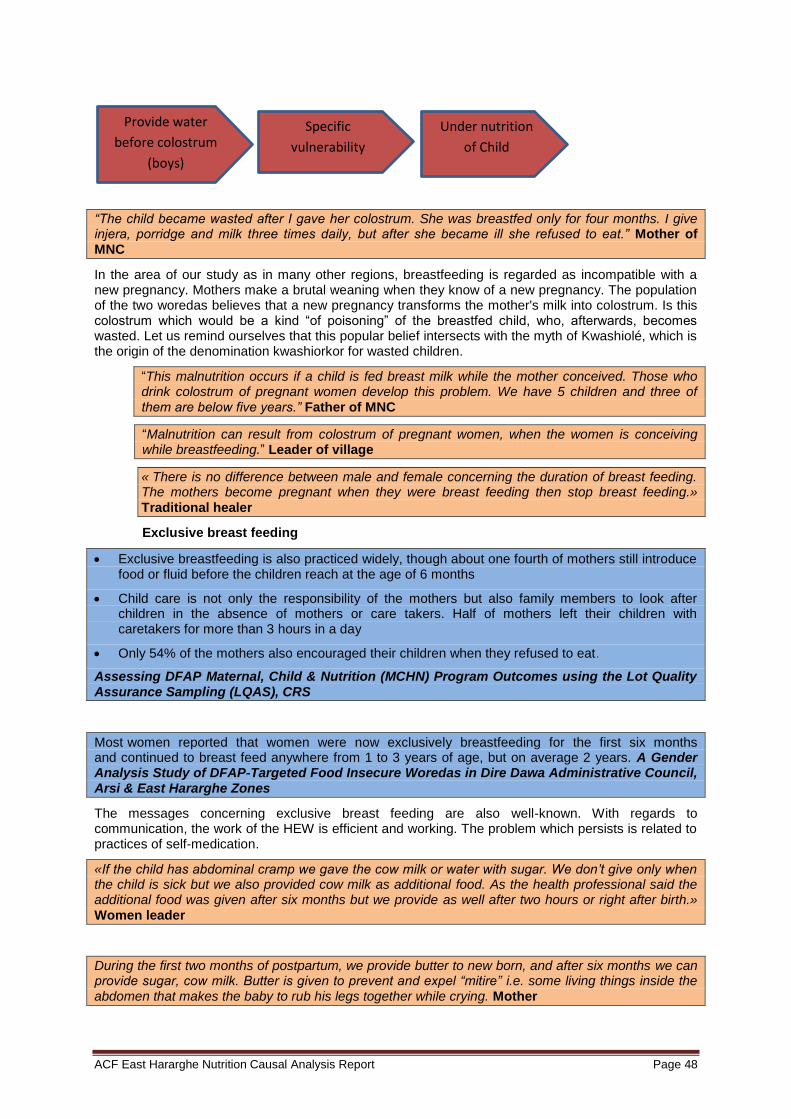
ACF East Hararghe Nutrition Causal Analysis Report Page 48
“The child became wasted after I gave her colostrum. She was breastfed only for four months. I give injera, porridge and milk three times daily, but after she became ill she refused to eat.” Mother of MNC
In the area of our study as in many other regions, breastfeeding is regarded as incompatible with a new pregnancy. Mothers make a brutal weaning when they know of a new pregnancy. The population of the two woredas believes that a new pregnancy transforms the mother's milk into colostrum. Is this colostrum which would be a kind “of poisoning” of the breastfed child, who, afterwards, becomes wasted. Let us remind ourselves that this popular belief intersects with the myth of Kwashiolé, which is the origin of the denomination kwashiorkor for wasted children.
“This malnutrition occurs if a child is fed breast milk while the mother conceived. Those who drink colostrum of pregnant women develop this problem. We have 5 children and three of them are below five years.” Father of MNC
“Malnutrition can result from colostrum of pregnant women, when the women is conceiving while breastfeeding.” Leader of village
« There is no difference between male and female concerning the duration of breast feeding. The mothers become pregnant when they were breast feeding then stop breast feeding.» Traditional healer
Exclusive breast feeding
Exclusive breastfeeding is also practiced widely, though about one fourth of mothers still introduce food or fluid before the children reach at the age of 6 months
Child care is not only the responsibility of the mothers but also family members to look after children in the absence of mothers or care takers. Half of mothers left their children with caretakers for more than 3 hours in a day
Only 54% of the mothers also encouraged their children when they refused to eat.
Assessing DFAP Maternal, Child & Nutrition (MCHN) Program Outcomes using the Lot Quality Assurance Sampling (LQAS), CRS
Most women reported that women were now exclusively breastfeeding for the first six months and continued to breast feed anywhere from 1 to 3 years of age, but on average 2 years. A Gender Analysis Study of DFAP-Targeted Food Insecure Woredas in Dire Dawa Administrative Council, Arsi & East Hararghe Zones
The messages concerning exclusive breast feeding are also well-known. With regards to communication, the work of the HEW is efficient and working. The problem which persists is related to practices of self-medication.
«If the child has abdominal cramp we gave the cow milk or water with sugar. We don’t give only when the child is sick but we also provided cow milk as additional food. As the health professional said the additional food was given after six months but we provide as well after two hours or right after birth.» Women leader
During the first two months of postpartum, we provide butter to new born, and after six months we can provide sugar, cow milk. Butter is given to prevent and expel “mitire” i.e. some living things inside the abdomen that makes the baby to rub his legs together while crying. Mother
Provide water
before colostrum
(boys)
Specific
vulnerability
Under nutrition
of Child

ACF East Hararghe Nutrition Causal Analysis Report Page 49
In this direction, for many of the mothers, to give water with sugar to a child of less than six months is not contradictory with exclusive breast feeding: it is about a practice of self-medication to relieve the colic of the children. We could see that the majority of mothers think they do exclusive breastfeeding. Giving water or cow milk is seen as a therapeutic practice.
The mothers think that certain situations make them produce bad milk. It is difficult nowadays to find an alternative for the lactating mothers today. In the past time it seemed frequent to have their child breastfed by another woman - most common was the mother’s sister. According to testimonies, this practice almost disappeared, mainly because of the messages of prevention of the transmission of HIV. The consequence is that if the mother cannot breastfeed or think that she cannot, the only solution is a brutal weaning.
“If we go out of home by leaving our child behind, we will not give breast milk immediately when we return , rather we express and discard the milk that distended the breast, and then start to provide the fresh one.” Mothers TSFP
«The mother’s sister can give breast milk to her sister’s child but it should not be given to brother’s child.» Mother
”Concerning breastfeeding, previously the neighbor, the sister, etc. gave breastmilk for the child if the mother is away from home. Recently, this is not happening in the community because of awareness related with HIV/AIDS.” Govt employee
«If the mothers have problem of malnutrition they were breastfeeding the child. I didn’t hear about HIV/AIDS here. Once upon a time I found some mother who have HIV/AIDS and the mother was not giving breast for the child. The mother was isolated from the other mothers.» Traditional healer
“If the mothers have problem with their breast, they didn’t breastfeed the child. If the child is young I was giving only cow milk and if it is a baby I gave for the neighbor/relatives who have their breast milk. I haven’t ever heard about the disease transmitted through breast feeding.” Fathers
8.10.2 Feeding Habits in Family
It is very common in the families that meals are organized according to the intra-household hierarchy. More often young children and women eat last what is left by the other family members. This practice can be a very harmful factor during periods of lack of food. It also contributes to explain why oldest children are generally exposed less to malnutrition than juniors.
We expected that the main cause of malnutrition would be Ethiopian family dining traditions.
That involves the father’s right to choose and eat food first, which determines what portion remains to children. The food then passes from the oldest to the youngest. The hierarchical approach to eat had been explained to be an important cause of malnutrition in our study sample of children. The Impact Of Poverty On Child Malnutrition And Its Manifestations In Ethiopia, 2013
“The father was served first. This is not good culture because if father finished the food the child was exposed to malnutrition and the children should be served first. Sometimes the children were fed with the husband. This is also not good.” Fathers
Provide water / cow’s milk (self-
medication) / butter
No exclusive
breastfeeding
Undernutrition of
child
ACF East Hararghe Nutrition Causal Analysis Report Page 50
“First husband is served in the household followed by older children and then smaller children and mothers eat together.” Mother of MNC
8.11 Lack of Awareness on Malnutrition
8.11.1 Representations in Community
Lack of awareness on malnutrition = hypothesis 4
Many local terms were used to name malnutrition. Among these terms, some indicate more on unit of signs than the disease itself: “Fedhido”, for example means “the child who does not grow normally”. The different words contribute to increase interpretations of the disease. That can infer different seeking behavior according to interpretation.
Group of words used for malnutrition during the interviews:
Hamile dhabu / Hanqina nyaataa / Fedhido / Layida / Kulukulus/ Mitire
There is no problem here regarding nutrition because there is lot of vegetables and milk. The major problems exist in the community were they lack awareness (improper care and how to cook variety of food for the children). Chief of village
Male and female FGD were well aware of the symptoms of malnutrition for adults and for children. They identified women and girls as central agents to deal with hunger and child malnutrition in the household.
A Gender Analysis Study of DFAP-Targeted Food Insecure Woredas in Dire Dawa Administrative Council, Arsi & East Hararghe Zones
“The majority of the children become wasted due to malnutrition. Health extension workers send them to the health facility and give them plumpy-nut and supplementary food. The problem is they only take the children who are extremely thin or edematous.” TBA
Concerning the signs of malnutrition, everybody recognize the disease with the symptoms of severe cases. All people, even the health extensions workers, describe edema as the first sign. Families, like the professionals, are likely to neglect the care of the child at early stages of the disease.
“When child body have edemas (excessive accumulation of fluid in the body) and diarrhea we can recognize as malnutrition.” Man
“We call it “hanqina nyaataa” which means lack of adequate food. The child become edematous and lack of interest to eat food including eggs and milk”. Mother of MN child
We have noticed that there is a feeling of shame for the families with a malnourished child. According to the HEW and the health professionals, malnutrition does not cause shame in the families because the disease is suspected to be used as instrument to obtain assistance. For the families, on the contrary, malnutrition is regarded as a shame because the disease is either a sign of poverty, or a sign of negligence of the parents who prefer money rather than the health of their children.
“They don’t feel ashamed of having malnourished children, rather they are happy to get “fafa”. The family wants rather fafa than plumpy-nut because all family can eat fafa but plumpy-nut is not enough for the family and some individuals dislike it. To discourage this thing we are advising the family by saying that if healthy person eat plumpy-nut it can make them ill.” HEW
“Yes, it was shameful because the community considered you as the poor and the family also considered themselves as inferior.” Fathers
Among CMAM components, community outreach is the first that aims to mobilize the community about cases of malnutrition and prevention. Nevertheless, reports and studies indicated that outreach has not been considered as important as other components of CMAM and emphasis and attention was not
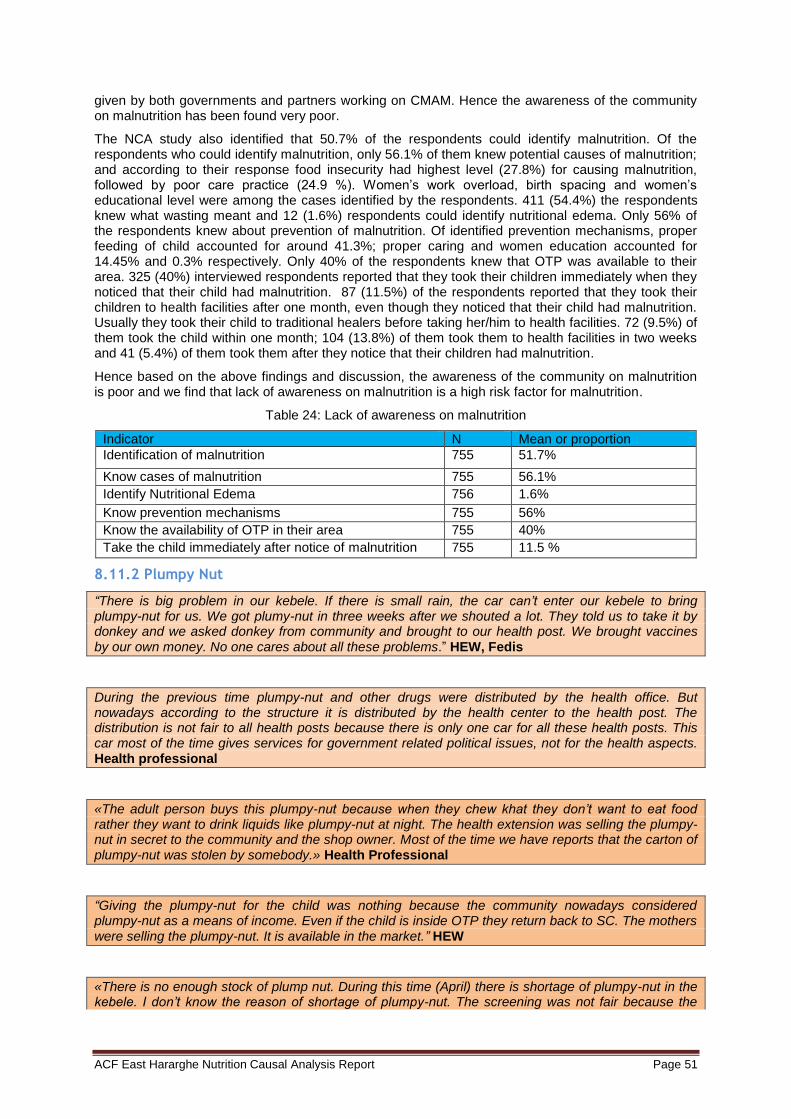
ACF East Hararghe Nutrition Causal Analysis Report Page 51
given by both governments and partners working on CMAM. Hence the awareness of the community on malnutrition has been found very poor.
The NCA study also identified that 50.7% of the respondents could identify malnutrition. Of the respondents who could identify malnutrition, only 56.1% of them knew potential causes of malnutrition; and according to their response food insecurity had highest level (27.8%) for causing malnutrition, followed by poor care practice (24.9 %). Women’s work overload, birth spacing and women’s educational level were among the cases identified by the respondents. 411 (54.4%) the respondents knew what wasting meant and 12 (1.6%) respondents could identify nutritional edema. Only 56% of the respondents knew about prevention of malnutrition. Of identified prevention mechanisms, proper feeding of child accounted for around 41.3%; proper caring and women education accounted for 14.45% and 0.3% respectively. Only 40% of the respondents knew that OTP was available to their area. 325 (40%) interviewed respondents reported that they took their children immediately when they noticed that their child had malnutrition. 87 (11.5%) of the respondents reported that they took their children to health facilities after one month, even though they noticed that their child had malnutrition. Usually they took their child to traditional healers before taking her/him to health facilities. 72 (9.5%) of them took the child within one month; 104 (13.8%) of them took them to health facilities in two weeks and 41 (5.4%) of them took them after they notice that their children had malnutrition.
Hence based on the above findings and discussion, the awareness of the community on malnutrition is poor and we find that lack of awareness on malnutrition is a high risk factor for malnutrition.
Table 24: Lack of awareness on malnutrition
Indicator N Mean or proportion
Identification of malnutrition 755 51.7%
Know cases of malnutrition 755 56.1%
Identify Nutritional Edema 756 1.6%
Know prevention mechanisms 755 56%
Know the availability of OTP in their area 755 40%
Take the child immediately after notice of malnutrition 755 11.5 %
8.11.2 Plumpy Nut
“There is big problem in our kebele. If there is small rain, the car can’t enter our kebele to bring plumpy-nut for us. We got plumy-nut in three weeks after we shouted a lot. They told us to take it by donkey and we asked donkey from community and brought to our health post. We brought vaccines by our own money. No one cares about all these problems.” HEW, Fedis
During the previous time plumpy-nut and other drugs were distributed by the health office. But nowadays according to the structure it is distributed by the health center to the health post. The distribution is not fair to all health posts because there is only one car for all these health posts. This car most of the time gives services for government related political issues, not for the health aspects. Health professional
«The adult person buys this plumpy-nut because when they chew khat they don’t want to eat food rather they want to drink liquids like plumpy-nut at night. The health extension was selling the plumpy- nut in secret to the community and the shop owner. Most of the time we have reports that the carton of plumpy-nut was stolen by somebody.» Health Professional
“Giving the plumpy-nut for the child was nothing because the community nowadays considered plumpy-nut as a means of income. Even if the child is inside OTP they return back to SC. The mothers were selling the plumpy-nut. It is available in the market.” HEW
«There is no enough stock of plump nut. During this time (April) there is shortage of plumpy-nut in the kebele. I don’t know the reason of shortage of plumpy-nut. The screening was not fair because the
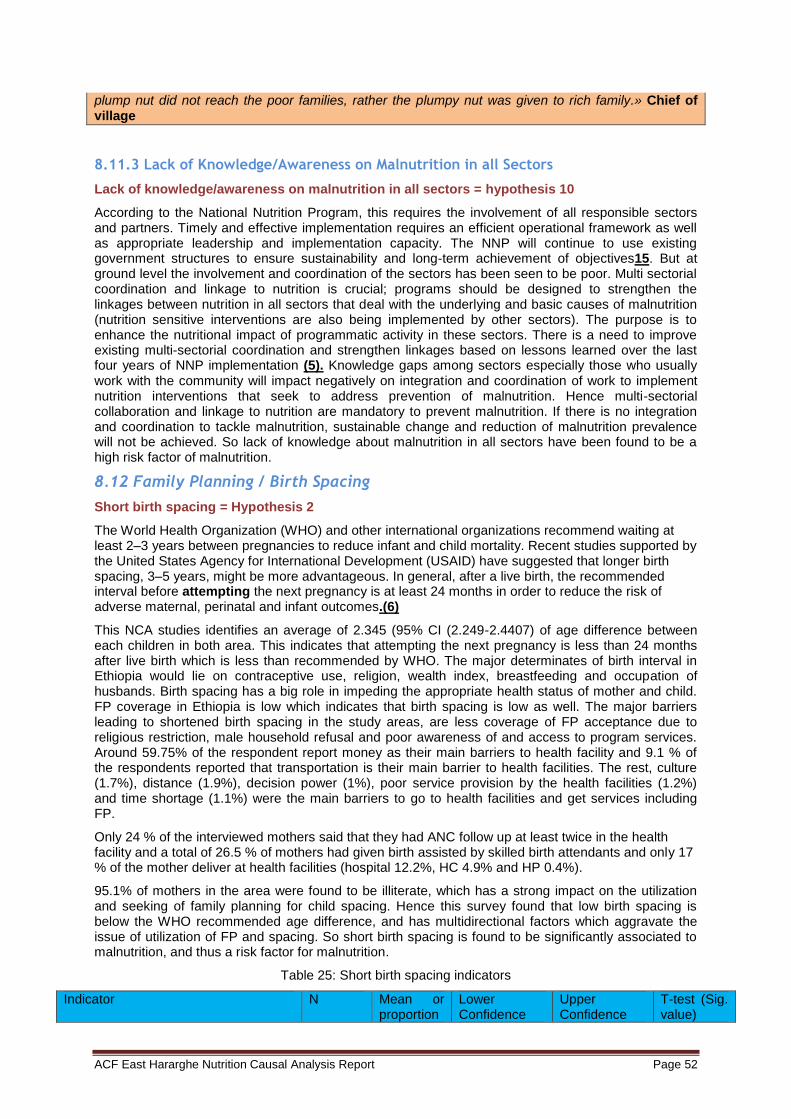
ACF East Hararghe Nutrition Causal Analysis Report Page 52
plump nut did not reach the poor families, rather the plumpy nut was given to rich family.» Chief of village
8.11.3 Lack of Knowledge/Awareness on Malnutrition in all Sectors
Lack of knowledge/awareness on malnutrition in all sectors = hypothesis 10
According to the National Nutrition Program, this requires the involvement of all responsible sectors and partners. Timely and effective implementation requires an efficient operational framework as well as appropriate leadership and implementation capacity. The NNP will continue to use existing government structures to ensure sustainability and long-term achievement of objectives15. But at ground level the involvement and coordination of the sectors has been seen to be poor. Multi sectorial coordination and linkage to nutrition is crucial; programs should be designed to strengthen the linkages between nutrition in all sectors that deal with the underlying and basic causes of malnutrition (nutrition sensitive interventions are also being implemented by other sectors). The purpose is to enhance the nutritional impact of programmatic activity in these sectors. There is a need to improve existing multi-sectorial coordination and strengthen linkages based on lessons learned over the last four years of NNP implementation (5). Knowledge gaps among sectors especially those who usually work with the community will impact negatively on integration and coordination of work to implement nutrition interventions that seek to address prevention of malnutrition. Hence multi-sectorial collaboration and linkage to nutrition are mandatory to prevent malnutrition. If there is no integration and coordination to tackle malnutrition, sustainable change and reduction of malnutrition prevalence will not be achieved. So lack of knowledge about malnutrition in all sectors have been found to be a high risk factor of malnutrition.
8.12 Family Planning / Birth Spacing
Short birth spacing = Hypothesis 2
The World Health Organization (WHO) and other international organizations recommend waiting at least 2–3 years between pregnancies to reduce infant and child mortality. Recent studies supported by the United States Agency for International Development (USAID) have suggested that longer birth spacing, 3–5 years, might be more advantageous. In general, after a live birth, the recommended interval before attempting the next pregnancy is at least 24 months in order to reduce the risk of adverse maternal, perinatal and infant outcomes.(6)
This NCA studies identifies an average of 2.345 (95% CI (2.249-2.4407) of age difference between each children in both area. This indicates that attempting the next pregnancy is less than 24 months after live birth which is less than recommended by WHO. The major determinates of birth interval in Ethiopia would lie on contraceptive use, religion, wealth index, breastfeeding and occupation of husbands. Birth spacing has a big role in impeding the appropriate health status of mother and child. FP coverage in Ethiopia is low which indicates that birth spacing is low as well. The major barriers leading to shortened birth spacing in the study areas, are less coverage of FP acceptance due to religious restriction, male household refusal and poor awareness of and access to program services. Around 59.75% of the respondent report money as their main barriers to health facility and 9.1 % of the respondents reported that transportation is their main barrier to health facilities. The rest, culture (1.7%), distance (1.9%), decision power (1%), poor service provision by the health facilities (1.2%) and time shortage (1.1%) were the main barriers to go to health facilities and get services including FP.
Only 24 % of the interviewed mothers said that they had ANC follow up at least twice in the health facility and a total of 26.5 % of mothers had given birth assisted by skilled birth attendants and only 17 % of the mother deliver at health facilities (hospital 12.2%, HC 4.9% and HP 0.4%).
95.1% of mothers in the area were found to be illiterate, which has a strong impact on the utilization and seeking of family planning for child spacing. Hence this survey found that low birth spacing is below the WHO recommended age difference, and has multidirectional factors which aggravate the issue of utilization of FP and spacing. So short birth spacing is found to be significantly associated to malnutrition, and thus a risk factor for malnutrition.
Table 25: Short birth spacing indicators
Indicator N Mean or proportion
Lower Confidence
Upper Confidence
T-test (Sig. value)
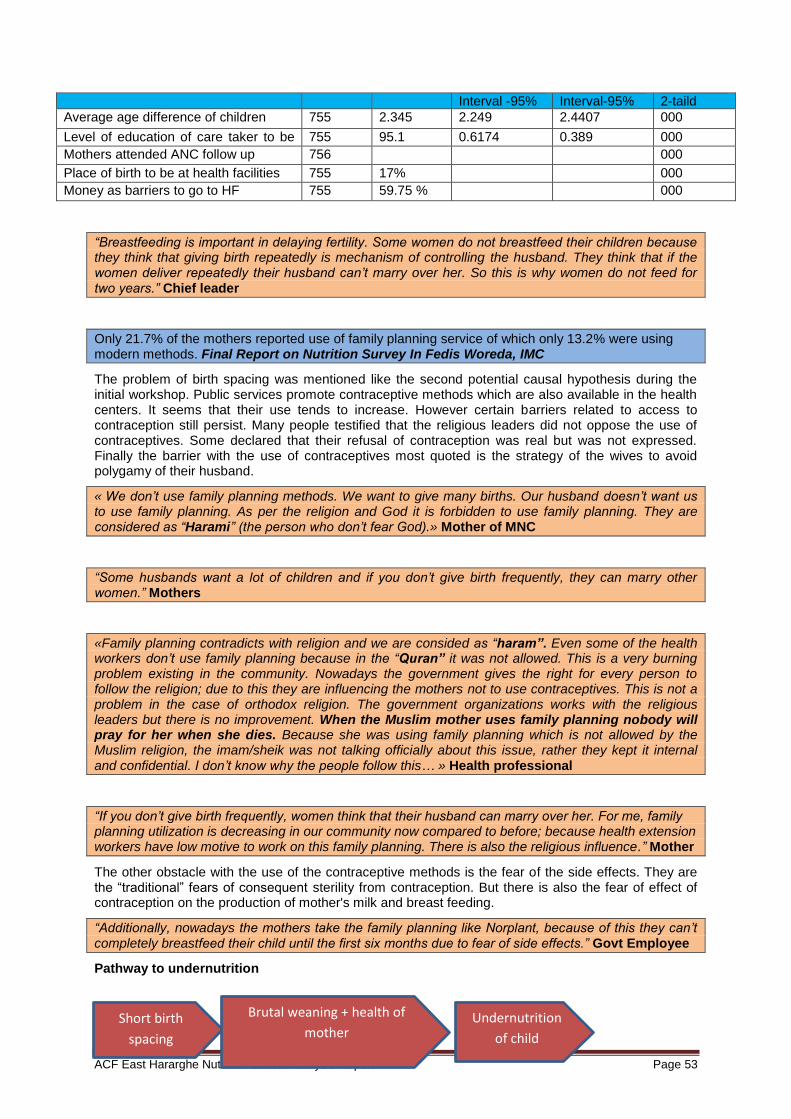
ACF East Hararghe Nutrition Causal Analysis Report Page 53
Interval -95% Interval-95% 2-taild
Average age difference of children 755 2.345 2.249 2.4407 000
Level of education of care taker to be none
755 95.1 0.6174 0.389 000
Mothers attended ANC follow up 756 000
Place of birth to be at health facilities 755 17% 000
Money as barriers to go to HF 755 59.75 % 000
“Breastfeeding is important in delaying fertility. Some women do not breastfeed their children because they think that giving birth repeatedly is mechanism of controlling the husband. They think that if the women deliver repeatedly their husband can’t marry over her. So this is why women do not feed for two years.” Chief leader
Only 21.7% of the mothers reported use of family planning service of which only 13.2% were using modern methods. Final Report on Nutrition Survey In Fedis Woreda, IMC
The problem of birth spacing was mentioned like the second potential causal hypothesis during the initial workshop. Public services promote contraceptive methods which are also available in the health centers. It seems that their use tends to increase. However certain barriers related to access to contraception still persist. Many people testified that the religious leaders did not oppose the use of contraceptives. Some declared that their refusal of contraception was real but was not expressed. Finally the barrier with the use of contraceptives most quoted is the strategy of the wives to avoid polygamy of their husband.
« We don’t use family planning methods. We want to give many births. Our husband doesn’t want us to use family planning. As per the religion and God it is forbidden to use family planning. They are considered as “Harami” (the person who don’t fear God).» Mother of MNC
“Some husbands want a lot of children and if you don’t give birth frequently, they can marry other women.” Mothers
«Family planning contradicts with religion and we are consided as “haram”. Even some of the health workers don’t use family planning because in the “Quran” it was not allowed. This is a very burning problem existing in the community. Nowadays the government gives the right for every person to follow the religion; due to this they are influencing the mothers not to use contraceptives. This is not a problem in the case of orthodox religion. The government organizations works with the religious leaders but there is no improvement. When the Muslim mother uses family planning nobody will pray for her when she dies. Because she was using family planning which is not allowed by the Muslim religion, the imam/sheik was not talking officially about this issue, rather they kept it internal and confidential. I don’t know why the people follow this… » Health professional
“If you don’t give birth frequently, women think that their husband can marry over her. For me, family planning utilization is decreasing in our community now compared to before; because health extension workers have low motive to work on this family planning. There is also the religious influence.” Mother
The other obstacle with the use of the contraceptive methods is the fear of the side effects. They are the “traditional” fears of consequent sterility from contraception. But there is also the fear of effect of contraception on the production of mother's milk and breast feeding.
“Additionally, nowadays the mothers take the family planning like Norplant, because of this they can’t completely breastfeed their child until the first six months due to fear of side effects.” Govt Employee
Pathway to undernutrition
Short birth
spacing
Brutal weaning + health of
mother
Undernutrition
of child
ACF East Hararghe Nutrition Causal Analysis Report Page 54
8.13 Socio-Cultural
8.13.1 Gender
“Decision making is home based. In some families, the wife can be a decision maker while in others husbands are decision makers. But usually it is husbands who can make decision on activities like taking the child to health facilities because usually it is husbands who have money.” FGD Mothers
We could notice that gender is transverse at several stages. The progress of the status of the woman, the workload over her, and her decisional capacity, all have consequences on the health of the children. The possibility of using contraceptive methods is also in the middle of this issue. It also appeared that the inequality of gender appears more at the young age. Boys draw a certain number of social and economic benefits, but paradoxically, they appear more exposed to malnutrition. Families tend to give more attention to boys - what is unfavorable for them taking into consideration the practice of traditional medicine. The desire to see the boys becoming stronger pushes the mothers to give them water to drink at birth, which is also a worsening factor.
What makes this Hararghe community different from other Ethiopian communities is that women have big roles in productivity i.e. income generation, in farming activities. Still we can’t say that women are independent because they can’t have total control over their income. Women may generate income but still males can have control over that income. Researcher, Haramaya University
“For Oromo religious leader gender has greater role. In addition women elite i.e. those who dominate male because of different reasons has influence. Whatever you want to do, if you go through male it is more successful than if you directly target women.” Researcher, Haramaya University
It is imperative that the assistance / development programs consider the relations of gender. But attention must be given to undesirable effects: increase in the workload of the beneficiary women in food security projects, possible social repercussions for the women who use contraception, etc.
8.13.2 Social Organization
“We don’t have pipe water; we fetch water from the river which is not clean and even far. Our village is neglected because we don’t have influential leaders.” Mothers
For the Oromo community living in the zone the nostalgia of a lost traditional system constitutes for some, an “existential” cause of the evils which strike the community. It is this feeling which is expressed in the following quotation and which is found in the identity and political claims of the Oromo community:
“When Gadaa was destroyed they left Gadaa. The bull refused to mount the cow and men no longer respected justice. There were no real leaders and few children were born. The cows gave birth to deformed calves. Pregnant women gave birth to their children at the wrong time. Lambs were born without forelegs and without tails ... When Gadaa did not exist everything else was also destroyed. The crops that were cultivated no longer grew. And the oxen refused to fatten. The men who had formerly respected truth and justice abandoned.”(Knutsson 1967 180)
Concerning our investigation, we cannot conclude that the social organization of Oromo in the zone contributes to the vulnerability of certain families: there are no castes, not trades prohibited for specific groups, nor restrictions of marriages excluded for religious reasons.
Social divisions are of economic nature. The standard of living determines access to resources and to the means of production. If poverty is, like everywhere, a determining factor of malnutrition for children, several witnesses specify that wealth, and the ways to reach it, can also be a worsening factor for the health of the children.
“When there is disagreement between the rich households malnutrition may occur. The other causes of malnutrition were the rich people they don’t care about their child and their attention is only searching the money or work. As a result of this the child is exposed to malnutrition. In general when
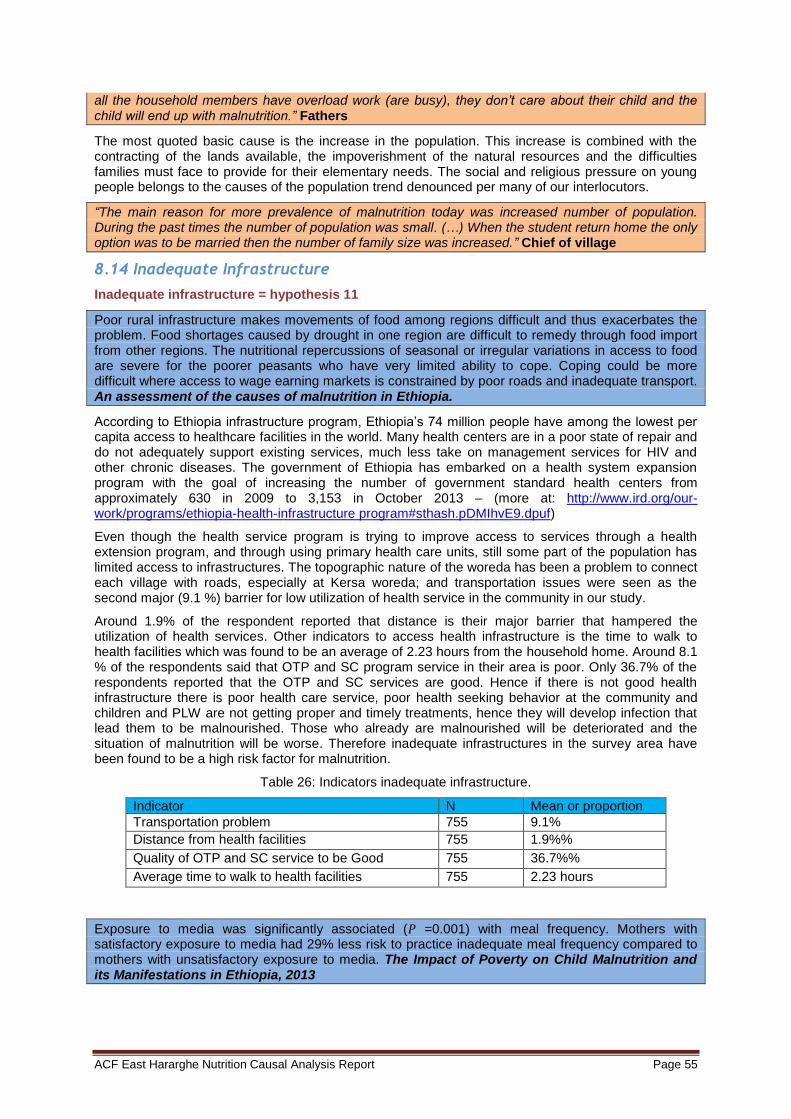
ACF East Hararghe Nutrition Causal Analysis Report Page 55
all the household members have overload work (are busy), they don’t care about their child and the child will end up with malnutrition.” Fathers
The most quoted basic cause is the increase in the population. This increase is combined with the contracting of the lands available, the impoverishment of the natural resources and the difficulties families must face to provide for their elementary needs. The social and religious pressure on young people belongs to the causes of the population trend denounced per many of our interlocutors.
“The main reason for more prevalence of malnutrition today was increased number of population. During the past times the number of population was small. (…) When the student return home the only option was to be married then the number of family size was increased.” Chief of village
8.14 Inadequate Infrastructure
Inadequate infrastructure = hypothesis 11
Poor rural infrastructure makes movements of food among regions difficult and thus exacerbates the problem. Food shortages caused by drought in one region are difficult to remedy through food import from other regions. The nutritional repercussions of seasonal or irregular variations in access to food are severe for the poorer peasants who have very limited ability to cope. Coping could be more difficult where access to wage earning markets is constrained by poor roads and inadequate transport. An assessment of the causes of malnutrition in Ethiopia.
According to Ethiopia infrastructure program, Ethiopia’s 74 million people have among the lowest per capita access to healthcare facilities in the world. Many health centers are in a poor state of repair and do not adequately support existing services, much less take on management services for HIV and other chronic diseases. The government of Ethiopia has embarked on a health system expansion program with the goal of increasing the number of government standard health centers from approximately 630 in 2009 to 3,153 in October 2013 – (more at: http://www.ird.org/our-work/programs/ethiopia-health-infrastructure program#sthash.pDMIhvE9.dpuf)
Even though the health service program is trying to improve access to services through a health extension program, and through using primary health care units, still some part of the population has limited access to infrastructures. The topographic nature of the woreda has been a problem to connect each village with roads, especially at Kersa woreda; and transportation issues were seen as the second major (9.1 %) barrier for low utilization of health service in the community in our study.
Around 1.9% of the respondent reported that distance is their major barrier that hampered the utilization of health services. Other indicators to access health infrastructure is the time to walk to health facilities which was found to be an average of 2.23 hours from the household home. Around 8.1 % of the respondents said that OTP and SC program service in their area is poor. Only 36.7% of the respondents reported that the OTP and SC services are good. Hence if there is not good health infrastructure there is poor health care service, poor health seeking behavior at the community and children and PLW are not getting proper and timely treatments, hence they will develop infection that lead them to be malnourished. Those who already are malnourished will be deteriorated and the situation of malnutrition will be worse. Therefore inadequate infrastructures in the survey area have been found to be a high risk factor for malnutrition.
Table 26: Indicators inadequate infrastructure.
Indicator N Mean or proportion
Transportation problem 755 9.1%
Distance from health facilities 755 1.9%%
Quality of OTP and SC service to be Good 755 36.7%%
Average time to walk to health facilities 755 2.23 hours
Exposure to media was significantly associated (𝑃 =0.001) with meal frequency. Mothers with satisfactory exposure to media had 29% less risk to practice inadequate meal frequency compared to mothers with unsatisfactory exposure to media. The Impact of Poverty on Child Malnutrition and its Manifestations in Ethiopia, 2013

ACF East Hararghe Nutrition Causal Analysis Report Page 56
This study also identified that care takers were found to have a high illiteracy rate, with 95.1% of the care takers who were never enrolled in school, and only 4.2% of the care takers were enrolled in primary school.
8.15 Families with/without malnourished children and differences among woredas
Based on the questionnaires (risk factors survey), we have highlighted specificity of families with malnourished children. These results show some trends in families profiles in some of the areas:
Risk factor survey: A / Care practices
• Care givers workload:
More than 94.4 % of child care takers were only mothers.
100% families with MNC were farmers or daily laborers (no pretty trade) in both woredas
44.7% of the care givers responded that they had work overload to care for their children: 46.17 % in Fedis (global) / 33.7% in Fedis (with wasted children)
The study also identified 2.27 hours / day was the average time spent with the child by the care takers.
• Feeding habits:
Breastfeeding: 97.4% children were breastfed in Fedis, 88.3% in Kersa.
60.3% of the children have been provided with colostrum: 65% in Fedis, 94% in Kersa (52% at national level)
56.6% of the respondents reported that priority during meal time was given to older children / Families with MNC in Fedis gave priority to adult male at 40% and in Kersa 26%
Risk factor Survey: B / Malnutrition and Health
Signs of malnutrition: 53% in Fedis declared they could not identify the malnutrition and 39% in Kersa
14% in Fedis, 4% in Kersa of respondents declared that Plumpy Nut was available in market or shop.
Nutritional status of mothers: 35% in Fedis, 46% in Kersa of mothers ate less during the last three months of their pregnancy
Low utilization of health services: In our study, only 40.3% of the respondents knew the availability of OTP and SC service in their area. Fedis: 54% knew availability of OTP, in Kersa, 38% Out of those 40.3% who knew OTP service; 43% of them reported that they took their child immediately after they notice the sign of malnutrition.
Main barriers to access to Health services: cost 98% in Fedis and 47% in Kersa
Traditional healer: At least (for medical plants) 55% of parents brought the child in a traditional healer in both woredas: 39% for burn skin in Fedis, 32% used medical plants for their children in Fedis, same results in Kersa.
Disease: 20% of children in the survey area (Fedis) were having more than 3 loose stools (diarrhea) in the last 24 hours of the survey date. And 10% in Kersa
Children with acute respiratory tract infection in the last 2 weeks in the area: Fedis 16%, and 8% in Kersa
Risk factor survey: C / Causal Hypothesis Food Security
The highest source of income found in this study was selling of khat in normal year of this time which accounted about 30.1% of household source of incomes (20% in Fedis, 43% in Kersa)
Cash crop production:
– Fedis: 45,5% Kersa: 95,2%
– In Kersa, more source of cash for families without MNC: oxen fattening, sale of paper, sale of fruit, onion, garlic, vegetables and borrowing
ACF East Hararghe Nutrition Causal Analysis Report Page 57
Coping mechanisms: For the difficult periods, the coping strategies for most of the people were borrowing, migration for labor and sale of productive animal in Fedis; and sale of productive animal in Kersa.
Source of staple food were equal in both Woreda (50% production/50% market.
Risk Factor Survey / D. Causal Hypothesis WASH, environment and climate change
• Access to water:
50% from pond for Fedis vs. 10%, for Kersa. 30% from rivers and unprotected springs. In Fedis among families with MNC 30% treated water (filter or chemical) in Kersa among MNC vs 56% families without MNC. 15% families with MNC vs 30% in Fedis treated water 28% in Fedis, 55% in Kersa used to treat water.
• Hygiene
Only 10.3 % of the respondents reported that they boiled water before drinking. 21% of the respondents report that they had toilet in both woredas. Of those who had toilet 20.5% of the community used toilet properly and constantly. A 24.9% of the respondents used disinfectants (soap or ashes) during hand washing.
Risk factor survey /E. Causal Hypothesis Others: Improper identification of target groups: 0.5% of persons recognized nutritional edema in Fedis and 4% in Kersa.

ACF East Hararghe Nutrition Causal Analysis Report Page 58
9. Conclusion
Situation
Highest priority causes
Strong impact causes
Moderate impact causes
Item
Quantitative Results Remarks
Prevalence / SMART survey
The point prevalence of global acute malnutrition (GAM) was estimated at 12.0% (95% C.I:8.9 - 16.1%) for all the study area (Fedis and Kersa woredas), with SAM 1.3% (95% C.I: 0.5 - 3.2%) ((using NCHS, 1977). 0.2 % of children were identified as having nutritional bi-lateral pitting edema.
The data revealed that boys were slightly more affected by malnutrition than girls, higher GAM rates in Kersa (boys 8.9%, girls 6.2%), and higher SAM rates among boys in Fedis (boys 2.2%, girls 1.2%).
Profile of malnourished children
Child boy, 6-17 month old, younger child (junior)
Mothers provided water to drink before 6 months more for boys than girls Families were looking for more medicine (traditional healer) for boys
Hyp 1 Care givers work load
More than 84.4 % (95%CI (0.0602-1342) N=637) of the child care takers were mothers only This study also identified 2.272 hours was the average time spent with child by the care takers.
Mothers left children in villages during their work time: most of them had to wait for the return of the mother to have a meal. Khat trade has contributed to an increase in women’s workload
Hyp 2. Short birth spacing
This NCA studies identified that an average of 2.345 (95 % CI (2.249-2.4407) of age difference between children in both areas. This indicated that attempting the next pregnancy was less than 24 months after live birth which was less than recommended by WHO.
Availability & accessibility of contraceptive methods has increased but some barriers were still there like marriage strategy, religious beliefs, fear of side effects. Short birth spacing leads brutal weaning
Hyp 3. Feeding habits -Anorexia of pregnant woman -60.3% of the children had been provided with colostrum. About 24.6% of the mothers reported giving something else to drink other than milk in the first three days of delivery. --- Exclusive breast feeding was reported only for about 56.7%. -The father’s pre-emptive right to choose and eat food first, which determined what portion remained to children. The food then passed from the oldest to the youngest.
To provide water or cow milk in the first days after birth or before 6 months was not considered like a food practice but like self-medication or traditional symbolism.
Hyp 4. Lack of awareness on malnutrition
50.7% (N=390) of the respondents could identify malnutrition. 11.5% of the respondents reported that they took their children’s to health facilities
Moderate malnutrition was less known and considered.
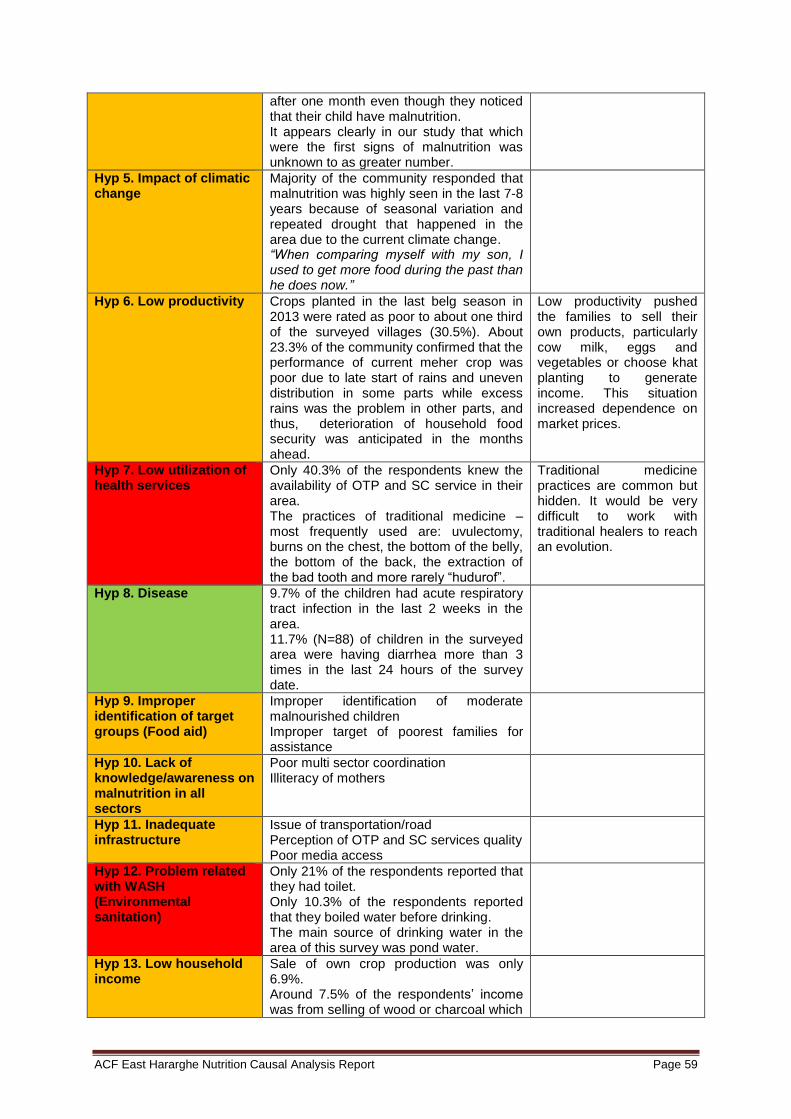
ACF East Hararghe Nutrition Causal Analysis Report Page 59
after one month even though they noticed that their child have malnutrition. It appears clearly in our study that which were the first signs of malnutrition was unknown to as greater number.
Hyp 5. Impact of climatic change
Majority of the community responded that malnutrition was highly seen in the last 7-8 years because of seasonal variation and repeated drought that happened in the area due to the current climate change. “When comparing myself with my son, I used to get more food during the past than he does now.”
Hyp 6. Low productivity Crops planted in the last belg season in 2013 were rated as poor to about one third of the surveyed villages (30.5%). About 23.3% of the community confirmed that the performance of current meher crop was poor due to late start of rains and uneven distribution in some parts while excess rains was the problem in other parts, and thus, deterioration of household food security was anticipated in the months ahead.
Low productivity pushed the families to sell their own products, particularly cow milk, eggs and vegetables or choose khat planting to generate income. This situation increased dependence on market prices.
Hyp 7. Low utilization of health services
Only 40.3% of the respondents knew the availability of OTP and SC service in their area. The practices of traditional medicine – most frequently used are: uvulectomy, burns on the chest, the bottom of the belly, the bottom of the back, the extraction of the bad tooth and more rarely “hudurof”.
Traditional medicine practices are common but hidden. It would be very difficult to work with traditional healers to reach an evolution.
Hyp 8. Disease
9.7% of the children had acute respiratory tract infection in the last 2 weeks in the area. 11.7% (N=88) of children in the surveyed area were having diarrhea more than 3 times in the last 24 hours of the survey date.
Hyp 9. Improper identification of target groups (Food aid)
Improper identification of moderate malnourished children Improper target of poorest families for assistance
Hyp 10. Lack of knowledge/awareness on malnutrition in all sectors
Poor multi sector coordination Illiteracy of mothers
Hyp 11. Inadequate infrastructure
Issue of transportation/road Perception of OTP and SC services quality Poor media access
Hyp 12. Problem related with WASH (Environmental sanitation)
Only 21% of the respondents reported that they had toilet. Only 10.3% of the respondents reported that they boiled water before drinking. The main source of drinking water in the area of this survey was pond water.
Hyp 13. Low household income
Sale of own crop production was only 6.9%. Around 7.5% of the respondents’ income was from selling of wood or charcoal which
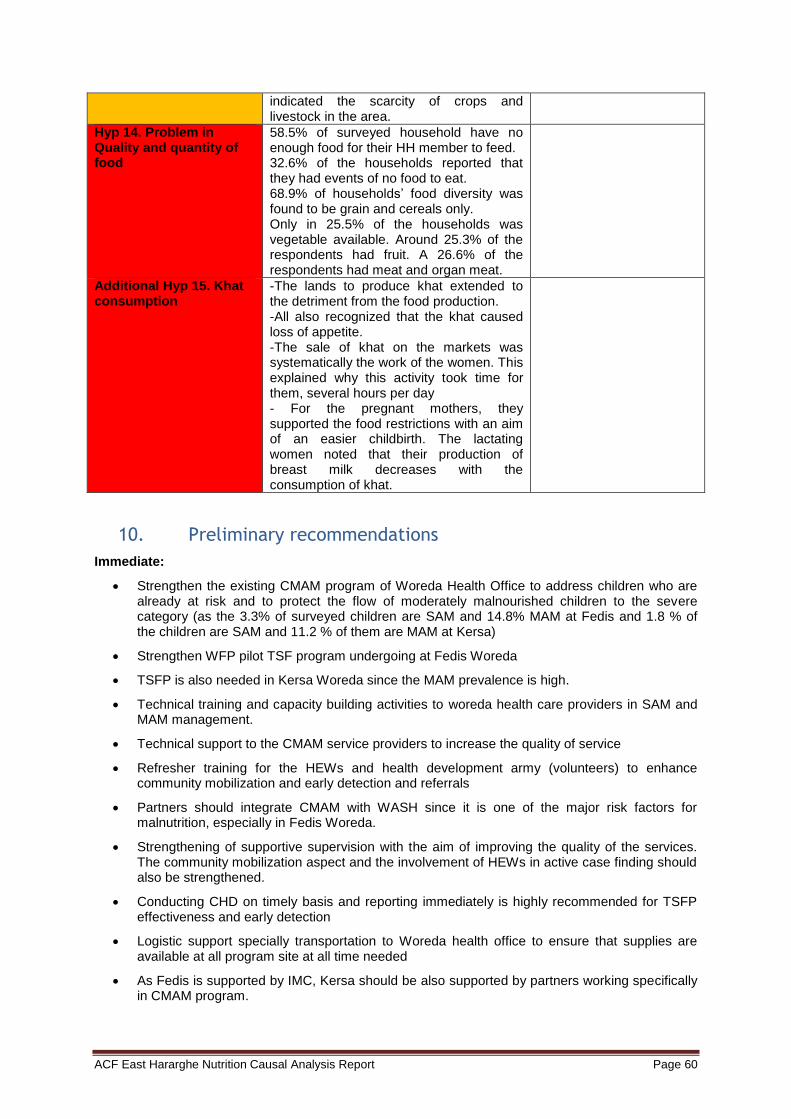
ACF East Hararghe Nutrition Causal Analysis Report Page 60
indicated the scarcity of crops and livestock in the area.
Hyp 14. Problem in Quality and quantity of food
58.5% of surveyed household have no enough food for their HH member to feed. 32.6% of the households reported that they had events of no food to eat. 68.9% of households’ food diversity was found to be grain and cereals only. Only in 25.5% of the households was vegetable available. Around 25.3% of the respondents had fruit. A 26.6% of the respondents had meat and organ meat.
Additional Hyp 15. Khat consumption
-The lands to produce khat extended to the detriment from the food production. -All also recognized that the khat caused loss of appetite. -The sale of khat on the markets was systematically the work of the women. This explained why this activity took time for them, several hours per day - For the pregnant mothers, they supported the food restrictions with an aim of an easier childbirth. The lactating women noted that their production of breast milk decreases with the consumption of khat.
10. Preliminary recommendations
Immediate:
Strengthen the existing CMAM program of Woreda Health Office to address children who are already at risk and to protect the flow of moderately malnourished children to the severe category (as the 3.3% of surveyed children are SAM and 14.8% MAM at Fedis and 1.8 % of the children are SAM and 11.2 % of them are MAM at Kersa)
Strengthen WFP pilot TSF program undergoing at Fedis Woreda
TSFP is also needed in Kersa Woreda since the MAM prevalence is high.
Technical training and capacity building activities to woreda health care providers in SAM and MAM management.
Technical support to the CMAM service providers to increase the quality of service
Refresher training for the HEWs and health development army (volunteers) to enhance community mobilization and early detection and referrals
Partners should integrate CMAM with WASH since it is one of the major risk factors for malnutrition, especially in Fedis Woreda.
Strengthening of supportive supervision with the aim of improving the quality of the services. The community mobilization aspect and the involvement of HEWs in active case finding should also be strengthened.
Conducting CHD on timely basis and reporting immediately is highly recommended for TSFP effectiveness and early detection
Logistic support specially transportation to Woreda health office to ensure that supplies are available at all program site at all time needed
As Fedis is supported by IMC, Kersa should be also supported by partners working specifically in CMAM program.
ACF East Hararghe Nutrition Causal Analysis Report Page 61
Health education is recommended to alleviate the sanitation problem of both Woreda.
Continued and more intensive health and nutrition education focusing on:
o importance of proper sanitation and hygiene especially using latrines
o appropriate IYCF feeding practices with special focus on the value and duration of exclusive breastfeeding and the importance of timely introduction of complementary feeding,
o dietary diversity and appropriate frequency of feeding
Significant proportion of the community was obtaining drinking water from unprotected sources (ponds) and is exposed to water borne diseases. Therefore, there is a need to advocate for implementing water, sanitation and hygiene promotion activities through the construction of more potable water sources and temporal distribution of disinfectants. Rehabilitating the existing non-functional hand pump wells is also recommended. To organize the promotion of the techniques of purification of the drinking water.
Closely monitor the overall situation, and especially the nutritional status of the children (with data on difference between girls and boys) and pregnant women, of the Woreda as the area is characterized as chronically food insecure
Medium/Long-term
Government and relevant NGOs should look at implementing resilience activities and integrated development programs that could sustainably tackle the underlying causes of malnutrition, and in line with the recommendations and final results of the Nutrition Causal Analysis.
The population in the surveyed Woreda is highly vulnerable to food insecurity as annual production is not sufficient to cover food needs of households. Therefore, it is very important to support agricultural production and create income opportunity for households to generate their own cash income through establishing local applicable income projects, promoting off-farm opportunities and saving and credit scheme.
Women education and empowerments.
To explore collective solutions to take care children during absence of mothers.
Improve health service infrastructure service and demand creation activities.
Improve media access and diffusion of messages in Health centers (videos) / Create attractive and innovative communication tools
Integration of promotion messages about:
a. Food distribution inside the family
b. Real exclusive breastfeeding
c. Food restrictions for pregnant women
d. Consequences of consumption of Khat
e. Criteria for assistance / admissions in nutrition program
Integration with faith based organization on demand creation and mobilization to increase the low FP uptake and to decrease religious influence.
Building portable water schemes and maintenance of existing water sources.
Disseminate and awareness to all sector office based on Ethiopia NNP strategy.
Advocacy to have Policy that decide which proportion of farming land is covered by khat and crops since majority of the farm lands of the area are covered with khat farming.
Integration of CLTS program with HEW’s program activities
Integration of traditional medicine in health public policy based on scientific research / abandonment of harmful practices
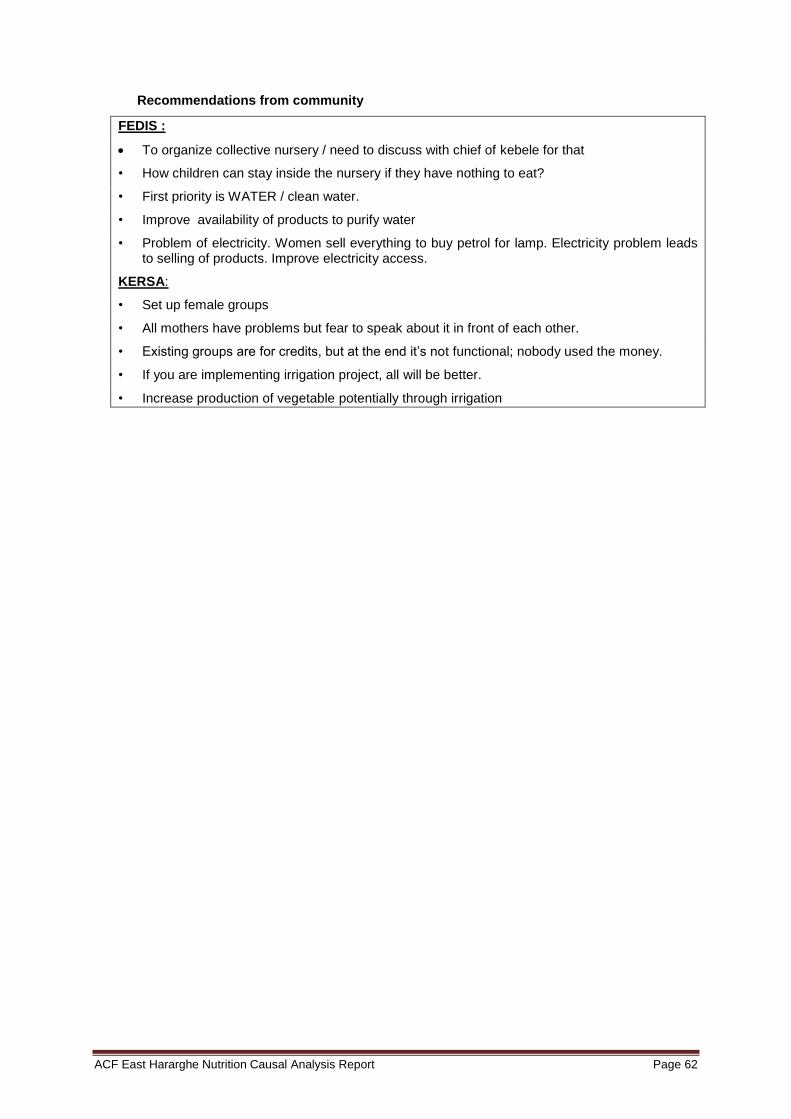
ACF East Hararghe Nutrition Causal Analysis Report Page 62
Recommendations from community
FEDIS :
To organize collective nursery / need to discuss with chief of kebele for that
• How children can stay inside the nursery if they have nothing to eat?
• First priority is WATER / clean water.
• Improve availability of products to purify water
• Problem of electricity. Women sell everything to buy petrol for lamp. Electricity problem leads to selling of products. Improve electricity access.
KERSA:
• Set up female groups
• All mothers have problems but fear to speak about it in front of each other.
• Existing groups are for credits, but at the end it’s not functional; nobody used the money.
• If you are implementing irrigation project, all will be better.
• Increase production of vegetable potentially through irrigation
ACF East Hararghe Nutrition Causal Analysis Report Page 63
11. Bibliography
ABBAS HAJI GNAMO : ISLAM, THE ORTHODOX CHURCH AND OROMO NATIONALISM (ETHIOPIA), IN :
CAHIERS D'ETUDES AFRICAINES [EN LIGNE], 165 | 2002, MIS EN LIGNE LE 25 MAI 2005, CONSULTE LE 14 OCTOBRE 2012. URL: HTTP:// ETUDESAFRICAINES.REVUES.ORG/137
ABBAS HAJI : POUVOIR DE BENIR ET DE MAUDIRE : COSMOLOGIE ET ORGANISATION SOCIALE DES OROMO-ARSI. IN: CAHIERS D'ETUDES AFRICAINES. VOL. 37 N°146. 1997. LA CORNE DANS TOUS SES
ÉTATS. PP. 289-318.
ACF: CHAD: QUALITATIVE ANALYSIS OF THE CAUSES OF MALNUTRITION IN ACF EXPERIENCES FROM THE FIELD
ALEMU ADEBA, DR. SILESHI GAROMA, HABTAMU FEKADU, and WONDU GAROMA: PREVALENCE OF WASTING AND ITS ASSOCIATED FACTORS OF CHILDREN AMONG 6-59 MONTHS AGE IN GUTO GIDA DISTRICT, OROMIYA REGIONAL STATE, ETHIOPIA. IN: FOOD SCIENCE AND QUALITY MANAGEMENT WWW.IISTE.ORG ISSN 2224-6088 (PAPER) ISSN 2225-0557 (ONLINE) VOL.24, 2014
BENSON TODD: AN ASSESSMENT OF THE CAUSES OF MALNUTRITION IN ETHIOPIA A CONTRIBUTION TO THE FORMULATION OF A NATIONAL NUTRITION STRATEGY FOR ETHIOPIA, INTERNATIONAL FOOD
POLICY RESEARCH INSTITUTE WASHINGTON, DC, USA NOVEMBER 2005
CRS Ethiopia : A Gender Analysis Study of DFAP-Targeted Food Insecure Woredas in Dire Dawa Administrative Council, Arsi & East Hararghe Zones, Oromiya Region, Ethiopia, October 2012
ETHIOPIAN NATIONAL NUTRITION PROGRAM, 2013
FICQUET ELOI : DYNAMIQUES GENERATIONNELLES ET EXPANSION DES OROMO EN ÉTHIOPIE AU XVIE SIECLE, IN L’HOMME 167-168 / 2003, PP. 235 A 252
HRF: GUIDANCE NOTE FOR CLUSTERS, TO IMPLEMENT THE IASC GENDER MARKER CREATING GENDER‐RESPONSIVE PROJECTS AND TRACKING GENDER‐RELATED ALLOCATIONS, IN:
HUMANITARIAN APPEALS AND FUNDING MECHANISMS
ICF: ETHIOPIA DEMOGRAPHIC AND HEALTH SURVEY 2011 CENTRAL STATISTICAL AGENCY ADDIS ABABA, ETHIOPIA ICF INTERNATIONAL CALVERTON, MARYLAND, USA MARCH 2012
IMC: A GENDER ANALYSIS STUDY OF DFAP-TARGETED FOOD INSECURE WOREDAS IN DIREDAWA ADMINISTRATIVE COUNCIL, ARSI & EAST HARARGHE ZONES, OROMIYA REGION, ETHIOPIA: KEY
ISSUES & RECOMMENDATIONS FOR DEVELOPING A GENDER TRANSFORMATIVE PROGRAM FOR ENHANCING FOOD SECURITY CRS ETHIOPIA OCTOBER 22, 2012
IMC: FINAL REPORT ON NUTRITION SURVEY IN FEDIS WOREDA OF EAST HARARGHE ZONE, OROMIYA REGIONAL STATE, ETHIOPIA,IMC, NOVEMBER 2013
LEFEVRE.P, DE SUREMAIN.C.E: LES CONTRIBUTIONS DE LA SOCIO-ANTHROPOLOGIE A LA NUTRITION PUBLIQUE· POURQUOI, COMMENT ET A QUELLES CONDITIONS? In Cahiers Santé 2002; 12: 77-85
LESSONS LEARNT IN THE 2013 HUMANITARIAN RESPONSES IN EAST HARARGHE, SUMMARY FROM EAST HARARGHE PARTNERS WORKSHOP OCTOBER 31
ST 2013
LQAS MCHN Monitoring Survey Report, DFAP Woreda Oromiya Regional State, ASSESSING DFAP MATERNAL, CHILD & NUTRTION (MCHN) PROGRAM OUTCOMES USING THE LOT QUALITY ASSURANCE SAMPLING (LQAS) METHODOLOGY, CRS / USAID, July 2013
MAGEN.C: Analyse qualitative des Causes de la Malnutrition Grand Kanem, Tchad, ACF 2012
MAIRE B. DELPEUCH.F : INDICATEURS DE NUTRITION POUR LE DEVELOPPEMENT SERVICE DE LA PLANIFICATION, DE L'ANALYSE ET DE L'EVALUATION NUTRITIONNELLES DIVISION DE L'ALIMENTATION ET DE LA NUTRITION ORGANISATION DES NATIONS UNIES POUR L'ALIMENTATION ET L'AGRICULTURE, IRD INSTITUT DE RECHERCHE POUR LE DEVELOPPEMENT MONTPELLIER,
FRANCE. ROME 2004
MELKAM AEMRO, MOLLA MESELE, ZELALEM BIRHANU AND AZEB ATENAFU: DIETARY DIVERSITY AND MEAL FREQUENCY PRACTICES AMONG INFANT AND YOUNG CHILDREN AGED 6–23 MONTHS IN ETHIOPIA: A SECONDARY ANALYSIS OF ETHIOPIAN DEMOGRAPHIC AND HEALTH SURVEY 2011
MOA: DISASTER RISK MANAGEMENT AND FOOD SECURITY SECTOR (DRMFSS), FOOD SUPPLY PROSPECTS; FOR THE SECOND HALF OF YEAR 2013, MINISTRY OF AGRICULTURE (MOA)SEPTEMBER, 2013, ADDIS ABABA, ETHIOPIA
MOARD: OROMIYA REGION LIVELIHOOD PROFILES, LIVELIHOOD INTEGRATION UNIT GOVERNMENT
OF ETHIOPIA: DISASTER MANAGEMENT & FOOD SECURITY SECTOR MOARD , USAID, JULY 2010
ACF East Hararghe Nutrition Causal Analysis Report Page 64
MYDLIKOVA EVA: DOC. PHDR., PHD, THE IMPACT OF POVERTY ON CHILD MALNUTRITION AND ITS MANIFESTATIONS IN ETHIOPIA, 1ST ANNUAL INTERNATIONAL INTERDISCIPLINARY CONFERENCE, AIIC 2013, 24-26 APRIL, AZORES, PORTUGAL
NIEMISTÖ NELLI: THE RESILIENCE OF RURAL ETHIOPIAN LIVELIHOODS A CASE STUDY FROM HARARGHE ZONE, EASTERN ETHIOPIA, UNIVERSITY OF JYVÄSKYLÄ, MASTER‘S PROGRAMME IN DEVELOPMENT AND INTERNATIONAL COOPERATION SOCIAL AND PUBLIC POLICY A PRO GRADU THESIS, SPRING 2011
OSMOND THOMAS : POSSESSION ET STRATEGIES DE REPRESENTATION CHEZ LES OROMO DE L'OUEST CHOAN (ÉTHIOPIE) : LE CAS DU MO'AATA, IN: ANNALES D'ETHIOPIE, VOLUME 20, ANNEE 2004. PP. 221-237.
OSMOND THOMAS: ETHNICITY AND LANGUAGE IN ETHIOPIA: ANTHROPOLOGICAL PERSPECTIVES,
SOCIAL ANTHROPOLOGY DEPARTMENT RESEARCH FELLOW IN THE CENTER FOR STUDIES ON AFRICAN WORLDS (CEMAF, CNRS FRANCE), NUMÉRO 4 , SEPTEMBRE 2009
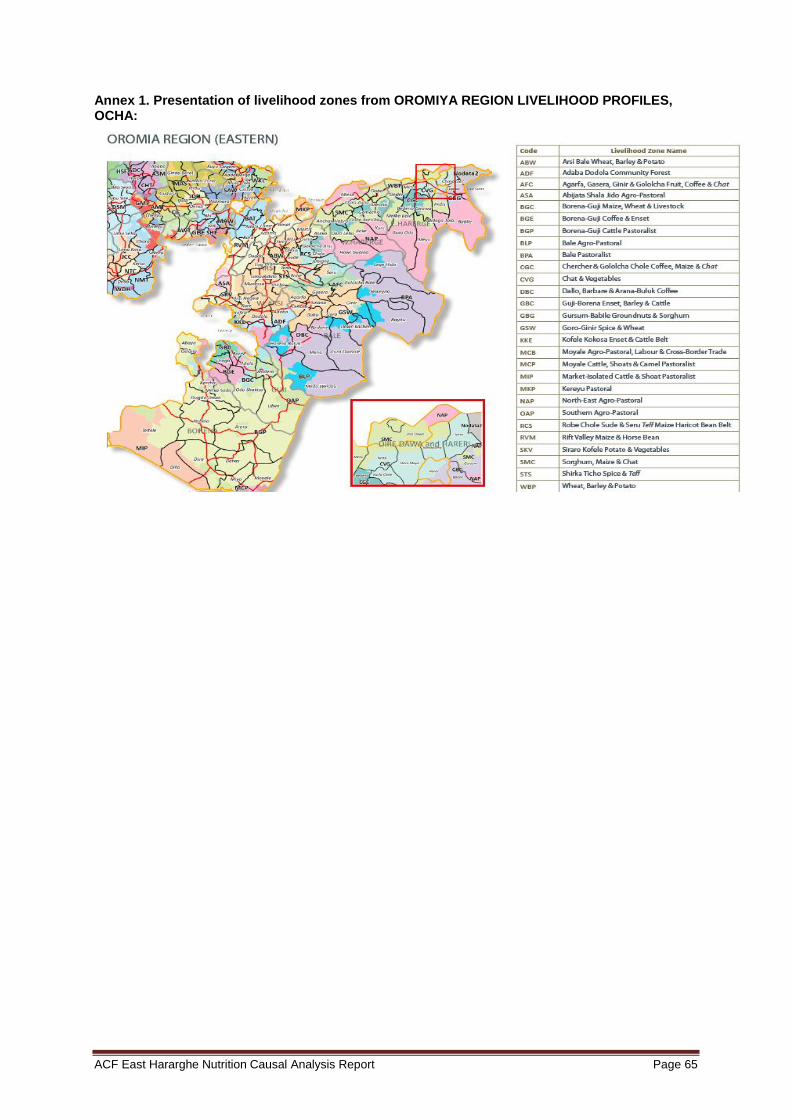
ACF East Hararghe Nutrition Causal Analysis Report Page 65
Annex 1. Presentation of livelihood zones from OROMIYA REGION LIVELIHOOD PROFILES, OCHA:
ACF East Hararghe Nutrition Causal Analysis Report Page 66
ANNEX 2. SUMMARY OF THE FINAL WORKSHOP RECOMMENDATIONS (ADDIS ABABA, 15-16
TH JULY, 2014)
A final workshop was held in Addis Ababa to present the results of the NCA study and government regional and zonal authorities attended together with national and international partners and donors.
Some of the main recommendations discussed by the group, in addition to the NCA findings were:
Ongoing programs on good nutrition education for pregnant mothers, strengthening the pregnant women nutritional status.
Current structured women group 1: 5 and every 30 households, to strengthen all activities at household level. It was suggested the recommendation to use extension program, HDA, which is a step down to the community.
Regarding birth spacing, DHS released contraceptive prevalence rate 32,8% for Hararghe zone, very high prevalence. Skilled delivery very low quality, East Hararghe is facing major challenge in providing quality of skilled delivery.
ANC near to 100% but not appropriate counselling, needs to be reinforced, as there are differences in between regions.
Chat chewing recommendation: crops need to be replaced by other type of crops which could increase food diversity.
There is a need to break the vicious cycle: from the malnutrition NNP cycle, young girls, adults, pregnant women, breaking the cycle to avoid malnourished children generation.
It was suggested a recommendation to include traditional medicine practices (TMP) in the health services and to inform about harmful practices in the population but as well to the traditional healers. HDAs need to be involved in informing the community about TMP and its consequences.
Outreach, one nurse from HC assigned to support HEW from now on, to link the recommendations to the government structure. Next year will be one MD at HC level. PHC Unit: health post plus health center.
Transportation system and logistic chain management supply needs to be reinforced.
Training of HEW, nurses in SAM management as not included in health curricula.
Challenge when the HEW is in outreach, how can we maintain the health services? In some areas the health center staff should fill the gap, but this is not always feasible. How can we use the HDA to decrease the delay of the health care delivery?
In EH people is visiting mostly private sectors, therefore need to link the nutrition program with private sectors.
Infrastructure and roads: government is funding directly, 75% of villages in Oromia are connected in the main road. Electricity at household level is high cost, as one of the findings of the study.
Low productivity in EH, long time history was good for rainfall, but now low cycle rain. Sorghum long cycle should be adapted to a short cycle crop. EH chat as the income of the nation, the local people are getting little birr, so saving and lifestyle promotion for EH should be recommended, addressed by appropriate institutions.
WASH latrine 21% as per the study, recommendation needs to be stronger. It was in CLTS but is recommended to increase the coverage.
Was recommended that Maternal, Adolescent and IYCF (MAIYCF) thinking on the lifecycle of malnutrition. Need to focus on adolescents. Still we have kebeles not linked with the main road.
Nutrition sensitive interventions promotion needs to be developed. Academia and research evidence needs to be linked with nutrition interventions.
Products to purify water and irrigation programs for crops need to be provided for the population, especially in Fedis.
ACF East Hararghe Nutrition Causal Analysis Report Page 67
ANNEX 3. RECOMMENDATIONS NCA_EH_ACF
Continued and more intensive health & nutrition education focusing on:
Appropriate IYCF practices, special focus on the value and duration of exclusive breastfeeding and the importance of timely/quality introduction of complementary feeding
Dietary diversity and appropriate frequency of feeding
Support promotion of family planning
Promote access to education for all ages, with a focus on girls and women
To explore collective solutions to take care of the children during absence of mothers. Integration of promotion messages about:- Food distribution inside the family
Real exclusive breastfeeding
Food restrictions for pregnant women
Consequences of consumption of Chat
Criteria for assistance / admissions in nutrition program
Strengthening implementation and monitoring of the CMAM program in both Woredas
Reinforcing TSF program at Fedis and Kersa Woredas.
Integration of CMAM with WASH (and other sectors)
Conducting timely CHD screening and reporting to increase TSFP effectiveness
Promotion of ANC / PNC
Improve supply chain of nutrition items from Region to woreda
Improve information of availability of health services for early utilization
Integration of traditional medicine in health public intervention
Advocate for abandonment of harmful practices
Include malnutrition as a disease in the system and improve common understanding of malnutrition in the community
Disseminate aware all sector office on Ethiopia NNP strategy
Support resilience of communities to adapt to impact of climate change
Support agricultural production to improve productivity and crop diversity
Support nutrition sensitive interventions
Support IGA (Income generating activities) without increasing workload of women
Promote Saving and credit scheme for communities
Improve hygiene and sanitation (latrine construction, health education, availability of water treatment/hygiene products)
Construction of more potable water sources and rehabilitation of non-functional schemes
Integration of CLTS program with HEW’s program activities
Promote integrated multi-sectoral development programs
Improve media access and diffusion of messages in Health centers (videos) / Create attractive and innovative communication tools
Improve service infrastructure (road, electricity, health facilities)

The Link NCA methodology was developed by Action Against Hunger – France with technical support from our scientific committee including multi-sectorial experts and eminent scientists from Tufts University | Friedman School of Nutri-tion Science and Policy, the French Institute for Development Research (IRD), and World Food Program (WFP).
Its development was made possible by the funding provided by:
More information on www.linknca.org

Pour plus d’informations concernant la conception ou la mise en œuvre d’une Link NCA,
visitez notre site internet : www.linknca.org
Pour prendre contact avec un expert concernant toute question sur la Link NCA :
Author : Carine Magen, Link NCA Expert

The Link NCA methodology was developed by Action Against Hunger – France with technical support from our scientific committee including multi-sectorial experts and eminent scientists from Tufts University | Friedman School of Nutri-tion Science and Policy, the French Institute for Development Research (IRD), and World Food Program (WFP).
Its development was made possible by the funding provided by:
More information on www.linknca.org
Pour plus d’informations concernant la conception ou la mise en œuvre d’une Link NCA,
visitez notre site internet : www.linknca.org
Pour prendre contact avec un expert concernant toute question sur la Link NCA :
Author : Carine Magen, Link NCA Expert