Direct Effect of cashew Nut Scarification Associated with ...

Erythropoiesis Suppression Is Associated with AnthraxLethal Toxin-Mediated Pathogenic ProgressionHsin-Hou Chang1,2, Tsung-Pao Wang1, Po-Kong Chen2, Yo-Yin Lin2, Chih-Hsien Liao1, Ting-Kai Lin1, Ya-
Wen Chiang1, Wen-Bin Lin1, Chih-Yu Chiang1, Jyh-Hwa Kau3, Hsin-Hsien Huang4, Hui-Ling Hsu4, Chi-
Yuan Liao5, Der-Shan Sun1,2*
1 Department of Molecular Biology and Human Genetics, Tzu-Chi University, Hualien, Taiwan, 2 Institute of Medical Sciences, Tzu-Chi University, Hualien, Taiwan,
3 Department of Microbiology and Immunology, National Defense Medical Center, Taipei, Taiwan, 4 Institute of Preventive Medicine, National Defense Medical Center,
Taipei, Taiwan, 5 Department of Obstetrics and Gynecology, Mennonite Christian Hospital, Hualien, Taiwan
Abstract
Anthrax is a disease caused by the bacterium Bacillus anthracis, which results in high mortality in animals and humans.Although some of the mechanisms are already known such as asphyxia, extensive knowledge of molecular pathogenesis ofthis disease is deficient and remains to be further investigated. Lethal toxin (LT) is a major virulence factor of B. anthracis anda specific inhibitor/protease of mitogen-activated protein kinase kinases (MAPKKs). Anthrax LT causes lethality and inducescertain anthrax-like symptoms, such as anemia and hypoxia, in experimental mice. Mitogen-activated protein kinases(MAPKs) are the downstream pathways of MAPKKs, and are important for erythropoiesis. This prompted us to hypothesizethat anemia and hypoxia may in part be exacerbated by erythropoietic dysfunction. As revealed by colony-forming cellassays in this study, LT challenges significantly reduced mouse erythroid progenitor cells. In addition, in a proteolyticactivity-dependent manner, LT suppressed cell survival and differentiation of cord blood CD34+-derived erythroblasts invitro. Suppression of cell numbers and the percentage of erythroblasts in the bone marrow were detected in LT-challengedC57BL/6J mice. In contrast, erythropoiesis was provoked through treatments of erythropoietin, significantly amelioratingthe anemia and reducing the mortality of LT-treated mice. These data suggested that suppressed erythropoiesis is part ofthe pathophysiology of LT-mediated intoxication. Because specific treatments to overcome LT-mediated pathogenesis arestill lacking, these efforts may help the development of effective treatments against anthrax.
Citation: Chang H-H, Wang T-P, Chen P-K, Lin Y-Y, Liao C-H, et al. (2013) Erythropoiesis Suppression Is Associated with Anthrax Lethal Toxin-Mediated PathogenicProgression. PLoS ONE 8(8): e71718. doi:10.1371/journal.pone.0071718
Editor: Nupur Gangopadhyay, University of Pittsburgh, United States of America
Received March 14, 2013; Accepted July 1, 2013; Published August 19, 2013
Copyright: � 2013 Chang et al. This is an open-access article distributed under the terms of the Creative Commons Attribution License, which permitsunrestricted use, distribution, and reproduction in any medium, provided the original author and source are credited.
Funding: This work was supported by grants from Tzu-Chi University http://www.tcu.edu.tw/(TCMRC9220) and the National Science Council http://web1.nsc.gov.tw/mp.aspx(NSC95-2311-B3200-06, NSC 96-2311-B-320-005-MY3, and 99-2311-B-320-003-MY3). The funders had no role in study design, data collection andanalysis, decision to publish, or preparation of the manuscript.
Competing Interests: The authors have declared that no competing interests exist.
* E-mail: [email protected]
Introduction
Bacillus anthracis, the etiological agent responsible for anthrax, is
a Gram-positive, nonmotile, aerobic, spore-forming rod-shaped
bacterium [1]. Anthrax is a disease primarily affecting herbivores
(e.g., cattle, sheep, and goats), which become infected by ingesting
contaminated vegetation, water, or soil; humans are generally
incidental hosts [1]. Based on the entrance route of B. anthracis
endospores, 3 types of human manifestations exist: cutaneous,
gastrointestinal, and inhalational infections; these can develop into
systemic infections with symptoms of hypotension, hemorrhage,
multi-organ failure, and sudden shock [2–4]. Anthrax lethal toxin
(LT) is a major virulence factor of B. anthracis, which is composed
of 2 polypeptides: the protective antigen (PA, 83 kDa) and the
lethal factor (LF, 90 kDa) [5–7]. LF is a zinc-dependent
metalloprotease, which cleaves the N-terminal domain of mito-
gen-activated protein kinase kinases (MKKs/MEKs) [8,9],
disrupting 3 downstream mitogen-activated protein kinase
(MAPK) pathways: the extracellular signal-regulated kinase
(ERK), p38, and the c-Jun N-terminal kinase (JNK) pathways
[10,11]. LF is toxic only when composed with PA to form LT.
After binding to one of 2 known cellular receptors, tumor
endothelium marker-8 (TEM8) or capillary morphogenesis pro-
tein-2 (CMG2) [12], PA is cleaved using a cellular furin-like
protease, oligomerized, and used to deliver LF into cells [6,13]. LT
could cause high mortality in experimental mice and rats [14,15];
however, the pathogenic mechanism of LT that leads to animal
death is not well understood. Previous studies have indicated that
LT treatments induce TNF-a-independent hypoxia and shock
[15]. Because systemic hypoxic symptoms cause animal deaths
[15], LT-induced anemia may be involved. Anthrax-mediated
hemolytic anemia has been reported in several clinical studies [16–
18]. An LT-induced hemolysis of human blood was also
demonstrated in vitro [19]; however, its impact has not been
clarified in vivo. Because LF can disrupt all 3 MAPK pathways [8],
and that the ERK [20,21], JNK [22], and p38 [23] pathways are
all critical to erythropoiesis, we hypothesized that LT may block
erythropoiesis and further exacerbate the anemic symptoms. This
study clarified the potential involvements of hemolytic anemia and
suppressed erythropoiesis in LT-treated C57BL/6J mice. In
addition, because a significant induction of serum erythropoietin
(EPO) is associated with extensive systemic hypoxia after LT
PLOS ONE | www.plosone.org 1 August 2013 | Volume 8 | Issue 8 | e71718

Figure 1. Effects of LT on hemolysis and in vitro erythroid colony-forming cell assay. An image of LT (200 ng/ml)-induced hemolysis invitro was compared with a saline-treated control group (A). After peripheral blood cells were incubated with or without LT at 37uC for 2 hours, plasmahemoglobin levels (mg/dL) were measured using Drabkin’s reagent (B). The experimental outline of the in vivo hemolysis assay is shown, in whichuntreated and saline-treated groups served as negative control groups (C). The RBC counts (D) and the levels of cell-free plasma hemoglobin (E) were
Anthrax Lethal Toxin Inhibits Erythropoiesis
PLOS ONE | www.plosone.org 2 August 2013 | Volume 8 | Issue 8 | e71718
administration in mice [15], we hypothesized that the EPO release
may be a self-rescue response. We also evaluated whether
enhancing erythropoiesis using EPO treatments may ameliorate
LT-induced anemia, and thus, reduce the mortality of LT-treated
mice.
Results
Lethal Toxins Induced Hemolysis in MiceFollowing previous studies using human blood [19], we
reproduced in vitro LT-mediated hemolysis experiments using
mouse blood. We found that LT treatments (200 ng/ml) had a
lesser effect in mice (Figure 1A and 1B) compared to humans ([19]
and authors’ unpublished results). In vivo analyses indicated that
LT treatments gradually reduced RBC counts of mice prior to
death (Figure 1C, experiment outline, and Figure 1D). When
hemolysis occurs within the blood circulation, hemoglobin is
normally cleared by the hemoglobin-scavenging mechanisms
[24,25]. When a massive hemolysis is severe enough to saturate
the hemoglobin-scavenging mechanism capacity, the plasma level
of the cell-free hemoglobin increases [26]. To investigate the level
of hemolysis in LT-mediated anemia, plasma hemoglobin levels of
LT-treated (1.5 mg/kg; a lethal dose) mice were measured.
Compared to the untreated and saline-treated groups, the level
of plasma hemoglobin did not increase significantly after LT
treatments (Figure 1C, experiment outline, and Figure 1E). Based
on these results, LT-induced hemolysis might not be the only
reason low RBC counts were induced. Because LT suppresses all 3
MAPK pathways [8], and that ERK [20,21], JNK [22], and p38
[23] are critical to erythropoiesis, we hypothesized that the
production and the maturation of the RBC (i.e., erythropoiesis)
might be affected by LT. To ascertain whether LT could influence
erythropoiesis of primary erythroid precursor cells, isolated mouse
BMs were treated with an erythrocytic differentiation-inducing
cocktail that contained native RBC synthesis-promoting cytokine
EPO, and then treated with or without LT. Erythroid progenitor
cells [i.e., burst-forming unit-erythroid (BFU-Es) colonies] ap-
peared after 7 to 14 days in untreated groups, whereas the colonies
were significantly suppressed in LT-treated groups, especially at
the high dose (Figure 1F, for 200 ng/ml groups). These results
suggest that LT is able to block erythropoiesis of primary erythroid
precursor cells.
Apoptosis is Involved in LT-catalytic Activity-dependentErythropoiesis Suppression
To investigate the suppression mechanism on erythropoiesis, in
vitro erythroid differentiation of cord blood-derived CD34+
hematopoietic stem cells (HSC) in a 16 day course was analyzed.
To determine the effects of LT on various differentiation stages,
cells were divided into 9 groups [Figure 2B (1–9), 2C (1–9), and 2D
(1–9)], and then subjected to vehicle [diluents: cell culture
medium; Figure 2B (1–5), 2C (1–5), and 2D (1–5)] and LT
[Figure 2B (6–9), 2C (6–9), and 2D (6–9)] groups. Cells were
treated with vehicle or LT on Days 0, 4, 8, and 12 (Figure 2B–2D,
2–5 vehicle groups, 6–9 LT groups). Toxin treatments were
conducted for 4 days for each of LT-treated groups (Figure 2B–
2D: Group 6, Days 0–4; Group 7, Days 4–8; Group 8, Days 8–12;
Group 9, Days 12–16). After treatments, surface markers of
erythrocytic progenitor cells, such as CD235a (glycophorin A,
GPA) and CD71 (the transferrin receptor), were examined using
flow cytometry. CD71 is expressed by a wide variety of
hematopoietic cells, including BFU-Es, CFU-Es, and proerythro-
blasts, but it is not present on mature erythrocytes [27], whereas
GPA is a late erythroid marker expressed on erythroblast cells and
mature erythrocytes, but not on the earliest precursor cells [28].
The data revealed that cell size (FSC), cell granularity (SSC), and
the percentage of GPA+ and GPA+/CD71+ cells were gradually
increased in the R1 region during differentiation (Figure 2A,
experiment outline, Figure 2B, 2C, and 2E). In contrast, the
populations of erythrocytic progenitor cells (Figure 2C–2F, GPA+
and GPA+/CD71+) were gradually shifted from the R1 (Figure 2B,
larger cells) to the R2 region (Figure 2B, smaller cells) after LT
treatments at varied differentiation times (Figure 2B–2F; E, F,
* p,0.05, ** p,0.01). To further explore the enzymatic activity
requirement of LT on erythropoiesis suppression, recombinant PA
(rPA), and recombinant LF (rLF), and E687A mutant LF
(rLFE687A) [which form recombinant wild-type LT (rLT) and
catalytic mutant LT (rLTE687A), respectively] were produced and
purified [29]. In agreement with the treatments using LT, rLT
induced a similar cellular response that shifted the populations of
the erythrocytic progenitor cells from the R1 to the R2 region,
compared to the untreated, vehicle, and other recombinant
protein control groups (Figure 2B–2F vs. Figure 3B–3F). The
catalytic mutant LT (rLTE687A) did not have such effects
(Figure 3B–3F). Because sub-G1 dead cells are smaller than
normal cells, propidium iodine (PI) staining was further used to
verify whether cell death was involved. In a representative PI-
staining analysis, LT and recombinant LT (rLT) elicited 52% and
61% of sub-G1 death cells, respectively [Figure 4A, Day 16-LT
(R1+R2) groups and Day 16-rLT (R1+R2) groups vs. untreated
control groups Day 0 (R1+R2) with only 9% sub-G1 and Day 16
(R1+R2) only 11% sub-G1 cells]. Among these 52% [Day 16-LT
(R1+R2) groups] and 61% [Day 16-rLT (R1+R2)] sub-G1 cells,
44% and 57% of which belong to R2 population [Figure 4A, Day
16-LT (R2), and Day 16-rLT (R2) groups], while only 8% and 4%
belong to R1 population (data not shown) (aforementioned
Figure 4A results are from one representative experiment,
averaged results are showed in Figure 4D). This indicates that
the major populations of cell in R2 region are actually dead after
LT treatments (92% and 95% of R2 region; data not shown). We
further used annexin V and active casepase-3 antibody to
characterize whether these are apoptotic cells. Our data indicates
that after LT and rLT treatments, 70% to 76% of total cells
(weighting 94% and 95% of R2 population) became annexin V
positive, and 47% to 53% of total cells became active-caspase-3
positive cells (Figure 4D). This indicates that those LT-elicited
hypoploid cells in R2 region are apoptotic cells. Our unpublished
data also indicate that there are approximately 80% of R2-region
cells expressing erythroid markers GPA on their surfaces. At the
same time, about 61% GPA+ cells are annexin V positive. To
verify whether LT preferentially kills those differentiated cells, we
performed LT-treatments of expanded CD34+ cells (4-day
treatment, a same time course of aforementioned differentiating
cells) for comparisons. Intriguingly, we did not observe significant
elicitation of apoptotic cells in R2 region (our unpublished data).
These results suggest that LT can’t kill undifferentiated CD34+
determined 22, 44, and 66 hours after the mice were treated with LT. The in vitro erythroid colony-forming cell assay was performed by incubatingmurine BM cells with or without LT (200 ng/ml or 20 ng/ml). Colonies of progenitor cells were counted on Days 7 and 14 post-erythroiddifferentiation initiation (F). Untreated BM cells were used as a control. ** p,0.01, comparisons between groups are indicated. Data are reported asmean 6 SD.doi:10.1371/journal.pone.0071718.g001
Anthrax Lethal Toxin Inhibits Erythropoiesis
PLOS ONE | www.plosone.org 3 August 2013 | Volume 8 | Issue 8 | e71718
Figure 2. Suppressive effect of LT on in vitro erythrocytic differentiation. The experiment outline of in vitro erythrocytic differentiation usinghuman cord blood-derived CD34+ cells is shown (A). Flow cytometry analysis of the cell size (FSC) and cell granularity (SSC) are shown at various timepoints (B). The percentage of GPA+ (erythrocytic marker) cells in the R1 and R2 regions are shown in (C) and (D), respectively. The percentage of GPAand GPA/CD71 expression cells in the R1 and R2 regions at various differentiation times are shown in (E) and (F), respectively. Cells were treated withLT (20 ng/ml) during differentiation on Days 0, 4, 8, and 12. After the 4-day LT treatments, cells in each differentiation stage were harvested for
Anthrax Lethal Toxin Inhibits Erythropoiesis
PLOS ONE | www.plosone.org 4 August 2013 | Volume 8 | Issue 8 | e71718

precursor cells. Our data collectively suggest that LT preferentially
kills GPA+-differentiating erythroid precursor cells but not GPA2,
CD34+ progenitors. As a result, our data collectively suggest that
anthrax LT can suppress erythropoiesis in part by killing the
erythroid progenitors through induction of caspase-3 dependent
apoptosis. In addition, this suppression is dependent on the
catalytic activity of LT.
Erythropoietin Treatments Reduced LT-mediatedMmortality, Aanemia, and Erythropoiesis Suppression inMice
Upregulated plasma EPO levels were previously shown to
coincide with hypoxic tissue damages in experimental mice [15].
EPO is a 30,400 dalton glycoprotein that positively regulates the
BM erythroid cell proliferation, differentiation, and survival [30].
To investigate whether the induction of EPO was only a
consequence of an acute phase response or a physiological
counteraction to overcome LT-mediated erythrocyte suppression,
recombinant EPO was administrated 1–3 days prior to LT
treatments (Figure 5A). If LT-mediated hemolysis anemia and
erythropoiesis suppression are associated with LT-mediated
pathogenic progression, then increasing erythropoiesis using
EPO treatments may have ameliorative effects. We found that a
single injection of a lethal dose of LT (1.5 mg/kg, LF : PA = 1: 5)
in mice resulted in 100% mortality (6/6 deaths) within 130 hours
(Figure 5B). In contrast, the same dosage of LT induced only 50%
mortality (3/6) in EPO-treated mice within 130 hours (Figure 5B;
statistically significant, p = 0.029). Our previous study has found
that LT treatments also induce thrombocytopenia and megakar-
yopoiesis suppression. These defects play certain roles in LT-
induced lethal pathogenesis [31]. In addition, treatments of TPO
can reduce LT-mediated mortality from 95.8% to 46.7% in mice
[31]. This evidence prompted us to test whether combined
treatments using EPO and TPO could achieve further ameliora-
tion on the lethal pathogenesis. Our data revealed that pretreat-
ments using EPO and TPO could exert a complete (100%) rescue
of the mice from LT-induced lethality (Figure 5B, TPO+EPO+LT
groups). All surviving mice remained alive for up to 2 months
(authors’ unpublished data). To verify whether reduced mortality
caused by EPO pretreatments is associated with ameliorated
suppression on erythropoiesis, a BFU-E colony assay was
performed using BM cells from LT- and/or EPO-treated mice
(Figure 5C, experimental outline). Analysis data revealed that the
colony formation of BM-derived BFU-E was suppressed in LT-
treated groups, while such suppression is significantly ameliorated
by EPO pretreatments (Figure 5D, LT vs. EPO+LT groups). RBC
counts, hemoglobin, and hematocrits can help diagnose anemia
[32]. These parameters were measured to determine whether
EPO rescue is associated with ameliorated anemia. Experimental
mice were treated with or without LT and/or EPO, and the
respective hematopoietic parameters such as RBC counts,
hemoglobin, hematocrits, white blood cell (WBC) counts, and
platelet counts were measured at various times for comparison
(Figure 6A, experimental outline). The data revealed that all of
these parameters except the WBC counts were reduced after LT
treatments (Figure 6B–6F, untreated vs. LT groups), whereas EPO
significantly ameliorated all LT-mediated suppressions except the
low platelet counts (Figure 6B–6D and 6F, LT vs. EPO+LT
groups). To verify whether the ameliorative effect of EPO on
anemia can be attributed to an increase in erythropoiesis, BM cells
of mice were isolated from femurs and tibiae at 69 hours post-LT
treatments (Figure 7A, experimental outline). The surface expres-
sion of CD71 and TER-119 was measured to determine the
maturation status of erythrocytes by using flow cytometry [33,34].
CD71 is expressed in a wide variety of hematopoietic cells,
including BFU-Es, CFU-Es, and proerythroblasts [27], whereas
TER-119 is a late erythroid marker expressed on erythroblast cells
[35]. These 2 markers allow researchers to distinguish among
erythroid cell populations at 4 differentiation states: CD71high-
TER-119med (Figure 7B, Region 1, R1), CD71highTER-119high
(Figure 7B, Region 2, R2), CD71medTER-119high (Figure 7B,
Region 3, R3), and CD71lowTER-119high (Figure 7B, Region 4,
R4) [36]. Analysis data revealed that the percentage of total
erythroblasts was reduced after LT treatment (Figure 7B, R1-to-
R4 regions, and Figure 7C, untreated vs. LT), especially in the R2
and R3 populations (Figure 7D, R2 and R3 groups, untreated vs.
LT) in BM. EPO pretreatment significantly increased the cell
numbers in the R1 and R2 regions (Figure 7D, LT vs. EPO+LT).
These results further suggest that LT suppresses erythropoiesis in
mouse BM, and that EPO treatments can ameliorate this
suppression (Figure 7B–7D).
Discussion
Hemoglobin in RBCs is the principle molecule that serves as an
oxygen carrier [37]. Suppressions of RBC counts, hemoglobin,
and hematocrits by LT treatments (Figure 6B–6D) may theoret-
ically contribute to the systemic hypoxia observed in LT-treated
mice [15] and anthrax patients [16,18]. LT-induced hemolysis is
one of the potential causes of low RBC counts. However, the basal
level of cell-free hemoglobin detected in mice plasma cannot fully
explain the drastic drops in RBC counts and hematocrits
(Figure 1D, 6B, and 6D). Because approximately 2.5 days (or 60
hours) are required to accomplish erythropoiesis in murine BM
[38], LT-mediated suppression on erythropoiesis can theoretically
be achieved before lethality occurs (Figure 5B, 78.5–126.5 hours).
The elicitation of apoptosis of primary CD34+-derived eryth-
roblasts during in vitro differentiation (Figure 2, 3, 4) suggests that
the suppressed erythropoiesis in BM may be caused by cell death
of CD71highTER-119high (R2) and CD71medTER-119high (R3)
populations (Figure 7B and 7D). The suppressive effect of LT on
erythropoiesis also occurs in the spleen (Figure S1), a minor
erythropoiesis site that is primarily induced under stress [39,40].
These occurrences are in agreement with our colony-forming unit
cell assays (in vitro, Figure 2F; in vivo, Figure 5D) and a previous
report [41].
Previous studies have indicated that PA binds to the anthrax
toxin receptor ATR1 on all lineages of hematopoietic progenitors
in the bone marrow, including the erythroid progenitor lineage
[41,42], and suppresses hematopoiesis [41]. However, the
mechanism involving LT-induced erythropoiesis suppression is
unclear. In our study, stroma cells were supplied in the expansion
stage but not in the in vitro differentiation stages (Figure 2A and
3A). Thus, an indirect suppressive effect through LT-elicited
stroma-derived cytokines, which was suggested to suppress
hematopoiesis [41], is not likely to be involved. LT is an MAPK
inhibitor and cleaves the N-terminal domain of MKKs/MEKs
[8,9], disrupting 3 MAPK pathways. The carboxy-terminal region
additional flow cytometry analysis. Representative cell-populations and histograms (B–D) were shown. The total cell number was defined as 100%.*p,0.05, ** p,0.01, comparisons between groups are indicated. Data are reported as mean 6 SD and represent results from 4 independentexperiments.doi:10.1371/journal.pone.0071718.g002
Anthrax Lethal Toxin Inhibits Erythropoiesis
PLOS ONE | www.plosone.org 5 August 2013 | Volume 8 | Issue 8 | e71718
Anthrax Lethal Toxin Inhibits Erythropoiesis
PLOS ONE | www.plosone.org 6 August 2013 | Volume 8 | Issue 8 | e71718
at residues 686–690 (HEXXH) of LF contains a putative zinc-
biding site for its metalloprotease activity [43]. We previously
demonstrated that the mutant LFE687A-composed LT has a
reduced cytotoxicity and catalytic property against MEK1 and
MEK2 ([29] and authors’ unpublished results). Our data suggests
that the catalytic activity of LT is required for the suppressive
effect on erythropoiesis (Figure 3).
Two major methods for tackling anthrax are currently available:
vaccination and antibiotics [44,45]. Animal experiment results
show that it takes approximately 6 or more PA immunization
cycles to elicit a weak immune response against anthrax. However,
the protective immunity does not usually last long (authors’
unpublished data). In addition, because the toxic effect of LT is
sufficient for lethality, animals may eventually die even after
aggressive antibiotic therapies to eliminate the bacteria [46]. These
results indicate that a specific treatment against LT is required. In
this study, we demonstrated that pretreatments of EPO could
reduce mortality in LT-injected mice by ameliorating RBC counts,
hemoglobin, hematocrits, and erythropoiesis in BM (Figure 5, 6,
7). However, EPO contains nonerythropoietic properties, includ-
ing tissue protection resulting from its ability to bind to injury-
induced lower-affinity EPO receptors (EPORs), distinct from the
high-affinity EPORs involved in erythropoiesis [47,48]. In
addition to the erythropoietic induction, the tissue-protective
property of EPO may be one of the possible mechanisms
explaining the rescue of LT-challenged mice [47,49]. Studies
have indicated that low levels of EPO (picomolar) are sufficient for
erythropoiesis induction, whereas much higher levels of EPO
(nanomolar) are required for tissue protection [47,48]. EPO has a
half-life of approximately 2 hours in the blood circulation [50].
Accordingly, to exclude the possibility of tissue protection, mice
were treated with rhEPO using doses that kinetically declined into
a range of concentrations to enhance erythropoiesis rather than
tissue protection before LT was administered (Figure S2) [47]. The
rhEPO was almost completely removed from the blood circulation
of the mice within 24 hours (Figure S2), at a much faster clearing
rate than for humans [47]. These results suggest that tissue
protection is not involved in the EPO rescue. Our previous study
showed that treatments of TPO could ameliorate LT-mediated
mortality in mice [31]. This evidence prompted us to test whether
combined treatments using EPO and TPO could also achieve
amelioration on the lethal pathogenesis. Our data reveal that
pretreatments using EPO and TPO could exert a complete (100%)
rescue of the mice from LT-induced lethality (Figure 5B,
TPO+EPO+LT groups). These results indicate the combined
treatments of EPO and TPO is much potent than the single
treatment of TPO alone [31]. TPO contains erythropoiesis-
enhancing properties in certain conditions [51], whereas treat-
ments of TPO alone did not significantly resolve the anemic
symptoms of LT-challenged mice [Figure 7D of the reference
[31]], indicating that the erythropoiesis-enhancing property of
TPO is not sufficient to protect against LT-induced erythropoiesis
suppression. Nonetheless, these results suggest that the platelet and
RBC are critical cell types for maintaining homeostasis in LT-
challenged mice. EPO administration is the well known medical
treatment to enhance erythropoiesis in renal anemia [52], anemia
of prematurity [53], and anemia with non-myeloid malignancies
[54]. TPO treatment has been discontinued due to thrombocy-
topenia elicited by autoantibodies against endogenous TPO [55].
For clinical view, combined administration of EPO and second-
generation of thrombopoietic agents, such as romiplostim and
eltrombopag, will be used as a potential approach to treat anthrax.
Evidence from other studies has revealed that once anthrax
enters a bacteremia stage, it inevitably leads to death, even with
aggressive antibiotic therapy that prevents bacterial growth [17].
This is caused by toxin-mediated damages that are accumulated in
the body, although the exact mechanism remains unclear [56].
Our data collectively suggested that LT-mediated suppression on
megakaryopoiesis and erythropoiesis is part of LT-mediated
pathophysiology. Protection from such damage to hematopoietic
progenitor cells using specific growth factors can significantly
reduce LT-induced animal death. The findings we have
documented provide a novel perspective for the potential
development of feasible alternative and additional therapeutic
strategies against anthrax.
Materials and Methods
Ethics StatementCord bloods and the umbilical cords from full-term deliveries
were collected by Mennonite Christian Hospital, Hualien,
Taiwan. Informed written consents were provided by participants
and obtained using protocols approved by the Research Ethics
Committee of Mennonite Christian Hospital (Approval ID: 09-12-
046-ER and 09-12-047-ER). All human samples were anon-
ymized. The research methods used on the experimental mice
were in accordance with the national guidelines of Animal
Protection Act (Taiwan) and approved by the Institutional Animal
Care and Use Committee, Tzu Chi University (Approval ID:
95017; Project: Potential roles of Bacillus anthracis lethal toxin on
erythroid cells).
ToxinsLT was purified and obtained as previously described [57].
Doses of LT refer to 1:5 amounts of LF and PA (i.e., 120 mg LT
equals 20 mg LF plus 100 mg PA). Recombinant wild-type LT
(rLT) is composed of recombinant PA (rPA) and wild-type LF
(rLF), and catalytic mutant LT (rLTE687A) is composed recombi-
nant PA (rPA) and E687A-mutant LF (rLFE687A) [29], respectively.
These recombinant proteins were produced and purified from
Escherichia coli/SG13009 as previously described [29], using His-
tagged affinity chromatography according to the manufacturer’s
instructions (Qiagen, Hilden, Germany).
Figure 3. Proteolytic activity of LT component lethal factor is essential for the suppression of erythrocytic differentiation. Thetimetable of in vitro erythrocytic differentiation using human cord blood-derived CD34+ cells is shown (A). To address the effect with or withoutproteolytic activity, rLF and rLFE687A were employed, respectively. Flow cytometry analysis of the cell size (FSC) and cell granularity (SSC) are shown atvarious times (B). The percentage of GPA+ (erythrocytic marker) cells in the R1 and R2 regions are shown in (C) and (D), respectively. The percentageof GPA expression cells in the total cells (16104) in the R1 and R2 regions for different treatments are shown in (E) and (F), respectively. LT and controlproteins such as rPA (5 mg/ml), rLF (5 mg/ml), rLFE687A (5 mg/ml), rLT (5 mg/ml rPA +5 mg/ml rLF), and rLTE687A (5 mg/ml rPA +5 mg/ml rLFE687A) wereadded into the medium by differentiation on Day 8. The cells were then analyzed using flowcytometry 4 days later. Groups treated with or without a(untreated) vehicle and BSA (10 mg/ml) served as negative controls. Representative cell-populations and histograms (B–D) were shown. Total cellnumber was defined as 100%. *p,0.05, ** p,0.01, comparisons with untreated groups are indicated. Data are reported as mean 6 SD and representresults from 4 independent experiments.doi:10.1371/journal.pone.0071718.g003
Anthrax Lethal Toxin Inhibits Erythropoiesis
PLOS ONE | www.plosone.org 7 August 2013 | Volume 8 | Issue 8 | e71718
Figure 4. Characterizations of LT-induced hypoploid cells. Human cord blood-derived CD34+ cells were treated using LT and rLT on Day 12and analyzed on Day 16 during the in vitro differentiation of erythrocytes. The DNA contents were revealed by fluorescence intensities of propidiumiodine (PI) staining. The hypoploid cells were increased in LT-treated and rLT-treated groups (A). Annexin V-APC (B) and active caspase-3-FITCantibodies (C) were used to characterize the apoptotic cells in R2 region by flow cytometry. The percentage of sub-G1 cells on day 0 and annexin V+
and active caspase-3+ cells of R1 region on day 0 were used as basal level controls. Representative histograms (A–C) and summarized events (D) wereshown. *p,0.05, ** p,0.01, compared to vehicle-treated controls. Data are reported as mean 6 SD and represent results from 3 independentexperiments.doi:10.1371/journal.pone.0071718.g004
Anthrax Lethal Toxin Inhibits Erythropoiesis
PLOS ONE | www.plosone.org 8 August 2013 | Volume 8 | Issue 8 | e71718
Hemoglobin DetectionC57BL/6J mice (males, 6–8 weeks old) were purchased from
the National Laboratory Animal Center (Taipei, Taiwan) and
maintained in pathogen-free conditions in the experimental
animal center at Tzu Chi University. For the in vitro hemoglobin
assay, peripheral blood collected from the retro-orbital plexi of
C57BL/6J mice were mixed with anticoagulant acid citrate
dextrose formula A (ACD-A : 38 mM citric acid, 75 mM
trisodium citrate, 139 mM D-glucose, 12.5 mM EDTA) (blood :
ACD-A = 8:1) [58] and then incubated with or without LT
(200 ng/ml) at 37uC for 2 hours [19]. Plasma hemoglobin was
measured using Drabkin’s reagent (Sigma-Aldrich, St. Louis, MO,
USA) by detecting the absorbance at 540 nm. The standard curve
for hemoglobin was obtained by serial dilution of the whole blood
from the peripheral blood of untreated mice, in which the
hemoglobin concentration was determined using an automated
hematology analyzer (KX-21, Sysmex Corporation, Kobe, Japan).
Hemoglobin concentrations (mg/dL) of the samples were then
obtained through comparisons of the standard curve. To
determine LT-induced hemolysis in vivo, C57BL/6J mice were
retro-orbitally injected with or without a lethal dose of LT
(1.5 mg/kg in 250 ml saline). Untreated and saline-treated mice
were used as negative controls. The level of plasma cell-free
hemoglobin was measured at 22, 44, and 66 hours post-LT
treatments using Drabkin’s reagent.
Erythroid Colony-forming Cells AssayMouse (C57BL/6J) bone marrow (BM) cells from femurs and
tibiae were collected by flushing using RPMI-1640 containing
20% anticoagulant ACD-A. The cell suspensions were passed
through a 55 mm nylon mesh to remove cell aggregates. Red blood
cells (RBCs) were depleted by adding a hypotonic buffer (153 mM
NH4Cl and 17 mM Tris-HCl) at room temperature for 10
minutes. Cells (96105/ml, 100 ml) were then resuspended in
Iscove’s Modified Dulbecco’s Medium (IMDM) (StemCell Tech-
nologies, Vancouver, BC, Canada) and mixed with a 1 ml
semisolid methylcellulose-based medium containing 3 units of
EPO (MethoCult-M3334, StemCell Technologies, Vancouver,
BC, Canada). Each 1.1 ml of methylcellulose cell suspension was
mixed with or without a varied LT dose (200 ng/ml or 20 ng/ml)
and seeded in 35 mm dishes. Finally, the cultures were incubated
at 37uC for either 7 or 14 days.
Figure 5. EPO treatments reduced LT-mediated mortality and erythropoiesis suppression in mice. The experimental outline of thesurvival rate analysis is shown in (A). The survival rate of mice treated with EPO, LT, TPO, EPO in addition LT or TPO, and EPO plus LT is shown in (B).Untreated mice were used as negative controls. The symbol marks in (A) and (B) indicate the starting point for recording mortality. Theexperimental outline of the in vivo erythroid colony-forming cell assay is shown in (C). Colony numbers of BM cells from mice treated with EPO, LT, orEPO in addition to LT by the erythroid colony-forming cells assay on Days 7 and 14 is shown in (D). BM cells from untreated mice were used ascontrols. *p,0.05, ** p,0.01, comparison between groups are indicated. Data are reported as mean 6 SD, and represent results from 4 independentexperiments.doi:10.1371/journal.pone.0071718.g005
Anthrax Lethal Toxin Inhibits Erythropoiesis
PLOS ONE | www.plosone.org 9 August 2013 | Volume 8 | Issue 8 | e71718
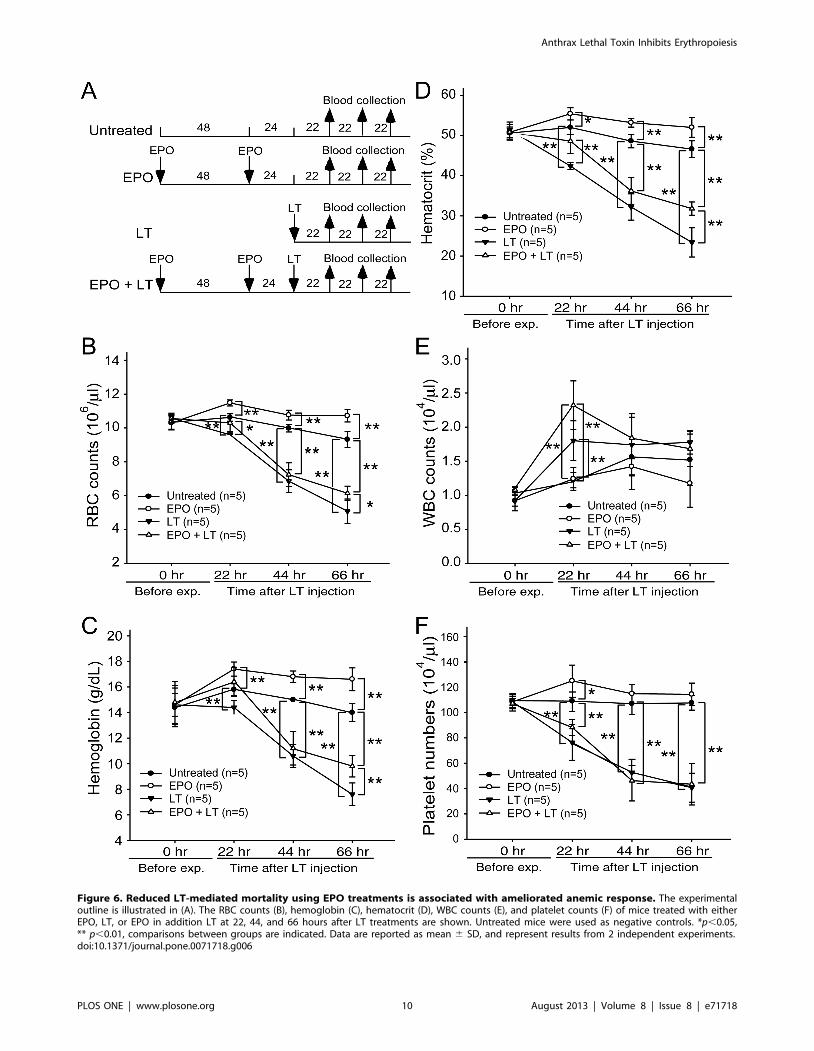
Figure 6. Reduced LT-mediated mortality using EPO treatments is associated with ameliorated anemic response. The experimentaloutline is illustrated in (A). The RBC counts (B), hemoglobin (C), hematocrit (D), WBC counts (E), and platelet counts (F) of mice treated with eitherEPO, LT, or EPO in addition LT at 22, 44, and 66 hours after LT treatments are shown. Untreated mice were used as negative controls. *p,0.05,** p,0.01, comparisons between groups are indicated. Data are reported as mean 6 SD, and represent results from 2 independent experiments.doi:10.1371/journal.pone.0071718.g006
Anthrax Lethal Toxin Inhibits Erythropoiesis
PLOS ONE | www.plosone.org 10 August 2013 | Volume 8 | Issue 8 | e71718

Erythrocyte in vitro Culture and Flow Cytometry AssayMononuclear cells of human cord blood were purified using
Ficoll-Paque Plus (GE Healthcare Bio-Sciences). Fresh CD34+
cells were purified using CD34-microbeads by a Miltenyi
VarioMACS device (Miltenyi Biotec), according to the manufac-
turer’s instructions. To induce erythroid differentiation, isolated
CD34+ cells were initially co-cultured with umbilical-cord
mesenchymal stem cells (MSC, Wharton’s jelly [59]) in a cell-
culture IMDM (Gibco) containing 10% fetal bovine serum (FBS,
Biological Industries, Kibbutz Beit Haemek, Israel), 10 ng/ml
recombinant human thrombopoietin (rhTPO, PeproTech),
20 ng/ml recombinant human interleukin-3 (rhIL-3, PeproTech),
30.5 ng/ml recombinant human stem cell factor (rhSCF,
PeproTech), and 22.3 ng/ml recombinant human Flt-3 ligand
(rhFLt3-L, PeproTech) for 4–5 days to expand the number of cells
[60]. Approximately 56105 CD34+ cells were then cultured in
1 ml IMDM (Gibco) supplemented with 3% FBS, 200 mg/ml
iron-saturated human transferrin (Sigma-Aldrich), 90 ng/ml ferric
nitrate (Sigma-Aldrich), 50 mg/ml insulin, 1026 M hydrocortisone
(Sigma-Aldrich), 4 mM l-glutamine, 100 U/l penicillin, 100 mg/
ml streptomycin and a cocktail of cytokines administered as
follows: 5 ng/ml IL-3, 100 ng/ml SCF, and 3 IU/ml EPO were
administered on Days 0–8; cells were diluted 2-fold on Day 4; and
erythroid cells were cultured in the presence of 3 IU/ml EPO and
MSC condition medium for further maturation on Days 8 to 16
[61]. On the differentiation days, Days 0, 4, 8, and 12, LT (20 ng/
ml) was added. For the recombinant anthrax toxins, rPA (5 mg/
ml), rLF (5 mg/ml), rLFE687A (5 mg/ml), rLT (5 mg/ml rPA +5 mg/
ml rLF), and rLTE687A (5 mg/ml rPA +5 mg/ml rLFE687A) were
added on Day 8. After 4 days, the total cells of the respective
groups were isolated for flow cytometry analysis. Untreated,
diluent-treated (glycerol:saline = 1:1), and bovine serum albumin
(BSA)-treated (10 mg/ml) groups were used as negative controls.
The erythrocytic surface marker expressions were stained using
anti-human CD71-APC (eBioscience) and anti-human CD235a-
PE (eBioscience) antibodies. To analyze apoptotic cells, Annexin
V-APC (BD Pharmingen) and anti-active caspase-3 antibodies
conjugated with FITC (BD Pharmingen) were used, and then
analyzed using flow cytometry and the CellQuest program
(Becton-Dickinson).
Figure 7. Beneficial effects of EPO treatments on survival are associated with rescued bone-marrow erythroblasts of LT-treatedmice. The experimental outline is illustrated in (A). Flow cytometry analyses of BM cells were performed at 69 hours post-LT treatments. Following apreviously described method used to distinguish the maturation stages of RBC precursors [33], the erythroblasts were gated as R1 (CD71high, TER-119med), R2 (CD71high, TER-119high), R3 (CD71med, TER-119high), and R4 (CD71low, TER-119high) in all groups (B). The relative cell population (% of total16105) (C) and the cell numbers of all erythroid precursor cells (R1, R2, R3, and R4) in the respective groups are shown (D). *p,0.05, ** p,0.01comparisons between groups are indicated. Data are reported as mean 6 SD.doi:10.1371/journal.pone.0071718.g007
Anthrax Lethal Toxin Inhibits Erythropoiesis
PLOS ONE | www.plosone.org 11 August 2013 | Volume 8 | Issue 8 | e71718

DNA Content AnalysisCells were washed twice using phosphate buffered saline (PBS),
fixed with ice-cold 70% ethanol in PBS at –20uC for 2 hours, and
then washed with PBS and resuspended in 500 ml staining solution
containing propidium iodine (PI) (20 mg/ml PI, 0.1% Triton X-
100 and 0.2 mg/ml RNase A in PBS) and incubated at room
temperature for 30 minutes. The DNA content of the cells was
analyzed using a flow cytometer (FACSCalibur, Becton-Dick-
inson, San Jose, CA, USA).
EPO Rescue Experiments (Mortality, Erythroid Colony-forming Cell Assay, Peripheral Blood HematopoieticParameters, and Bone Marrow Analysis)
C57BL/6J mice (males, 10–11 weeks old) were treated with
recombinant human EPO (rhEPO, Neorecormon H, Roche,
Mannheim, Germany) (2 IU/g, in 250 ml saline) and/or murine
TPO (CytoLab, Rehovot, Israel) (0.25 mg/mice, in 250 ml saline)
twice by using a retro-orbital injection at 72 and 24 hours before
administration of a lethal dose of LT (1.5 mg/kg in 250 ml saline,
using retro-orbital injection, with approximately 95.8% mortality
[31]). Untreated and EPO-treated groups without further LT
treatments served as controls. As there is no suitable parameter to
predict the death/survival for LT-challenged mice, we use death
as an endpoint. The mortality and survival duration of the mice
were recorded after LT treatments. The experimental mice were
monitored every 4–6 hours. The surveillance showed that LT-
challenges reduce behavioral activities of mice before death
without body weight loss and any obvious discomfort (such as
abnormal behavior and convulsions). Surviving mice were
sacrificed by cervical dislocation 69 hours after LT treatments.
The BM cells were collected and performed in vivo in the erythroid
colony-forming cell assay (Materials and Methods: Erythroidcolony-forming cell assay). To measure the hematological
parameters [RBC counts, hemoglobin level, white blood cell
counts, hematocrits (Hcts), and platelet counts], blood samples
were collected 22, 44, and 66 hours from the retro-orbital plexi of
the mice after LT treatments. Collected blood was mixed with the
anticoagulant ACD-A (blood: ACD-A = 1:9). The hematological
parameters were determined using an automated hematology
analyzer (KX-21, Sysmex Corporation, Kobe, Japan). To detect
erythroblast-specific surface markers, BM cells of mice were
collected from femurs and tibiae 69 hours after LT treatments.
The femurs and tibiae were flushed using the RPMI-1640 medium
supplemented with 20% anticoagulant ACD-A through 30G
needles. The cell suspensions were passed through a 55 mm nylon
mesh to remove the cell aggregates. Cells were blocked with 5%
BSA in an RPMI medium at 37uC for 1 hour and then incubated
in a 500 ml RPMI-1640 medium with 1 ml of an FITC-conjugated
rat anti-mouse CD71 antibody (BioLegend) and 3 ml of R-
Phycoerythrin (R-PE)-conjugated rat anti-mouse TER-119 anti-
body (BD Immunocytometry System) at 37uC for 1 hour. After
PBS washes, the cells were analyzed using a FACSCalibur flow
cytometer and CellQuestTM Pro program (Becton-Dickinson, San
Jose, CA, USA).
StatisticsMeans, standard deviations (SDs), and statistics for quantifiable
data were calculated using Microsoft Office Excel 2003 for
Windows. Comparisons between groups were made using the two-
tailed Student t test. A p value of ,0.05 was considered significant.
Supporting Information
Figure S1 LT-mediated mortality is associated withreduced number of erythroblast cells in spleen. The
experimental outline of spleen experiments is illustrated (A). Flow
cytometry analysis of spleen cells were performed at 69 hours after
LT treatments. To determine the maturation stages of RBC
precursors, the erythroblast cells were gated as R1 (CD71high,
TER-119med), R2 (CD71high, TER-119high), R3 (CD71med, TER-
119high), and R4 (CD71low, TER-119high) in all groups (B). The
relative cell population (% of total 16105) (C) and the cell numbers
of all erythroblast cells (R1, R2, R3, and R4) in respective groups
are showed (D). *p,0.05, ** p,0.01, comparisons between groups
are indicated. Data are reported as mean 6 standard deviation
(SD).
(TIF)
Figure S2 Plasma EPO concentration after EPO injec-tion. The experimental outline of EPO immunoassay is showed
(A). EPO concentration of plasma after two sequential EPO
injections was examined 30 minutes and 24 hours after the second
EPO injection by ELISA (B). Data are reported as mean 6
standard deviation (SD) except the 30-minute group showed as a
mean value. EPO concentration was calculated according to a
standard curve showed on (C).
(TIF)
Methods S1 Supplemental experimental procedures.
(PDF)
Acknowledgments
The authors wish to thank Li ZC for performing preliminary works of this
manuscript. The authors are grateful to Prof. Wang MH and his team
(Experimental Animal Center, Tzu-Chi University) for their help
maintaining experimental animals and the pathogen-free environments.
We also greatly appreciate the team from the Department of Obstetrics
and Gynecology (Mennonite Christian Hospital) for providing human
umbilical cords and umbilical cord bloods.
Author Contributions
Conceived and designed the experiments: HHC DSS. Performed the
experiments: TPW PKC YYL CHL TKL YWC WBL CYC. Analyzed the
data: HHC DSS. Contributed reagents/materials/analysis tools: JHK
HHH HLH CYL. Wrote the paper: HHC DSS.
References
1. Mock M, Fouet A (2001) Anthrax. Annu Rev Microbiol 55: 647–671.
2. Abramova FA, Grinberg LM, Yampolskaya OV, Walker DH (1993) Pathology
of inhalational anthrax in 42 cases from the Sverdlovsk outbreak of 1979. ProcNatl Acad Sci U S A 90: 2291–2294.
3. Dixon TC, Meselson M, Guillemin J, Hanna PC (1999) Anthrax. N Engl J Med
341: 815–826.
4. Shafazand S, Doyle R, Ruoss S, Weinacker A, Raffin TA (1999) Inhalationalanthrax: epidemiology, diagnosis, and management. Chest 116: 1369–1376.
5. Brossier F, Mock M (2001) Toxins of Bacillus anthracis. Toxicon 39: 1747–1755.
6. Collier RJ, Young JA (2003) Anthrax toxin. Annu Rev Cell Dev Biol 19: 45–70.
7. Mourez M (2004) Anthrax toxins. Rev Physiol Biochem Pharmacol 152: 135–
164.
8. Bardwell AJ, Abdollahi M, Bardwell L (2004) Anthrax lethal factor-cleavage
products of MAPK (mitogen-activated protein kinase) kinases exhibit reduced
binding to their cognate MAPKs. Biochem J 378: 569–577.
9. Turk BE (2007) Manipulation of host signalling pathways by anthrax toxins.
Biochem J 402: 405–417.
10. Hagemann C, Blank JL (2001) The ups and downs of MEK kinase interactions.
Cell Signal 13: 863–875.
11. Wada T, Penninger JM (2004) Mitogen-activated protein kinases in apoptosis
regulation. Oncogene 23: 2838–2849.
12. Bradley KA, Mogridge J, Mourez M, Collier RJ, Young JA (2001) Identification
of the cellular receptor for anthrax toxin. Nature 414: 225–229.
Anthrax Lethal Toxin Inhibits Erythropoiesis
PLOS ONE | www.plosone.org 12 August 2013 | Volume 8 | Issue 8 | e71718
13. Moayeri M, Leppla SH (2004) The roles of anthrax toxin in pathogenesis. Curr
Opin Microbiol 7: 19–24.14. Cui X, Moayeri M, Li Y, Li X, Haley M, et al. (2004) Lethality during
continuous anthrax lethal toxin infusion is associated with circulatory shock but
not inflammatory cytokine or nitric oxide release in rats. Am J Physiol RegulIntegr Comp Physiol 286: R699–709.
15. Moayeri M, Haines D, Young HA, Leppla SH (2003) Bacillus anthracis lethaltoxin induces TNF-alpha-independent hypoxia-mediated toxicity in mice. J Clin
Invest 112: 670–682.
16. Freedman A, Afonja O, Chang MW, Mostashari F, Blaser M, et al. (2002)Cutaneous anthrax associated with microangiopathic hemolytic anemia and
coagulopathy in a 7-month-old infant. JAMA 287: 869–874.17. Jernigan JA, Stephens DS, Ashford DA, Omenaca C, Topiel MS, et al. (2001)
Bioterrorism-related inhalational anthrax: the first 10 cases reported in theUnited States. Emerg Infect Dis 7: 933–944.
18. Mina B, Dym JP, Kuepper F, Tso R, Arrastia C, et al. (2002) Fatal inhalational
anthrax with unknown source of exposure in a 61-year-old woman in New YorkCity. JAMA 287: 858–862.
19. Wu AG, Alibek D, Li YL, Bradburne C, Bailey CL, et al. (2003) Anthrax toxininduces hemolysis: an indirect effect through polymorphonuclear cells. J Infect
Dis 188: 1138–1141.
20. Huo XF, Zhang JW (2005) Annexin1 regulates the erythroid differentiationthrough ERK signaling pathway. Biochem Biophys Res Commun 331: 1346–
1352.21. Zhang J, Lodish HF (2004) Constitutive activation of the MEK/ERK pathway
mediates all effects of oncogenic H-ras expression in primary erythroidprogenitors. Blood 104: 1679–1687.
22. Jacobs-Helber SM, Sawyer ST (2004) Jun N-terminal kinase promotes
proliferation of immature erythroid cells and erythropoietin-dependent celllines. Blood 104: 696–703.
23. Moosavi MA, Yazdanparast R, Lotfi A (2007) ERK1/2 inactivation and p38MAPK-dependent caspase activation during guanosine 59-triphosphate-mediat-
ed terminal erythroid differentiation of K562 cells. Int J Biochem Cell Biol 39:
1685–1697.24. Kristiansen M, Graversen JH, Jacobsen C, Sonne O, Hoffman HJ, et al. (2001)
Identification of the haemoglobin scavenger receptor. Nature 409: 198–201.25. Nagel RL, Gibson QH (1971) The binding of hemoglobin to haptoglobin and its
relation to subunit dissociation of hemoglobin. J Biol Chem 246: 69–73.26. Rother RP, Bell L, Hillmen P, Gladwin MT (2005) The clinical sequelae of
intravascular hemolysis and extracellular plasma hemoglobin: a novel mecha-
nism of human disease. JAMA 293: 1653–1662.27. Trowbridge IS, Lesley J, Schulte R (1982) Murine cell surface transferrin
receptor: studies with an anti-receptor monoclonal antibody. J Cell Physiol 112:403–410.
28. Gahmberg CG, Jokinen M, Andersson LC (1978) Expression of the major
sialoglycoprotein (glycophorin) on erythroid cells in human bone marrow. Blood52: 379–387.
29. Chang HH, Tsai MF, Chung CP, Chen PK, Hu HI, et al. (2006) Single-steppurification of recombinant anthrax lethal factor from periplasm of Escherichia
coli. J Biotechnol 126: 277–285.30. Fisher JW (2003) Erythropoietin: physiology and pharmacology update. Exp
Biol Med (Maywood) 228: 1–14.
31. Chen PK, Chang HH, Lin GL, Wang TP, Lai YL, et al. (2013) Suppressiveeffects of anthrax lethal toxin on megakaryopoiesis. PLoS ONE 8 e59512.
32. George-Gay B, Parker K (2003) Understanding the complete blood count withdifferential. J Perianesth Nurs 18: 96–114; quiz 115–117.
33. Socolovsky M, Nam H, Fleming MD, Haase VH, Brugnara C, et al. (2001)
Ineffective erythropoiesis in Stat5a(2/2)5b(2/2) mice due to decreasedsurvival of early erythroblasts. Blood 98: 3261–3273.
34. Zhang J, Socolovsky M, Gross AW, Lodish HF (2003) Role of Ras signaling inerythroid differentiation of mouse fetal liver cells: functional analysis by a flow
cytometry-based novel culture system. Blood 102: 3938–3946.
35. Kina T, Ikuta K, Takayama E, Wada K, Majumdar AS, et al. (2000) Themonoclonal antibody TER-119 recognizes a molecule associated with
glycophorin A and specifically marks the late stages of murine erythroid lineage.Br J Haematol 109: 280–287.
36. Halupa A, Bailey ML, Huang K, Iscove NN, Levy DE, et al. (2005) A novel rolefor STAT1 in regulating murine erythropoiesis: deletion of STAT1 results in
overall reduction of erythroid progenitors and alters their distribution. Blood
105: 552–561.
37. Inayat MS, Bernard AC, Gallicchio VS, Garvy BA, Elford HL, et al. (2006)
Oxygen carriers: a selected review. Transfus Apher Sci 34: 25–32.
38. Mary JY, Valleron AJ, Croizat H, Frindel E (1980) Mathematical analysis of
bone marrow erythropoiesis: application to C3H mouse data. Blood Cells 6:
241–262.
39. Mide SM, Huygens P, Bozzini CE, Fernandez Pol JA (2001) Effects of human
recombinant erythropoietin on differentiation and distribution of erythroid
progenitor cells on murine medullary and splenic erythropoiesis during hypoxia
and post-hypoxia. In Vivo 15: 125–132.
40. Vacha J, Hola J, Dungel J, Znojil V (1982) The distribution of erythropoiesis
over the various anatomical regions of the erythropoietic system in some inbred
strains of mice. Exp Hematol 10: 768–773.
41. Rameshwar P, Wong EW, Connell ND (2012) Effects by anthrax toxins on
hematopoiesis: a key role for cytokines as mediators. Cytokine 57: 143–149.
42. Liu K, Wong EW, Schutzer SE, Connell ND, Upadhyay A, et al. (2009) Non-
canonical effects of anthrax toxins on haematopoiesis: implications for vaccine
development. J Cell Mol Med 13: 1907–1919.
43. Klimpel KR, Arora N, Leppla SH (1994) Anthrax toxin lethal factor contains a
zinc metalloprotease consensus sequence which is required for lethal toxin
activity. Mol Microbiol 13: 1093–1100.
44. Holty JE, Bravata DM, Liu H, Olshen RA, McDonald KM, et al. (2006)
Systematic review: a century of inhalational anthrax cases from 1900 to 2005.
Ann Intern Med 144: 270–280.
45. Tournier JN, Ulrich RG, Quesnel-Hellmann A, Mohamadzadeh M, Stiles BG
(2009) Anthrax, toxins and vaccines: a 125-year journey targeting Bacillus
anthracis. Expert Rev Anti Infect Ther 7: 219–236.
46. Shoop WL, Xiong Y, Wiltsie J, Woods A, Guo J, et al. (2005) Anthrax lethal
factor inhibition. Proc Natl Acad Sci U S A 102: 7958–7963.
47. Brines M, Cerami A (2008) Erythropoietin-mediated tissue protection: reducing
collateral damage from the primary injury response. J Intern Med 264: 405–432.
48. Hand CC, Brines M (2011) Promises and pitfalls in erythopoietin-mediated
tissue protection: are nonerythropoietic derivatives a way forward? J Investig
Med 59: 1073–1082.
49. Chateauvieux S, Grigorakaki C, Morceau F, Dicato M, Diederich M (2011)
Erythropoietin, erythropoiesis and beyond. Biochem Pharmacol 82: 1291–1303.
50. Fukuda MN, Sasaki H, Lopez L, Fukuda M (1989) Survival of recombinant
erythropoietin in the circulation: the role of carbohydrates. Blood 73: 84–89.
51. Ratajczak MZ, Ratajczak J, Marlicz W, Pletcher CH Jr, Machalinski B, et al.
(1997) Recombinant human thrombopoietin (TPO) stimulates erythropoiesis by
inhibiting erythroid progenitor cell apoptosis. Br J Haematol 98: 8–17.
52. de Francisco AL, Pinera C (2011) Anemia trials in CKD and clinical practice:
refining the approach to erythropoiesis-stimulating agents. Contrib Nephrol 171:
248–254.
53. Gallagher PG, Ehrenkranz RA (1993) Erythropoietin therapy for anemia of
prematurity. Clin Perinatol 20: 169–191.
54. Shehata N, Walker I, Meyer R, Haynes AE, Imrie K, et al. (2008) The use of
erythropoiesis-stimulating agents in patients with non-myeloid hematological
malignancies: a systematic review. Ann Hematol 87: 961–973.
55. Li J, Yang C, Xia Y, Bertino A, Glaspy J, et al. (2001) Thrombocytopenia caused
by the development of antibodies to thrombopoietin. Blood 98: 3241–3248.
56. Rainey GJ, Young JA (2004) Antitoxins: novel strategies to target agents of
bioterrorism. Nat Rev Microbiol 2: 721–726.
57. Kau JH, Lin CG, Huang HH, Hsu HL, Chen KC, et al. (2002) Calyculin A
sensitive protein phosphatase is required for Bacillus anthracis lethal toxin
induced cytotoxicity. Curr Microbiol 44: 106–111.
58. Brown AS, Hong Y, de Belder A, Beacon H, Beeso J, et al. (1997)
Megakaryocyte ploidy and platelet changes in human diabetes and atheroscle-
rosis. Arterioscler Thromb Vasc Biol 17: 802–807.
59. Bakhshi T, Zabriskie RC, Bodie S, Kidd S, Ramin S, et al. (2008) Mesenchymal
stem cells from the Wharton’s jelly of umbilical cord segments provide stromal
support for the maintenance of cord blood hematopoietic stem cells during long-
term ex vivo culture. Transfusion 48: 2638–2644.
60. Yao CL, Feng YH, Lin XZ, Chu IM, Hsieh TB, et al. (2006) Characterization of
serum-free ex vivo-expanded hematopoietic stem cells derived from human
umbilical cord blood CD133(+) cells. Stem Cells Dev 15: 70–78.
61. Baek EJ, Kim HS, Kim S, Jin H, Choi TY, et al. (2008) In vitro clinical-grade
generation of red blood cells from human umbilical cord blood CD34+ cells.
Transfusion 48: 2235–2245.
Anthrax Lethal Toxin Inhibits Erythropoiesis
PLOS ONE | www.plosone.org 13 August 2013 | Volume 8 | Issue 8 | e71718