
Effets des éléments d’alliage sur les propriétés de...
195
Effets des éléments d’alliage sur les propriétés de traction des alliages de base Al-Si-Cu-Mg à température ambiante et haute Par Loay Alyaldin Mémoire présenté à l`Université du Québec à Chicoutimi en vue de l’obtention du grade de la maîtrise en ingénierie Québec, Canada © [Loay Alyaldin], [2017]
Transcript of Effets des éléments d’alliage sur les propriétés de...
Effets des éléments d’alliage sur les propriétés de
traction des alliages de base Al-Si-Cu-Mg à température
ambiante et haute
Par Loay Alyaldin
Mémoire présenté à l`Université du Québec à Chicoutimi
en vue de l’obtention du grade de la maîtrise en
ingénierie
Québec, Canada
© [Loay Alyaldin], [2017]
Effects of alloying elements on room and high
temperature tensile properties of Al-Si-Cu-Mg base
alloys
By Loay Alyaldin
Thesis presented to University of Quebec at Chicoutimi
in partial fulfillment of the requirement for the d egree of
master in engineering
Quebec, Canada
© [Loay Alyaldin], [2017]

Dedicated to my grandparents, my
parents, my sisters and my wife Mariam
RÉSUMÉ
Au cours des dernières années, l'aluminium et les alliages d'aluminium ont été largement utilisés dans l’industrie de l'automobile et de l'aérospatiale. Parmi les alliages d'aluminium coulé les plus couramment utilisés, figurent ceux appartenant au système Al-Si. En raison de leurs propriétés mécaniques, de leur légèreté, de leur excellente coulabilité et de leur résistance à la corrosion, ces alliages sont principalement utilisés dans l'ingénierie et dans les applications automobiles. Plus l'aluminium est utilisé dans la production d'un véhicule, plus le poids de celui-ci est diminué et contribue à diminuer sa consommation de carburant, réduisant ainsi la quantité d'émissions nocives dans l'atmosphère.
Les principaux éléments d'alliage dans les alliages Al-Si, en plus du silicium, sont le magnésium et le cuivre. Ceux-ci améliorent la résistance à l'alliage par le phénomène de durcissement par précipitation suite au traitement thermique, grâce à la formation de précipités Al 2Cu et Mg2Si. Cependant, la plupart des alliages Al-Si ne conviennent pas aux applications à haute température, car leur résistance à la traction et à la fatigue ne sont pas aussi élevées que souhaitées dans la plage de température 230-350 ° C, qui est la plage de températures souvent atteinte dans les composants du moteur automobile en service. Le principal défi réside dans le fait que la résistance des alliages d'aluminium moulé traitable thermiquement diminue à des températures supérieures à ~200 ° C. Les précipités de Mg2Si et Al2Cu qui maintiennent la résistance élevée de l'alliage habituellement grossissent ou se dissolvent à des températures supérieures à 150 ° C, ce qui entraîne une réduction des performances à haute température et par conséquent limite les applications pratiques. La plupart des alliages moulés Al-Si à ce jour sont destinés pour des applications à des températures qui ne dépassent pas environ 230 ° C.
La résistance des alliages dans des conditions à haute température est améliorée grâce à l'obtention d'une microstructure contenant des intermétalliques thermiquement stables et résistants au grossissement, ce qui peut être obtenu avec l'addition de Ni. Zr et Sc. Le nickel conduit à la formation d'aluminiure de nickel Al3Ni et Al9FeNi en présence de fer. Tandis que le zirconium lui, forme des particules d’Al3Zr. Ces intermétalliques améliorent la résistance à la température élevée des alliages Al-Si. Certaines améliorations intéressantes ont été réalisées en modifiant la composition de l'alliage de base avec des additions de Mn. Ce qui entraîne une augmentation de la résistance et de la ductilité à la fois, à température ambiante et à haute température. Les principaux effets qui peuvent être obtenus en ajoutant du scandium aux alliages d'aluminium sont le raffinement du grain et le durcissement par précipitation à partir de particules Al3Sc. L'ajout de Zr avec le Sc ce traduit par une amélioration de la résistance d’alliage et la résistance au grossissement des précipités de durcissement dans la microstructure.
Les alliages d'Al-Si-Cu-Mg tels que les alliages 354 (Al-9% Si-1,8% Cu-0,5% Mg, en poids) montrent une plus grande réponse au traitement thermique en raison de la présence de Mg et de Cu. Ces types d'alliage présentent d'excellentes valeurs en résistance aux températures basses et hautes. Les ajouts de Zr, Ni, Mn et Sc devraient maintenir la performance de ces alliages à des températures encore plus élevées. La présente étude a donc été réalisée pour étudier les effets des ajouts de Zr, Ni, Mn et Sc, individuellement ou en combinaison, sur la microstructure et les
ii
propriétés de traction de l'alliage de fonderie 354 à température ambiante et à haute température (250 °C) en utilisant différentes temps de maintien à la température de test. Nous avons préparé six alliages, en utilisant l'alliage 354 raffiné au Ti 0,2% en poids, comprenant l'alliage R (354 + 0,25% en poids de Zr) considéré comme l'alliage de base ou de référence et cinq autres, à savoir les alliages S, T, U, V et Z contenant diverses quantités de Ni, Mn, Sc et Zr, ajoutés individuellement ou en combinaison. À des fins de comparaison, un autre alliage (L) a été préparé à partir d'alliage 398 (Al-16% Si), rapporté pour donner d'excellentes propriétés à haute température, auxquelles ont été réalisés les mêmes niveaux d'ajouts de Zr et Sc, comme dans l'alliage Z.
Des barreaux de traction, en utilisant un moule permanent ASTM B-108, ont été préparés à partir des différents alliages 354. Les barres d'essai ont été traitées par mise en solution, en utilisant un traitement thermique à une étape ou à plusieurs étapes, suivi de la trempe dans l’eau tiède, puis un vieillissement artificiel en utilisant différents traitements de vieillissement (T5, T6, T62 et T7). Le traitement de mise en solution à une étape (ou SHT 1), était établie à une durée de 5 h à 495 °C et le traitement de mise en solution à plusieurs étapes (ou SHT 2), comprenait 5 h à 495 ° C, suivi de + 2 h à 515 ° C et terminé par + 2 h à 530 ° C.
Les essais de traction avec les barres d'essai brut de coulé et traités thermiquement ont été effectués à température ambiante à l'aide d'un taux de déformation de 4 x 10⁻⁴s-1. Cinq barres d'essai ont été utilisées par composition/condition thermique d'alliage. Dans ce cas, les barres d'essai ont été testées avec ou sans stabilisation préalable pendant 200 h à 250 °C. Les essais de traction à haute température ont été effectués à 250 °C, où les barres d'essai ont été stabilisées pendant 1 h et 200 h à 250 ° C avant l'essai.
Les analyses thermiques des différents alliages 354 ont été réalisées pour déterminer la séquence de réactions et de phases formées lors de la solidification dans des conditions de refroidissement proches de l'équilibre. Les principales réactions observées comprenaient la formation du réseau dendritique α-Al à 598 °C, suivie de la précipitation de la phase eutectique Al-Si et la phase β-Al 5FeSi post-eutectique à 560°C; la phase Mg2Si et la transformation de la phase β en phase π-Al 8Mg3FeSi6 à 540 °C et 525 °C; et enfin, la précipitation de Al 2Cu et Q-Al5Mg8Cu2Si6 presque simultanément à 498 °C et 488 °C. En raison du faible taux de solidification des pièces moulées durant l’analyse thermique et d'une teneur en Zr de 0,25% en poids, tous les alliages contenant du Zr sont situés dans la région L + Al3Zr du diagramme de phase Al-Zr pendant l'étape de fusion. Trois réactions principales sont détectées avec l'addition de Ni, c'est-à-dire la formation de phases AlFeNi, AlCuNi et AlSiNiZr. De plus grandes tailles de particules de phase AlFeNi et AlCuNi sont observées dans l'alliage T avec sa teneur en Ni supérieure de 4% en poids, par rapport à celles observées dans l'alliage S à 2% de teneur en Ni. L'ajout de Mn dans l'alliage U contribue à réduire les effets néfastes de la phase β-fer en le remplaçant par les phases intermétalliques du fer en forme script chinoise et de boues α-Al 15(Fe,Mn)3Si2. Les phases intermetalliques du Sc observées dans cette étude apparaissent sous deux formes différentes: (Al, Ti) (Sc, Zr) et (Al, Si) (Sc, Zr, Ti). Avec l'utilisation du traitement en solution multi-étapes - impliquant des températures de solution plus élevées et des durées plus longues, une quantité accrue de fusion initiale devrait se produire. Le grossissement des particules de Si est également observée; les particules plus grandes augmentant aux dépens des plus petites. Des particules primaires de Si sont observées dans la microstructure de l'alliage hypereutectique L avec sa teneur élevée en Si de 16% en poids.
iii
Les données de traction ont montré que l'UTS et le pourcentage d'allongement des alliages R, S, T, U, V et Z augmentaient avec le traitement thermique de mise en solution à une étape par rapport à l'état brut de coulé. Le traitement thermique de mise en solution multi-étapes a montré des propriétés de traction plus élevées que celles obtenues avec le traitement SHT 1. L'utilisation du traitement T62, en incorporant le traitement en solution SHT 2, permet une dissolution maximale des phases de cuivre dans les multi-étapes du traitement de mise en solution, ce qui entraîne une amélioration maximale pour les UTS et YS. Sans stabilisation, les traitements T6 et T62 fournissent les meilleures améliorations pour les valeurs UTS et YS de tous les alliages. Les meilleures propriétés de traction des alliages testés à température ambiante après stabilisation à 250 °C pendant 200 h, sont obtenues avec le traitement thermique T6. Après le traitement T62, l’alliage U (contenant 0,75% en poids de Mn + 0,25% en poids de Zr) a montré l'augmentation maximale des valeurs UTS et YS.
L'ajout d’élément d'alliages tel que Zr, Ni, Mn et Sc à un alliage 354 (Al-Si) améliore les propriétés de traction à haute température. L'alliage S (Al 354 + 0.25wt% Zr + 2wt% Ni) et l'alliage U (Al 354 + 0.25wt% Zr + 2wt% Ni) se comportent mieux en cas de conditions à haute température, avec une stabilisation d'une heure à 250 °C. Après 200 heures de stabilisation à 250 °C, la résistance des alliages traités avec T6 est considérablement réduite tandis que la ductilité augmente, l'alliage R représentant le pourcentage d'allongement le plus élevé, ~19%, suivi de l'alliage Z avec une ductilité de ~16%. La réduction de la résistance peut être attribuée à l'adoucissement de l'alliage, qui se produit après un aussi long temps de stabilisation à la température de test élevée. Bien que l'alliage L traité avec T6 affiche de bonnes valeurs de résistance, par rapport aux alliages 354 aux mêmes conditions de test à haute température, sa ductilité est de ~2,45% par rapport à l'alliage S qui produit une résistance à la traction similaire mais a une ductilité de ~6,5%. La réduction de la résistance peut être attribuée à l'adoucissement de l'alliage qui se produit après un si long temps de stabilisation à la température de test élevée.
ABSTRACT
In recent years, aluminum and aluminum alloys have been widely used in automotive and aerospace industries. Among the most commonly used cast aluminum alloys are those belonging to the Al-Si system. Due to their mechanical properties, light weight, excellent castability and corrosion resistance, these alloys are primarily used in engineering and in automotive applications. The more aluminum is used in the production of a vehicle, the less the weight of the vehicle, and the less fuel it consumes, thereby reducing the amount of harmful emissions into the atmosphere.
The principal alloying elements in Al-Si alloys, in addition to silicon, are magnesium and copper which, through the formation of Al2Cu and Mg2Si precipitates, improve the alloy strength via precipitation hardening following heat treatment. However, most Al-Si alloys are not suitable for high temperature applications because their tensile and fatigue strengths are not as high as desired in the temperature range 230-350°C, which are the temperatures that are often attained in automotive engine components under actual service conditions. The main challenge lies in the fact that the strength of heat-treatable cast aluminum alloys decreases at temperatures above ~200°C. The Mg2Si and Al2Cu precipitates that maintain the high strength of the alloy usually coarsen or dissolve at temperatures above 150°C, resulting in reduced high temperature performance and consequently limited practical applications. Most Al-Si cast alloys to date are intended for applications at temperatures no higher than about 230°C.
The strength of alloys under high temperature conditions is improved by obtaining a
microstructure containing thermally stable and coarsening-resistant intermetallics, which may be achieved with the addition of Ni. Zr and Sc. Nickel leads to the formation of nickel aluminide Al 3Ni and Al9FeNi in the presence of iron, while zirconium forms Al3Zr. These intermetallics improve the high temperature strength of Al–Si alloys. Some interesting improvements have been achieved by modifying the composition of the base alloy with additions of Mn, resulting in an increase in strength and ductility at both room and high temperatures. The principle effects that can be obtained by adding scandium to aluminium alloys are grain refinement and precipitation hardening from Al3Sc particles. Addition of Zr together with Sc is found to improve alloy strength and coarsening resistance.
Al-Si-Cu-Mg alloys such as the 354 (Al-9wt%Si-1.8wt%Cu-0.5wt%Mg) alloys show a
greater response to heat treatment as a result of the presence of both Mg and Cu. These alloy types display excellent strength values at both low and high temperatures. Additions of Zr, Ni, Mn and Sc would be expected to maintain the performance of these alloys at still higher temperatures. The present study was thus carried out to investigate the effect of Zr, Ni, Mn, and Sc additions, individually or in combination, on the microstructure and tensile properties of 354 casting alloy at ambient and at high temperature (250°C) using different holding times at testing temperature. Six alloys were prepared using 0.2 wt% Ti grain-refined 354 alloy, comprising alloy R (354 + 0.25wt% Zr ) considered as the base or reference alloy, and five others, viz., alloys S, T, U, V, and Z containing various amounts of Ni, Mn, Sc and Zr, added individually or in combination. For comparison purposes, another alloy L was prepared from 398 (Al-16%Si) alloy, reported to give excellent high temperature properties, to which the same levels of Zr and Sc additions were made, as in alloy Z.
Tensile test bars were prepared from the different 354 alloys using an ASTM B-108 permanent mold. The test bars were solution heat treated using a one-step or a multi-step solution heat treatment, followed by quenching in warm water, and then artificial aging employing different aging treatments (T5, T6, T62 and T7). The one-step (or SHT 1) solution treatment consisted of 5 h @ 495 °C) and the multi-step (or SHT 2) solution treatment comprised 5 h @ 495°C + 2 h @ 515°C + 2 h @ 530°C.
v
Tensile testing of the as-cast and heat-treated test bars was carried out at room temperature using a strain rate of 4 x 10⁻⁴s-1. Five test bars were used per alloy composition/condition. In this case, the test bars were tested with or without prior stabilization for 200 h at 250 °C. The high temperature tensile testing was carried out at 250 °C, where the test bars were stabilized for 1 h and 200 h at 250 °C prior to testing.
Thermal analysis of the various 354 alloy melts was carried out to determine the sequence of reactions and phases formed during solidification under close-to-equilibrium cooling conditions. The main reactions observed comprised formation of the α-Al dendritic network at 598°C followed by precipitation of the Al-Si eutectic and post-eutectic β-Al 5FeSi phase at 560°C; Mg2Si phase and transformation of the β-phase into π-Al 8Mg3FeSi6 phase at 540°C and 525°C; and lastly, precipitation of Al2Cu and Q-Al5Mg8Cu2Si6 almost simultaneously at 498°C and 488°C. As a result of the low solidification rate of the thermal analysis castings, and a Zr content of 0.25 wt%, all Zr-containing alloys are located in the L + Al3Zr region of the Al-Zr phase diagram during the melting stage. Three main reactions are detected with the addition of Ni, i.e., the formation of AlFeNi, AlCuNi and AlSiNiZr phases. Larger sizes of AlFeNi and AlCuNi phase particles were observed in T alloy with its higher Ni content of 4 wt%, when compared to those seen in S alloy at 2% Ni content. Mn addition in Alloy U helps in reducing the detrimental effect of the β-iron phase by replacing it with the less-detrimental Chinese script α-Al 15(Fe,Mn)3Si2 phase and sludge particles. The Sc-intermetallic phases observed in this study appeared in two different forms: (Al,Ti)(Sc,Zr) and (Al,Si)(Sc,Zr,Ti). With the use of the multi-step solution treatment – involving higher solution temperatures and longer durations, an increased amount of incipient melting is expected to occur. Coarsening of the Si particles is also observed; with larger particles growing bigger at the expense of smaller ones. Primary Si particles are observed in the microstructure of the hypereutectic alloy L with its high Si content of 16 wt%.
The tensile data showed that UTS and percent elongation of R, S, T, U, V and Z alloys increased in the one-step solution heat-treated condition compared to the as-cast case. The multi-step solution heat treatment displayed higher tensile properties than those achieved with SHT 1 treatment. The use of the T62 treatment, incorporating the SHT 2, allows for maximum dissolution of the copper phases in the multiple stages of solution treatment, resulting in the greatest improvement in both UTS and YS. Without stabilization, T6 and T62 treatments provide the best improvements in both UTS and YS values of all alloys. The best tensile properties of alloys tested at room temperature after stabilization at 250°C for 200 h are obtained with the T6 heat treatment. After T62 treatment, Alloy U (containing 0.75wt% Mn + 0.25wt% Zr) showed the maximum increase in UTS and YS values.
The addition of Zr, Ni, Mn and Sc to Al-Si alloys improves the high temperature tensile properties of the 354 alloy. Alloy S (Al 354 + 0.25wt% Zr + 2wt% Ni) and alloy U (Al 354 + 0.25wt% Zr + 2wt% Ni) perform better in case of high temperature conditions, with one hour stabilization at 250°C. After 200 hours stabilization at 250°C, the strength of the T6-treated alloys is reduced considerably, while the ductility is increased, with alloy R showing the highest percent elongation, ~19%, followed by Z alloy with a ductility of ~16%. The reduction in strength may be attributed to the alloy softening which occurs after such long stabilization time at the high testing temperature. Although the T6-treated L alloy displays good strength values, in comparison with the 354 alloys at the same high temperature testing conditions, its ductility is ~2.45% compared to alloy S which produces similar tensile strength but has a ductility of ~6.5%. The reduction in strength may be attributed to the alloy softening which occurs after such long stabilization time at the high testing temperature.
ACKNOWLEDGMENTS
First and foremost I want to thank my advisor Professor F.H. Samuel. It has been an
honor to be his student. I appreciate all his contributions of time, ideas, and funding to
make my MSc. experience productive and stimulating. I would also like to thank Professor
A.M Samuel for her continuous guidance and support and for providing me helpful
suggestions in improving the quality of my thesis. Without their continuous guidance and
support it would have been impossible to complete my Master's degree.
For this dissertation I would like to thank the committee members: Professor A.M.
Samuel and Dr. A.M. Mohamed for their time, interest, and helpful comments.
It is a pleasure to thank all those who have contributed in any way to the
completion of this study: Dr. Emad El-gallad and Dr. Mohamed Ibrahim co-supervisors of
TAMLA Group for helping and guiding me in experimental work;
Financial support in the form of scholarships received from the Natural Sciences
and Engineering Research Council of Canada (NSERC), General Motors Powertrain
Group (U.S.A), and Corporativo Nemak (Mexico) is gratefully acknowledged.
Lastly, I would like to thank my family: my parents and my two sisters for all their
love and encouragement, especially my mother Hanan Hafez who raised me with a love of
science and supported me in all my pursuits. And most of all for my loving, supportive,
encouraging, and patient wife Mariam Emad whose faithful support during the final stages
of my MSc. is so appreciated. Thank you!
Loay Hesham Alyaldin UQAC April 2017
0 Table of Contents
RÉSUMÉ…………………………………………………...……………………………...i
ABSTRACT………………………………………………………….…………………...iv
ACKNOWLEDGMENTS…………………………………………………..…………...vi
TABLE OF CONTENTS………………………………….…………………….............vii
LIST OF FIGURES……………………………………………………………………….x
LIST OF TABLES………………………………………………………………………xiv
CHAPTER 1 DEFINING THE PROBLEM ..................................................................... 1
1.1 INTRODUCTION ................................................................................................... 2
1.2 OBJECTIVES .......................................................................................................... 6
1.3 THESIS LAYOUT .................................................................................................. 7
CHAPTER 2 LITERATURE SURVEY ............................................................................ 8
2.1 INTRODUCTION ................................................................................................... 9
2.2 ALUMINUM CAST ALLOYS ............................................................................... 9
2.3 ALUMINUM-SILICON CAST ALLOYS ............................................................ 11
2.3.1 Role of alloying elements in Al-Si alloys ............................................................ 13
2.4 EFFECT OF ALLOYING ELEMENTS ON Al-Si ALLOYS .............................. 18
2.4.1 Zirconium (Zr) ..................................................................................................... 18
2.4.2 Nickel (Ni) ........................................................................................................... 19
2.4.3 Manganese (Mn) .................................................................................................. 20
2.4.4 Scandium (Sc) ...................................................................................................... 21
2.4.5 Strontium (Sr)....................................................................................................... 22
2.4.6 Titanium (Ti) ........................................................................................................ 23
2.5 HEAT TREATMENT OF Al-Si-Cu-Mg ALLOYS .............................................. 23
2.5.1 Solution Heat Treatment ...................................................................................... 24
2.5.2 Quenching ............................................................................................................ 26
2.5.3 Age Hardening Treatment .................................................................................... 27
2.6 MICROSTRUCTURE OF Al–Si–Cu–Mg ALLOYS ........................................... 29
2.7 MECHANICAL PROPERTIES OF Al-Si ALLOYS ........................................... 32
viii
2.7.1 Effect of additives on high temperature mechanical properties of Al-Si-Cu-Mg alloys .................................................................................................................... 34
2.8 FRACTOGRAPHY ............................................................................................... 36
2.9 QUALITY CHARTS ............................................................................................. 39
CHAPTER 3 EXPERIMENTAL PROCEDURES ......................................................... 42
3.1 INTRODUCTION ................................................................................................. 43
3.2 CLASSIFICATION OF ALLOYS ........................................................................ 44
3.3 MELTING AND CASTING PROCEDURES ...................................................... 44
3.4 HEAT TREATMENT ........................................................................................... 47
3.5 TENSILE TESTING ............................................................................................. 50
3.6 CHARACTERIZATION OF MICROSTRUCTURE ........................................... 51
3.6.1 Thermal Analysis ................................................................................................. 51
3.6.2 Optical Microscopy .............................................................................................. 53
3.6.3 Scanning Electron Microscopy ............................................................................ 56
CHAPTER 4 MICROSTRUCTURE CHARACTERIZATION AND POROS ITY FORMATION ..................................................................................... 58
4.1 INTRODUCTION ................................................................................................. 59
4.2 THERMAL ANALYSIS ....................................................................................... 59
4.2.1 Alloy R (354 + 0.25%Zr) ..................................................................................... 61
4.2.2 Alloy S (354 + 0.25%Zr + 2%Ni) ........................................................................ 63
4.2.3 Alloy T (354 + 0.25%Zr + 4%Ni) ........................................................................ 64
4.2.4 Alloy U (354 + 0.25%Zr + 0.75%Mn) ................................................................. 66
4.2.5 Alloy V (354 + 0.25%Zr + 0.75%Mn + 2%Ni) ................................................... 68
4.2.6 Alloy Z (354 + 0.25%Zr + 0.15%Sc) ................................................................... 70
4.2.7 Alloy L (398 + 0.25%Zr + 0.15%Sc) ................................................................... 72
4.3 POROSITY FORMATION DUE TO INCIPIENT MELTING ............................ 74
CHAPTER 5 ROOM AND HIGH TEMPERATURE TENSILE PROPERT IES ...... 90
5.1 INTRODUCTION ................................................................................................. 91
5.2 ROOM TEMPERATURE TENSILE PROPERTIES (AS-CAST AND SOLUTION HEAT-TREATED CONDITIONS) ................................................. 92
5.3 INFLUENCE OF ALLOYING ADDITIONS AND HEAT TREATMENT CONDITIONS ....................................................................................................... 97
5.4 TENSILE PROPERTIES OF ALLOYS R, S AND U AT ROOM TEMPERATURE ................................................................................................ 108
5.4.1 Alloy R (354 + 0.25wt% Zr) .............................................................................. 108
ix
5.4.2 Alloy S (354 + 0.25wt% Zr + 2wt% Ni) ............................................................ 111
5.4.3 Alloy U (354 + 0.25wt% Zr + 0.75wt% Mn) ..................................................... 114
5.4.4 Quality charts for Alloys R, S and U - room temperature tensile data ............... 116
5.4.5 Effect of Zr and Sc addition to 354 and 398 alloys ............................................ 118
5.4.6 Statistical analysis .............................................................................................. 122
5.5 TENSILE PROPERTIES OF ALLOYS R, S AND U AT HIGH TEMPERATURE ................................................................................................ 126
5.5.1 Alloy R (354 + 0.25wt% Zr) .............................................................................. 126
5.5.3 Alloy S (354 + 0.25wt% Zr + 2wt% Ni) ............................................................ 129
5.5.4 Alloy U (354 + 0.25wt% Zr + 0.75wt% Mn) ..................................................... 131
5.5.5 Quality charts of Alloys R, S and U - high temperature tensile data ................. 133
5.5.6 Comparison between the high temperature tensile properties of as-cast and T6-treated 354 alloy with different alloying additions and a new alloy .................. 138
5.5.7 Statistical analysis .............................................................................................. 149
CHAPTER 6 CONCLUSIONS ....................................................................................... 153
RECOMMENDATIONS FOR FUTURE WORK………………...………….………159
REFERENCES…………………………………………………………..……………...161
LIST OF FIGURES
CHAPTER 2 Figure 2.1 The binary equilibrium phase diagram of the Al-Si alloy system. ..................... 12
Figure 2.2 Diagram representing precipitation stages with aging time. .............................. 15
Figure 2.3 Schematic of the T6 heat treatment process. ...................................................... 24
Figure 2.4 Schematic phase diagram of a heat-treatable alloy, showing temperature ranges for solutionizing and for aging and showing amount of solute precipitated during aging. ..................................................................................................... 26
Figure 2.5 Comparison of the silicon morphology in: (a) unmodified and (b) Sr-modified (300 ppm Sr), near-eutectic aluminum-silicon alloys. ...................................... 31
Figure 2.6 α-Fe and β-Fe intermetallic phases precipitated in Al 354 alloys. ..................... 32
Figure 2.7 Stress-strain curve. ............................................................................................. 33 Figure 2.8 Schematic diagram showing brittle vs ductile stress-strain behavior . ............... 37
Figure 2.9 Photographs showing (a) ductile vs (b) brittle specimens. ................................. 37
Figure 2.10 SEM images showing (a) a ductile fracture surface exhibiting a dimpled structure, and (b) a brittle fracture surface, showing how fracture occurs through the cracking of particles (arrowed). ..................................................... 39
Figure 2.11 Example of the quality chart proposed by Drouzy et al. [115] with iso-Q and iso-YS lines generated using Equations 1 and 2. ............................................... 41
CHAPTER 3 Figure 3.1 Electrical resistance furnace. .............................................................................. 45 Figure 3.2 Graphite degassing impeller. .............................................................................. 45 Figure 3.3 ASTM B-108 permanent mold used for casting tensile test bars. ...................... 46
Figure 3.4 Dimensions of the tensile test bar (in mm). ........................................................ 46
Figure 3.5 Lindberg Blue M electric furnace. ..................................................................... 48 Figure 3.6 (a) MTS mechanical testing machine for room temperature testing, and (b)
Instron Universal mechanical testing machine for high temperature testing. ... 51
Figure 3.7 Schematic drawing showing the graphite mold used for thermal analysis. ....... 53
Figure 3.8 Thermal analysis set-up. ..................................................................................... 53 Figure 3.9 Diagram showing the sectioned area for analysis of tensile samples using optical
microscopy. ....................................................................................................... 54 Figure 3.10 Struers LaboPress-3 and TegraForce-5 machines for mounting and polishing of
metallography samples. ..................................................................................... 55 Figure 3.11 Clemex Vision PE 4.0 image analyzer-optical microscope system. ................ 56
Figure 3.12 Scanning electron microscope system used in this study. ................................ 57
Figure 3.13 Field emission scanning electron microscope used in this study. .................... 57
CHAPTER 4 Figure 4.1 Temperature-time plot and first derivative obtained from the thermal analysis of
Alloy R (354 + 0.25% Zr). ................................................................................ 62
xi
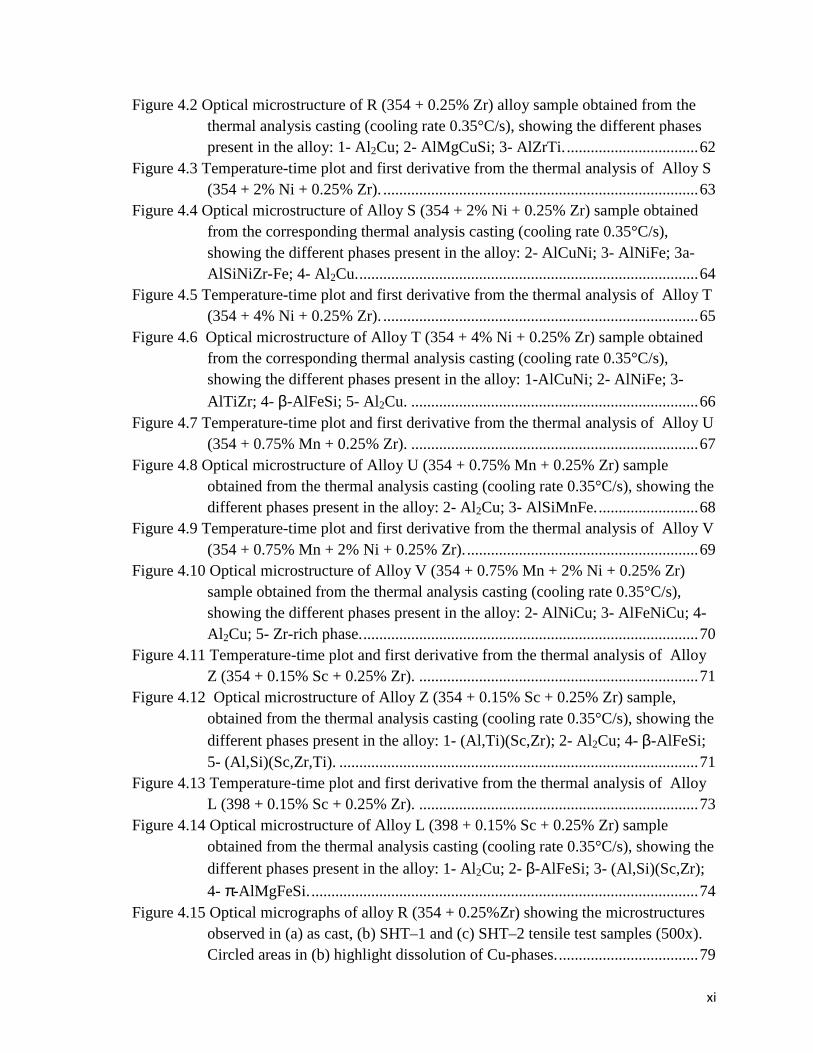
Figure 4.2 Optical microstructure of R (354 + 0.25% Zr) alloy sample obtained from the thermal analysis casting (cooling rate 0.35°C/s), showing the different phases present in the alloy: 1- Al2Cu; 2- AlMgCuSi; 3- AlZrTi. ................................. 62
Figure 4.3 Temperature-time plot and first derivative from the thermal analysis of Alloy S (354 + 2% Ni + 0.25% Zr). ............................................................................... 63
Figure 4.4 Optical microstructure of Alloy S (354 + 2% Ni + 0.25% Zr) sample obtained from the corresponding thermal analysis casting (cooling rate 0.35°C/s), showing the different phases present in the alloy: 2- AlCuNi; 3- AlNiFe; 3a- AlSiNiZr-Fe; 4- Al2Cu. ..................................................................................... 64
Figure 4.5 Temperature-time plot and first derivative from the thermal analysis of Alloy T (354 + 4% Ni + 0.25% Zr). ............................................................................... 65
Figure 4.6 Optical microstructure of Alloy T (354 + 4% Ni + 0.25% Zr) sample obtained from the corresponding thermal analysis casting (cooling rate 0.35°C/s), showing the different phases present in the alloy: 1-AlCuNi; 2- AlNiFe; 3- AlTiZr; 4- β-AlFeSi; 5- Al2Cu. ........................................................................ 66
Figure 4.7 Temperature-time plot and first derivative from the thermal analysis of Alloy U (354 + 0.75% Mn + 0.25% Zr). ........................................................................ 67
Figure 4.8 Optical microstructure of Alloy U (354 + 0.75% Mn + 0.25% Zr) sample obtained from the thermal analysis casting (cooling rate 0.35°C/s), showing the different phases present in the alloy: 2- Al2Cu; 3- AlSiMnFe. ......................... 68
Figure 4.9 Temperature-time plot and first derivative from the thermal analysis of Alloy V (354 + 0.75% Mn + 2% Ni + 0.25% Zr). .......................................................... 69
Figure 4.10 Optical microstructure of Alloy V (354 + 0.75% Mn + 2% Ni + 0.25% Zr) sample obtained from the thermal analysis casting (cooling rate 0.35°C/s), showing the different phases present in the alloy: 2- AlNiCu; 3- AlFeNiCu; 4- Al 2Cu; 5- Zr-rich phase. .................................................................................... 70
Figure 4.11 Temperature-time plot and first derivative from the thermal analysis of Alloy Z (354 + 0.15% Sc + 0.25% Zr). ...................................................................... 71
Figure 4.12 Optical microstructure of Alloy Z (354 + 0.15% Sc + 0.25% Zr) sample, obtained from the thermal analysis casting (cooling rate 0.35°C/s), showing the different phases present in the alloy: 1- (Al,Ti)(Sc,Zr); 2- Al2Cu; 4- β-AlFeSi; 5- (Al,Si)(Sc,Zr,Ti). .......................................................................................... 71
Figure 4.13 Temperature-time plot and first derivative from the thermal analysis of Alloy L (398 + 0.15% Sc + 0.25% Zr). ...................................................................... 73
Figure 4.14 Optical microstructure of Alloy L (398 + 0.15% Sc + 0.25% Zr) sample obtained from the thermal analysis casting (cooling rate 0.35°C/s), showing the different phases present in the alloy: 1- Al2Cu; 2- β-AlFeSi; 3- (Al,Si)(Sc,Zr);
4- π-AlMgFeSi. ................................................................................................. 74 Figure 4.15 Optical micrographs of alloy R (354 + 0.25%Zr) showing the microstructures
observed in (a) as cast, (b) SHT–1 and (c) SHT–2 tensile test samples (500x). Circled areas in (b) highlight dissolution of Cu-phases. ................................... 79
xii
Figure 4.16 Optical micrographs of Alloy S (354 + 0.25% Zr + 2% Ni) showing the microstructures observed in (a) as cast, (b) SHT–1 and (c) SHT–2 tensile test samples (500x). ................................................................................................. 81
Figure 4.17 Optical micrographs of Alloy T (354 + 0.25%Zr + 4%Ni) showing the microstructures observed in (a) as cast, (b) SHT–1 and (c) SHT–2 tensile test samples (500x). ................................................................................................. 82
Figure 4.18 Optical micrographs of Alloy U (354 + 0.25%Zr + 0.75%Mn) showing the microstructures observed in (a) as cast, (b) SHT–1 and (c) SHT–2 tensile test samples (500x). ................................................................................................. 84
Figure 4.19 Optical micrographs of Alloy V (354 + 0.25%Zr + 0.75%Mn + 2%Ni) showing the microstructures observed in (a) as cast, (b) SHT–1 and (c) SHT–2 tensile test samples (500x). ............................................................................... 85
Figure 4.20 Optical micrographs of Alloy Z (354 + 0.25%Zr + 0.15%Sc) showing the microstructures observed in (a) as cast, (b) SHT–1 and (c) SHT–2 tensile test samples (500x). ................................................................................................. 87
Figure 4.21 Optical micrographs of Alloy L (398 + 0.25%Zr + 0.15%Sc) showing the microstructures observed in (a, b) as cast, (c) SHT–1 and (d) SHT–2 tensile test samples at 500X magnification. Circled areas in (c) and (d) highlight dissolution of phases. ........................................................................................ 89
CHAPTER 5 Figure 5.1 Mean values for UTS, YS, % El for Alloys R, S, T, U and V in the as-cast and
SHT 1 and SHT 2 solution heat-treated conditions. ......................................... 95
Figure 5.2 Quality chart showing relationship between UTS and percent elongation for the 354 alloys investigated in the as-cast and SHT 1 and SHT 2 solution heat treated conditions. ............................................................................................. 96
Figure 5.3 Mean values for UTS, YS, % El for Alloys R, S, T, U and V obtained under the given heat treatment conditions (without stabilization). ................................. 100
Figure 5.4 Mean values of UTS, YS, % El for Alloys R, S, T, U and V obtained under the given heat treatment conditions (after 200 hours stabilization at 250°C). ...... 101
Figure 5.5 Quality index-color contour charts for Alloys R, S, T, U and V obtained from room temperature tensile testing data: (a) without stabilization, and (b) after 200 h stabilization at 250°C ............................................................................ 105
Figure 5.6 Probable yield strength-color contour charts for Alloys R, S, T, U and V obtained from room temperature tensile testing data: (a) without stabilization, and (b) after 200 h stabilization at 250°C. ...................................................... 107
Figure 5.7 Mean values for UTS, YS, % El for Alloy R at the given heat treatment condition: (a) without, and (b) after 200 h stabilization at 250°C prior to testing. ............................................................................................................. 110
Figure 5.8 Mean values for UTS, YS, % El for Alloy S at the given heat treatment condition: (a) without, and (b) after 200 h stabilization at 250°C prior to testing. ............................................................................................................. 113
xiii
Figure 5.9 Mean values for UTS, YS, % El for Alloy U at the given heat treatment condition: (a) without, and (b) after 200 h stabilization at 250°C prior to testing. ............................................................................................................. 115
Figure 5.10 Quality charts showing UTS vs % El plots for Alloys R, S and U subjected to various heat treatment conditions, and tested at room temperature without and with 200 h stabilization at 250°C prior testing. .............................................. 117
Figure 5.11 Comparison of tensile test data of Alloys R, S, U, Z and Alloy L listed in Table 5.4 (Room temperature tensile testing). .......................................................... 121
Figure 5.12 Comparison of tensile properties of R, S and U alloys relative to those of as-cast base alloy R: (a) UTS, (b) YS, and (c) %El without, and after 200h stabilization at 250°C. ..................................................................................... 125
Figure 5.13 Mean values for UTS, YS, % El for alloy R at the given heat treatment conditions for; (a) One and (b) 200 hours stabilization at 250°C. .................. 128
Figure 5.14 Mean values for UTS, YS, % El for alloy S at the given heat treatment conditions for; (a) One and (b) 200 hours stabilization at 250°C. .................. 130
Figure 5.15 Mean values for UTS, YS, % El for alloy U at the given heat treatment conditions for; (a) One and (b) 200 hours stabilization at 250°C. .................. 132
Figure 5.16 Quality charts showing UTS vs % El plots for Alloys R, S and U subjected to various heat treatment conditions (testing at 250°C after 1h stabilization). ... 135
Figure 5.17 Quality charts showing UTS vs % El plots for Alloys R, S and U subjected to various heat treatment conditions (testing at 250°C after 200h stabilization). ......................................................................................................................... 136
Figure 5.18 Relevant part of Figure 5.17 rescaled to distinguish the contour lines obtained for Alloys R, S and U. ..................................................................................... 137
Figure 5.19 Comparison of tensile test data of Alloys R, S, U, Z and Alloy L listed in Table 5.5 (tested at 250°C after 1 h stabilization)..................................................... 141
Figure 5.20 Comparison of tensile test data of Alloys R, S, U, Z and Alloy L listed in Table 5.6 (tested at 250°C after 200 h stabilization)................................................. 142
Figure 5.21 Comparison of the precipitates observed in Alloy U tested at 250 °C, after (a) 1 hr, and (b) 200 hrs stabilization at testing temperature. .................................. 145
Figure 5.22 Quality charts showing UTS vs %El plots for Alloys R, S, U, Z and L in the as-cast and T6-heat treated conditions (testing at 250°C after 1 h stabilization at testing temperature). ....................................................................................... 147
Figure 5.23 Quality charts showing UTS vs %El plots for Alloys R, S, U, Z and L in the as-cast and T6 heat-treated conditions (testing at 250°C after 200 h stabilization at testing temperature). ............................................................... 148
Figure 5.24 Comparison of high temperature tensile properties of R, S and U alloys relative to those of the as-cast base alloy: (a) UTS, (b) YS, and (c) %El after 1 h and 200 h stabilization at 250°C. ........................................................................... 152
LIST OF TABLES
CHAPTER 2 Table 2.1 Cast aluminum alloy designation. ........................................................................ 11 Table 2.2 Common aluminum heat treatment designations ................................................ 29 CHAPTER 3 Table 3.1 Chemical composition of the as-received 354 alloy ............................................ 45
Table 3.2 Chemical composition of the alloys used in this study. ....................................... 47
Table 3.3 Summary of the heat treatment and testing conditions at room and high temperatures ........................................................................................................ 49
CHAPTER 4 Table 4.1 Suggested main reactions occurring during solidification of 354-type alloys .... 60
Table 4.2 Porosity measurements for Alloys R, S, T, U, V, Z and L. ................................. 76
CHAPTER 5 Table 5.1 Mean values for UTS, YS, %El for alloys R, S, T, U, V, Z and L subjected to
different heat treatment conditions and tested at ambient temperature; Q values obtained using Equation 1 ................................................................................... 94
Table 5.2 Mean values of UTS, YS, %El obtained at room temperature (without stabilization) for Alloys R, S, T, U and V subjected to different heat treatment conditions; Q and Probable YS values were obtained using Eqns 1 and 2 ........ 98
Table 5.3 Mean values of UTS, YS, %El obtained at room temperature (after 200h/250°C stabilization) for Alloys R, S, T, U and V subjected to different heat treatment conditions; Q and Probable YS values were obtained using Eqns 1 and 2 ......... 99
Table 5.4 Comparison of tensile properties of Alloys R, S, U, Z and L (tested at room temperature without stabilization) ..................................................................... 120
Table 5.5 Comparison of high temperature tensile properties of Alloys R, S, U, Z and L (tested at 250°C after 1 h stabilization at testing temperature) ......................... 139
Table 5.6 Comparison of high temperature tensile properties of Alloys R, S, U, Z and L (tested at 250°C after 200 h stabilization at testing temperature). .................... 140
Table 5.7 High temperature tensile properties of reference alloy R, (tested at 250°C after 1 and 200 h stabilization at testing temperature) .................................................. 149

1 CHAPTER 1
DEFINING THE PROBLEM
CHAPTER 1
DEFINING THE PROBLEM
1.1 INTRODUCTION
Aluminum is one of the most versatile of the common foundry metals, with cast
products consuming, as a world average, ~20% of this metal. Apart from the light weight,
the special advantages of aluminum alloys for castings are their relatively low melting
temperatures, negligible solubility for all gases except hydrogen, and the good surface
finish that is usually achieved with the final products. Most alloys also display good
fluidity and compositions can be selected with solidification ranges appropriate to
particular applications.
The first casting alloy used in America was an Al-8% Cu composition, known as
No. 12 alloy. An Al-10% Cu alloy (No. 122) was used for automotive pistons and cylinder
heads. In 1909, Alfred Wilm discovered that an Al-4.5%Cu-0.5%Mn alloy would
strengthen by aging, after a quench from an elevated temperature. This alloy was called
“Duralumin” and formed the basis for the Al-Cu family of alloys used today. The Al-Cu
alloys have excellent mechanical properties; but they are difficult to cast primarily because
of hot cracking. As the years went by, foundrymen discovered that additions of other
elements, especially silicon, improved alloy castability. For this reason, cast Al-Cu alloys
have been largely supplanted by cast Al-Cu-Si and Al-Si alloys [1].

3
During the past few decades, the automotive industry has shown a great interest in
aluminum for its applications. Today aluminum is an essential material in car
manufacturing and its alloys are actually used in the components of cylinder blocks,
pistons and other engine parts. It is believed that 1 kg of aluminum can replace up to 2 kg
of steel and cast iron in many areas of application [2]. The more aluminum alloys are used
in the production of a vehicle, the less the weight of the vehicle is, and the less fuel it will
consume, thereby reducing the amount of harmful emissions into the atmosphere. Actually,
as an industry, scientific researches must follow the needs of the designers. So they are
required to be at the same point of thinking with the designers, and to appreciate the
boundary conditions and constraints of their work. Secondly, the casting industry should
have the means and tools to tailor and optimize alloys for specific
performance/applications. As pointed out above, developing alloys for specific processes is
not the norm, although it should be taken into consideration. Therefore, it is important to
optimize the performance attained from specific processes by ensuring that the alloys
processed are optimized to take advantage of the merits of the particular process.
Today, we have predictive tools that enable us to work in a much more intelligent
and effective way than in years past. The trial and error approach of alloy development is
not only ineffective but also economically unsustainable. Cast components undergo post-
processing operations, such as heat-treating, etc. In complex alloys, the range of elemental
composition may make all the difference during heat-treating. Predictive tools mitigate, if
not prevent, the occurrence of incidences such as incipient melting. So it is not only during
the alloy and processing stages that these enabling tools are useful, but also during post-
processing operations.
4
For aluminum alloys, the principle alloying elements, in addition to silicon (Si), are
magnesium (Mg) and copper (Cu). However, most Al-Si alloys are not suitable for high
temperature applications because their tensile and fatigue strengths are not as high as
desired in the temperature range 230-350°C, a range often observed under service
conditions. Most of the Al-Si cast alloys to date are intended for applications at
temperatures no higher than about 230°C; however, some interesting improvements have
been achieved by modifying the composition of the base alloy with the addition of Mn and
Ni, resulting in an increase in strength and ductility at both room and high temperatures.
Thus, there is a need in the automobile industry for developing a low-cost, high strength
aluminum alloy, exhibiting high wear resistance and a low coefficient of thermal
expansion, with better tensile and fatigue strength at temperatures of 260-370°C.
Iron is traditionally considered as a harmful element in Al–Si alloys since platelets
of the coarse and brittle lamellar β-iron Al5FeSi may be formed as a primary phase, when
the iron content is more than 0.5 wt.% [3]. It is found that the α-iron Al15(Fe, Mn)3Si2
phase can be formed, instead, if both Fe and Mn are added under certain solidification rates
[4]. Due to its Chinese script morphology, a certain amount of such α-Fe phase particles
indeed improve the tensile strength and retard the extension of micro-cracks during tensile
testing [3].
Zirconium has a low solubility in aluminum, and only small additions of Zr are
therefore necessary to form dispersoids. In many alloys, however, Al3Zr is heterogeneously
distributed, and in the areas where the number density of dispersoids is low, the alloy will
be prone to recrystallization [5]. The addition of transition elements such as Ni and Cu is
considered to be an effective way to improve the high temperature strength of cast Al-Si
5
alloys in as-cast and solution-treated conditions through the formation of stable aluminides.
Copper and magnesium as alloying elements are often added to improve alloy strength at
room temperature as well as at higher temperatures [6].
Hypoeutectic Al-Si-Cu-Mg alloys exhibit three main solidification reactions during
the solidification process, starting with the formation of α-Al dendrites followed by the
development of two main eutectic phases; eutectic silicon and secondary β-(Al, Si, Fe)
phase. The presence of alloying and impurity elements such as Cu, Mg, Mn, Fe leads to
more complex constituents, including intermetallic phases, that may be characterized by
metallographic techniques [7].
Heat-treatment is of major importance since it is commonly used to alter the
mechanical properties of cast aluminum alloys. Heat treatment improves the strength of
aluminum alloys through a process known as precipitation hardening, which occurs during
the heating and cooling of an aluminum alloy, and in which precipitates are formed in the
aluminum matrix. The improvement in the mechanical properties of Al alloys as a result of
heat treatment depends upon the change in solubility of the alloying constituents with
temperature [8].
A comprehensive study was carried out to investigate the effect of additions of Zr,
Ni, Mn and Sc on the microstructure and tensile properties of Al-Si-Cu-Mg 354 type alloys
at ambient and high temperatures. Generally, the mechanical properties and microstructure
of aluminum cast alloys are dependent on the composition, the melt treatment conditions,
the solidification rate, the casting process and the applied thermal treatment. All these
parameters were investigated in this study and the results obtained were analyzed in terms
6
of their effect on the microstructures and, hence, on the mechanical properties obtained for
the 354 alloys.
1.2 OBJECTIVES
The current study was carried out to analyze the effect of Ni, Mn, Zr and Sc
additions on the strength of cast aluminum alloy 354 (Al-9%Si-1.8%Cu-0.5%Mg), as well
as the effect of only Zr and Sc additions on the strength of cast aluminum alloy 398 (Al-
16%Si), at room and high temperatures for different holding times. The latter alloy was
examined solely for the purpose of comparing how the properties of the 354 alloys
investigated in this study stand with respect to the 398 alloy, an alloy developed by NASA
and reported to give superior high temperature properties [9].
The evolution of the microstructural features with the addition of the above alloying
elements and their consequent effect on the mechanical properties were investigated. Based
on this approach, the principal objectives of this study cover the following.
I. Examining the main microstructural features observed in the alloys, such as phases,
intermetallics, and precipitates, together with their identifying characteristics and
evolution during controlled exposure at different temperatures and times.
II. Determining the room temperature tensile properties of the alloys subjected to
different aging conditions (temperature and time).
III. Obtaining the high temperature tensile property values at different temperatures for
selected alloys or conditions based on the room temperature tensile testing results.
7
IV. Correlating the results obtained from the room temperature and high temperature
tensile tests with the principal microstructural features observed in the corresponding
alloy samples, in order to analyze and understand the major parameters involved in
the strengthening of alloy 354 at high temperatures.
V. Determining the effect of Zr and Sc as alloying element additions on the mechanical
properties of high-strength cast aluminum alloy 398 (Al-16%Si) and comparing the
properties obtained with those of 354 aluminum alloy.
1.3 THESIS LAYOUT
The structure of this thesis is presented in five chapters. Chapter 1 introduces the
research study which was carried out and defines its objectives. Chapter 2 presents the
literature review about the topic of this thesis. Chapter 3 describes the experimental
procedures and testing methods which were employed in the given research. Details of the
microstructural examination of the alloys investigated, identification and qualitative and
quantitative analyses are provided in Chapter 4. Chapter 5 presents the room and high-
temperature mechanical properties of the alloys. The results are discussed and analyzed in
terms of the microstructural data presented in Chapter 4. Chapter 6 presents conclusions,
followed by recommendations for future work. A list of references is provided at the end.

2 CHAPTER 2
LITERATURE SURVEY
CHAPTER 2
LITERATURE SURVEY
2.1 INTRODUCTION
It is known that aluminum alloys are developed with allowance for the effect of
each alloying element on the phase composition and structure from the standpoint of
obtaining the desired result, for example, raising the alloy strength or ductility or its high-
temperature performance. The alloying is used for providing the maximum possible
number of structural mechanisms that can cause an increase in the requisite properties. The
efficiency of alloying additions depends on the modifying and refining actions of the
alloying elements. A special feature of the alloying process is the possibility of formation
of new phases with a complex composition, which can influence the strength and ductility
characteristics.
2.2 ALUMINUM CAST ALLOYS
Aluminum casting alloys find wide use in several applications employed in
automotive, aerospace and other transportation industries [10-12]. Aluminum alloys have
about one-third of the density and modulus of elasticity of steels, high thermal and
electrical conductivity, high corrosion resistance [13], high friction coefficient, excellent
formability, low melting point, high magnetic neutrality, and the possibility for a wide
range of possible surface treatments [14,15]. The increasing demand for the use of
aluminum alloys is related not only to their mechanical performance, economical
10
efficiency and environmental advantages, but also to the fact that these alloys offer
advantageous safety features since the ability of aluminum to absorb the energy of impact
in case of an accident is twice that of steel for the same weight.
The continuous and steady growth of aluminum alloy usage in industrial
applications is directly related to the need for taking advantage of such specific assets as a
high strength-to-weight ratio, and by so doing to enhance mechanical performance and to
lessen energy consumption [16-18].
Aluminum alloys are classed into two groups, wrought alloys and cast alloys.
Furthermore, depending on whether they contain hardening elements such as magnesium
and copper, they are further distinguished as heat-treatable or non-heat treatable alloys.
Heat-treatable alloys are those whose strength is improved after subjecting the alloy to heat
treatment; whereas non-heat treatable alloys are strengthened through mechanical working
or deformation, the strengthening process in the two cases being termed ‘precipitation
hardening’ and ‘work hardening’, respectively.
The cast alloy designation system is based on a 3 digit-plus decimal designation
xxx.x (i.e. 356.0). The first digit (Xxx.x) indicates the principal alloying element which has
been added to the aluminum alloy (see Table 2). The second and third digits (xXX .x) are
arbitrary numbers given to identify a specific alloy in the series. The number following the
decimal point indicates whether the alloy is a casting (.0) or an ingot (.1 or .2). A capital
letter prefix indicates a modification to a specific alloy [19].
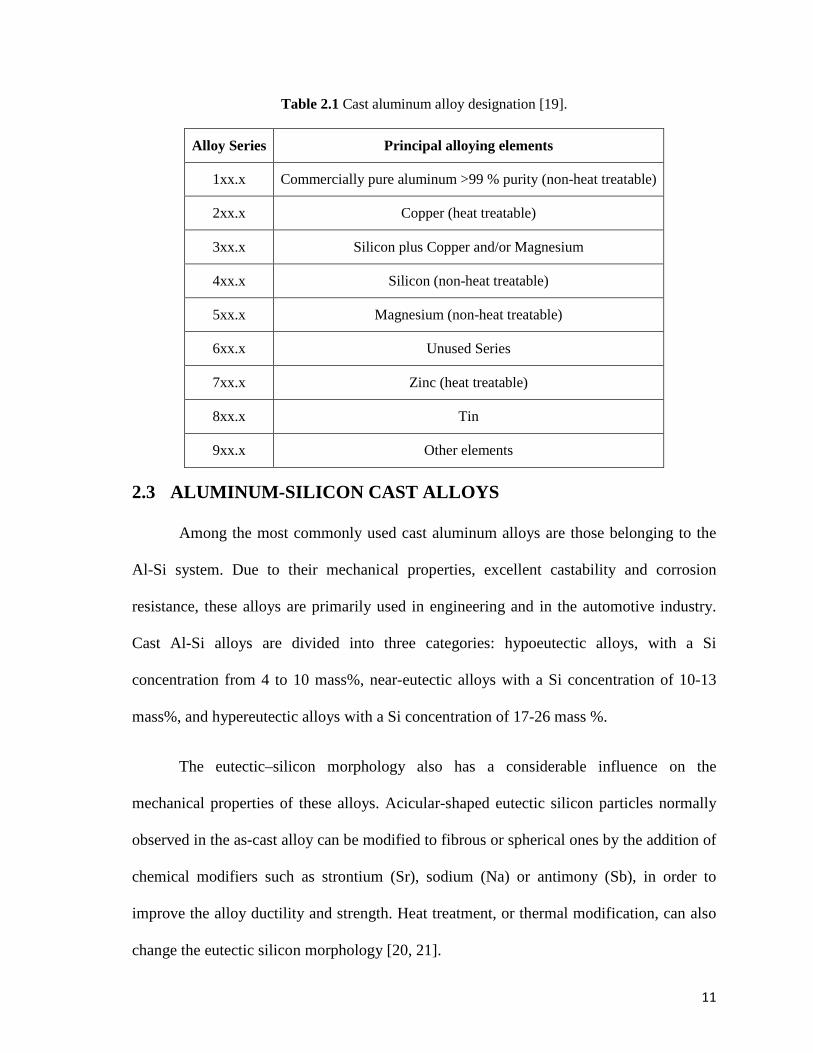
11
Table 2.1 Cast aluminum alloy designation [19].
Alloy Series Principal alloying elements
1xx.x Commercially pure aluminum >99 % purity (non-heat treatable)
2xx.x Copper (heat treatable)
3xx.x Silicon plus Copper and/or Magnesium
4xx.x Silicon (non-heat treatable)
5xx.x Magnesium (non-heat treatable)
6xx.x Unused Series
7xx.x Zinc (heat treatable)
8xx.x Tin
9xx.x Other elements
2.3 ALUMINUM-SILICON CAST ALLOYS
Among the most commonly used cast aluminum alloys are those belonging to the
Al-Si system. Due to their mechanical properties, excellent castability and corrosion
resistance, these alloys are primarily used in engineering and in the automotive industry.
Cast Al-Si alloys are divided into three categories: hypoeutectic alloys, with a Si
concentration from 4 to 10 mass%, near-eutectic alloys with a Si concentration of 10-13
mass%, and hypereutectic alloys with a Si concentration of 17-26 mass %.
The eutectic–silicon morphology also has a considerable influence on the
mechanical properties of these alloys. Acicular-shaped eutectic silicon particles normally
observed in the as-cast alloy can be modified to fibrous or spherical ones by the addition of
chemical modifiers such as strontium (Sr), sodium (Na) or antimony (Sb), in order to
improve the alloy ductility and strength. Heat treatment, or thermal modification, can also
change the eutectic silicon morphology [20, 21].
12
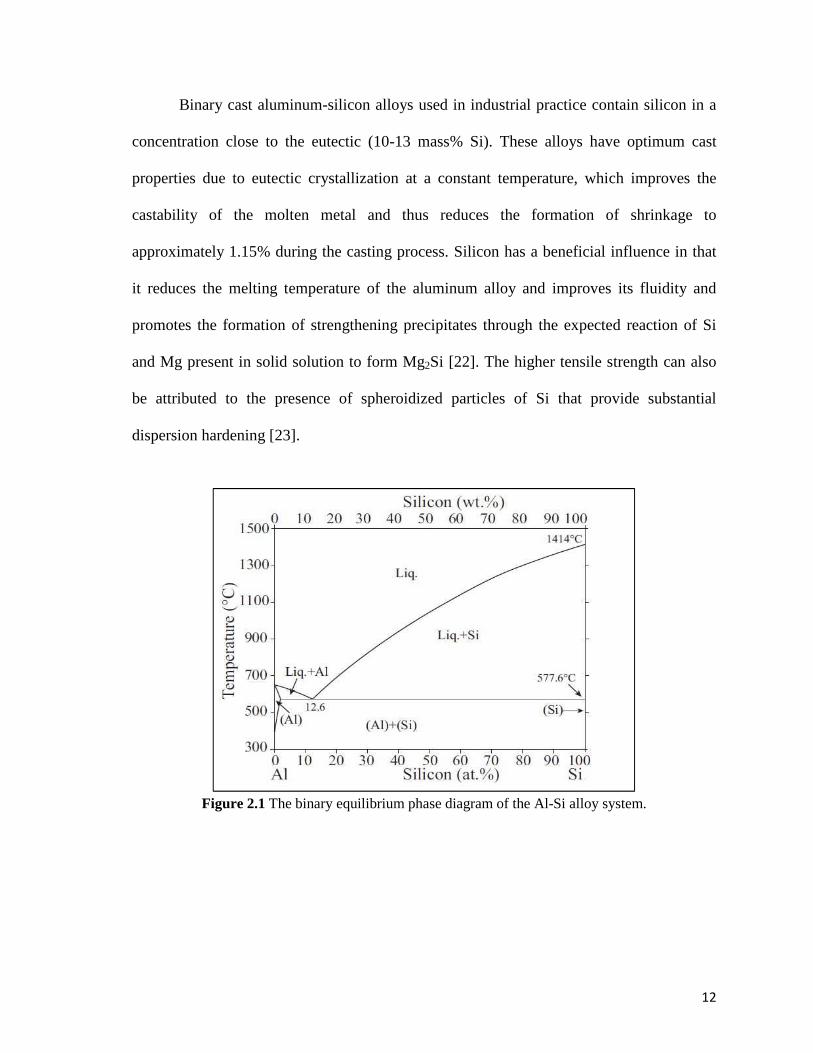
Binary cast aluminum-silicon alloys used in industrial practice contain silicon in a
concentration close to the eutectic (10-13 mass% Si). These alloys have optimum cast
properties due to eutectic crystallization at a constant temperature, which improves the
castability of the molten metal and thus reduces the formation of shrinkage to
approximately 1.15% during the casting process. Silicon has a beneficial influence in that
it reduces the melting temperature of the aluminum alloy and improves its fluidity and
promotes the formation of strengthening precipitates through the expected reaction of Si
and Mg present in solid solution to form Mg2Si [22]. The higher tensile strength can also
be attributed to the presence of spheroidized particles of Si that provide substantial
dispersion hardening [23].
Figure 2.1 The binary equilibrium phase diagram of the Al-Si alloy system.
13
In spite of these advantages, however, Al-Si alloys are limited to applications which
can work up to temperatures of ~250 °C [6] as above this temperature, the alloys lose
coherency between the aluminum solid solution matrix and the precipitated particles which
will then rapidly coarsen and dissolve again into the solid solution, resulting in an alloy
having an undesirable microstructure for high temperature applications [24].
2.3.1 Role of alloying elements in Al-Si alloys
Copper and magnesium are the main alloying elements added to Al-Si cast alloys
for use in industrial applications. Addition of these elements increases the alloy strength
after aging because of the precipitation of different hardening phases such as θ′ (Al2Cu), S′
(Al 2CuMg) and β″ (Mg2Si) [25]. The Mg content of commercial 354 alloys ranges from
0.4 to 0.7 wt%. The addition of Mg results in the formation of the Q-Al5Mg8Si6Cu2 phase
which grows from the blocky Al2Cu phase during the last stage of solidification. The
coarseness of the Q phase increases with increasing Mg content [26]. In applications where
ductility is not the most important factor in material selection, adding Cu to these alloys
has the distinct advantage of increased strength at high temperatures. However, the
addition of Cu also decreases the solidus eutectic temperatures of the alloy, thereby
increasing the solidification range of the alloy, resulting in a tendency to develop porosity
and hot cracking [27].
2.3.1.1 Al-Si-Cu alloys
Adding copper to an Al-Si alloy increases its strength and facilitates precipitation
hardening but it reduces ductility and corrosion resistance [28]. When the Cu content is
above its solubility in Al, the precipitation of the second phase θ' (Al2Cu) also contributes
to the strengthening effect. During solution treatment, copper dissolves rapidly into the
14
aluminum matrix despite the short duration employed; this element is critical in facilitating
age hardening, particularly when Mg and Si are also present [29].
In an Al-Cu alloy, upon appropriate heat treatment, the Cu atoms progressively
cluster together to form very small particles which separate out within the matrix grains of
the alloy; this process is called precipitation [30]. The strengthening effect of Cu in Al-Si
alloys is linked to the precipitation of the secondary eutectic phases of intermetallic Al2Cu
or Al5Cu2Mg8Si6 that form upon aging during the T6 heat treatment. A solution
temperature that exceeds the solidus temperature of incipient melting leads to the
occurrence of incipient melting of the Cu-rich phases, which would deteriorate the
mechanical properties of these alloys [31, 32].
The alloy is initially in a state far from equilibrium and, given sufficient time at the
applied temperature, diffusion of atoms occurs progressively to transform the metallurgical
structure towards the equilibrium state. The precipitation process creates precipitate
particles that usually provide an appreciable hindrance to plastic deformation by slip.
Hence, as precipitation progresses and the size and amount of precipitates increases, the
alloy hardens and strengthens with time. The full precipitation occurs only when the alloy
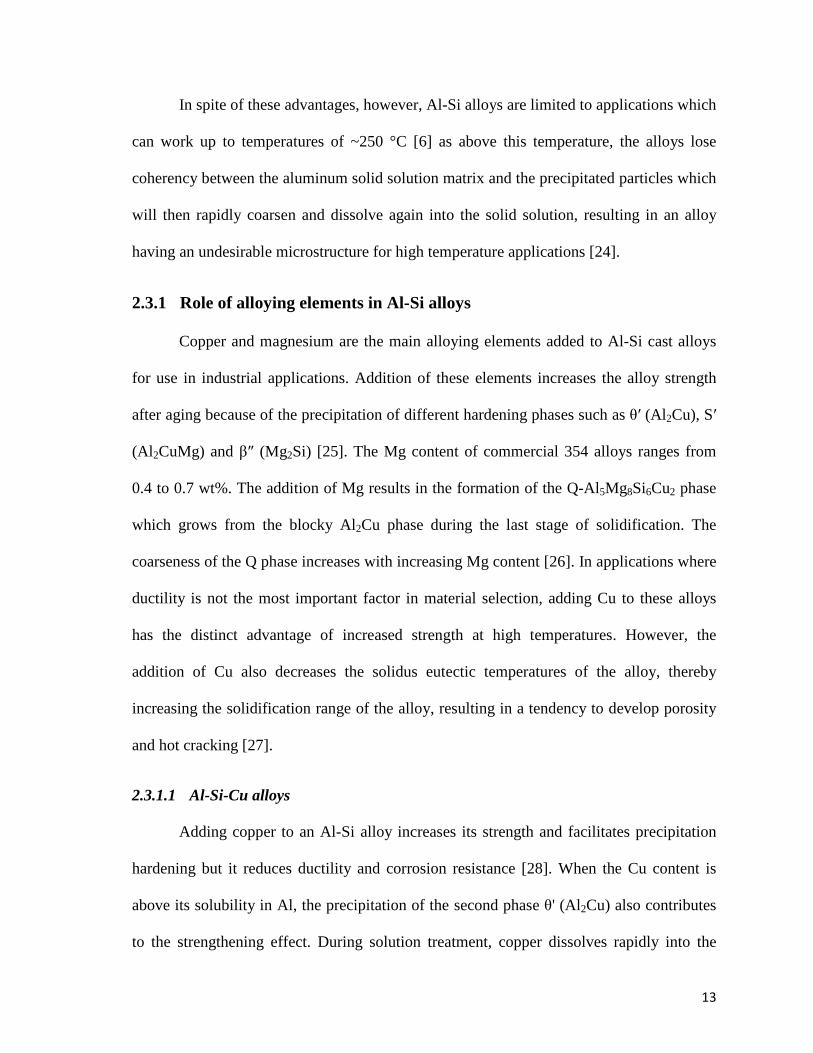
is artificially aged at temperatures below the solvus of the Guinier Preston 1 (or GP1) zone.
Many steps in this process may be covered up by aging at temperatures above the
Guinier Preston zones, θ' and θ", simultaneously with the solvus line of the stable phase θ
[33, 34]. The primary hardening at 180 °C is added to GP1 zones. After attaining a critical
radius of 5 nm, an incubation time starts, during incubation period the size of the zone and
the value of hardness remains unchanged [35, 36].
15
Figure 2.2 Diagram representing precipitation stages with aging time [37].
A content of approximately 1% of copper provides good mechanical properties at
high temperature, without significantly affecting the elongation at room temperature [38].
The addition of transition elements such as Cu in addition to Ni is considered to be
effective for increasing the room and the high temperature strength of cast Al-Si alloys by
forming stable aluminides [39]. As with the as-cast condition, ductility for alloys aged to a
T6 temper decreases gradually as the Cu content is raised [22].
2.3.1.2 Al-Si-Mg alloys
Al-Si-Mg alloys are also of great interest in the transportation field due to their high
specific strength and good castability. Magnesium provides substantial strengthening and
improvement of the work-hardening characteristics of aluminum. It has a relatively high
solubility in solid aluminum, and has a major impact on strengthening while decreasing the
ductility, as reported by Caceres et al. [40]. In general, corrosion resistance and weldability
are also good [41].
When present in combination with Cu and/or Si, Mg is also a very efficient alloying
addition for strengthening aluminum alloys. Even small amounts of Mg can have a
16
profound effect on age hardening [22]. Tavitas-Medrano et al. [42] have reported that
additions of 0.4 wt% Mg increase the response of the alloy to artificial aging, thereby
increasing the tensile strength and micro-hardness values achievable, however, at the
expense of reduced elongation and impact toughness.
Magnesium is added to Al-Si alloys to make them heat treatable whereby, through
the formation of Mg2Si precipitates upon aging, the alloy strength is increased via
precipitation hardening. The microstructure of as-cast hypoeutectic aluminum alloys,
however, contains coarse primary α-Al dendrites and acicular shaped eutectic silicon
particles, which reduce the mechanical properties [43, 44]. With heat treatment, the
mechanical properties of Al-Si-Mg alloys can be improved noticeably.
The mechanical properties of heat-treatable cast Al-Si-Mg alloys, such as the A356
alloy, are negatively affected by prolonged exposure at high temperatures [45, 46]. A
significant reduction in hardness and tensile strength already occurs at temperatures equal
to or higher than 200 °C, thus limiting the application of these alloys in the case of
automotive and other engine components.
With the aim of overcoming these limits and ensuring a superior thermal stability,
Al-Si-Cu-Mg alloys are currently under extensive study [8, 47-49]. In particular, the alloys
being developed are expected to have superior thermal stability in comparison to the
widely used A356 and A357 (Al-Si-Mg) casting alloys, thanks to the presence of more
stable Cu-based intermetallic precipitates, as observed in Al-Mg-Si-Cu alloys [50]. Al-Si-
Mg and Al-Si-Cu alloys are characterized, respectively, by the strengthening phases Mg2Si
and Al2Cu, whose precipitation sequences were studied in Al-Mg-Si and Al-Cu alloys [51-
55]. These sequences respectively occur as:
17
α (SSS)→GP zones→ β”→ β’/B’
→ β in Al-Mg-Si alloys, and
α (SSS)→GP zones→ θ”→ θ’
→ θ in Al-Cu alloys,
where β”, β’, B’ and θ”, θ’ are the intermediate coherent/semi-coherent precipitates, while β
and θ are the stable incoherent phases.
In quaternary Al-Si-Cu-Mg alloys, the presence of both Cu and Mg induces the
formation of further reinforcing compounds, such as the S phase, characterized by the
stoichiometry Al2CuMg, according to the following precipitation sequence [56, 57]:
α (SSS)→GPB zones→ S”→ S’
→ S
After the decomposition of the supersaturated solid solution (SSS), the formation of
Guinier–Preston–Bagaryatsky (GPB) zones occurs, followed by the precipitation of the
coherent S”, semi-coherent S’ , and incoherent equilibrium S phase. The quaternary Q
phase (AlCuMgSi) was also observed in Al-Cu-Mg-Si alloys, characterized by a complex
precipitation sequence, depending on alloy composition [58, 59], which may be expressed
by:
α (SSS)→QP→ QC→ Q’→ Q
where QP, QC and Q’ are the precursors of the stable Q phase. The Cu-containing phases
should confer to the quaternary Al-Si-Cu-Mg alloys a superior thermal stability in
comparison to the more widely used Al-Si-Mg alloys, leading to a better response of the
T6 heat-treated alloys to high temperature exposure (i.e., overaging) [50].
18
2.4 EFFECT OF ALLOYING ELEMENTS ON Al-Si ALLOYS
Alloying elements are usually added to Al–Si cast alloys in order to improve
microstructure features and thus improve mechanical properties. Nickel (Ni) and
Zirconium (Zr) are used as alloying additions to increase high temperature strength in
aluminum alloys due to the production of the L12-type precipitates Al3Zr or Al3Ni, which
are more able to maintain overaging at higher temperatures than the precipitates existing in
cast aluminum alloys such as Al2Cu and Mg2Si [60]. Manganese (Mn) is used to neutralize
the effect of iron (Fe) and to modify the morphology and type of intermetallic phases
formed. Scandium (Sc) in aluminum alloys acts as an effective grain refiner and increases
the recrystallization temperature, the corrosion resistance, and weldability.
2.4.1 Zirconium (Zr)
Zirconium is added to aluminum to form fine precipitates of intermetallic particles
that inhibit recrystallization [6]. For alloys with zirconium additions, a non-recrystallized
structure can be obtained after heat treatment which provides a high level of structural
hardening for a wider range of semi-products than in the case of aluminum alloys
containing manganese (Mn). These products include virtually all pressed and rolled plates,
stampings, forgings, and some cold-deformed semi-products (sheets) obtained from Al-Zn-
Mg and Al-Zn-Mg-Cu alloys, which require a lower temperature of heating for hardening
(450°-470°C) than Al-Cu alloys.
19
Zirconium is usually present in aluminum alloys in an amount ranging from 0.1 to
0.25%. Segregations of the Al3Zr phase particles formed are finer than those of Mn
aluminides (10-100 nm in size) [61]. However, the effect of precipitation hardening due to
segregation of the Al3Zr phase is not high because of the low content of Zr in the alloys
similar to the case of the Mn aluminides, although the effect of the finer zirconium
aluminide segregates on the process of recrystallization in deformed semi-products and,
accordingly, on their grain structure, is considerably stronger [5]. Additionally, it has been
shown that Zr increases the resistance to overaging when it is added to binary Al-Sc alloys
[62].
2.4.2 Nickel (Ni)
Cast Al-Si alloys usually contain alloying components such as magnesium, copper,
nickel, etc. which are widely used in the automotive industry in piston applications [63,64].
These additions form intermetallic phases with complex morphologies and complex
compositions. Nickel is added to Al-Cu and Al-Si alloys to improve hardness and strength
at elevated temperatures and to reduce the coefficient of thermal expansion, as there is an
increasing demand for Al-Si cast alloys with better performance concerning yield and
tensile strength at elevated temperatures up to 250 °C [65]. In fact, the addition of alloying
elements such as Cu and Ni is an effective and practical way to improve the mechanical
properties, especially in relation to the performance of piston alloys which are subjected to
high temperature service conditions [66].
20
The advantages of adding Ni and Zr to Al-Si alloys are that their precipitates (Al3Ni
and Al3Zr) possess the following important characteristics:
• They are coherent;
• Possess low solubility;
• Directly affect the strength of the material because they act as hard pinning points
which inhibit the movement of dislocations in the matrix.
2.4.3 Manganese (Mn)
Manganese is very soluble in aluminum; when the cast is chilled, most of the added
manganese is substantially retained in solution. It increases the strength of the alloy either
in solid solution or as a finely precipitated intermetallic phase by modifying the
morphology of the intermetallic phases which are formed after heat treatment of the given
alloy. As reported by Seifeddine et al. [67], it has no adverse effect on corrosion resistance.
Manganese combines with Fe in the alloy forming the script-like α-iron phase which is
more compact and less detrimental to the mechanical properties [68]. Hwang et al. [69]
have reported that as the Mn content is increased up to 0.65 wt% corresponding to an
Fe/Mn ratio of 1.2 in the Al-7wt.% Si-3.8 wt.% Cu-0.5 wt.% Fe alloy, the plate-like β-
Al 5FeSi iron intermetallic phase is completely converted to the Chinese script α-
Al(Fe,Mn)Si iron phase, resulting in improved tensile properties. Excess amounts of Mn,
however, deteriorate the mechanical properties by increasing the total amount of iron-
containing intermetallic phases formed.
21
2.4.4 Scandium (Sc)
Al-Sc alloys have excellent mechanical properties at ambient and elevated
temperatures due to the presence of a high density (as high as 1022 m-3) of elastically-hard
L12 type Al3Sc precipitates which remain coherent with the α-Al matrix at elevated
temperatures [70, 71]. Krug [72], and Seidman and coworkers [73, 74] have reported that
the Al3Sc precipitates coarsen slowly up to ~300oC, imparting good creep resistance in
coarse-grained cast alloys. The low lattice parameter mismatch of Al and Al3Sc also
contributes to the high creep resistance of Al-Sc alloys. The good interfacial strength
between the Al3Sc precipitates and the aluminium matrix creates a significant lattice strain,
which blocks dislocation motion and prevents grain growth [75]. Furthermore, the thermal
stability of the Al3Sc precipitates suppresses recrystallization [76] and leads to a significant
strengthening effect. Although Al-Sc alloys appear to be very promising alloys for high
temperature applications, their application is limited by the high cost and availability of Sc.
A possible solution to this problem would be to achieve solid solution
strengthening using substitute alloying additions that are similar in nature to Sc, to reduce
the Sc content without lowering the properties. Kending [77], and Dunand and coworkers
[78-82] showed that ternary additions to Al-Sc alloys improve mechanical properties by
solid solution strengthening as in the case of Mg, or by substituting for Sc in Al3Sc
precipitates as in the cases of Ti and Zr.
Scandium (Sc) addition to Al alloys results in as-cast grain size refinement, an
increase in mechanical properties and improvement of weldability [83]. It acts as an
effective grain refiner and increases the recrystallization temperature so that it does not
form any second phase intermetallic compounds with other alloying elements such as Fe,

22
Mg, Mn and Si [84]. While the addition of Sc to Al alloys is more effective in improving
resistance to recrystallization than Zr [85] due to the formation of a high density of Al3Sc
particles, the addition of both Sc and Zr produces Al 3(Sc,Zr) particles which are more
stable than the Al3Sc dispersoids, thus increasing the resistance to recrystallization [86,87];
however, Sc is too expensive to be extensively used in industry [88], so cheaper rare-earth
element additions are being studied to replace it.
2.4.5 Strontium (Sr)
As mentioned previously, the eutectic silicon morphology has a considerable
influence on the mechanical properties of Al-Si based alloys. The tips of the needle-like
eutectic silicon particles in an unmodified Al-Si alloy act as stress raisers which are
harmful to the mechanical properties. Acicular-shape eutectic silicon particles normally
observed in the as-cast alloy can be modified to fibrous or spherical ones by the addition of
chemical modifiers. The most common element used in industry today is strontium (Sr)
[89], which is added in the form of Al-Sr master alloy to Al-Si alloy melts in order to
change or ‘modify’ the morphology of the eutectic silicon particles from their normally
brittle, acicular form to a fibrous form during solidification. Both Sr addition and
solidification rate have a strong influence on the microstructure. The change in
morphology from acicular to fibrous form results in improving the ductility of the alloy as
well as its strength. [90]. According to Merlin and Garagnani [91], one of the
disadvantages of modification, however, is that the addition of strontium to the alloy could
increase the hydrogen content and, as a result, the presence of gas porosities.

23
2.4.6 Titanium (Ti)
It is common practice to add Ti to Al-Si foundry alloys because of its potential
grain refining effect [92]. Sigworth and Kuhn [93] have reported that the grain refining
effect of titanium is enhanced if boron is present in the melt or if the Ti is added in the
form of an Al-Ti-B master alloy containing boron and titanium, largely combined as TiB2
which act as excellent nuclei for the α-Al phase. Titanium diboride has almost no solubility
in liquid aluminum; thus, TiB2 particles produce good refinement at small addition levels.
The refinement is also long lasting, when the particles are not allowed to sediment from the
melt.
2.5 HEAT TREATMENT OF Al-Si-Cu-Mg ALLOYS
Heat treatment is a controlled process used to modify the microstructure of
materials such as alloys to obtain improved properties which benefit the working life of a
component, such as increased surface hardness, temperature resistance, ductility and
strength. There are various types of heat treatment processes, the main among them being
annealing, solution heat treatment, and age hardening. Annealing is basically a stress
relieving process in which a material is heated at a temperature above its recrystallization
temperature, and then it is maintained at a suitable temperature, followed by cooling.
Solution heat treatment is the process of heating the metal well above the upper critical
temperature and then quenching it in a medium such as oil or water. After solution
treatment and quenching, hardening is achieved either at room temperature (natural ageing)
or with a precipitation heat treatment (artificial ageing).
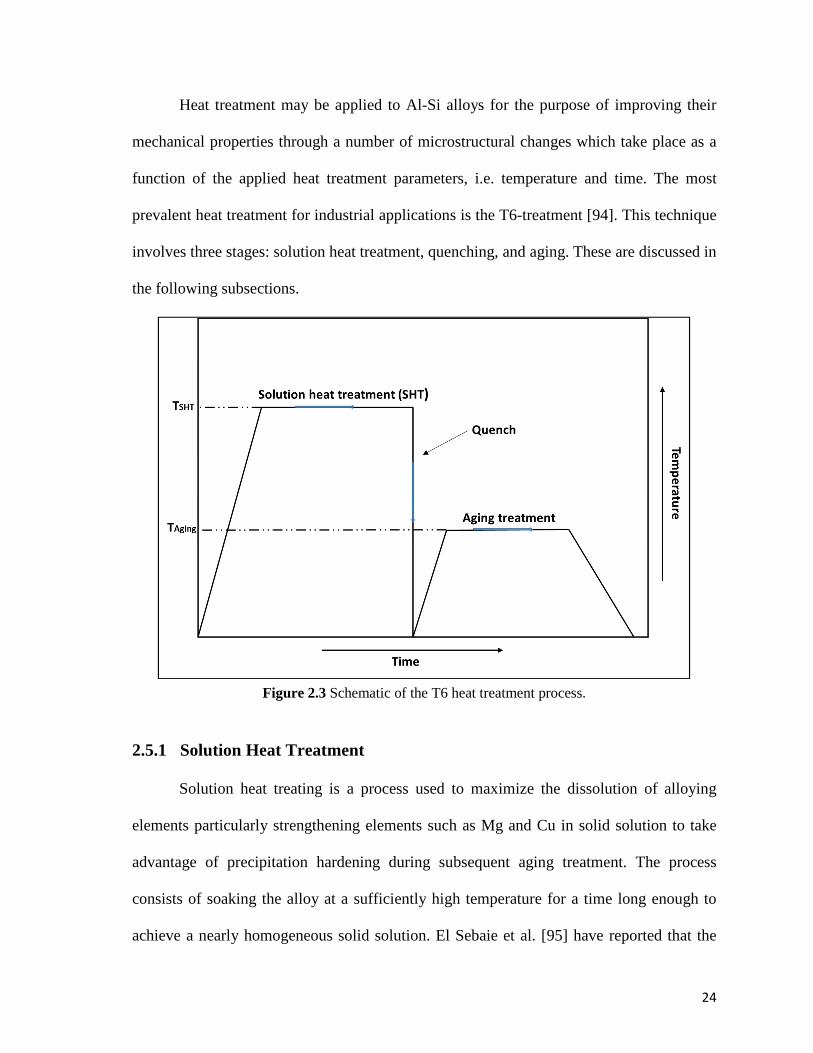
24
Heat treatment may be applied to Al-Si alloys for the purpose of improving their
mechanical properties through a number of microstructural changes which take place as a
function of the applied heat treatment parameters, i.e. temperature and time. The most
prevalent heat treatment for industrial applications is the T6-treatment [94]. This technique
involves three stages: solution heat treatment, quenching, and aging. These are discussed in
the following subsections.
Figure 2.3 Schematic of the T6 heat treatment process.
2.5.1 Solution Heat Treatment
Solution heat treating is a process used to maximize the dissolution of alloying
elements particularly strengthening elements such as Mg and Cu in solid solution to take
advantage of precipitation hardening during subsequent aging treatment. The process
consists of soaking the alloy at a sufficiently high temperature for a time long enough to
achieve a nearly homogeneous solid solution. El Sebaie et al. [95] have reported that the
25
purpose of the solution heat treatment is to dissolve soluble phases formed during and after
solidification so the alloying elements are homogenized.
The solution treatment process needs to be optimized because too short a solution
treatment time means that not all alloying elements added will be dissolved and made
available for precipitation hardening, while too long a solution treatment means using more
energy than is necessary.
Solution treatment is carried out at a high temperature close to the solidus
temperature of the alloy. Sjölander and Seifeddine [26] have reported that cast Al-Si-Mg
alloys are solution treated at 540°C, while alloys containing copper are solution treated at a
lower temperature due to the risk of local or incipient melting of Cu-containing phases.
The solution temperature of Al-Si-Cu-Mg alloys is thus restricted to 495°C, to avoid such
incipient melting of the copper-rich Al2Cu phase [63]. The solution treatment time must be
long enough to homogenize the alloy and to ensure a satisfactory degree of precipitates in
solution [96]. In alloys containing high levels of copper, complete dissolution of the Al2Cu
phase is not usually possible. The solution time must then be chosen carefully to allow for
the maximum dissolution of this phase, also keeping in mind that solution treatment for
long times would be expensive and may not be necessary to obtain the required alloy
strength. Moreover, the coarsening of the microstructural constituents and the possible
formation of secondary porosity due to long time exposure at such temperatures could also
have a harmful effect on the mechanical properties [97].
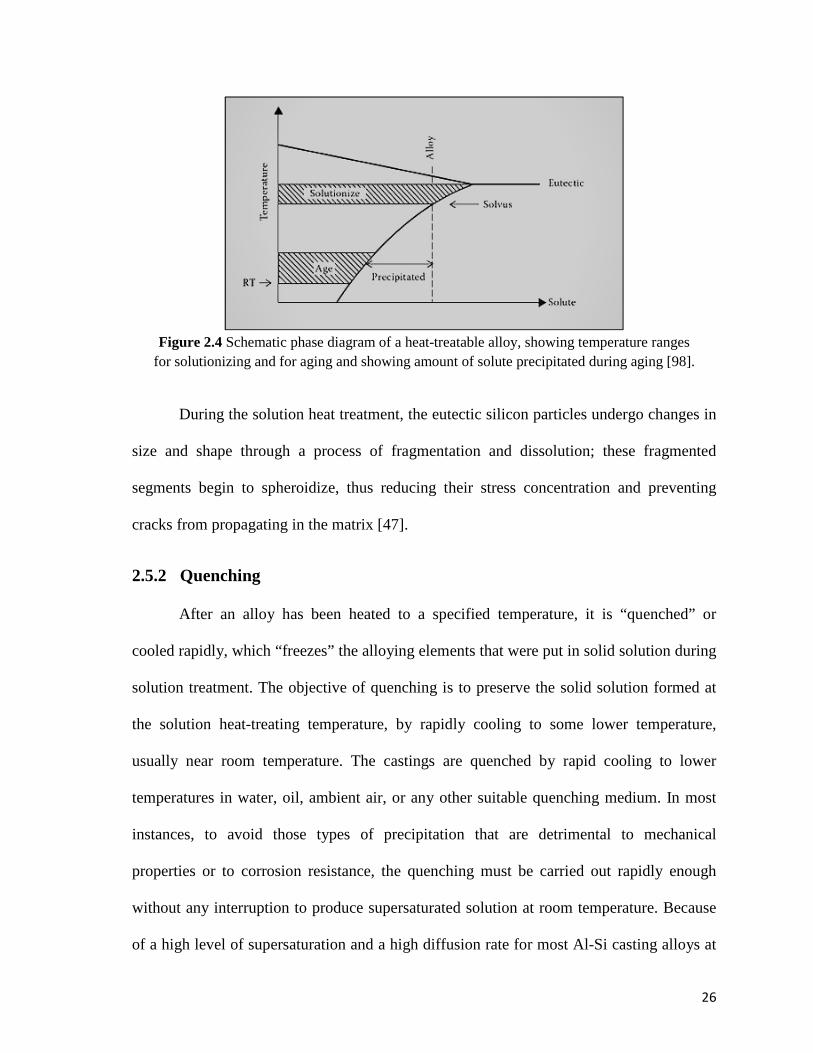
26
Figure 2.4 Schematic phase diagram of a heat-treatable alloy, showing temperature ranges
for solutionizing and for aging and showing amount of solute precipitated during aging [98].
During the solution heat treatment, the eutectic silicon particles undergo changes in
size and shape through a process of fragmentation and dissolution; these fragmented
segments begin to spheroidize, thus reducing their stress concentration and preventing
cracks from propagating in the matrix [47].
2.5.2 Quenching
After an alloy has been heated to a specified temperature, it is “quenched” or
cooled rapidly, which “freezes” the alloying elements that were put in solid solution during
solution treatment. The objective of quenching is to preserve the solid solution formed at
the solution heat-treating temperature, by rapidly cooling to some lower temperature,
usually near room temperature. The castings are quenched by rapid cooling to lower
temperatures in water, oil, ambient air, or any other suitable quenching medium. In most
instances, to avoid those types of precipitation that are detrimental to mechanical
properties or to corrosion resistance, the quenching must be carried out rapidly enough
without any interruption to produce supersaturated solution at room temperature. Because
of a high level of supersaturation and a high diffusion rate for most Al-Si casting alloys at
27
temperatures between 450 °C and 200 °C, the quench rate is critical as, since the
precipitates form rapidly, however, such problems as the formation of residual stresses and
distortions of the castings which might accompany a very fast quenching rate need to be
avoided [14]. At higher temperatures the supersaturation is too low and at lower
temperatures the diffusion rate is too low for precipitation to be critical. The limiting
quench rate is ~4°C/s, above which the yield strength increases slowly with further
increase in quench rate [97]. Quenching rate also has a great influence on the
microstructure and properties of super high strength aluminum alloy, influencing the
ultimate tensile strength and yield strength. With a decrease in the quenching rate, the
strength of the samples decreases [99].
2.5.3 Age Hardening Treatment
Age hardening or precipitation hardening is a process that follows solution
treatment and quenching where the castings are subjected to a specified temperature for a
certain period of time. The age hardening occurs when castings are exposed to a certain
temperature that allows the trapped alloying elements to diffuse through the microstructure
and form intermetallic precipitates; these precipitates nucleate out of the solid solution and
act as reinforcing phases.
Aging, for example, at 100°C – 260°C is called artificial aging because the alloy is
heated to produce precipitation. Using a lower aging temperature provides properties that
are more uniform. When heat-treated alloys are aged at room temperature it is called
natural aging. The rate and amount of natural aging varies from one alloy to another.
Properties of the alloys depend on the aging temperature and time. Typically, the hardness
and strength of the alloy increases initially with time and the precipitate particle size until
28
it reaches the peak aging point, where maximum strength is obtained. With further aging,
the strength and hardness decrease, or softening of the alloy occurs, corresponding to
overaging conditions.
Cuniberti et al. [100] investigated the influence of natural aging on precipitation
hardening of an Al–Mg–Si alloy by mechanical testing and quantitative transmission
electron microscopy. They found that natural aging increases yield stress and reduces
ductility, which is attributed to the formation of Mg/Si clusters, as was also confirmed by
Mohamed and Samuel [97] in the review on the heat treatment of Al-Si-Cu/Mg casting
alloys, in which the precipitation of Mg-rich phases was reported to depend on the Mg-to-
Si ratio.
Wang and Jones [101] developed a non-isothermal aging process based on
precipitation strengthening, computational thermodynamic and kinetics. The aging
temperature varies with time so that the nucleation, growth and coarsening of precipitates
can be controlled and optimized. With the non-isothermal aging scheme, the desired yield
strength of aluminum alloys can be achieved with minimal time and energy. Table 2.2 lists
the most common heat treatment designations that are used to produce desired features of
aluminum alloys.
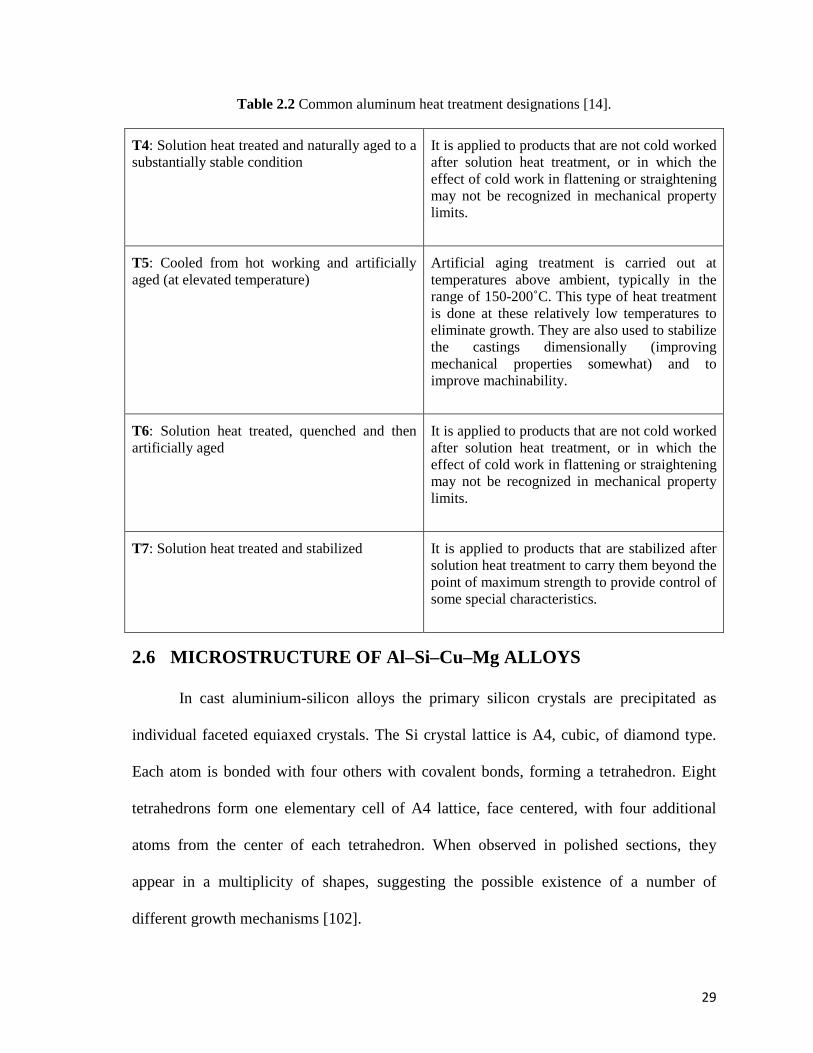
29
Table 2.2 Common aluminum heat treatment designations [14].
T4: Solution heat treated and naturally aged to a substantially stable condition
It is applied to products that are not cold worked after solution heat treatment, or in which the effect of cold work in flattening or straightening may not be recognized in mechanical property limits.
T5: Cooled from hot working and artificially aged (at elevated temperature)
Artificial aging treatment is carried out at temperatures above ambient, typically in the range of 150-200˚C. This type of heat treatment is done at these relatively low temperatures to eliminate growth. They are also used to stabilize the castings dimensionally (improving mechanical properties somewhat) and to improve machinability.
T6: Solution heat treated, quenched and then artificially aged
It is applied to products that are not cold worked after solution heat treatment, or in which the effect of cold work in flattening or straightening may not be recognized in mechanical property limits.
T7: Solution heat treated and stabilized It is applied to products that are stabilized after solution heat treatment to carry them beyond the point of maximum strength to provide control of some special characteristics.
2.6 MICROSTRUCTURE OF Al–Si–Cu–Mg ALLOYS
In cast aluminium-silicon alloys the primary silicon crystals are precipitated as
individual faceted equiaxed crystals. The Si crystal lattice is A4, cubic, of diamond type.
Each atom is bonded with four others with covalent bonds, forming a tetrahedron. Eight
tetrahedrons form one elementary cell of A4 lattice, face centered, with four additional
atoms from the center of each tetrahedron. When observed in polished sections, they
appear in a multiplicity of shapes, suggesting the possible existence of a number of
different growth mechanisms [102].
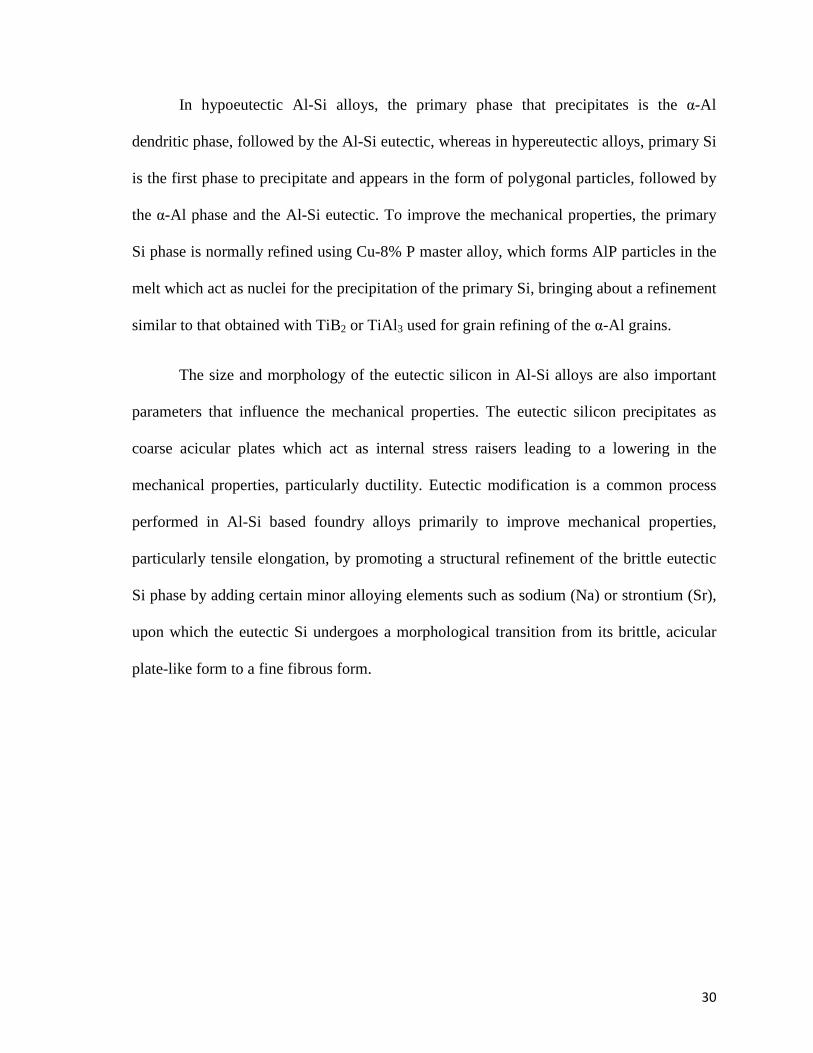
30
In hypoeutectic Al-Si alloys, the primary phase that precipitates is the α-Al
dendritic phase, followed by the Al-Si eutectic, whereas in hypereutectic alloys, primary Si
is the first phase to precipitate and appears in the form of polygonal particles, followed by
the α-Al phase and the Al-Si eutectic. To improve the mechanical properties, the primary
Si phase is normally refined using Cu-8% P master alloy, which forms AlP particles in the
melt which act as nuclei for the precipitation of the primary Si, bringing about a refinement
similar to that obtained with TiB2 or TiAl3 used for grain refining of the α-Al grains.
The size and morphology of the eutectic silicon in Al-Si alloys are also important
parameters that influence the mechanical properties. The eutectic silicon precipitates as
coarse acicular plates which act as internal stress raisers leading to a lowering in the
mechanical properties, particularly ductility. Eutectic modification is a common process
performed in Al-Si based foundry alloys primarily to improve mechanical properties,
particularly tensile elongation, by promoting a structural refinement of the brittle eutectic
Si phase by adding certain minor alloying elements such as sodium (Na) or strontium (Sr),
upon which the eutectic Si undergoes a morphological transition from its brittle, acicular
plate-like form to a fine fibrous form.
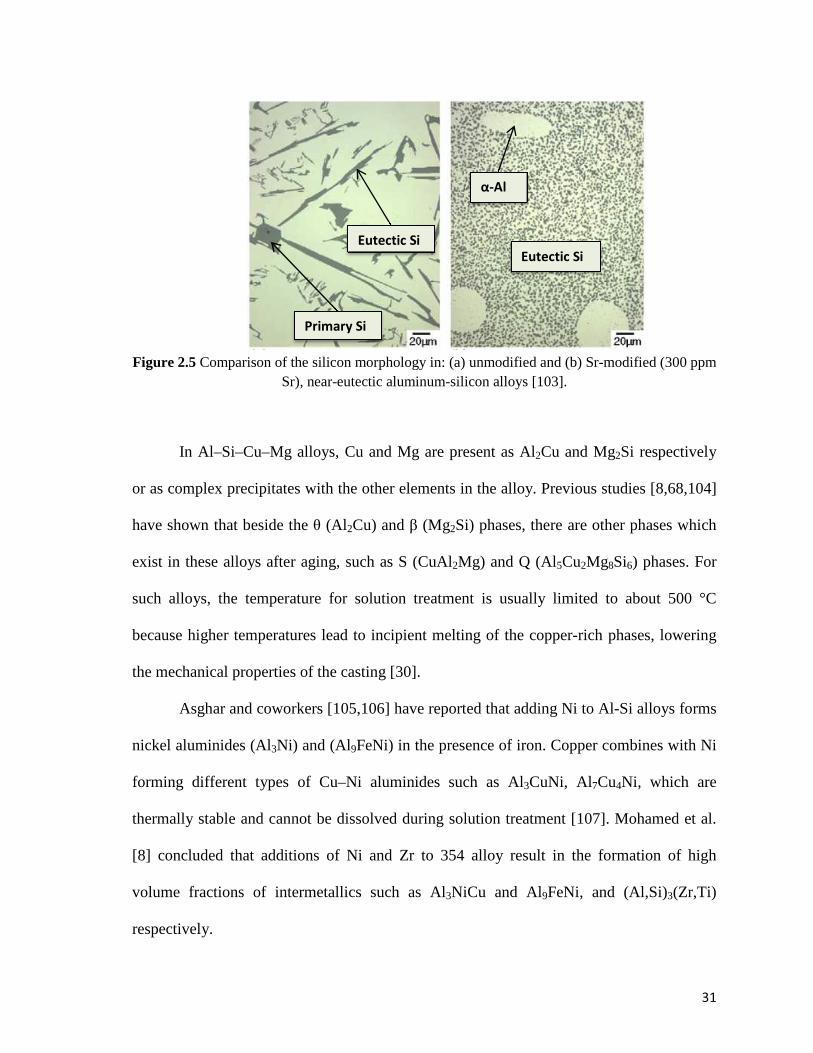
31
Figure 2.5 Comparison of the silicon morphology in: (a) unmodified and (b) Sr-modified (300 ppm
Sr), near-eutectic aluminum-silicon alloys [103].
In Al–Si–Cu–Mg alloys, Cu and Mg are present as Al2Cu and Mg2Si respectively
or as complex precipitates with the other elements in the alloy. Previous studies [8,68,104]
have shown that beside the θ (Al2Cu) and β (Mg2Si) phases, there are other phases which
exist in these alloys after aging, such as S (CuAl2Mg) and Q (Al5Cu2Mg8Si6) phases. For
such alloys, the temperature for solution treatment is usually limited to about 500 °C
because higher temperatures lead to incipient melting of the copper-rich phases, lowering
the mechanical properties of the casting [30].
Asghar and coworkers [105,106] have reported that adding Ni to Al-Si alloys forms
nickel aluminides (Al3Ni) and (Al9FeNi) in the presence of iron. Copper combines with Ni
forming different types of Cu–Ni aluminides such as Al3CuNi, Al7Cu4Ni, which are
thermally stable and cannot be dissolved during solution treatment [107]. Mohamed et al.
[8] concluded that additions of Ni and Zr to 354 alloy result in the formation of high
volume fractions of intermetallics such as Al3NiCu and Al9FeNi, and (Al,Si)3(Zr,Ti)
respectively.
Primary Si
Eutectic Si
α-Al
Eutectic Si
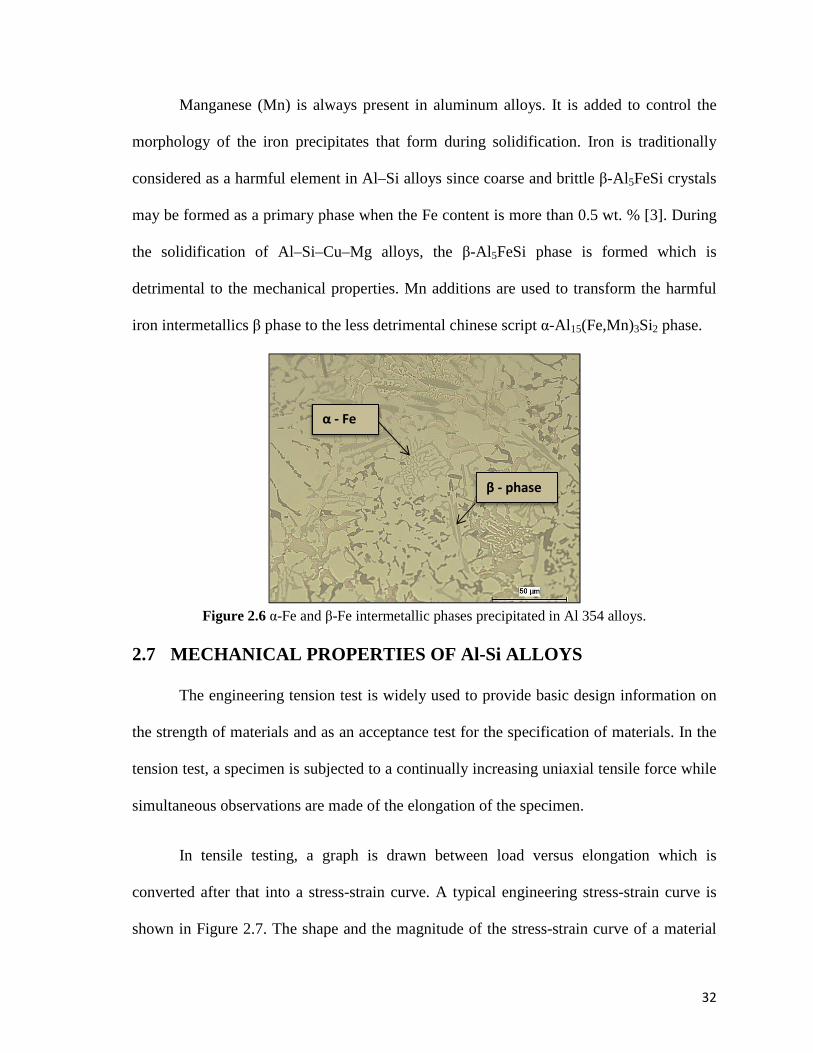
32
Manganese (Mn) is always present in aluminum alloys. It is added to control the
morphology of the iron precipitates that form during solidification. Iron is traditionally
considered as a harmful element in Al–Si alloys since coarse and brittle β-Al 5FeSi crystals
may be formed as a primary phase when the Fe content is more than 0.5 wt. % [3]. During
the solidification of Al–Si–Cu–Mg alloys, the β-Al 5FeSi phase is formed which is
detrimental to the mechanical properties. Mn additions are used to transform the harmful
iron intermetallics β phase to the less detrimental chinese script α-Al 15(Fe,Mn)3Si2 phase.
Figure 2.6 α-Fe and β-Fe intermetallic phases precipitated in Al 354 alloys.
2.7 MECHANICAL PROPERTIES OF Al-Si ALLOYS
The engineering tension test is widely used to provide basic design information on
the strength of materials and as an acceptance test for the specification of materials. In the
tension test, a specimen is subjected to a continually increasing uniaxial tensile force while
simultaneous observations are made of the elongation of the specimen.
In tensile testing, a graph is drawn between load versus elongation which is
converted after that into a stress-strain curve. A typical engineering stress-strain curve is
shown in Figure 2.7. The shape and the magnitude of the stress-strain curve of a material
α - Fe
β - phase
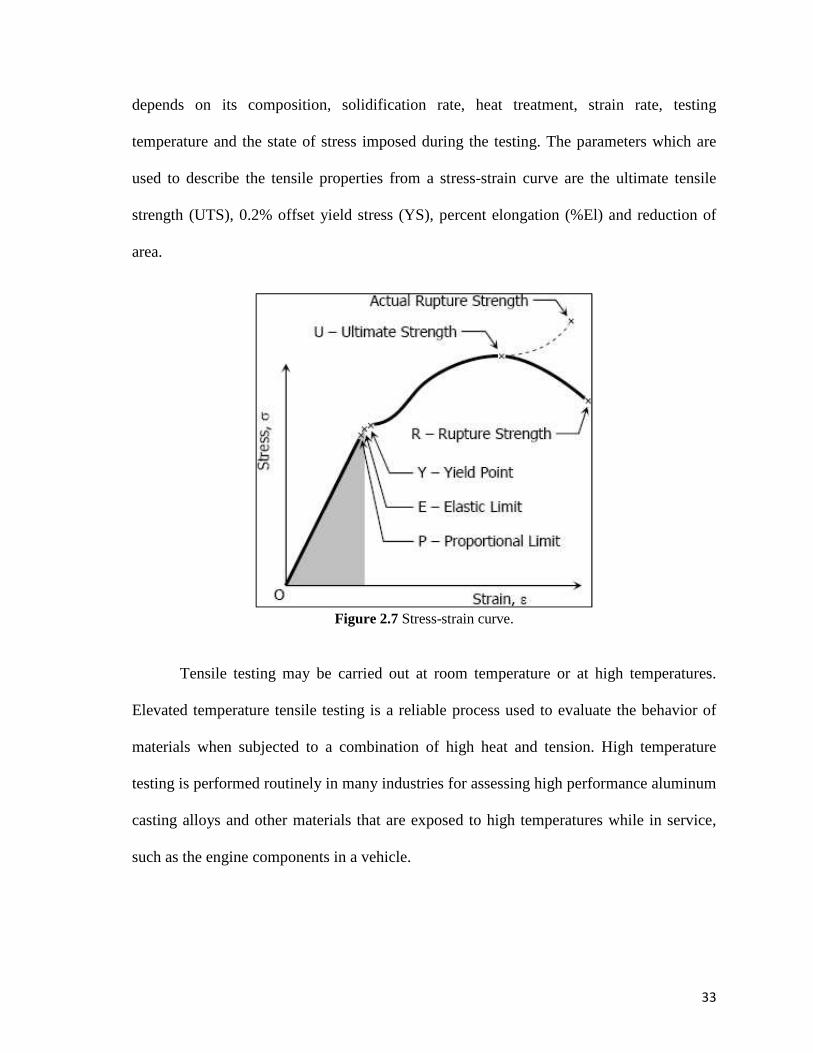
33
depends on its composition, solidification rate, heat treatment, strain rate, testing
temperature and the state of stress imposed during the testing. The parameters which are
used to describe the tensile properties from a stress-strain curve are the ultimate tensile
strength (UTS), 0.2% offset yield stress (YS), percent elongation (%El) and reduction of
area.
Figure 2.7 Stress-strain curve.
Tensile testing may be carried out at room temperature or at high temperatures.
Elevated temperature tensile testing is a reliable process used to evaluate the behavior of
materials when subjected to a combination of high heat and tension. High temperature
testing is performed routinely in many industries for assessing high performance aluminum
casting alloys and other materials that are exposed to high temperatures while in service,
such as the engine components in a vehicle.
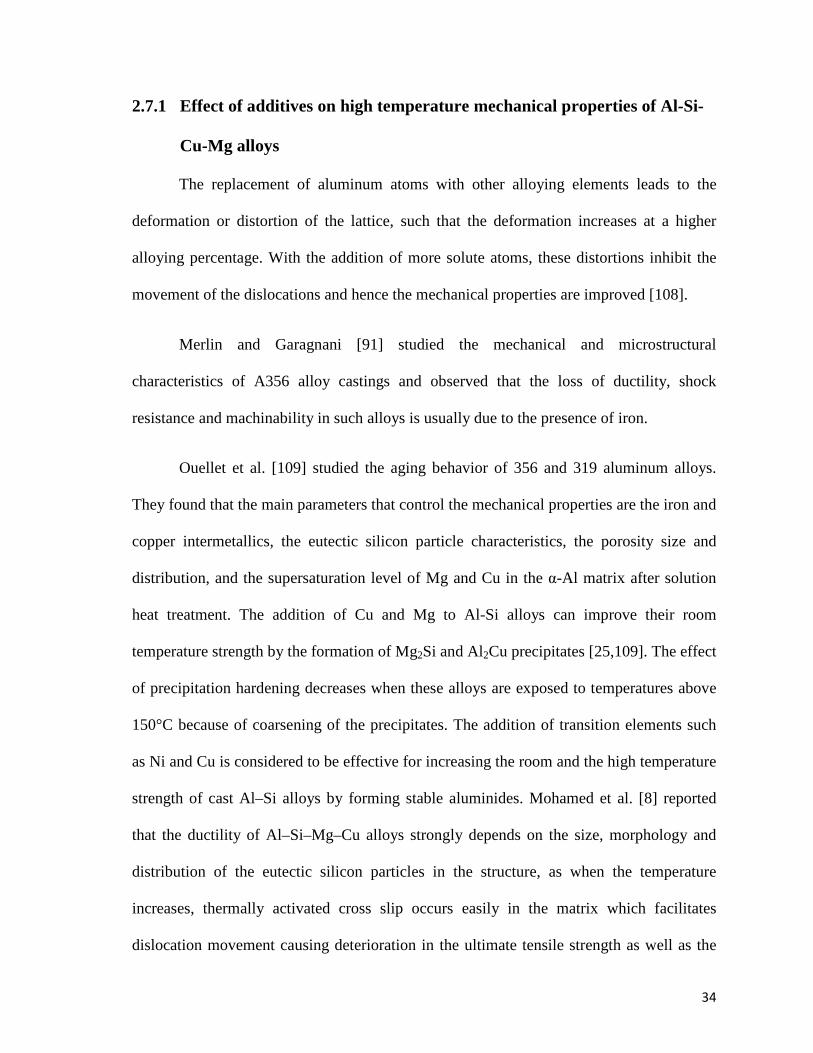
34
2.7.1 Effect of additives on high temperature mechanical properties of Al-Si-
Cu-Mg alloys
The replacement of aluminum atoms with other alloying elements leads to the
deformation or distortion of the lattice, such that the deformation increases at a higher
alloying percentage. With the addition of more solute atoms, these distortions inhibit the
movement of the dislocations and hence the mechanical properties are improved [108].
Merlin and Garagnani [91] studied the mechanical and microstructural
characteristics of A356 alloy castings and observed that the loss of ductility, shock
resistance and machinability in such alloys is usually due to the presence of iron.
Ouellet et al. [109] studied the aging behavior of 356 and 319 aluminum alloys.
They found that the main parameters that control the mechanical properties are the iron and
copper intermetallics, the eutectic silicon particle characteristics, the porosity size and
distribution, and the supersaturation level of Mg and Cu in the α-Al matrix after solution
heat treatment. The addition of Cu and Mg to Al-Si alloys can improve their room
temperature strength by the formation of Mg2Si and Al2Cu precipitates [25,109]. The effect
of precipitation hardening decreases when these alloys are exposed to temperatures above
150°C because of coarsening of the precipitates. The addition of transition elements such
as Ni and Cu is considered to be effective for increasing the room and the high temperature
strength of cast Al–Si alloys by forming stable aluminides. Mohamed et al. [8] reported
that the ductility of Al–Si–Mg–Cu alloys strongly depends on the size, morphology and
distribution of the eutectic silicon particles in the structure, as when the temperature
increases, thermally activated cross slip occurs easily in the matrix which facilitates
dislocation movement causing deterioration in the ultimate tensile strength as well as the
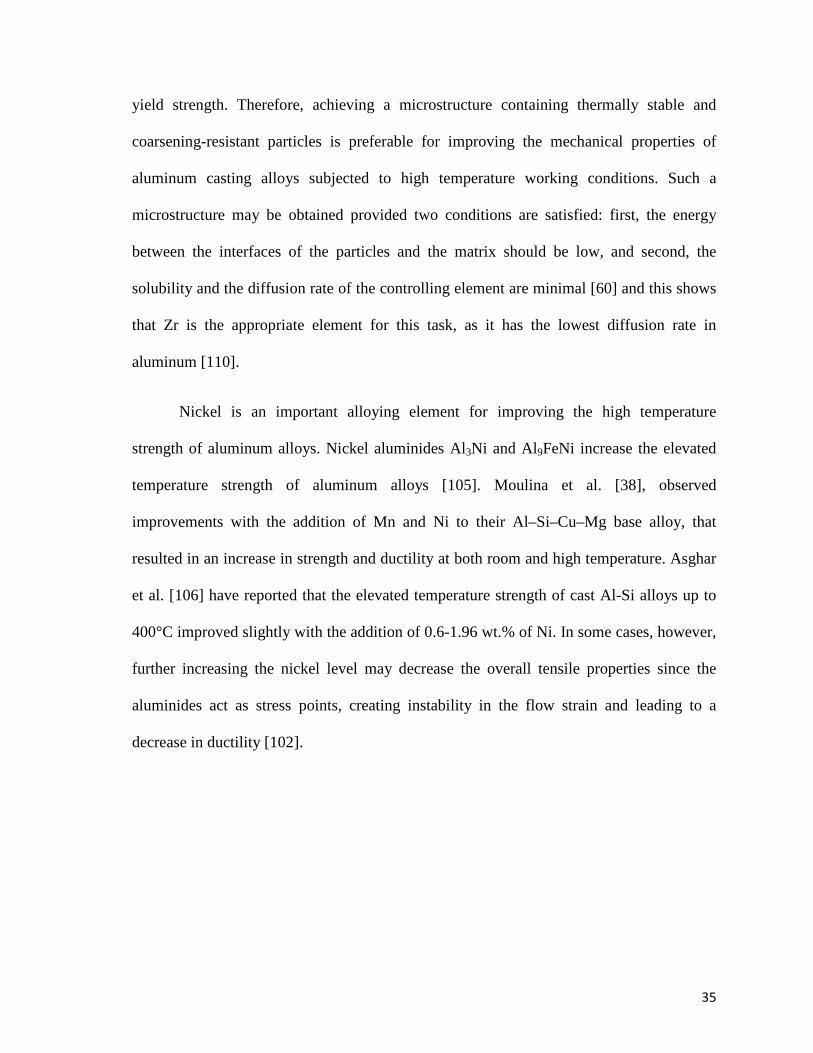
35
yield strength. Therefore, achieving a microstructure containing thermally stable and
coarsening-resistant particles is preferable for improving the mechanical properties of
aluminum casting alloys subjected to high temperature working conditions. Such a
microstructure may be obtained provided two conditions are satisfied: first, the energy
between the interfaces of the particles and the matrix should be low, and second, the
solubility and the diffusion rate of the controlling element are minimal [60] and this shows
that Zr is the appropriate element for this task, as it has the lowest diffusion rate in
aluminum [110].
Nickel is an important alloying element for improving the high temperature
strength of aluminum alloys. Nickel aluminides Al3Ni and Al9FeNi increase the elevated
temperature strength of aluminum alloys [105]. Moulina et al. [38], observed
improvements with the addition of Mn and Ni to their Al–Si–Cu–Mg base alloy, that
resulted in an increase in strength and ductility at both room and high temperature. Asghar
et al. [106] have reported that the elevated temperature strength of cast Al-Si alloys up to
400°C improved slightly with the addition of 0.6-1.96 wt.% of Ni. In some cases, however,
further increasing the nickel level may decrease the overall tensile properties since the
aluminides act as stress points, creating instability in the flow strain and leading to a
decrease in ductility [102].
36
2.8 FRACTOGRAPHY
One of the most important and key concepts in understanding the mechanical
behavior of materials is fracture. There are only two possible types of fracture, ductile and
brittle. In general, the main difference between brittle and ductile fracture can be attributed
to the amount of plastic deformation that the material undergoes before fracture occurs.
Ductile materials undergo large amounts of plastic deformation while brittle materials
show little or no plastic deformation before fracture. Figure 2.8 is a schematic
representation of the degree of plastic deformation exhibited by both brittle and ductile
materials before fracture.
Crack initiation and crack propagation are essential to fracture. The manner in
which the crack propagates through the material gives great insight into the type of fracture
that will occur. In ductile materials, the crack moves slowly and is accompanied by a large
amount of plastic deformation. The crack will usually not extend unless an increased stress
is applied. On the other hand, in dealing with brittle fracture, cracks spread very rapidly
with little or no plastic deformation. There are two types of cracking, inter-crystalline
cracking and trans-crystalline cracking; the latter depends on the size, shape, and
orientation of the particle, and activation of the dislocation source, whereas an inter-
crystalline crack can be observed on the fracture surface.
37
Figure 2.8 Schematic diagram showing brittle vs ductile stress-strain behavior [111].
(a) (b)
Figure 2.9 Photographs showing (a) ductile vs (b) brittle specimens.
Macroscopically, ductile fracture surfaces have larger necking regions and an
overall rougher appearance than a brittle fracture surface. Figure 2.9 shows the
macroscopic differences between the ductile and brittle specimens. On the microscopic
level, electron images of the fracture surface are obtained using scanning electron
microscopy (SEM), as shown in Figure 2.10. A ductile fracture surface is characterized by
dimples, the size of which is governed by the number and the distribution of the nucleated
micro-voids. Figure 2.10(a) shows an example of the simple dimpled rupture mode of
fracture, where particles are observed at the bottom of the dimples. The decohesion of the
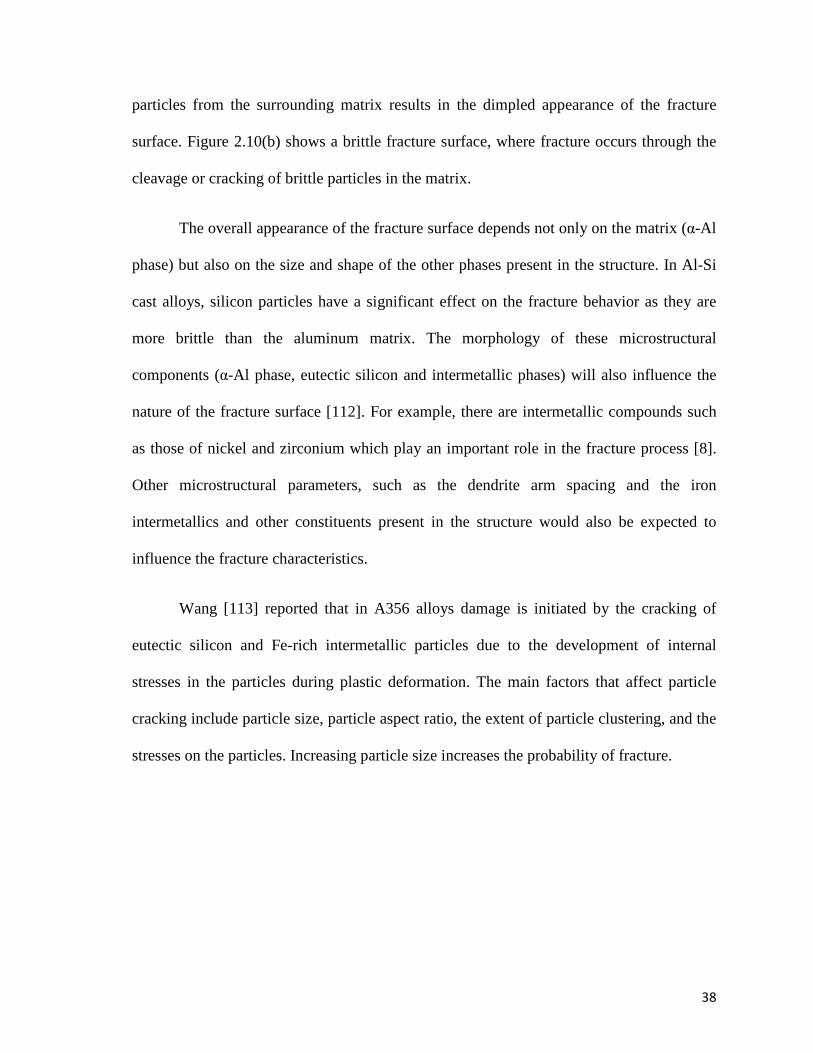
38
particles from the surrounding matrix results in the dimpled appearance of the fracture
surface. Figure 2.10(b) shows a brittle fracture surface, where fracture occurs through the
cleavage or cracking of brittle particles in the matrix.
The overall appearance of the fracture surface depends not only on the matrix (α-Al
phase) but also on the size and shape of the other phases present in the structure. In Al-Si
cast alloys, silicon particles have a significant effect on the fracture behavior as they are
more brittle than the aluminum matrix. The morphology of these microstructural
components (α-Al phase, eutectic silicon and intermetallic phases) will also influence the
nature of the fracture surface [112]. For example, there are intermetallic compounds such
as those of nickel and zirconium which play an important role in the fracture process [8].
Other microstructural parameters, such as the dendrite arm spacing and the iron
intermetallics and other constituents present in the structure would also be expected to
influence the fracture characteristics.
Wang [113] reported that in A356 alloys damage is initiated by the cracking of
eutectic silicon and Fe-rich intermetallic particles due to the development of internal
stresses in the particles during plastic deformation. The main factors that affect particle
cracking include particle size, particle aspect ratio, the extent of particle clustering, and the
stresses on the particles. Increasing particle size increases the probability of fracture.
39
(a) (b)
Figure 2.10 SEM images showing (a) a ductile fracture surface exhibiting a dimpled structure, and (b) a brittle fracture surface, showing how fracture occurs through the cracking of particles
(arrowed).
Apart from SEM fractography, it is also useful to examine the fracture profile on
sections perpendicular to the fracture surface. This can be carried out on a polished section
of the fractured sample using an optical microscope, and allows us to determine if any
microstructural defects contributed to fracture initiation, as well as determine the nature of
the fracture path and whether it is specific to any phase or constituent present in the
microstructure [114].
2.9 QUALITY CHARTS
The quality of aluminum casting alloys is considered to be one of the critical factors
controlling the selection of an alloy for a specific application. Metallurgical variables
which influence the alloy quality include alloy composition, solidification rate, heat
treatment, casting defects and other microstructural features such as grain size and
intermetallic phases. The quality of an alloy is a reference to its tensile properties (tensile
40
strength and ductility) and can also provide an indication to the overall performance of the
alloy, in terms of possible risk and cost efficiency factors involved in applying different
heat treatments to achieve the desired properties.
The quality of aluminum alloy castings may be defined using the quality index Q
which provides a correlation to the mechanical properties. Drouzy et al. [115] first
proposed the concept of quality index in 1980 in relation to their investigations of the
tensile properties of Al-7%Si-Mg alloys containing different levels of Mg, and defined Q
in terms of the following equation:
� = �� + �. log� �� [1]
In Eq. [1], �� stands for the ultimate tensile strength in MPa, � stands for the elongation
to fracture in pct, and d is an empirical coefficient in MPa chosen such as to make Q
practically independent of the aging condition. For the investigated Al-7%Si-Mg or 356
alloys, the coefficient d has been determined to be 150 MPa. The probable yield strength
�� of an Al-Si-Mg alloy may be assessed by the equation:
�� = �.�� − �. log� �� + � [2]
where a, b, and c are alloy-dependent empirically determined coefficients. From the above
equations, a quality chart can be generated, as shown in Figure 2.11. In a typical quality
chart, which is a diagram of the ultimate tensile strength vs the logarithm of the elongation
to fracture, Eqs. [1] and [2] represent sets of parallel lines termed iso-Q and iso-YS lines,
respectively; they fit the experimentally obtained Q and R� values resulting from
variations in chemical composition, solidification conditions, and heat treatment of Al-Si-
Mg aluminum alloys with a good approximation. Such charts are therefore very useful in
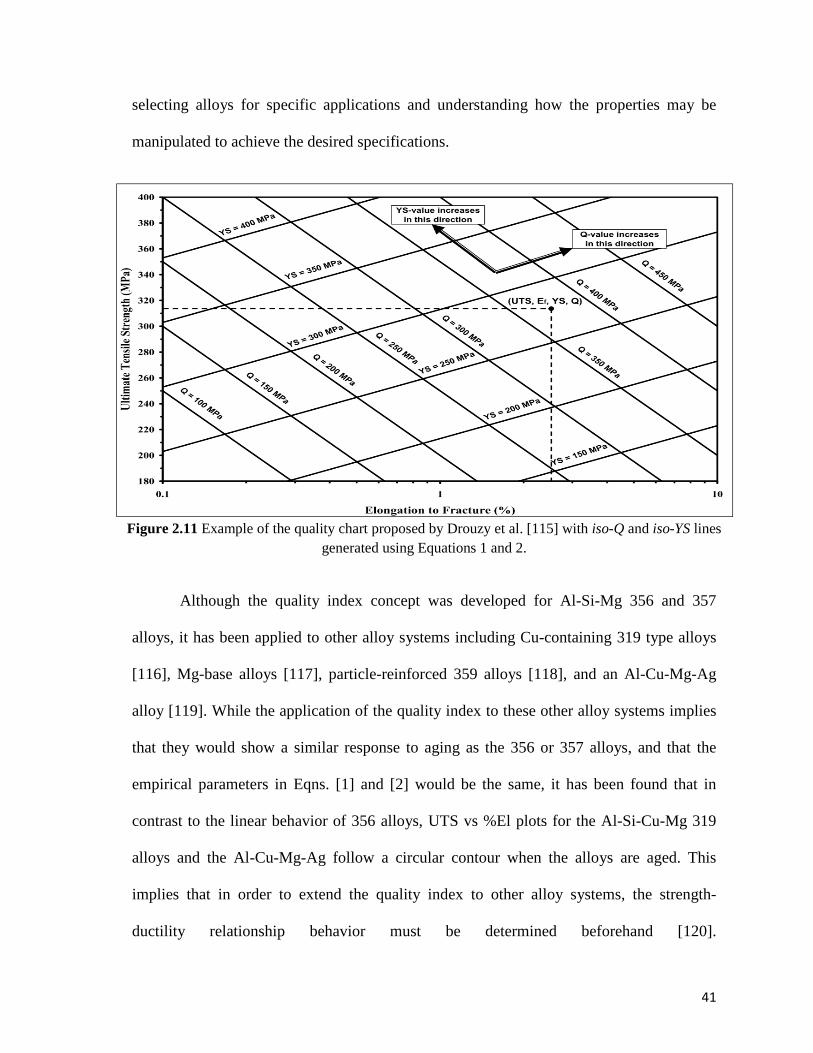
41
selecting alloys for specific applications and understanding how the properties may be
manipulated to achieve the desired specifications.
Figure 2.11 Example of the quality chart proposed by Drouzy et al. [115] with iso-Q and iso-YS lines
generated using Equations 1 and 2.
Although the quality index concept was developed for Al-Si-Mg 356 and 357
alloys, it has been applied to other alloy systems including Cu-containing 319 type alloys
[116], Mg-base alloys [117], particle-reinforced 359 alloys [118], and an Al-Cu-Mg-Ag
alloy [119]. While the application of the quality index to these other alloy systems implies
that they would show a similar response to aging as the 356 or 357 alloys, and that the
empirical parameters in Eqns. [1] and [2] would be the same, it has been found that in
contrast to the linear behavior of 356 alloys, UTS vs %El plots for the Al-Si-Cu-Mg 319
alloys and the Al-Cu-Mg-Ag follow a circular contour when the alloys are aged. This
implies that in order to extend the quality index to other alloy systems, the strength-
ductility relationship behavior must be determined beforehand [120].

3 CHAPTER 3
EXPERIMENTAL PROCEDURES
CHAPTER 3
EXPERIMENTAL PROCEDURES
3.1 INTRODUCTION
The present chapter will provide all the details relevant to the 354-Al-9%Si-
1.8%Cu-0.5%Mg casting alloy with regard to general melting and casting procedures, heat
treatment, the various techniques used for microstructural characterization and phase
identification, namely optical microscopy, scanning electron microscopy (SEM) and field-
emission scanning electron microscopy (FESEM), as well as the tensile testing method
used to determine the mechanical properties. Apart from the analysis of microstructures
obtained from tensile test samples, further elaboration of the microstructure involves
thermal analysis, which is a method for identifying the main phase reactions related to the
solidification of the alloys studied. The alloy codes for the various alloys which were
prepared are collectively listed in Table 3.2.
The processes described herein were carried out with the intention of investigating
and viewing the effect of additions of nickel, zirconium, manganese and scandium on the
mechanical properties of the 354 cast aluminum alloy at different temperatures.
The study was carried out in two parts according to the temperature at which the
tensile testing was carried out:
• Ambient Temperature Tensile Testing
1. No stabilization.
44
2. 200 hours stabilization at 250°C.
• High Temperature Tensile Testing
1. One hour stabilization at 250°C.
2. 200 hours stabilization at 250°C.
3.2 CLASSIFICATION OF ALLOYS
The alloys were classified according to the alloying elements additions made to the
base 354 alloy. For comparison purposes with the 354 alloy, a 398 alloy - reported to show
good high temperature properties - was also prepared, using the same Zr and Sc additions.
1. Alloy R (354 + 0.25%Zr) - Base Alloy
2. Alloy S (354 + 0.25%Zr + 2%Ni)
3. Alloy T (354 + 0.25%Zr + 4%Ni)
4. Alloy U (354 + 0.25%Zr + 0.75%Mn)
5. Alloy V (354 + 0.25%Zr + 0.75%Mn + 2%Ni)
6. Alloy Z (354 + 0.25%Zr + 0.15%Sc)
7. Alloy L (398 + 0.25%Zr + 0.15%Sc)
3.3 MELTING AND CASTING PROCEDURES
The chemical composition of the 354 base alloy used for this study is listed in
Table 3.1. The alloy ingots were cut into smaller pieces, dried and melted in a 120-kg
capacity SiC crucible, using an electrical resistance furnace, as shown in Figure 3.1. The
melting temperature was maintained at 750 ± 5°C. All the 354 alloy melts prepared were
grain refined and modified using Al-5%Ti-1%B and Al-10%Sr master alloys, respectively,
to obtain levels of 0.2% Ti and 200 ppm Sr in the melt. Additions of Ni, Zr, Mn and Sc
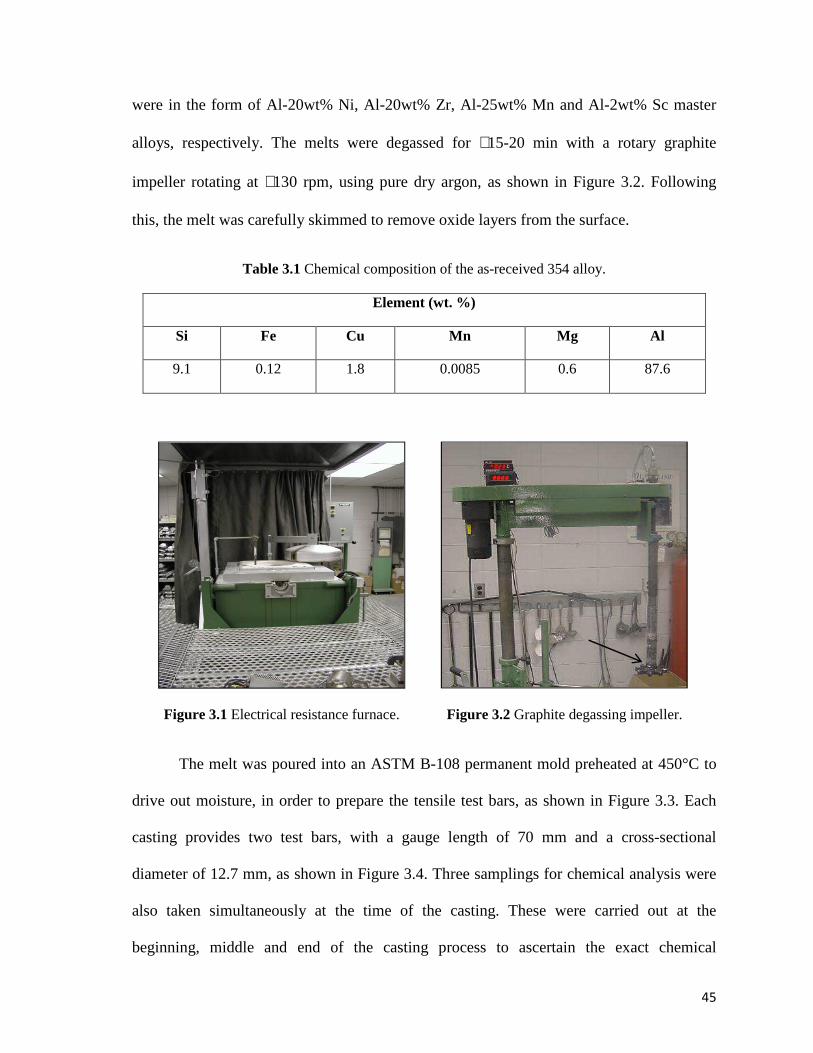
45
were in the form of Al-20wt% Ni, Al-20wt% Zr, Al-25wt% Mn and Al-2wt% Sc master
alloys, respectively. The melts were degassed for ∼15-20 min with a rotary graphite
impeller rotating at ∼130 rpm, using pure dry argon, as shown in Figure 3.2. Following
this, the melt was carefully skimmed to remove oxide layers from the surface.
Table 3.1 Chemical composition of the as-received 354 alloy.
Element (wt. %)
Si Fe Cu Mn Mg Al
9.1 0.12 1.8 0.0085 0.6 87.6
Figure 3.1 Electrical resistance furnace.
Figure 3.2 Graphite degassing impeller.
The melt was poured into an ASTM B-108 permanent mold preheated at 450°C to
drive out moisture, in order to prepare the tensile test bars, as shown in Figure 3.3. Each
casting provides two test bars, with a gauge length of 70 mm and a cross-sectional
diameter of 12.7 mm, as shown in Figure 3.4. Three samplings for chemical analysis were
also taken simultaneously at the time of the casting. These were carried out at the
beginning, middle and end of the casting process to ascertain the exact chemical
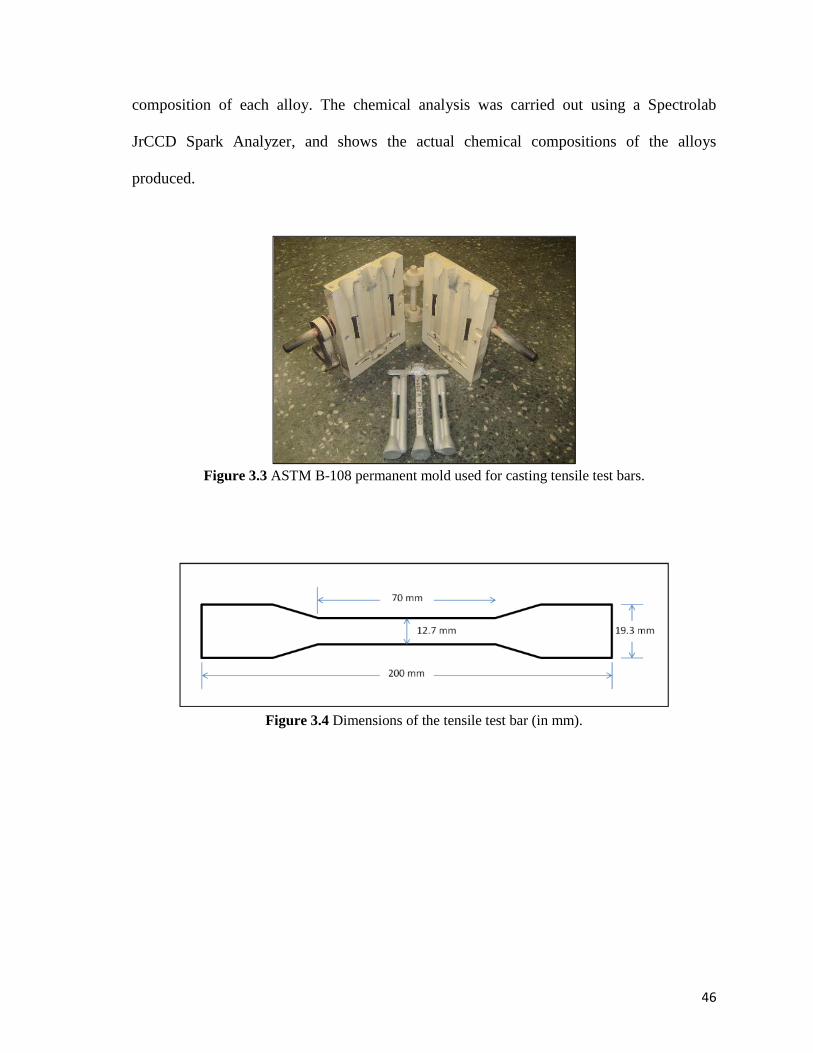
46
composition of each alloy. The chemical analysis was carried out using a Spectrolab
JrCCD Spark Analyzer, and shows the actual chemical compositions of the alloys
produced.
Figure 3.3 ASTM B-108 permanent mold used for casting tensile test bars.
Figure 3.4 Dimensions of the tensile test bar (in mm).
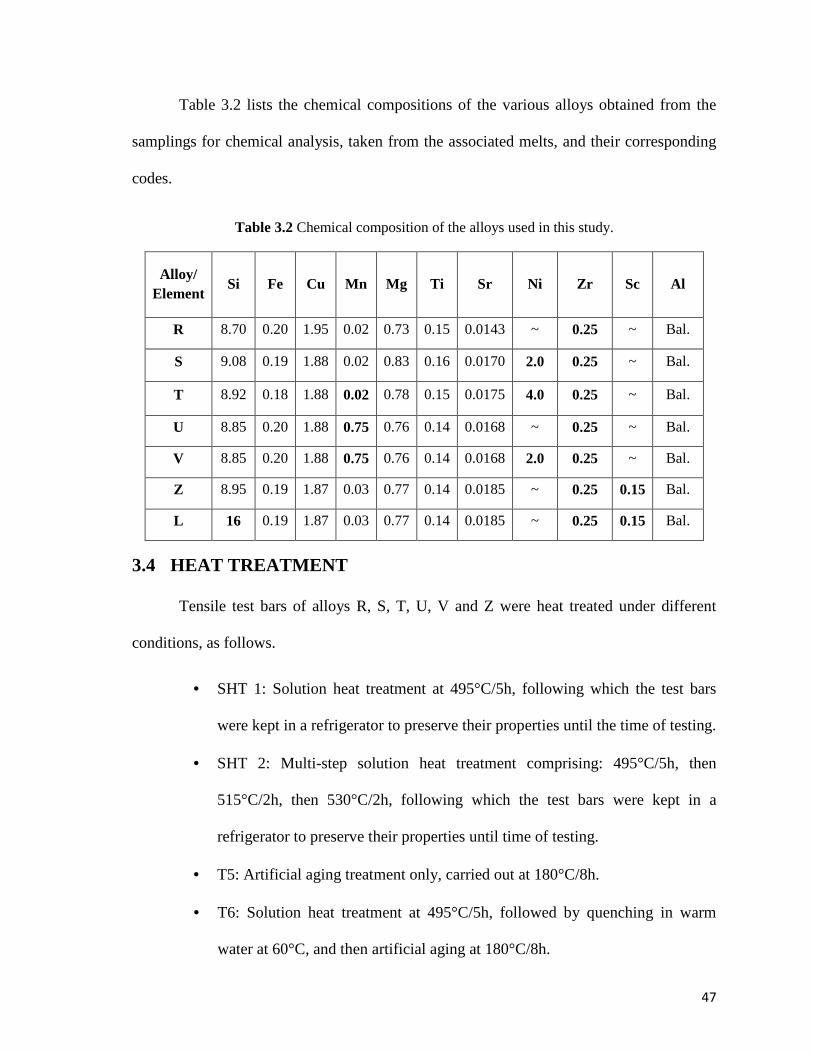
47
Table 3.2 lists the chemical compositions of the various alloys obtained from the
samplings for chemical analysis, taken from the associated melts, and their corresponding
codes.
Table 3.2 Chemical composition of the alloys used in this study.
Alloy/ Element
Si Fe Cu Mn Mg Ti Sr Ni Zr Sc Al
R 8.70 0.20 1.95 0.02 0.73 0.15 0.0143 ~ 0.25 ~ Bal.
S 9.08 0.19 1.88 0.02 0.83 0.16 0.0170 2.0 0.25 ~ Bal.
T 8.92 0.18 1.88 0.02 0.78 0.15 0.0175 4.0 0.25 ~ Bal.
U 8.85 0.20 1.88 0.75 0.76 0.14 0.0168 ~ 0.25 ~ Bal.
V 8.85 0.20 1.88 0.75 0.76 0.14 0.0168 2.0 0.25 ~ Bal.
Z 8.95 0.19 1.87 0.03 0.77 0.14 0.0185 ~ 0.25 0.15 Bal.
L 16 0.19 1.87 0.03 0.77 0.14 0.0185 ~ 0.25 0.15 Bal.
3.4 HEAT TREATMENT
Tensile test bars of alloys R, S, T, U, V and Z were heat treated under different
conditions, as follows.
• SHT 1: Solution heat treatment at 495°C/5h, following which the test bars
were kept in a refrigerator to preserve their properties until the time of testing.
• SHT 2: Multi-step solution heat treatment comprising: 495°C/5h, then
515°C/2h, then 530°C/2h, following which the test bars were kept in a
refrigerator to preserve their properties until time of testing.
• T5: Artificial aging treatment only, carried out at 180°C/8h.
• T6: Solution heat treatment at 495°C/5h, followed by quenching in warm
water at 60°C, and then artificial aging at 180°C/8h.
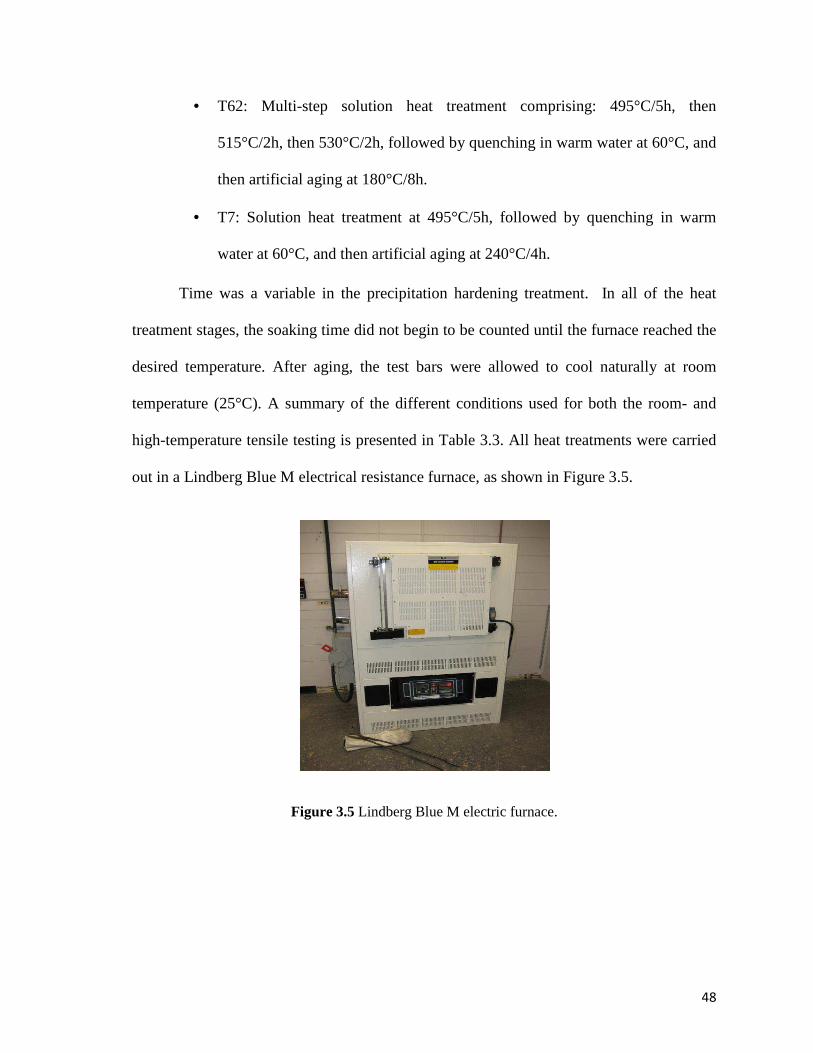
48
• T62: Multi-step solution heat treatment comprising: 495°C/5h, then
515°C/2h, then 530°C/2h, followed by quenching in warm water at 60°C, and
then artificial aging at 180°C/8h.
• T7: Solution heat treatment at 495°C/5h, followed by quenching in warm
water at 60°C, and then artificial aging at 240°C/4h.
Time was a variable in the precipitation hardening treatment. In all of the heat
treatment stages, the soaking time did not begin to be counted until the furnace reached the
desired temperature. After aging, the test bars were allowed to cool naturally at room
temperature (25°C). A summary of the different conditions used for both the room- and
high-temperature tensile testing is presented in Table 3.3. All heat treatments were carried
out in a Lindberg Blue M electrical resistance furnace, as shown in Figure 3.5.
Figure 3.5 Lindberg Blue M electric furnace.
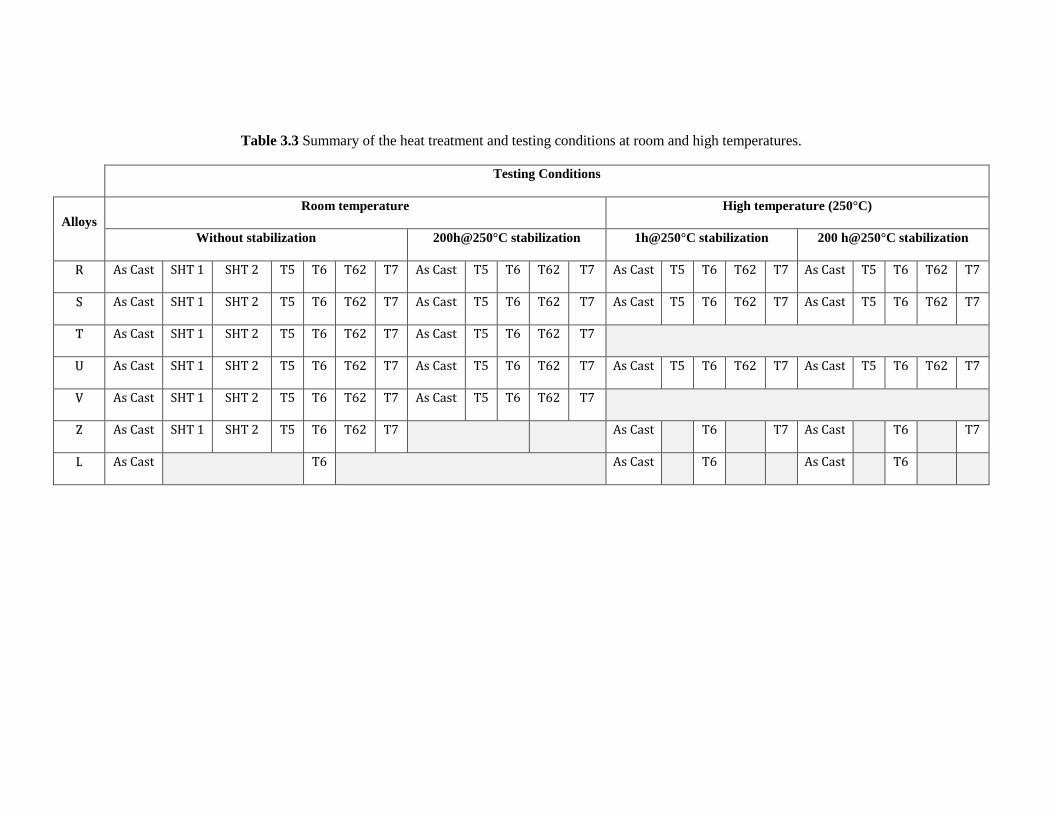
Table 3.3 Summary of the heat treatment and testing conditions at room and high temperatures.
Testing Conditions
Alloys Room temperature High temperature (250°C)
Without stabilization 200h@250°C stabilization 1h@250°C stabilization 200 h@250°C stabilization
R AsCast SHT1 SHT2 T5 T6 T62 T7 AsCast T5 T6 T62 T7 AsCast T5 T6 T62 T7 AsCast T5 T6 T62 T7
S AsCast SHT1 SHT2 T5 T6 T62 T7 AsCast T5 T6 T62 T7 AsCast T5 T6 T62 T7 AsCast T5 T6 T62 T7
T AsCast SHT1 SHT2 T5 T6 T62 T7 AsCast T5 T6 T62 T7
U AsCast SHT1 SHT2 T5 T6 T62 T7 AsCast T5 T6 T62 T7 AsCast T5 T6 T62 T7 AsCast T5 T6 T62 T7
V AsCast SHT1 SHT2 T5 T6 T62 T7 AsCast T5 T6 T62 T7
Z AsCast SHT1 SHT2 T5 T6 T62 T7
AsCast
T6
T7 AsCast
T6
T7
L AsCast
T6
AsCast
T6
AsCast
T6
50
3.5 TENSILE TESTING
All samples for ambient temperature testing, whether as-cast, solution heat-treated
or aged, were tested to the point of fracture using an MTS Servohydraulic mechanical
testing machine at a strain rate of 4 x 10⁻⁴ s-1, as shown in Figure 3.6(a). An extensometer,
or strain gage, was used in the tests to measure the extent of deformation in the samples.
Yield strength (YS) at 0.2% offset strain, ultimate tensile strength (UTS), and percent
elongation (%El) were obtained from the data acquisition system of the machine. Five
samples from each condition covered in this part of the study were tested, for a total of 345
bars covering all alloys.
For testing of the alloys at high temperature, the samples were mounted in the
testing chamber which was pre-set to the required temperature, as shown in Figure 3.6(b).
After mounting, the sample was maintained at the testing temperature for 30 min before
starting the test. As before, five test bars were used for each alloy composition/condition
studied for all high temperature tests carried out. The average UTS, YS and %El values
obtained from each set of five tests were considered as representing the tensile properties
of that alloy/condition. A total of 200 bars were tested for this part of the study.
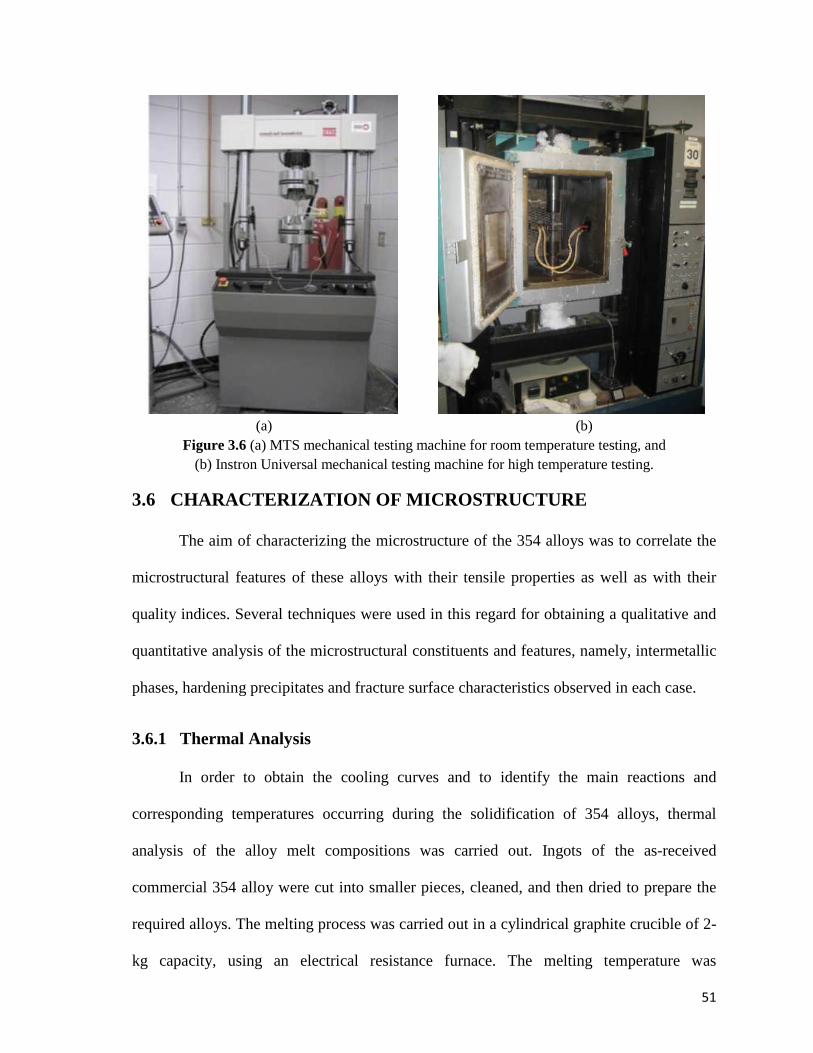
51
(a) (b)
Figure 3.6 (a) MTS mechanical testing machine for room temperature testing, and (b) Instron Universal mechanical testing machine for high temperature testing.
3.6 CHARACTERIZATION OF MICROSTRUCTURE
The aim of characterizing the microstructure of the 354 alloys was to correlate the
microstructural features of these alloys with their tensile properties as well as with their
quality indices. Several techniques were used in this regard for obtaining a qualitative and
quantitative analysis of the microstructural constituents and features, namely, intermetallic
phases, hardening precipitates and fracture surface characteristics observed in each case.
3.6.1 Thermal Analysis
In order to obtain the cooling curves and to identify the main reactions and
corresponding temperatures occurring during the solidification of 354 alloys, thermal
analysis of the alloy melt compositions was carried out. Ingots of the as-received
commercial 354 alloy were cut into smaller pieces, cleaned, and then dried to prepare the
required alloys. The melting process was carried out in a cylindrical graphite crucible of 2-
kg capacity, using an electrical resistance furnace. The melting temperature was
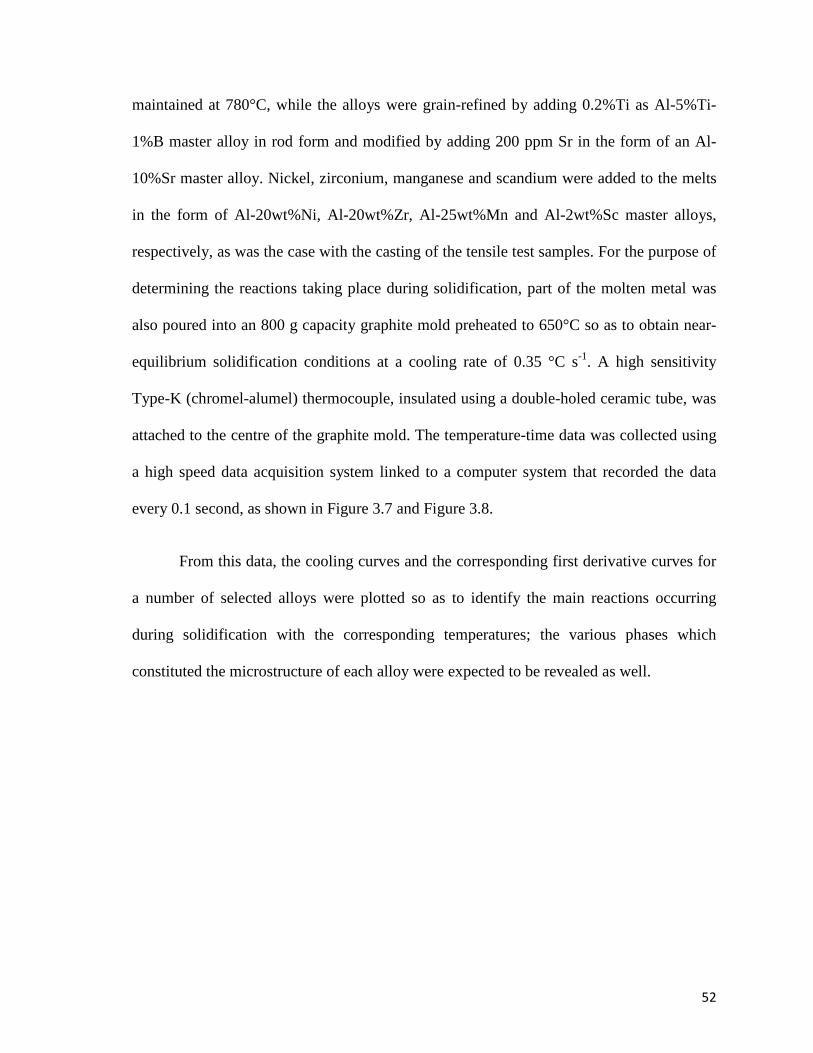
52
maintained at 780°C, while the alloys were grain-refined by adding 0.2%Ti as Al-5%Ti-
1%B master alloy in rod form and modified by adding 200 ppm Sr in the form of an Al-
10%Sr master alloy. Nickel, zirconium, manganese and scandium were added to the melts
in the form of Al-20wt%Ni, Al-20wt%Zr, Al-25wt%Mn and Al-2wt%Sc master alloys,
respectively, as was the case with the casting of the tensile test samples. For the purpose of
determining the reactions taking place during solidification, part of the molten metal was
also poured into an 800 g capacity graphite mold preheated to 650°C so as to obtain near-
equilibrium solidification conditions at a cooling rate of 0.35 °C s-1. A high sensitivity
Type-K (chromel-alumel) thermocouple, insulated using a double-holed ceramic tube, was
attached to the centre of the graphite mold. The temperature-time data was collected using
a high speed data acquisition system linked to a computer system that recorded the data
every 0.1 second, as shown in Figure 3.7 and Figure 3.8.
From this data, the cooling curves and the corresponding first derivative curves for
a number of selected alloys were plotted so as to identify the main reactions occurring
during solidification with the corresponding temperatures; the various phases which
constituted the microstructure of each alloy were expected to be revealed as well.
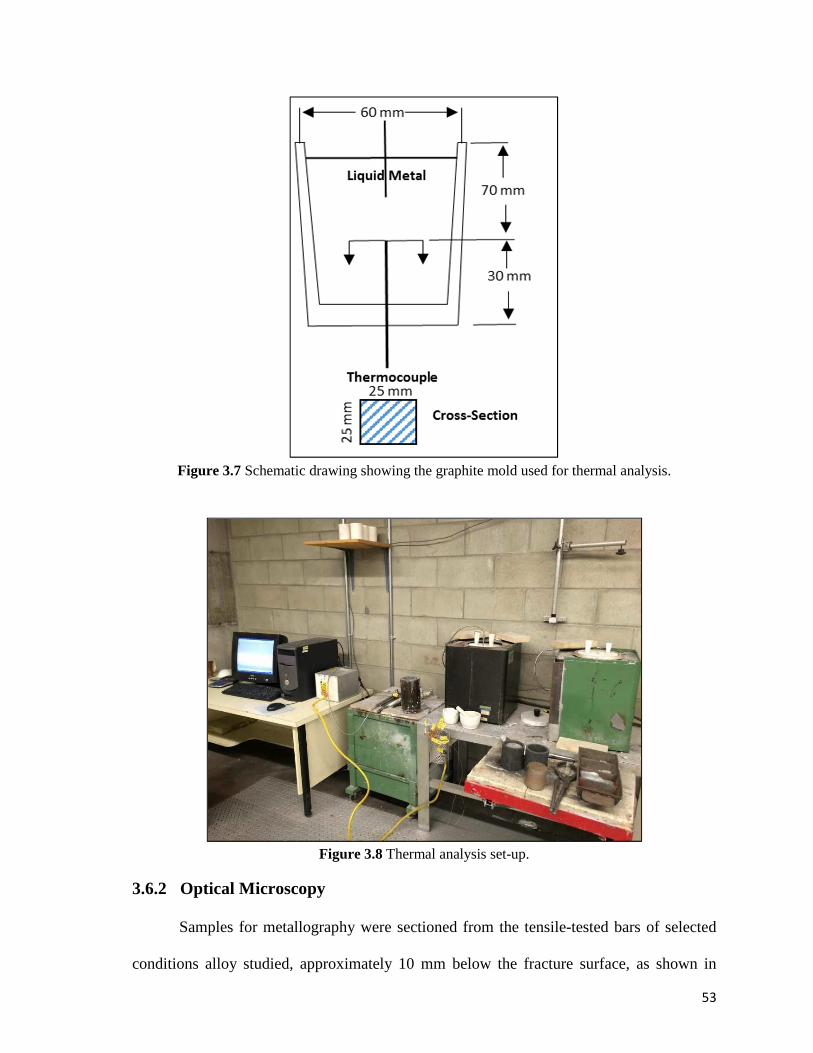
53
Figure 3.7 Schematic drawing showing the graphite mold used for thermal analysis.
Figure 3.8 Thermal analysis set-up.
3.6.2 Optical Microscopy
Samples for metallography were sectioned from the tensile-tested bars of selected
conditions alloy studied, approximately 10 mm below the fracture surface, as shown in
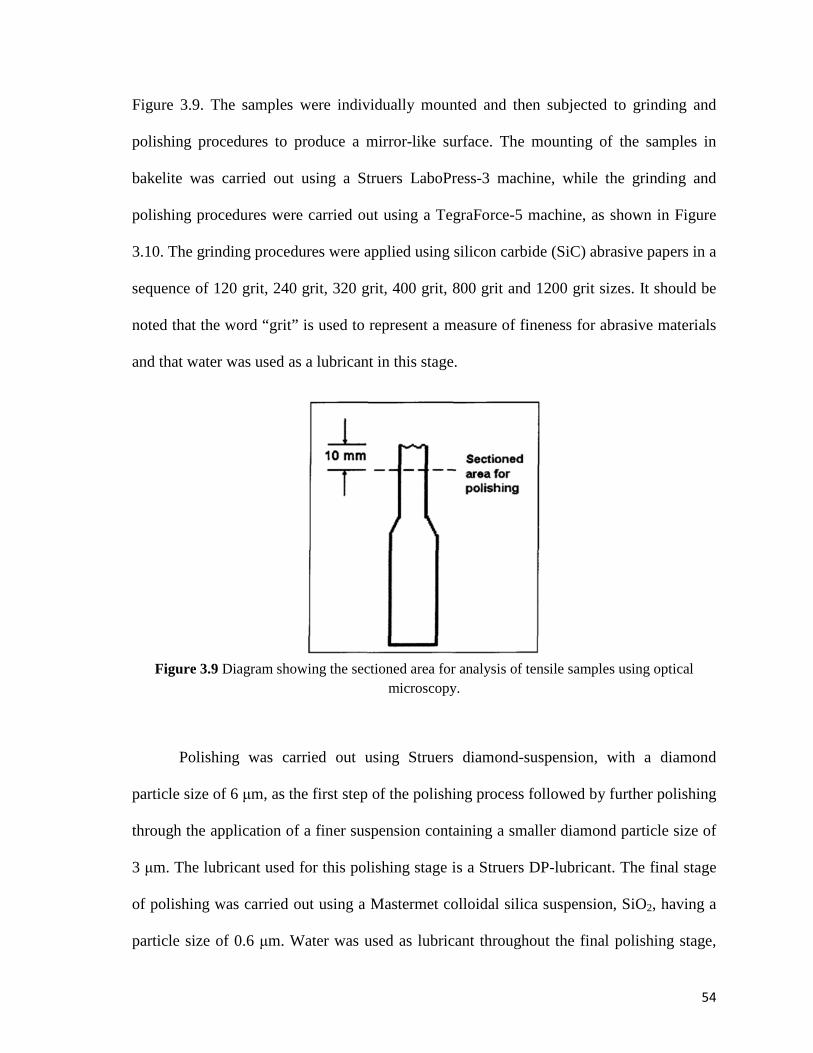
54
Figure 3.9. The samples were individually mounted and then subjected to grinding and
polishing procedures to produce a mirror-like surface. The mounting of the samples in
bakelite was carried out using a Struers LaboPress-3 machine, while the grinding and
polishing procedures were carried out using a TegraForce-5 machine, as shown in Figure
3.10. The grinding procedures were applied using silicon carbide (SiC) abrasive papers in a
sequence of 120 grit, 240 grit, 320 grit, 400 grit, 800 grit and 1200 grit sizes. It should be
noted that the word “grit” is used to represent a measure of fineness for abrasive materials
and that water was used as a lubricant in this stage.
Figure 3.9 Diagram showing the sectioned area for analysis of tensile samples using optical
microscopy.
Polishing was carried out using Struers diamond-suspension, with a diamond
particle size of 6 µm, as the first step of the polishing process followed by further polishing
through the application of a finer suspension containing a smaller diamond particle size of
3 µm. The lubricant used for this polishing stage is a Struers DP-lubricant. The final stage
of polishing was carried out using a Mastermet colloidal silica suspension, SiO2, having a
particle size of 0.6 µm. Water was used as lubricant throughout the final polishing stage,
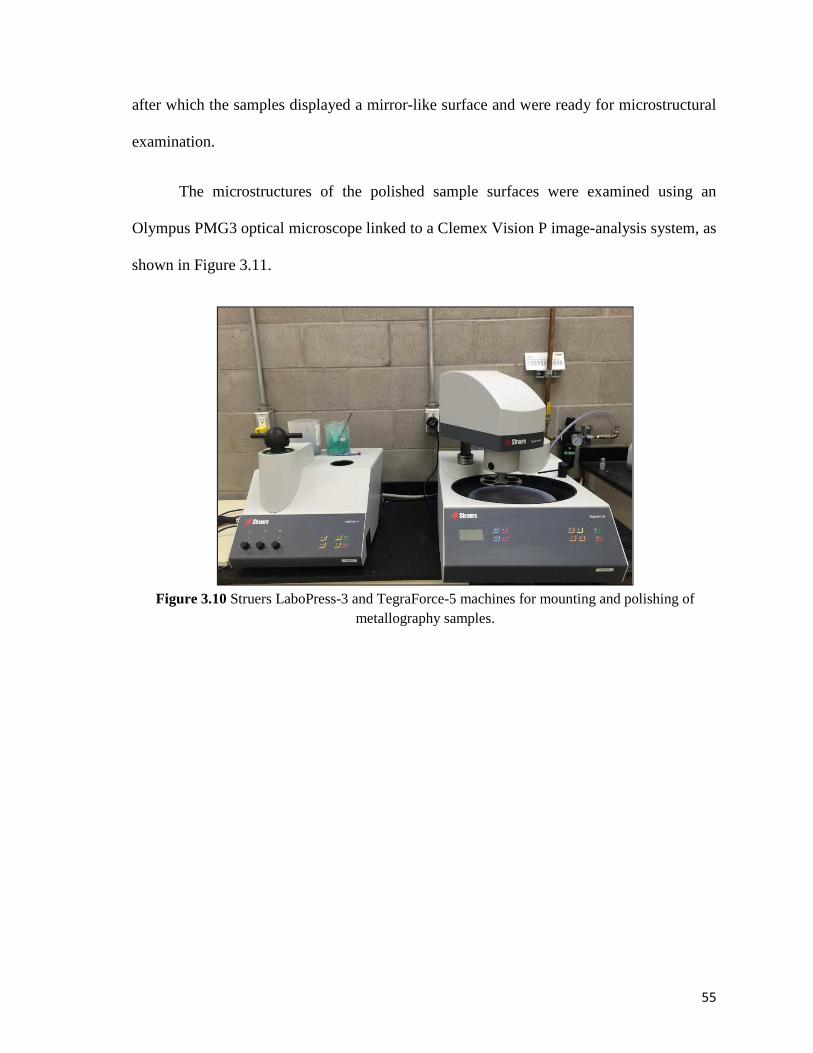
55
after which the samples displayed a mirror-like surface and were ready for microstructural
examination.
The microstructures of the polished sample surfaces were examined using an
Olympus PMG3 optical microscope linked to a Clemex Vision P image-analysis system, as
shown in Figure 3.11.
Figure 3.10 Struers LaboPress-3 and TegraForce-5 machines for mounting and polishing of
metallography samples.
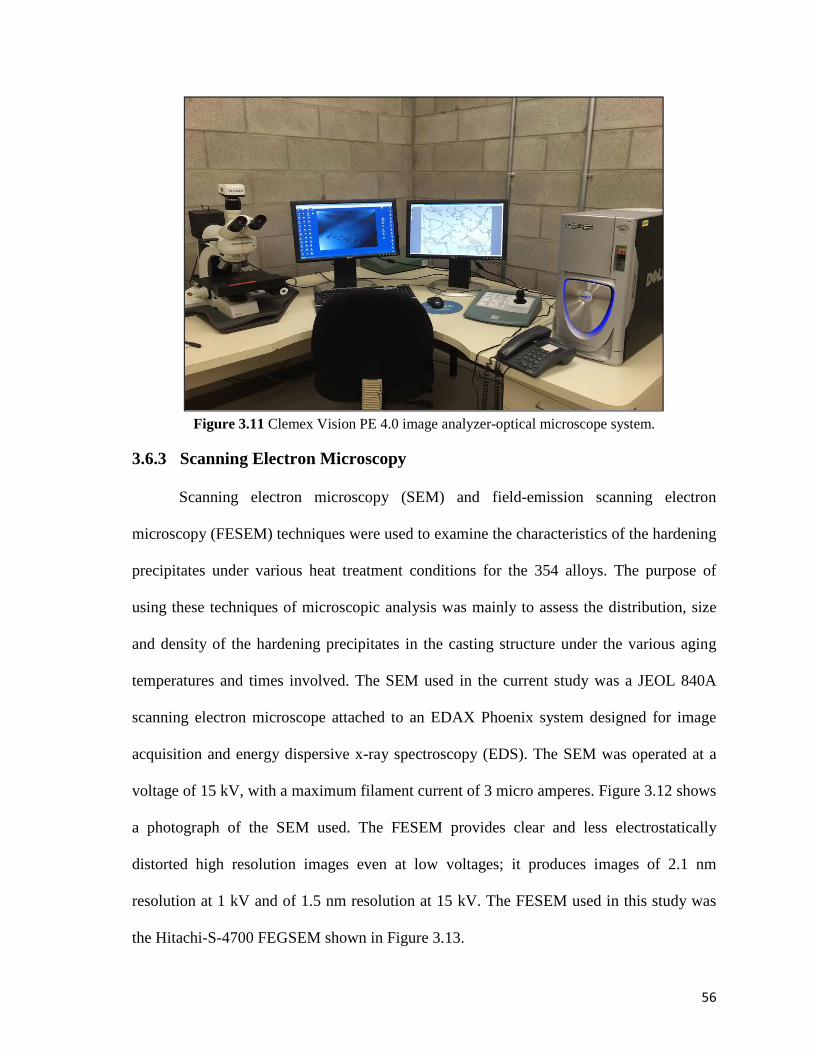
56
Figure 3.11 Clemex Vision PE 4.0 image analyzer-optical microscope system.
3.6.3 Scanning Electron Microscopy
Scanning electron microscopy (SEM) and field-emission scanning electron
microscopy (FESEM) techniques were used to examine the characteristics of the hardening
precipitates under various heat treatment conditions for the 354 alloys. The purpose of
using these techniques of microscopic analysis was mainly to assess the distribution, size
and density of the hardening precipitates in the casting structure under the various aging
temperatures and times involved. The SEM used in the current study was a JEOL 840A
scanning electron microscope attached to an EDAX Phoenix system designed for image
acquisition and energy dispersive x-ray spectroscopy (EDS). The SEM was operated at a
voltage of 15 kV, with a maximum filament current of 3 micro amperes. Figure 3.12 shows
a photograph of the SEM used. The FESEM provides clear and less electrostatically
distorted high resolution images even at low voltages; it produces images of 2.1 nm
resolution at 1 kV and of 1.5 nm resolution at 15 kV. The FESEM used in this study was
the Hitachi-S-4700 FEGSEM shown in Figure 3.13.
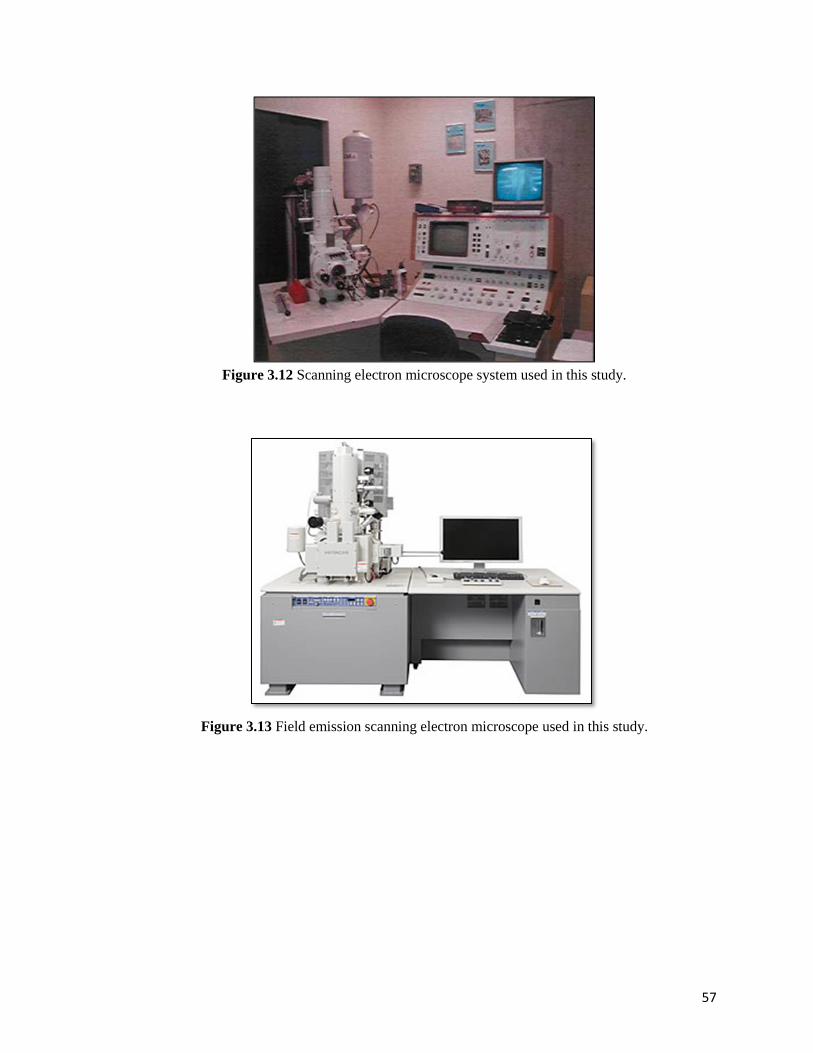
57
Figure 3.12 Scanning electron microscope system used in this study.
Figure 3.13 Field emission scanning electron microscope used in this study.

4 CHAPTER 4
MICROSTRUCTURE CHARACTERIZATION AND
POROSITY FORMATION
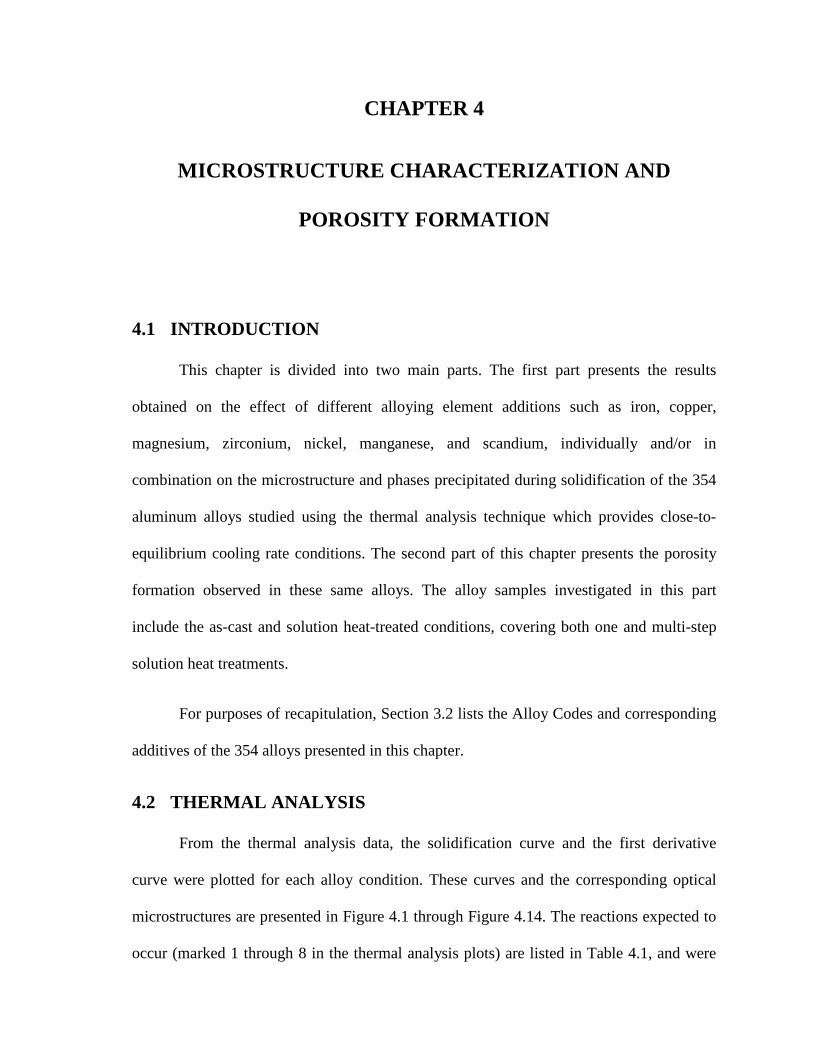
CHAPTER 4
MICROSTRUCTURE CHARACTERIZATION AND
POROSITY FORMATION
4.1 INTRODUCTION
This chapter is divided into two main parts. The first part presents the results
obtained on the effect of different alloying element additions such as iron, copper,
magnesium, zirconium, nickel, manganese, and scandium, individually and/or in
combination on the microstructure and phases precipitated during solidification of the 354
aluminum alloys studied using the thermal analysis technique which provides close-to-
equilibrium cooling rate conditions. The second part of this chapter presents the porosity
formation observed in these same alloys. The alloy samples investigated in this part
include the as-cast and solution heat-treated conditions, covering both one and multi-step
solution heat treatments.
For purposes of recapitulation, Section 3.2 lists the Alloy Codes and corresponding
additives of the 354 alloys presented in this chapter.
4.2 THERMAL ANALYSIS
From the thermal analysis data, the solidification curve and the first derivative
curve were plotted for each alloy condition. These curves and the corresponding optical
microstructures are presented in Figure 4.1 through Figure 4.14. The reactions expected to
occur (marked 1 through 8 in the thermal analysis plots) are listed in Table 4.1, and were
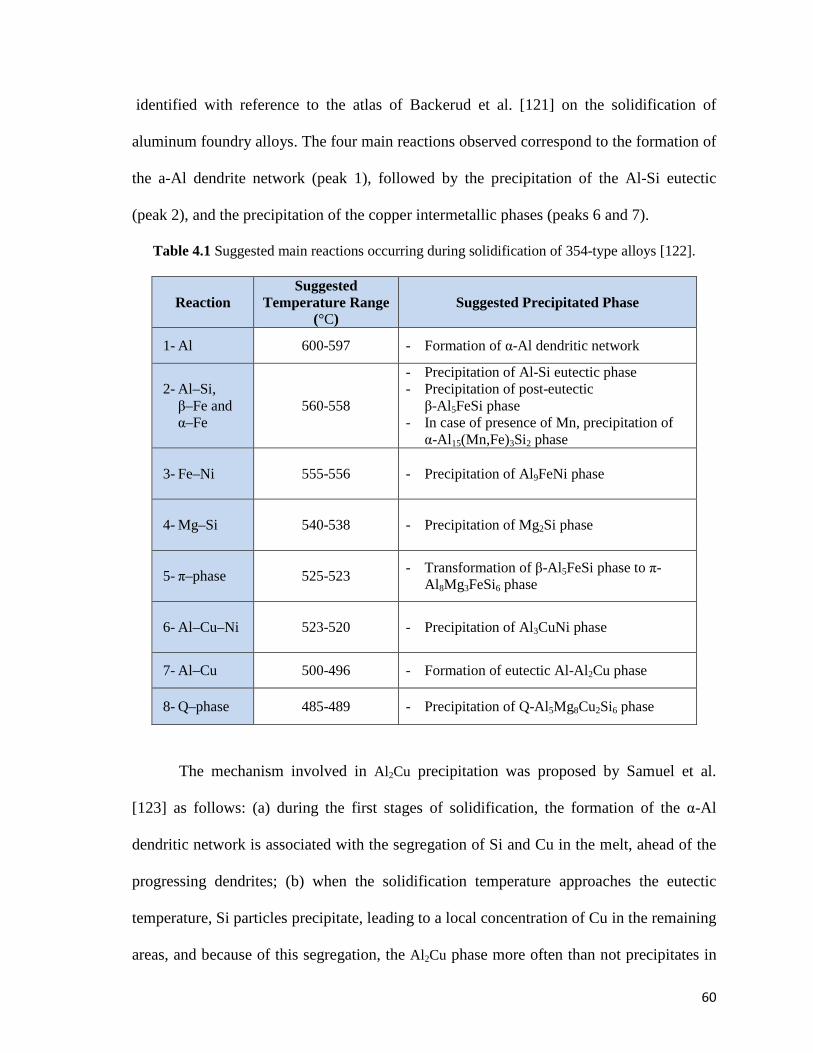
60
identified with reference to the atlas of Backerud et al. [121] on the solidification of
aluminum foundry alloys. The four main reactions observed correspond to the formation of
the a-Al dendrite network (peak 1), followed by the precipitation of the Al-Si eutectic
(peak 2), and the precipitation of the copper intermetallic phases (peaks 6 and 7).
Table 4.1 Suggested main reactions occurring during solidification of 354-type alloys [122].
The mechanism involved in Al 2Cu precipitation was proposed by Samuel et al.
[123] as follows: (a) during the first stages of solidification, the formation of the α-Al
dendritic network is associated with the segregation of Si and Cu in the melt, ahead of the
progressing dendrites; (b) when the solidification temperature approaches the eutectic
temperature, Si particles precipitate, leading to a local concentration of Cu in the remaining
areas, and because of this segregation, the Al 2Cu phase more often than not precipitates in
Reaction Suggested
Temperature Range (°C)
Suggested Precipitated Phase
1- Al 600-597 - Formation of α-Al dendritic network
2- Al–Si, β–Fe and α–Fe
560-558
- Precipitation of Al-Si eutectic phase - Precipitation of post-eutectic β-Al 5FeSi phase
- In case of presence of Mn, precipitation of α-Al 15(Mn,Fe)3Si2 phase
3- Fe–Ni
555-556
- Precipitation of Al9FeNi phase
4- Mg–Si
540-538
- Precipitation of Mg2Si phase
5- π–phase
525-523
- Transformation of β-Al 5FeSi phase to π-Al 8Mg3FeSi6 phase
6- Al–Cu–Ni
523-520
- Precipitation of Al3CuNi phase
7- Al–Cu 500-496 - Formation of eutectic Al-Al2Cu phase
8- Q–phase 485-489 - Precipitation of Q-Al5Mg8Cu2Si6 phase
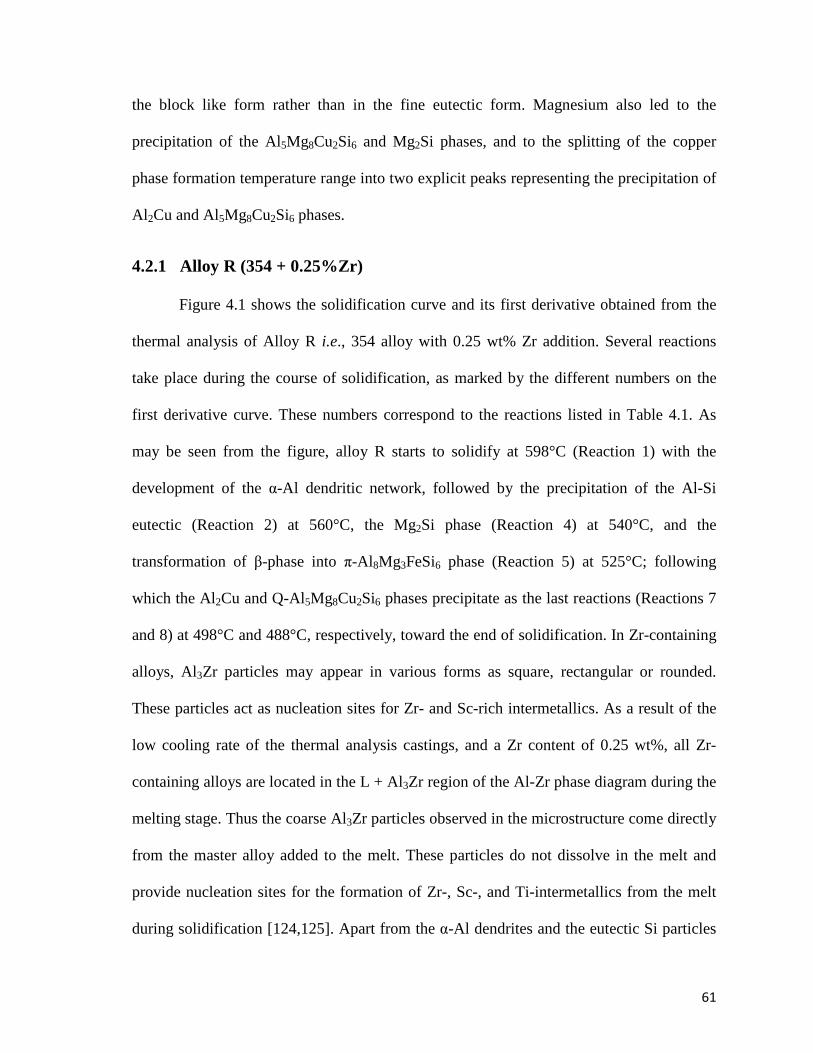
61
the block like form rather than in the fine eutectic form. Magnesium also led to the
precipitation of the Al5Mg8Cu2Si6 and Mg2Si phases, and to the splitting of the copper
phase formation temperature range into two explicit peaks representing the precipitation of
Al 2Cu and Al5Mg8Cu2Si6 phases.
4.2.1 Alloy R (354 + 0.25%Zr)
Figure 4.1 shows the solidification curve and its first derivative obtained from the
thermal analysis of Alloy R i.e., 354 alloy with 0.25 wt% Zr addition. Several reactions
take place during the course of solidification, as marked by the different numbers on the
first derivative curve. These numbers correspond to the reactions listed in Table 4.1. As
may be seen from the figure, alloy R starts to solidify at 598°C (Reaction 1) with the
development of the α-Al dendritic network, followed by the precipitation of the Al-Si
eutectic (Reaction 2) at 560°C, the Mg2Si phase (Reaction 4) at 540°C, and the
transformation of β-phase into π-Al 8Mg3FeSi6 phase (Reaction 5) at 525°C; following
which the Al2Cu and Q-Al5Mg8Cu2Si6 phases precipitate as the last reactions (Reactions 7
and 8) at 498°C and 488°C, respectively, toward the end of solidification. In Zr-containing
alloys, Al3Zr particles may appear in various forms as square, rectangular or rounded.
These particles act as nucleation sites for Zr- and Sc-rich intermetallics. As a result of the
low cooling rate of the thermal analysis castings, and a Zr content of 0.25 wt%, all Zr-
containing alloys are located in the L + Al3Zr region of the Al-Zr phase diagram during the
melting stage. Thus the coarse Al3Zr particles observed in the microstructure come directly
from the master alloy added to the melt. These particles do not dissolve in the melt and
provide nucleation sites for the formation of Zr-, Sc-, and Ti-intermetallics from the melt
during solidification [124,125]. Apart from the α-Al dendrites and the eutectic Si particles
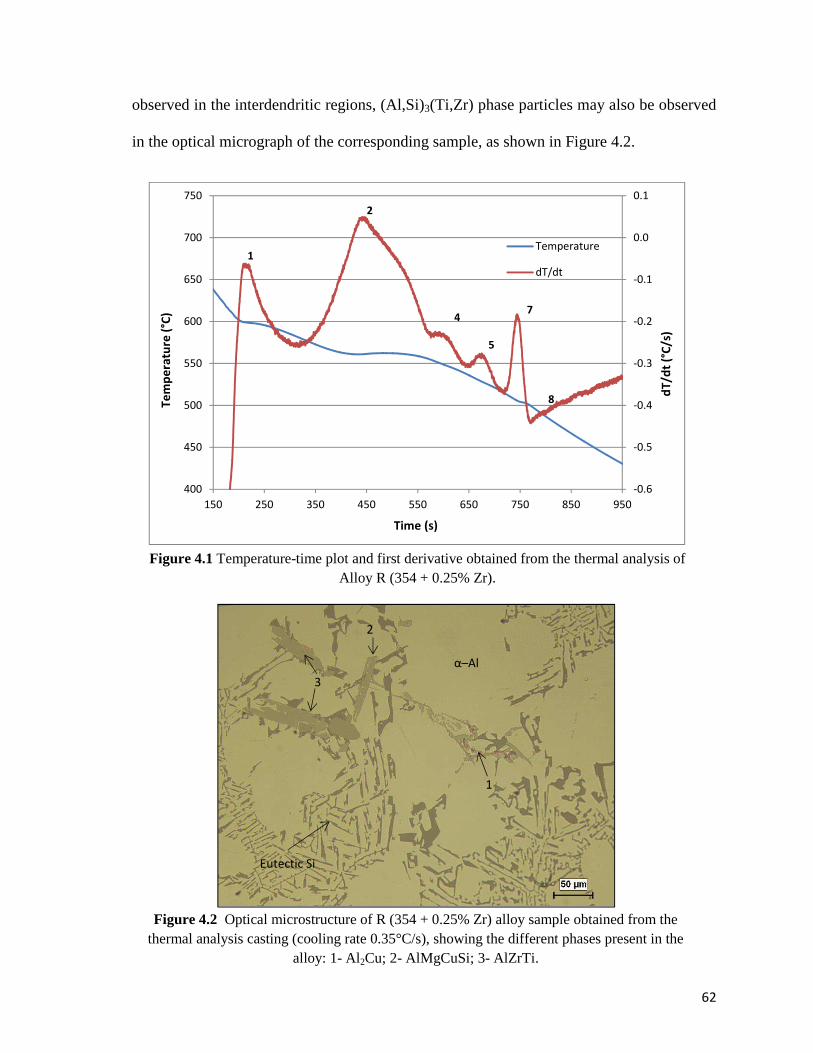
62
observed in the interdendritic regions, (Al,Si)3(Ti,Zr) phase particles may also be observed
in the optical micrograph of the corresponding sample, as shown in Figure 4.2.
Figure 4.1 Temperature-time plot and first derivative obtained from the thermal analysis of
Alloy R (354 + 0.25% Zr).
-0.6
-0.5
-0.4
-0.3
-0.2
-0.1
0.0
0.1
400
450
500
550
600
650
700
750
150 250 350 450 550 650 750 850 950
dT
/dt
(°C
/s)
Te
mp
era
ture
(°C
)
Time (s)
Temperature
dT/dt
Figure 4.2 Optical microstructure of R (354 + 0.25% Zr) alloy sample obtained from the
thermal analysis casting (cooling rate 0.35°C/s), showing the different phases present in the alloy: 1- Al2Cu; 2- AlMgCuSi; 3- AlZrTi.
1
2
4
5
7
8
Eutectic Si
α–Al
1
2
3
63
4.2.2 Alloy S (354 + 0.25%Zr + 2%Ni)
The thermal analysis results for Alloy S i.e., 354 alloy containing 2 wt% Ni + 0.25
wt% Zr are plotted in Figure 4.3. The presence of Ni results in the precipitation of Ni-
containing phases, represented by the Reactions 3 and 6 as noted on the first derivative
curve. In addition, due to the presence of Zr and Fe in Alloy S, another precipitate is
formed, namely, AlSiNiZrFe besides the AlFeNi phase.
Figure 4.3 Temperature-time plot and first derivative from the thermal analysis of
Alloy S (354 + 2% Ni + 0.25% Zr).
The presence of the Q-Al5Mg8Cu2Si6 and Mg2Si phases under the low solidification
rate conditions of the thermal analysis experiment primarily depends on the Mg content.
Although the Q-phase and Mg2Si phase reactions were observed in the first derivative
curve of alloy R, the proportion of Mg2Si formed increased as the Mg level increased, as
evidenced by Figures 4.3 and 4.4 in the case of Alloy S. It is also interesting to note from
-0.6
-0.5
-0.4
-0.3
-0.2
-0.1
0.0
0.1
400
450
500
550
600
650
700
750
150 250 350 450 550 650 750 850 950d
T/d
t (°
C/s
)
Te
mp
era
ture
(°C
)
Time (s)
Temperature
dT/dt1
2
7
3
8
4
6
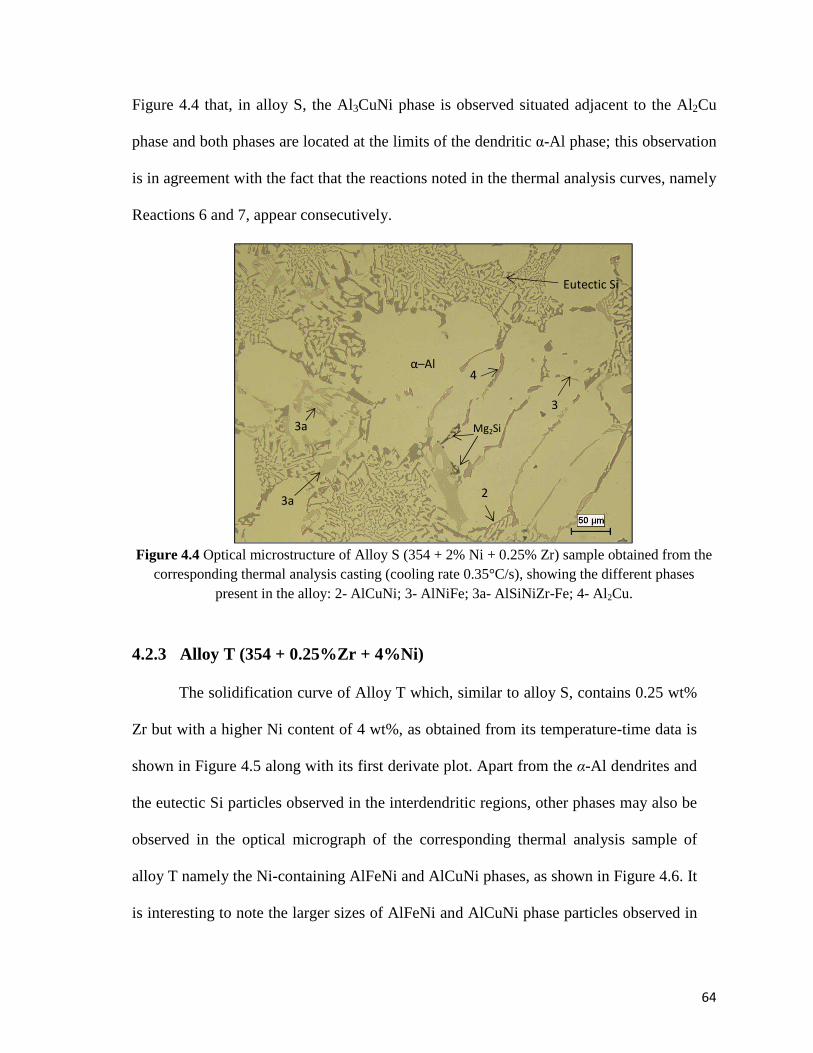
64
Figure 4.4 that, in alloy S, the Al3CuNi phase is observed situated adjacent to the Al2Cu
phase and both phases are located at the limits of the dendritic α-Al phase; this observation
is in agreement with the fact that the reactions noted in the thermal analysis curves, namely
Reactions 6 and 7, appear consecutively.
Figure 4.4 Optical microstructure of Alloy S (354 + 2% Ni + 0.25% Zr) sample obtained from the
corresponding thermal analysis casting (cooling rate 0.35°C/s), showing the different phases present in the alloy: 2- AlCuNi; 3- AlNiFe; 3a- AlSiNiZr-Fe; 4- Al2Cu.
4.2.3 Alloy T (354 + 0.25%Zr + 4%Ni)
The solidification curve of Alloy T which, similar to alloy S, contains 0.25 wt%
Zr but with a higher Ni content of 4 wt%, as obtained from its temperature-time data is
shown in Figure 4.5 along with its first derivate plot. Apart from the α-Al dendrites and
the eutectic Si particles observed in the interdendritic regions, other phases may also be
observed in the optical micrograph of the corresponding thermal analysis sample of
alloy T namely the Ni-containing AlFeNi and AlCuNi phases, as shown in Figure 4.6. It
is interesting to note the larger sizes of AlFeNi and AlCuNi phase particles observed in
Eutectic Si
α–Al
Mg2Si
2
3
3a
3a
4
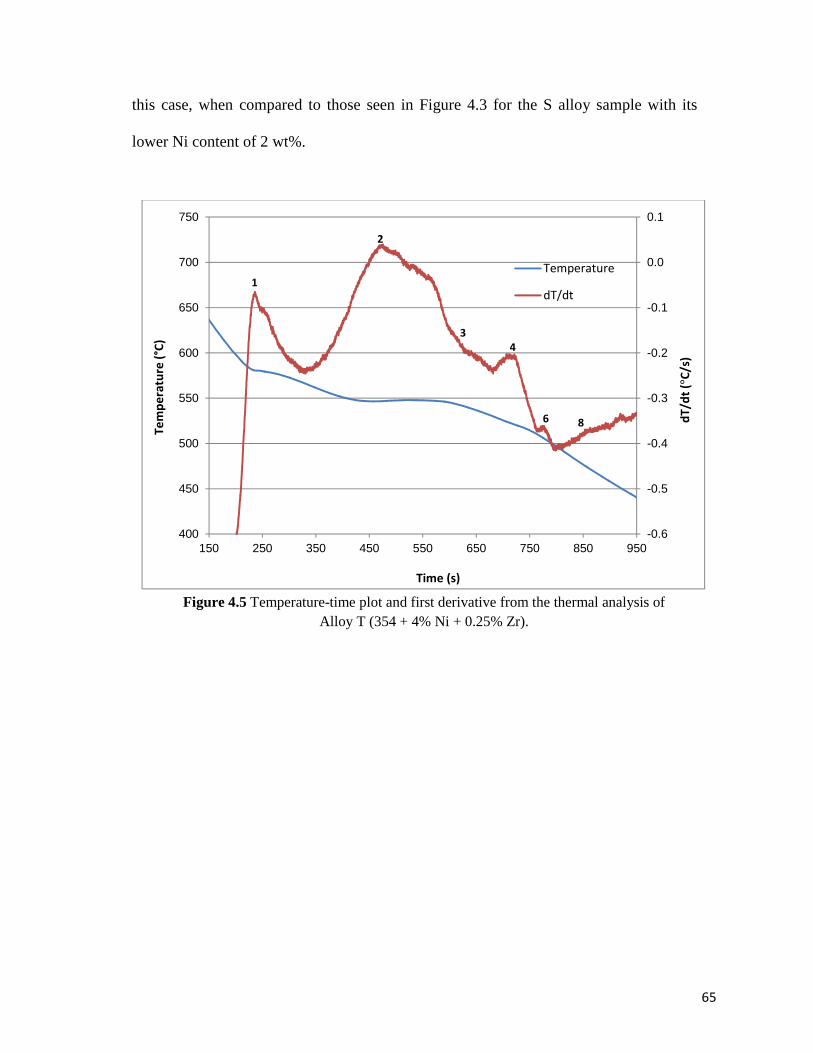
65
this case, when compared to those seen in Figure 4.3 for the S alloy sample with its
lower Ni content of 2 wt%.
Figure 4.5 Temperature-time plot and first derivative from the thermal analysis of
Alloy T (354 + 4% Ni + 0.25% Zr).
-0.6
-0.5
-0.4
-0.3
-0.2
-0.1
0.0
0.1
400
450
500
550
600
650
700
750
150 250 350 450 550 650 750 850 950
dT
/dt
(°C
/s)
Te
mp
era
ture
(°C
)
Time (s)
Temperature
dT/dt1
2
4
3
6 8
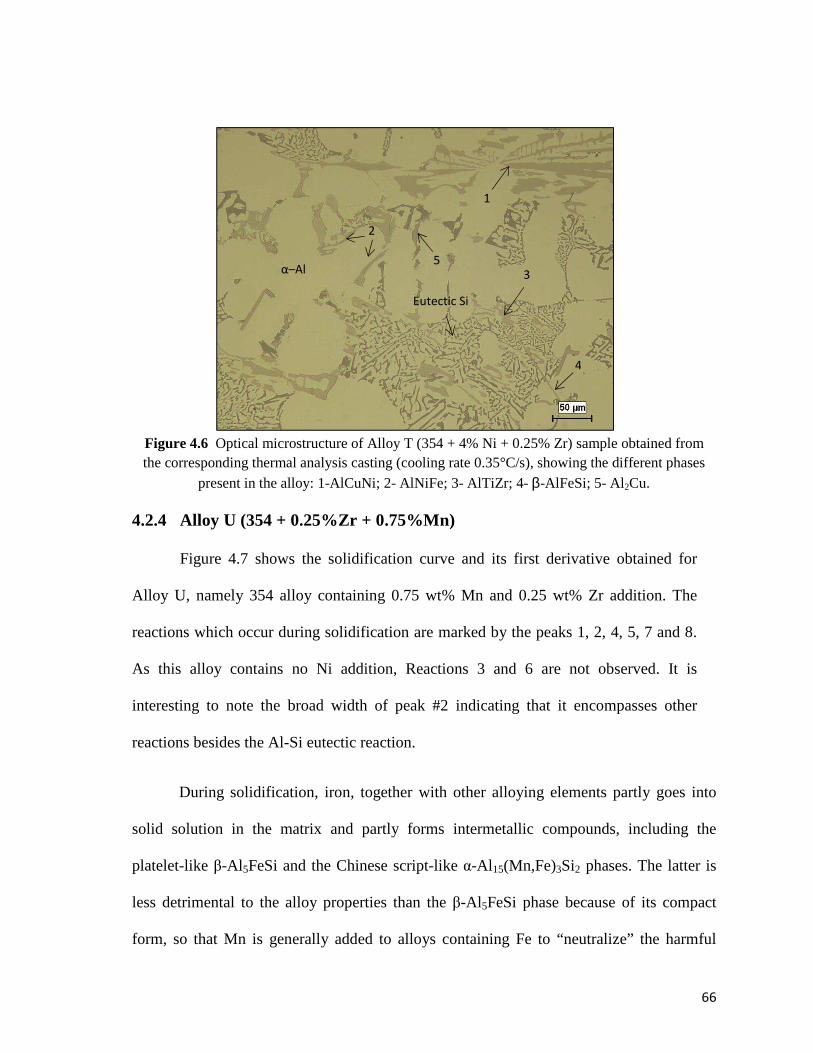
66
4.2.4 Alloy U (354 + 0.25%Zr + 0.75%Mn)
Figure 4.7 shows the solidification curve and its first derivative obtained for
Alloy U, namely 354 alloy containing 0.75 wt% Mn and 0.25 wt% Zr addition. The
reactions which occur during solidification are marked by the peaks 1, 2, 4, 5, 7 and 8.
As this alloy contains no Ni addition, Reactions 3 and 6 are not observed. It is
interesting to note the broad width of peak #2 indicating that it encompasses other
reactions besides the Al-Si eutectic reaction.
During solidification, iron, together with other alloying elements partly goes into
solid solution in the matrix and partly forms intermetallic compounds, including the
platelet-like β-Al 5FeSi and the Chinese script-like α-Al 15(Mn,Fe)3Si2 phases. The latter is
less detrimental to the alloy properties than the β-Al 5FeSi phase because of its compact
form, so that Mn is generally added to alloys containing Fe to “neutralize” the harmful
Figure 4.6 Optical microstructure of Alloy T (354 + 4% Ni + 0.25% Zr) sample obtained from the corresponding thermal analysis casting (cooling rate 0.35°C/s), showing the different phases
present in the alloy: 1-AlCuNi; 2- AlNiFe; 3- AlTiZr; 4- β-AlFeSi; 5- Al2Cu.
Eutectic Si
α–Al 5
1
3
2
4
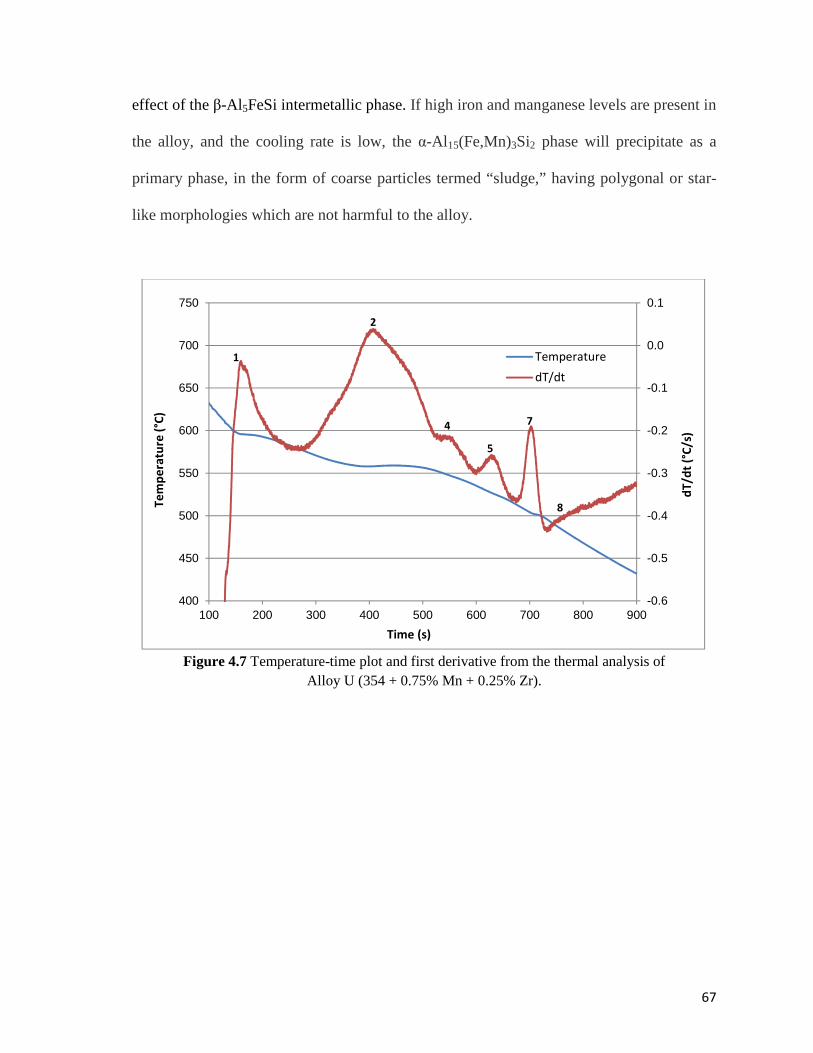
67
effect of the β-Al 5FeSi intermetallic phase. If high iron and manganese levels are present in
the alloy, and the cooling rate is low, the α-Al 15(Fe,Mn)3Si2 phase will precipitate as a
primary phase, in the form of coarse particles termed “sludge,” having polygonal or star-
like morphologies which are not harmful to the alloy.
Figure 4.7 Temperature-time plot and first derivative from the thermal analysis of
Alloy U (354 + 0.75% Mn + 0.25% Zr).
-0.6
-0.5
-0.4
-0.3
-0.2
-0.1
0.0
0.1
400
450
500
550
600
650
700
750
100 200 300 400 500 600 700 800 900
dT
/dt
(°C
/s)
Te
mp
era
ture
(°C
)
Time (s)
Temperature
dT/dt
1
2
4
5
7
8
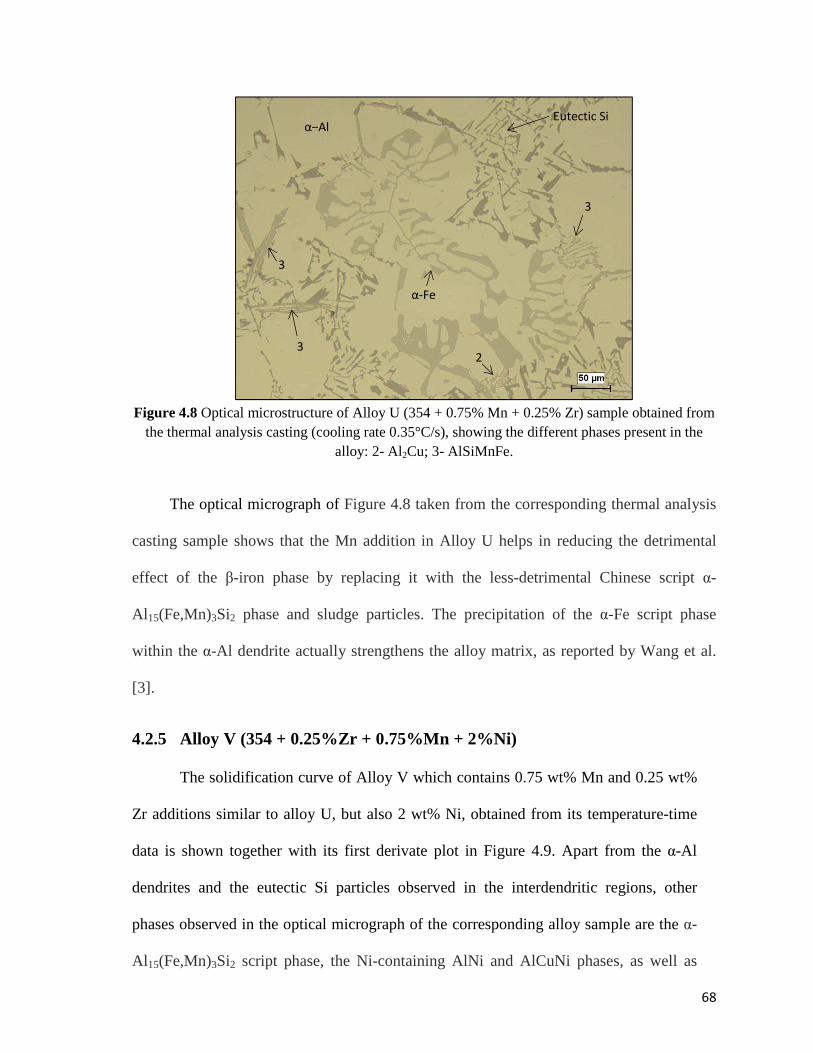
68
Figure 4.8 Optical microstructure of Alloy U (354 + 0.75% Mn + 0.25% Zr) sample obtained from
the thermal analysis casting (cooling rate 0.35°C/s), showing the different phases present in the alloy: 2- Al2Cu; 3- AlSiMnFe.
The optical micrograph of Figure 4.8 taken from the corresponding thermal analysis
casting sample shows that the Mn addition in Alloy U helps in reducing the detrimental
effect of the β-iron phase by replacing it with the less-detrimental Chinese script α-
Al 15(Fe,Mn)3Si2 phase and sludge particles. The precipitation of the α-Fe script phase
within the α-Al dendrite actually strengthens the alloy matrix, as reported by Wang et al.
[3].
4.2.5 Alloy V (354 + 0.25%Zr + 0.75%Mn + 2%Ni)
The solidification curve of Alloy V which contains 0.75 wt% Mn and 0.25 wt%
Zr additions similar to alloy U, but also 2 wt% Ni, obtained from its temperature-time
data is shown together with its first derivate plot in Figure 4.9. Apart from the α-Al
dendrites and the eutectic Si particles observed in the interdendritic regions, other
phases observed in the optical micrograph of the corresponding alloy sample are the α-
Al 15(Fe,Mn)3Si2 script phase, the Ni-containing AlNi and AlCuNi phases, as well as
Eutectic Si α–Al
α-Fe
2
3
3
3
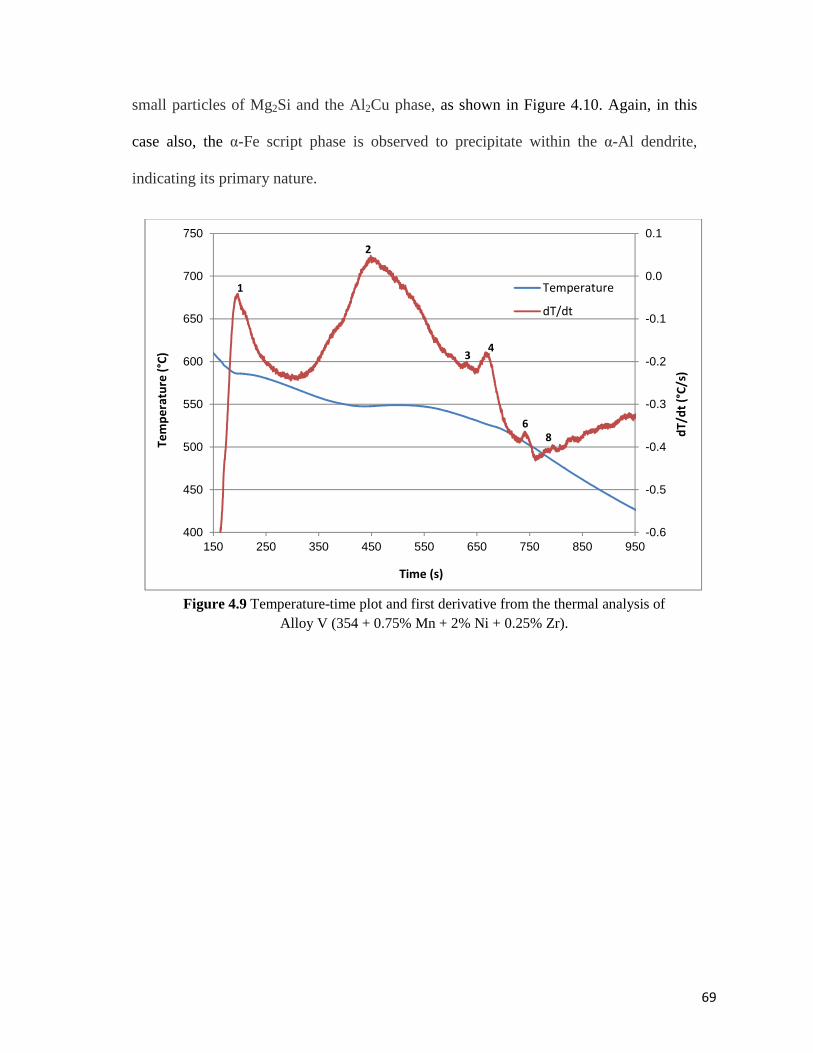
69
small particles of Mg2Si and the Al2Cu phase, as shown in Figure 4.10. Again, in this
case also, the α-Fe script phase is observed to precipitate within the α-Al dendrite,
indicating its primary nature.
Figure 4.9 Temperature-time plot and first derivative from the thermal analysis of
Alloy V (354 + 0.75% Mn + 2% Ni + 0.25% Zr).
-0.6
-0.5
-0.4
-0.3
-0.2
-0.1
0.0
0.1
400
450
500
550
600
650
700
750
150 250 350 450 550 650 750 850 950
dT
/dt
(°C
/s)
Te
mp
era
ture
(°C
)
Time (s)
Temperature
dT/dt
1
2
34
8
6
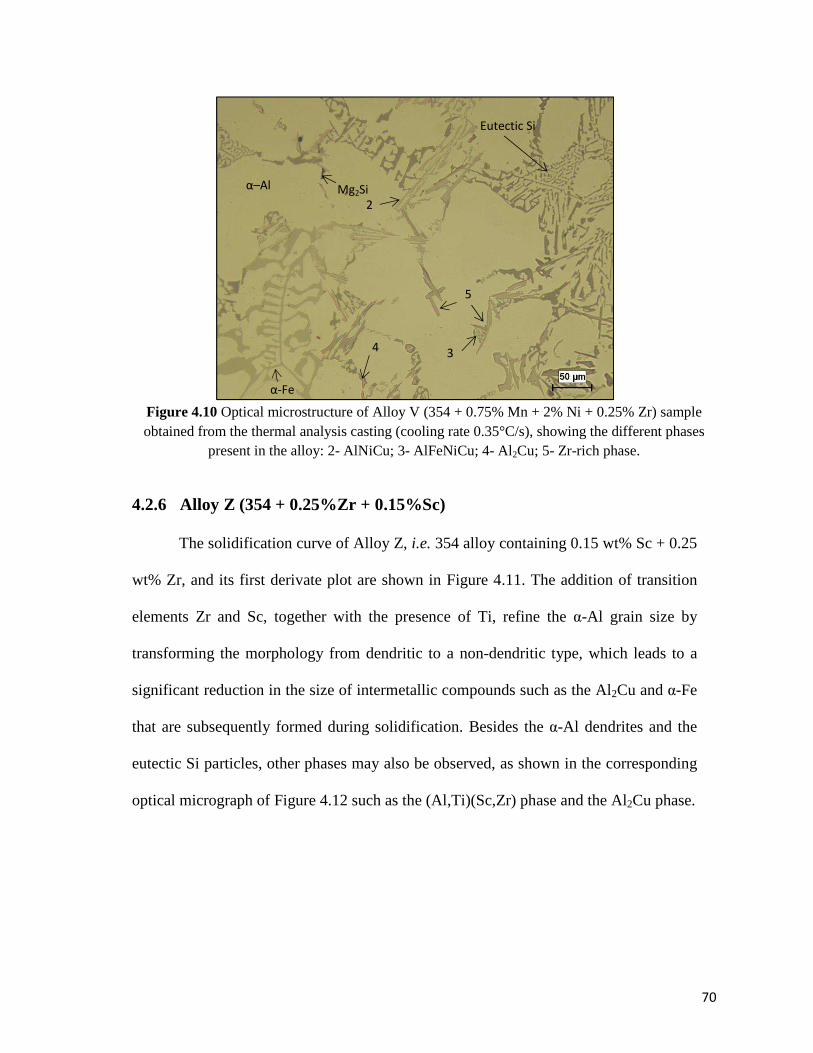
70
Figure 4.10 Optical microstructure of Alloy V (354 + 0.75% Mn + 2% Ni + 0.25% Zr) sample obtained from the thermal analysis casting (cooling rate 0.35°C/s), showing the different phases
present in the alloy: 2- AlNiCu; 3- AlFeNiCu; 4- Al2Cu; 5- Zr-rich phase.
4.2.6 Alloy Z (354 + 0.25%Zr + 0.15%Sc)
The solidification curve of Alloy Z, i.e. 354 alloy containing 0.15 wt% Sc + 0.25
wt% Zr, and its first derivate plot are shown in Figure 4.11. The addition of transition
elements Zr and Sc, together with the presence of Ti, refine the α-Al grain size by
transforming the morphology from dendritic to a non-dendritic type, which leads to a
significant reduction in the size of intermetallic compounds such as the Al2Cu and α-Fe
that are subsequently formed during solidification. Besides the α-Al dendrites and the
eutectic Si particles, other phases may also be observed, as shown in the corresponding
optical micrograph of Figure 4.12 such as the (Al,Ti)(Sc,Zr) phase and the Al2Cu phase.
Eutectic Si
α–Al Mg2Si
α-Fe
4
5
3
2
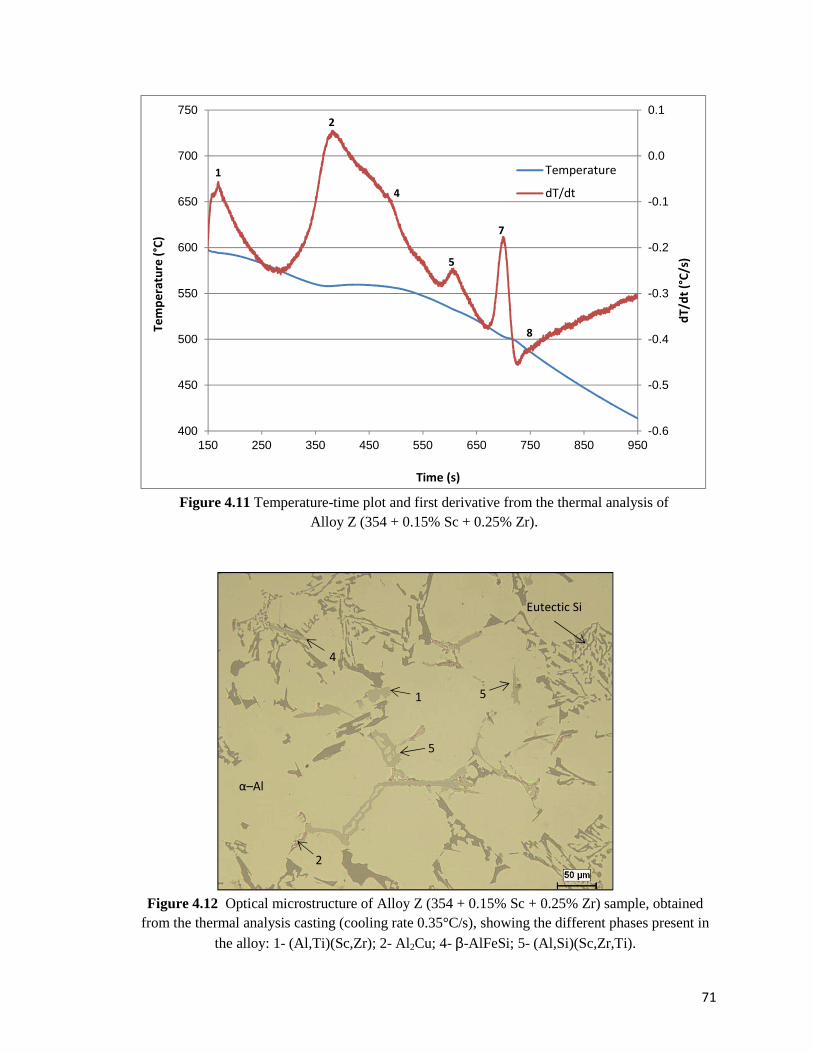
71
Figure 4.11 Temperature-time plot and first derivative from the thermal analysis of
Alloy Z (354 + 0.15% Sc + 0.25% Zr).
-0.6
-0.5
-0.4
-0.3
-0.2
-0.1
0.0
0.1
400
450
500
550
600
650
700
750
150 250 350 450 550 650 750 850 950
dT
/dt
(°C
/s)
Te
mp
era
ture
(°C
)
Time (s)
Temperature
dT/dt
1
2
4
5
7
8
Figure 4.12 Optical microstructure of Alloy Z (354 + 0.15% Sc + 0.25% Zr) sample, obtained
from the thermal analysis casting (cooling rate 0.35°C/s), showing the different phases present in the alloy: 1- (Al,Ti)(Sc,Zr); 2- Al2Cu; 4- β-AlFeSi; 5- (Al,Si)(Sc,Zr,Ti).
Eutectic Si
α–Al
5
1 5
2
4
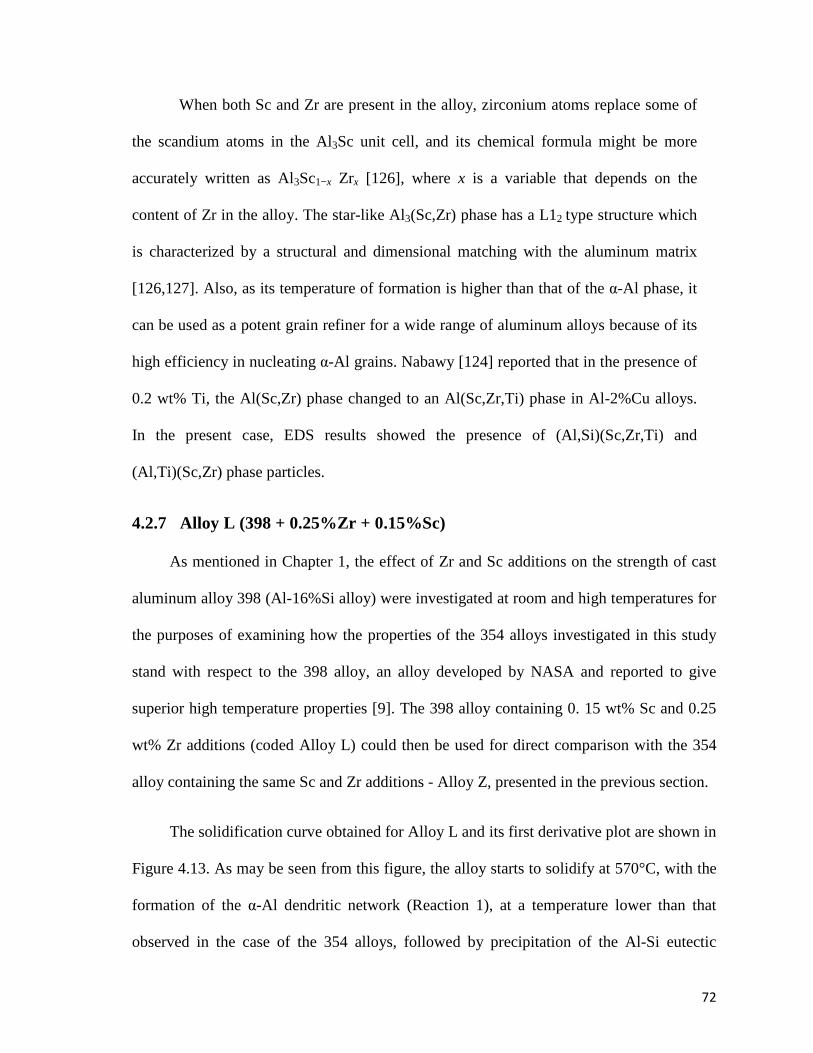
72
When both Sc and Zr are present in the alloy, zirconium atoms replace some of
the scandium atoms in the Al3Sc unit cell, and its chemical formula might be more
accurately written as Al3Sc1−x Zrx [126], where x is a variable that depends on the
content of Zr in the alloy. The star-like Al3(Sc,Zr) phase has a L12 type structure which
is characterized by a structural and dimensional matching with the aluminum matrix
[126,127]. Also, as its temperature of formation is higher than that of the α-Al phase, it
can be used as a potent grain refiner for a wide range of aluminum alloys because of its
high efficiency in nucleating α-Al grains. Nabawy [124] reported that in the presence of
0.2 wt% Ti, the Al(Sc,Zr) phase changed to an Al(Sc,Zr,Ti) phase in Al-2%Cu alloys.
In the present case, EDS results showed the presence of (Al,Si)(Sc,Zr,Ti) and
(Al,Ti)(Sc,Zr) phase particles.
4.2.7 Alloy L (398 + 0.25%Zr + 0.15%Sc)
As mentioned in Chapter 1, the effect of Zr and Sc additions on the strength of cast
aluminum alloy 398 (Al-16%Si alloy) were investigated at room and high temperatures for
the purposes of examining how the properties of the 354 alloys investigated in this study
stand with respect to the 398 alloy, an alloy developed by NASA and reported to give
superior high temperature properties [9]. The 398 alloy containing 0. 15 wt% Sc and 0.25
wt% Zr additions (coded Alloy L) could then be used for direct comparison with the 354
alloy containing the same Sc and Zr additions - Alloy Z, presented in the previous section.
The solidification curve obtained for Alloy L and its first derivative plot are shown in
Figure 4.13. As may be seen from this figure, the alloy starts to solidify at 570°C, with the
formation of the α-Al dendritic network (Reaction 1), at a temperature lower than that
observed in the case of the 354 alloys, followed by precipitation of the Al-Si eutectic
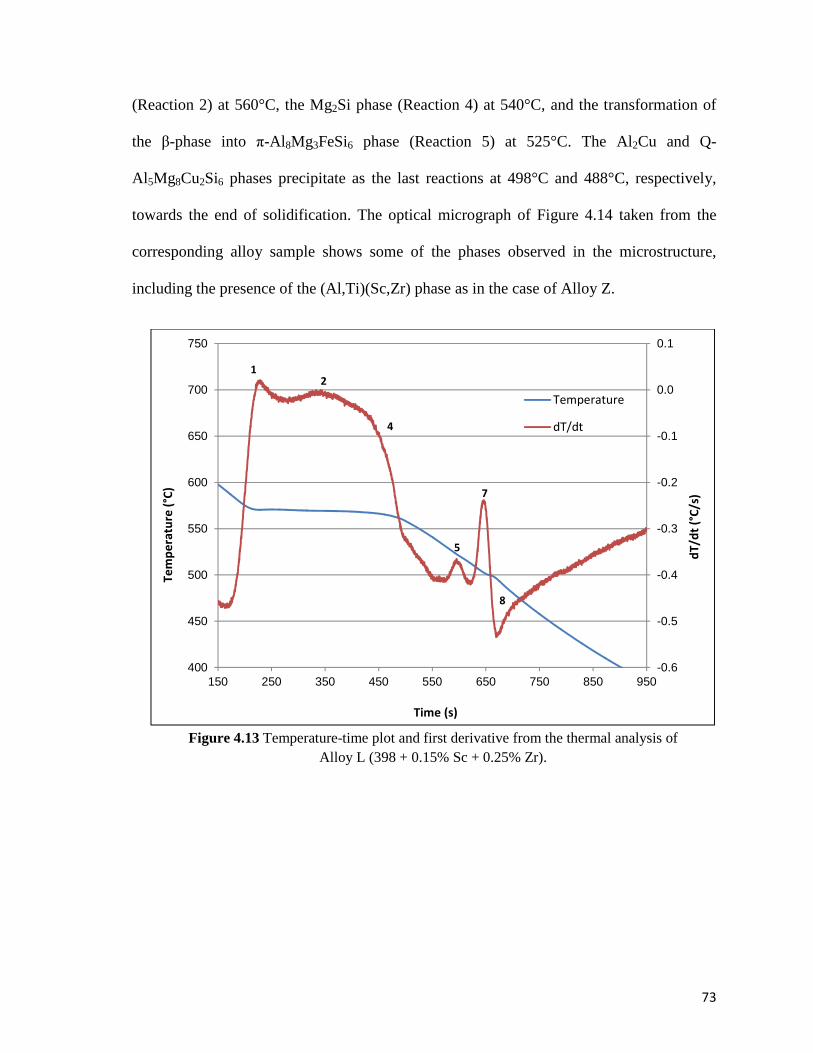
73
(Reaction 2) at 560°C, the Mg2Si phase (Reaction 4) at 540°C, and the transformation of
the β-phase into π-Al 8Mg3FeSi6 phase (Reaction 5) at 525°C. The Al2Cu and Q-
Al 5Mg8Cu2Si6 phases precipitate as the last reactions at 498°C and 488°C, respectively,
towards the end of solidification. The optical micrograph of Figure 4.14 taken from the
corresponding alloy sample shows some of the phases observed in the microstructure,
including the presence of the (Al,Ti)(Sc,Zr) phase as in the case of Alloy Z.
Figure 4.13 Temperature-time plot and first derivative from the thermal analysis of
Alloy L (398 + 0.15% Sc + 0.25% Zr).
-0.6
-0.5
-0.4
-0.3
-0.2
-0.1
0.0
0.1
400
450
500
550
600
650
700
750
150 250 350 450 550 650 750 850 950d
T/d
t (°
C/s
)
Te
mp
era
ture
(°C
)
Time (s)
Temperature
dT/dt
12
4
5
7
8
74
Figure 4.14 Optical microstructure of Alloy L (398 + 0.15% Sc + 0.25% Zr) sample obtained from the thermal analysis casting (cooling rate 0.35°C/s), showing the different phases present
in the alloy: 1- Al2Cu; 2- β-AlFeSi; 3- (Al,Si)(Sc,Zr); 4- π-AlMgFeSi.
4.3 POROSITY FORMATION DUE TO INCIPIENT MELTING
Solution heat treatment is carried out to maximize the concentration of hardening
elements such as Mg and Cu in solid solution, to homogenize the casting, and to alter the
structure of the eutectic silicon particles in order to improve the mechanical properties. In
Al-Si-Cu-Mg alloys, control of the solution treatment process is very critical because, if
the solution heat treatment temperature exceeds the melting point, there is localized
melting at the grain boundaries and the mechanical properties are reduced. In this study,
the alloys were heat treated using two different solution heat treatment processes: one step
and multi-step solution treatments. The multi-step solution heat treatment is carried out at
three different temperatures consecutively, for different solution times, viz., 5 hours at
495°C, then 2 hours at 515°C, and then 2 hours at 530°C. A main consequence of incipient
melting in Al–Si–Cu–Mg alloys is the melting of the Al2Cu phase. As reported by de la
Sablonnière and Samuel [128], the Al2Cu intermetallic may melt at 525 °C, so that when
Eutectic Si
α–Al
3
1 2
4
75
the temperature of the multi-step solution heat treatment reaches 530°C, or when local
heating occurs at any point in the sample, it is expected that the Al2Cu phase will melt,
causing the formation of porosity and, in turn, a deterioration in the mechanical properties.
In the present study, all alloy melts were degassed to minimize the hydrogen level
before casting. The only variable factor with respect to the cast samples would be the
temperature, depending on the solution heat treatment conditions. Hence, any relatively
significant changes in the porosity characteristics could be reasonably attributed to the
melting of the copper phase(s) resulting from the changes in the temperature variable.
Therefore, porosity measurements were carried out to monitor the incipient melting that
resulted in the alloys studied, corresponding to the various solution heat treatments. The
porosity characteristics resulting from incipient melting were examined and quantified
using an optical microscope-Clemex Vision PE 4.0 image analysis system. Ten fields were
examined for each alloy sample, at 200x magnification. The porosity parameters measured
were the average area percent porosity (percentage porosity over a constant sample surface
area), and the average pore area, total pore area (SUM) and the pore count. These values
are listed in Table 4.2.
As may be seen from Table 4.2, the as-cast samples for all alloys show minimum
porosity, whereas after solution heat treatment, the porosity values increase. In general,
compared to the one step or SHT 1 treatment, the multi-step solution treatment leads to
somewhat higher porosity values for the 354 alloys, whereas for Alloy L (398 + Zr + Sc),
the one-step solution heat treatment results in a higher porosity value. This trend may be
noted more clearly in the column showing the SUM or total area of the pores measured in
each sample.

76
It is worthwhile mentioning here that while these measurements provide
quantitative results per se, they should be considered in a qualitative light overall, when
discussing the influence of such porosity (resulting from incipient melting) on the
mechanical properties of these alloys, which will be presented in the next chapter.
The microstructures of the alloys studied were examined at high magnification
(500x) to highlight some of the interesting features observed with respect to the incipient
melting-related porosity observed in the as-cast, SHT 1 and SHT 2 samples corresponding
to each alloy, as well as the effect of the progress of solution heat treatment on the micro-
constituents themselves.
Table 4.2 Porosity measurements for Alloys R, S, T, U, V, Z and L.
Alloy Code Condition Area (%) Pore Area (µm²)
Mean SD Mean SD SUM Count
R As Cast 0.012 0.005 0.614 0.14 183 317 SHT 1 0.063 0.018 4.45 4 1105.8 388 SHT 2 0.067 0.035 12.45 7.36 1483.5 127
S As Cast 0.024 0.048 1.98 2.25 221.2 226 SHT 1 0.075 0.032 8.98 7.38 1639.4 498 SHT 2 0.087 0.038 3.5 2.88 1920.8 760
T As Cast 0.0082 0.006 2.13 1.76 180.1 79 SHT 1 0.0629 0.0344 7.35 6.18 1378.1 268 SHT 2 0.1 0.037 4.5 2.96 2214.2 693
U As Cast 0.02 0.021 2.08 8.35 441.2 212 SHT 1 0.09 0.045 22 38.4 1959.2 89 SHT 2 0.087 0.054 6.81 19.3 1913 281
V As Cast 0.011 0.011 1.16 2.61 238 206 SHT 1 0.078 0.055 5.59 25.1 1710.9 306 SHT 2 0.097 0.071 6.32 19.5 2130 337
Z As Cast 0.021 0.019 2.81 7.44 461.2 164 SHT 1 0.088 0.159 20 35 1939.5 97 SHT 2 0.099 0.063 16.3 38.6 2168.5 133
L As Cast 0.009 0.0056 2.09 3.33 198.9 95 SHT 1 0.105 0.042 5.23 21.2 2305.8 441 SHT 2 0.086 0.029 6.64 21.6 1886.6 284
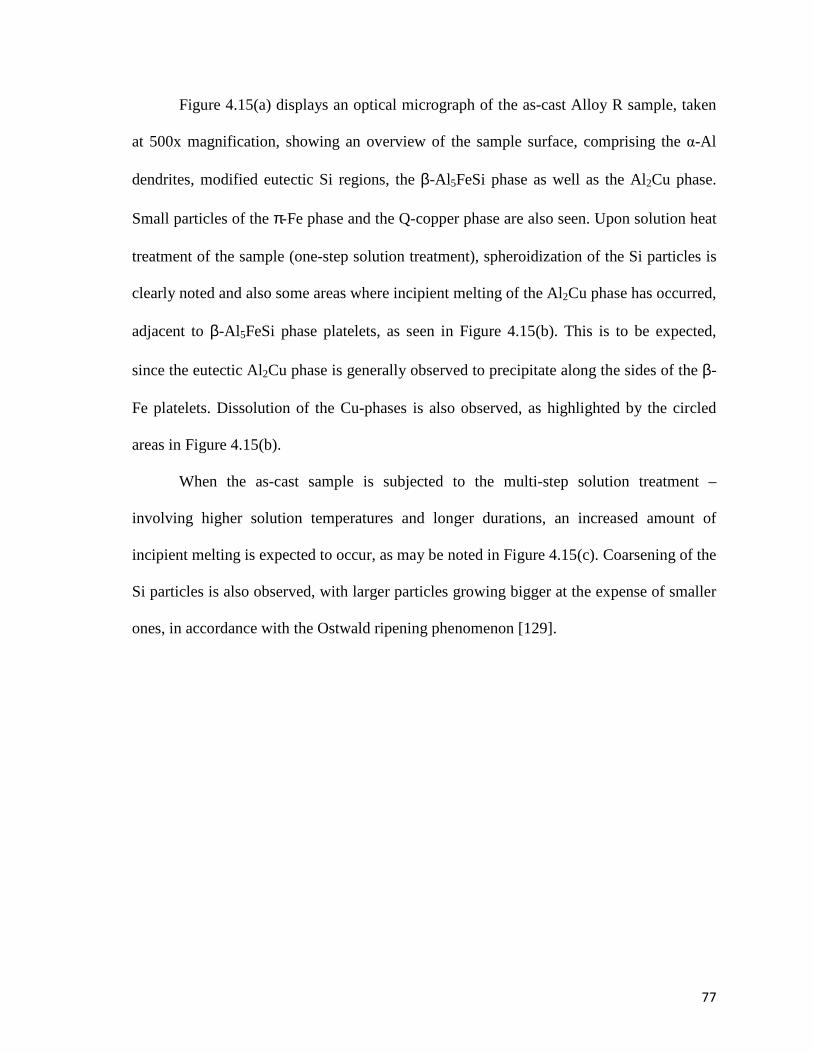
77
Figure 4.15(a) displays an optical micrograph of the as-cast Alloy R sample, taken
at 500x magnification, showing an overview of the sample surface, comprising the α-Al
dendrites, modified eutectic Si regions, the β-Al5FeSi phase as well as the Al2Cu phase.
Small particles of the π-Fe phase and the Q-copper phase are also seen. Upon solution heat
treatment of the sample (one-step solution treatment), spheroidization of the Si particles is
clearly noted and also some areas where incipient melting of the Al2Cu phase has occurred,
adjacent to β-Al 5FeSi phase platelets, as seen in Figure 4.15(b). This is to be expected,
since the eutectic Al2Cu phase is generally observed to precipitate along the sides of the β-
Fe platelets. Dissolution of the Cu-phases is also observed, as highlighted by the circled
areas in Figure 4.15(b).
When the as-cast sample is subjected to the multi-step solution treatment –
involving higher solution temperatures and longer durations, an increased amount of
incipient melting is expected to occur, as may be noted in Figure 4.15(c). Coarsening of the
Si particles is also observed, with larger particles growing bigger at the expense of smaller
ones, in accordance with the Ostwald ripening phenomenon [129].
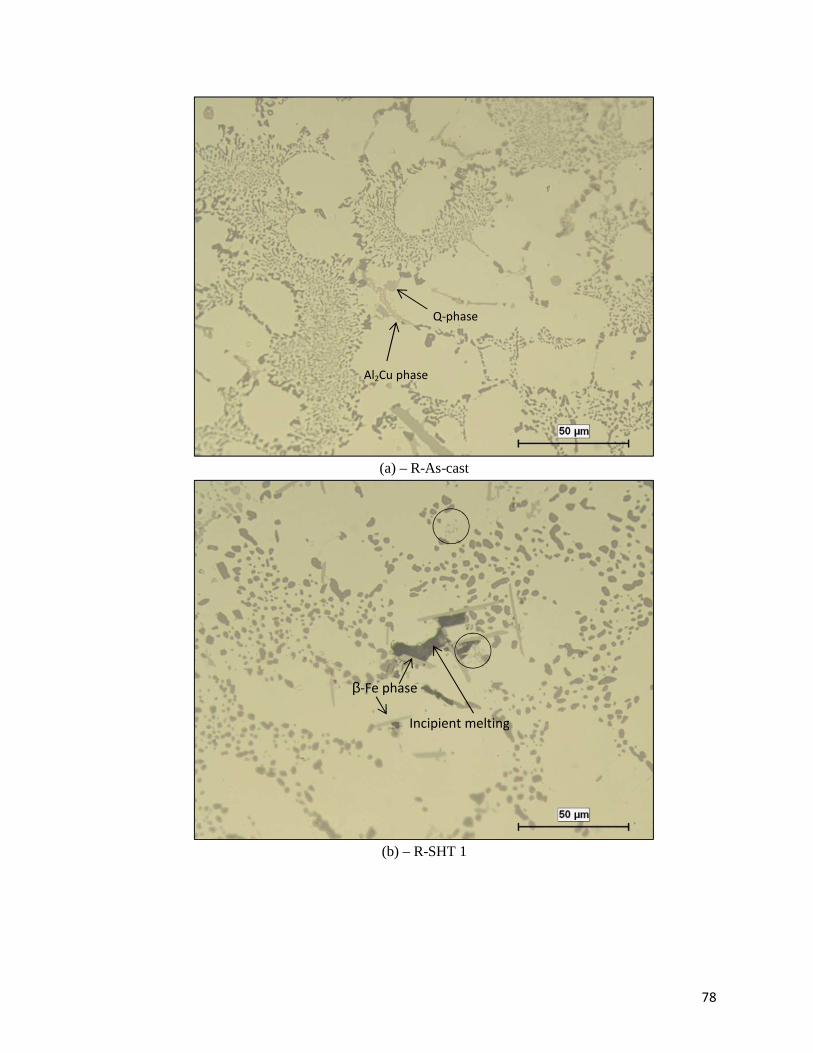
78
(a) – R-As-cast
(b) – R-SHT 1
Q-phase
Al2Cu phase
β-Fe phase
Incipient melting
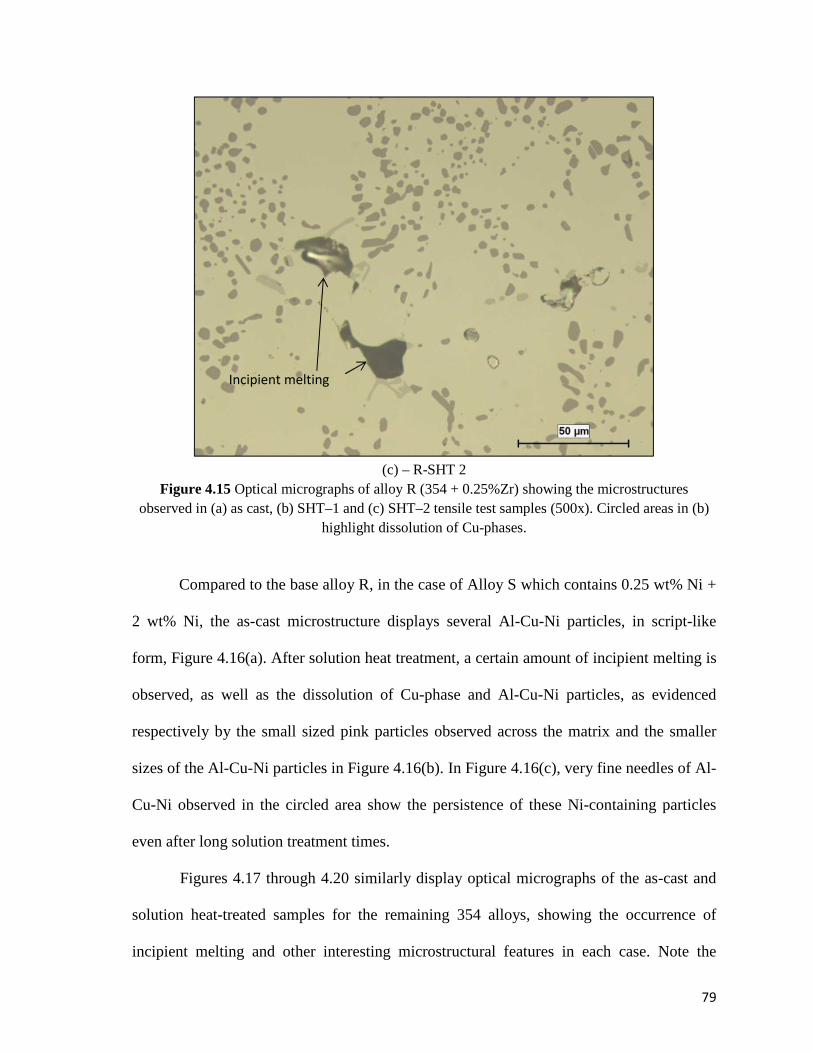
79
(c) – R-SHT 2
Figure 4.15 Optical micrographs of alloy R (354 + 0.25%Zr) showing the microstructures observed in (a) as cast, (b) SHT–1 and (c) SHT–2 tensile test samples (500x). Circled areas in (b)
highlight dissolution of Cu-phases.
Compared to the base alloy R, in the case of Alloy S which contains 0.25 wt% Ni +
2 wt% Ni, the as-cast microstructure displays several Al-Cu-Ni particles, in script-like
form, Figure 4.16(a). After solution heat treatment, a certain amount of incipient melting is
observed, as well as the dissolution of Cu-phase and Al-Cu-Ni particles, as evidenced
respectively by the small sized pink particles observed across the matrix and the smaller
sizes of the Al-Cu-Ni particles in Figure 4.16(b). In Figure 4.16(c), very fine needles of Al-
Cu-Ni observed in the circled area show the persistence of these Ni-containing particles
even after long solution treatment times.
Figures 4.17 through 4.20 similarly display optical micrographs of the as-cast and
solution heat-treated samples for the remaining 354 alloys, showing the occurrence of
incipient melting and other interesting microstructural features in each case. Note the
Incipient melting
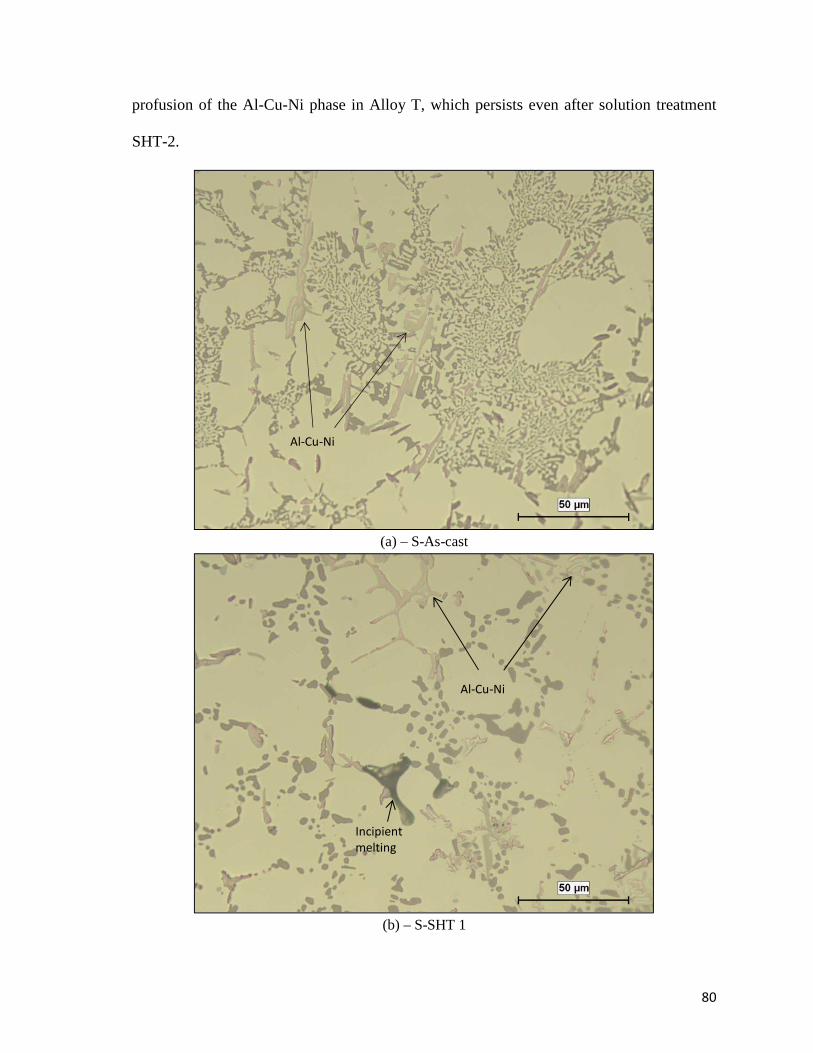
80
profusion of the Al-Cu-Ni phase in Alloy T, which persists even after solution treatment
SHT-2.
(a) – S-As-cast
(b) – S-SHT 1
Al-Cu-Ni
Incipient
melting
Al-Cu-Ni
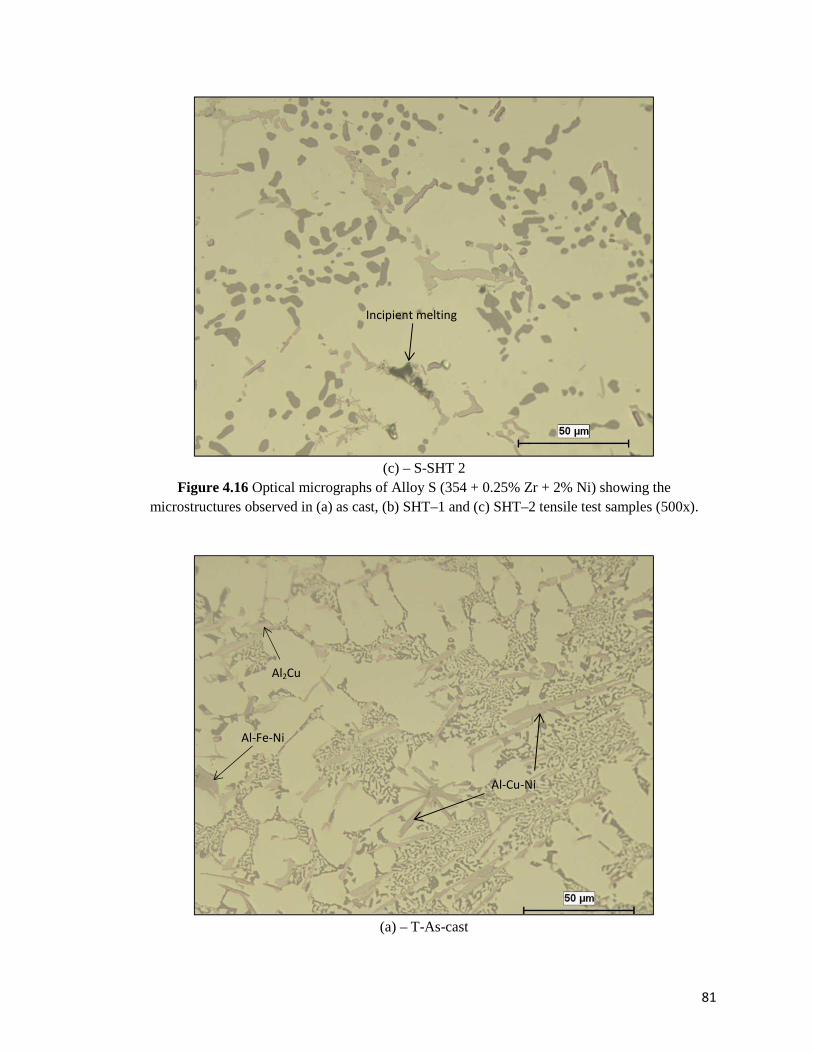
81
(c) – S-SHT 2 Figure 4.16 Optical micrographs of Alloy S (354 + 0.25% Zr + 2% Ni) showing the
microstructures observed in (a) as cast, (b) SHT–1 and (c) SHT–2 tensile test samples (500x).
(a) – T-As-cast
Incipient melting
Al2Cu
Al-Cu-Ni
Al-Fe-Ni
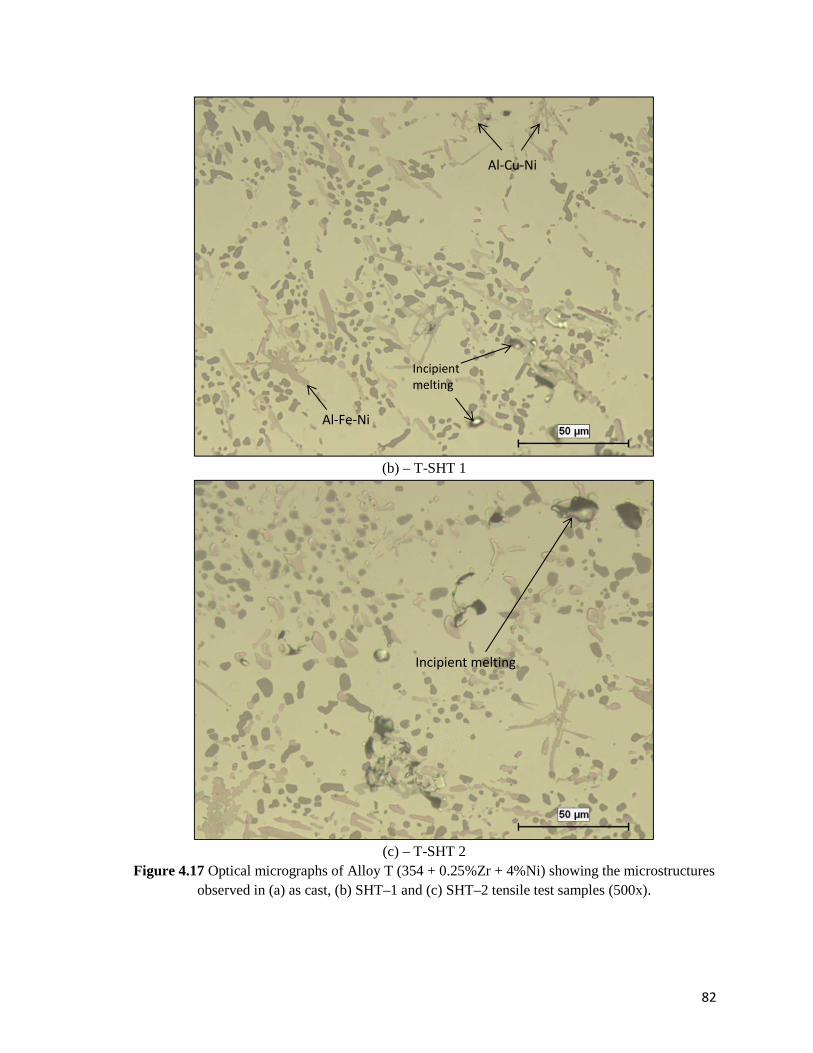
82
(b) – T-SHT 1
(c) – T-SHT 2 Figure 4.17 Optical micrographs of Alloy T (354 + 0.25%Zr + 4%Ni) showing the microstructures
observed in (a) as cast, (b) SHT–1 and (c) SHT–2 tensile test samples (500x).
Incipient
melting
Incipient melting
Al-Cu-Ni
Al-Fe-Ni
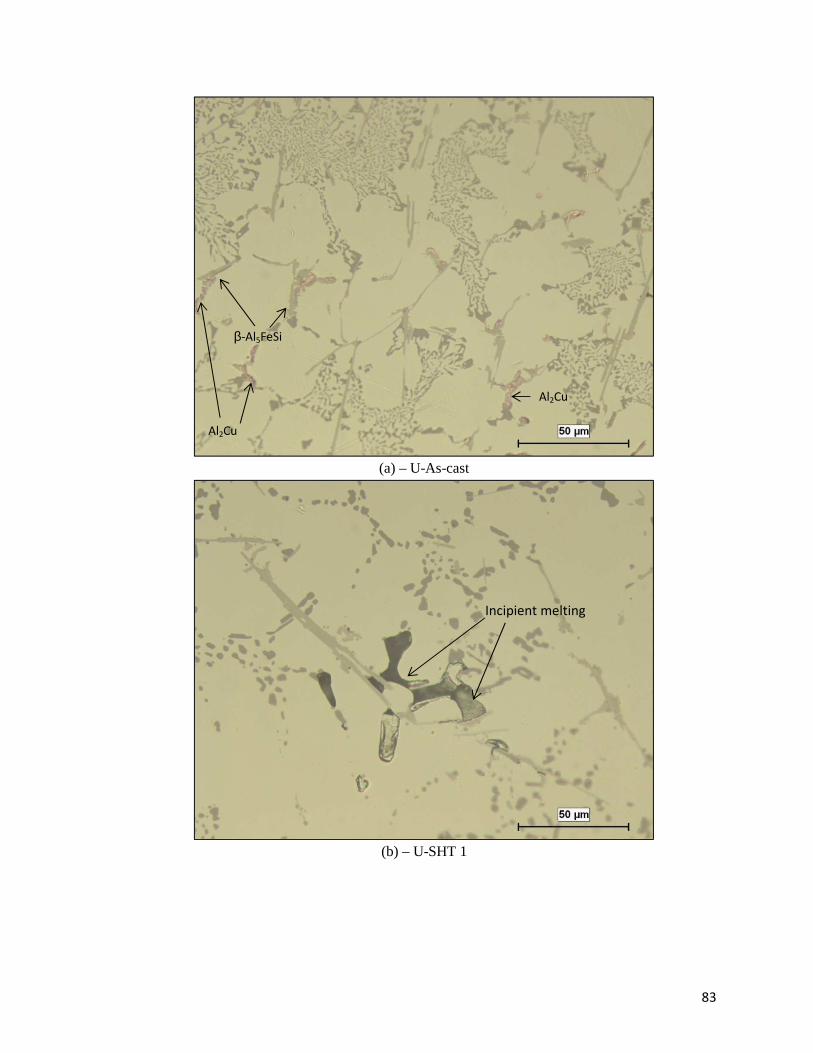
83
(a) – U-As-cast
(b) – U-SHT 1
β-Al5FeSi
Al2Cu
Al2Cu
Incipient melting
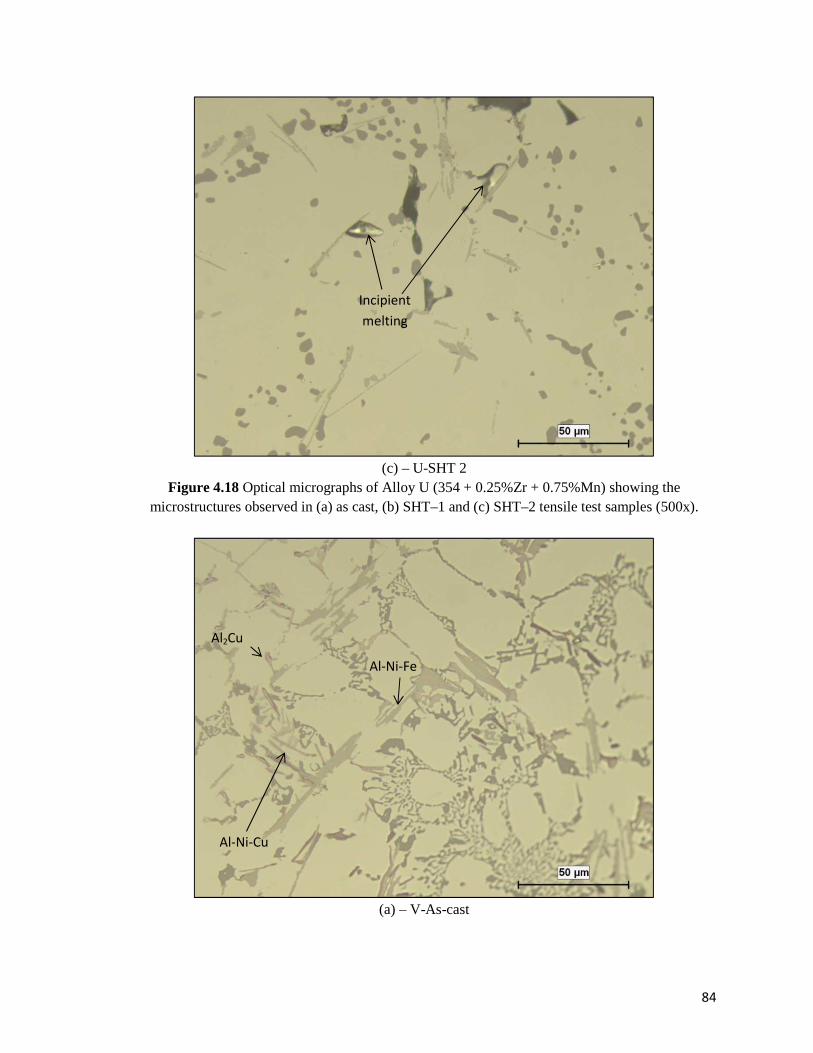
84
(c) – U-SHT 2 Figure 4.18 Optical micrographs of Alloy U (354 + 0.25%Zr + 0.75%Mn) showing the
microstructures observed in (a) as cast, (b) SHT–1 and (c) SHT–2 tensile test samples (500x).
(a) – V-As-cast
Incipient
melting
Al2Cu
Al-Ni-Fe
Al-Ni-Cu
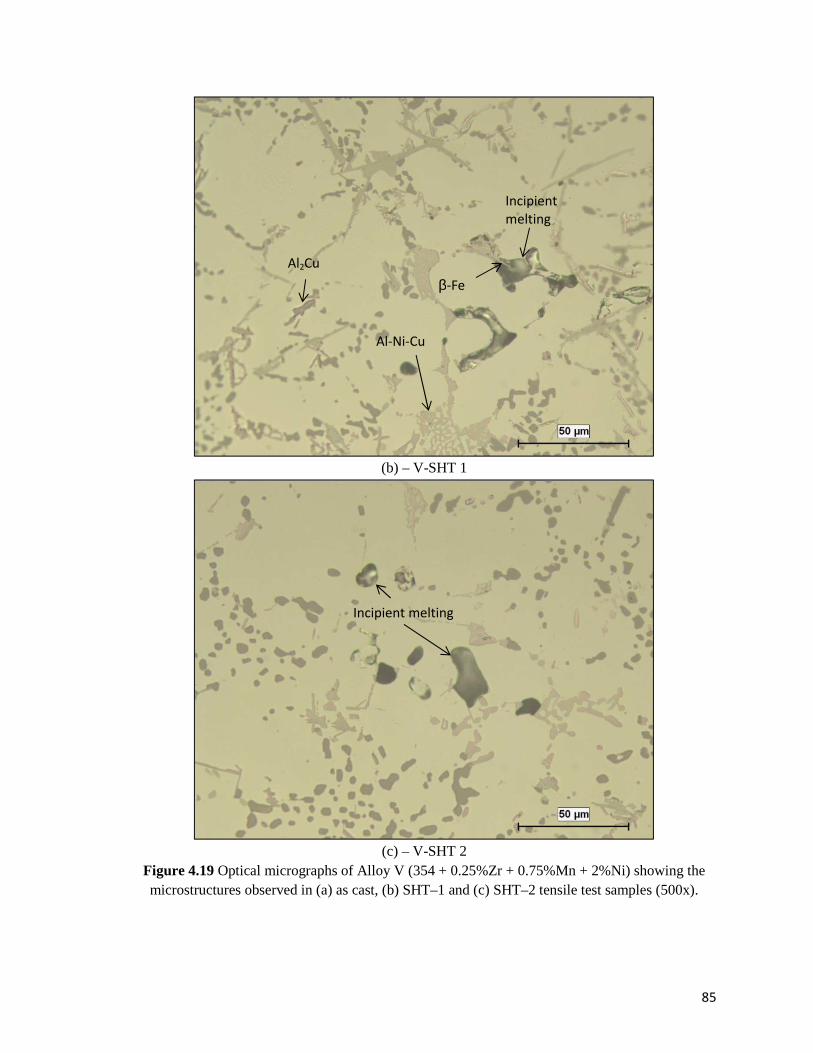
85
(b) – V-SHT 1
(c) – V-SHT 2 Figure 4.19 Optical micrographs of Alloy V (354 + 0.25%Zr + 0.75%Mn + 2%Ni) showing the microstructures observed in (a) as cast, (b) SHT–1 and (c) SHT–2 tensile test samples (500x).
Al-Ni-Cu
Incipient
melting
Al2Cu
β-Fe
Incipient melting
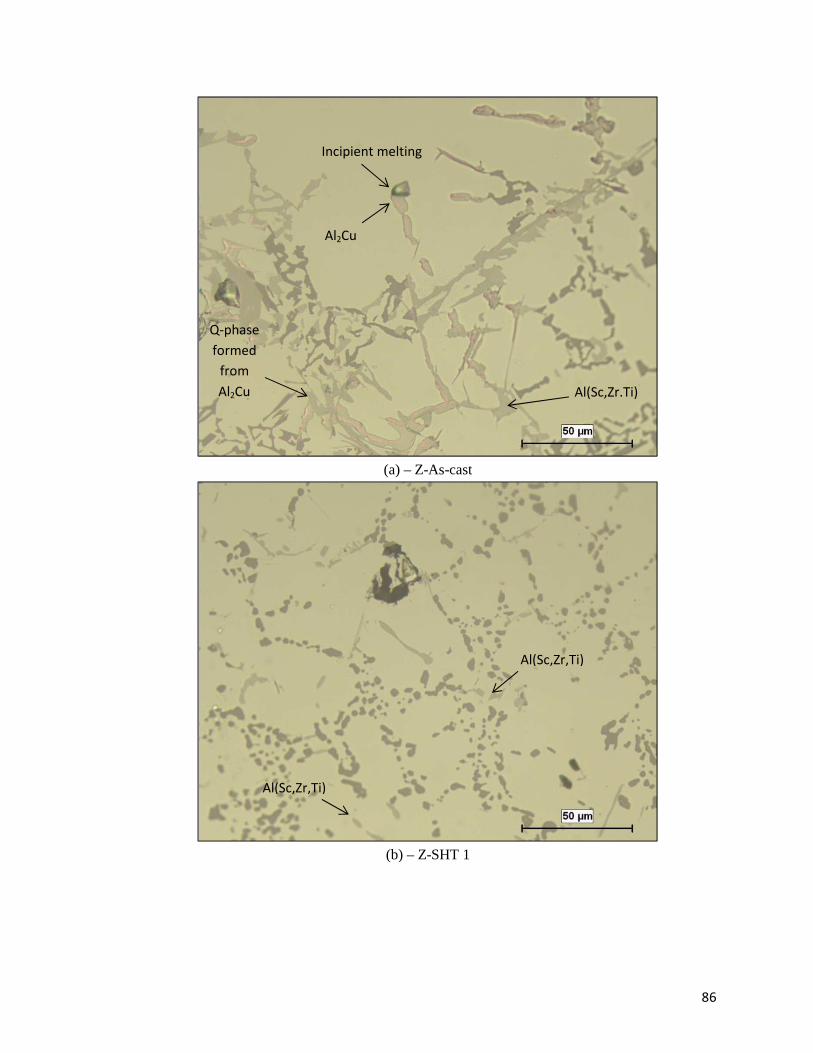
86
(a) – Z-As-cast
(b) – Z-SHT 1
Incipient melting
Al2Cu
Al(Sc,Zr.Ti)
Q-phase
formed
from
Al2Cu
Al(Sc,Zr,Ti)
Al(Sc,Zr,Ti)
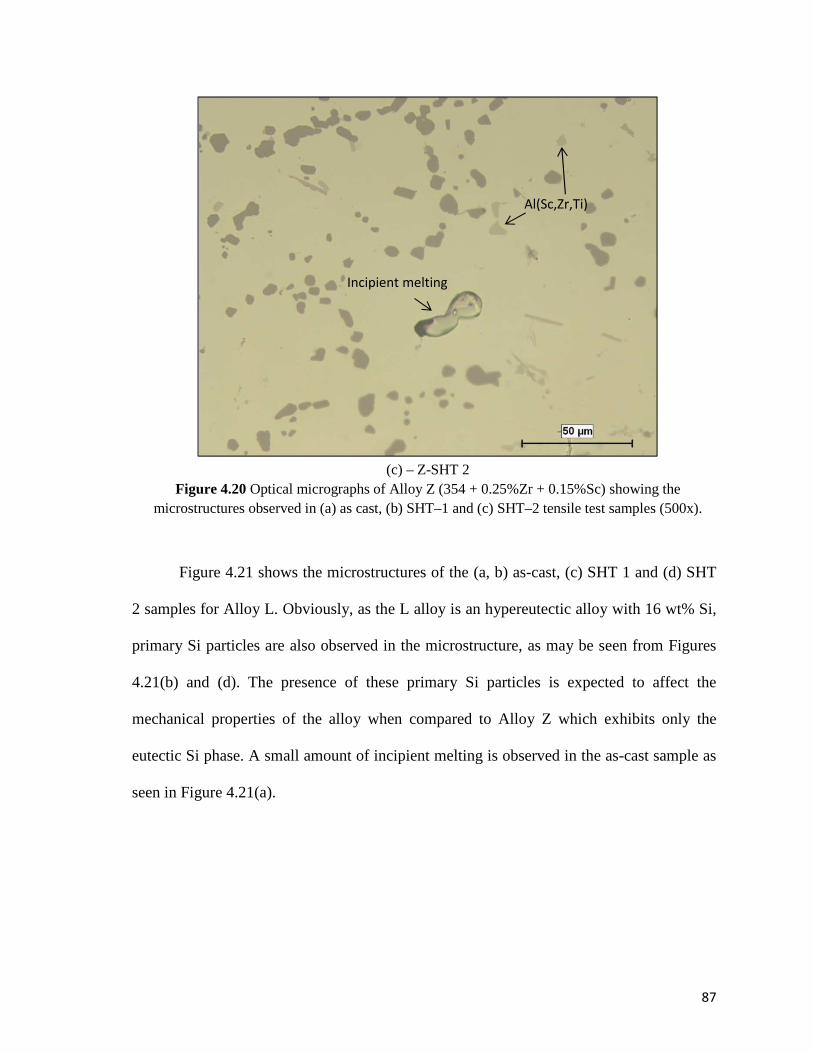
87
(c) – Z-SHT 2
Figure 4.20 Optical micrographs of Alloy Z (354 + 0.25%Zr + 0.15%Sc) showing the microstructures observed in (a) as cast, (b) SHT–1 and (c) SHT–2 tensile test samples (500x).
Figure 4.21 shows the microstructures of the (a, b) as-cast, (c) SHT 1 and (d) SHT
2 samples for Alloy L. Obviously, as the L alloy is an hypereutectic alloy with 16 wt% Si,
primary Si particles are also observed in the microstructure, as may be seen from Figures
4.21(b) and (d). The presence of these primary Si particles is expected to affect the
mechanical properties of the alloy when compared to Alloy Z which exhibits only the
eutectic Si phase. A small amount of incipient melting is observed in the as-cast sample as
seen in Figure 4.21(a).
Al(Sc,Zr,Ti)
Incipient melting
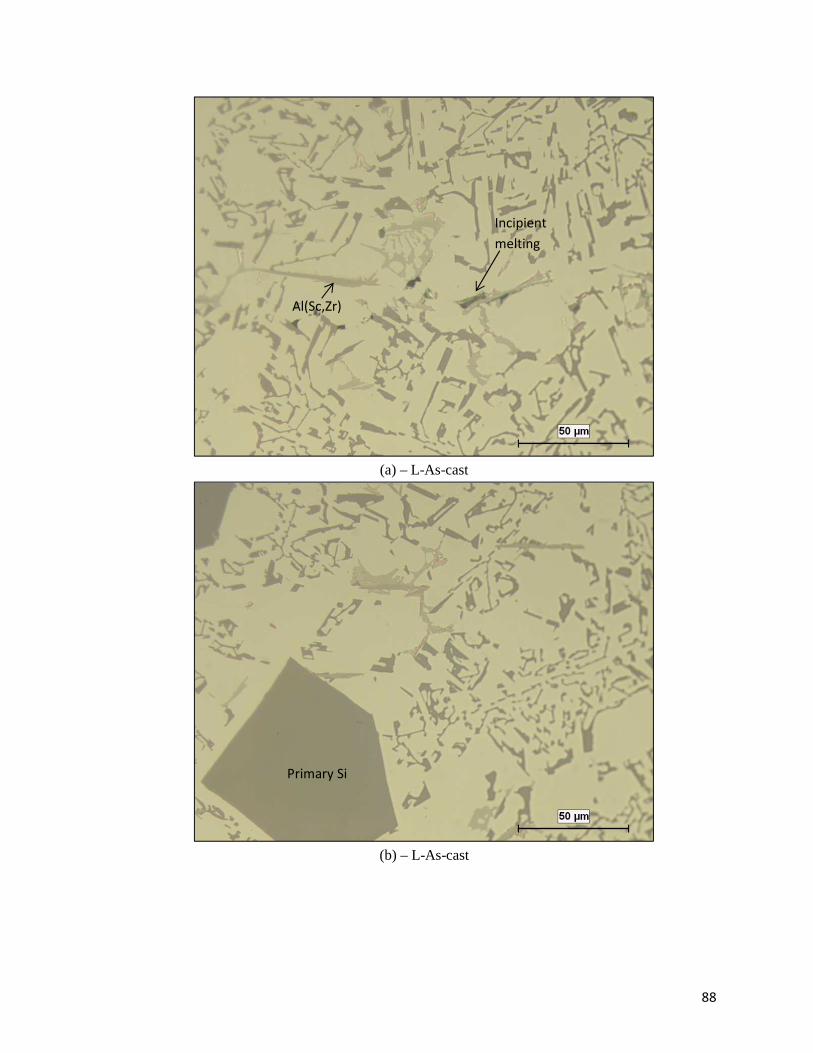
88
(a) – L-As-cast
(b) – L-As-cast
Primary Si
Al(Sc,Zr)
Incipient
melting
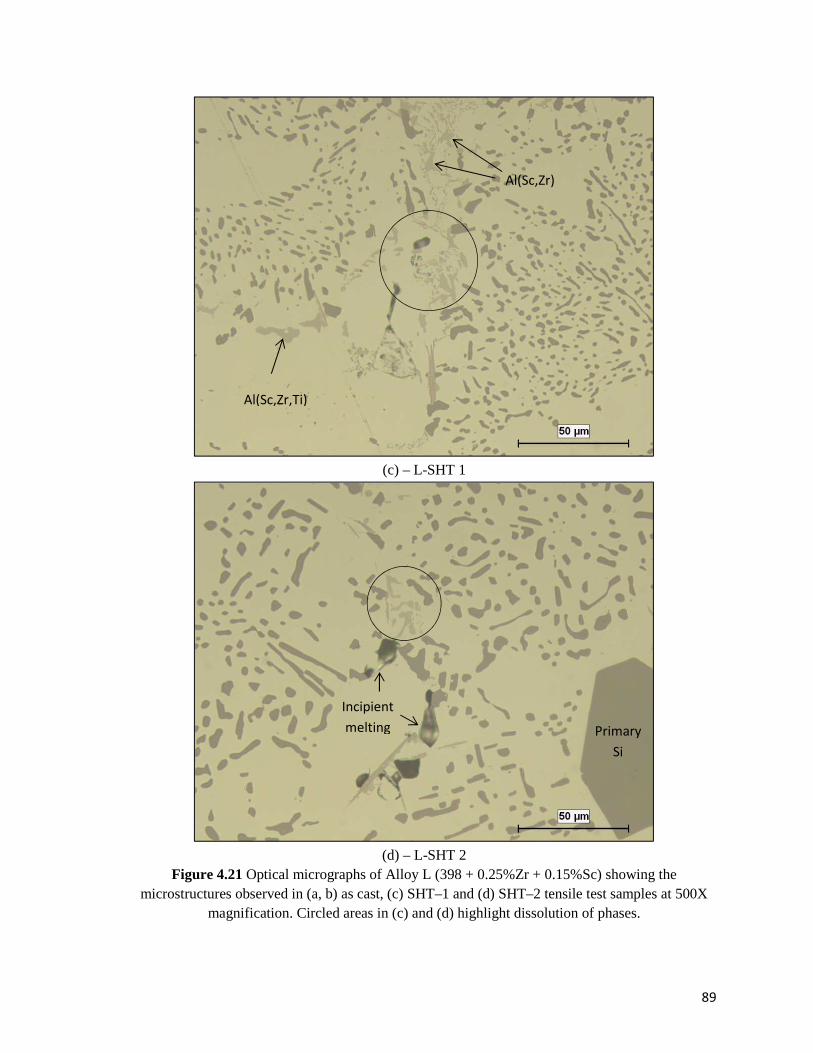
89
(c) – L-SHT 1
(d) – L-SHT 2
Figure 4.21 Optical micrographs of Alloy L (398 + 0.25%Zr + 0.15%Sc) showing the microstructures observed in (a, b) as cast, (c) SHT–1 and (d) SHT–2 tensile test samples at 500X
magnification. Circled areas in (c) and (d) highlight dissolution of phases.
Primary
Si
Incipient
melting
Al(Sc,Zr,Ti)
Al(Sc,Zr)

5 CHAPTER 5
ROOM AND HIGH TEMPERATURE TENSILE
PROPERTIES
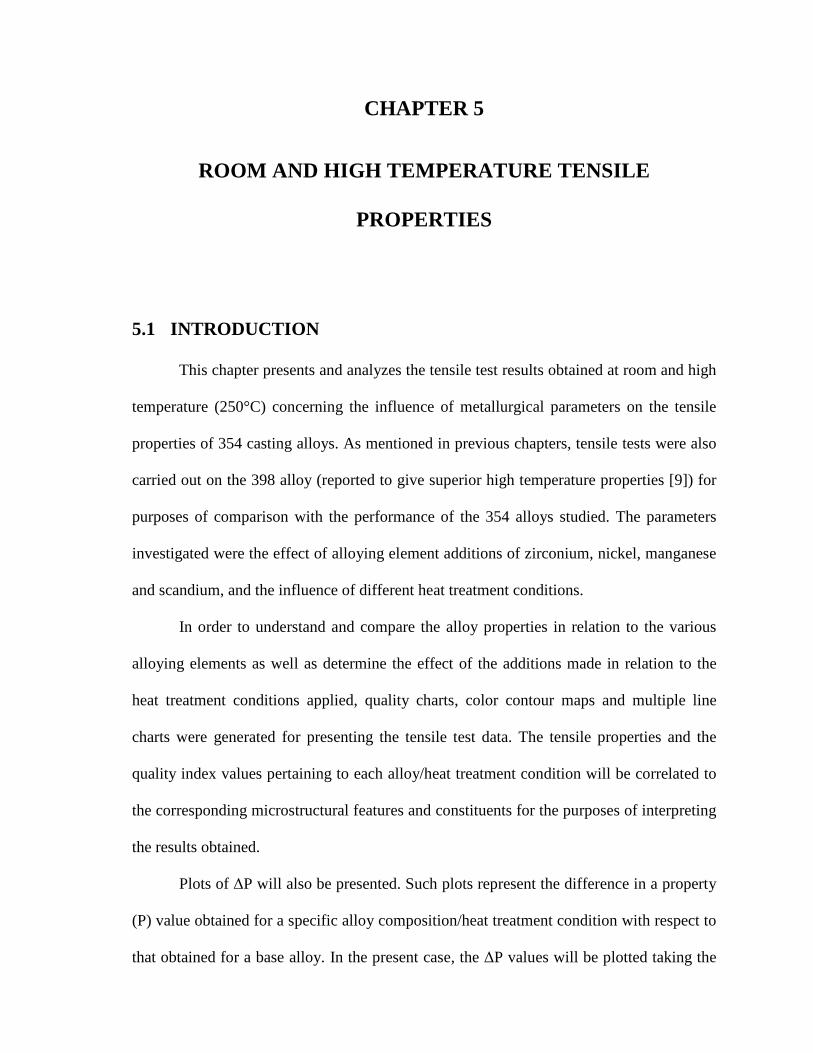
CHAPTER 5
ROOM AND HIGH TEMPERATURE TENSILE
PROPERTIES
5.1 INTRODUCTION
This chapter presents and analyzes the tensile test results obtained at room and high
temperature (250°C) concerning the influence of metallurgical parameters on the tensile
properties of 354 casting alloys. As mentioned in previous chapters, tensile tests were also
carried out on the 398 alloy (reported to give superior high temperature properties [9]) for
purposes of comparison with the performance of the 354 alloys studied. The parameters
investigated were the effect of alloying element additions of zirconium, nickel, manganese
and scandium, and the influence of different heat treatment conditions.
In order to understand and compare the alloy properties in relation to the various
alloying elements as well as determine the effect of the additions made in relation to the
heat treatment conditions applied, quality charts, color contour maps and multiple line
charts were generated for presenting the tensile test data. The tensile properties and the
quality index values pertaining to each alloy/heat treatment condition will be correlated to
the corresponding microstructural features and constituents for the purposes of interpreting
the results obtained.
Plots of ∆P will also be presented. Such plots represent the difference in a property
(P) value obtained for a specific alloy composition/heat treatment condition with respect to
that obtained for a base alloy. In the present case, the ∆P values will be plotted taking the
92
R alloy (354 + 0.25wt%Zr) in the as-cast condition as the base or reference line. The ∆P
plots of the UTS, YS and percent elongation values obtained will be generated for selected
alloys relative to the values obtained for the base alloy.
5.2 ROOM TEMPERATURE TENSILE PROPERTIES (AS-CAST
AND SOLUTION HEAT-TREATED CONDITIONS)
The solution treatment temperature for the 354 casting alloys was selected by a
critical selection process because of the high copper content (1.8% Cu) of the alloys. Two
solution heat treatment processes were considered suitable based on the extensive
investigations carried out by Northwood et al. [130], Sokolowski et al. [131] and Wang et
al. [31] of the effect of solution treatment temperature on the tensile properties, namely,
single and multi-step solution heat treatments.
Table 5.1 lists the tensile properties obtained for the as-cast and solution heat-
treated alloys. The one step solution heat treatment (designated SHT 1) for the 354 alloys
was carried out at 495°C for 5 hours while the multi-step solution heat treatment
(designated SHT 2) was carried out at three different temperatures: 495 °C , 515 °C and
530 °C for specific times of 5, 2 and 2 hours, respectively. The subsequent increase in
solution temperature in the second and third steps improved the strength of the castings
compared to the as-cast condition. The tensile properties of R, S, T, U, V and Z alloys in
the one-step solution heat-treated condition showed an increase of 10-40 MPa in the UTS,
and up to 2.5% in percent elongation in comparison with the as-cast condition, while the
yield strength (YS) decreased in the case of alloys R (354 + 0.25% Zr), S (354+2%Ni +
0.25%Zr), U (354+0.75%Mn + 0.25%Zr) and Z (354+0.15%Sc + 0.25%Zr), but showed a
slight increase in alloys T (354+4%Ni + 0.25%Zr) and V (354+0.75%Mn+2%Ni +
93
0.25%Zr). The multi-step solution heat treatment displayed higher tensile properties than
those achieved with SHT 1 or in the as-cast condition. The ultimate tensile strength of the
given alloys in the multi-step solution heat-treated condition, increased by as much as 70
MPa, and by 3% for the percent elongation in comparison with the as-cast and SHT 1
conditions, while the yield strength remained almost the same. This increase in the
mechanical properties is related to the changes occurring in the morphology of the silicon
particles during solution heat treatment, so that they become more rounded, resulting in a
decrease in their aspect ratio and density [36]. The change in ductility may be explained as
follows: in the as-cast condition, the brittle acicular silicon particles serve as stress
concentrators since they are harder than the matrix. Such particles tend to promote crack
propagation during load application thereby decreasing the ductility of the alloy. The effect
of solution heat treatment on the spheroidization of the Si particles increases with the
progress of solution treatment at the specified solution temperature, and the ductility
increases correspondingly.
The main purpose of solution heat treatment is to maximize dissolution of
hardening elements in solid solution; it also leads to the fragmentation and dissolution of
undissolved phases such as Fe-intermetallics and fragmentation and spheroidization of the
eutectic Si particles so that a homogeneous structure is achieved, leading to improvement
in the ductility and the quality of Al-Si cast alloys [39] [132].
From the tensile test data shown in Table 5.1, quality index or Q values were
calculated and are also listed in the table. Quality charts were then generated for evaluating
the influence of the metallurgical parameters involved on the tensile properties and quality
of the 354 aluminum alloys investigated.
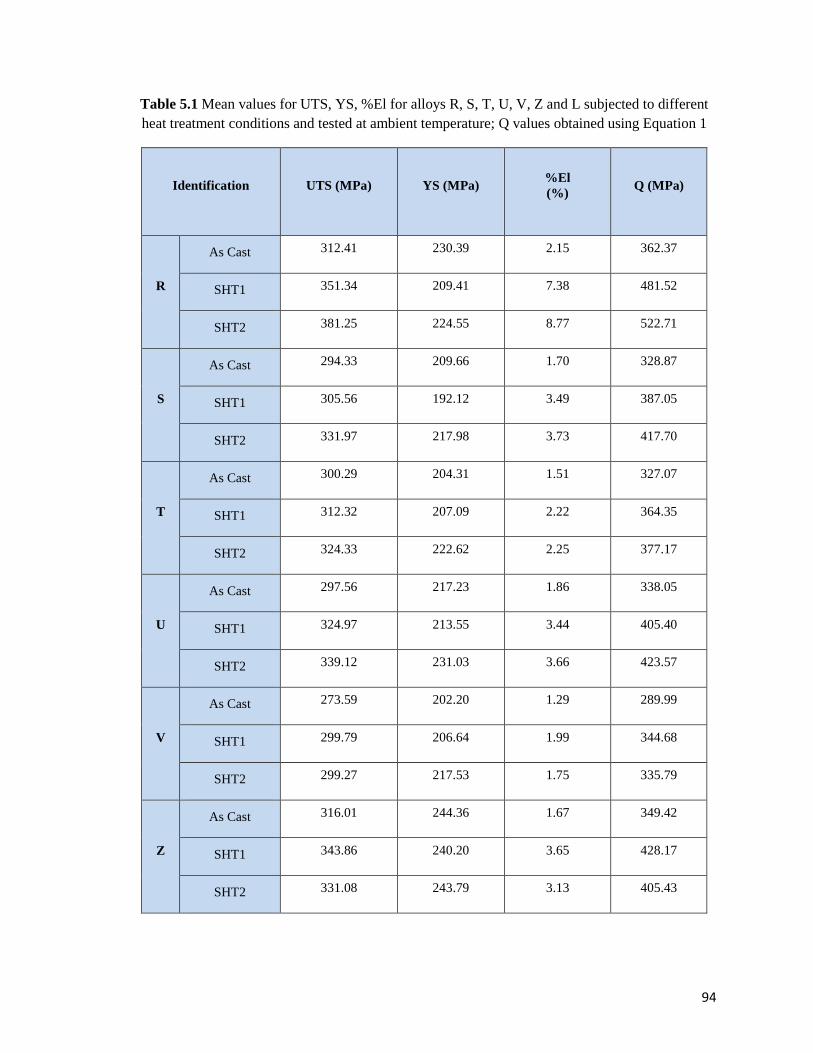
94
Table 5.1 Mean values for UTS, YS, %El for alloys R, S, T, U, V, Z and L subjected to different heat treatment conditions and tested at ambient temperature; Q values obtained using Equation 1
Identification UTS (MPa) YS (MPa) %El (%)
Q (MPa)
R
As Cast 312.41 230.39 2.15 362.37
SHT1 351.34 209.41 7.38 481.52
SHT2 381.25 224.55 8.77 522.71
S
As Cast 294.33 209.66 1.70 328.87
SHT1 305.56 192.12 3.49 387.05
SHT2 331.97 217.98 3.73 417.70
T
As Cast 300.29 204.31 1.51 327.07
SHT1 312.32 207.09 2.22 364.35
SHT2 324.33 222.62 2.25 377.17
U
As Cast 297.56 217.23 1.86 338.05
SHT1 324.97 213.55 3.44 405.40
SHT2 339.12 231.03 3.66 423.57
V
As Cast 273.59 202.20 1.29 289.99
SHT1 299.79 206.64 1.99 344.68
SHT2 299.27 217.53 1.75 335.79
Z
As Cast 316.01 244.36 1.67 349.42
SHT1 343.86 240.20 3.65 428.17
SHT2 331.08 243.79 3.13 405.43
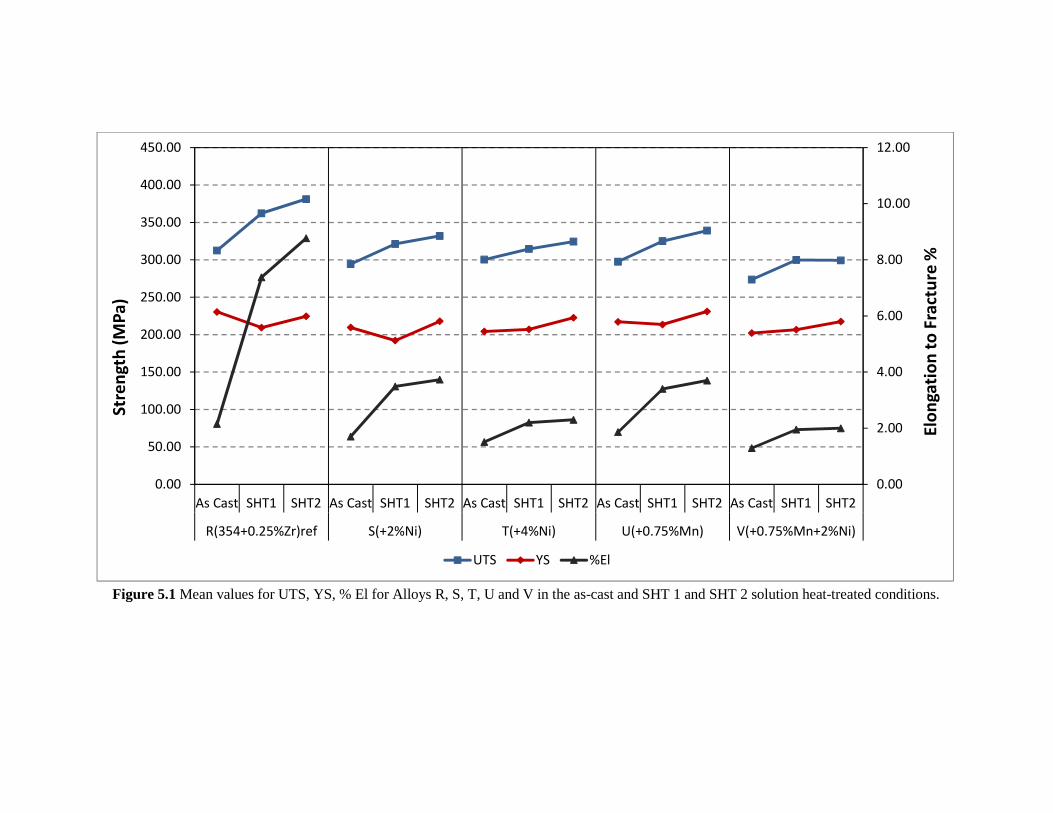
Figure 5.1 Mean values for UTS, YS, % El for Alloys R, S, T, U and V in the as-cast and SHT 1 and SHT 2 solution heat-treated conditions.
0.00
2.00
4.00
6.00
8.00
10.00
12.00
0.00
50.00
100.00
150.00
200.00
250.00
300.00
350.00
400.00
450.00
As Cast SHT1 SHT2 As Cast SHT1 SHT2 As Cast SHT1 SHT2 As Cast SHT1 SHT2 As Cast SHT1 SHT2
R(354+0.25%Zr)ref S(+2%Ni) T(+4%Ni) U(+0.75%Mn) V(+0.75%Mn+2%Ni)
Elo
ng
ati
on
to
Fra
ctu
re %
Str
en
gth
(M
Pa
)
UTS YS %El
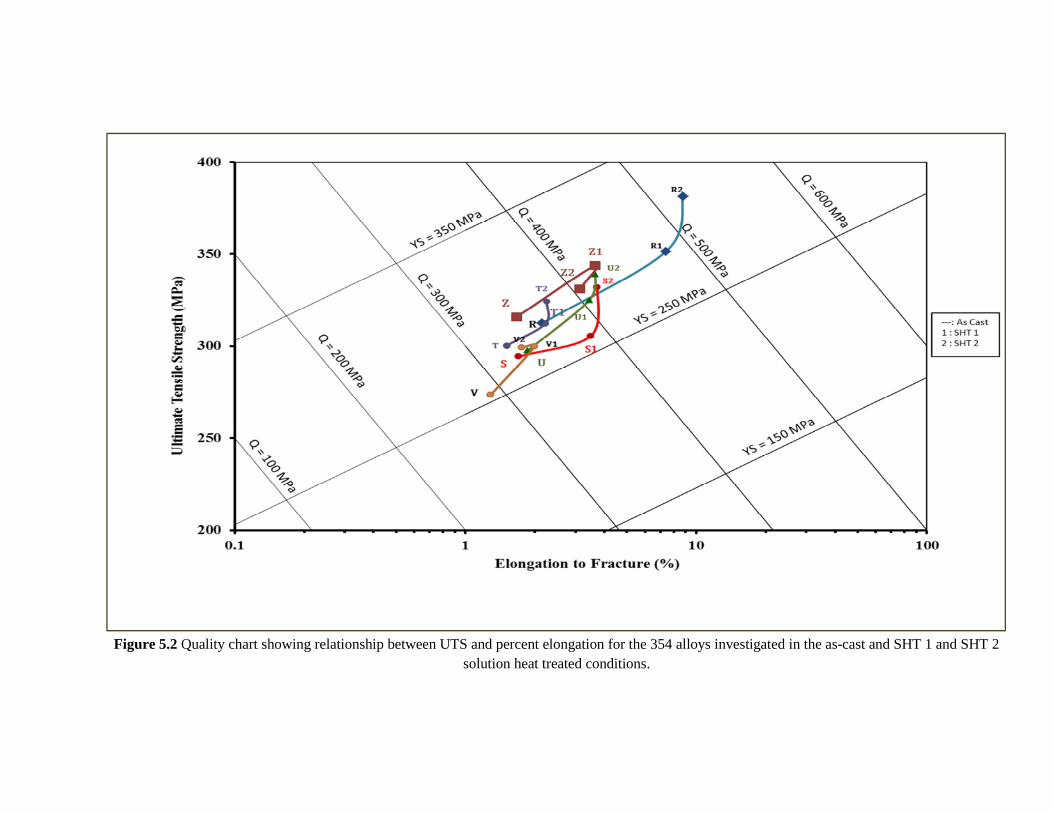
Figure 5.2 Quality chart showing relationship between UTS and percent elongation for the 354 alloys investigated in the as-cast and SHT 1 and SHT 2
solution heat treated conditions.
97
5.3 INFLUENCE OF ALLOYING ADDITIONS AND HEAT
TREATMENT CONDITIONS
Figures 5.3 and 5.4 respectively show the tensile properties of the 354 alloys
obtained under various heat-treatment conditions and different alloying element additions,
tested without and after 200 h stabilization at 250 °C. The T6 heat treatment condition,
which comprises the one step solution heat treatment of 495 °C/5h, followed by quenching
and aging at 180°C/8h, increases the alloy strength (UTS and YS) while maintaining more
or less the same ductility as that observed in the as-cast case. After T62 treatment, Alloy U
(containing 0.75wt% Mn + 0.25wt% Zr) showed the maximum increase in tensile
properties, followed by Alloy R (containing only 0.25wt% Zr). In the case of Alloy U, the
UTS and YS values increased by ~100 MPa and ~160 MPa, respectively. As may be seen
in Figure 5.3, without stabilization, after T5 treatment, the UTS of the alloy is decreased by
adding alloying elements to the base alloy R, while no significant change in tensile
properties is observed after T7 treatment, compared to the as-cast condition.
Figure 5.4 shows the tensile properties of alloys tested at room temperature after
stabilization at 250°C for 200h, for the various heat treatment conditions. The best tensile
properties are obtained with the T6 heat treatment. The figure reveals that the alloy
performs well with the addition of Mn to the base alloy R. With the use of stabilization, the
strengths of the alloys improve after T5 treatment whereas the ductility is lowered. No
significant change in the alloy strength is observed with the use of T6, T62 and T7
treatments, while the ductility is improved compared to the T5 condition, with the T62-
treated alloys displaying the highest values in each case.
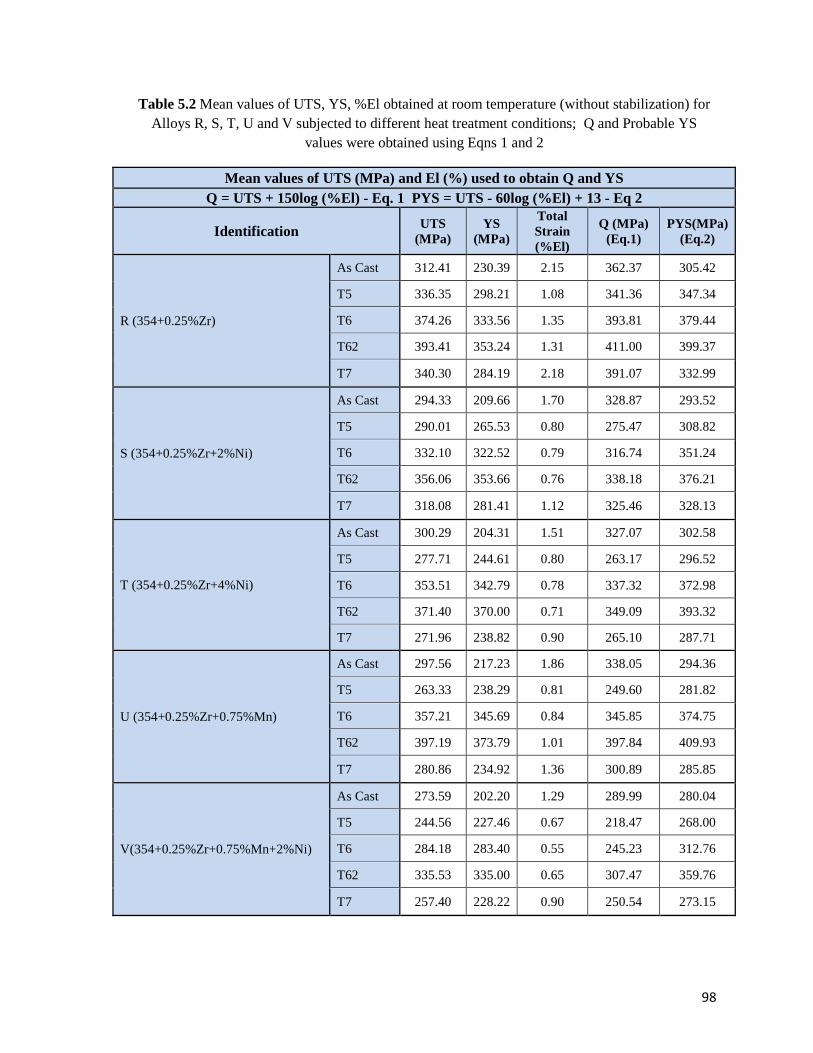
98
Table 5.2 Mean values of UTS, YS, %El obtained at room temperature (without stabilization) for Alloys R, S, T, U and V subjected to different heat treatment conditions; Q and Probable YS
values were obtained using Eqns 1 and 2
Mean values of UTS (MPa) and El (%) used to obtain Q and YS Q = UTS + 150log (%El) - Eq. 1 PYS = UTS - 60log (%El) + 13 - Eq 2
Identification UTS
(MPa) YS
(MPa)
Total Strain (%El)
Q (MPa) (Eq.1)
PYS(MPa) (Eq.2)
R (354+0.25%Zr)
As Cast 312.41 230.39 2.15 362.37 305.42
T5 336.35 298.21 1.08 341.36 347.34
T6 374.26 333.56 1.35 393.81 379.44
T62 393.41 353.24 1.31 411.00 399.37
T7 340.30 284.19 2.18 391.07 332.99
S (354+0.25%Zr+2%Ni)
As Cast 294.33 209.66 1.70 328.87 293.52
T5 290.01 265.53 0.80 275.47 308.82
T6 332.10 322.52 0.79 316.74 351.24
T62 356.06 353.66 0.76 338.18 376.21
T7 318.08 281.41 1.12 325.46 328.13
T (354+0.25%Zr+4%Ni)
As Cast 300.29 204.31 1.51 327.07 302.58
T5 277.71 244.61 0.80 263.17 296.52
T6 353.51 342.79 0.78 337.32 372.98
T62 371.40 370.00 0.71 349.09 393.32
T7 271.96 238.82 0.90 265.10 287.71
U (354+0.25%Zr+0.75%Mn)
As Cast 297.56 217.23 1.86 338.05 294.36
T5 263.33 238.29 0.81 249.60 281.82
T6 357.21 345.69 0.84 345.85 374.75
T62 397.19 373.79 1.01 397.84 409.93
T7 280.86 234.92 1.36 300.89 285.85
V(354+0.25%Zr+0.75%Mn+2%Ni)
As Cast 273.59 202.20 1.29 289.99 280.04
T5 244.56 227.46 0.67 218.47 268.00
T6 284.18 283.40 0.55 245.23 312.76
T62 335.53 335.00 0.65 307.47 359.76
T7 257.40 228.22 0.90 250.54 273.15
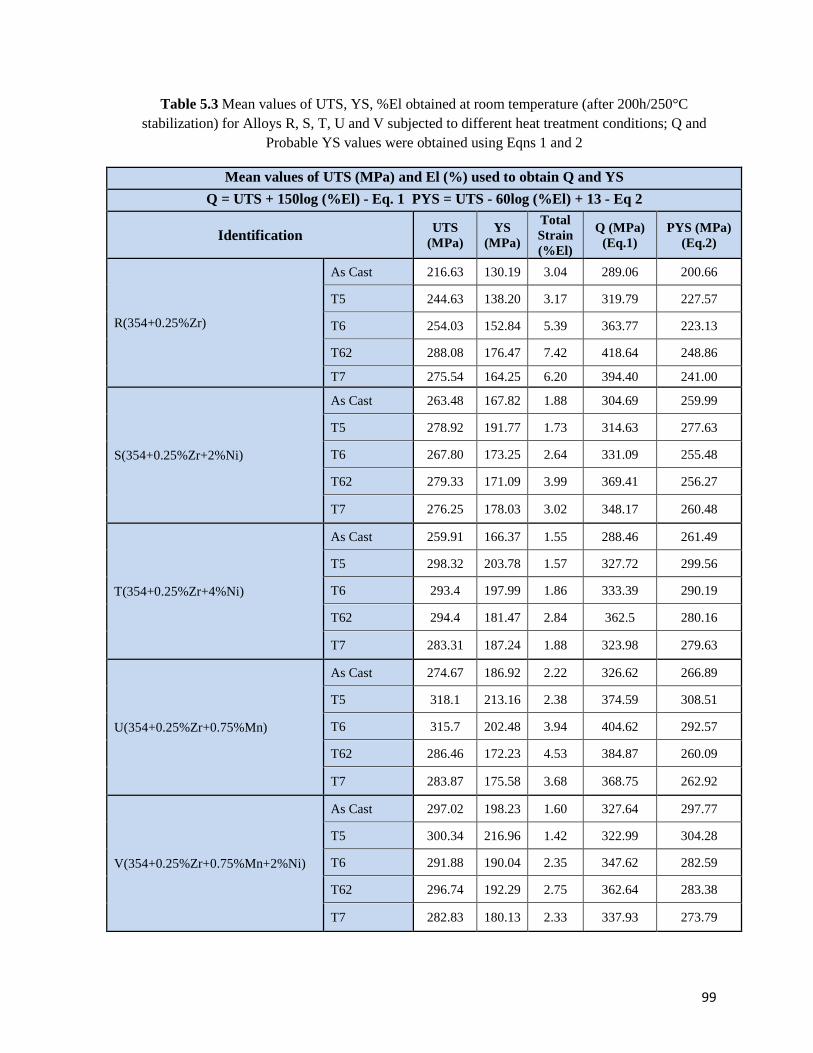
99
Table 5.3 Mean values of UTS, YS, %El obtained at room temperature (after 200h/250°C stabilization) for Alloys R, S, T, U and V subjected to different heat treatment conditions; Q and
Probable YS values were obtained using Eqns 1 and 2
Mean values of UTS (MPa) and El (%) used to obtain Q and YS
Q = UTS + 150log (%El) - Eq. 1 PYS = UTS - 60log (%El) + 13 - Eq 2
Identification UTS
(MPa) YS
(MPa)
Total Strain (%El)
Q (MPa) (Eq.1)
PYS (MPa) (Eq.2)
R(354+0.25%Zr)
As Cast 216.63 130.19 3.04 289.06 200.66
T5 244.63 138.20 3.17 319.79 227.57
T6 254.03 152.84 5.39 363.77 223.13
T62 288.08 176.47 7.42 418.64 248.86
T7 275.54 164.25 6.20 394.40 241.00
S(354+0.25%Zr+2%Ni)
As Cast 263.48 167.82 1.88 304.69 259.99
T5 278.92 191.77 1.73 314.63 277.63
T6 267.80 173.25 2.64 331.09 255.48
T62 279.33 171.09 3.99 369.41 256.27
T7 276.25 178.03 3.02 348.17 260.48
T(354+0.25%Zr+4%Ni)
As Cast 259.91 166.37 1.55 288.46 261.49
T5 298.32 203.78 1.57 327.72 299.56
T6 293.4 197.99 1.86 333.39 290.19
T62 294.4 181.47 2.84 362.5 280.16
T7 283.31 187.24 1.88 323.98 279.63
U(354+0.25%Zr+0.75%Mn)
As Cast 274.67 186.92 2.22 326.62 266.89
T5 318.1 213.16 2.38 374.59 308.51
T6 315.7 202.48 3.94 404.62 292.57
T62 286.46 172.23 4.53 384.87 260.09
T7 283.87 175.58 3.68 368.75 262.92
V(354+0.25%Zr+0.75%Mn+2%Ni)
As Cast 297.02 198.23 1.60 327.64 297.77
T5 300.34 216.96 1.42 322.99 304.28
T6 291.88 190.04 2.35 347.62 282.59
T62 296.74 192.29 2.75 362.64 283.38
T7 282.83 180.13 2.33 337.93 273.79

Figure 5.3 Mean values for UTS, YS, % El for Alloys R, S, T, U and V obtained under the given heat treatment conditions (without stabilization).
0.00
2.00
4.00
6.00
8.00
10.00
12.00
0.00
50.00
100.00
150.00
200.00
250.00
300.00
350.00
400.00
450.00
As
Cast
T5 T6 T62 T7 As
Cast
T5 T6 T62 T7 As
Cast
T5 T6 T62 T7 As
Cast
T5 T6 T62 T7 As
Cast
T5 T6 T62 T7
R(354+0.25%Zr)ref S(+2%Ni) T(+4%Ni) U(+0.75%Mn) V(+0.75%Mn+2%Ni)
Elo
ng
ati
on
to
Fra
ctu
re %
Str
en
gth
(M
Pa
)
UTS YS %El
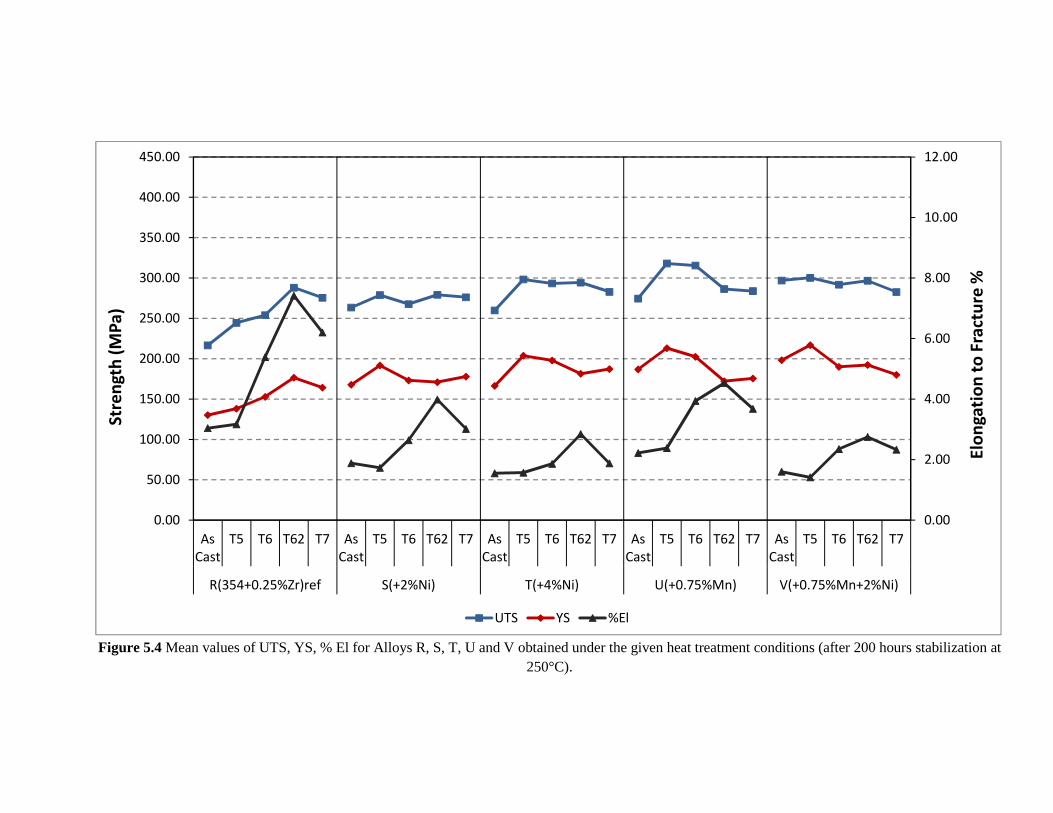
Figure 5.4 Mean values of UTS, YS, % El for Alloys R, S, T, U and V obtained under the given heat treatment conditions (after 200 hours stabilization at
250°C).
0.00
2.00
4.00
6.00
8.00
10.00
12.00
0.00
50.00
100.00
150.00
200.00
250.00
300.00
350.00
400.00
450.00
As
Cast
T5 T6 T62 T7 As
Cast
T5 T6 T62 T7 As
Cast
T5 T6 T62 T7 As
Cast
T5 T6 T62 T7 As
Cast
T5 T6 T62 T7
R(354+0.25%Zr)ref S(+2%Ni) T(+4%Ni) U(+0.75%Mn) V(+0.75%Mn+2%Ni)
Elo
ng
ati
on
to
Fra
ctu
re %
Str
en
gth
(M
Pa
)
UTS YS %El
102
Color-contour maps are 2D vector plots that display a field of vectors in x, y
coordinates where both direction and magnitude are represented. It is a tool that can help to
present the tensile results obtained in a different way, whereby one can observe how the
properties vary with different heat treatment conditions, according to the change in color
and magnitude of the contour regions. Each contour line represents a specific value of the
property being considered. As an example, Figures 5.5 and 5.6 show the quality index (Q)
and probable yield strength (YS) color-contour maps for Alloys R, S, T, U and V tested at
room temperature, without and after 200 hours stabilization at 250°C, respectively. Quality
index (Q) and probable yield strength (PYS) values were obtained using Equations 1 and 2,
and are plotted as a function of heat treatment conditions and alloying additions.
As may be seen from Figure 5.5, the tensile performance of the as-cast base alloy R
is improved after the application of different heat treatments. After T5 treatment, the
quality of the alloy decreases with the addition of alloying elements to the base alloy R.
For T6 and T62 heat treatments, the tensile properties decrease with the addition of Ni, but
increase in the case of Alloy U when Mn is added. The figure also reveals that Alloy R
shows the best quality index values after T62 treatment, i.e., 411 MPa and 418.64 MPa
without, and with 200 hours stabilization, respectively, followed by Alloy U which
displays a Q value of 397.84 MPa after T62 treatment (with no stabilization) and 404.62
MPa following T6 treatment and 200 h stabilization at 250°C before testing.
Figure 5.6 shows the probable yield strength (YS) color-contour maps for Alloys R,
S, T, U and V. Figure 5.6(a) reveals that, in the absence of stabilization, the yield strength
of the base alloy R does not change to any great extent with alloying additions. With 200 h
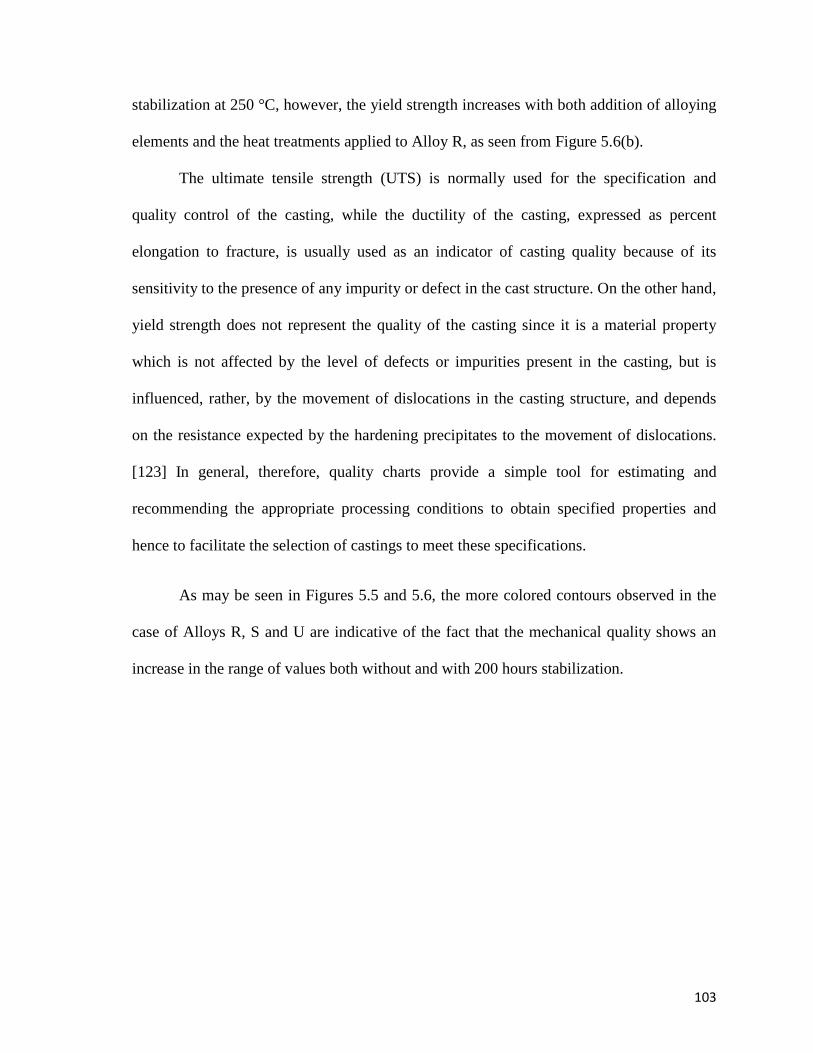
103
stabilization at 250 °C, however, the yield strength increases with both addition of alloying
elements and the heat treatments applied to Alloy R, as seen from Figure 5.6(b).
The ultimate tensile strength (UTS) is normally used for the specification and
quality control of the casting, while the ductility of the casting, expressed as percent
elongation to fracture, is usually used as an indicator of casting quality because of its
sensitivity to the presence of any impurity or defect in the cast structure. On the other hand,
yield strength does not represent the quality of the casting since it is a material property
which is not affected by the level of defects or impurities present in the casting, but is
influenced, rather, by the movement of dislocations in the casting structure, and depends
on the resistance expected by the hardening precipitates to the movement of dislocations.
[123] In general, therefore, quality charts provide a simple tool for estimating and
recommending the appropriate processing conditions to obtain specified properties and
hence to facilitate the selection of castings to meet these specifications.
As may be seen in Figures 5.5 and 5.6, the more colored contours observed in the
case of Alloys R, S and U are indicative of the fact that the mechanical quality shows an
increase in the range of values both without and with 200 hours stabilization.
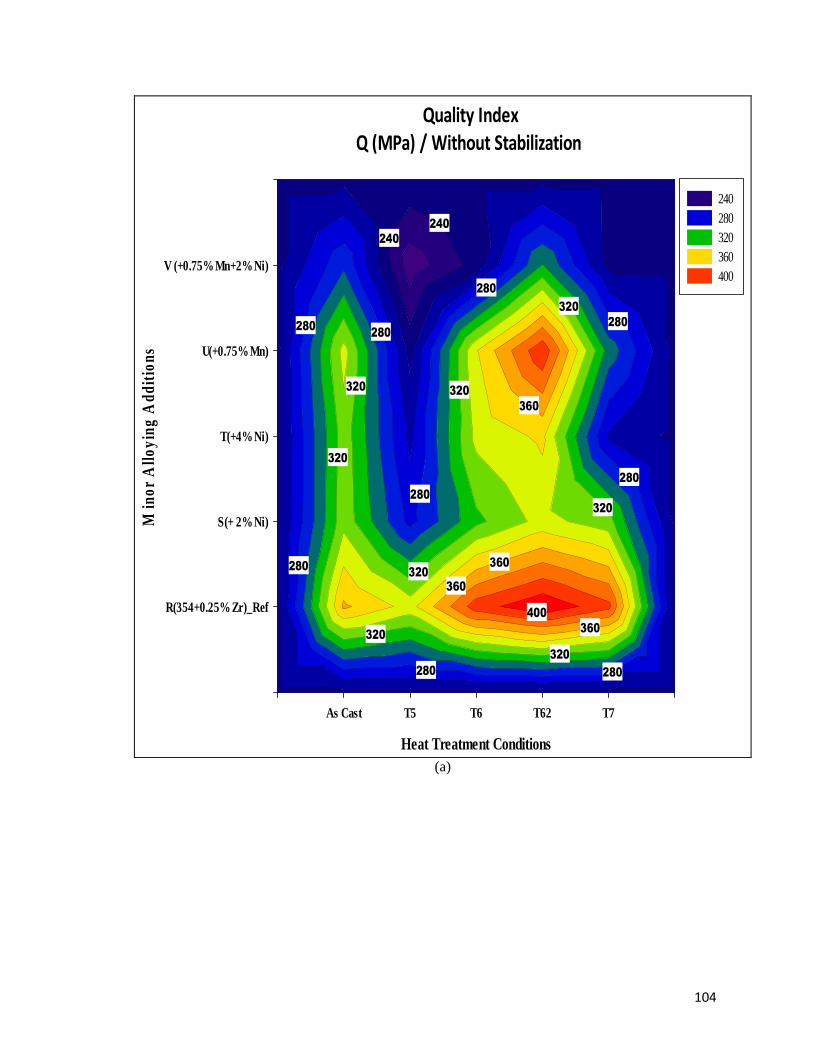
104
Quality Index
Q (MPa) / Without Stabilization
Heat Treatment Conditions
As Cast T5 T6 T62 T7
Min
or A
lloyi
ng A
dditi
ons
R(354+0.25%Zr)_Ref
S(+ 2%Ni)
T(+4%Ni)
U(+0.75%Mn)
V (+0.75%Mn+2%Ni)
280
280
280
280
320
320
320
320
320
280
280280
280
280
360
360
360
360
400
320
320
320
240
240
240 280 320 360 400
(a)
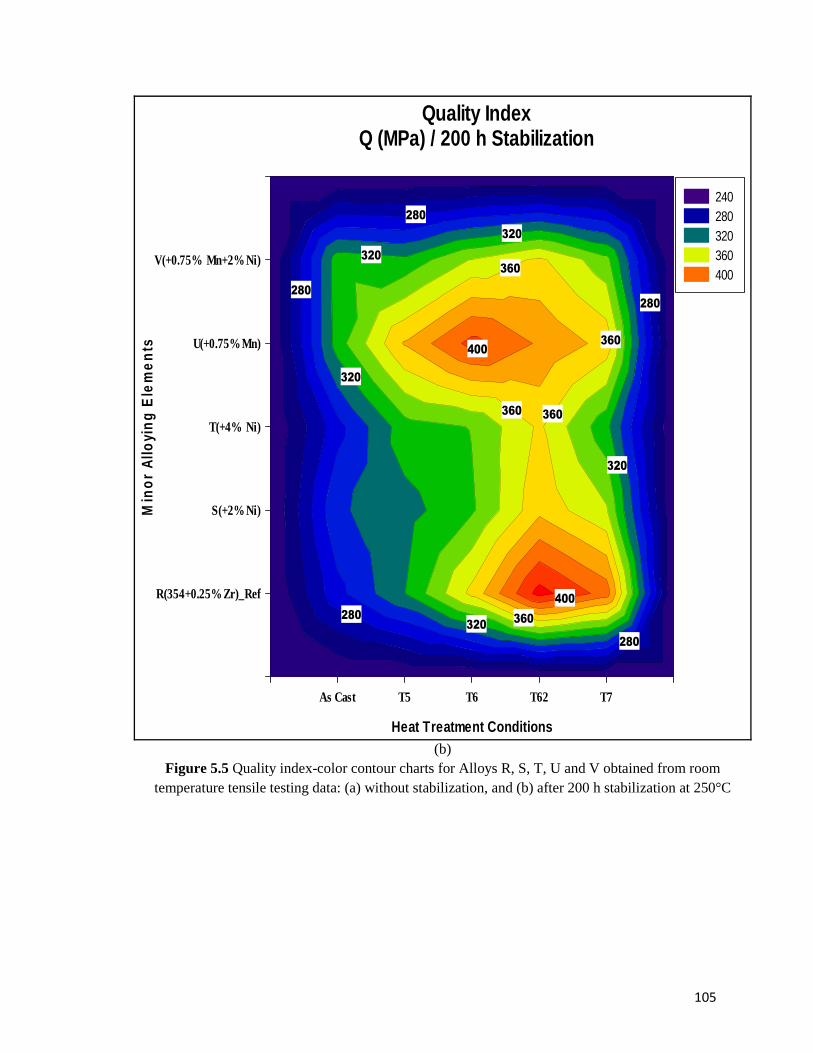
105
Quality IndexQ (MPa) / 200 h Stabilization
Heat Treatment Conditions
As Cast T5 T6 T62 T7
Min
or
Allo
yin
g E
lem
en
ts
R(354+0.25%Zr)_Ref
S(+2%Ni)
T(+4% Ni)
U(+0.75%Mn)
V(+0.75% Mn+2%Ni)
320
320
320
320
280
280
280
280
280
360
360
360
360
400
400
360
320
240 280 320 360 400
(b) Figure 5.5 Quality index-color contour charts for Alloys R, S, T, U and V obtained from room
temperature tensile testing data: (a) without stabilization, and (b) after 200 h stabilization at 250°C
106
Probable Yield Strength
YS (MPa) / Without Stabilization
Heat Treatment Conditions
As Cast T5 T6 T62 T7
Min
or
Allo
yin
g E
lem
en
ts
R(354+0.25%Zr)_Ref
S(+ 2%Ni)
T(+4%Ni)
U(+0.75%Mn)
V (+0.75%Mn+2%Ni)
260
260
260
280
280
280
320
320
300
300
340
400380
360
380
380
360
340
360
300
300
300
260 280 300 320 340 360 380 400
(a)
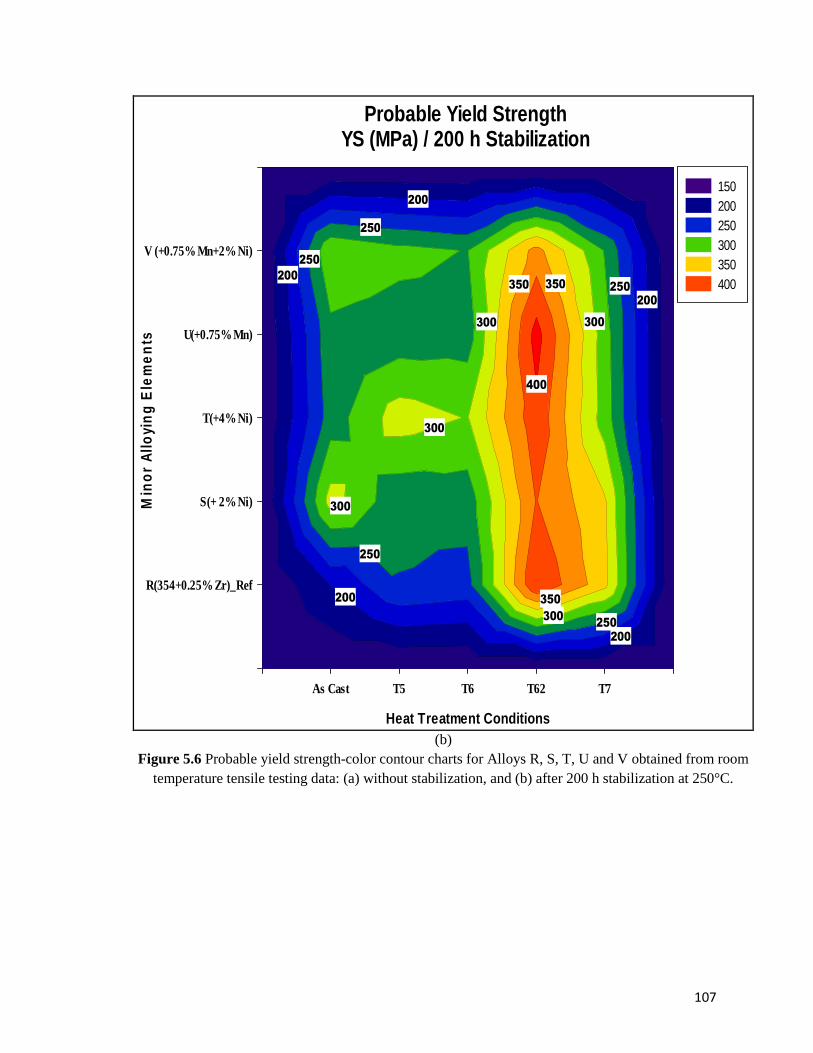
107
Probable Yield StrengthYS (MPa) / 200 h Stabilization
Heat Treatment Conditions
As Cast T5 T6 T62 T7
Min
or
Allo
yin
g E
lem
en
ts
R(354+0.25%Zr)_Ref
S(+ 2%Ni)
T(+4%Ni)
U(+0.75%Mn)
V (+0.75%Mn+2%Ni)
250
250
250
250
250
200
200
200
200
200
300
300
300
350
350
350
400
300
300
150 200 250 300 350 400
(b) Figure 5.6 Probable yield strength-color contour charts for Alloys R, S, T, U and V obtained from room
temperature tensile testing data: (a) without stabilization, and (b) after 200 h stabilization at 250°C.
108
5.4 TENSILE PROPERTIES OF ALLOYS R, S AND U AT ROOM
TEMPERATURE
Tensile tests at room and at high temperature were performed to know the effect of
additions of zirconium, nickel, manganese and scandium on the mechanical performance
of 354 cast aluminum alloy. As evidenced by the results presented in the previous section,
Alloys R, S and U give best results for tensile properties. Therefore, these alloys were
selected for testing at high temperature. Alloys Z and L which contain zirconium and
scandium additions will also be compared with these alloys to determine the best alloys
that are suitable for high temperature applications.
5.4.1 Alloy R (354 + 0.25wt% Zr)
Figure 5.7 shows the room temperature tensile properties obtained from Alloy R
(containing 0.25wt% Zr) corresponding to various heat treatment conditions, without and
after 200h@250°C stabilization prior to testing. Compared to the as-cast condition, heat
treatment obviously affects the tensile performance of the alloy. As may be observed from
Figure 5.7(a), without stabilization, the strength of the alloy increases with the heat
treatments T6 and T62, in which the formation of coherent precipitates is the main source
of strengthening in the R alloy, while it increases to a lesser extent after T5 and T7 heat
treatments. With 200 h stabilization at 250°C, while lower strength values are obtained, the
UTS and YS follow the same trend as in the case of Fig. 5.7(a) with respect to the heat
treatment conditions applied, however, with a larger gap between them. In this case, also,
highest strength is obtained with the T62 treatment. In addition, the alloy also exhibits high
ductility, ~7% with this treatment.
109
The presence of Zr in the alloy would lead to the formation of Al3Zr dispersoids
which are known for persisting even at high temperatures. This will ensure that the alloy
would maintain high strength values. The use of the T62 treatment, incorporating the two-
step solution treatment, allows for maximum dissolution of the copper phases in the two
stages of solution treatment. Such dissolution would further strengthen the alloy matrix. In
general, if alloy strength is increased, the ductility correspondingly decreases, and vice
versa. A high ductility implies that the hardening precipitates and particles observed in the
matrix have undergone coarsening, larger particles growing at the expense of smaller ones,
so that more of the ductile matrix is present between the hard precipitates, which will
increase the ductility. Furthermore, the stabilization treatment would also contribute to this
effect.
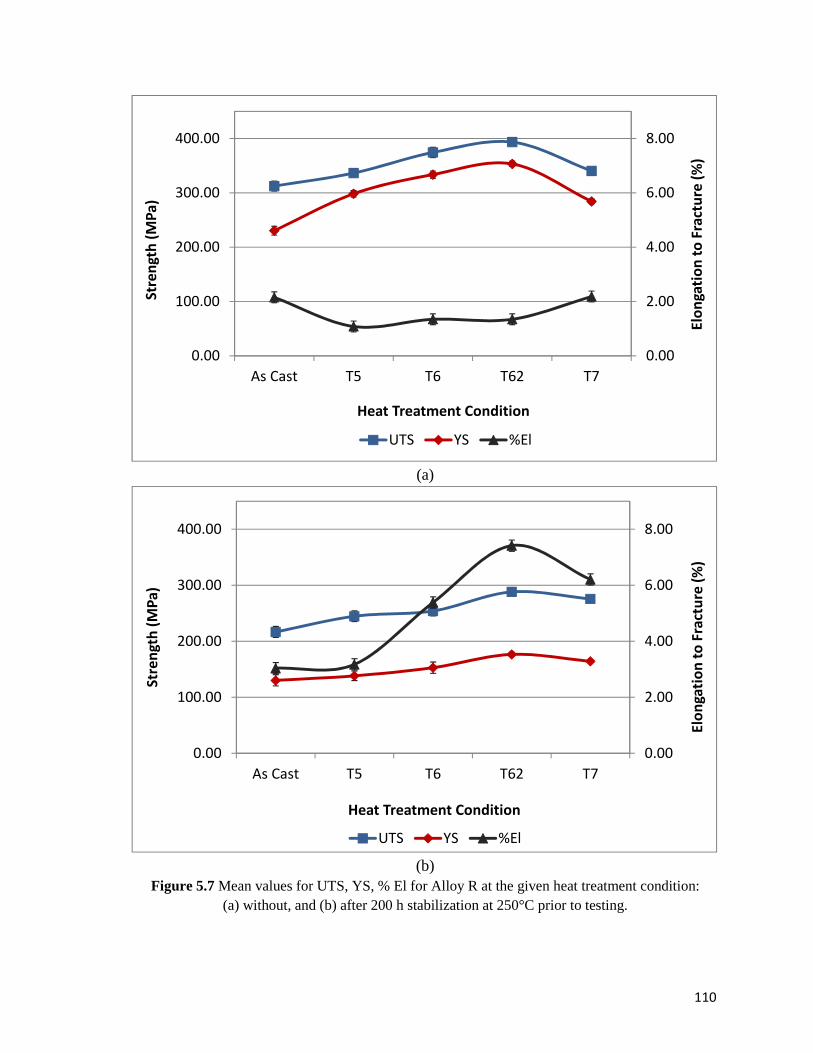
110
(a)
(b)
Figure 5.7 Mean values for UTS, YS, % El for Alloy R at the given heat treatment condition: (a) without, and (b) after 200 h stabilization at 250°C prior to testing.
0.00
2.00
4.00
6.00
8.00
0.00
100.00
200.00
300.00
400.00
As Cast T5 T6 T62 T7
Elo
nga
tio
n t
o F
ract
ure
(%
)
Str
en
gth
(M
Pa
)
Heat Treatment Condition
UTS YS %El
0.00
2.00
4.00
6.00
8.00
0.00
100.00
200.00
300.00
400.00
As Cast T5 T6 T62 T7
Elo
nga
tio
n t
o F
ract
ure
(%
)
Str
en
gth
(M
Pa
)
Heat Treatment Condition
UTS YS %El
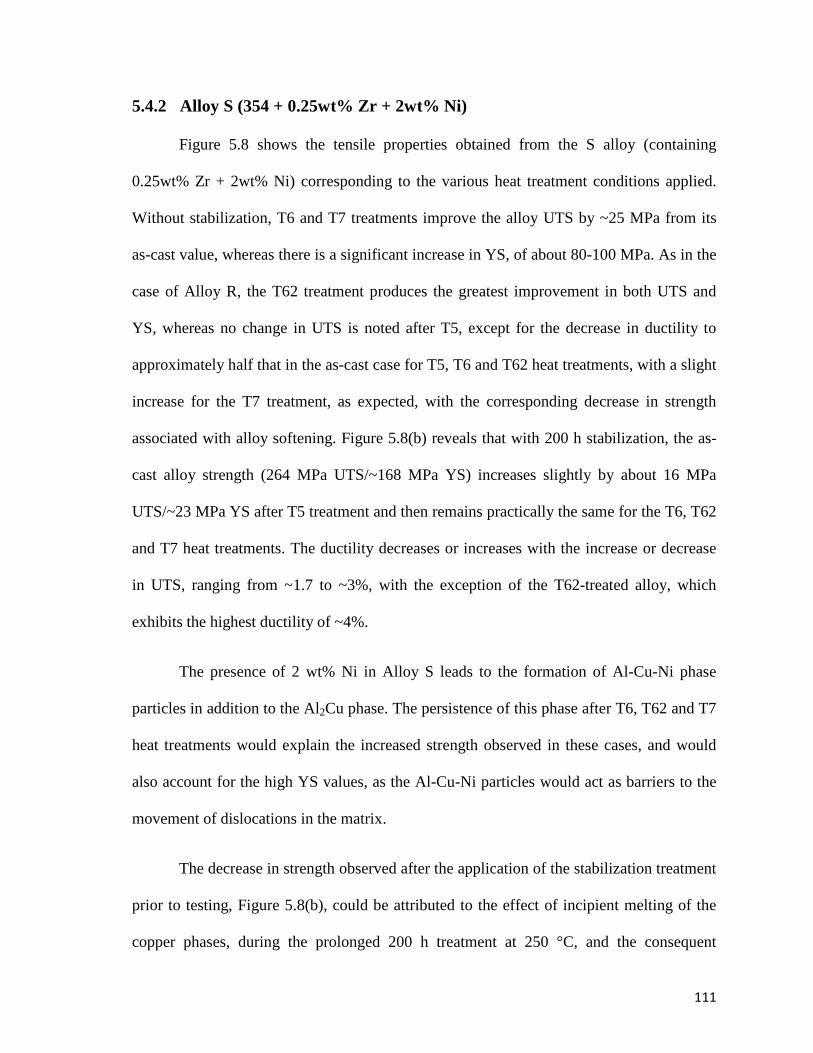
111
5.4.2 Alloy S (354 + 0.25wt% Zr + 2wt% Ni)
Figure 5.8 shows the tensile properties obtained from the S alloy (containing
0.25wt% Zr + 2wt% Ni) corresponding to the various heat treatment conditions applied.
Without stabilization, T6 and T7 treatments improve the alloy UTS by ~25 MPa from its
as-cast value, whereas there is a significant increase in YS, of about 80-100 MPa. As in the
case of Alloy R, the T62 treatment produces the greatest improvement in both UTS and
YS, whereas no change in UTS is noted after T5, except for the decrease in ductility to
approximately half that in the as-cast case for T5, T6 and T62 heat treatments, with a slight
increase for the T7 treatment, as expected, with the corresponding decrease in strength
associated with alloy softening. Figure 5.8(b) reveals that with 200 h stabilization, the as-
cast alloy strength (264 MPa UTS/~168 MPa YS) increases slightly by about 16 MPa
UTS/~23 MPa YS after T5 treatment and then remains practically the same for the T6, T62
and T7 heat treatments. The ductility decreases or increases with the increase or decrease
in UTS, ranging from ~1.7 to ~3%, with the exception of the T62-treated alloy, which
exhibits the highest ductility of ~4%.
The presence of 2 wt% Ni in Alloy S leads to the formation of Al-Cu-Ni phase
particles in addition to the Al2Cu phase. The persistence of this phase after T6, T62 and T7
heat treatments would explain the increased strength observed in these cases, and would
also account for the high YS values, as the Al-Cu-Ni particles would act as barriers to the
movement of dislocations in the matrix.
The decrease in strength observed after the application of the stabilization treatment
prior to testing, Figure 5.8(b), could be attributed to the effect of incipient melting of the
copper phases, during the prolonged 200 h treatment at 250 °C, and the consequent

112
formation of porosity related to such melting. As the number of the hard Cu- or Cu-Ni-
phase particles would decrease, the yield strength would also be significantly lowered. In
this case, the increased ductility observed for the T62-treated alloy would be attributed to
the effect of particle coarsening, as well, over the duration of the stabilization treatment.
113
(a)
(b)
Figure 5.8 Mean values for UTS, YS, % El for Alloy S at the given heat treatment condition: (a) without, and (b) after 200 h stabilization at 250°C prior to testing.
0.00
2.00
4.00
6.00
8.00
0.00
100.00
200.00
300.00
400.00
As Cast T5 T6 T62 T7
Elo
nga
tio
n t
o F
ract
ure
(%
)
Str
en
gth
(M
Pa
)
Heat Treatment Condition
UTS YS %El
0.00
2.00
4.00
6.00
8.00
0.00
100.00
200.00
300.00
400.00
As Cast T5 T6 T62 T7
Elo
nga
tio
n t
o F
ract
ure
(%
)
Str
en
gth
(M
Pa
)
Heat Treatment Condition
UTS YS %El
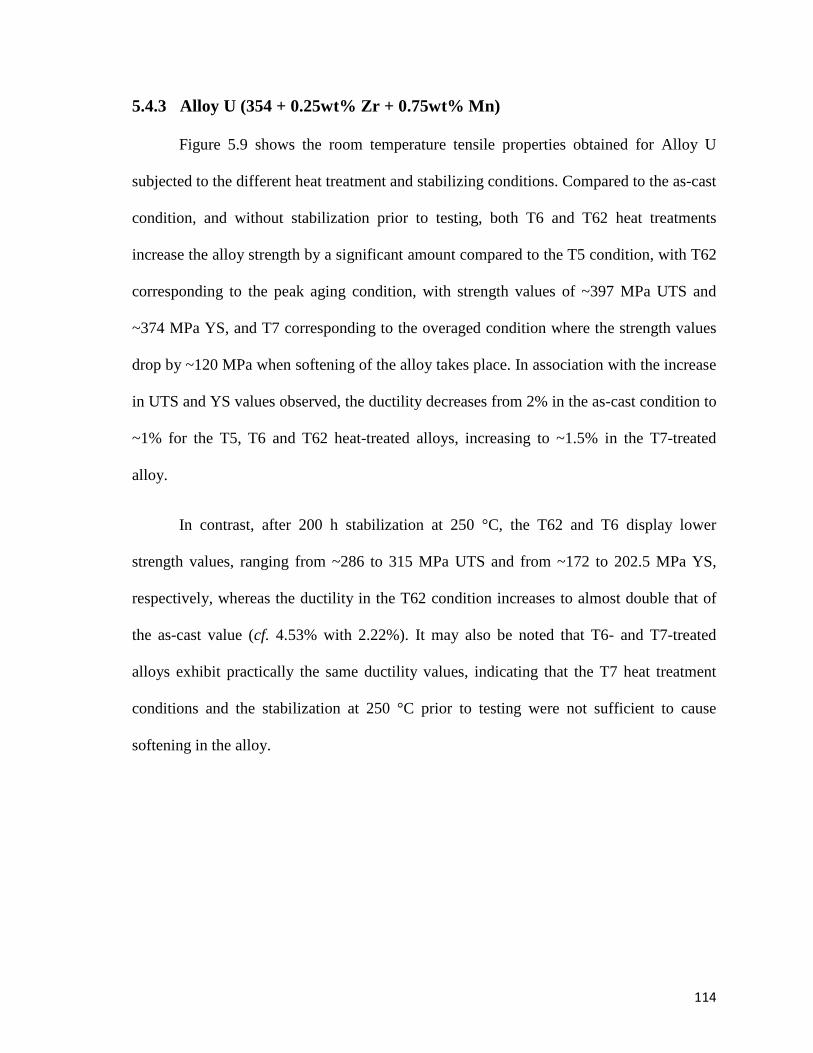
114
5.4.3 Alloy U (354 + 0.25wt% Zr + 0.75wt% Mn)
Figure 5.9 shows the room temperature tensile properties obtained for Alloy U
subjected to the different heat treatment and stabilizing conditions. Compared to the as-cast
condition, and without stabilization prior to testing, both T6 and T62 heat treatments
increase the alloy strength by a significant amount compared to the T5 condition, with T62
corresponding to the peak aging condition, with strength values of ~397 MPa UTS and
~374 MPa YS, and T7 corresponding to the overaged condition where the strength values
drop by ~120 MPa when softening of the alloy takes place. In association with the increase
in UTS and YS values observed, the ductility decreases from 2% in the as-cast condition to
~1% for the T5, T6 and T62 heat-treated alloys, increasing to ~1.5% in the T7-treated
alloy.
In contrast, after 200 h stabilization at 250 °C, the T62 and T6 display lower
strength values, ranging from ~286 to 315 MPa UTS and from ~172 to 202.5 MPa YS,
respectively, whereas the ductility in the T62 condition increases to almost double that of
the as-cast value (cf. 4.53% with 2.22%). It may also be noted that T6- and T7-treated
alloys exhibit practically the same ductility values, indicating that the T7 heat treatment
conditions and the stabilization at 250 °C prior to testing were not sufficient to cause
softening in the alloy.
115
(a)
(b)
Figure 5.9 Mean values for UTS, YS, % El for Alloy U at the given heat treatment condition: (a) without, and (b) after 200 h stabilization at 250°C prior to testing.
0.00
2.00
4.00
6.00
8.00
0.00
100.00
200.00
300.00
400.00
As Cast T5 T6 T62 T7
Elo
nga
tio
n t
o F
ract
ure
(%
)
Str
en
gth
(M
Pa
)
Heat Treatment Condition
UTS YS %El
0.00
2.00
4.00
6.00
8.00
0.00
100.00
200.00
300.00
400.00
As Cast T5 T6 T62 T7
Elo
nga
tio
n t
o F
ract
ure
(%
)
Str
en
gth
(M
Pa
)
Heat Treatment Condition
UTS YS %El
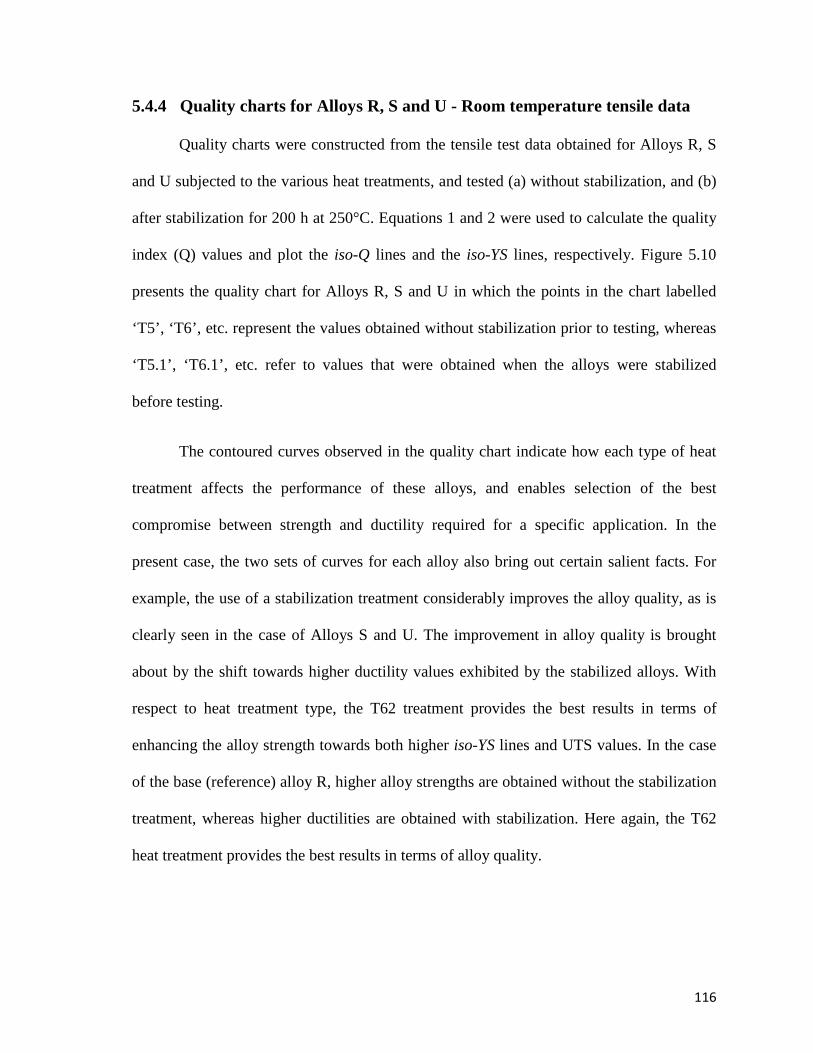
116
5.4.4 Quality charts for Alloys R, S and U - Room temperature tensile data
Quality charts were constructed from the tensile test data obtained for Alloys R, S
and U subjected to the various heat treatments, and tested (a) without stabilization, and (b)
after stabilization for 200 h at 250°C. Equations 1 and 2 were used to calculate the quality
index (Q) values and plot the iso-Q lines and the iso-YS lines, respectively. Figure 5.10
presents the quality chart for Alloys R, S and U in which the points in the chart labelled
‘T5’, ‘T6’, etc. represent the values obtained without stabilization prior to testing, whereas
‘T5.1’, ‘T6.1’, etc. refer to values that were obtained when the alloys were stabilized
before testing.
The contoured curves observed in the quality chart indicate how each type of heat
treatment affects the performance of these alloys, and enables selection of the best
compromise between strength and ductility required for a specific application. In the
present case, the two sets of curves for each alloy also bring out certain salient facts. For
example, the use of a stabilization treatment considerably improves the alloy quality, as is
clearly seen in the case of Alloys S and U. The improvement in alloy quality is brought
about by the shift towards higher ductility values exhibited by the stabilized alloys. With
respect to heat treatment type, the T62 treatment provides the best results in terms of
enhancing the alloy strength towards both higher iso-YS lines and UTS values. In the case
of the base (reference) alloy R, higher alloy strengths are obtained without the stabilization
treatment, whereas higher ductilities are obtained with stabilization. Here again, the T62
heat treatment provides the best results in terms of alloy quality.
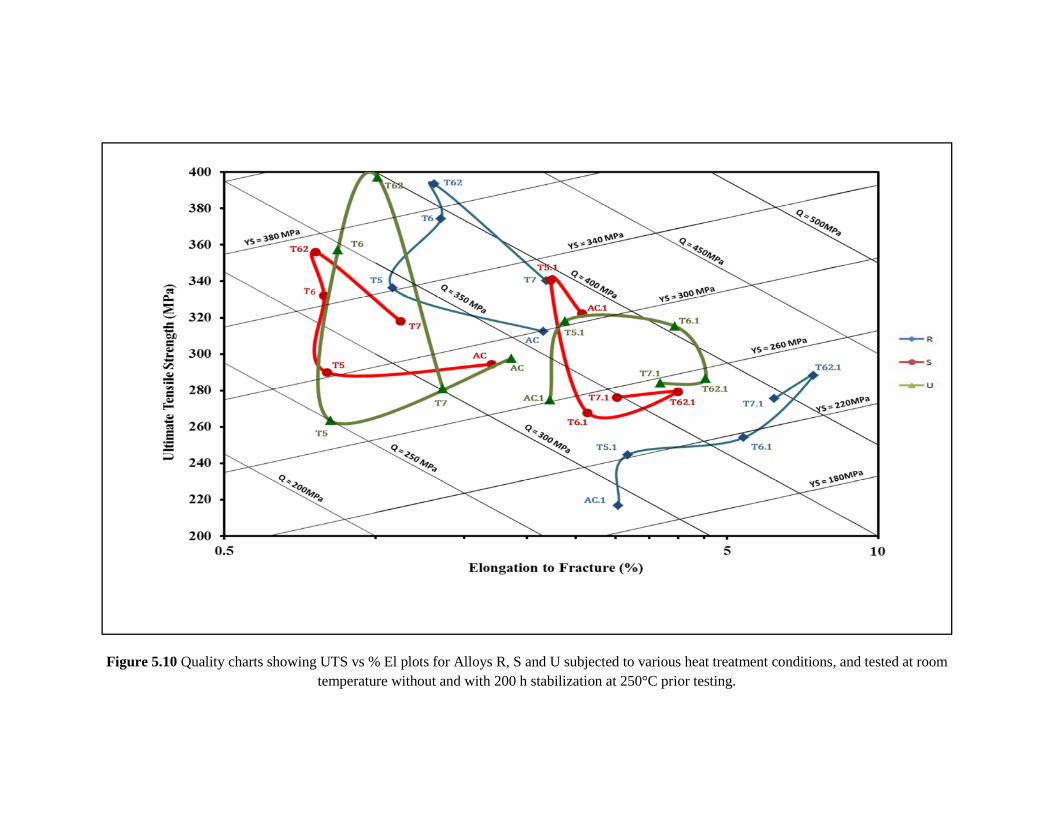
Figure 5.10 Quality charts showing UTS vs % El plots for Alloys R, S and U subjected to various heat treatment conditions, and tested at room temperature without and with 200 h stabilization at 250°C prior testing.
118
5.4.5 Effect of Zr and Sc addition to 354 and 398 alloys
In this section, the room temperature tensile properties of as-cast and T6-heat
treated 354 alloys R, S and U will be compared with the tensile properties of another 354
alloy (Alloy Z, containing 0.25 wt% Zr and 0.15 wt% Sc) and the new aluminum alloy 398
(coded Alloy L, containing the same alloying additions as Alloy Z) to examine (i) the effect
of a combined Zr and Sc addition in changing the behavior of the 354 alloy, and (ii) the
feasibility of using the new alloy 398 with the same Zr and Sc additions as an alternative
for similar high temperature applications.
Aluminum alloy 398 is an Al-Si hypereutectic alloy (containing 16 wt% Si) with a
microstructure that consists of small polygonal primary silicon particles evenly distributed
in an aluminum matrix. As mentioned previously, this alloy was originally developed by
NASA as a high performance piston alloy to meet US requirements and tensile strength
suitable for many applications at elevated temperatures - from 260°C to 370°C; this alloy
has been reported to offer significant improvements in strength relative to most
conventional aluminum alloys [9], [133]. It would be interesting, therefore, to compare the
performance of the 354 alloy used in this study with that of 398 alloy.
To this effect, additions of 0.25wt% Zr + 0.15wt% Sc were made to each alloy
(giving alloys Z and L) and their as-cast properties compared. It has been shown that Zr
increases the resistance to aging when it is added to binary Al-Sc alloy [62]. Table 5.4
compares the tensile properties obtained for the five alloys when tested at room
temperature without prior stabilization.
119
As may be seen from Table 5.4, for the as-cast condition, the strength of the alloy
decreases with the addition of Ni in Alloy S, and Mn in case of Alloy U, but it remains
almost the same in Alloy Z (containing Zr + Sc). Alloy L, however, or alloy 398 with the
same Zr and Sc additions, gives the lowest strength values. After T6 heat treatment
(incorporating SHT 1 solution treatment), the alloy strength is increased in each case. All
alloys display an increase in UTS of approximately 30 MPa, 40 MPa and 60 MPa after heat
treatment (T6), respectively. As may be observed from Table 5.4, Alloy R (containing
0.25wt% Zr) in the T6-SHT condition seems to be the best alloy with respect to mechanical
properties at high temperature, since it displays the higher tensile properties taking into
consideration the alloys tested in both as-cast and T6 conditions.
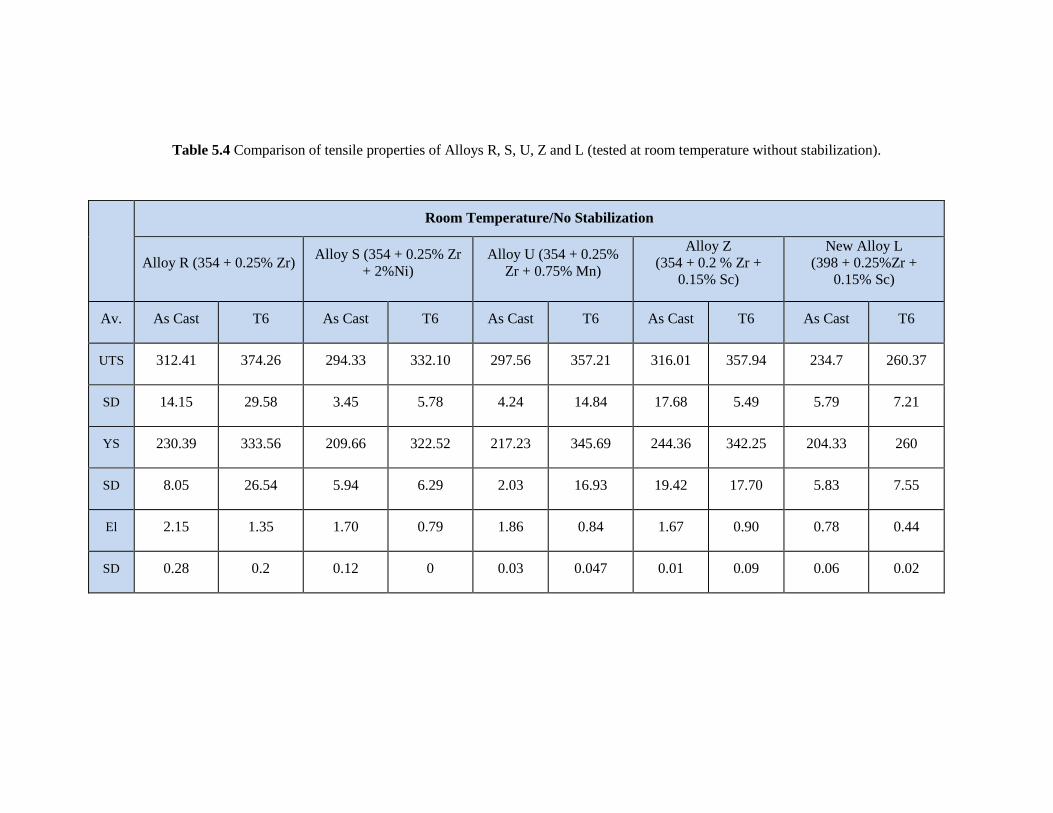
Table 5.4 Comparison of tensile properties of Alloys R, S, U, Z and L (tested at room temperature without stabilization).
Room Temperature/No Stabilization
Alloy R (354 + 0.25% Zr) Alloy S (354 + 0.25% Zr
+ 2%Ni) Alloy U (354 + 0.25%
Zr + 0.75% Mn)
Alloy Z (354 + 0.2 % Zr +
0.15% Sc)
New Alloy L (398 + 0.25%Zr +
0.15% Sc)
Av. As Cast T6 As Cast T6 As Cast T6 As Cast T6 As Cast T6
UTS 312.41 374.26 294.33 332.10 297.56 357.21 316.01 357.94 234.7 260.37
SD 14.15 29.58 3.45 5.78 4.24 14.84 17.68 5.49 5.79 7.21
YS 230.39 333.56 209.66 322.52 217.23 345.69 244.36 342.25 204.33 260
SD 8.05 26.54 5.94 6.29 2.03 16.93 19.42 17.70 5.83 7.55
El 2.15 1.35 1.70 0.79 1.86 0.84 1.67 0.90 0.78 0.44
SD 0.28 0.2 0.12 0 0.03 0.047 0.01 0.09 0.06 0.02
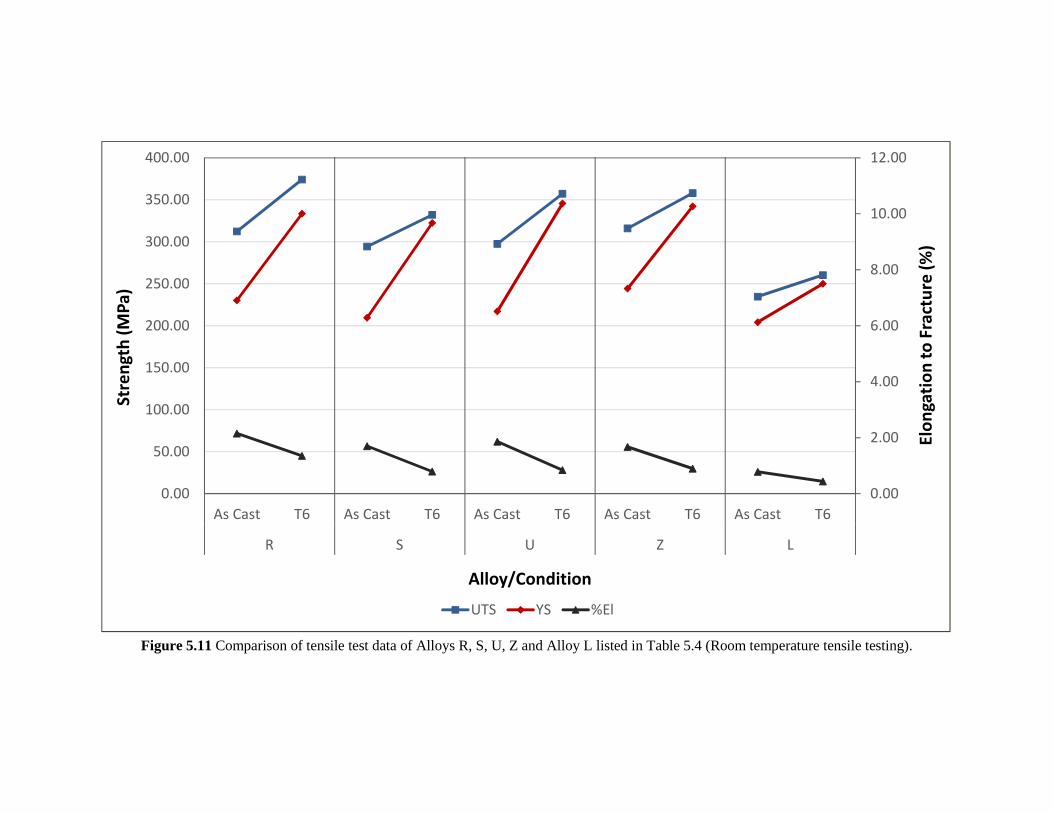
Figure 5.11 Comparison of tensile test data of Alloys R, S, U, Z and Alloy L listed in Table 5.4 (Room temperature tensile testing).
0.00
2.00
4.00
6.00
8.00
10.00
12.00
0.00
50.00
100.00
150.00
200.00
250.00
300.00
350.00
400.00
As Cast T6 As Cast T6 As Cast T6 As Cast T6 As Cast T6
R S U Z L
Elo
ng
ati
on
to
Fra
ctu
re (
%)
Str
en
gth
(M
Pa
)
Alloy/Condition
UTS YS %El
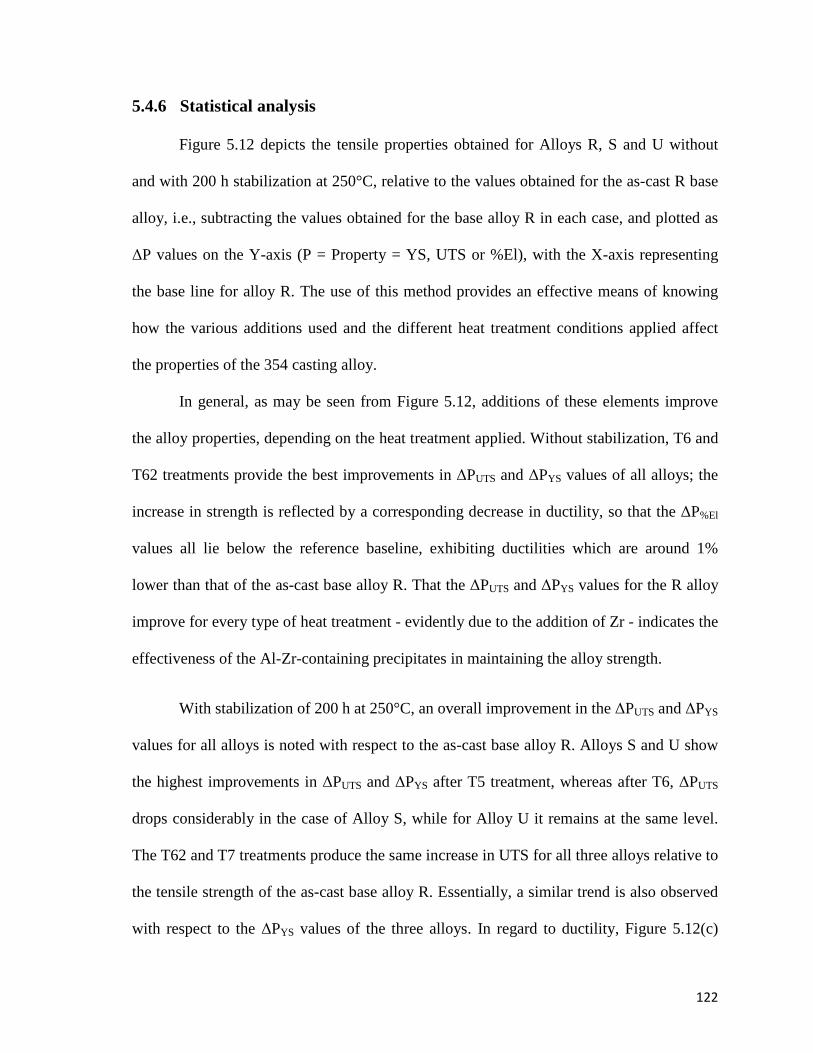
122
5.4.6 Statistical analysis
Figure 5.12 depicts the tensile properties obtained for Alloys R, S and U without
and with 200 h stabilization at 250°C, relative to the values obtained for the as-cast R base
alloy, i.e., subtracting the values obtained for the base alloy R in each case, and plotted as
∆P values on the Y-axis (P = Property = YS, UTS or %El), with the X-axis representing
the base line for alloy R. The use of this method provides an effective means of knowing
how the various additions used and the different heat treatment conditions applied affect
the properties of the 354 casting alloy.
In general, as may be seen from Figure 5.12, additions of these elements improve
the alloy properties, depending on the heat treatment applied. Without stabilization, T6 and
T62 treatments provide the best improvements in ∆PUTS and ∆PYS values of all alloys; the
increase in strength is reflected by a corresponding decrease in ductility, so that the ∆P%El
values all lie below the reference baseline, exhibiting ductilities which are around 1%
lower than that of the as-cast base alloy R. That the ∆PUTS and ∆PYS values for the R alloy
improve for every type of heat treatment - evidently due to the addition of Zr - indicates the
effectiveness of the Al-Zr-containing precipitates in maintaining the alloy strength.
With stabilization of 200 h at 250°C, an overall improvement in the ∆PUTS and ∆PYS
values for all alloys is noted with respect to the as-cast base alloy R. Alloys S and U show
the highest improvements in ∆PUTS and ∆PYS after T5 treatment, whereas after T6, ∆PUTS
drops considerably in the case of Alloy S, while for Alloy U it remains at the same level.
The T62 and T7 treatments produce the same increase in UTS for all three alloys relative to
the tensile strength of the as-cast base alloy R. Essentially, a similar trend is also observed
with respect to the ∆PYS values of the three alloys. In regard to ductility, Figure 5.12(c)
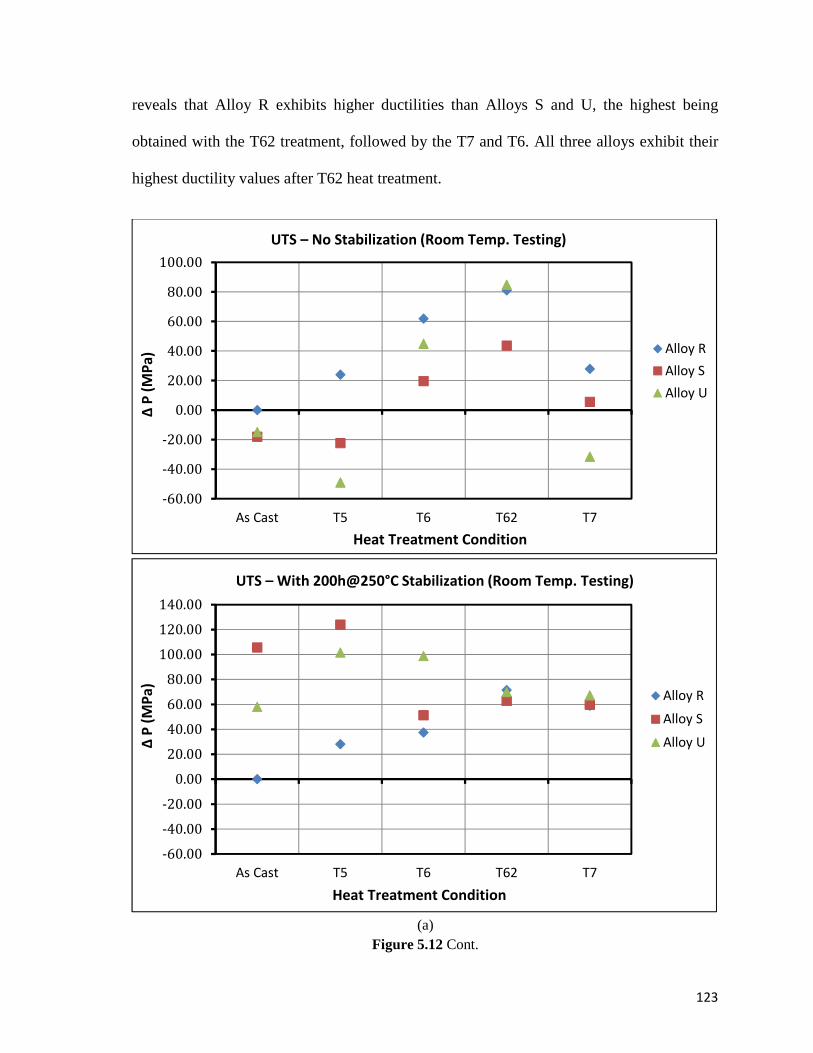
123
reveals that Alloy R exhibits higher ductilities than Alloys S and U, the highest being
obtained with the T62 treatment, followed by the T7 and T6. All three alloys exhibit their
highest ductility values after T62 heat treatment.
(a)
Figure 5.12 Cont.
-60.00
-40.00
-20.00
0.00
20.00
40.00
60.00
80.00
100.00
As Cast T5 T6 T62 T7
Alloy R
Alloy S
Alloy U
Heat Treatment Condition
∆ P
(M
Pa
)
UTS – No Stabilization (Room Temp. Testing)
-60.00
-40.00
-20.00
0.00
20.00
40.00
60.00
80.00
100.00
120.00
140.00
As Cast T5 T6 T62 T7
Alloy R
Alloy S
Alloy U
Heat Treatment Condition
∆ P
(M
Pa
)
UTS – With 200h@250°C Stabilization (Room Temp. Testing)
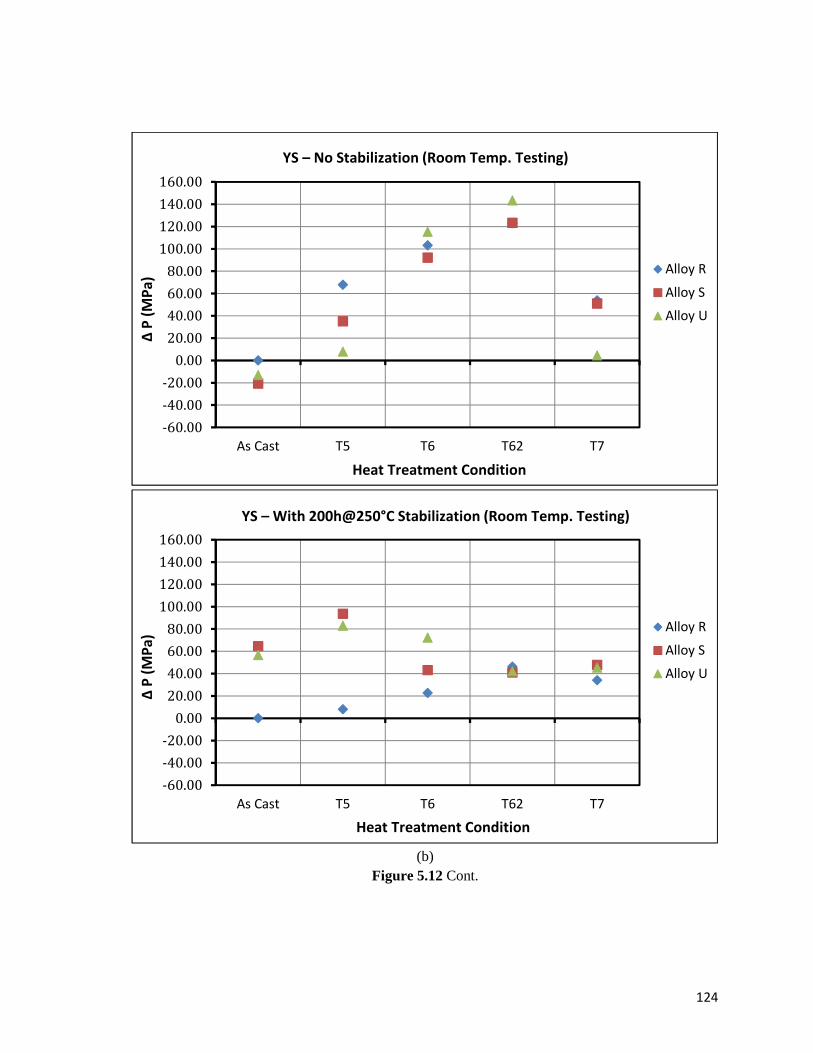
124
(b)
Figure 5.12 Cont.
-60.00
-40.00
-20.00
0.00
20.00
40.00
60.00
80.00
100.00
120.00
140.00
160.00
As Cast T5 T6 T62 T7
Alloy R
Alloy S
Alloy U
Heat Treatment Condition
∆ P
(M
Pa
) YS – No Stabilization (Room Temp. Testing)
-60.00
-40.00
-20.00
0.00
20.00
40.00
60.00
80.00
100.00
120.00
140.00
160.00
As Cast T5 T6 T62 T7
Alloy R
Alloy S
Alloy U
Heat Treatment Condition
∆ P
(M
Pa
)
YS – With 200h@250°C Stabilization (Room Temp. Testing)
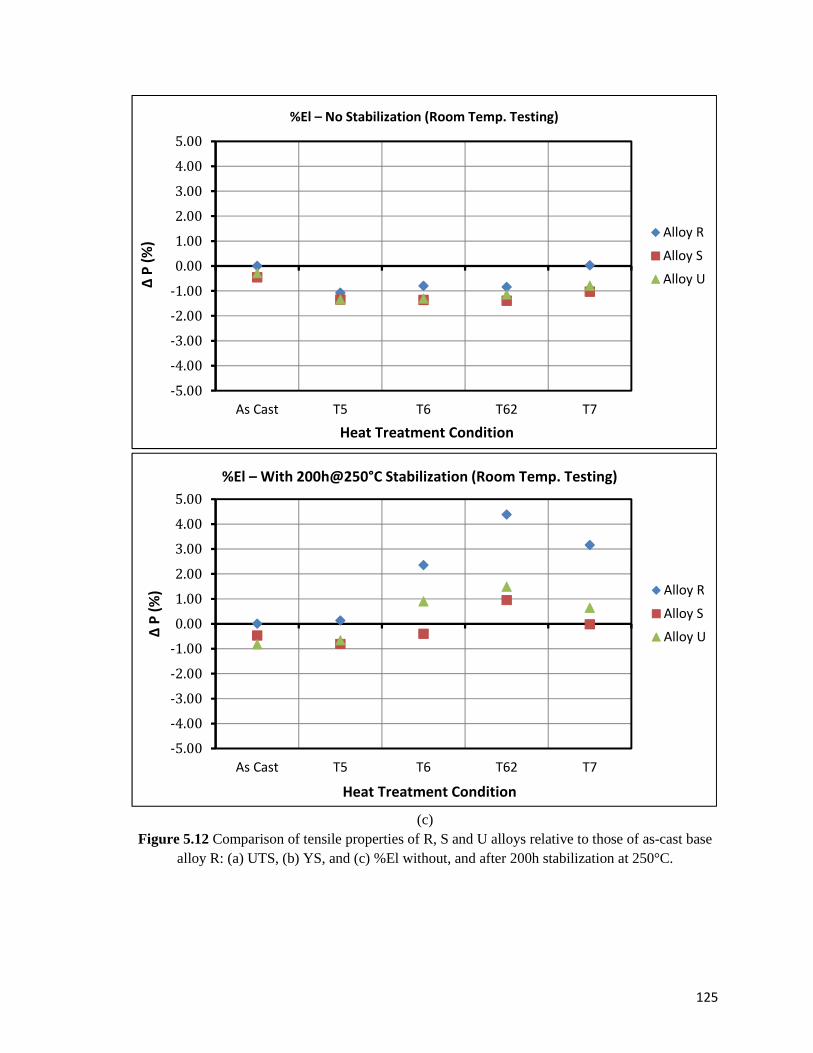
125
(c)
Figure 5.12 Comparison of tensile properties of R, S and U alloys relative to those of as-cast base alloy R: (a) UTS, (b) YS, and (c) %El without, and after 200h stabilization at 250°C.
-5.00
-4.00
-3.00
-2.00
-1.00
0.00
1.00
2.00
3.00
4.00
5.00
As Cast T5 T6 T62 T7
Alloy R
Alloy S
Alloy U
Heat Treatment Condition
∆ P
(%
)
%El – No Stabilization (Room Temp. Testing)
-5.00
-4.00
-3.00
-2.00
-1.00
0.00
1.00
2.00
3.00
4.00
5.00
As Cast T5 T6 T62 T7
Alloy R
Alloy S
Alloy U
Heat Treatment Condition
∆ P
(%
)
%El – With 200h@250°C Stabilization (Room Temp. Testing)
126
5.5 TENSILE PROPERTIES OF ALLOYS R, S AND U AT HIGH
TEMPERATURE
Tensile tests were performed at 250 °C to determine the effect of the alloying
additions used and the heat treatment and stabilization conditions employed on the high
temperature mechanical performance of the 354 alloys. It was found that the tensile
properties showed a different tendency to that observed at room temperature, resulting in
improved strength, particularly the yield strength, at temperatures above 200°C. The tensile
properties of the selected Alloys R, S and U are discussed in this section together with
those of Alloys Z and L for comparison purposes. The alloys were tested at 250 °C using
stabilization times of 1 hour and 200 hours at 250 °C prior to conducting the tensile tests.
5.5.1 Alloy R (354 + 0.25wt% Zr)
Figure 5.13 shows the high temperature tensile properties obtained from the R alloy
under the various heat treatment and stabilization conditions employed. Compared to the
as-cast condition, the heat treatments improve the tensile performance of the alloy. As
observed from Figure 5.13(a), in case of one hour stabilization, the strength of the alloy
increases with the T6 and T62 heat treatments, in which the formation of coherent
precipitates is the main source of strengthening in the R alloy, whereas it remains
practically the same after T5 heat treatment, and softening occurs when the T7 heat
treatment is applied to the alloy. The ductility varies according as the strength increases or
decreases, exhibiting almost 5% after the T7 treatment.
With 200 h stabilization at 250°C, also, there is no change in the tensile and yield
strengths after T5 heat treatment compared to the as-cast case, while a slight decrease is

127
noted after T6 treatment, with the T62 and T7 treatments providing no further change in the
alloy strength. The alloy ductility increases significantly, from about 8% in the as-cast and
T5 conditions, to ~18 ± 1% after T6 and T7 treatments, with the T62 treatment exhibiting a
maximum ductility of ~23%.
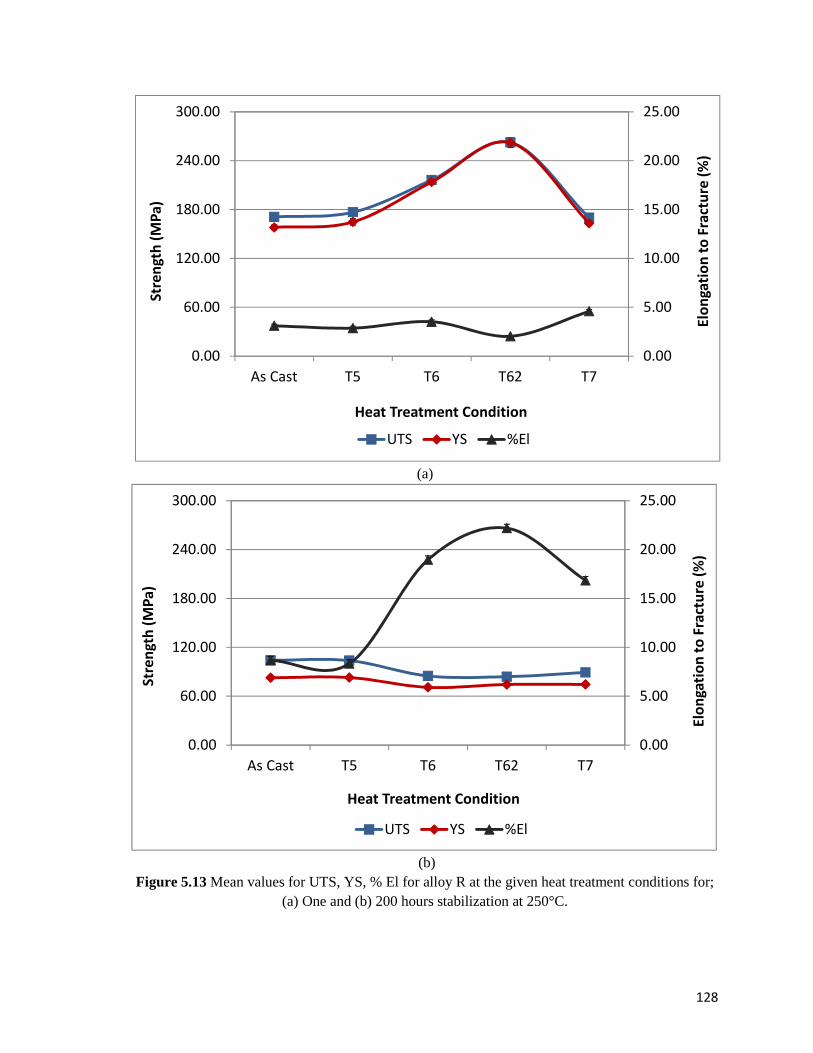
128
(a)
(b) Figure 5.13 Mean values for UTS, YS, % El for alloy R at the given heat treatment conditions for;
(a) One and (b) 200 hours stabilization at 250°C.
0.00
5.00
10.00
15.00
20.00
25.00
0.00
60.00
120.00
180.00
240.00
300.00
As Cast T5 T6 T62 T7
Elo
nga
tio
n t
o F
ract
ure
(%
)
Str
en
gth
(M
Pa
)
Heat Treatment Condition
UTS YS %El
0.00
5.00
10.00
15.00
20.00
25.00
0.00
60.00
120.00
180.00
240.00
300.00
As Cast T5 T6 T62 T7
Elo
nga
tio
n t
o F
ract
ure
(%
)
Str
en
gth
(M
Pa
)
Heat Treatment Condition
UTS YS %El
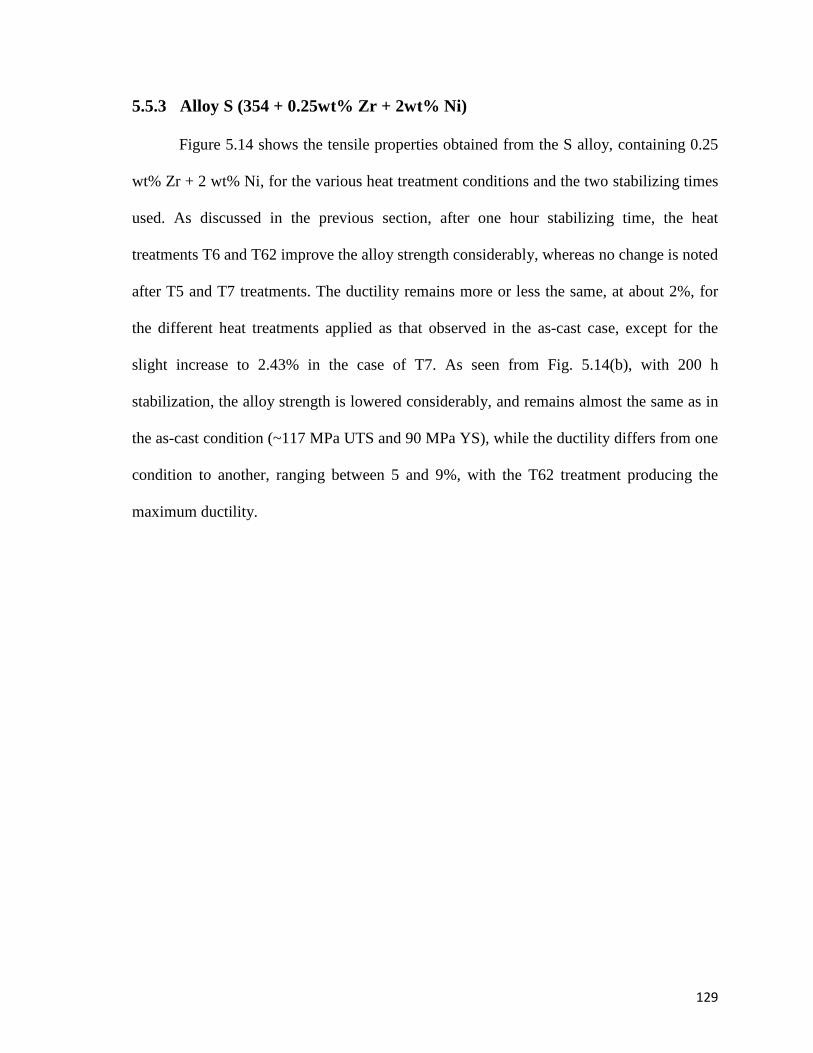
129
5.5.3 Alloy S (354 + 0.25wt% Zr + 2wt% Ni)
Figure 5.14 shows the tensile properties obtained from the S alloy, containing 0.25
wt% Zr + 2 wt% Ni, for the various heat treatment conditions and the two stabilizing times
used. As discussed in the previous section, after one hour stabilizing time, the heat
treatments T6 and T62 improve the alloy strength considerably, whereas no change is noted
after T5 and T7 treatments. The ductility remains more or less the same, at about 2%, for
the different heat treatments applied as that observed in the as-cast case, except for the
slight increase to 2.43% in the case of T7. As seen from Fig. 5.14(b), with 200 h
stabilization, the alloy strength is lowered considerably, and remains almost the same as in
the as-cast condition (~117 MPa UTS and 90 MPa YS), while the ductility differs from one
condition to another, ranging between 5 and 9%, with the T62 treatment producing the
maximum ductility.
130
(a)
(b)
Figure 5.14 Mean values for UTS, YS, % El for alloy S at the given heat treatment conditions for; (a) One and (b) 200 hours stabilization at 250°C.
0.00
5.00
10.00
15.00
20.00
25.00
0.00
60.00
120.00
180.00
240.00
300.00
As Cast T5 T6 T62 T7
Elo
nga
tio
n t
o F
ract
ure
(%
)
Str
en
gth
(M
Pa
)
Heat Treatment Condition
UTS YS %El
0.00
5.00
10.00
15.00
20.00
25.00
0.00
60.00
120.00
180.00
240.00
300.00
As Cast T5 T6 T62 T7
Elo
nga
tio
n t
o F
ract
ure
(%
)
Str
en
gth
(M
Pa
)
Heat Treatment Condition
UTS YS %El
131
5.5.4 Alloy U (354 + 0.25wt% Zr + 0.75wt% Mn)
Figure 5.15 shows the tensile properties obtained from the U alloy, under the
different heat treatment conditions and after (a) 1h and (b) 200h stabilization at 250°C.
Compared to the as-cast condition, and for the one hour stabilization time, the T62
condition corresponds to the peak aging condition, with strength values of 255.58 MPa
UTS and 255.11 MPa YS. Alloy softening is observed following T7 heat treatment,
although the ductility increases only slightly above the average 2.5% observed for the other
conditions. In contrast, with 200 h stabilization, the T6, T62 and T7 heat-treated alloys
display the lowest strength values: ~97 MPa UTS, and ~78-80 MPa YS, respectively,
whereas the ductility in theT62 condition increases to almost triple that of the as-cast value
(cf. 14.3% with 5%).
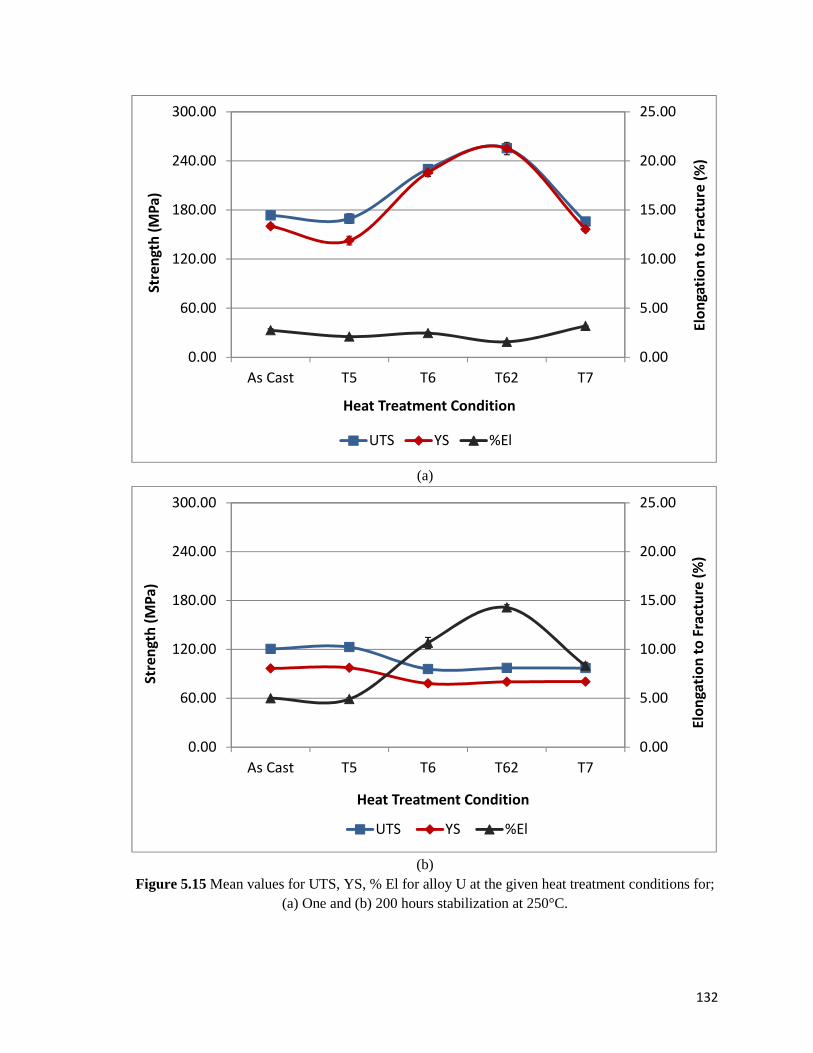
132
(a)
(b)
Figure 5.15 Mean values for UTS, YS, % El for alloy U at the given heat treatment conditions for; (a) One and (b) 200 hours stabilization at 250°C.
0.00
5.00
10.00
15.00
20.00
25.00
0.00
60.00
120.00
180.00
240.00
300.00
As Cast T5 T6 T62 T7
Elo
nga
tio
n t
o F
ract
ure
(%
)
Str
en
gth
(M
Pa
)
Heat Treatment Condition
UTS YS %El
0.00
5.00
10.00
15.00
20.00
25.00
0.00
60.00
120.00
180.00
240.00
300.00
As Cast T5 T6 T62 T7
Elo
nga
tio
n t
o F
ract
ure
(%
)
Str
en
gth
(M
Pa
)
Heat Treatment Condition
UTS YS %El
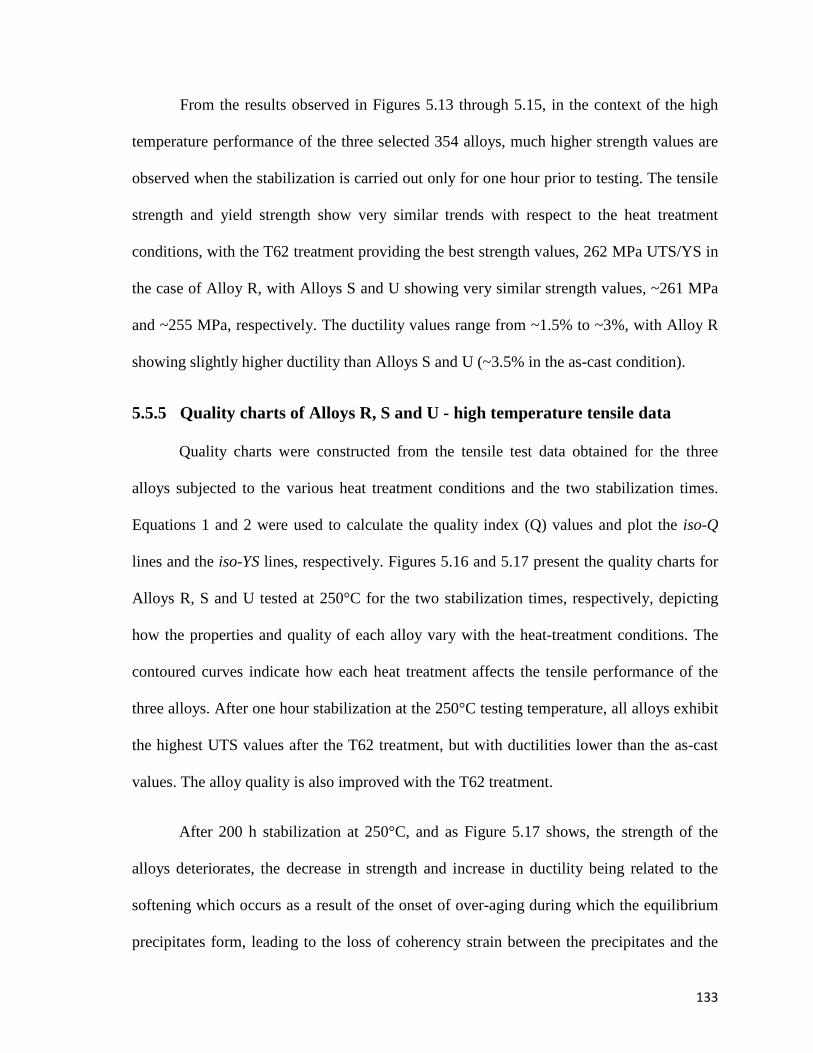
133
From the results observed in Figures 5.13 through 5.15, in the context of the high
temperature performance of the three selected 354 alloys, much higher strength values are
observed when the stabilization is carried out only for one hour prior to testing. The tensile
strength and yield strength show very similar trends with respect to the heat treatment
conditions, with the T62 treatment providing the best strength values, 262 MPa UTS/YS in
the case of Alloy R, with Alloys S and U showing very similar strength values, ~261 MPa
and ~255 MPa, respectively. The ductility values range from ~1.5% to ~3%, with Alloy R
showing slightly higher ductility than Alloys S and U (~3.5% in the as-cast condition).
5.5.5 Quality charts of Alloys R, S and U - high temperature tensile data
Quality charts were constructed from the tensile test data obtained for the three
alloys subjected to the various heat treatment conditions and the two stabilization times.
Equations 1 and 2 were used to calculate the quality index (Q) values and plot the iso-Q
lines and the iso-YS lines, respectively. Figures 5.16 and 5.17 present the quality charts for
Alloys R, S and U tested at 250°C for the two stabilization times, respectively, depicting
how the properties and quality of each alloy vary with the heat-treatment conditions. The
contoured curves indicate how each heat treatment affects the tensile performance of the
three alloys. After one hour stabilization at the 250°C testing temperature, all alloys exhibit
the highest UTS values after the T62 treatment, but with ductilities lower than the as-cast
values. The alloy quality is also improved with the T62 treatment.
After 200 h stabilization at 250°C, and as Figure 5.17 shows, the strength of the
alloys deteriorates, the decrease in strength and increase in ductility being related to the
softening which occurs as a result of the onset of over-aging during which the equilibrium
precipitates form, leading to the loss of coherency strain between the precipitates and the
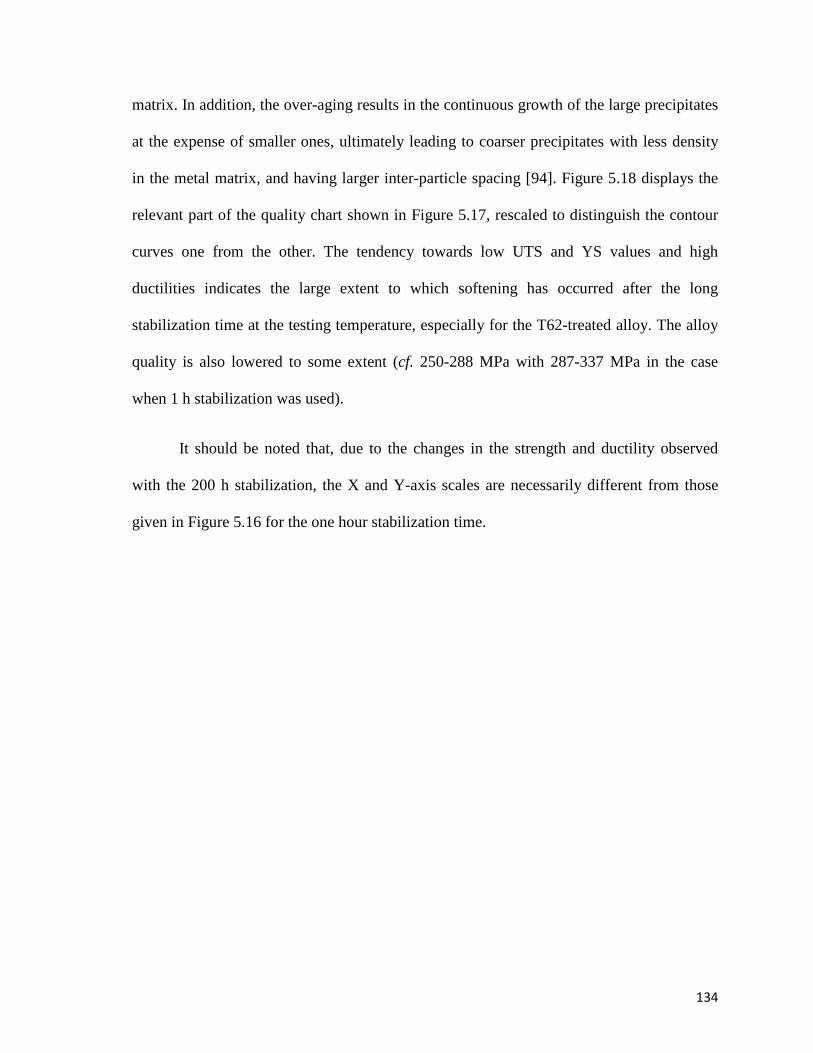
134
matrix. In addition, the over-aging results in the continuous growth of the large precipitates
at the expense of smaller ones, ultimately leading to coarser precipitates with less density
in the metal matrix, and having larger inter-particle spacing [94]. Figure 5.18 displays the
relevant part of the quality chart shown in Figure 5.17, rescaled to distinguish the contour
curves one from the other. The tendency towards low UTS and YS values and high
ductilities indicates the large extent to which softening has occurred after the long
stabilization time at the testing temperature, especially for the T62-treated alloy. The alloy
quality is also lowered to some extent (cf. 250-288 MPa with 287-337 MPa in the case
when 1 h stabilization was used).
It should be noted that, due to the changes in the strength and ductility observed
with the 200 h stabilization, the X and Y-axis scales are necessarily different from those
given in Figure 5.16 for the one hour stabilization time.
Figure 5.16 Quality charts showing UTS vs % El plots for Alloys R, S and U subjected to various heat treatment conditions (testing at 250°C after 1h stabilization).
Figure 5.17 Quality charts showing UTS vs % El plots for Alloys R, S and U subjected to various heat treatment conditions (testing at 250°C after 200h stabilization).
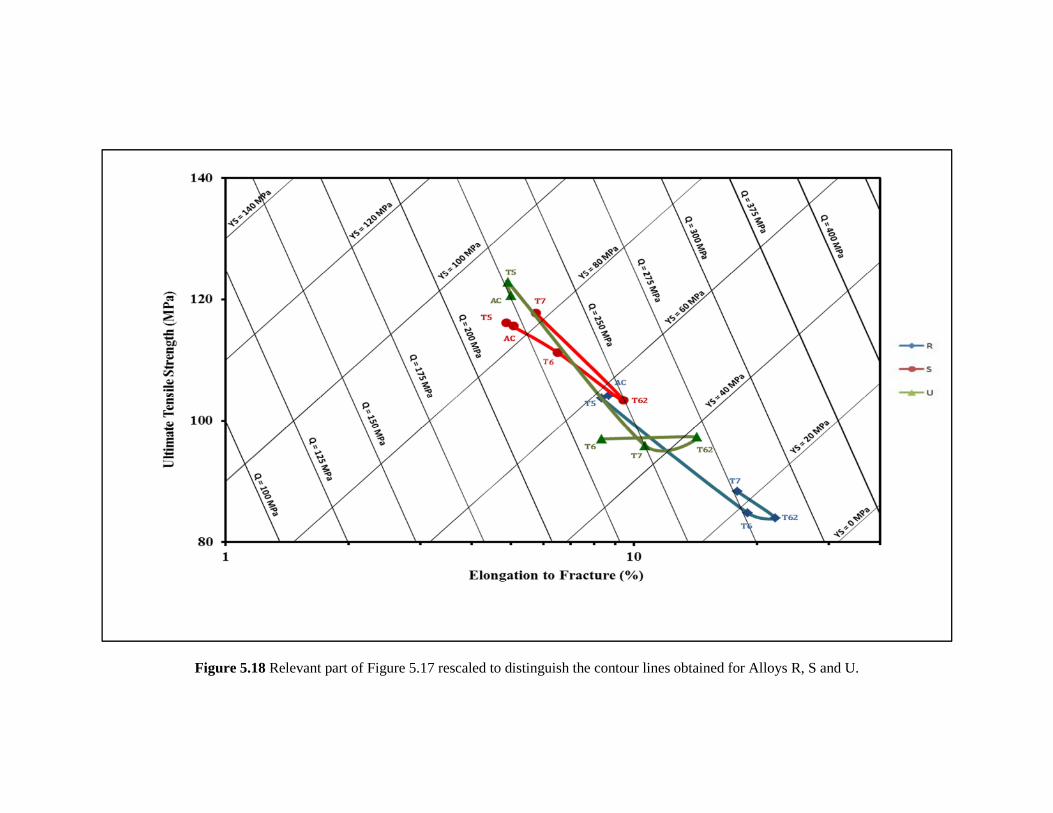
Figure 5.18 Relevant part of Figure 5.17 rescaled to distinguish the contour lines obtained for Alloys R, S and U.
138
5.5.6 Comparison between the high temperature tensile properties of as-cast
and T6-treated 354 alloy with different alloying additions and a new
alloy
In this section, the high temperature tensile properties of as-cast and T6-heat treated
354 alloys R, S and U (tested at 250°C and using the two stabilization times at testing
temperature) will be compared to determine the effect of the various alloying additions,
together with the tensile properties of Alloy Z (354 alloy, containing 0.25 wt% Zr + 0.15
wt% Sc) and Alloy L (398 alloy, containing the same levels of Zr and Sc as alloy Z) to
examine (i) the effect of a combined Zr and Sc addition in enhancing the high temperature
behavior of 354 alloy, and (ii) the feasibility of using the new alloy 398 with the same Zr
and Sc additions as an alternative for similar high temperature applications.
Table 5.5 lists the tensile properties obtained for the five alloys when tested at
250°C after 1 hour of stabilization at testing temperature, while Table 5.6 shows the tensile
properties for the same five alloys after 200 h stabilization at the same testing temperature.
The results are displayed in Figures 5.19 and 5.20, respectively.
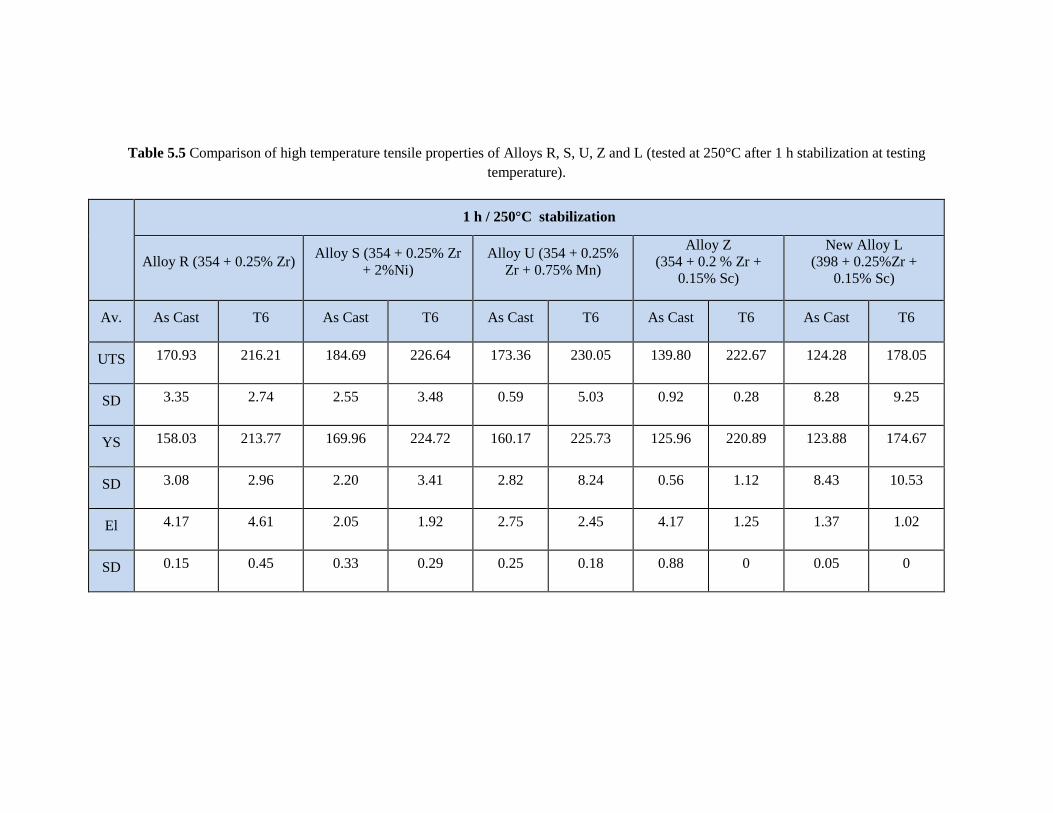
Table 5.5 Comparison of high temperature tensile properties of Alloys R, S, U, Z and L (tested at 250°C after 1 h stabilization at testing temperature).
1 h / 250°C stabilization
Alloy R (354 + 0.25% Zr) Alloy S (354 + 0.25% Zr
+ 2%Ni) Alloy U (354 + 0.25%
Zr + 0.75% Mn)
Alloy Z (354 + 0.2 % Zr +
0.15% Sc)
New Alloy L (398 + 0.25%Zr +
0.15% Sc)
Av. As Cast T6 As Cast T6 As Cast T6 As Cast T6 As Cast T6
UTS 170.93 216.21 184.69 226.64 173.36 230.05 139.80 222.67 124.28 178.05
SD 3.35 2.74 2.55 3.48 0.59 5.03 0.92 0.28 8.28 9.25
YS 158.03 213.77 169.96 224.72 160.17 225.73 125.96 220.89 123.88 174.67
SD 3.08 2.96 2.20 3.41 2.82 8.24 0.56 1.12 8.43 10.53
El 4.17 4.61 2.05 1.92 2.75 2.45 4.17 1.25 1.37 1.02
SD 0.15 0.45 0.33 0.29 0.25 0.18 0.88 0 0.05 0
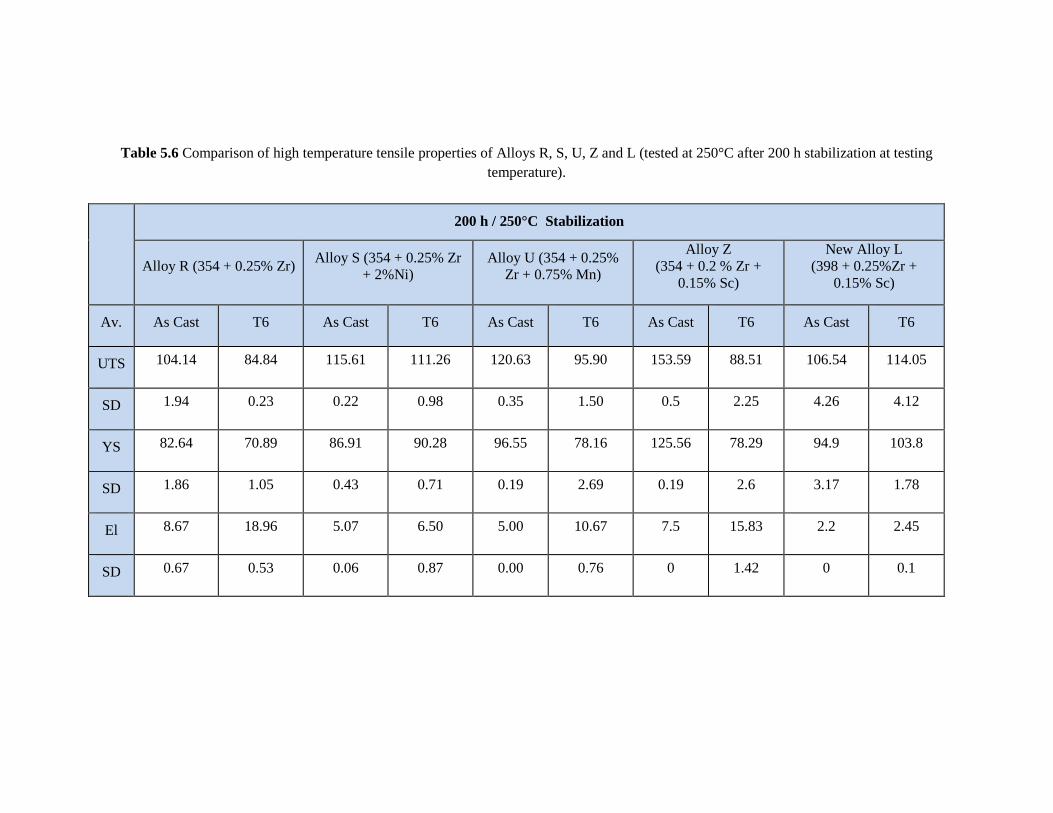
Table 5.6 Comparison of high temperature tensile properties of Alloys R, S, U, Z and L (tested at 250°C after 200 h stabilization at testing temperature).
200 h / 250°C Stabilization
Alloy R (354 + 0.25% Zr) Alloy S (354 + 0.25% Zr
+ 2%Ni) Alloy U (354 + 0.25%
Zr + 0.75% Mn)
Alloy Z (354 + 0.2 % Zr +
0.15% Sc)
New Alloy L (398 + 0.25%Zr +
0.15% Sc)
Av. As Cast T6 As Cast T6 As Cast T6 As Cast T6 As Cast T6
UTS 104.14 84.84 115.61 111.26 120.63 95.90 153.59 88.51 106.54 114.05
SD 1.94 0.23 0.22 0.98 0.35 1.50 0.5 2.25 4.26 4.12
YS 82.64 70.89 86.91 90.28 96.55 78.16 125.56 78.29 94.9 103.8
SD 1.86 1.05 0.43 0.71 0.19 2.69 0.19 2.6 3.17 1.78
El 8.67 18.96 5.07 6.50 5.00 10.67 7.5 15.83 2.2 2.45
SD 0.67 0.53 0.06 0.87 0.00 0.76 0 1.42 0 0.1
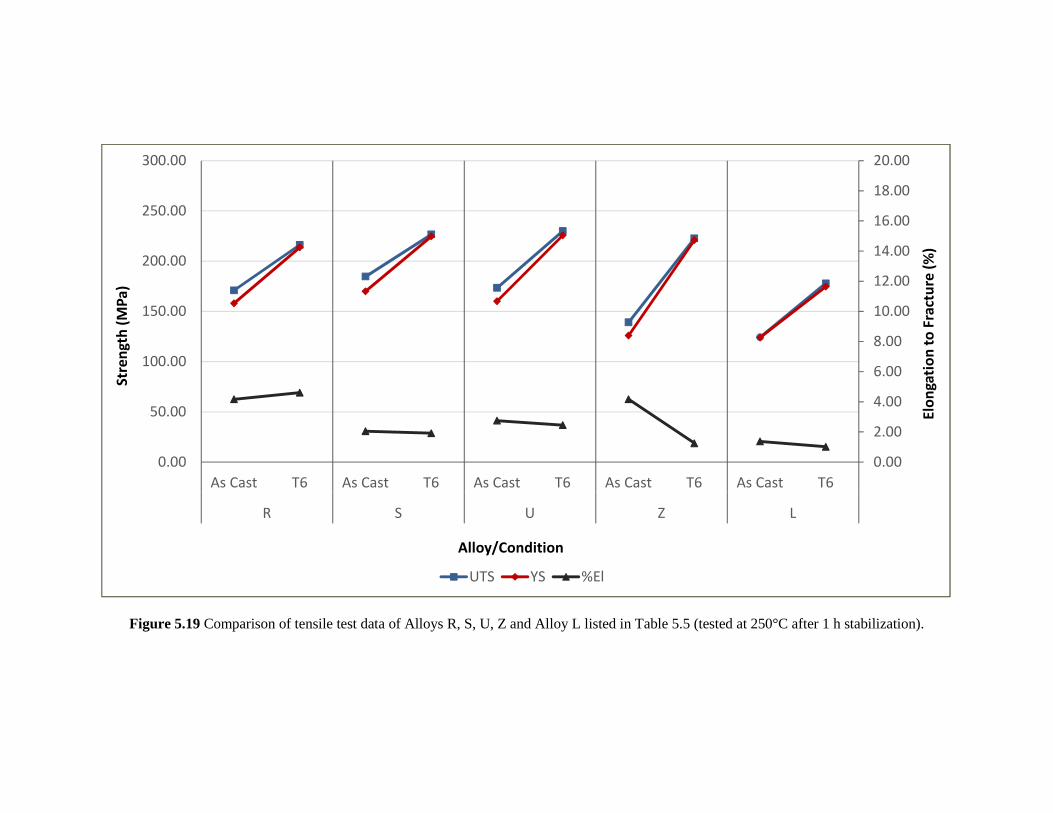
Figure 5.19 Comparison of tensile test data of Alloys R, S, U, Z and Alloy L listed in Table 5.5 (tested at 250°C after 1 h stabilization).
0.00
2.00
4.00
6.00
8.00
10.00
12.00
14.00
16.00
18.00
20.00
0.00
50.00
100.00
150.00
200.00
250.00
300.00
As Cast T6 As Cast T6 As Cast T6 As Cast T6 As Cast T6
R S U Z L
Elo
nga
tio
n t
o F
ract
ure
(%
)
Str
en
gth
(M
Pa
)
Alloy/Condition
UTS YS %El
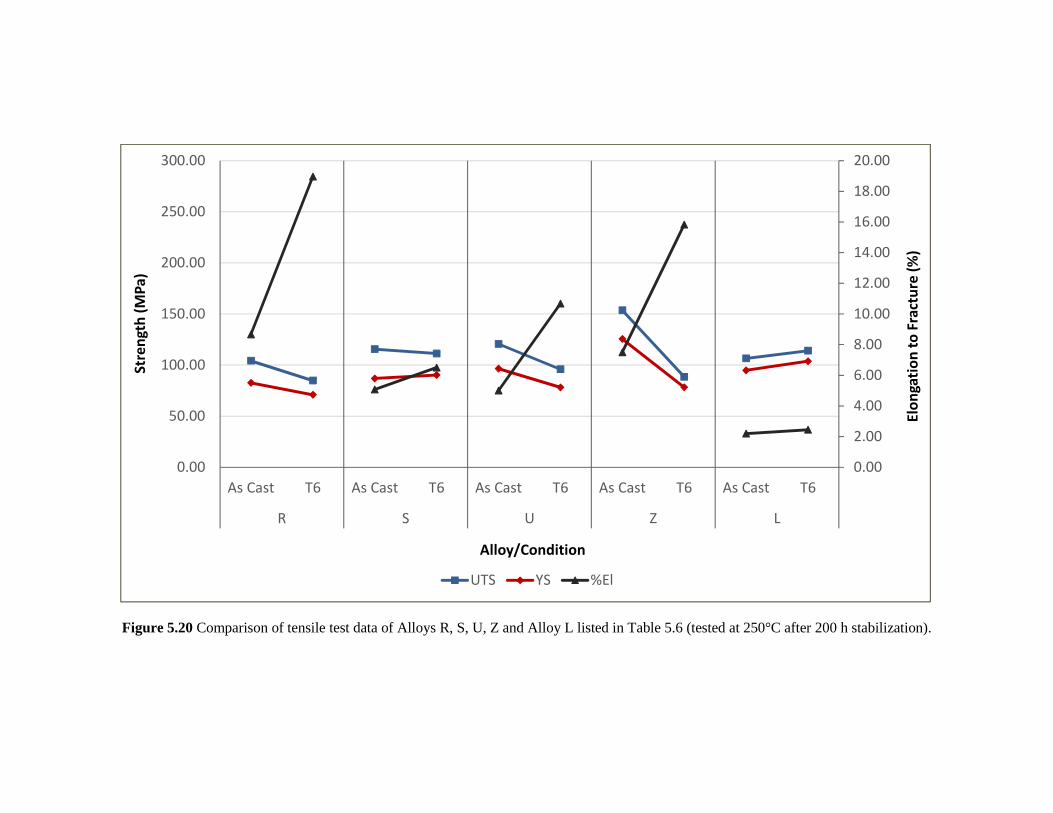
Figure 5.20 Comparison of tensile test data of Alloys R, S, U, Z and Alloy L listed in Table 5.6 (tested at 250°C after 200 h stabilization).
0.00
2.00
4.00
6.00
8.00
10.00
12.00
14.00
16.00
18.00
20.00
0.00
50.00
100.00
150.00
200.00
250.00
300.00
As Cast T6 As Cast T6 As Cast T6 As Cast T6 As Cast T6
R S U Z L
Elo
nga
tio
n t
o F
ract
ure
(%
)
Str
en
gth
(M
Pa
)
Alloy/Condition
UTS YS %El
143
As may be seen from Table 5.5, with one hour stabilization, the alloy strength in the
as-cast condition is increased with the addition of Ni in Alloy S and Mn in the case of
Alloy U but it decreases in Alloy Z and Alloy L (398 alloy with the same Zr and Sc
additions as Alloy Z); after T6 heat treatment incorporating the SHT 1 solution treatment,
the strength of all alloys is enhanced, by about 40-80 MPa, with Alloy Z showing the
greatest improvement. As may also be observed from Table 5.5, Alloy U (containing
0.75wt% Mn + 0.25wt% Zr) in the T6 (SHT 1) condition seems to be the best alloy with
respect to mechanical properties at high temperature, since it displays higher tensile
properties taking into consideration both as-cast and T6 conditions.
From Table 5.6, which displays the high temperature tensile properties after 200
hours stabilization at 250°C, it may be seen that Alloy Z (354 + 0.25wt% Zr + 0.15wt%
Sc) shows a large increase in strength compared to the base alloy R for the as-cast
condition. The addition of Sc to Al alloys is more effective than Zr addition in improving
recrystallization resistance [134], due to the formation of a high density of Al3Sc particles.
However, a combined addition of Sc and Zr produces Al 3(Sc,Zr) particles which are more
stable than the Al3Sc dispersoids, and that leads to the improvement of the recrystallization
resistance [70]. Additionally, it has been shown that Zr increases the resistance to
overaging when it is added to binary Al-Sc alloy [62].
Table 5.6 also shows that, in general, the strength of the 354 alloys (UTS and YS)
decreases considerably on going from the as-cast to the T6 heat-treated condition, with the
exception of Alloy S, which shows a decrease in the UTS of ~4.5 MPa and an increase in
the YS of ~3 MPa. The reduction in strength of the other 354 alloys results from the
coarsening of the different strengthening precipitates in the alloys based on the additions
144
made in each case. In contrast, alloy L (398 + 0.25wt% Zr + 0.15wt% Sc) the strength
values increase by ~6.5 MPa and ~ 9 MPa for the UTS and YS.
While a detailed investigation of the precipitation behavior using transmission
electron microscopy (TEM) was not within the scope of the present study, as an example,
TEM analysis was carried out for the Alloy U samples tested at high temperature following
the two stabilization times to demonstrate the change in the precipitates over prolonged
periods of heating. Figure 5.21 compares the precipitates observed in the U alloy samples
after (a) 1 hr stabilization and (b) 200 hrs stabilization at 250 °C. As may be seen, the finer
precipitates in Figure 5.21(a) have coarsened so that a lot more of them are visible after the
200 hrs stabilization period, as seen in Figure 5.21(b).
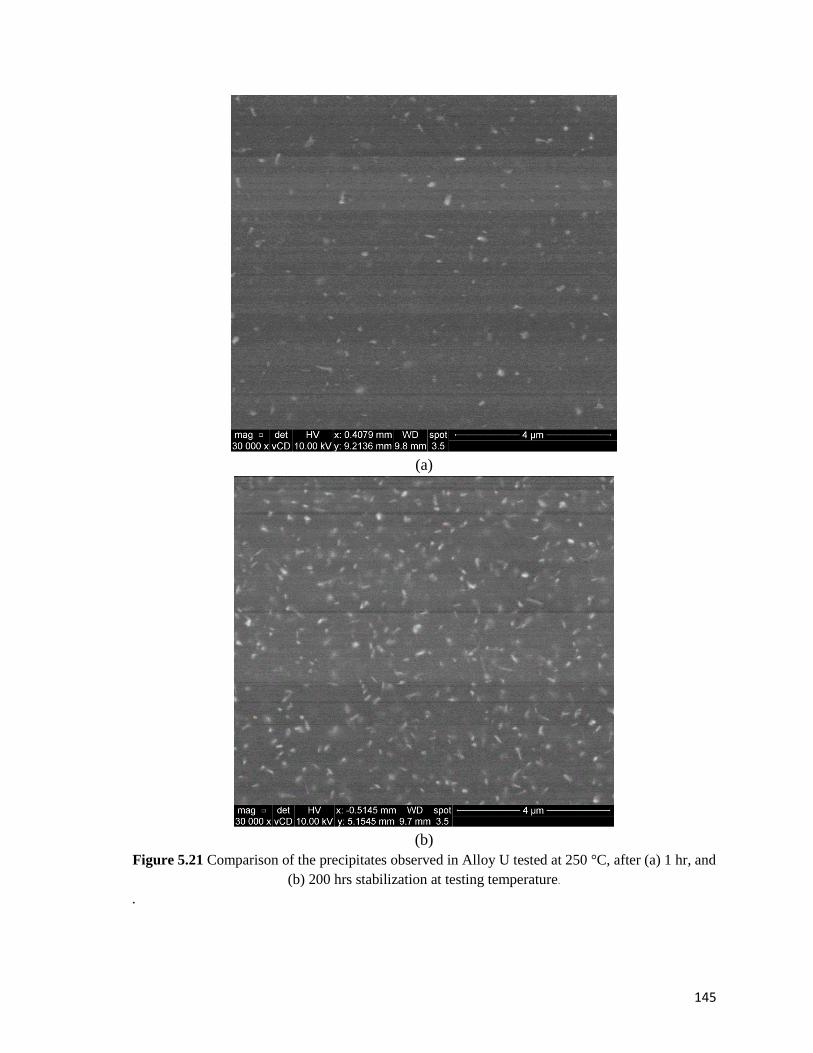
145
(a)
(b)
Figure 5.21 Comparison of the precipitates observed in Alloy U tested at 250 °C, after (a) 1 hr, and (b) 200 hrs stabilization at testing temperature.
.
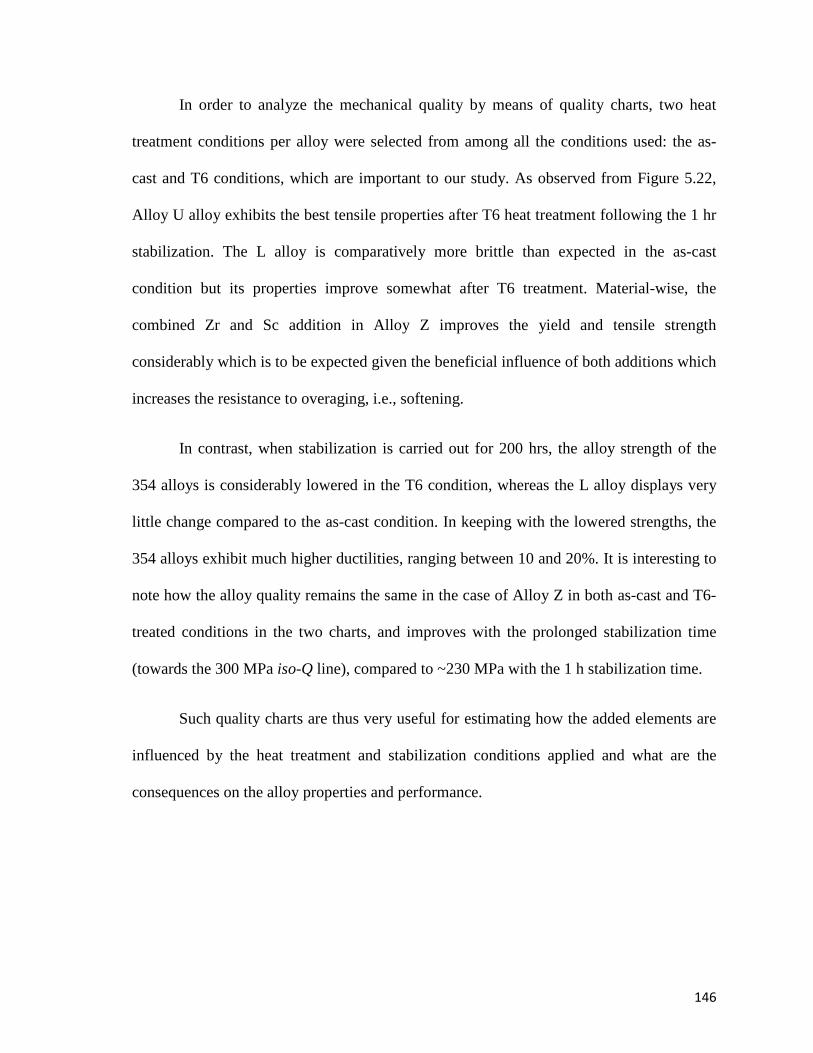
146
In order to analyze the mechanical quality by means of quality charts, two heat
treatment conditions per alloy were selected from among all the conditions used: the as-
cast and T6 conditions, which are important to our study. As observed from Figure 5.22,
Alloy U alloy exhibits the best tensile properties after T6 heat treatment following the 1 hr
stabilization. The L alloy is comparatively more brittle than expected in the as-cast
condition but its properties improve somewhat after T6 treatment. Material-wise, the
combined Zr and Sc addition in Alloy Z improves the yield and tensile strength
considerably which is to be expected given the beneficial influence of both additions which
increases the resistance to overaging, i.e., softening.
In contrast, when stabilization is carried out for 200 hrs, the alloy strength of the
354 alloys is considerably lowered in the T6 condition, whereas the L alloy displays very
little change compared to the as-cast condition. In keeping with the lowered strengths, the
354 alloys exhibit much higher ductilities, ranging between 10 and 20%. It is interesting to
note how the alloy quality remains the same in the case of Alloy Z in both as-cast and T6-
treated conditions in the two charts, and improves with the prolonged stabilization time
(towards the 300 MPa iso-Q line), compared to ~230 MPa with the 1 h stabilization time.
Such quality charts are thus very useful for estimating how the added elements are
influenced by the heat treatment and stabilization conditions applied and what are the
consequences on the alloy properties and performance.
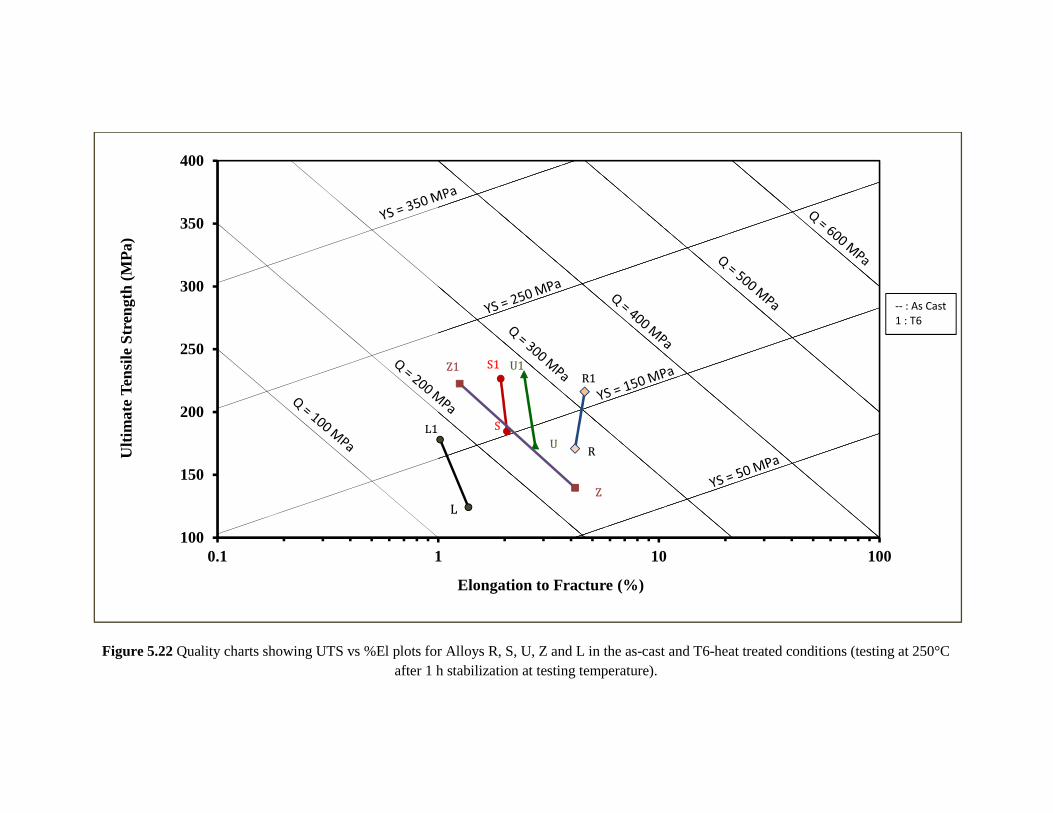
Figure 5.22 Quality charts showing UTS vs %El plots for Alloys R, S, U, Z and L in the as-cast and T6-heat treated conditions (testing at 250°C after 1 h stabilization at testing temperature).
100
150
200
250
300
350
400
0.1 1 10 100
Ulti
mat
e Te
nsile
Str
engt
h (M
Pa)
Elongation to Fracture (%)
R
L
R1
S
Z1
Z
L1U
U1S1
-- : As Cast
1 : T6
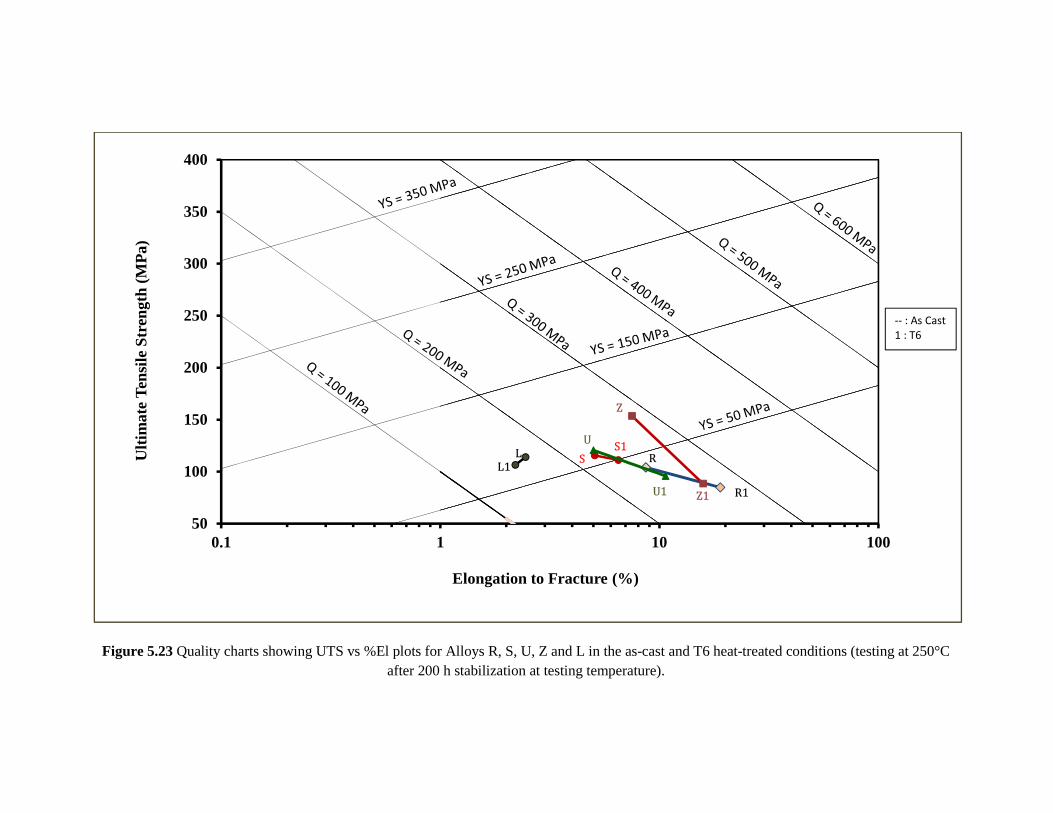
Figure 5.23 Quality charts showing UTS vs %El plots for Alloys R, S, U, Z and L in the as-cast and T6 heat-treated conditions (testing at 250°C after 200 h stabilization at testing temperature).
50
100
150
200
250
300
350
400
0.1 1 10 100
Ulti
mat
e Te
nsile
Str
engt
h (M
Pa)
Elongation to Fracture (%)
RL
R1
S
Z1
Z
L1
U
U1
S1
-- : As Cast
1 : T6
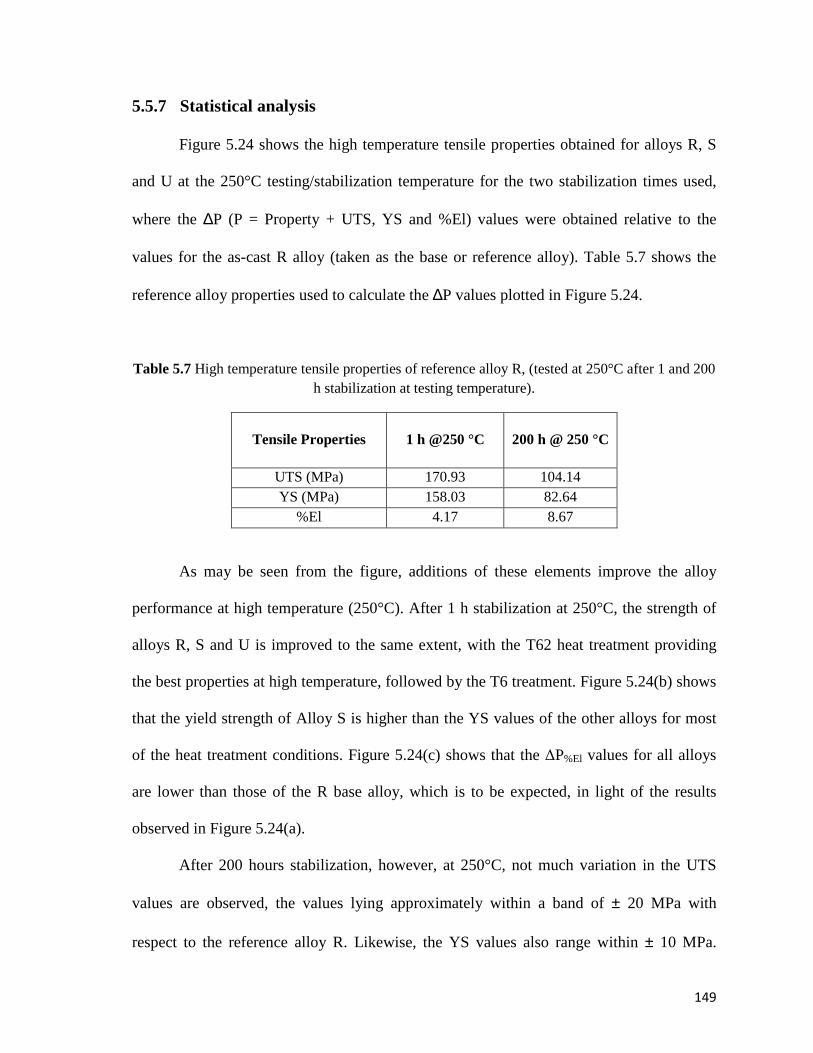
149
5.5.7 Statistical analysis
Figure 5.24 shows the high temperature tensile properties obtained for alloys R, S
and U at the 250°C testing/stabilization temperature for the two stabilization times used,
where the ∆P (P = Property + UTS, YS and %El) values were obtained relative to the
values for the as-cast R alloy (taken as the base or reference alloy). Table 5.7 shows the
reference alloy properties used to calculate the ∆P values plotted in Figure 5.24.
Table 5.7 High temperature tensile properties of reference alloy R, (tested at 250°C after 1 and 200 h stabilization at testing temperature).
Tensile Properties 1 h @250 °C 200 h @ 250 °C
UTS (MPa) 170.93 104.14 YS (MPa) 158.03 82.64
%El 4.17 8.67
As may be seen from the figure, additions of these elements improve the alloy
performance at high temperature (250°C). After 1 h stabilization at 250°C, the strength of
alloys R, S and U is improved to the same extent, with the T62 heat treatment providing
the best properties at high temperature, followed by the T6 treatment. Figure 5.24(b) shows
that the yield strength of Alloy S is higher than the YS values of the other alloys for most
of the heat treatment conditions. Figure 5.24(c) shows that the ∆P%El values for all alloys
are lower than those of the R base alloy, which is to be expected, in light of the results
observed in Figure 5.24(a).
After 200 hours stabilization, however, at 250°C, not much variation in the UTS
values are observed, the values lying approximately within a band of ± 20 MPa with
respect to the reference alloy R. Likewise, the YS values also range within ± 10 MPa.
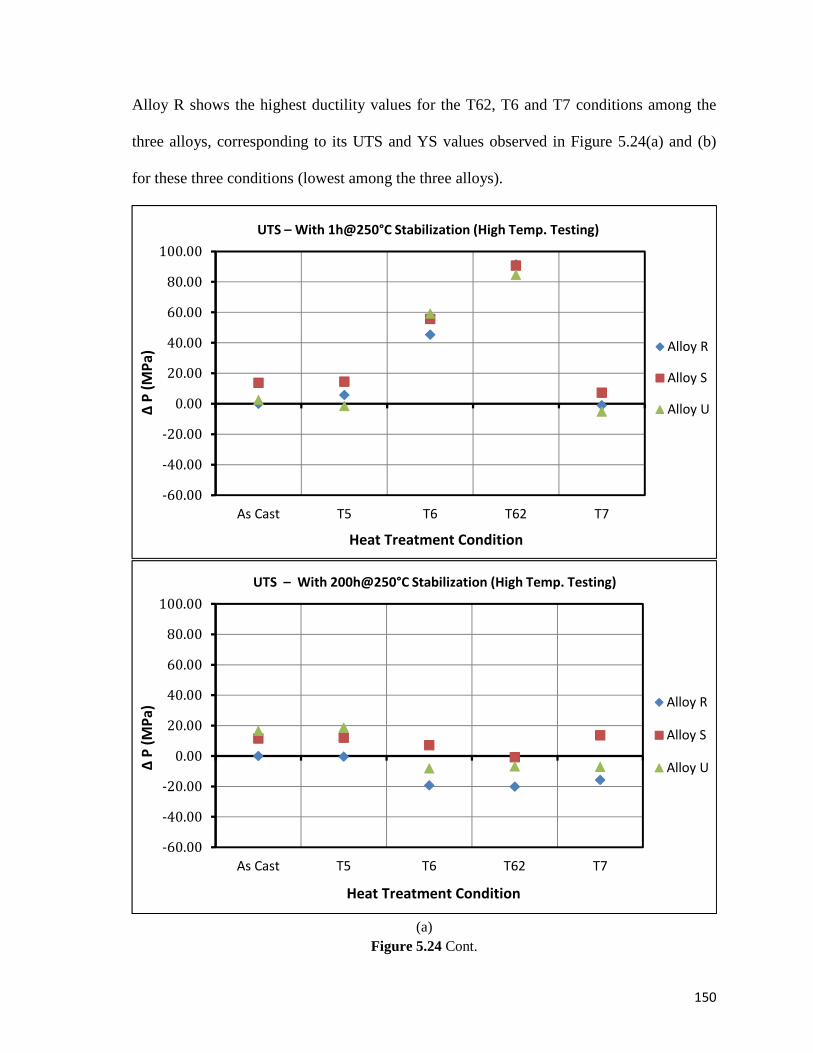
150
Alloy R shows the highest ductility values for the T62, T6 and T7 conditions among the
three alloys, corresponding to its UTS and YS values observed in Figure 5.24(a) and (b)
for these three conditions (lowest among the three alloys).
(a)
Figure 5.24 Cont.
-60.00
-40.00
-20.00
0.00
20.00
40.00
60.00
80.00
100.00
As Cast T5 T6 T62 T7
Alloy R
Alloy S
Alloy U
Heat Treatment Condition
∆ P
(M
Pa
)
UTS – With 1h@250°C Stabilization (High Temp. Testing)
-60.00
-40.00
-20.00
0.00
20.00
40.00
60.00
80.00
100.00
As Cast T5 T6 T62 T7
Alloy R
Alloy S
Alloy U
Heat Treatment Condition
∆ P
(M
Pa
)
UTS – With 200h@250°C Stabilization (High Temp. Testing)
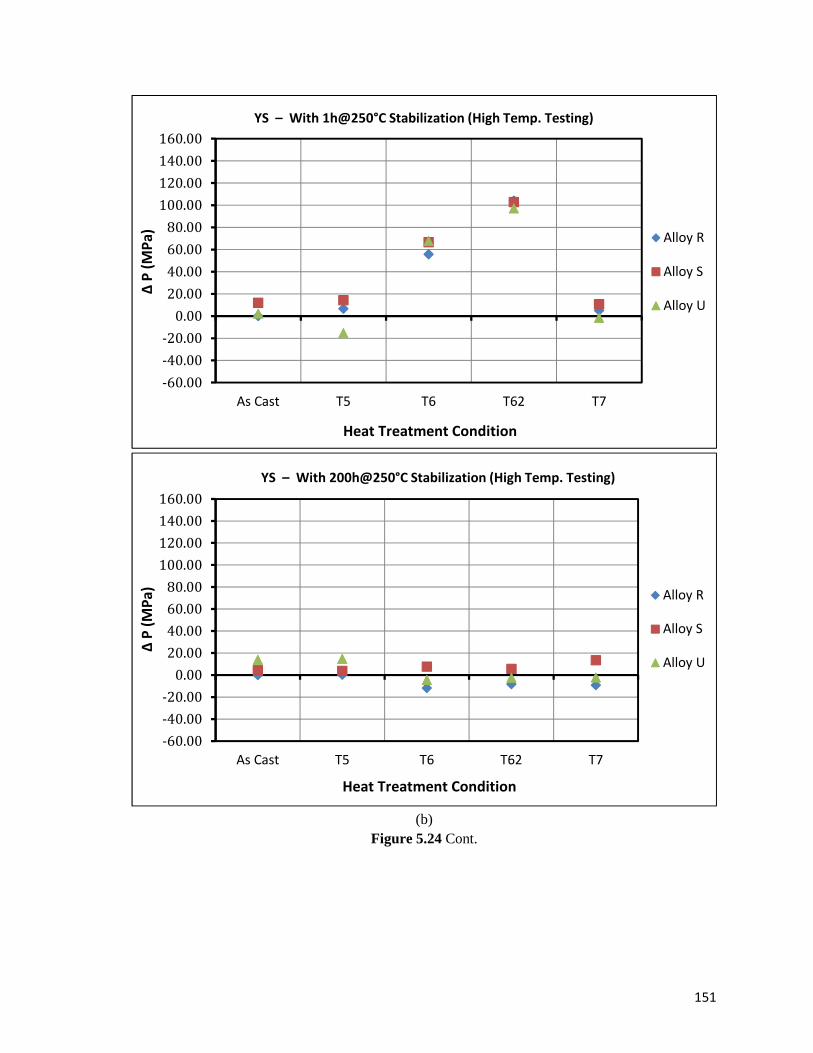
151
(b)
Figure 5.24 Cont.
-60.00
-40.00
-20.00
0.00
20.00
40.00
60.00
80.00
100.00120.00
140.00
160.00
As Cast T5 T6 T62 T7
Alloy R
Alloy S
Alloy U
Heat Treatment Condition
∆ P
(M
Pa
)
YS – With 1h@250°C Stabilization (High Temp. Testing)
-60.00-40.00-20.000.00
20.0040.0060.0080.00
100.00120.00140.00160.00
As Cast T5 T6 T62 T7
Alloy R
Alloy S
Alloy U
Heat Treatment Condition
∆ P
(M
Pa
)
YS – With 200h@250°C Stabilization (High Temp. Testing)
152
(c)
Figure 5.24 Comparison of high temperature tensile properties of R, S and U alloys relative to those of the as-cast base alloy: (a) UTS, (b) YS, and (c) %El after 1 h and 200 h stabilization at
250°C.
-5.00
0.00
5.00
10.00
15.00
As Cast T5 T6 T62 T7
Alloy R
Alloy S
Alloy U
Heat Treatment Condition
∆ P
(%
)
%El – With 1h@250°C Stabilization (High Temp. Testing)
-5.00
0.00
5.00
10.00
15.00
As Cast T5 T6 T62 T7
Alloy R
Alloy S
Alloy U
Heat Treatment Condition
∆ P
(%
)
%El – With 200h@250°C Stabilization (High Temp. Testing)

6 CHAPTER 6
CONCLUSIONS
CHAPTER 6
CONCLUSIONS
This chapter presents the conclusions drawn from the experimental data obtained
which were presented in Chapters 4 and 5. These are presented in two separate parts, A and
B, as shown below.
Part A
Based on the microstructural results, thermal analysis data and porosity formation
measurements presented in Chapter 4, corresponding to the different 354 alloys containing
Zr, Ni, Mn and Sc additions (viz., alloys R, S, T, U, V and Z), the following conclusions
may be drawn:
1. Six main reactions are detected during the solidification of the 354 base alloy:
(i) formation of the α-Al dendritic network at 598°C, followed by (ii) precipitation
of the Al-Si eutectic and the post-eutectic β-Al 5FeSi phase at 560°C; (iii) Mg2Si
phase formation at 540°C; (iv) transformation of the β-iron Al5FeSi phase into π-
Al 8Mg3FeSi6 phase at 525°C; and lastly, precipitation of the copper-containing
phases Al2Cu and Q-Al 5Mg8Cu2Si6 that precipitate almost simultaneously at 498°C
and 488°C.
2. While minimum iron content is always recommended in the production of the 354
casting alloys, when such alloy castings contain high iron levels, appropriate
155
solution heat treatment procedures may partially neutralize the deleterious effect of
the iron-bearing phases.
3. As a result of the low solidification rate of the thermal analysis castings, and a Zr
content of 0.25 wt%, all Zr-containing alloys are located in the L + Al3Zr region of
the Al-Zr phase diagram during the melting stage.
4. Three main reactions are detected with the addition of Ni, i.e., the formation of
AlFeNi, AlCuNi and AlSiNiZr phases.
5. Larger sizes of AlFeNi and AlCuNi phase particles are observed in the T alloy
with a Ni content of 4 wt%, when compared to those seen in the S alloy sample
with its lower Ni content of 2 wt%.
6. Mn addition in Alloy U helps in reducing the detrimental effect of the platelet
morphology of the β-iron Al5FeSi phase by replacing it with the more compact
and hence less detrimental Chinese script α-Al 15(Fe,Mn)3Si2 phase and sludge
particles.
7. Sc-containing intermetallic phases observed in this study appear in two different
forms: (Al,Ti)(Sc,Zr) and (Al,Si)(Sc,Zr,Ti).
8. When the as-cast alloys are subjected to the multi-step solution treatment –
involving higher solution temperatures and longer durations, an increased
amount of incipient melting is expected to occur.
9. After multi-step solution heat treatment coarsening of the Si particles is
observed, with larger particles growing bigger at the expense of smaller ones.
10. Primary Si particles are observed in the microstructure of the 398 hypereutectic
Al-Si alloy L with its high Si content of 16 wt%.
156
Part B
Based on the results presented in Chapter 5 on the room temperature and high
temperature tensile properties of the 354 alloys investigated, the following conclusions
may be drawn:
Room Temperature Tensile Testing
11. The multi-step solution heat treatment (or SHT 2) results in higher tensile
properties than those achieved with the SHT 1 treatment or in the as-cast
condition, due to the increase in the amount of dissolution of the Cu-phases and
a reduced risk of the occurrence of incipient melting.
12. The ultimate tensile strength and ductility of the given alloys in the multi-step
solution heat-treated condition increase by as much as 70 MPa and 3%
respectively, in comparison with the as-cast and SHT 1 conditions, while the
yield strength remains almost the same.
13. Without stabilization, T6 and T62 treatments provide the best improvements in
both UTS and YS values of all alloys.
14. The best tensile properties of alloys tested at room temperature after stabilization
at 250°C for 200h are obtained with the T6 heat treatment.
15. Alloy R shows the best quality index values after T62 treatment, i.e., 411 MPa
and 418.64 MPa without, and with 200 hours stabilization, respectively,
followed by Alloy U which displays a Q value of 397.84 MPa after T62
treatment (with no stabilization) and 404.62 MPa following T6 treatment and
200 h stabilization at 250°C before testing.
157
16. The presence of 2 wt% Ni in Alloy S leads to the formation of Al-Cu-Ni phase
particles in addition to the Al2Cu phase. The persistence of this phase after T6,
T62 and T7 heat treatments would explain the increased strength observed in
these cases, and would also account for the high YS values, as the Al-Cu-Ni
particles would act as barriers to the movement of dislocations in the matrix.
17. After T62 treatment, Alloy U (containing 0.75wt% Mn + 0.25wt% Zr) shows
the maximum increase in tensile properties, with the UTS and YS values
increasing by ~100 MPa and ~160 MPa, respectively.
High Temperature Tensile Testing
18. The addition of Zr, Ni, Mn and Sc to 354-type alloys improves the high
temperature tensile properties compared to the base alloy.
19. Alloy S (Al 354 + 0.25wt% Zr + 2wt% Ni) and alloy U (Al 354 + 0.25wt% Zr +
2wt% Ni) perform better in case of high temperature conditions, with one hour
stabilization at 250oC, displaying strength values of 226.64/230.05 MPa UTS and
224.72/225.73 MPa YS, respectively. For a prolonged stabilization time (200 h at
250oC), however, the strength values are reduced to 111.26/95.9 MPa UTS, and
90.28/78.16 MPa YS, respectively.
20. The decrease in strength and increase in ductility observed for the 354 alloys after
prolonged stabilization of 200 h at 250oC is related to the softening which occurs as
a result of the over-aging conditions during which the equilibrium precipitates
form, leading to the loss of the coherency strain between the precipitates and the
matrix.
21. The L alloy (398 + 0.25wt% Zr + 0.15wt% Sc) is more brittle than expected in the
as-cast condition but it improves slightly after T6 treatment. After 200 hours
158
stabilization at 250oC, the T6-treated L alloy shows much better strength values of
114.05 MPa UTS and 103 MPa YS, in comparison with the 354 alloys.
22. Analysis of the tensile data using quality charts, color contour maps and ∆P plots
provide different tools to interpret the data and facilitate the selection of the
appropriate alloying additions and heat treatment conditions needed to achieve
properties specified for a required application, as well as determine how these
parameters would affect the properties and quality of the base alloy.
23. The addition of Zr with Mn to 354-alloy after T62 heat treatment gives best tensile
properties at room and high temperature as Mn addition in Alloy U helps in
reducing the detrimental effect of the β-iron phase by replacing it with the less-
detrimental Chinese script α-Al 15(Fe,Mn)3Si2 phase and sludge particles. In
addition, the use of the T62 heat treatment, incorporating the multi-step solution
treatment, allows for maximum dissolution of the copper phases in the multiple
stages of solution treatment, such dissolution produces the greatest improvement in
both UTS and YS values.

RECOMMENDATIONS FOR FUTURE WORK
160
RECOMMENDATIONS FOR FUTURE WORK
According to the results obtained in this study, the following aspects may be further
explored to provide a complete and well-established background for the Al-Si-Cu-Mg 354-
type alloys investigated in this study.
• Studying the effect of sample geometry such as flat samples with different
thicknesses, round samples with notches or holes one side to physically simulate
the different parts located in real castings e.g. engine blocks.
• Using an electron microprobe analyzer in order to identify the actual stoichiometric
composition of the different phases reported in the present work.
• Detailed fractographic investigation of samples tested at ambient and high
temperatures using scanning electron microscopy to establish the possible failure
mechanisms.

REFERENCES
REFERENCES
1- Franetovic, V., Lints, R.C. and Carter, J.T., 2003. Aluminum 2003. Proceedings of
the TMS 2003, 133-144.
2- Vatsayan, U., Pandey, K.M. and Biswas, A., 2014. Effects of Heat Treatment on
Materials Used In Automobiles: A Case Study. J. Mech. Civ. Eng., 11(5), pp.90-95.
3- Wang, E.R., Hui, X.D. and Chen, G.L., 2011. Eutectic Al–Si–Cu–Fe–Mn alloys with
enhanced mechanical properties at room and elevated temperature. Materials &
Design, 32(8), pp.4333-4340.
4- Ammar, H.R., Samuel, A.M. and Samuel, F.H., 2008. Effect of casting imperfections
on the fatigue life of 319-F and A356-T6 Al–Si casting alloys. Materials Science and
Engineering: A, 473(1), pp.65-75.
5- Jia, Z., Hu, G., Forbord, B. and Solberg, J.K., 2007. Effect of homogenization and
alloying elements on recrystallization resistance of Al–Zr–Mn alloys. Materials
Science and Engineering: A, 444(1), pp.284-290.
6- Garza-Elizondo, G.H., Alkahtani, S.A., Samuel, A.M. and Samuel, F.H., 2014. Role
of Ni and Zr in Preserving the Strength of 354 Aluminum Alloy at High
Temperature. In Light Metals 2014 (pp. 305-314). Springer International Publishing.
7- Dobrzański, L.A., Maniara, R. and Sokolowski, J.H., 2006. The effect of cast Al-Si-
Cu alloy solidification rate on alloy thermal characteristics. Journal of Achievements
in Materials and Manufacturing Engineering, 17(1-2), pp.217-220.
8- Mohamed, A.M.A. and Samuel, F.H., 2013. Microstructure, tensile properties and
fracture behavior of high temperature Al–Si–Mg–Cu cast alloys. Materials Science
and Engineering: A, 577, pp.64-72.
163
9- Jonathan, L., 2001. NASA 398 Material Properties Data Sheet. NASA-Marshall
Space Flight Center, Huntsville, AL.
10- Cole, G.S. and Sherman, A.M., 1995. Lightweight materials for automotive
applications. Materials Characterization, 35(1), pp.3-9.
11- Miller, W.S., Zhuang, L., Bottema, J., Wittebrood, A., De Smet, P., Haszler, A. and
Vieregge, A., 2000. Recent development in aluminium alloys for the automotive
industry. Materials Science and Engineering: A, 280(1), pp.37-49.
12- Palazzo, F., 1977. The Future of Aluminum in the Automotive Industry. Aluminio,
Vol. 46 (9), pp. 323-334.
13- Pardo, A., Merino, M.C., Coy, A.E., Arrabal, R., Viejo, F. and Matykina, E., 2008.
Corrosion behaviour of magnesium/aluminium alloys in 3.5 wt.% NaCl. Corrosion
Science, 50(3), pp.823-834.
14- Hatch, J.E., (1984) Aluminum: properties and physical metallurgy. ASM
International, pp. 134-424.
15- Garza-Elizondo, G.H., 2014. Ambient and High Temperature performance of Al-Si-
Cu-Mg Based Alloys. Seminar Report. University of Quebec at Chicoutimi, Nov.
2014.
16- Spada, A.T., 2002. In Search of Light-Weight Components: Automotive's Cast
Aluminum Conversion. Engineered Casting Solutions (USA), 4(2), pp.28-31.
17- Immarigeon, J.P., Holt, R.T., Koul, A.K., Zhao, L., Wallace, W. and Beddoes, J.C.,
1995. Lightweight materials for aircraft applications. Materials
Characterization, 35(1), pp.41-67.
18- Fridlyander, I.N., 2001. Aluminum alloys in aircraft in the periods of 1970–2000 and
2001–2015. Metal Science and Heat Treatment, 43(1), pp.6-10.
164
19- Kaufman, J.G. and Rooy, E.L., 2004. Aluminum alloy castings: properties,
processes, and applications. ASM International, Materials Park, OH.
20- Wang, T., Fu, H., Chen, Z., Xu, J., Zhu, J., Cao, F. and Li, T., 2012. A novel fading-
resistant Al–3Ti–3B grain refiner for Al–Si alloys. Journal of Alloys and
Compounds, 511(1), pp.45-49.
21- Lashgari, H.R., Zangeneh, S., Shahmir, H., Saghafi, M. and Emamy, M., 2010. Heat
treatment effect on the microstructure, tensile properties and dry sliding wear
behavior of A356–10% B4C cast composites. Materials & Design, 31(9), pp.4414-
4422.
22- Rana, R.S., Purohit, R. and Das, S., 2012. Reviews on the influences of alloying
elements on the microstructure and mechanical properties of aluminum alloys and
aluminum alloy composites. International Journal of Scientific and Research
Publications, 2(6), pp.1-7.
23- Lumley, R.N., O'Donnell, R.G., Gunasegaram, D.R., Kittel-Sherri, T., Gershenzon,
M., Yob, A.C. and Polmear, I.J., 2013. The role of alloy composition in the heat
treatment of aluminium high pressure die castings. Metallurgical Science and
Tecnology, 26(2).
24- Lee, J.A., 2003. Cast aluminum alloy for high temperature applications. 132nd TMS,
2-6 March 2003, San Diego, California.
25- Zeren, M., 2005. Effect of copper and silicon content on mechanical properties in
Al–Cu–Si–Mg alloys. Journal of Materials Processing Technology, 169(2), pp.292-
298.
26- Sjölander, E. and Seifeddine, S., 2010. The heat treatment of Al–Si–Cu–Mg casting
alloys. Journal of Materials Processing Technology, 210(10), pp.1249-1259.
165
27- Caceres, C.H., Svensson, I.L. and Taylor, J.A., 2003. Strength-ductility behaviour of
Al-Si-Cu-Mg casting alloys in T6 temper. International Journal of Cast Metals
Research, 15(5), pp.531-543.
28- Abhishek, S., 2008. Strength and fracture studies of as-cast Al-Si-Cu alloys, Thapar
University, India: Master of Technology in Materials Science and Engineering thesis.
29- Xiao, D.H., Wang, J.N., Ding, D.Y. and Chen, S.P., 2002. Effect of Cu content on
the mechanical properties of an Al–Cu–Mg–Ag alloy. Journal of alloys and
compounds, 343(1), pp.77-81.
30- Samuel, A.M., Gauthier, J. and Samuel, F.H., 1996. Microstructural aspects of the
dissolution and melting of Al2Cu phase in Al-Si alloys during solution heat
treatment. Metallurgical and Materials Transactions A, 27(7), pp.1785-1798.
31- Wang, P.S., Lee, S.L., Lin, J.C. and Jahn, M.T., 2000. Effects of solution
temperature on mechanical properties of 319.0 aluminum casting alloys containing
trace beryllium. Journal of Materials Research, 15(09), pp.2027-2035.
32- Reiso, O., Øverlie, H.G. and Ryum, N., 1990. Dissolution and melting of secondary
Al2Cu phase particles in an AlCu alloy. Metallurgical Transactions A, 21(6),
pp.1689-1695.
33- Askeland, D.R., 1996. The Science and Engineering of Materials: 3rd SI Edi.,
Chapman and Hall, London.
34- Smith, W.F., 1986. Principles of materials science and engineering, McGraw-Hill
Inc., York, PA.
35- Ringer, S.P. and Hono, K., 2000. Microstructural evolution and age hardening in
aluminium alloys: atom probe field-ion microscopy and transmission electron
microscopy studies. Materials Characterization, 44(1), pp.101-131.
166
36- Polmear, I.J., 1995. Metallurgy of the Light Metals. 3rd edition, Arnold Hodder
Headline PLC, London.
37- Dieter, Ellwood, G. and Bacon, D.J., 1986. Mechanical Metallurgy. Vol. 3, New
York, McGraw-Hill.
38- Molina, R., Amalberto, P. and Rosso, M., 2011. Mechanical characterization of
aluminium alloys for high temperature applications Part1: Al-Si-Cu
alloys. Metallurgical Science and Tecnology, 29(1), p.5.
39- Ammar, H.R., Moreau, C., Samuel, A.M., Samuel, F.H. and Doty, H.W., 2008.
Influences of alloying elements, solution treatment time and quenching media on
quality indices of 413-type Al–Si casting alloys. Materials Science and Engineering:
A, 489(1), pp.426-438.
40- Caceres, C.H., Davidson, C.J., Griffiths, J.R. and Wang, Q.G., 1999. The effect of
Mg on the microstructure and mechanical behavior of Al-Si-Mg casting
alloys. Metallurgical and Materials Transactions A, 30(10), pp.2611-2618.
41- Davis, J., 1999. Corrosion of Aluminum and Aluminum alloys. ASM International,
Ohio.
42- Tavitas-Medrano, F.J., Gruzleski, J.E., Samuel, F.H., Valtierra, S. and Doty, H.W.,
2008. Effect of Mg and Sr-modification on the mechanical properties of 319-type
aluminum cast alloys subjected to artificial aging. Materials Science and
Engineering: A, 480(1), pp.356-364.
43- Zhu, M., Jian, Z., Yang, G. and Zhou, Y., 2012. Effects of T6 heat treatment on the
microstructure, tensile properties, and fracture behavior of the modified A356
alloys. Materials & Design (1980-2015), 36, pp.243-249.
167
44- Mallapur, D.G., Udupa, K.R. and Kori, S.A., 2011. Studies on the influence of grain
refining and modification on microstructure and mechanical properties of forged
A356 alloy. Materials Science and Engineering: A, 528(13), pp.4747-4752.
45- Ceschini, L., Morri, A., Toschi, S. and Seifeddine, S., 2016. Room and high
temperature fatigue behaviour of the A354 and C355 (Al–Si–Cu–Mg) alloys: Role of
microstructure and heat treatment. Materials Science and Engineering: A, 653,
pp.129-138.
46- Baradarani, B. and Raiszadeh, R., 2011. Precipitation hardening of cast Zr-
containing A356 aluminium alloy. Materials & Design, 32(2), pp.935-940.
47- Lasa, L. and Rodriguez-Ibabe, J.M., 2004. Evolution of the main intermetallic phases
in Al-Si-Cu-Mg casting alloys during solution treatment. Journal of Materials
Science, 39(4), pp.1343-1355.
48- Han, Y., Samuel, A.M., Doty, H.W., Valtierra, S. and Samuel, F.H., 2014.
Optimizing the tensile properties of Al–Si–Cu–Mg 319-type alloys: role of solution
heat treatment. Materials & Design, 58, pp.426-438.
49- Kasprzak, W., Amirkhiz, B.S. and Niewczas, M., 2014. Structure and properties of
cast Al–Si based alloy with Zr–V–Ti additions and its evaluation of high temperature
performance. Journal of Alloys and Compounds, 595, pp.67-79.
50- Man, J., Jing, L. and Jie, S.G., 2007. The effects of Cu addition on the microstructure
and thermal stability of an Al–Mg–Si alloy. Journal of Alloys and
Compounds, 437(1), pp.146-150.
51- Murayama, M., Hono, K., Saga, M. and Kikuchi, M., 1998. Atom probe studies on
the early stages of precipitation in Al–Mg–Si alloys. Materials Science and
Engineering: A, 250(1), pp.127-132.
168
52- Zhen, L., Fei, W.D., Kang, S.B. and Kim, H.W., 1997. Precipitation behaviour of Al-
Mg-Si alloys with high silicon content. Journal of Materials Science, 32(7), pp.1895-
1902.
53- Miao, W.F. and Laughlin, D.E., 1999. Precipitation hardening in aluminum alloy
6022. Scripta Materialia, 40(7), pp.873-878.
54- Eskin, D.G., Decomposition of supersaturated solid solutions in Al–Cu–Mg–Si
alloys, Journal of Materials Science, 38 (2003) 279–290.
55- Son, S.K., Takeda, M., Mitome, M., Bando, Y. and Endo, T., 2005. Precipitation
behavior of an Al–Cu alloy during isothermal aging at low temperatures. Materials
Letters, 59(6), pp.629-632.
56- Wang, S.C., Starink, M.J. and Gao, N., 2006. Precipitation hardening in Al–Cu–Mg
alloys revisited. Scripta Materialia, 54(2), pp.287-291.
57- Ratchev, P., Verlinden, B., De Smet, P. and Van Houtte, P., 1998. Effect of cooling
rate and pre deformation on the precipitation hardening of an Al-4.2 wt.% Mg-0.6
wt.% Cu alloy. Scripta Materialia, 38(8), pp.1195-1201.
58- Chakrabarti, D.J. and Laughlin, D.E., 2004. Phase relations and precipitation in Al–
Mg–Si alloys with Cu additions. Progress in Materials Science, 49(3), pp.389-410.
59- Cayron, C. and Buffat, P.A., 2000. Transmission electron microscopy study of the β′
phase (Al–Mg–Si alloys) and QC phase (Al–Cu–Mg–Si alloys): ordering mechanism
and crystallographic structure. Acta Materialia, 48(10), pp.2639-2653.
60- Hernandez-Sandoval, J., Garza-Elizondo, G.H., Samuel, A.M., Valtiierra, S. and
Samuel, F.H., 2014. The ambient and high temperature deformation behavior of Al–
Si–Cu–Mg alloy with minor Ti, Zr, Ni additions. Materials & Design, 58, pp.89-101.

169
61- Elagin, V.I., 2007. Ways of developing high-strength and high-temperature structural
aluminum alloys in the 21st century. Metal Science and Heat Treatment, 49(9),
pp.427-434.
62- Tolley, A.J., Radmilovic, V. and Dahmen, U., 2004. On the effect of Zr on
precipitate evolution in Al-Sc-Zr alloys," in Congress CONAMET/SAM 2004
Proceedings, La Serena, Chile.
63- Wang, G., Bian, X., Wang, W. and Zhang, J., 2003. Influence of Cu and minor
elements on solution treatment of Al–Si–Cu–Mg cast alloys. Materials
Letters, 57(24), pp.4083-4087.
64- Belov, N.A., Eskin, D.G. and Avxentieva, N.N., 2005. Constituent phase diagrams of
the Al–Cu–Fe–Mg–Ni–Si system and their application to the analysis of aluminium
piston alloys. Acta Materialia, 53(17), pp.4709-4722.
65- Stadler, F., Antrekowitsch, H., Fragner, W., Kaufmann, H. and Uggowitzer, P.J.,
2011. The effect of Ni on the high-temperature strength of Al-Si cast alloys.
In Materials Science Forum (Vol. 690, pp. 274-277). Trans Tech Publications.
66- Cho, Y.H., Joo, D.H., Kim, C.H. and Lee, H.C., 2006. The effect of alloy addition on
the high temperature properties of over-aged Al-Si (CuNiMg) cast alloys.
In Materials Science Forum (Vol. 519, pp. 461-466). Trans Tech Publications,
Switzerland.
67- Seifeddine, S., Johansson, S. and Svensson, I.L., 2008. The influence of cooling rate
and manganese content on the β-Al 5 FeSi phase formation and mechanical
properties of Al–Si-based alloys. Materials Science and Engineering: A, 490(1),
pp.385-390.
170
68- Mohamed, A.M.A., Samuel, F.H., Samuel, A.M. and Doty, H.W., 2009. Influence of
additives on the impact toughness of Al–10.8% Si near-eutectic cast alloys. Materials
& Design, 30(10), pp.4218-4229.
69- Hwang, J.Y., Doty, H.W. and Kaufman, M.J., 2008. The effects of Mn additions on
the microstructure and mechanical properties of Al–Si–Cu casting alloys. Materials
Science and Engineering: A, 488(1), pp.496-504.
70- Davydov, V.G., Rostova, T.D., Zakharov, V.V., Filatov, Y.A. and Yelagin, V.I.,
2000. Scientific principles of making an alloying addition of scandium to aluminium
alloys. Materials Science and Engineering: A, 280(1), pp.30-36.
71- Marquis, E.A. and Seidman, D.N., 2001. Nanoscale structural evolution of Al 3 Sc
precipitates in Al (Sc) alloys. Acta Materialia, 49(11), pp.1909-1919.
72- Krug, M.E., 2011. Microstructural Evolution and Mechanical Properties in Al-Sc
Alloys with Li and Rare Earth Additions (Doctoral dissertation, Northwestern
University).
73- Van Dalen, M.E., Seidman, D.N. and Dunand, D.C., 2008. Creep-and coarsening
properties of Al–0.06 at.% Sc–0.06 at.% Ti at 300–450° C. Acta Materialia, 56(16),
pp.4369-4377.
74- Fuller, C.B., Seidman, D.N. and Dunand, D.C., 1999. Creep properties of coarse-
grained Al (Sc) alloys at 300° C. Scripta Materialia, 40(6), pp.691-696.
75- Seidman, D.N., Marquis, E.A. and Dunand, D.C., 2002. Precipitation strengthening
at ambient and elevated temperatures of heat-treatable Al (Sc) alloys. Acta
Materialia, 50(16), pp.4021-4035.
171
76- Prukkanon, W., Srisukhumbowornchai, N. and Limmaneevichitr, C., 2009.
Modification of hypoeutectic Al–Si alloys with scandium. Journal of Alloys and
Compounds, 477(1), pp.454-460.
77- Kendig, K.L. and Miracle, D.B., 2002. Strengthening mechanisms of an Al-Mg-Sc-
Zr alloy. Acta Materialia, 50(16), pp.4165-4175.
78- Marquis, E.A., Seidman, D.N. and Dunand, D.C., 2003. Effect of Mg addition on the
creep and yield behavior of an Al–Sc alloy. Acta Materialia, 51(16), pp.4751-4760.
79- Knipling, K.E., Seidman, D.N. and Dunand, D.C., 2011. Ambient-and high-
temperature mechanical properties of isochronally aged Al–0.06 Sc, Al–0.06 Zr and
Al–0.06 Sc–0.06 Zr (at.%) alloys. Acta Materialia, 59(3), pp.943-954.
80- Harada, Y. and Dunand, D.C., 2002. Microstructure of Al 3Sc with ternary transition-
metal additions. Materials Science and Engineering: A, 329, pp.686-695.
81- Fuller, C.B., Seidman, D.N. and Dunand, D.C., 2003. Mechanical properties of Al
(Sc, Zr) alloys at ambient and elevated temperatures. Acta Materialia, 51(16),
pp.4803-4814.
82- Van Dalen, M.E., Dunand, D.C. and Seidman, D.N., 2005. Effects of Ti additions on
the nanostructure and creep properties of precipitation-strengthened Al–Sc
alloys. Acta Materialia, 53(15), pp.4225-4235.
83- Kaiser, M.S. and Kurny, A.S.W., 2011. Effect of scandium on the grain refining and
ageing behaviour of cast Al-Si-Mg alloy. Iranian Journal of Materials Science &
Engineering, 8(4), pp.1-8.
84- Prukkanon, W., Srisukhumbowornchai, N. and Limmaneevichitr, C., 2009. Influence
of Sc modification on the fluidity of an A356 aluminum alloy. Journal of Alloys and
Compounds, 487(1), pp.453-457.
172
85- Riddle, Y.W. and Sanders, T.H., 2004. A study of coarsening, recrystallization, and
morphology of microstructure in Al-Sc-(Zr)-(Mg) alloys. Metallurgical and Materials
Transactions A, 35(1), pp.341-350.
86- Ocenasek, V. and Slamova, M., 2001. Resistance to recrystallization due to Sc and
Zr addition to Al–Mg alloys. Materials Characterization, 47(2), pp.157-162.
87- Røyset, J. and Ryum, N., 2005. Scandium in aluminium alloys. International
Materials Reviews, 50(1), pp.19-44.
88- Norman, A.F., Prangnell, P.B. and McEwen, R.S., 1998. The solidification behaviour
of dilute aluminium–scandium alloys. Acta Materialia, 46(16), pp.5715-5732.
89- Hegde, S. and Prabhu, K.N., 2008. Modification of eutectic silicon in Al–Si
alloys. Journal of Materials Science, 43(9), pp.3009-3027.
90- Closset, B. and Gruzleski, J.E., 1982. Structure and properties of hypoeutectic Al-Si-
Mg alloys modified with pure strontium. Metallurgical Transactions A, 13(6),
pp.945-951.
91- Merlin, M. and Garagnani, G.L., 2013. Mechanical and microstructural
characterisation of A356 castings realised with full and empty cores. Metallurgical
Science and Tecnology, 27(1), pp.21-30.
92- Zeren, M. and Karakulak, E., 2008. Influence of Ti addition on the microstructure
and hardness properties of near-eutectic Al–Si alloys. Journal of Alloys and
Compounds, 450(1), pp.255-259.
93- Sigworth, G.K. and Kuhn, T.A., 2007. Grain refinement of aluminum casting
alloys. International Journal of Metal Casting, American Foundry Society,
Schaumburg, IL USA, 1(1), pp.31-40.
173
94- Ammar, H.R., 2010. Influence of Metallurgical Parameters on the Mechanical
Properties and Quality Indices of Al-Si-Cu-Mg and Al-Si-Mg Casting Alloys.
Thesis. University of Quebec at Chicoutimi.
95- El Sebaie, O., Samuel, A.M., Samuel, F.H. and Doty, H.W., 2008. The effects of
mischmetal, cooling rate and heat treatment on the eutectic Si particle characteristics
of A319. 1, A356. 2 and A413. 1 Al–Si casting alloys. Materials Science and
Engineering: A, 480(1), pp.342-355.
96- Lasa, L. and Rodriguez-Ibabe, J.M., 2002. Characterization of the dissolution of the
Al 2Cu phase in two Al–Si–Cu–Mg casting alloys using calorimetry. Materials
Characterization, 48(5), pp.371-378.
97- Mohamed, A.M.A. and Samuel, F.H., 2012. A review on the heat treatment of Al-Si-
Cu/Mg casting alloys. Heat Treatment, Rijeka, Croatia, InTech Science, pp.229-246.
98- Shuey, R. and Tiryakioglu, M., 2010. Quenching of aluminium alloys. Quenching
Theory and Technology, pp.43-83.
99- Chen, S.Y., Chen, K.H., Peng, G.S., Liang, X. and Chen, X.H., 2012. Effect of
quenching rate on microstructure and stress corrosion cracking of 7085 aluminum
alloy. Transactions of Nonferrous Metals Society of China, 22(1), pp.47-52.
100- Cuniberti, A., Tolley, A., Riglos, M.C. and Giovachini, R., 2010. Influence of natural
aging on the precipitation hardening of an AlMgSi alloy. Materials Science and
Engineering: A, 527(20), pp.5307-5311.
101- Wang, Q. and Jones, P.E., GM Global Technology Operations LLC, 2012. Artificial
aging process for aluminum alloys. U.S. Patent 8,323,425
174
102- Wang, R.Y., Lu, W.H. and Hogan, L.M., 1999. Growth morphology of primary
silicon in cast Al–Si alloys and the mechanism of concentric growth. Journal of
Crystal Growth, 207(1), pp.43-54.
103- Dahle, A.K., Nogita, K., McDonald, S.D., Dinnis, C. and Lu, L., 2005. Eutectic
modification and microstructure development in Al–Si Alloys. Materials Science and
Engineering: A, 413, pp.243-248.
104- Mohamed, A.M.A. and Samuel, F.H., 2012. Influence of Mg and solution heat
treatment on the occurrence of incipient melting in Al–Si–Cu–Mg cast
alloys. Materials Science and Engineering: A, 543, pp.22-34.
105- Asghar, Z., Requena, G., Degischer, H.P. and Cloetens, P., 2009. Three-dimensional
study of Ni aluminides in an AlSi12 alloy by means of light optical and synchrotron
microtomography. Acta Materialia, 57(14), pp.4125-4132.
106- Asghar, Z., Requena, G. and Kubel, F., 2010. The role of Ni and Fe aluminides on
the elevated temperature strength of an AlSi12 alloy. Materials Science and
Engineering: A, 527(21), pp.5691-5698.
107- Stadler, F., Antrekowitsch, H., Fragner, W., Kaufmann, H. and Uggowitzer, P.J.,
2012. Effect of main alloying elements on strength of Al–Si foundry alloys at
elevated temperatures. International Journal of Cast Metals Research, 25(4), pp.215-
224.
108- Hamasha, M.M., Mayyas, A.T., Hassan, A.M. and Hayajneh, M.T., 2012. The effect
of time, percent of copper and nickel on naturally aged Al-Cu-Ni cast alloys. Journal
of Minerals and Materials Characterization and Engineering, 11(02), p.117.
175
109- Ouellet, P. and Samuel, F.H., 1999. Effect of Mg on the ageing behaviour of Al-Si-
Cu 319 type aluminium casting alloys. Journal of Materials Science, 34(19),
pp.4671-4697.
110- Mahmudi, R., Sepehrband, P. and Ghasemi, H.M., 2006. Improved properties of
A319 aluminum casting alloy modified with Zr. Materials Letters, 60(21), pp.2606-
2610.
111- https://commons.wikimedia.org/wiki/File:Brittle_v_ductile_stress
strain_behaviour.png
112- Hurtalová, L., Tillová, E. and Chalupová, M., 2013. Influence of intermetallic phases
on the fracture surfaces in secondary aluminum cast alloy," In Acta Metallurgica
Slovaca-Conference, Vol. 3, pp. 65-74.
113- Wang, Q.G., 2003. Microstructural effects on the tensile and fracture behavior of
aluminum casting alloys A356/357. Metallurgical and Materials Transactions
A, 34(12), pp.2887-2899.
114- Van der Voort, G.F., 1987. Visual Examination and Light Microscopy. Metals
Handbook, 9th Edition, Vol. 12: Fractography, American Society for Metals, Metals
Park, OH, pp. 91-165.
115- Drouzy, M., Jacob, S. and Richard, M., 1980. Interpretation of tensile results by
means of quality index and probable yield strength-application to Al-Si7 Mg foundry
alloys-France. International Cast Metals Journal 5.2, pp 43-50.
116- Caceres, C.H. and Taylor, J.A., 2005. Enhanced ductility in Al-Si-Cu-Mg foundry
alloys with high Si content. TMS Annual Meeting, pp. 245-254.
176
117- Westengen, H. and Holta, O., 1988. Low Pressure Permanent Mold Casting of
Magnesium-Recent Developments (No. 880509). SAE Technical Paper.
118- Samuel, A.M. and Samuel, F.H., 1995. Relevance of the use of the quality index
concept in cast SiCP-reinforced Al-Si-Mg composites. Journal of Materials
Science, 30(3), pp.568-572.
119- Caceres, C.H., Din, T., Rashid, A.K. and Campbell, J., 1999. Effect of aging on
quality index of an Al–Cu casting alloy. Materials Science and Technology, 15(6),
pp.711-716.
120- Mohamed, A.M.A., April 2008. Effect of Additives on the Microstructure and
Mechanical properties of Aluminum-Silicon Alloys. PhD Thesis, Université du
Québec à Chicoutimi, Quebec, Canada, pp. 31-34.
121- Backerud, L., Chai, G. and Tamminen, J., 1990. Solidification characteristics of
aluminum alloys. Vol. 2. Foundry alloys. American Foundrymen's Society, Inc.,
1990, pp. 266.
122- Garza-Elizondo, G.H., 2016. Effect of Ni, Mn, Zr and Sc additions on the
performance of Al-Si-Cu-Mg alloys. PhD, Thesis, Université du Québec à
Chicoutimi, Chicoutimi, Quebec, Canada.
123- F.H. Samuel, A.M. Samuel and H.W. Doty, 1996. Factors controlling the type and
morphology of Cu-containing phases in 319 Al alloys. AFS Transactions, Vol.104,
pp. 893-901.
124- Nabawy, A.M., 2010. Influence of Zirconium and Scandium on the Microstructure,
Tensile Properties, and Hot-Tearing Susceptibility of Al-2wt%Cu-Based Alloys.
PhD, Thesis, Université du Québec à Chicoutimi, Chicoutimi, Quebec, Canada.
177
125- Srinivasan, D. and Chattopadhyay, K., 2005. Non-equilibrium Transformations
Involving, L12-Al 3Zr in Ternary Al-X-Zr Alloys. Metallurgical and Materials
Transactions A, Vol. 36A, 2005, pp. 311-320.
126- Yu, K., Li, W., Li, S. and Zhao, J., 2004. Mechanical properties and microstructure
of aluminum alloy 2618 with Al 3 (Sc, Zr) phases. Materials Science and
Engineering: A, 368(1), pp.88-93.
127- Zeng, F., Xia, C. and Gu, Y., 2004. The 430°C Isothermal Section of the Al-4Mg-Sc-
Zr Quaternary System in the Al-rich Range. Journal of Alloys and Compounds, Vol.
363, pp.175-181.
128- De la Sablonnière, H. and Samuel, F.H., 1996. Solution heat treatment of 319
aluminum alloy containing ~0.5wt%Mg. Part2—microstructure and
fractography. International Journal of Cast Metals Research, 9(4), pp.213-225.
129- El Sebaie, O., Samuel, A.M., Samuel, F.H. and Doty, H.W., 2014. Impact toughness
of Al–Si–Cu–Mg–Fe cast alloys: effects of minor additives and aging conditions.
Materials & Design, 60, pp.496-509.
130- Northwood, D., Sun, X., Byczynski, G., Sokolowski, J.H., 1995. The development of
a two-stage solution heat treatment for cast Al-Si-Cu alloys. IMMA ADCA
conference proceedings, Vol. 4, 1995, pp. 15-19.
131- Sokolowski, J.H., Sun, X.C. and Esseltine, A., 1995. The removal of copper-phase
segregation and the subsequent improvement in mechanical properties of cast 319
aluminium alloys by a two-stage solution heat treatment. Journal of Materials
Processing Technology, Vol. 53, no. 1, pp. 385-392.
178
132- Alexopoulos, N. and Pantelakis, S., 2004. A New Quality Index for Characterizing
Aluminum Cast Alloys with Regard to Aircraft Structure Design Requirements.
Metallurgical and Materials Transactions A, Vol. 35A, pp. 301-308.
133- Lee, Jonathan A., and Po Shou Chen, 2003. High strength and wear resistant
aluminum alloy for high temperature applications. 5th Conference on Aerospace
Materials, Processes, and Environmental Technology, Huntsville, AL.
134- Dong-Woo Suh, Sang-Yong Lee, Kyong-Hwan Lee, Su-Keun Lim and Kyu Hwan
Oh, 2004. Microstructural evolution of Al–Zn–Mg–Cu–(Sc) alloy during hot
extrusion and heat treatments. Journal of Materials Processing Technology, Vols.
155-156, pp. 1330-1336.