Développement de la climatisation en Europe et …compressor) and a splitting in 3 or 4 units of...
81
Jérôme Adnot, Matthieu Orphelin et Philippe Rivière, Ecole des Mines, à partir des résultats de divers groupes de travail " Développement de la climatisation en Europe et impacts sur le réseau électrique” 1-Etudes menées par Ademe et EDF sur une alternative à la ligne Boutre-Carros Région, Départements, Ademe, EDF, RTE, Inestene 2-EERAC Energy Efficiency of Room Air Conditioners 3-EECCAC Energy Efficiency and Certification of Central Air Conditioners Financement et suivi DGTREN (UE)
Transcript of Développement de la climatisation en Europe et …compressor) and a splitting in 3 or 4 units of...
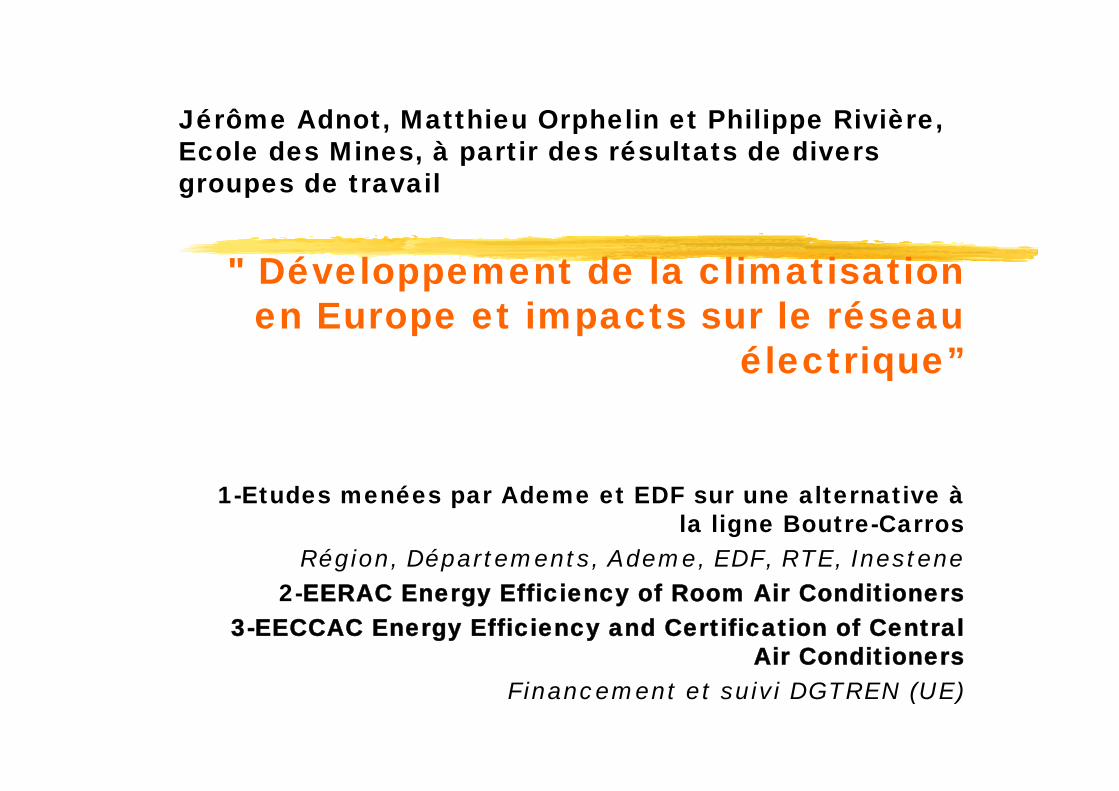
Jérôme Adnot, Matthieu Orphelin et Philippe Rivière, Ecole des Mines, à partir des résultats de divers groupes de travail
" Développement de la climatisationen Europe et impacts sur le réseau
électrique”
1-Etudes menées par Ademe et EDF sur une alternative àla ligne Boutre-Carros
Région, Départements, Ademe, EDF, RTE, Inestene2-EERAC Energy Efficiency of Room Air Conditioners
3-EECCAC Energy Efficiency and Certification of Central Air Conditioners
Financement et suivi DGTREN (UE)
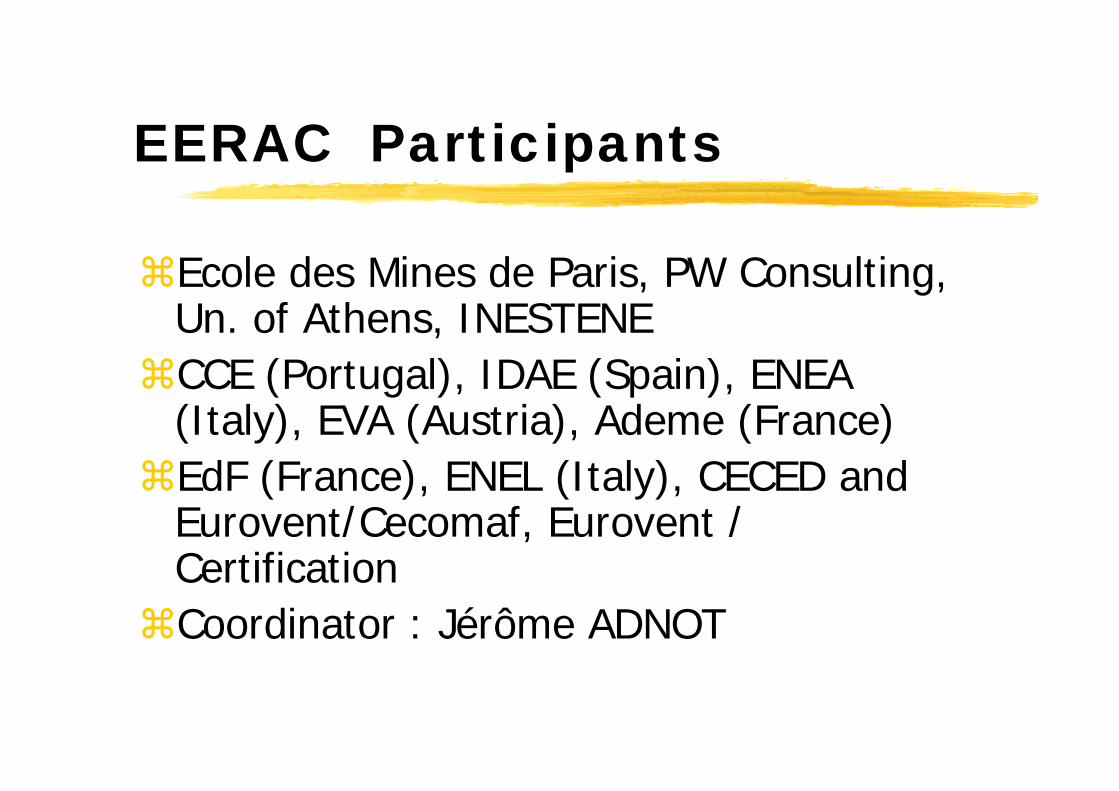
EERAC Participants
Ecole des Mines de Paris, PW Consulting, Un. of Athens, INESTENECCE (Portugal), IDAE (Spain), ENEA (Italy), EVA (Austria), Ademe (France)EdF (France), ENEL (Italy), CECED and Eurovent/Cecomaf, Eurovent / CertificationCoordinator : Jérôme ADNOT
EECCAC Participants
Armines, Un. of Athens Poltecnico diMILANO Inestene now “Energies Demain”
AICIA, U.Seville AQEEB-UCBucharest BREEurovent Cecomaf and Certification ,
AICARR IDAE CCE now ADENE EVA EDF Electricité de France
Coordinator : Jérôme ADNOT
DEUX RAPPORTS DGTREN
DEFINITIONS AND BASIC DATA FOR CENTRAL AND SELF STANDING SYSTEMSFIGURES FOR AIR-CONDITIONING IN EUROPETECHNICAL AND ECONOMIC EVALUATION OF THE ELEMENTARY EQUIPMENT USEDOPTIMISATION OF SYSTEMS INCLUDING PART LOAD AND SECONDARY SYSTEMSEFFICIENCY RATING AT PART LOADENERGY AND ENVIRONMENTAL BENEFITS: HIGHER EFFICIENCY SCENARIOS
Structure de l’exposé
Quelques chiffresUn marché de produits sans aucun règlementUn marché de conception, presque sans règlementProblèmes induits sur le réseau électrique, principalement à venir
Quelques chiffres
Nota bene : on ne discute jamais ici les raisons du choix clim/non clim; on
le constate et on le modélise
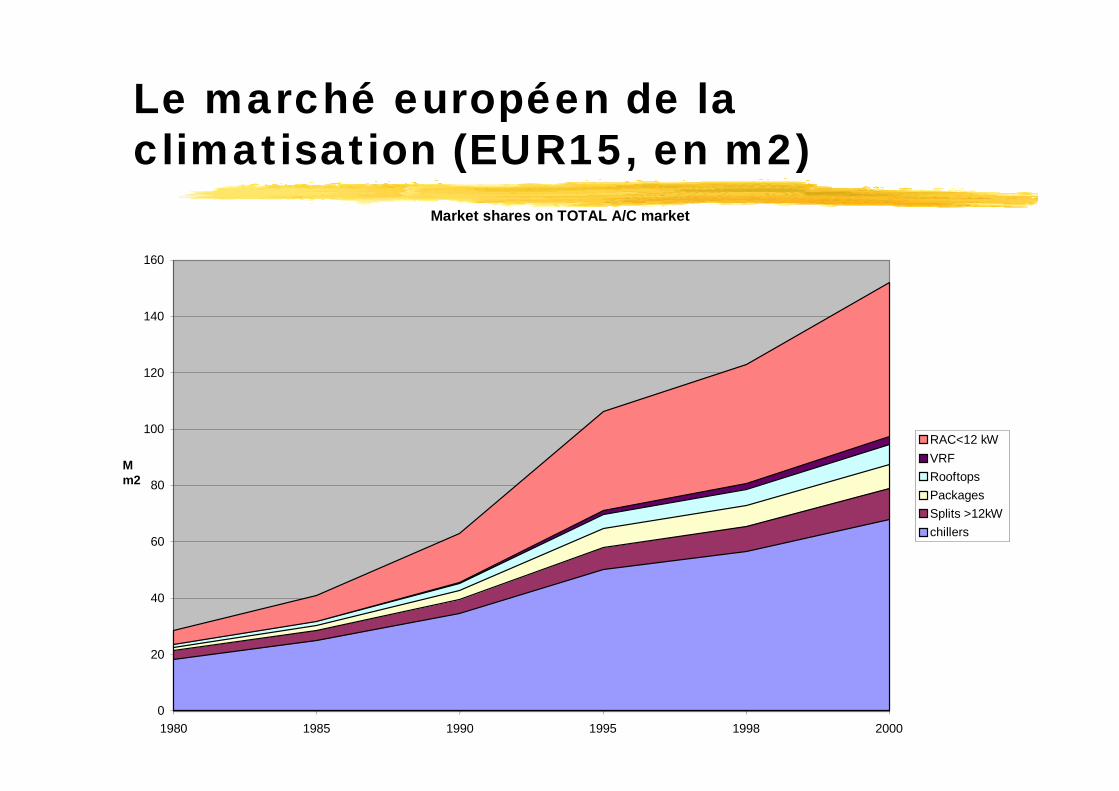
Le marché européen de la climatisation (EUR15, en m2)
Market shares on TOTAL A/C market
0
20
40
60
80
100
120
140
160
1980 1985 1990 1995 1998 2000
Mm2
RAC<12 kWVRFRooftopsPackagesSplits >12kWchillers
PROJECTIONS A 2010 ET 2020 (BAU)
From markets to stock (regressive model)from stock to consumption (DOE2 simulations and climatic extrapolationthrough CDD regression)a different consumption (kWh/m2) foreach country and each systemGWh, tCO2, etc by country/year
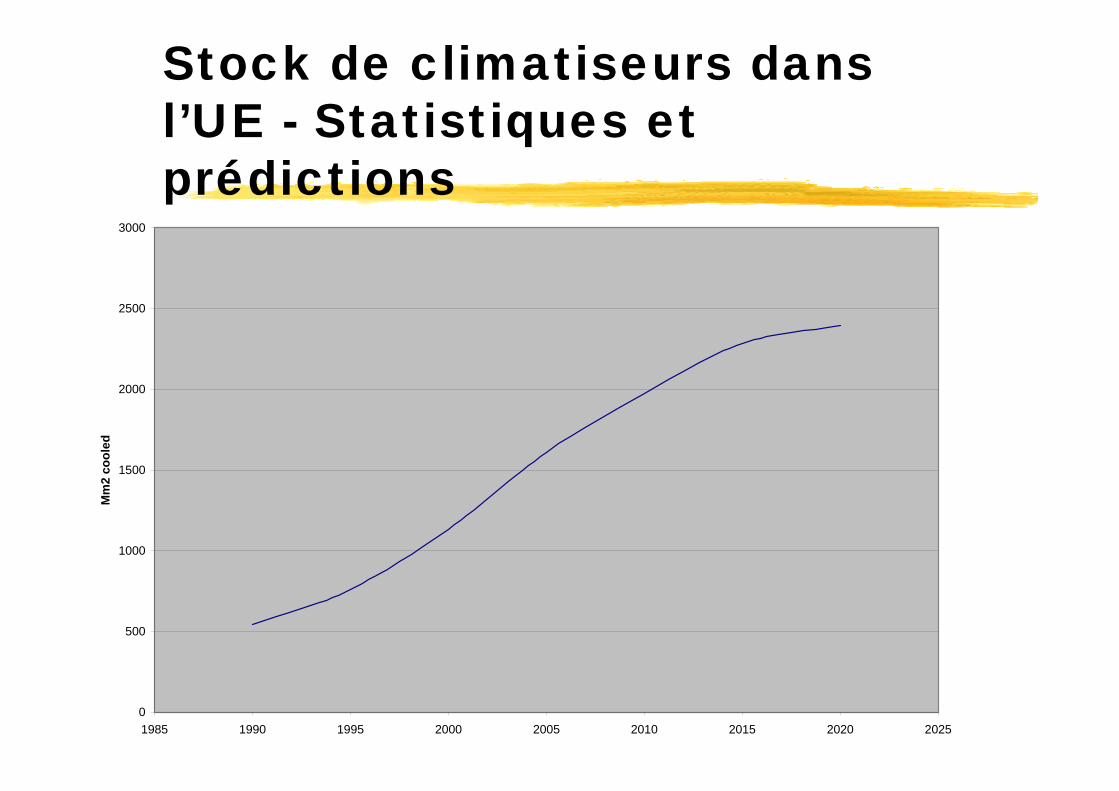
Stock de climatiseurs dans l’UE - Statistiques et prédictions
0
500
1000
1500
2000
2500
3000
1985 1990 1995 2000 2005 2010 2015 2020 2025
Mm
2 co
oled
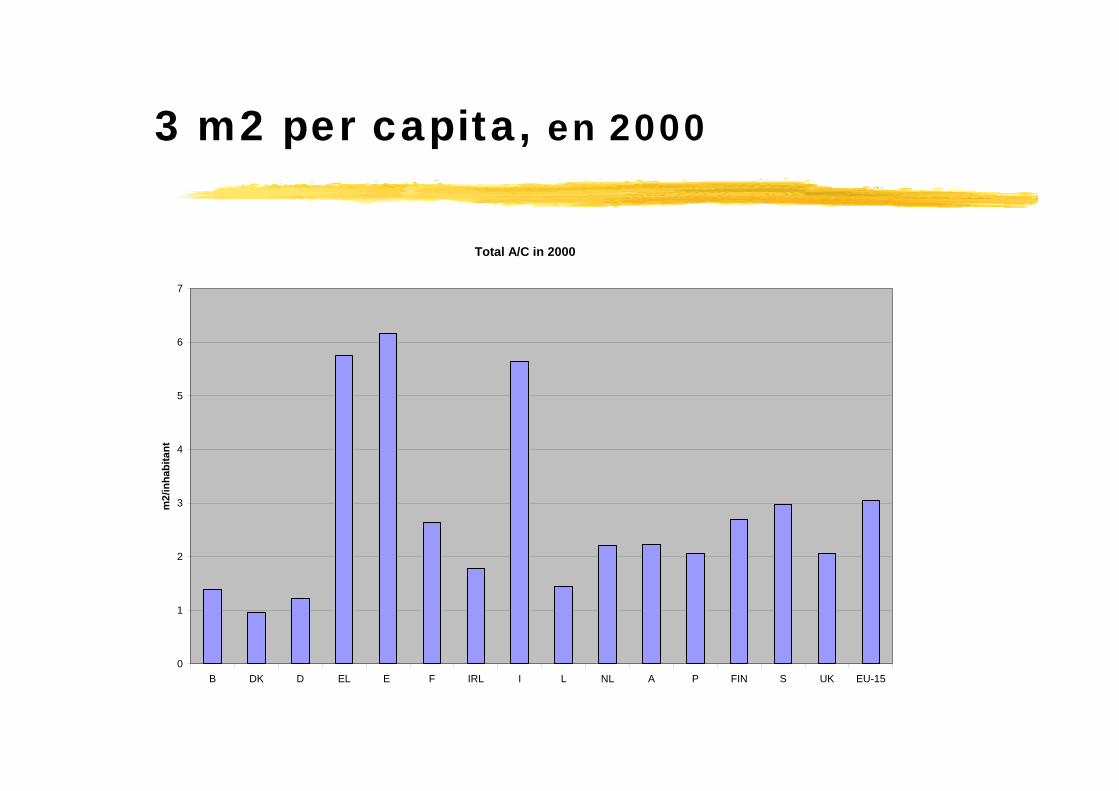
3 m2 per capita, en 2000
Total A/C in 2000
0
1
2
3
4
5
6
7
B DK D EL E F IRL I L NL A P FIN S UK EU-15
m2/
inha
bita
nt
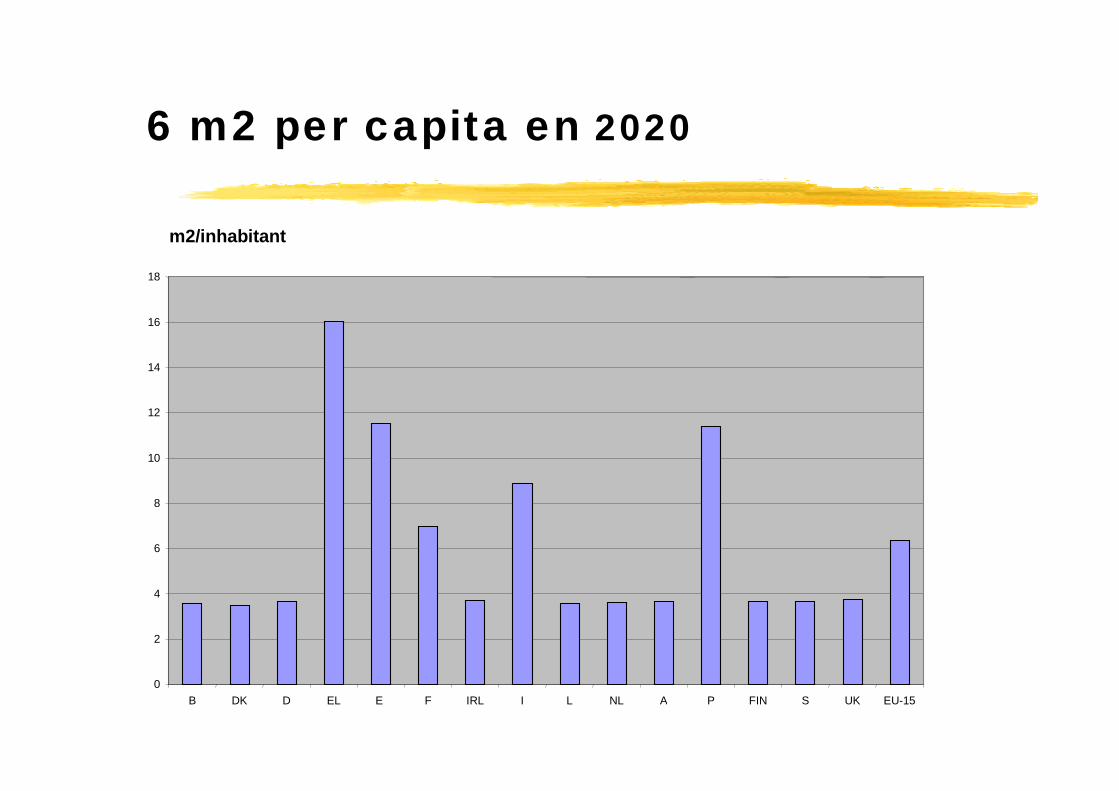
6 m2 per capita en 2020
m2/inhabitant
0
2
4
6
8
10
12
14
16
18
B DK D EL E F IRL I L NL A P FIN S UK EU-15
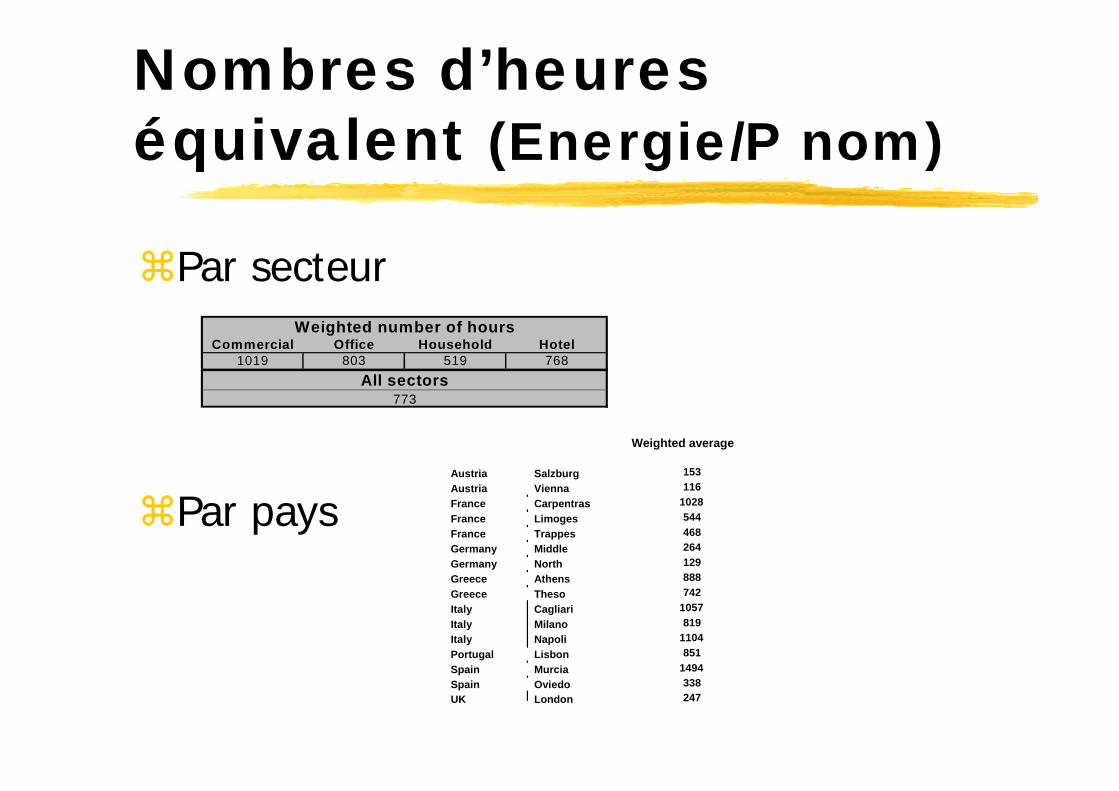
Nombres d’heures équivalent (Energie/P nom)
Par secteur
Par pays
Commercial Office Household Hotel1019 803 519 768
Weighted number of hours
773All sectors
Austria SalzburgAustria ViennaFrance CarpentrasFrance LimogesFrance TrappesGermany MiddleGermany NorthGreece AthensGreece ThesoItaly CagliariItaly MilanoItaly NapoliPortugal LisbonSpain MurciaSpain OviedoUK London
153116
1028544468264129888742
1057819
1104851
1494338247
Weighted average
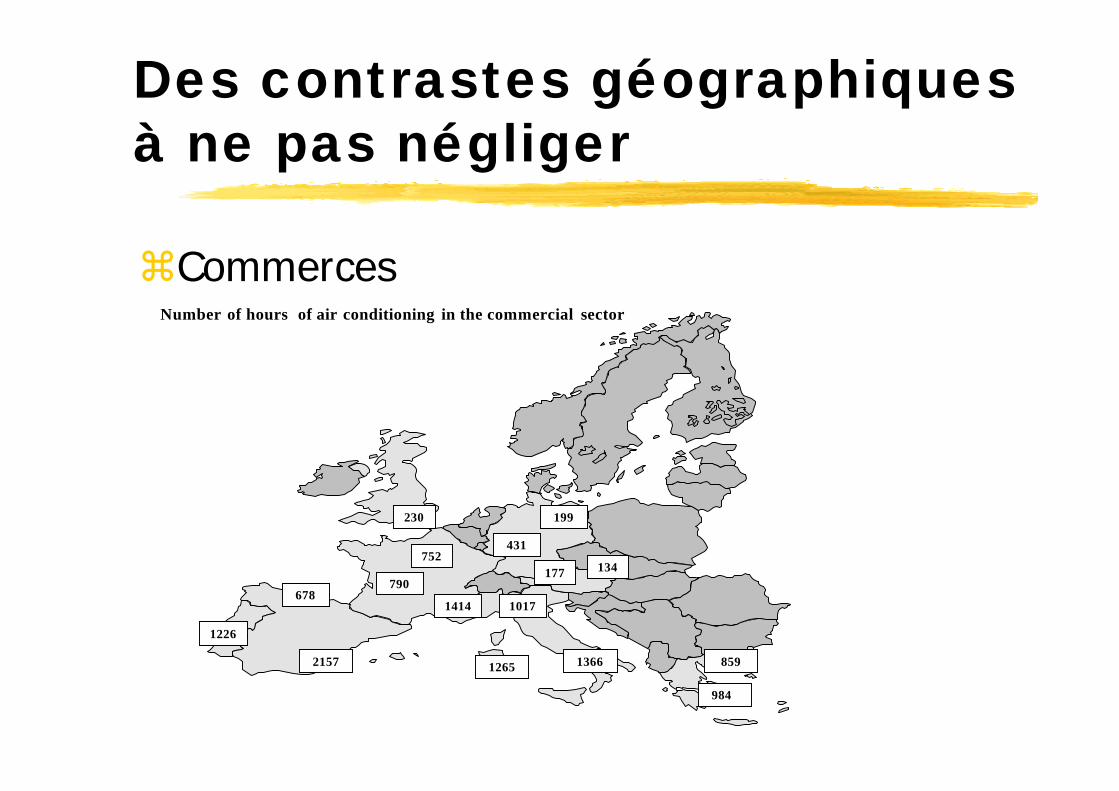
Des contrastes géographiques à ne pas négliger
CommercesNumber of hours of air conditioning in the commercial sector
752
199
431
1017
1366
984
85912652157
678
1226
790
1414
230
177 134
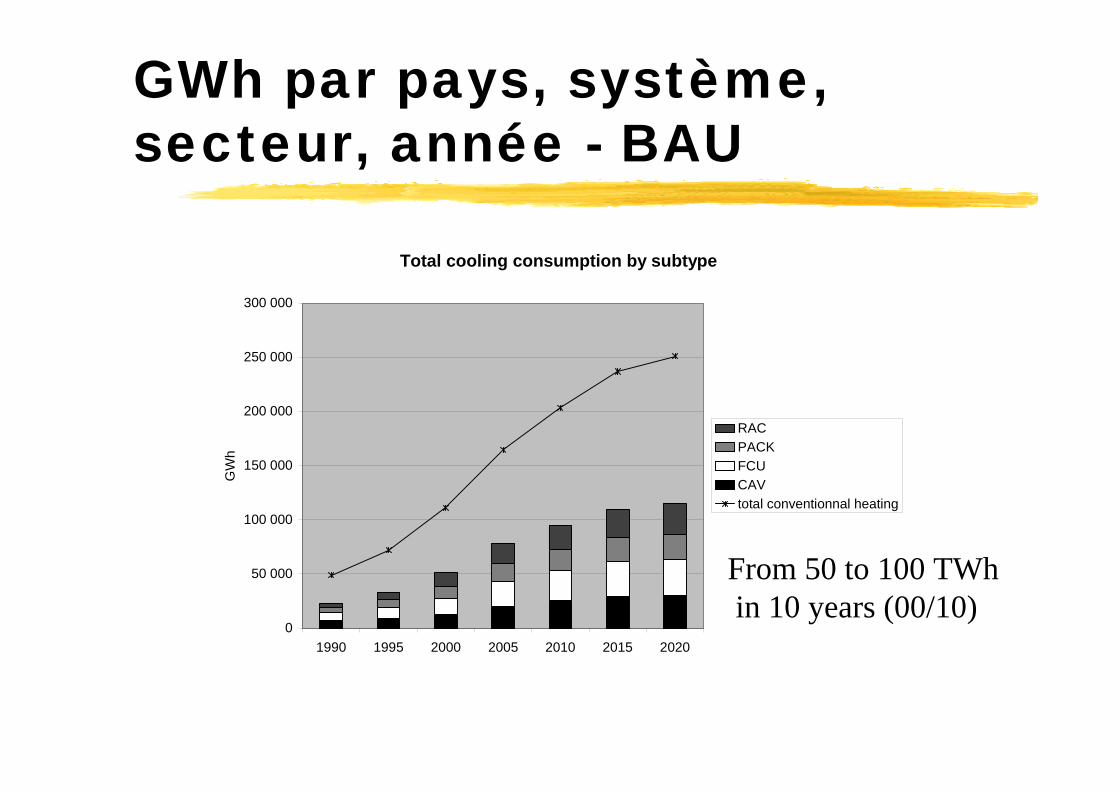
GWh par pays, système, secteur, année - BAU
Total cooling consumption by subtype
0
50 000
100 000
150 000
200 000
250 000
300 000
1990 1995 2000 2005 2010 2015 2020
GW
h
RACPACKFCUCAVtotal conventionnal heating
From 50 to 100 TWhin 10 years (00/10)
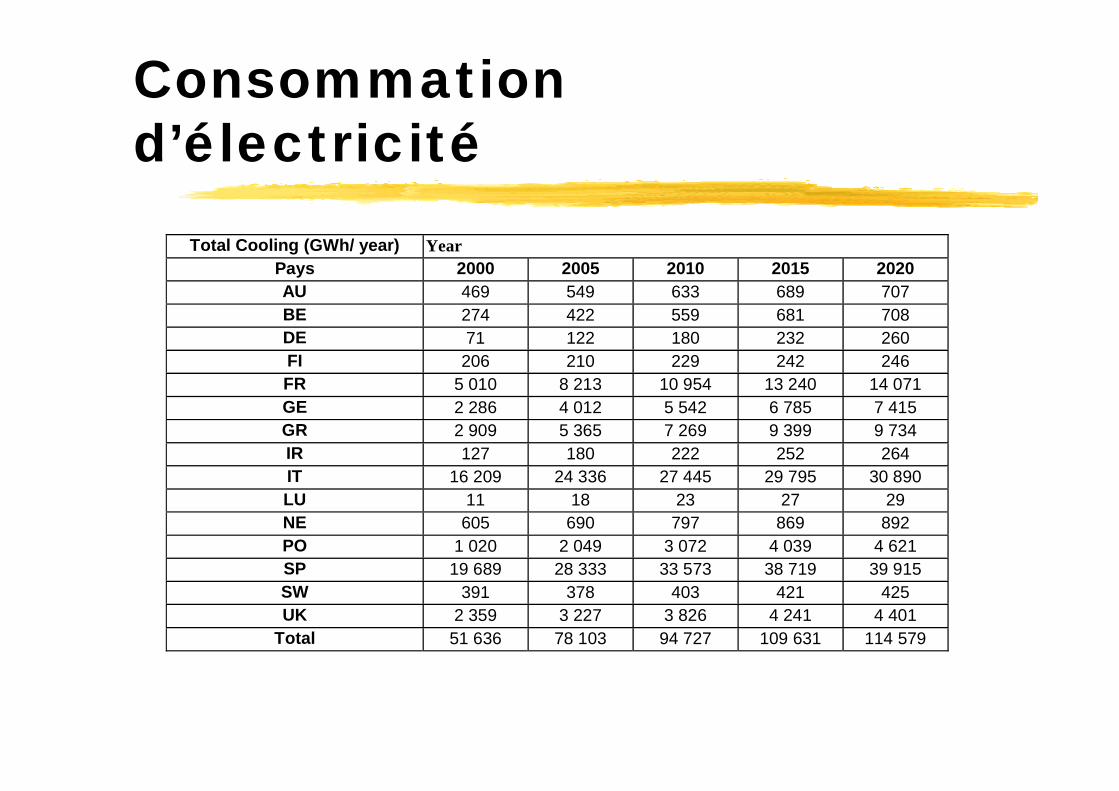
Consommation d’électricité
Total Cooling (GWh/ year) Year Pays 2000 2005 2010 2015 2020 AU 469 549 633 689 707 BE 274 422 559 681 708 DE 71 122 180 232 260 FI 206 210 229 242 246 FR 5 010 8 213 10 954 13 240 14 071 GE 2 286 4 012 5 542 6 785 7 415 GR 2 909 5 365 7 269 9 399 9 734 IR 127 180 222 252 264 IT 16 209 24 336 27 445 29 795 30 890 LU 11 18 23 27 29 NE 605 690 797 869 892 PO 1 020 2 049 3 072 4 039 4 621 SP 19 689 28 333 33 573 38 719 39 915 SW 391 378 403 421 425 UK 2 359 3 227 3 826 4 241 4 401
Total 51 636 78 103 94 727 109 631 114 579
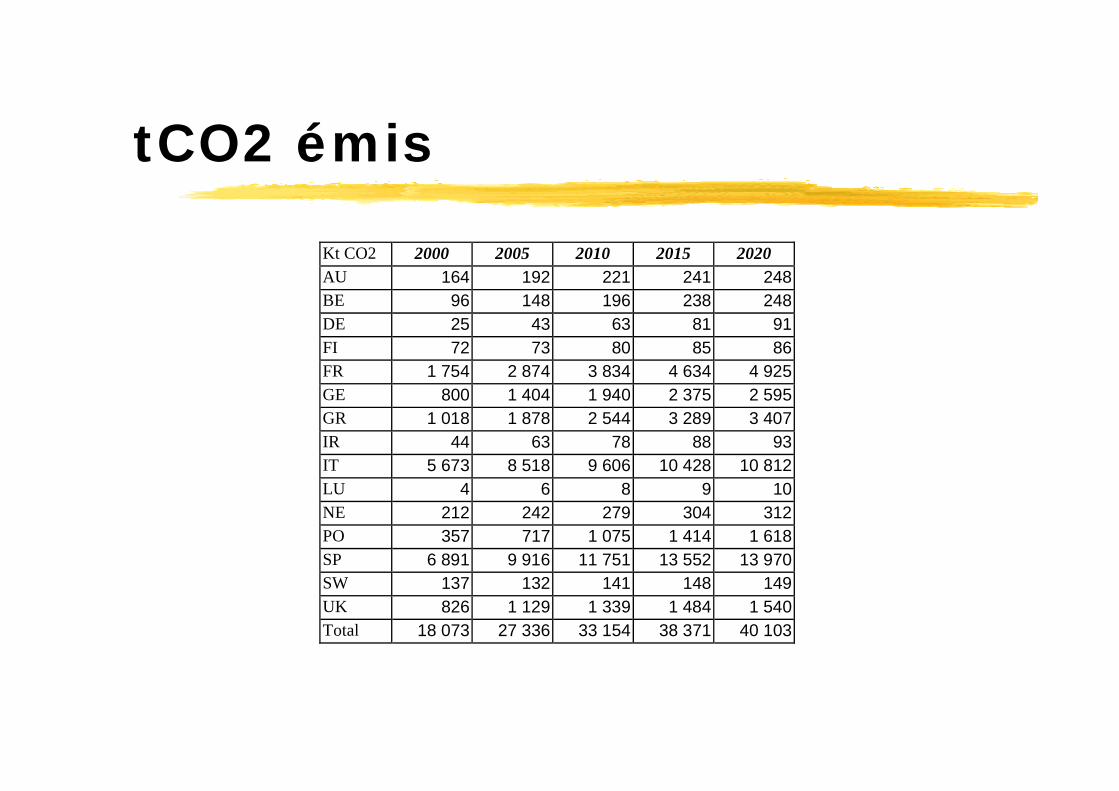
tCO2 émis
Kt CO2 2000 2005 2010 2015 2020AU 164 192 221 241 248BE 96 148 196 238 248DE 25 43 63 81 91FI 72 73 80 85 86FR 1 754 2 874 3 834 4 634 4 925GE 800 1 404 1 940 2 375 2 595GR 1 018 1 878 2 544 3 289 3 407IR 44 63 78 88 93IT 5 673 8 518 9 606 10 428 10 812LU 4 6 8 9 10NE 212 242 279 304 312PO 357 717 1 075 1 414 1 618SP 6 891 9 916 11 751 13 552 13 970SW 137 132 141 148 149UK 826 1 129 1 339 1 484 1 540Total 18 073 27 336 33 154 38 371 40 103
Un marché de produits sans aucun règlement
On s’intéresse à l’efficacité énergétique : comment assurer la fonction demandée avec
moins d’énergie et « plus d’équipement »
Définitions techniques 18
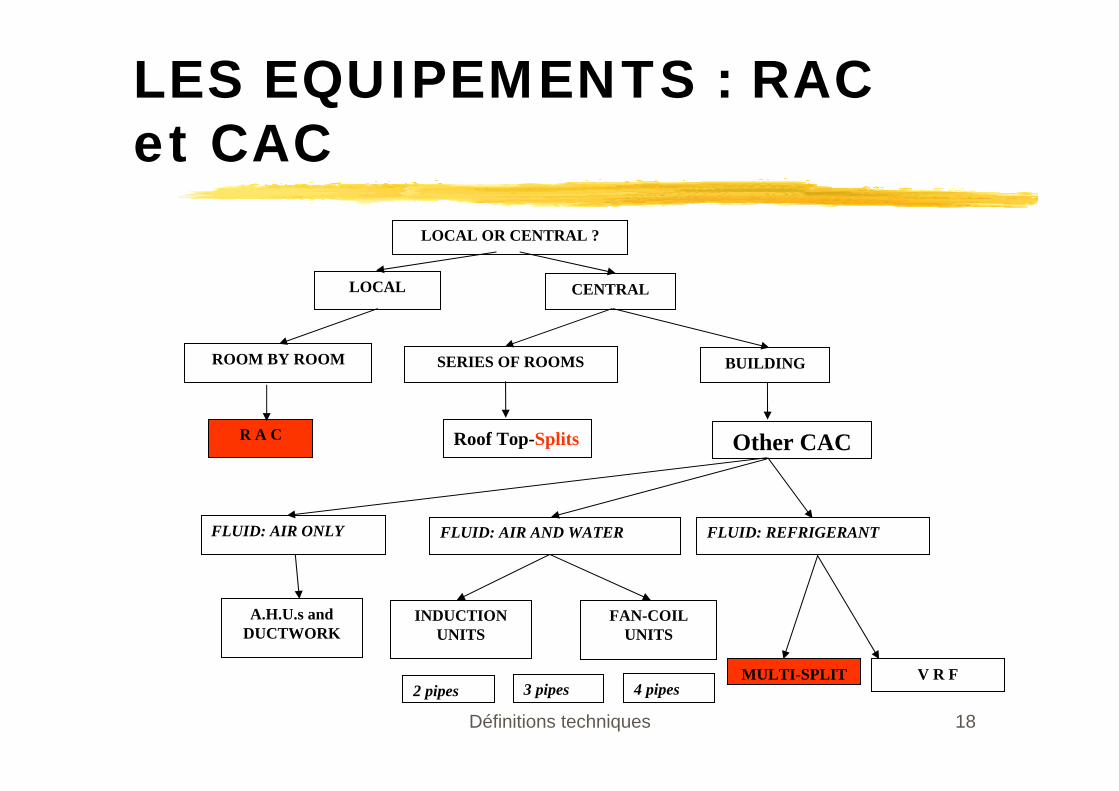
LES EQUIPEMENTS : RAC et CAC
LOCAL OR CENTRAL ?
LOCAL CENTRAL
ROOM BY ROOM
Roof Top-Splits
SERIES OF ROOMS BUILDING
R A C Other CAC
FLUID: AIR ONLY FLUID: AIR AND WATER FLUID: REFRIGERANT
A.H.U.s andDUCTWORK
INDUCTION UNITS
FAN-COIL UNITS
2 pipes 3 pipes 4 pipesMULTI-SPLIT V R F
Définitions techniques 19
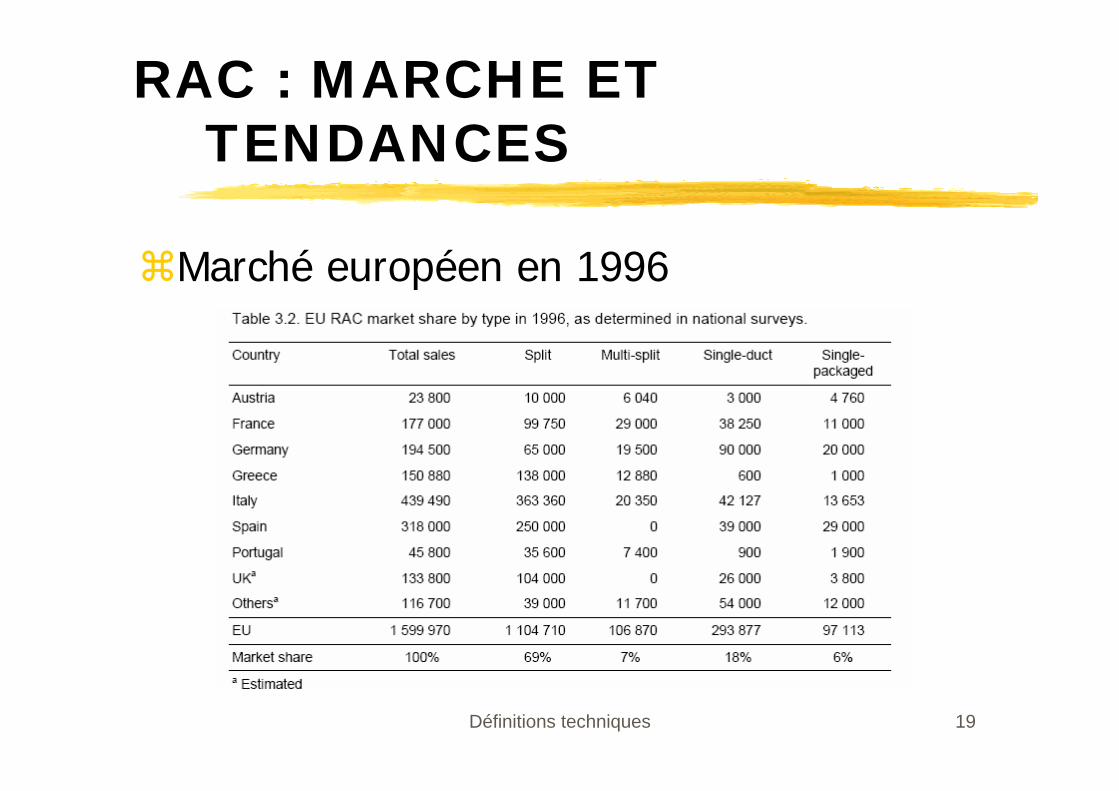
RAC : MARCHE ET TENDANCES
Marché européen en 1996
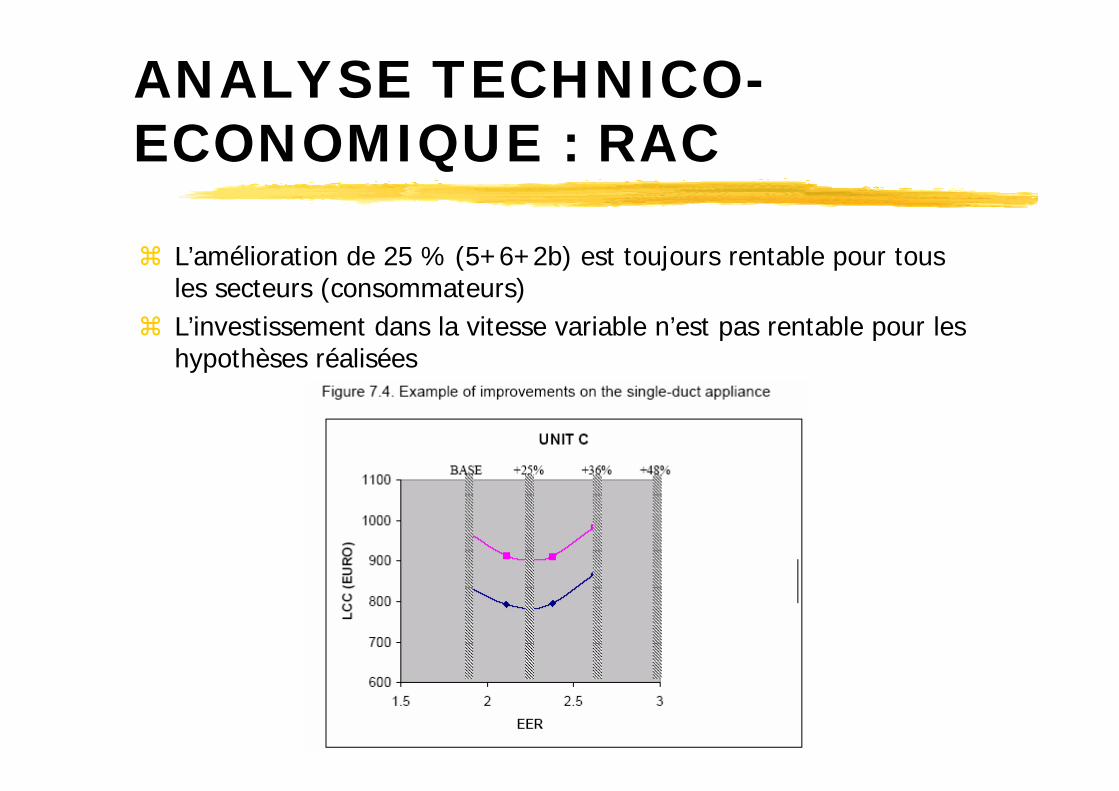
ANALYSE TECHNICO-ECONOMIQUE : RAC
L’amélioration de 25 % (5+6+2b) est toujours rentable pour tous les secteurs (consommateurs)L’investissement dans la vitesse variable n’est pas rentable pour les hypothèses réalisées
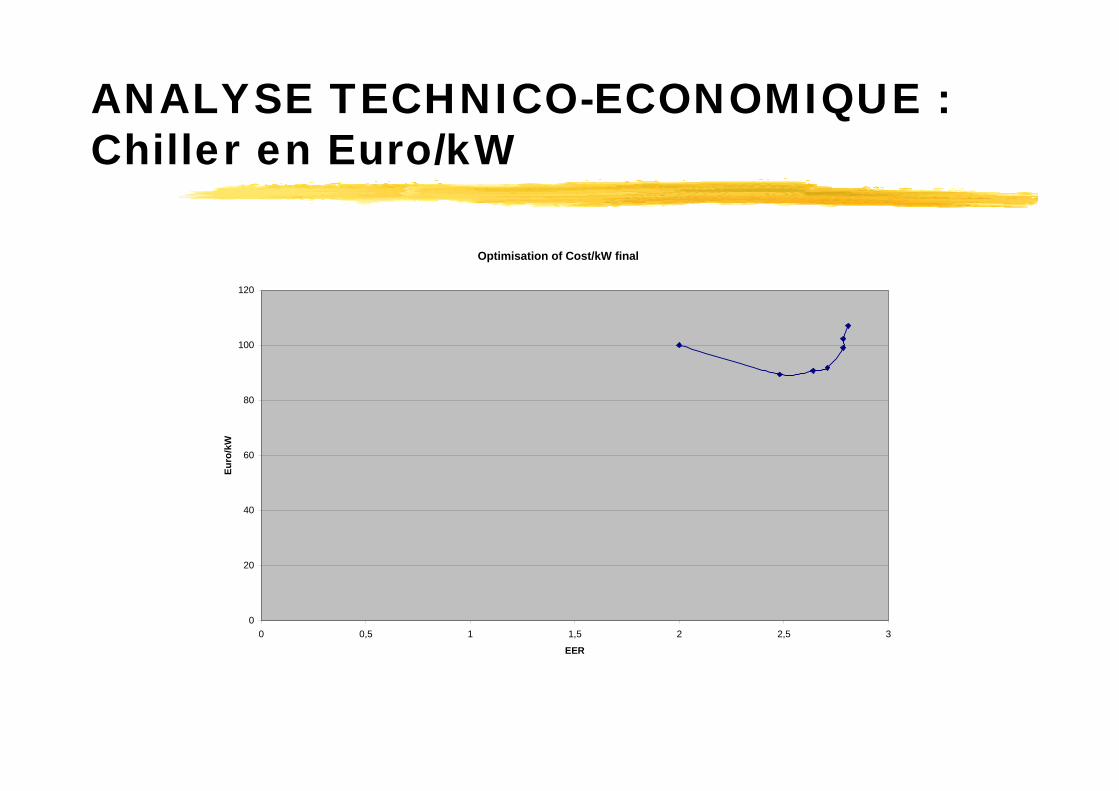
ANALYSE TECHNICO-ECONOMIQUE : Chiller en Euro/kW
Optimisation of Cost/kW final
0
20
40
60
80
100
120
0 0,5 1 1,5 2 2,5 3
EER
Euro
/kW
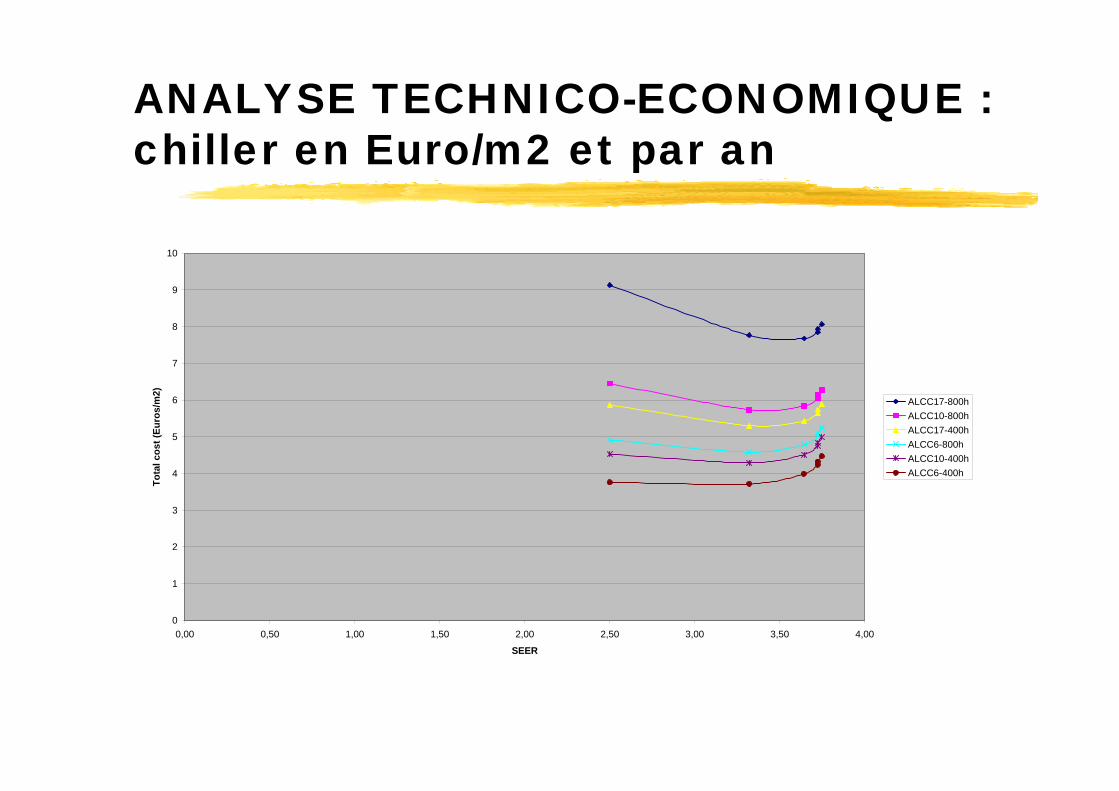
ANALYSE TECHNICO-ECONOMIQUE : chiller en Euro/m2 et par an
0
1
2
3
4
5
6
7
8
9
10
0,00 0,50 1,00 1,50 2,00 2,50 3,00 3,50 4,00
SEER
Tota
l cos
t (Eu
ros/
m2)
ALCC17-800hALCC10-800hALCC17-400hALCC6-800hALCC10-400hALCC6-400h
Le chiller optimum est 40% plus efficace que le moins bon
The optimal chiller is present on the market, it has a SEER between 3.00 and 3.50One way to reach this performance is an EER around 2.46 (enhanced evaporator and condenser, improved compressor) and a splitting in 3 or 4 units of the capacity of the compressor.We have estimated the associated overcost at 12.3 Euros/kW (+12.3%). Once again, manufacturers engineers may have other ways to reach 3.50 SEER, less expensive
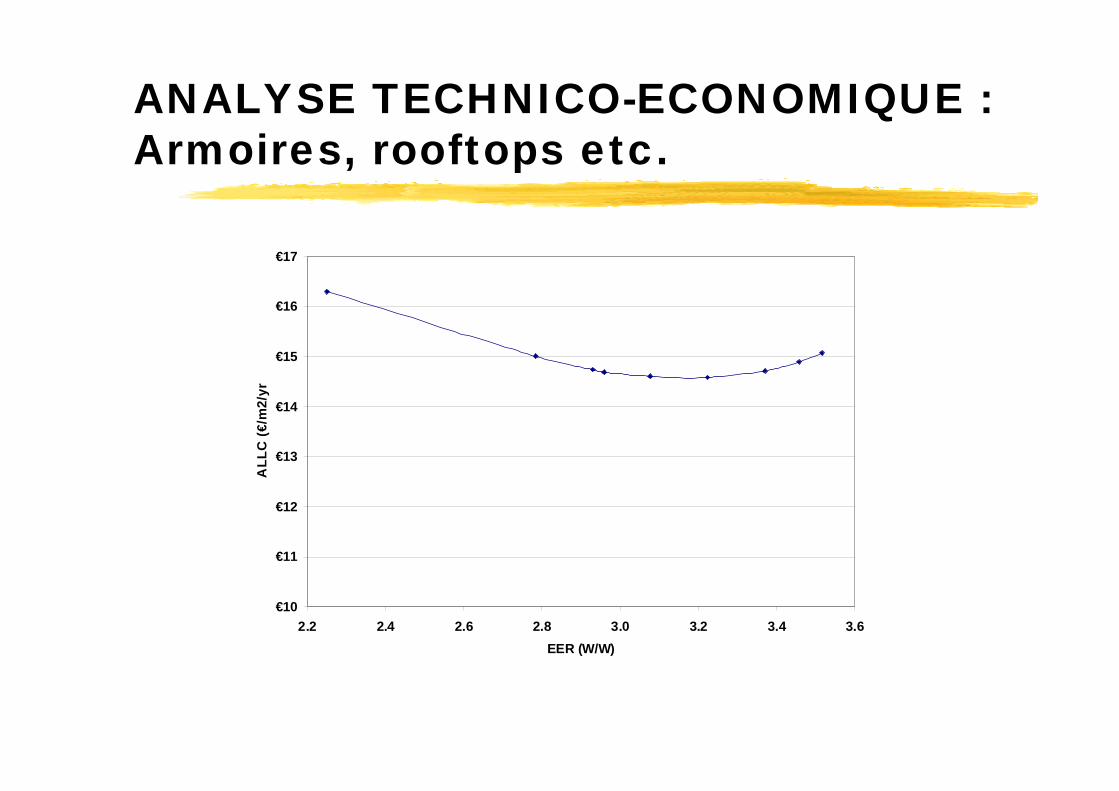
ANALYSE TECHNICO-ECONOMIQUE : Armoires, rooftops etc.
€10
€11
€12
€13
€14
€15
€16
€17
2.2 2.4 2.6 2.8 3.0 3.2 3.4 3.6EER (W/W)
ALL
C (€
/m2/
yr
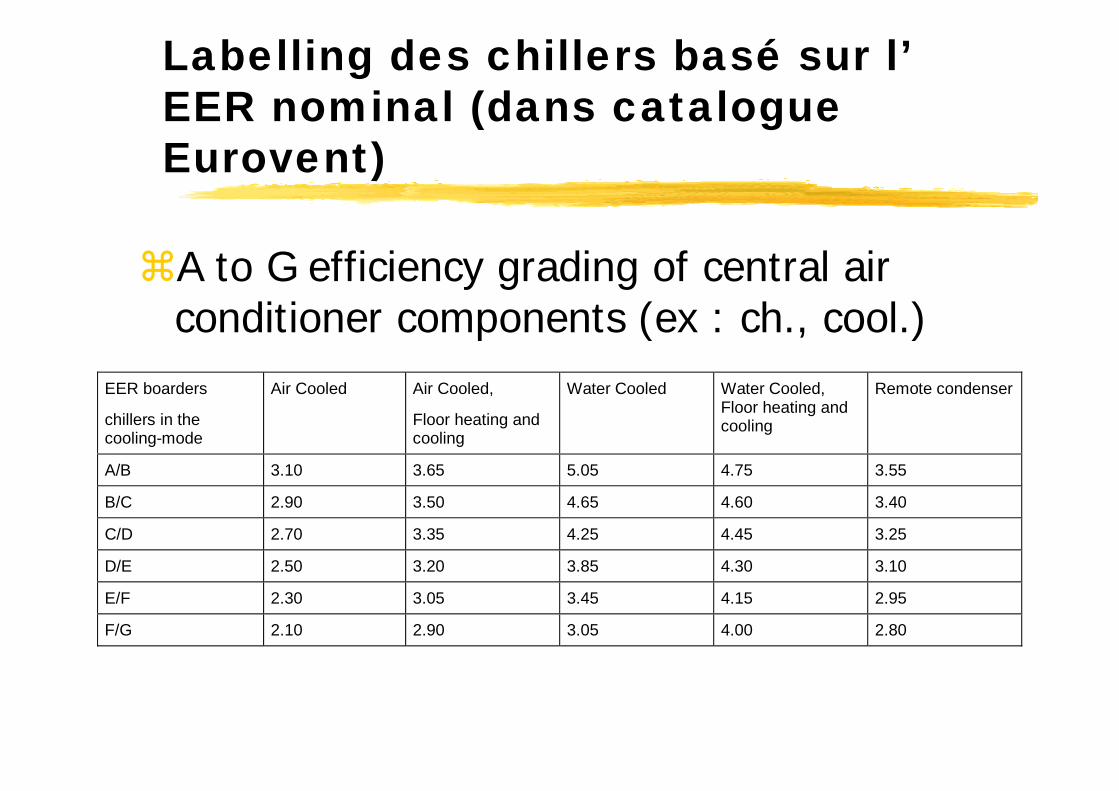
Labelling des chillers basé sur l’EER nominal (dans catalogue Eurovent)
A to G efficiency grading of central air conditioner components (ex : ch., cool.)
EER boarders
chillers in thecooling-mode
Air Cooled Air Cooled,
Floor heating andcooling
Water Cooled Water Cooled,Floor heating andcooling
Remote condenser
A/B 3.10 3.65 5.05 4.75 3.55
B/C 2.90 3.50 4.65 4.60 3.40
C/D 2.70 3.35 4.25 4.45 3.25
D/E 2.50 3.20 3.85 4.30 3.10
E/F 2.30 3.05 3.45 4.15 2.95
F/G 2.10 2.90 3.05 4.00 2.80
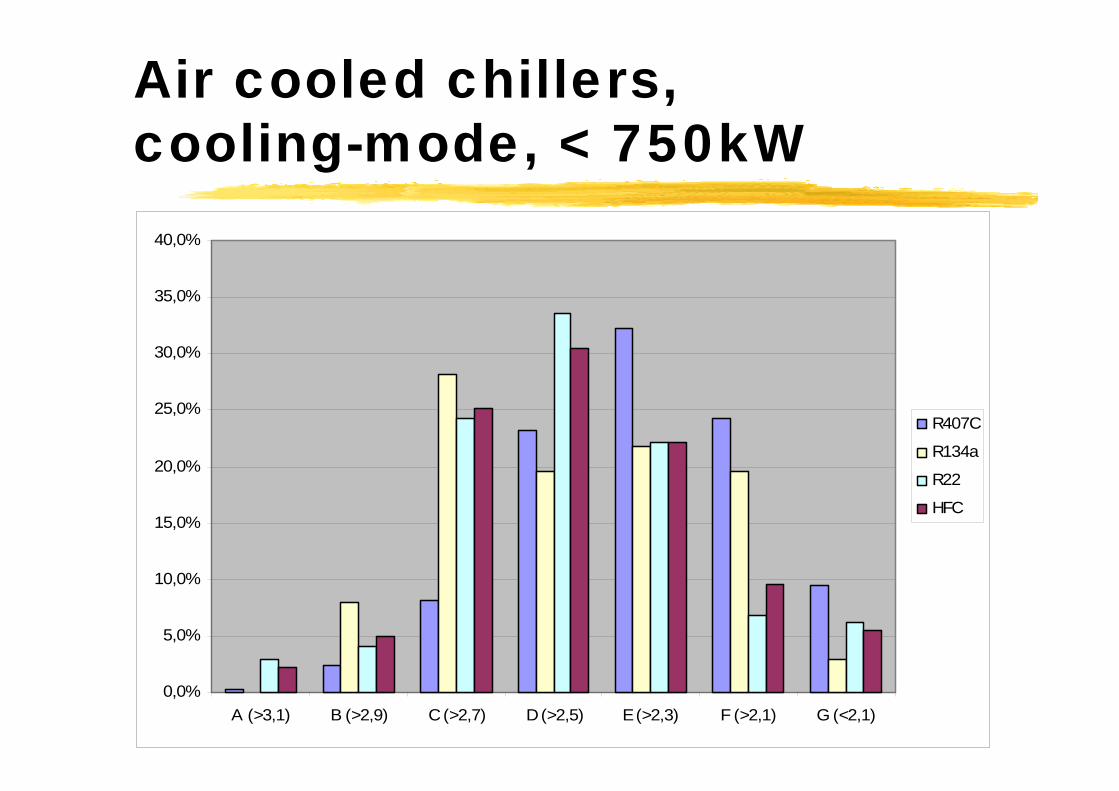
Air cooled chillers, cooling-mode, < 750kW
0,0%
5,0%
10,0%
15,0%
20,0%
25,0%
30,0%
35,0%
40,0%
A (>3,1) B (>2,9) C (>2,7) D (>2,5) E (>2,3) F (>2,1) G (<2,1)
R407C
R134a
R22
HFC
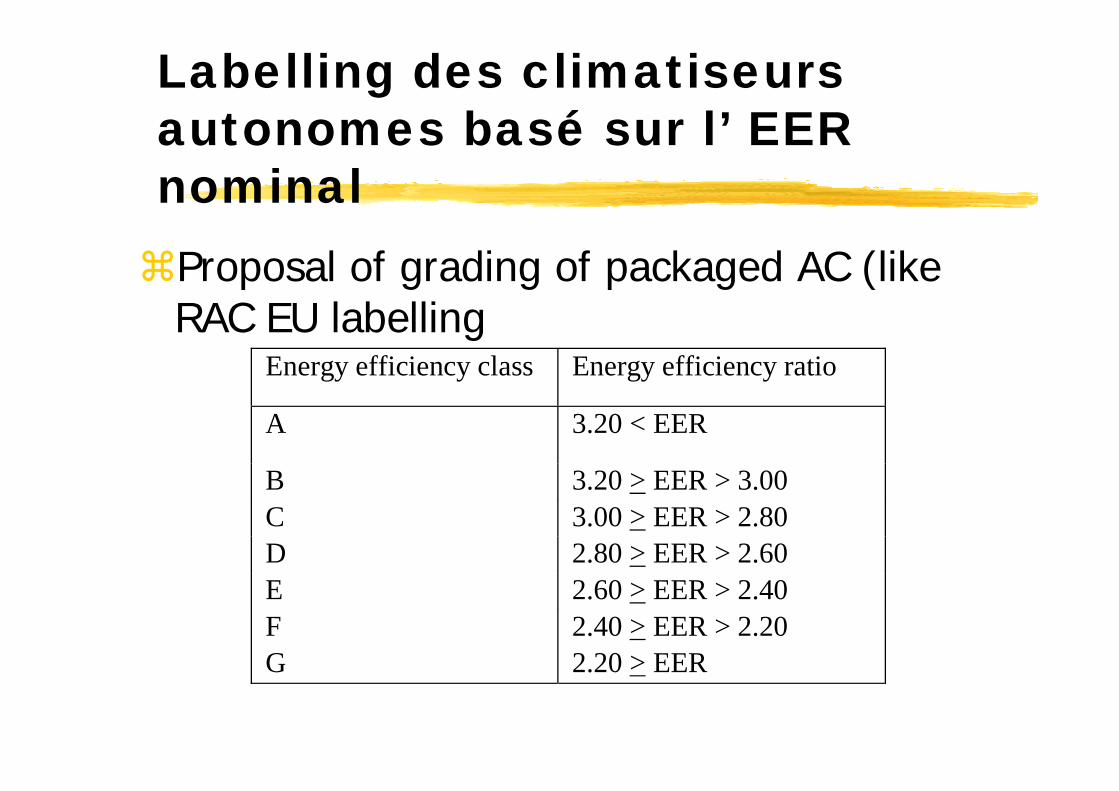
Labelling des climatiseurs autonomes basé sur l’ EER nominalProposal of grading of packaged AC (likeRAC EU labelling
Energy efficiency class Energy efficiency ratio
A 3.20 < EER
B 3.20 > EER > 3.00C 3.00 > EER > 2.80D 2.80 > EER > 2.60E 2.60 > EER > 2.40F 2.40 > EER > 2.20G 2.20 > EER
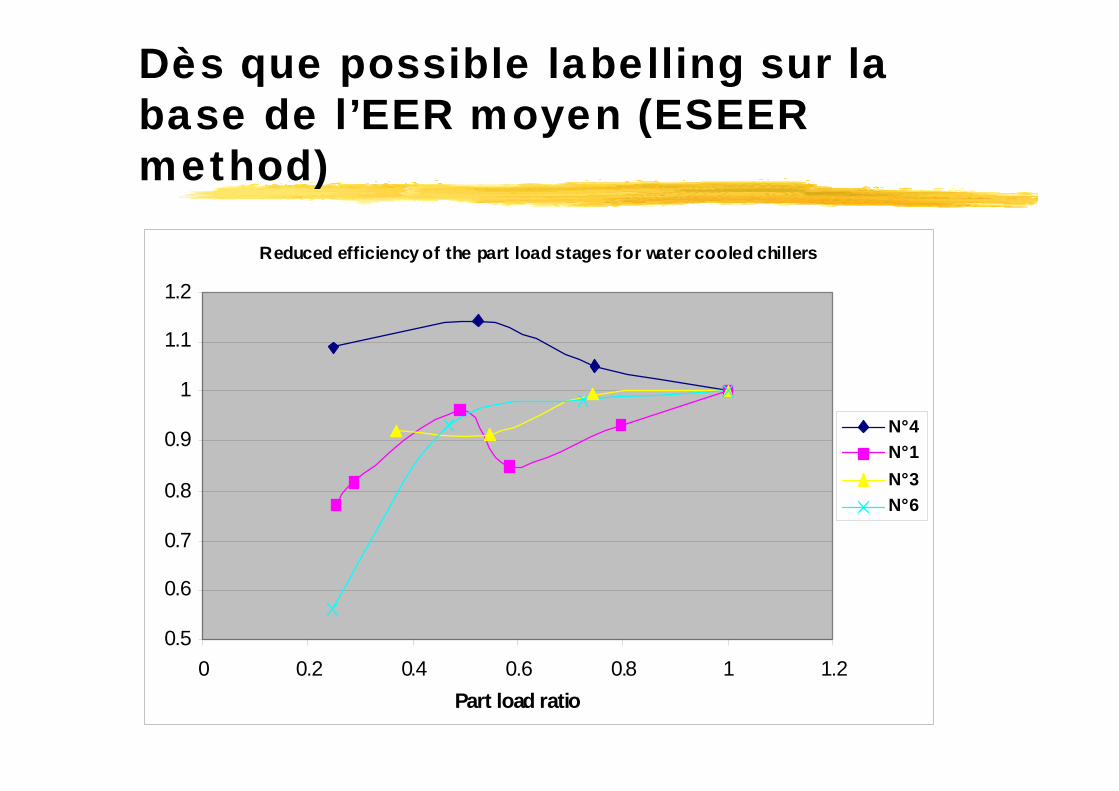
Dès que possible labelling sur la base de l’EER moyen (ESEER method)
Reduced efficiency of the part load stages for water cooled chillers
0.5
0.6
0.7
0.8
0.9
1
1.1
1.2
0 0.2 0.4 0.6 0.8 1 1.2Part load ratio
N° 4N° 1N° 3N° 6
ESEER des chillers va apparaître de manière volontaire dans le catalogue Eurovent
We have developed with experiments and many DOE simulations ESEER, an average EER as easy to obtain as usual EEROnly for chillers presentlyWe check with HSEER, the DOE referenceThe ESEER index proposed here is a set of 4 conditions given for E.U. as a whole, but there are as many similar indices as specific demands: sector, country, etc.
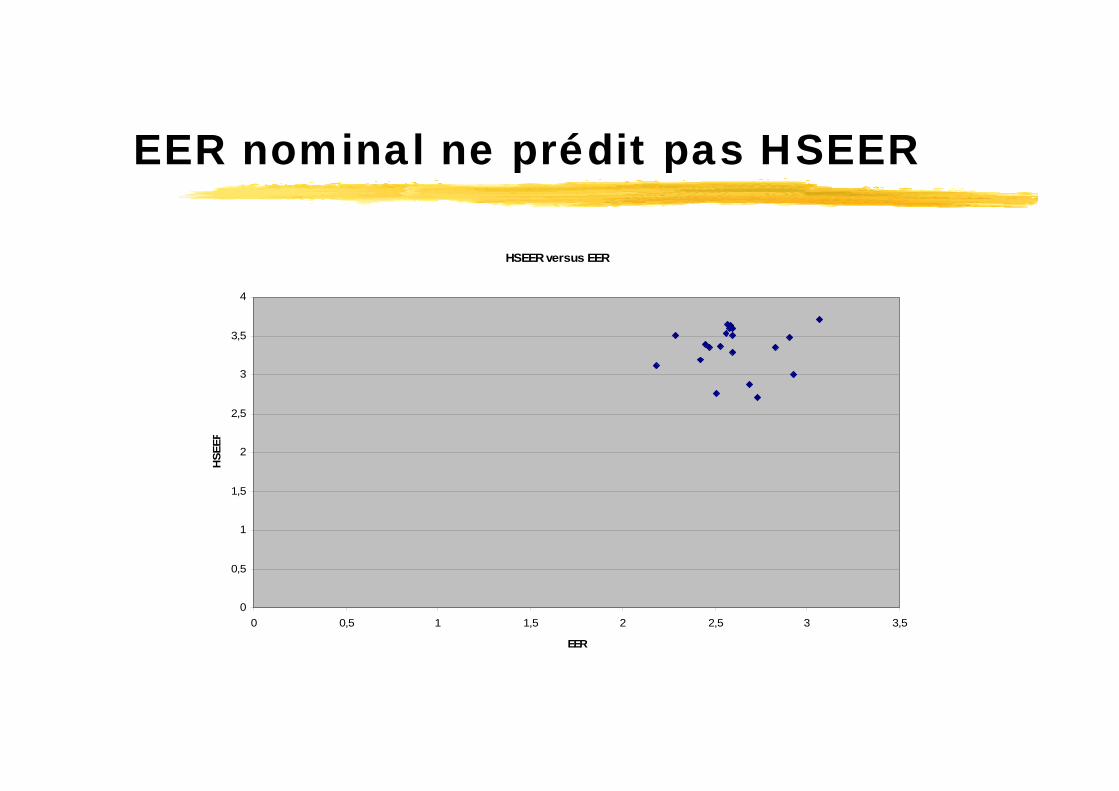
EER nominal ne prédit pas HSEER
HSEER versus EER
0
0,5
1
1,5
2
2,5
3
3,5
4
0 0,5 1 1,5 2 2,5 3 3,5
EER
HSE
ER
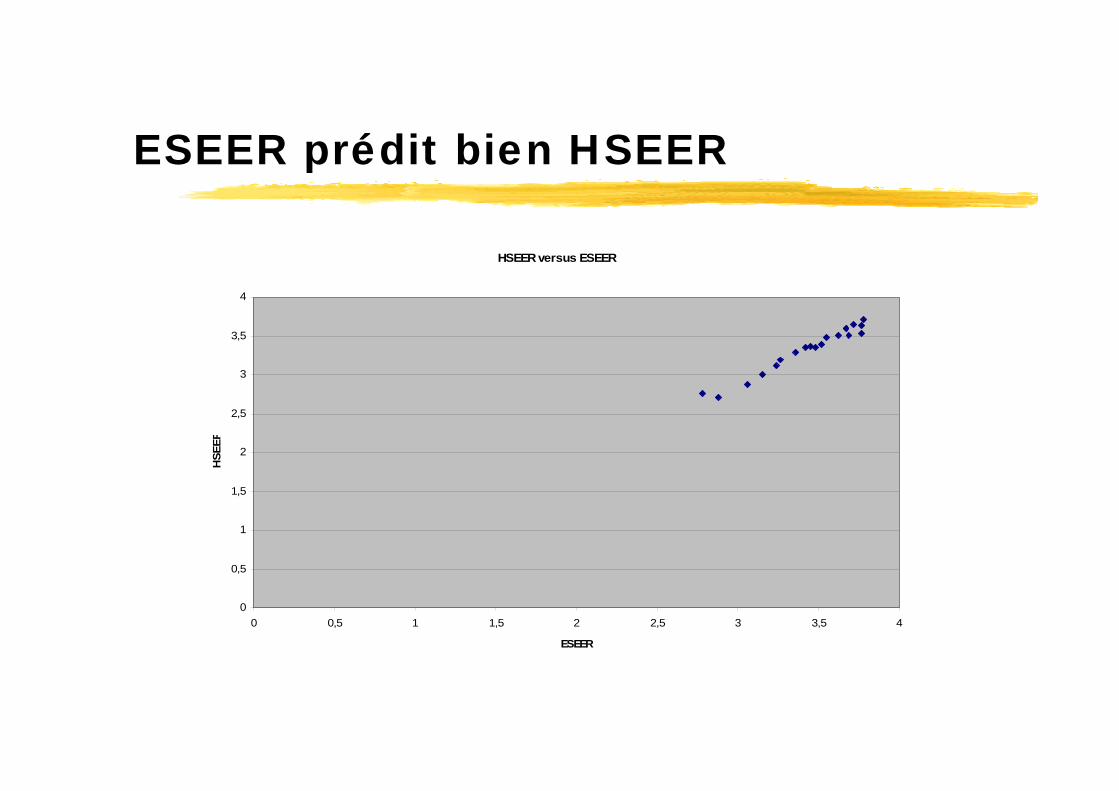
ESEER prédit bien HSEER
HSEER versus ESEER
0
0,5
1
1,5
2
2,5
3
3,5
4
0 0,5 1 1,5 2 2,5 3 3,5 4
ESEER
HSE
ER
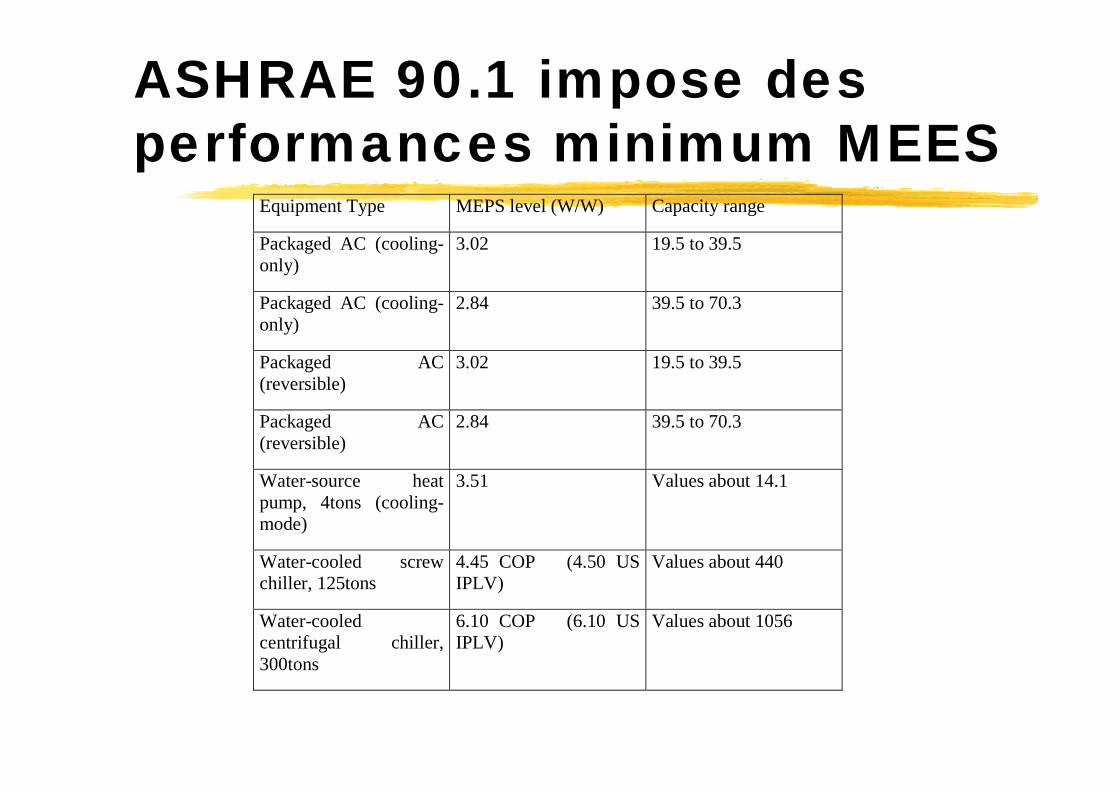
ASHRAE 90.1 impose des performances minimum MEES
Equipment Type MEPS level (W/W) Capacity range
Packaged AC (cooling-only)
3.02 19.5 to 39.5
Packaged AC (cooling-only)
2.84 39.5 to 70.3
Packaged AC(reversible)
3.02 19.5 to 39.5
Packaged AC(reversible)
2.84 39.5 to 70.3
Water-source heatpump, 4tons (cooling-mode)
3.51 Values about 14.1
Water-cooled screwchiller, 125tons
4.45 COP (4.50 USIPLV)
Values about 440
Water-cooledcentrifugal chiller,300tons
6.10 COP (6.10 USIPLV)
Values about 1056
La boite à outil sur les produits
A to G efficiency grading of RACA to G efficiency grading of chillers, full load then part loadRemoving less efficient equipment from the market (MEES and voluntaryagreements)Additional effects of grading (consumer decision)
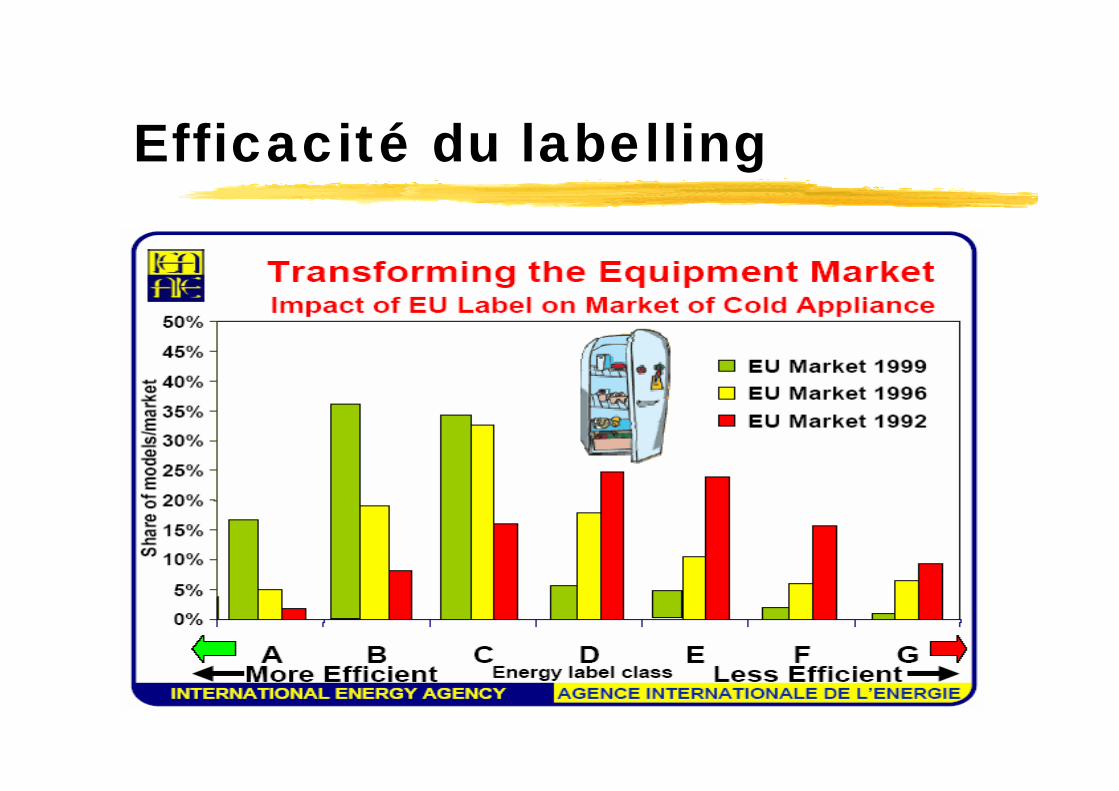
Efficacité du labelling
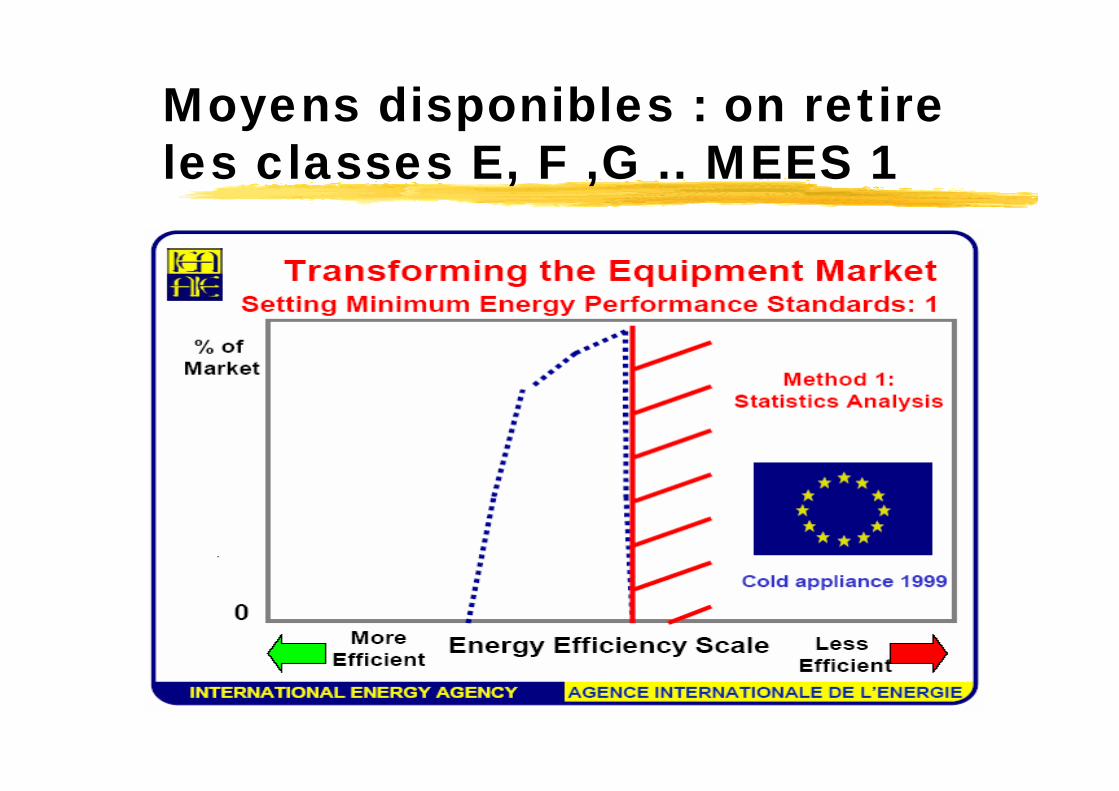
Moyens disponibles : on retire les classes E, F ,G .. MEES 1
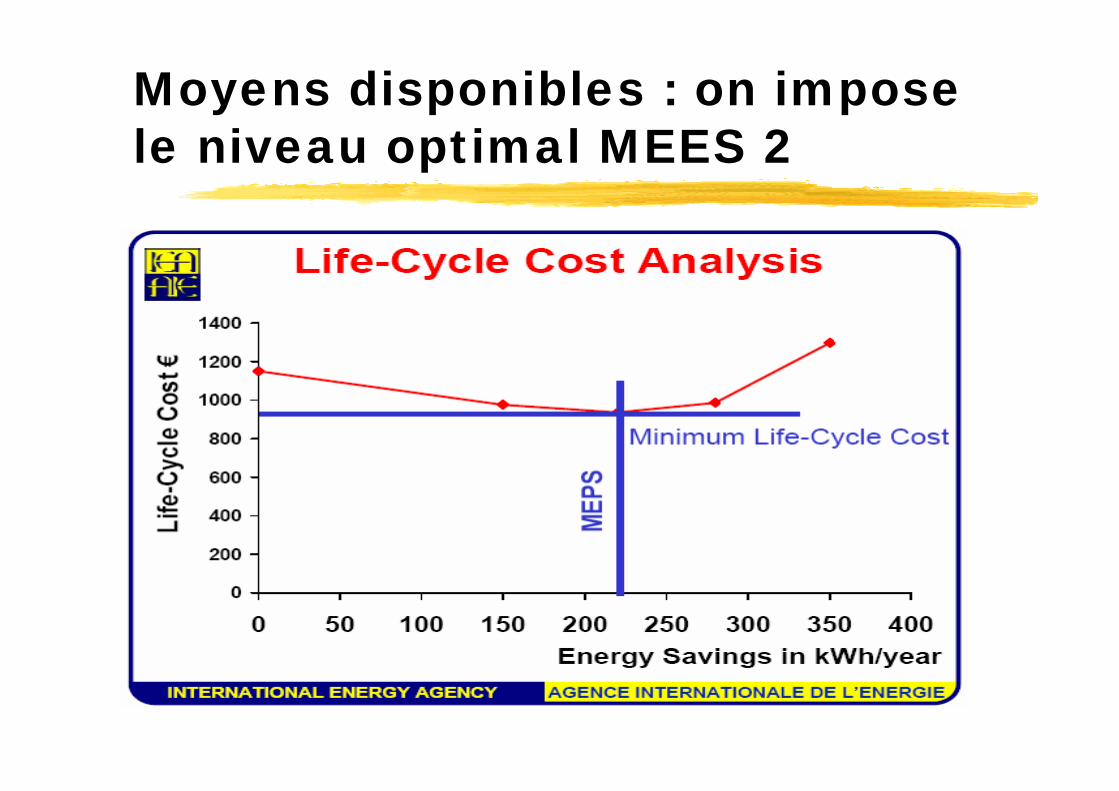
Moyens disponibles : on impose le niveau optimal MEES 2
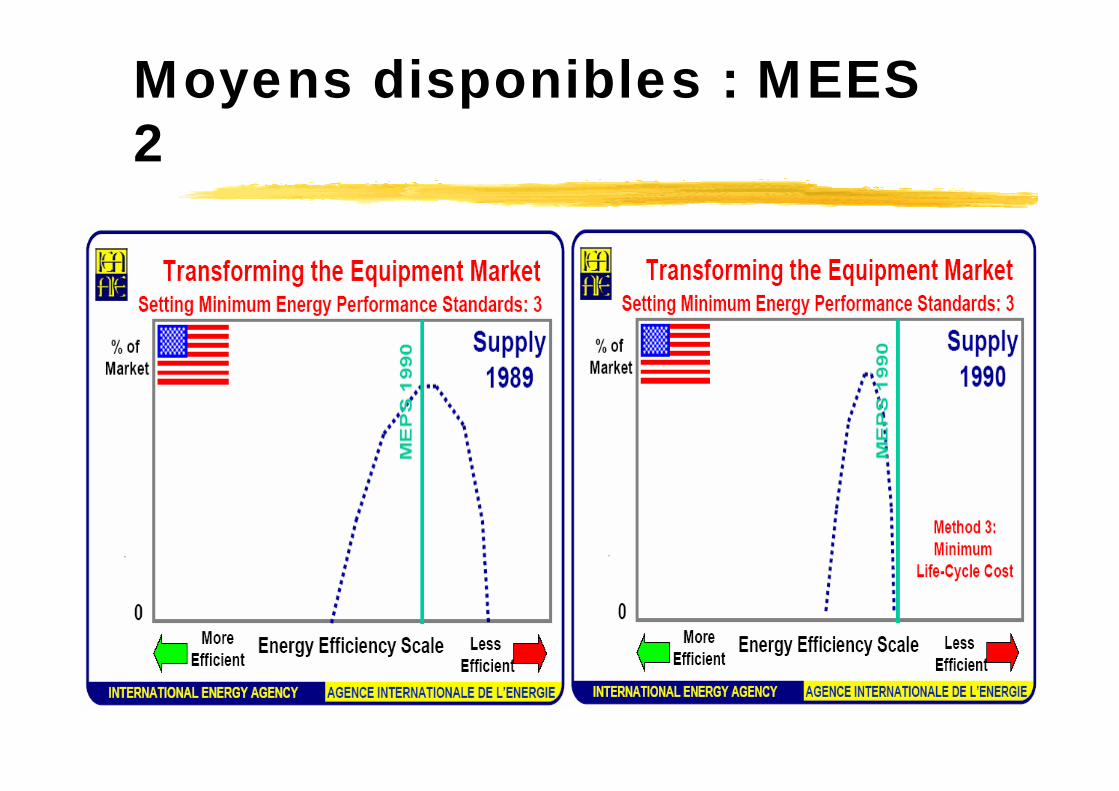
Moyens disponibles : MEES 2
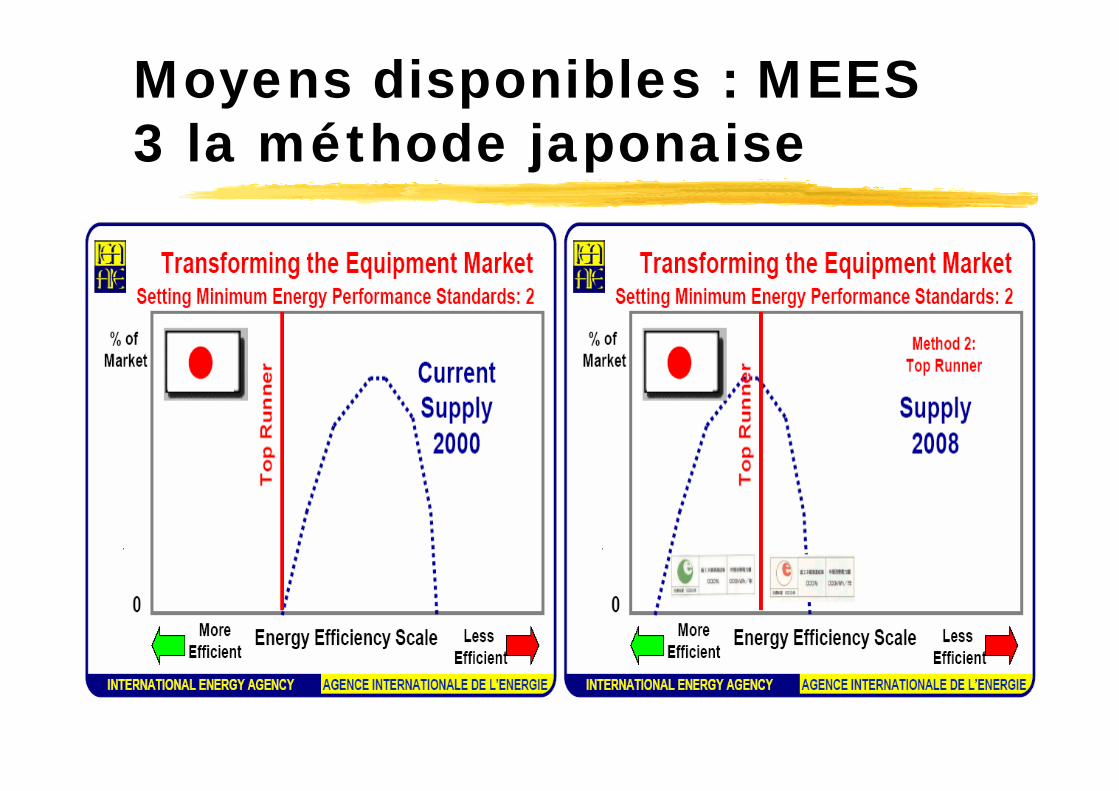
Moyens disponibles : MEES 3 la méthode japonaise
LES PROGRAMMESD’ETIQUETAGE
US (labelling, MEES) NAFTACanada NAFTAMexico NAFTAJapon (labelling, MEES)Corée du Sud (labelling, MEES)ChinePhilippines (labelling, MEES)Taipei (MEES)Israel (prévu mais pas encore achevé élaboré en 1998)Hong-Kong (labelling, MEES)Australie (labelling, pas MEES, min performance température extérieure élevée)Thaïlande (labelling, programme volontaire)

Effets : USA
Impact of MEES before 1996 (RACs)
0%
10%
20%
30%
40%
50%
60%
70%
80%
90%
100%
1974
1978
1980
1981
1982
1983
1984
1985
1986
1987
1988
1989
1990
1991
1992
1993
1994
1995
1996
Mar
ket s
hare
(% o
f shi
pmen
ts)
EER > 2.75
EER 2.49-2.75
EER < 2.49
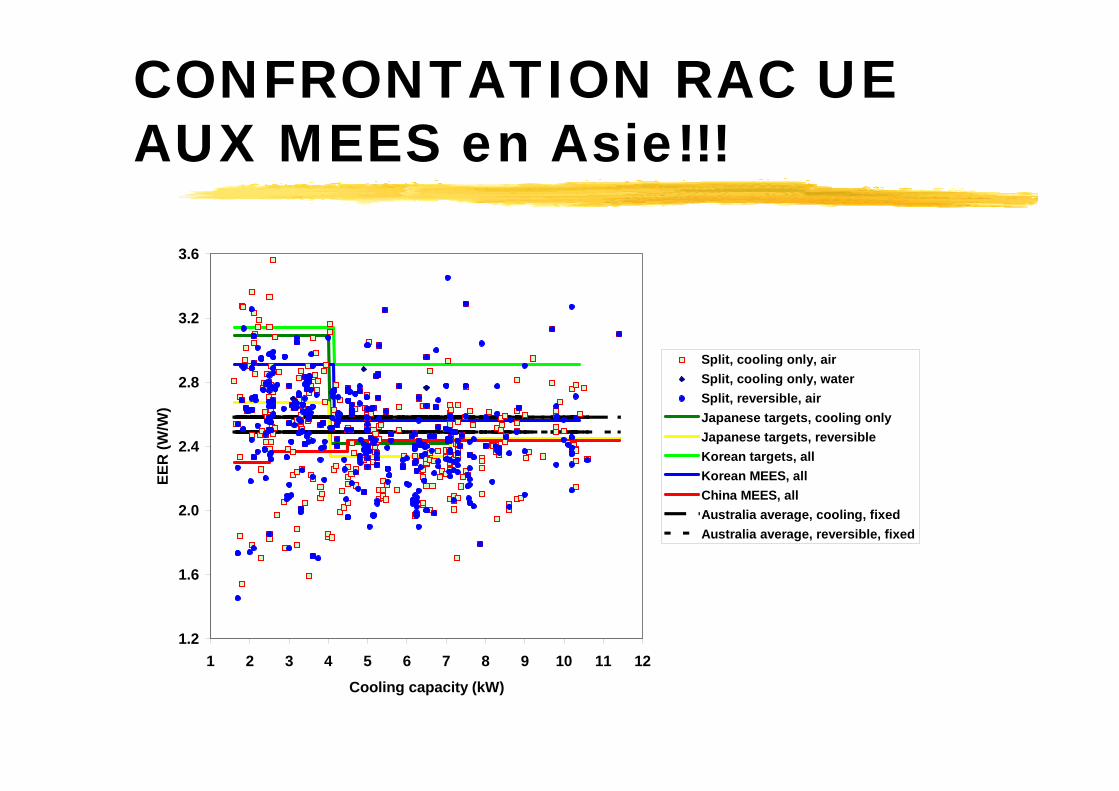
CONFRONTATION RAC UE AUX MEES en Asie!!!
1.2
1.6
2.0
2.4
2.8
3.2
3.6
1 2 3 4 5 6 7 8 9 10 11 12
Cooling capacity (kW)
EER
(W/W
)
Split, cooling only, airSplit, cooling only, waterSplit, reversible, airJapanese targets, cooling onlyJapanese targets, reversibleKorean targets, allKorean MEES, allChina MEES, allAustralia average, cooling, fixedAustralia average, reversible, fixed
Un marché de conception, presque sans règlement
On s’intéresse à l’efficacité énergétique : comment assurer la fonction demandée avec moins d’énergie et « plus d’intelligence » ou
« plus de régulation»
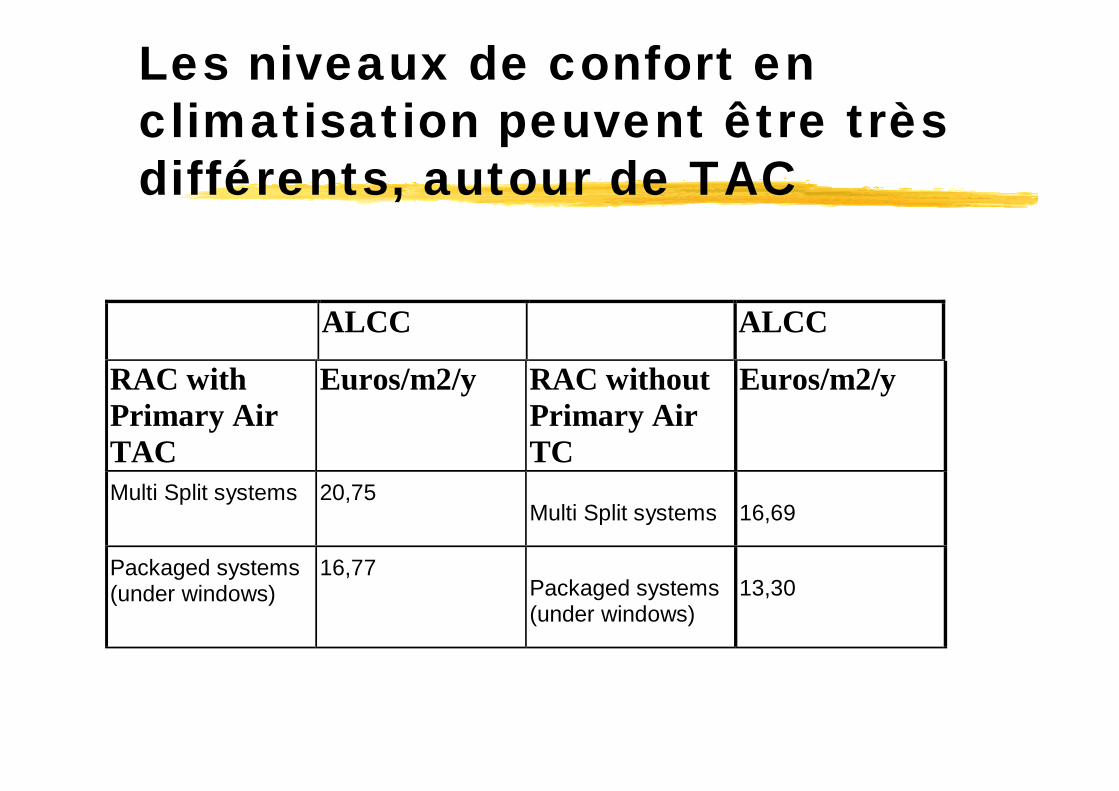
Les niveaux de confort en climatisation peuvent être trèsdifférents, autour de TAC
ALCC ALCC
RAC withPrimary AirTAC
Euros/m2/y RAC withoutPrimary AirTC
Euros/m2/y
Multi Split systems 20,75Multi Split systems 16,69
Packaged systems(under windows)
16,77Packaged systems(under windows)
13,30
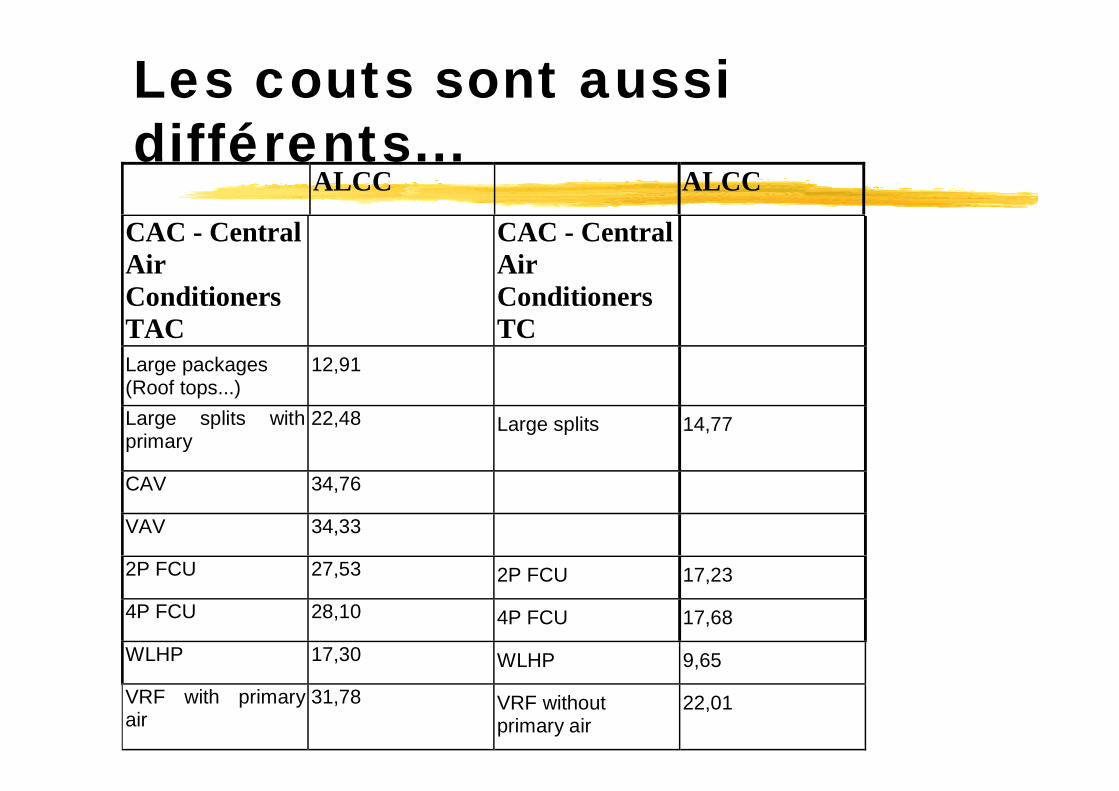
Les couts sont aussidifférents...
ALCC ALCC
CAC - CentralAirConditionersTAC
CAC - CentralAirConditionersTC
Large packages(Roof tops...)
12,91
Large splits withprimary
22,48 Large splits 14,77
CAV 34,76
VAV 34,33
2P FCU 27,53 2P FCU 17,23
4P FCU 28,10 4P FCU 17,68
WLHP 17,30 WLHP 9,65
VRF with primaryair
31,78 VRF withoutprimary air
22,01
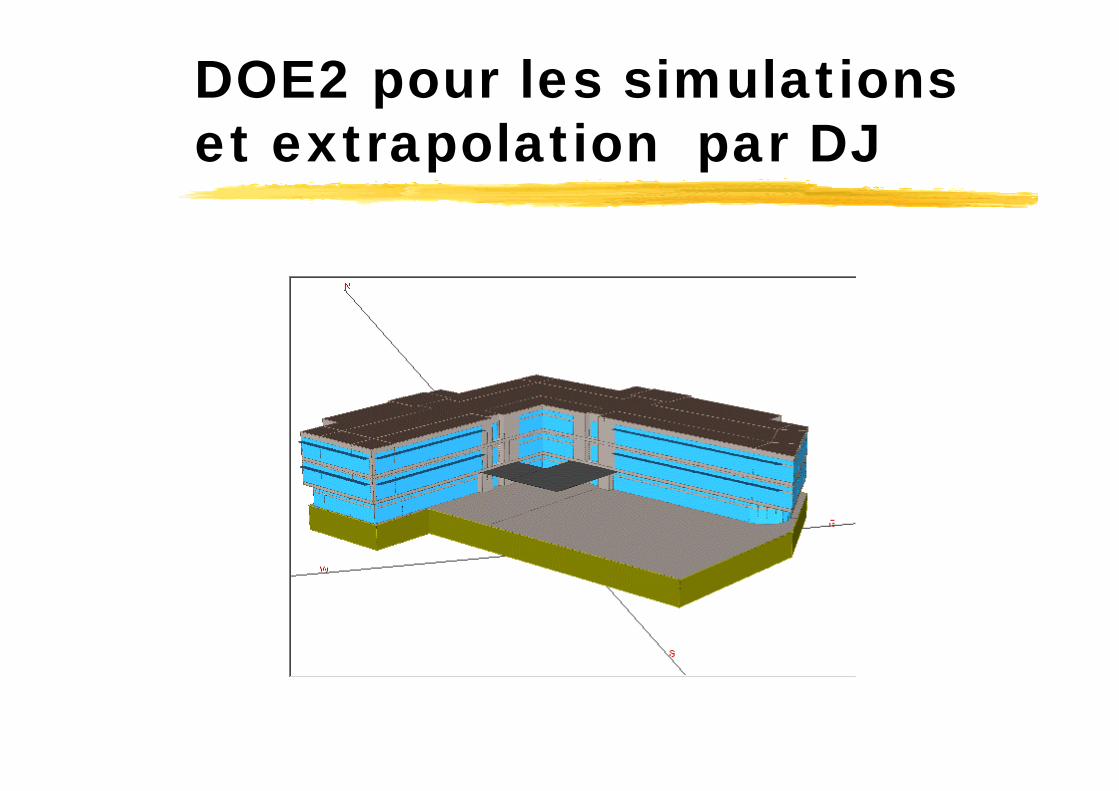
DOE2 pour les simulations et extrapolation par DJ
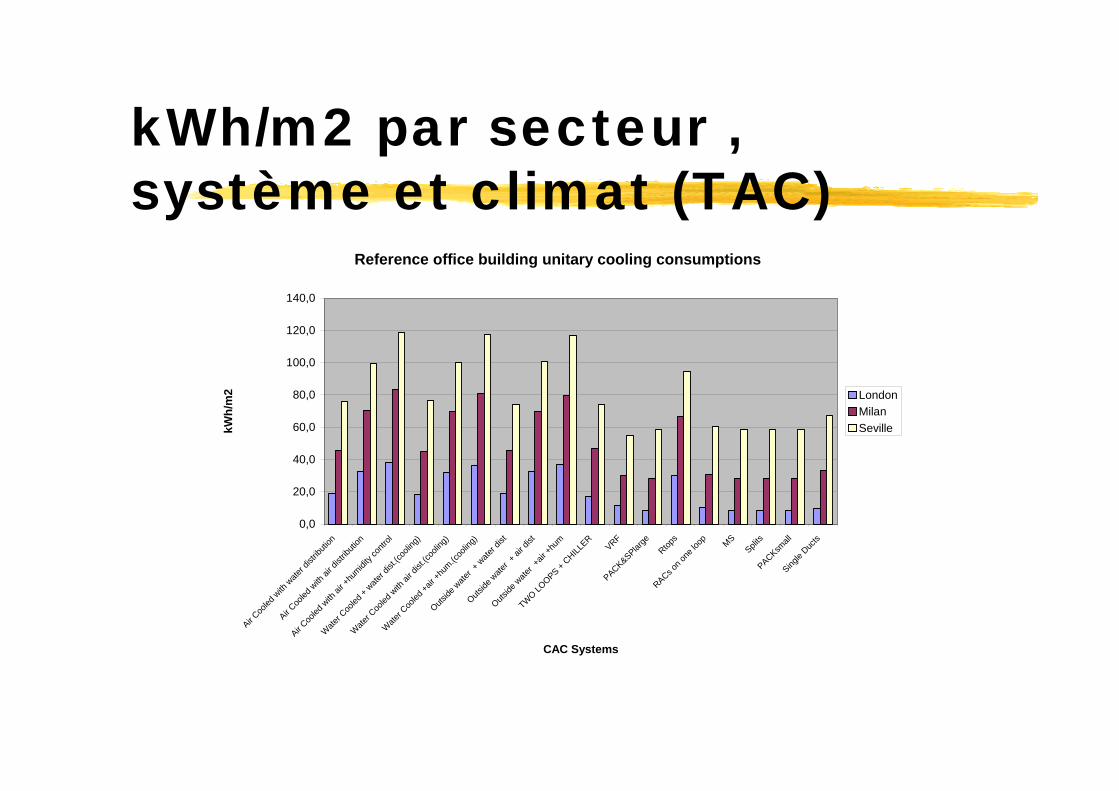
kWh/m2 par secteur , système et climat (TAC)
Reference office building unitary cooling consumptions
0,0
20,0
40,0
60,0
80,0
100,0
120,0
140,0
Air Coo
led w
ith w
ater d
istrib
ution
Air Coo
led w
ith ai
r dist
ributi
on
Air Coo
led w
ith ai
r +hu
midity
contr
ol
Wate
r Coo
led +
water d
ist.(c
oolin
g)
Wate
r Coo
led w
ith ai
r dist
.(coo
ling)
Wate
r Coo
led +a
ir +hu
m.(coo
ling)
Outside
wate
r + w
ater d
ist
Outside
wate
r + ai
r dist
Outside
wate
r +air
+hum
TWO LOOPS +
CHILLER
VRFPACK&SPlar
ge
Rtops
RACs on o
ne lo
op
MS
Splits
PACKsmall
Single
Ducts
CAC Systems
kWh/
m2 London
MilanSeville
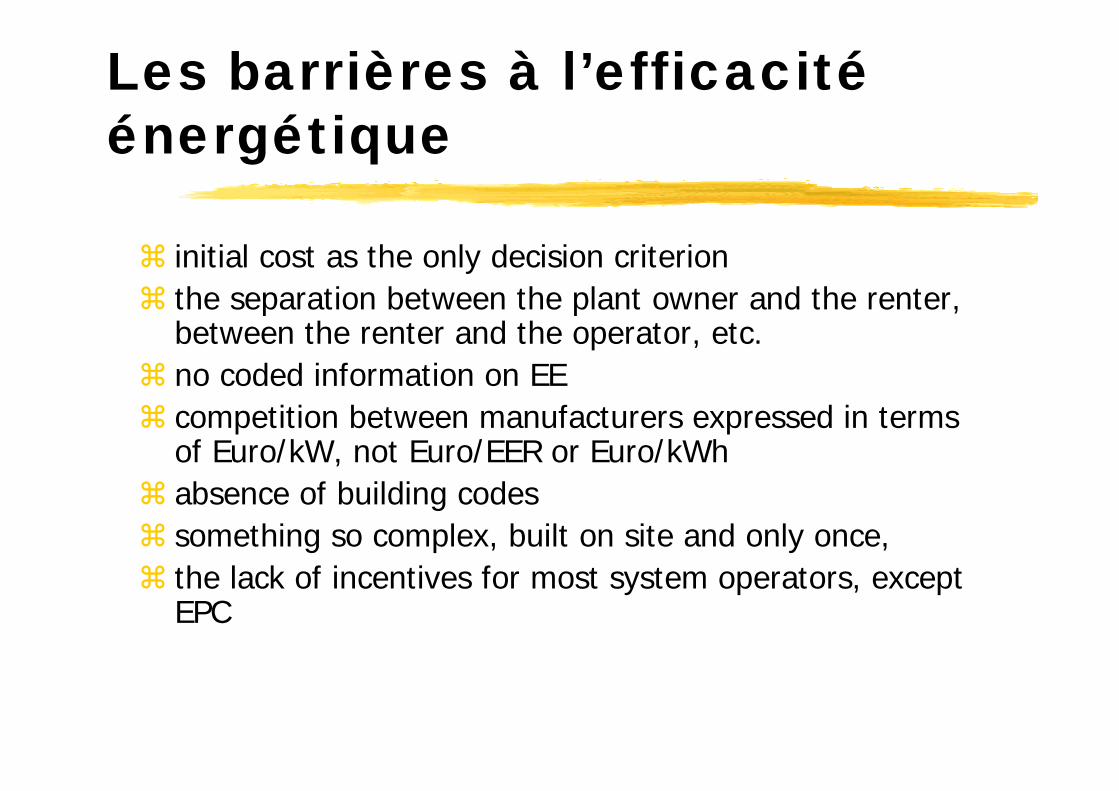
Les barrières à l’efficacitéénergétique
initial cost as the only decision criterionthe separation between the plant owner and the renter,between the renter and the operator, etc. no coded information on EEcompetition between manufacturers expressed in termsof Euro/kW, not Euro/EER or Euro/kWhabsence of building codessomething so complex, built on site and only once,the lack of incentives for most system operators, exceptEPC
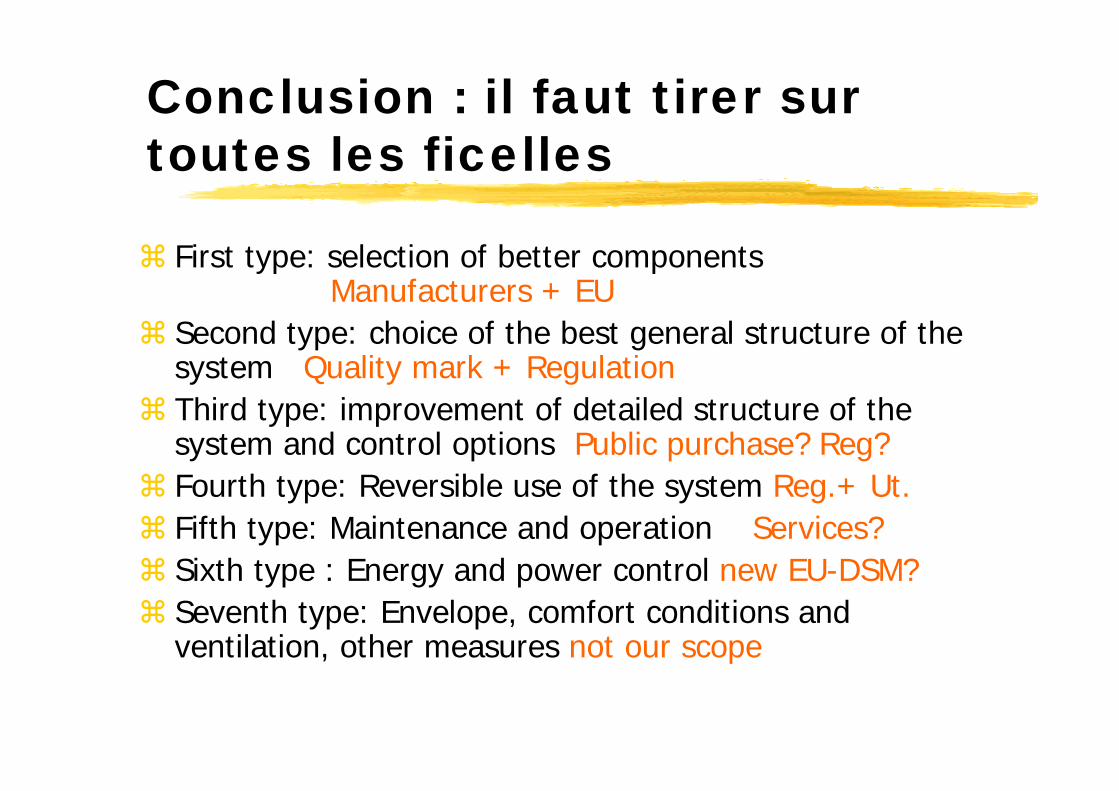
Conclusion : il faut tirer sur toutes les ficelles
First type: selection of better components Manufacturers + EU
Second type: choice of the best general structure of the system Quality mark + RegulationThird type: improvement of detailed structure of the system and control options Public purchase? Reg?Fourth type: Reversible use of the system Reg.+ Ut.Fifth type: Maintenance and operation Services?Sixth type : Energy and power control new EU-DSM?Seventh type: Envelope, comfort conditions and ventilation, other measures not our scope
La boite à outil sur les systèmes
A to G efficiency grading of all central airconditioner componentsRemoving less efficient equipment from the market (MEPS and voluntary agreements)Legal basis for policy measures targeting more efficient system structuresPolicy aims and potential measures targeting improved O&MBroadening the application of existing policy measures addressing O&MEtc.
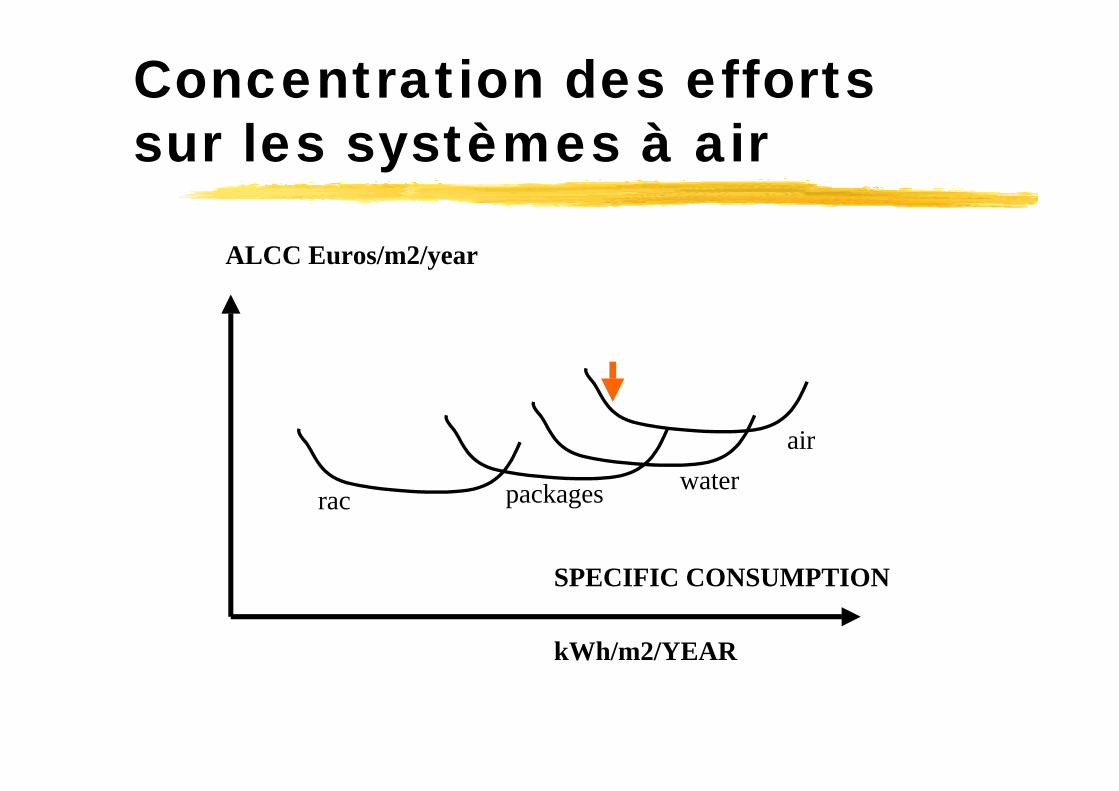
Concentration des efforts sur les systèmes à air
SPECIFIC CONSUMPTION
ALCC Euros/m2/year
kWh/m2/YEAR
airwaterpackagesrac
Toutes les options ont étéquantifiées sur DOE2 avec redimensionnement (U.Séville)
Heat recovery on primary airMotors and fans efficiencyVariable air flow and lower head lossesTerminal reheat issuesAir Side Free Cooling (Economiser)Quality of Air DiffusionDesign of flow in water circulationInfluence of terminal equipmentSimultaneous demand of heating and coolingHeat rejection (dry, wet, water)
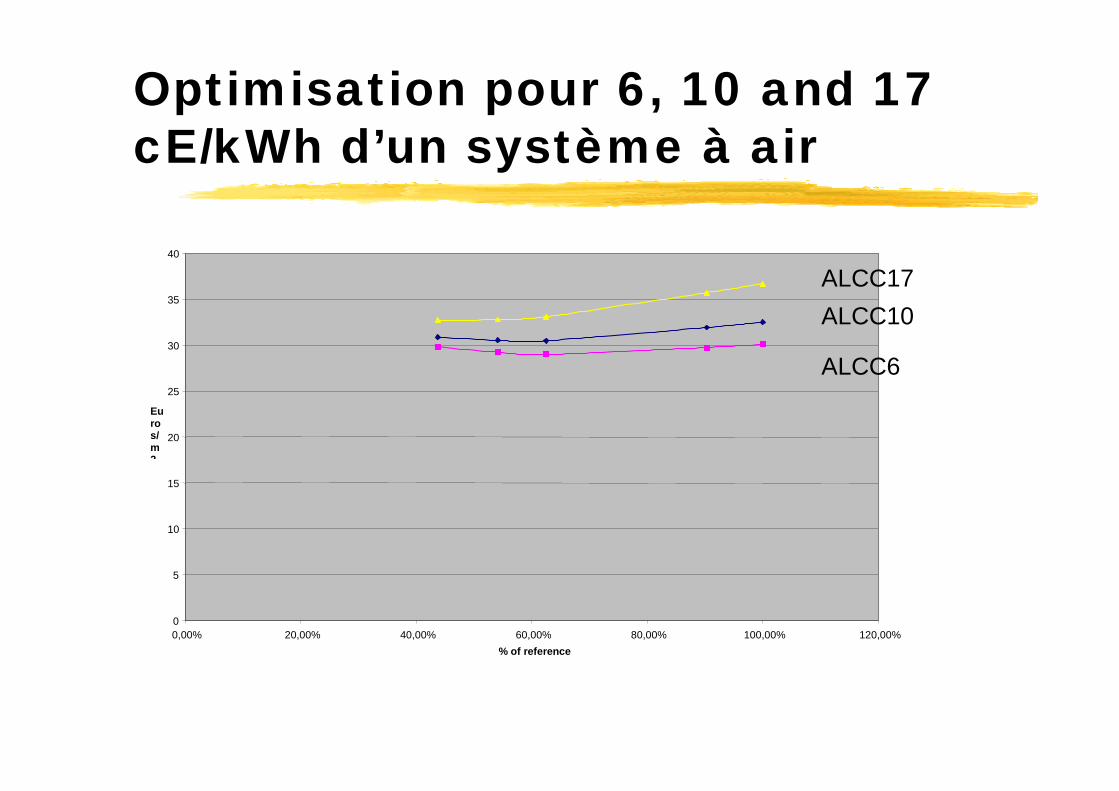
Optimisation pour 6, 10 and 17 cE/kWh d’un système à air
0
5
10
15
20
25
30
35
40
0,00% 20,00% 40,00% 60,00% 80,00% 100,00% 120,00%% of reference
Euros/m2
ALCC17ALCC10
ALCC6

La directive PEB : un premier pas
Building codes are the primary policy measure available to encourage the adoption of more efficient system types. Energy Performance in Buildings Directive is an opportunityIn the case of the UK this Directive may simply require minor revisions of the existing regulations for building cooling energy performance The requirement that a simple calculation method should be constructed against which the compliance of the MEPS is to be judged may also require modification of the Portuguese regulations. Ultimately such a code could be the EU equivalent to the US ASHRAE 90.1 standard, which is none-binding in itself but can be bought either wholly or in-part into national regulations
Une possibilité d’effort volontaire :labelling des projets de A à G
The difficulty in obtaining the best grades (closer to A) should be increasing and involve not only the manufacturer but also other elements of the chain. Moving from G to F or E might be based only on full-load ratings i.e. readily available EER values. Following these measures the importance of system design cannot be neglected. A designer could refer to a design procedure proving he has considered all cost effective options of the project. and reached a certain performance level like C (- 25 %) or B(-50 %) or even A (-75%) compared with the average European performance level, just as is currently the case in the US Energy Star for buildings scheme.
Problèmes induits sur le réseau électrique,
principalement à venir
On s’intéresse à l’efficacité économique : comment être sûr que celui qui entraîne des
dépenses les paye (internalisation)
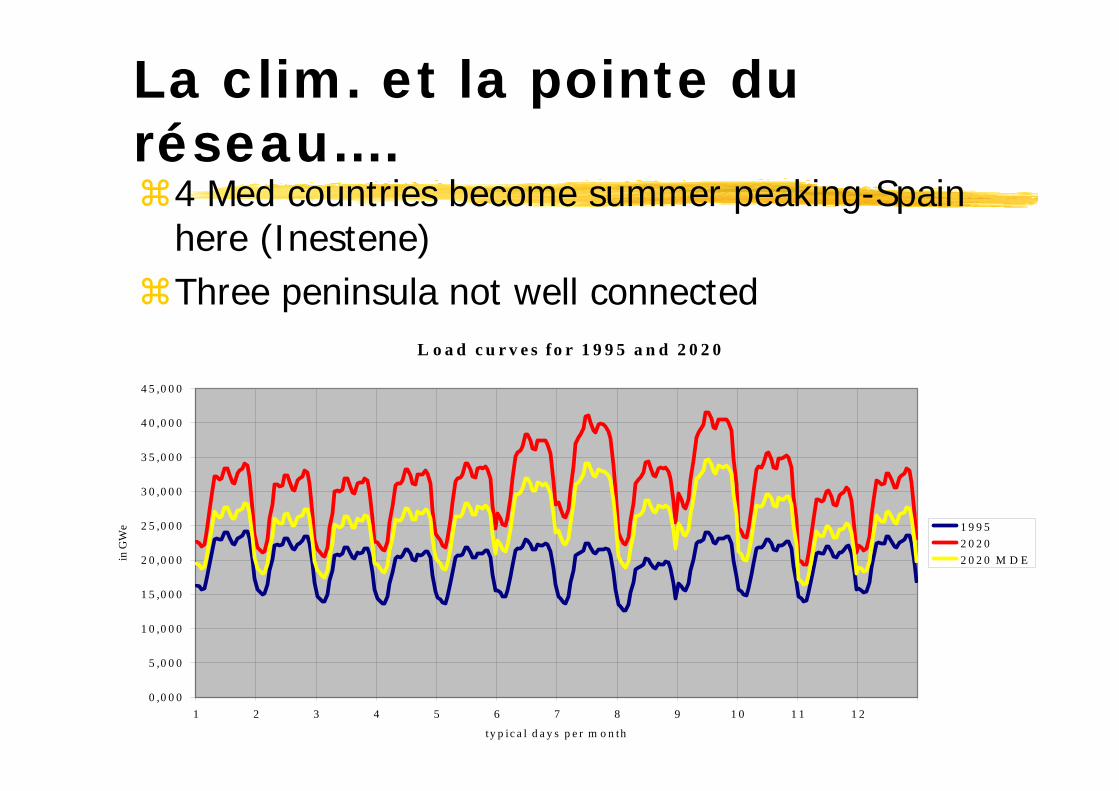
La clim. et la pointe du réseau….
4 Med countries become summer peaking-Spain here (Inestene)Three peninsula not well connected
L o a d c u r v e s fo r 1 9 9 5 a n d 2 0 2 0
0 ,0 0 0
5 ,0 0 0
1 0 ,0 0 0
1 5 ,0 0 0
2 0 ,0 0 0
2 5 ,0 0 0
3 0 ,0 0 0
3 5 ,0 0 0
4 0 ,0 0 0
4 5 ,0 0 0
1 2 3 4 5 6 7 8 9 1 0 1 1 1 2
ty p ic a l d a y s p e r m o n th
in G
We 1 9 9 5
2 0 2 02 0 2 0 M D E
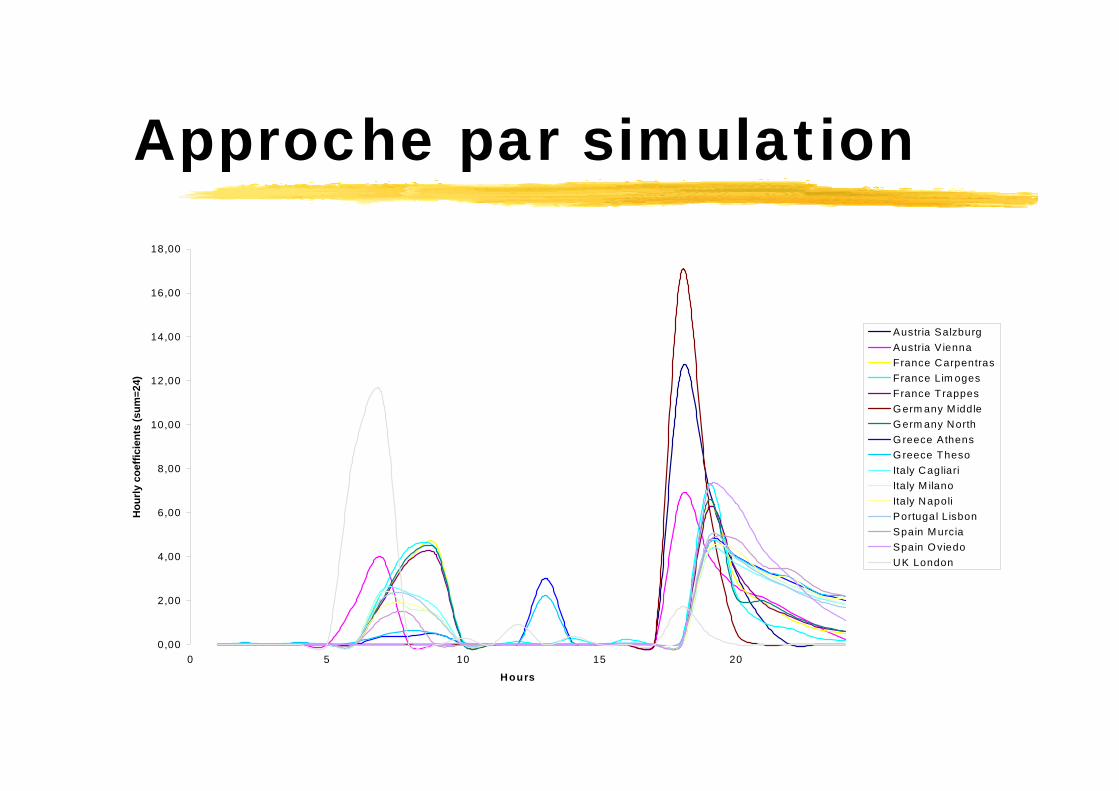
Approche par simulation
0,00
2,00
4,00
6,00
8,00
10,00
12,00
14,00
16,00
18,00
0 5 10 15 20
Hours
Hou
rly c
oeffi
cien
ts (s
um=2
4)
Austria SalzburgAustria V iennaFrance CarpentrasFrance Lim ogesFrance T rappesG erm any M iddleG erm any NorthG reece AthensG reece ThesoItaly CagliariIta ly M ilanoItaly NapoliPortugal L isbonSpain M urciaSpain O viedoUK London
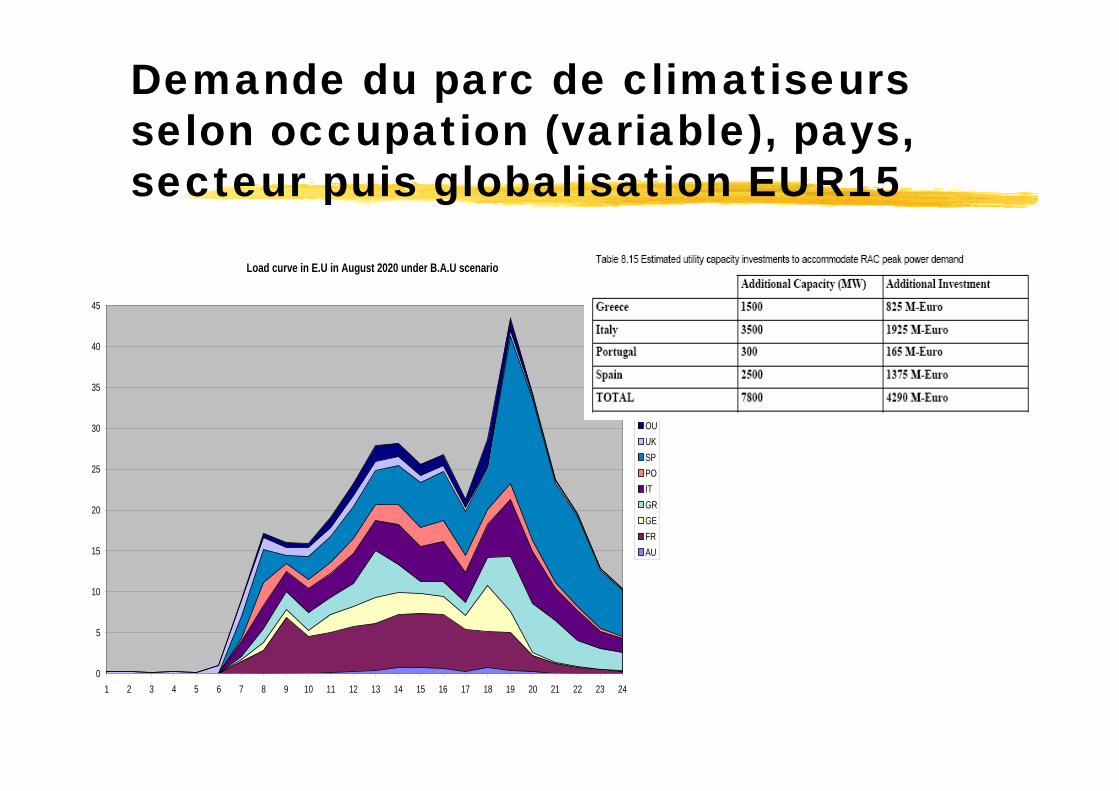
Demande du parc de climatiseurs selon occupation (variable), pays, secteur puis globalisation EUR15
Load curve in E.U in August 2020 under B.A.U scenario
0
5
10
15
20
25
30
35
40
45
1 2 3 4 5 6 7 8 9 10 11 12 13 14 15 16 17 18 19 20 21 22 23 24
OUUKSPPOITGRGEFRAU
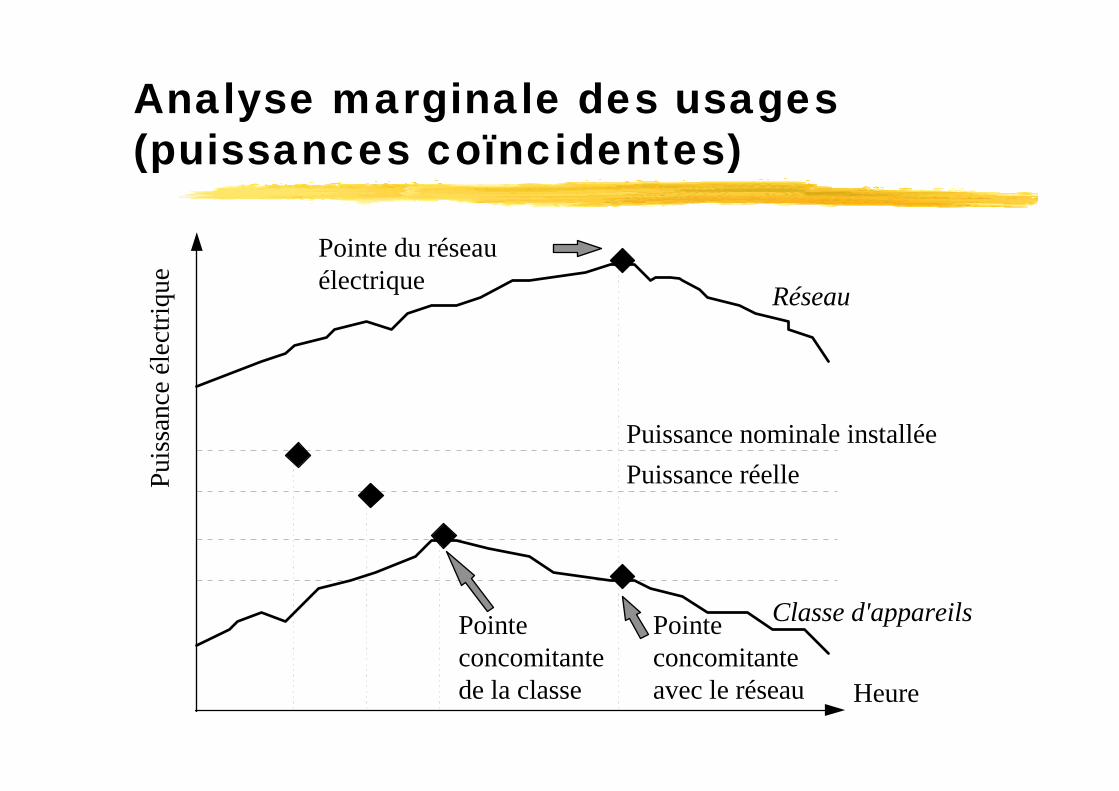
Analyse marginale des usages (puissances coïncidentes)
Heure
Puis
sanc
e él
ectri
que
Pointeconcomitantede la classe
Pointe du réseau électrique Réseau
Puissance nominale installée
Classe d'appareils
Puissance réelle
Pointeconcomitanteavec le réseau
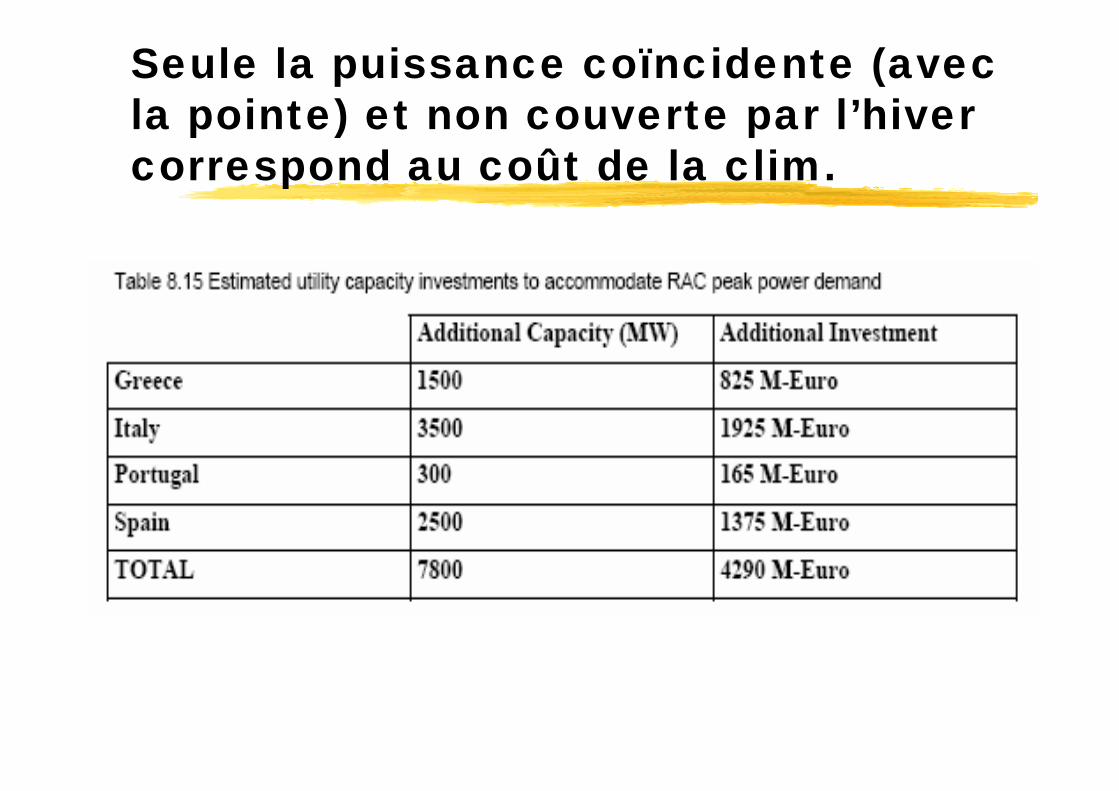
Seule la puissance coïncidente (avec la pointe) et non couverte par l’hiver correspond au coût de la clim.
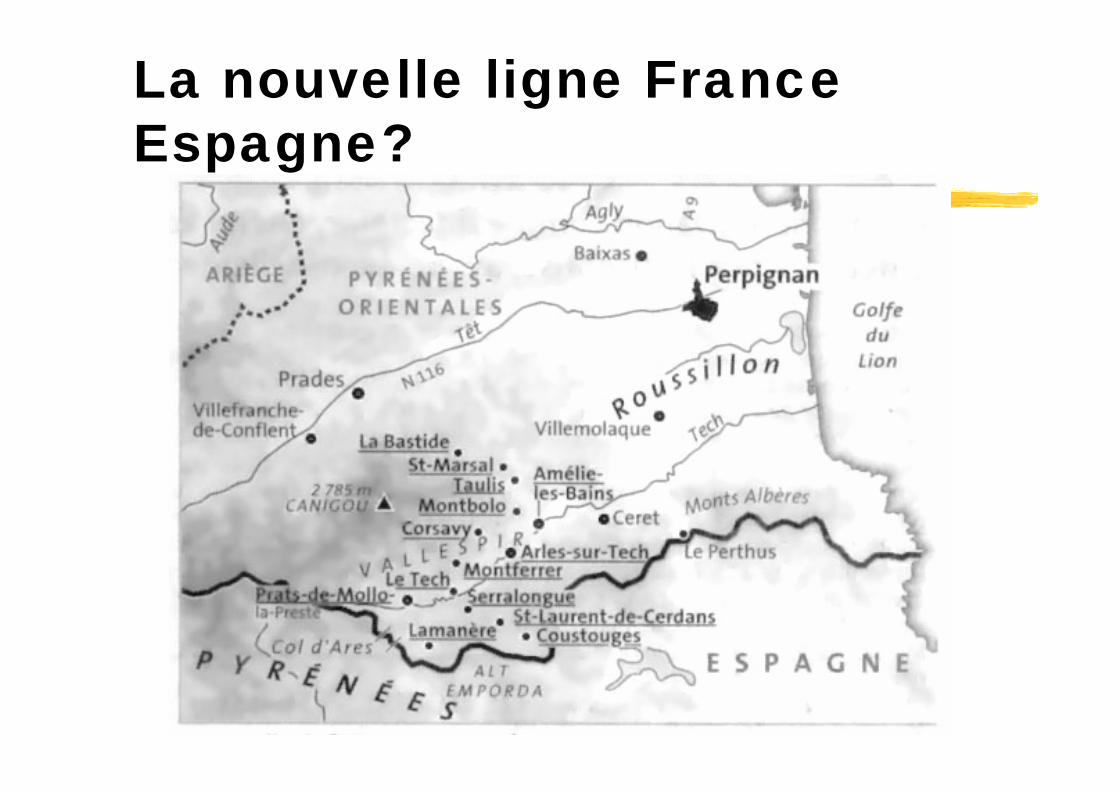
La nouvelle ligne France Espagne?
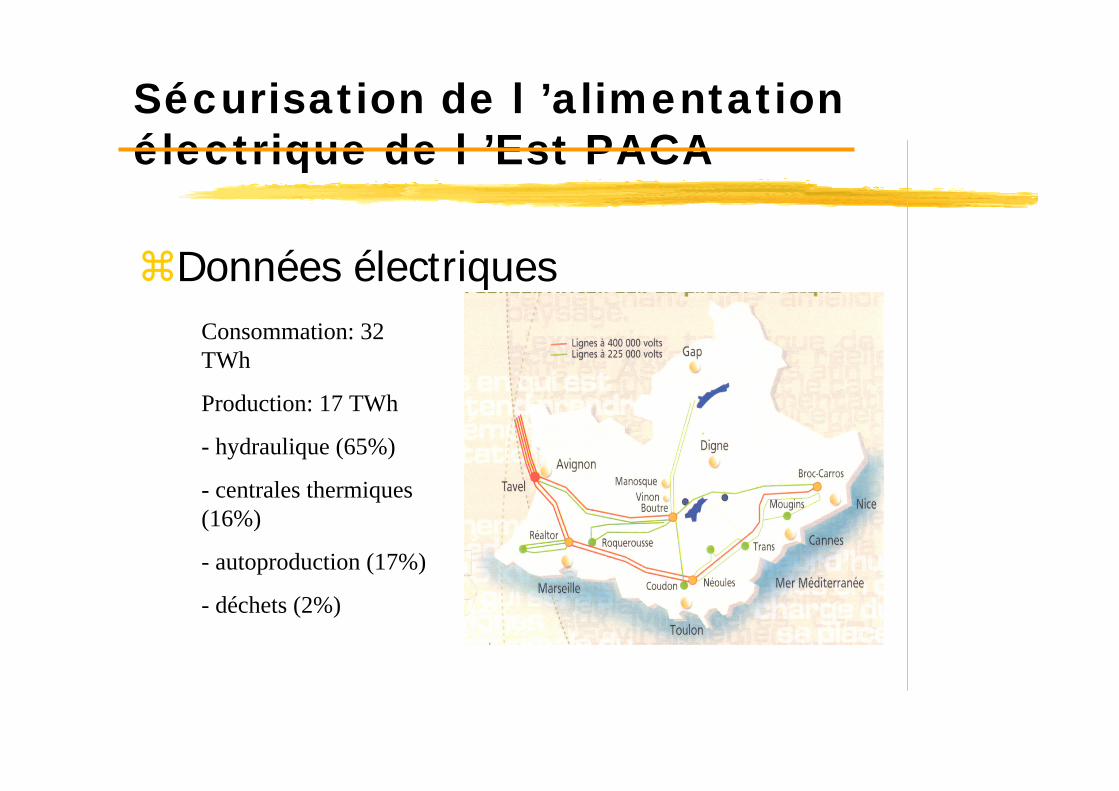
Sécurisation de l ’alimentation électrique de l ’Est PACA
Données électriquesConsommation: 32 TWh
Production: 17 TWh
- hydraulique (65%)
- centrales thermiques (16%)
- autoproduction (17%)
- déchets (2%)
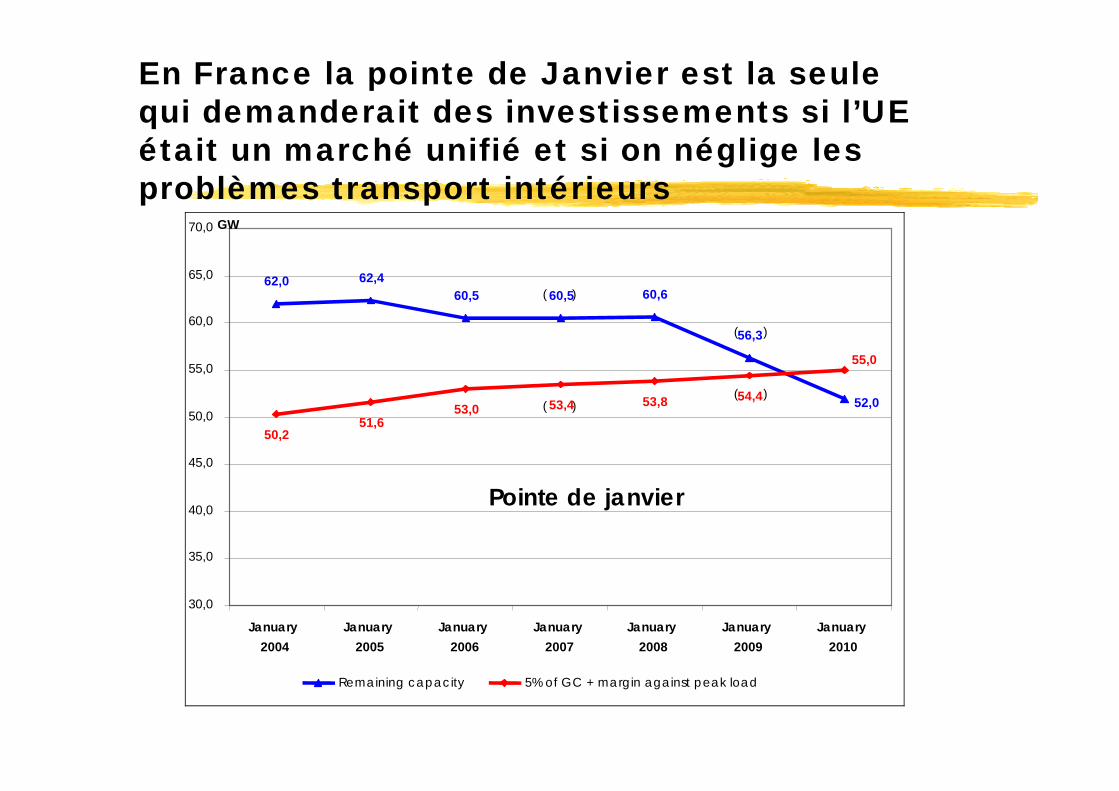
En France la pointe de Janvier est la seule qui demanderait des investissements si l’UE était un marché unifié et si on néglige les problèmes transport intérieurs
62,460,5 60,5 60,6
56,3
51,653,0 53,4 53,8 54,4 52,0
62,0
55,0
50,2
30,0
35,0
40,0
45,0
50,0
55,0
60,0
65,0
70,0
January2004
January2005
January2006
January2007
January2008
January2009
January2010
GW
Remaining capacity 5% of GC + margin against peak load
Pointe de janvier
( )
( )
( )( )
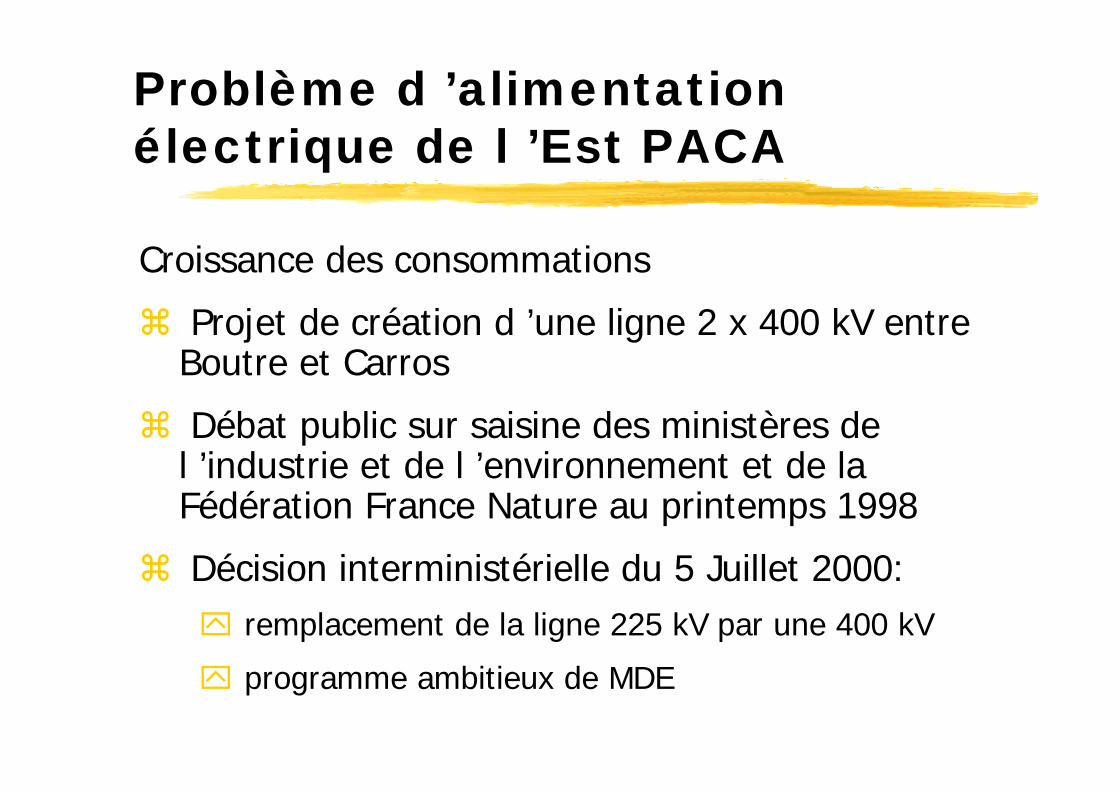
Problème d ’alimentation électrique de l ’Est PACA
Croissance des consommations
Projet de création d ’une ligne 2 x 400 kV entre Boutre et Carros
Débat public sur saisine des ministères de l ’industrie et de l ’environnement et de la Fédération France Nature au printemps 1998
Décision interministérielle du 5 Juillet 2000:remplacement de la ligne 225 kV par une 400 kV
programme ambitieux de MDE
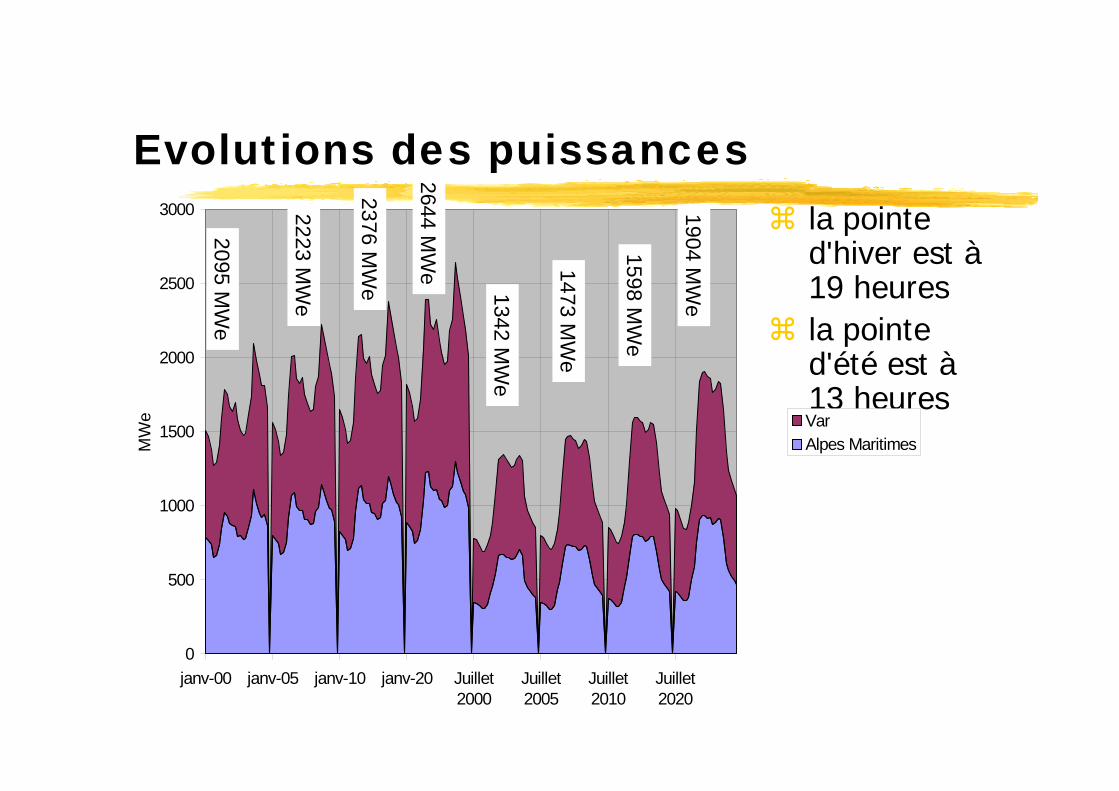
Evolutions des puissancesla pointe d'hiver est à19 heuresla pointe d'été est à13 heures
0
500
1000
1500
2000
2500
3000
janv-00 janv-05 janv-10 janv-20 Juillet2000
Juillet2005
Juillet2010
Juillet2020
MW
e VarAlpes Maritimes
2095M
We
2223M
We
2376M
We
2644M
We
1342M
We
1473M
We
1598M
We
1904M
We
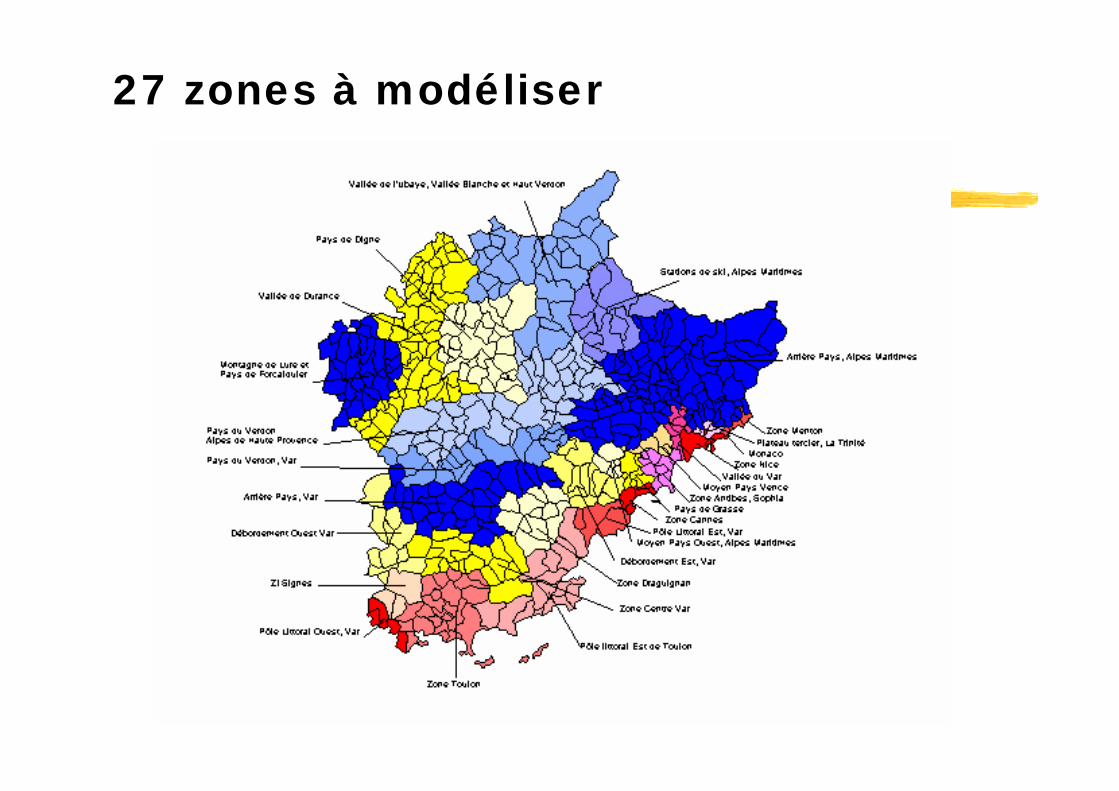
27 zones à modéliser
AVIGNON
TOULON
DIGNE
NICE
GAP
MARSEILLE
CANNES
TAVEL
REALTOR
NEOULES
TRANS
MOUGINS
LE BROC CARROS
BOUTRE
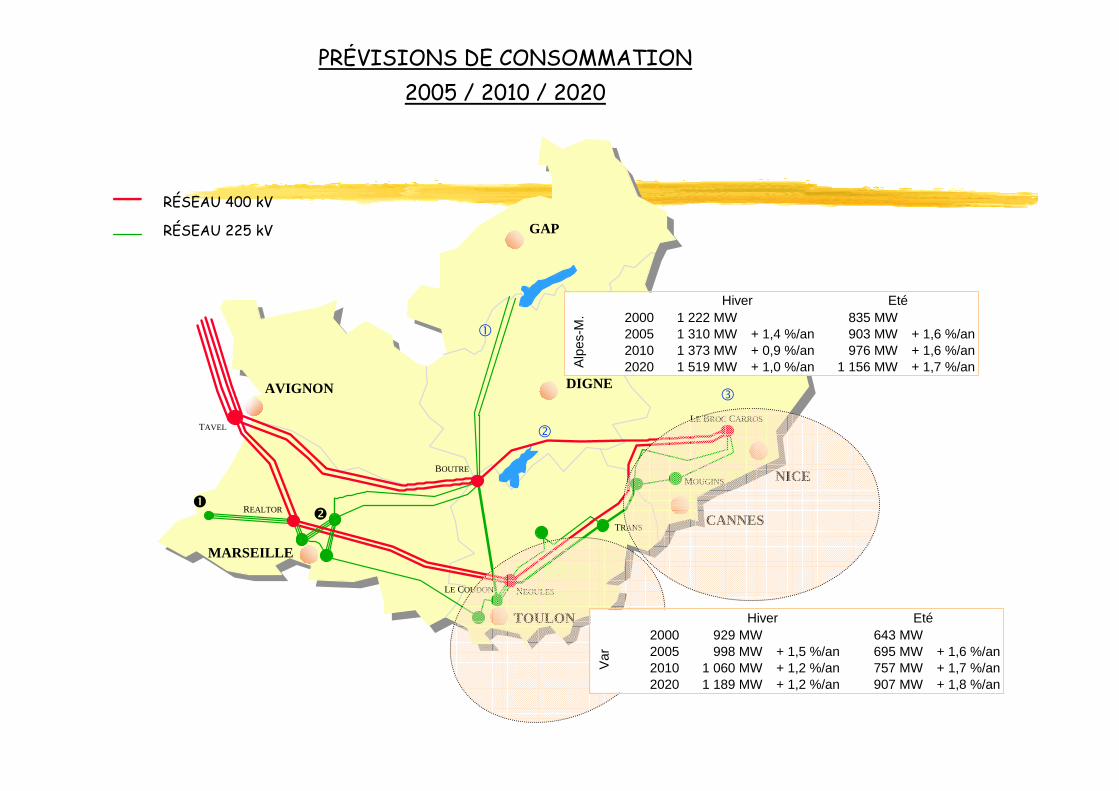
RÉSEAU 400 kV
RÉSEAU 225 kV
LE COUDON
PRÉVISIONS DE CONSOMMATION2005 / 2010 / 2020
2000 1 222 MW 835 MW2005 1 310 MW + 1,4 %/an 903 MW + 1,6 %/an2010 1 373 MW + 0,9 %/an 976 MW + 1,6 %/an2020 1 519 MW + 1,0 %/an 1 156 MW + 1,7 %/an
Hiver Eté
Alp
es-M
.
2000 929 MW 643 MW2005 998 MW + 1,5 %/an 695 MW + 1,6 %/an2010 1 060 MW + 1,2 %/an 757 MW + 1,7 %/an2020 1 189 MW + 1,2 %/an 907 MW + 1,8 %/an
Hiver EtéV
ar
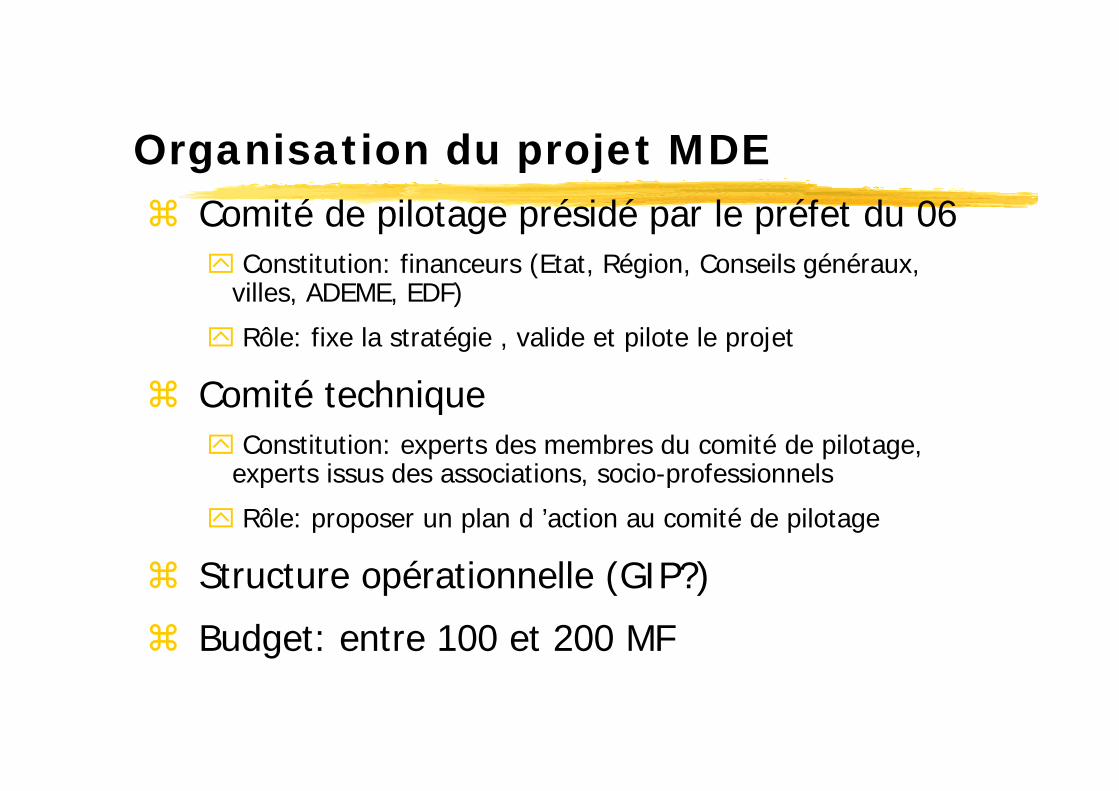
Organisation du projet MDEComité de pilotage présidé par le préfet du 06
Constitution: financeurs (Etat, Région, Conseils généraux, villes, ADEME, EDF)
Rôle: fixe la stratégie , valide et pilote le projet
Comité techniqueConstitution: experts des membres du comité de pilotage,
experts issus des associations, socio-professionnels
Rôle: proposer un plan d ’action au comité de pilotage
Structure opérationnelle (GIP?)
Budget: entre 100 et 200 MF
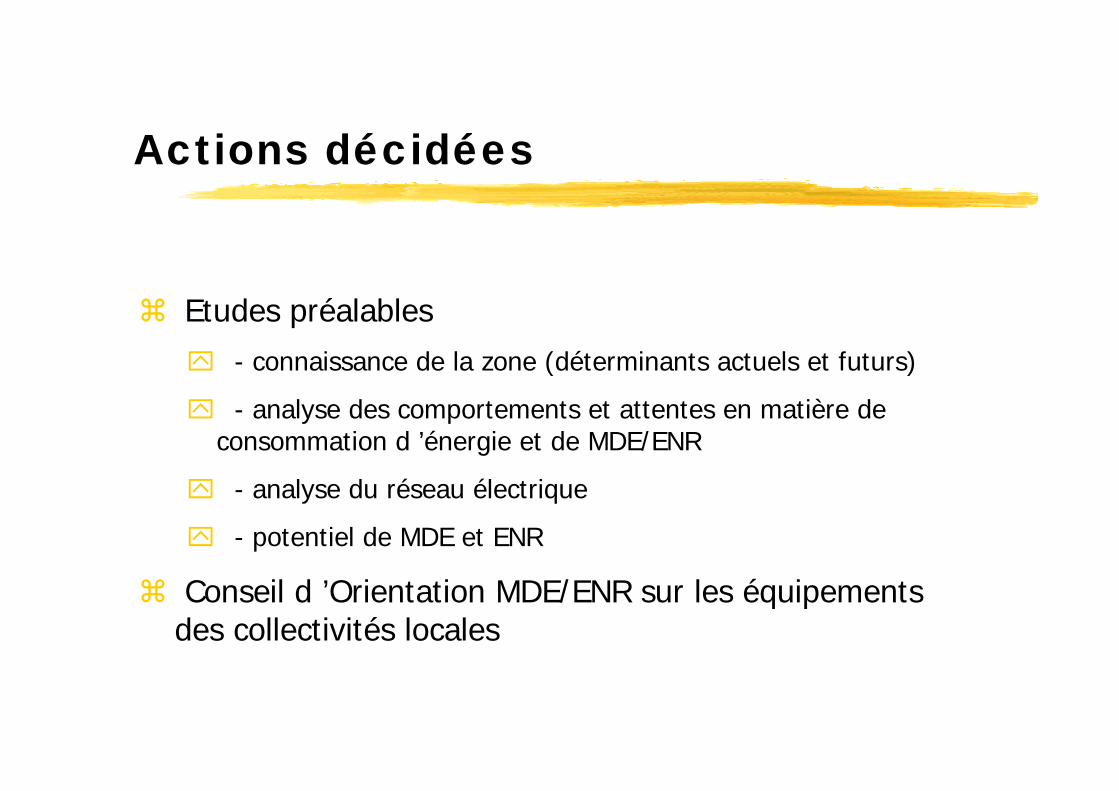
Actions décidées
Etudes préalables- connaissance de la zone (déterminants actuels et futurs)
- analyse des comportements et attentes en matière de consommation d ’énergie et de MDE/ENR
- analyse du réseau électrique
- potentiel de MDE et ENR
Conseil d ’Orientation MDE/ENR sur les équipements des collectivités locales
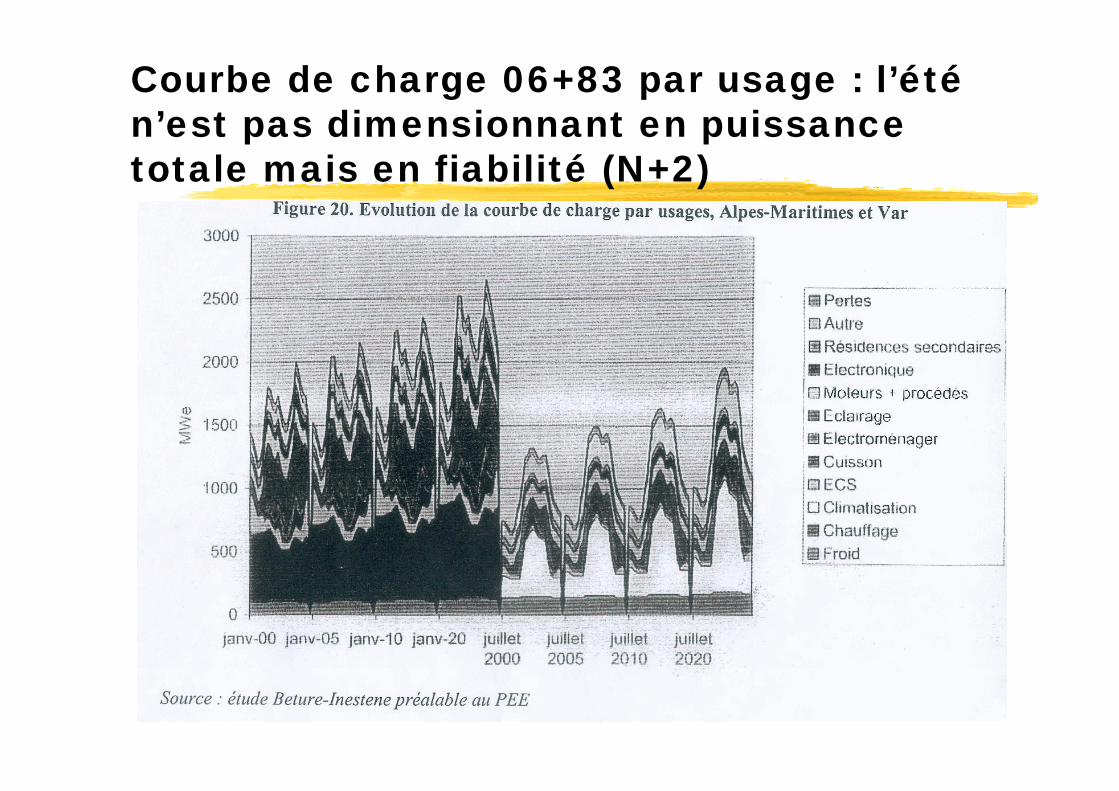
Courbe de charge 06+83 par usage : l’étén’est pas dimensionnant en puissance totale mais en fiabilité (N+2)
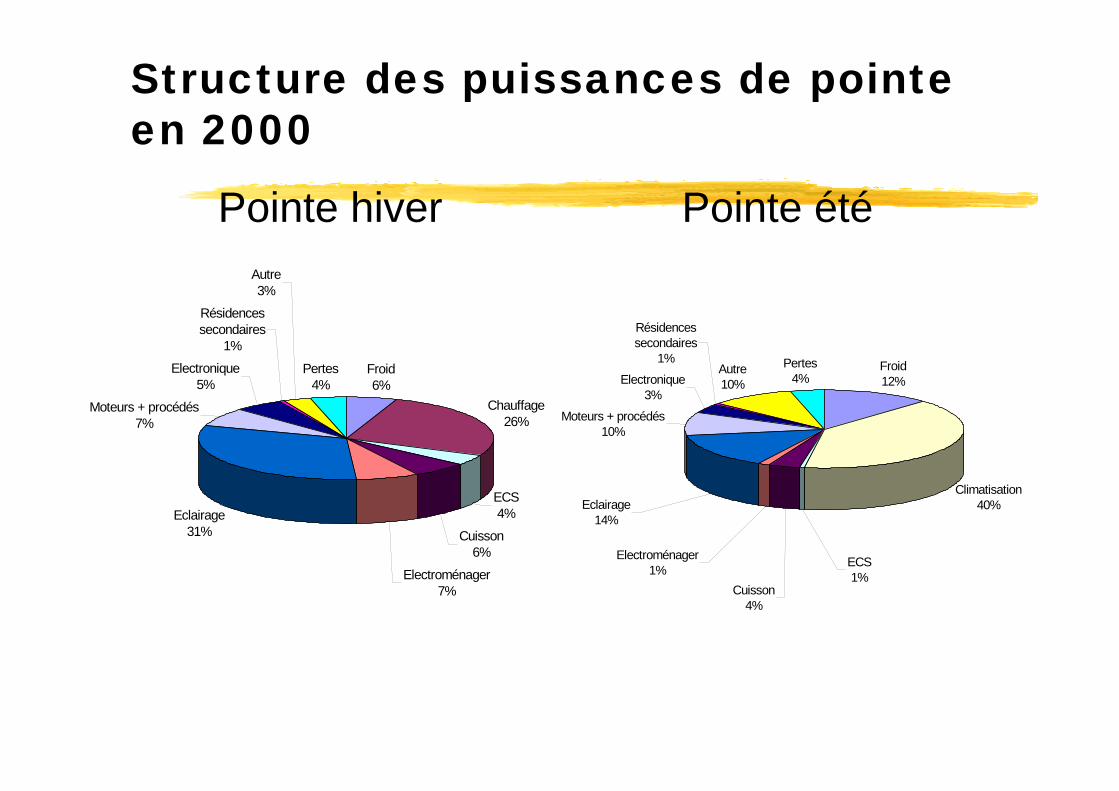
Structure des puissances de pointe en 2000
Pointe hiver Pointe été
Froid6%
Chauffage26%
ECS4%
Cuisson6%
Electroménager7%
Eclairage31%
Moteurs + procédés7%
Electronique5%
Résidences secondaires
1%
Autre3%
Pertes4%
Froid12%
Climatisation40%
Moteurs + procédés10%
Electronique3%
Résidences secondaires
1%Autre10%
Pertes4%
ECS1%
Cuisson4%
Electroménager1%
Eclairage14%
AVIGNON
TOULON
DIGNE
NICE
GAP
MARSEILLE
CANNES
TAVEL
REALTOR
NEOULES
TRANS
MOUGINS
LE BROC CARROS
BOUTRE
RÉSEAU 400 kV
RÉSEAU 225 kV
LE COUDON
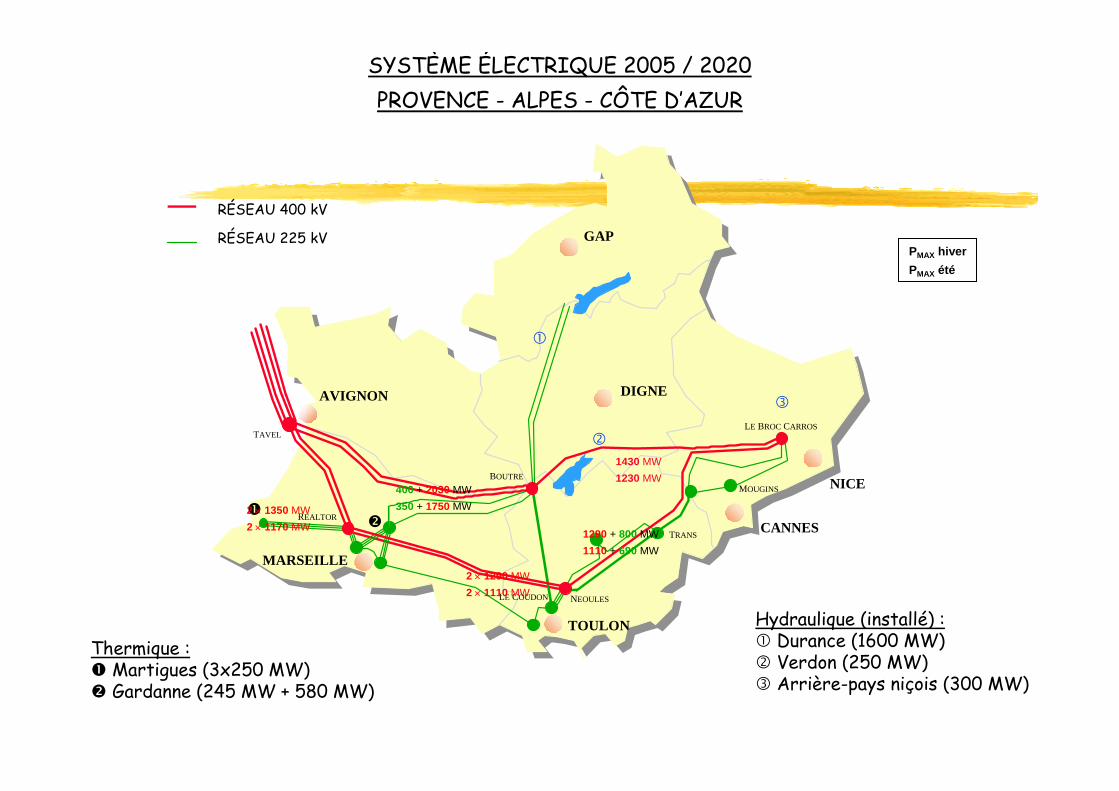
SYSTÈME ÉLECTRIQUE 2005 / 2020PROVENCE - ALPES - CÔTE D’AZUR
2 × 1350 MW2 × 1170 MW
2 × 1290 MW2 × 1110 MW
400 + 2030 MW350 + 1750 MW
1290 + 800 MW1110 + 690 MW
1430 MW1230 MW
PMAX hiverPMAX été
Thermique : Martigues (3x250 MW) Gardanne (245 MW + 580 MW)
Hydraulique (installé) : Durance (1600 MW) Verdon (250 MW) Arrière-pays niçois (300 MW)
AVIGNON
TOULON
DIGNE
NICE
GAP
MARSEILLE
CANNES
TAVEL
REALTOR
NEOULES
TRANS
MOUGINS
LE BROC CARROS
BOUTRE
RÉSEAU 400 kV
RÉSEAU 225 kV
LE COUDON
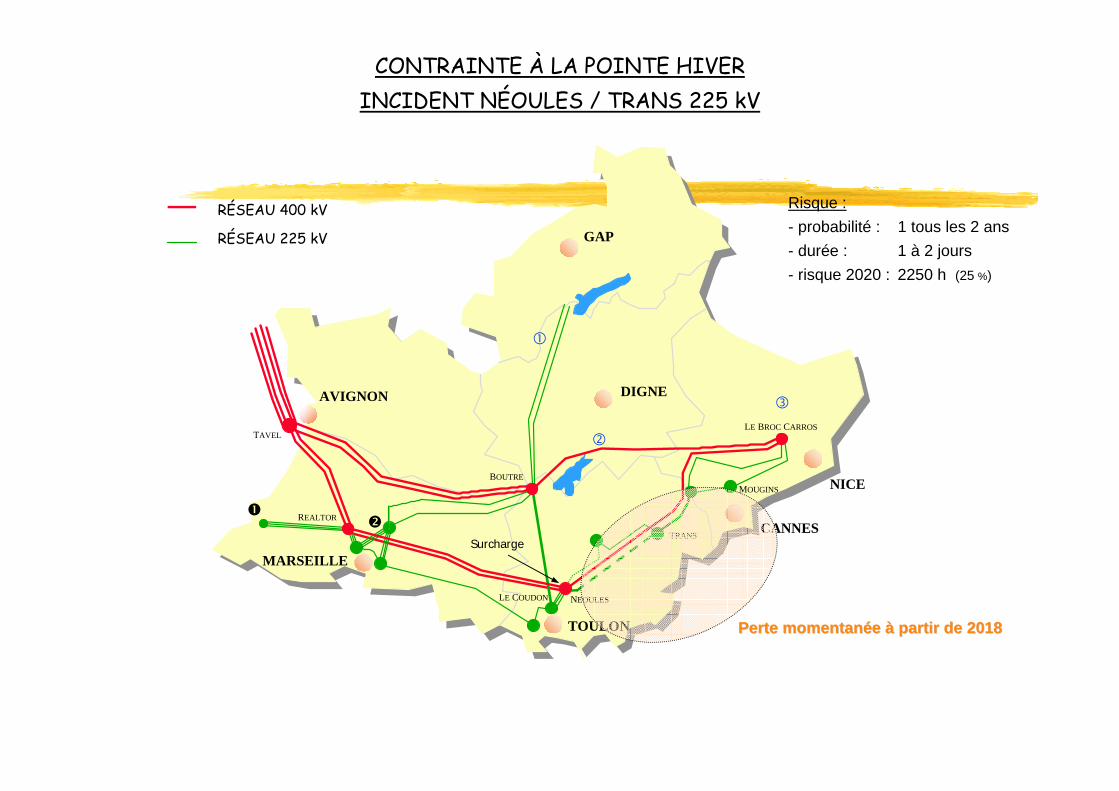
CONTRAINTE À LA POINTE HIVERINCIDENT NÉOULES / TRANS 225 kV
Risque :- probabilité : 1 tous les 2 ans- durée : 1 à 2 jours- risque 2020 : 2250 h (25 %)
Surcharge
Perte momentanPerte momentanéée e àà partir de 2018partir de 2018
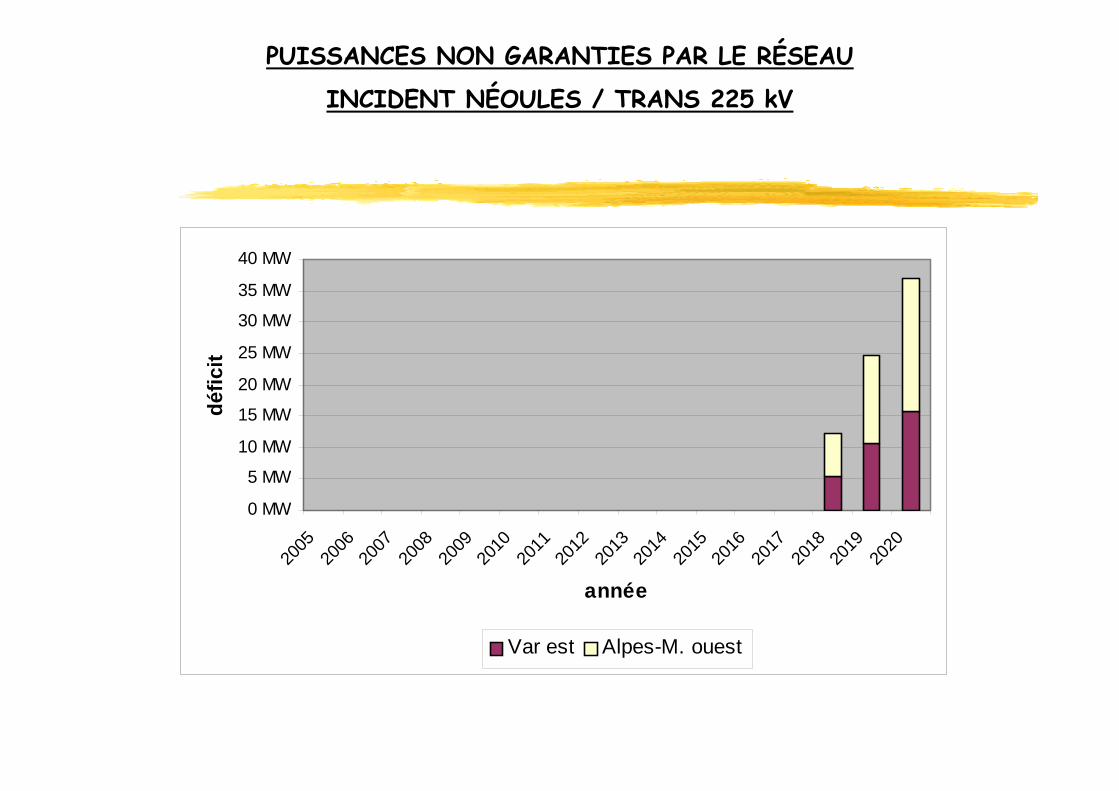
PUISSANCES NON GARANTIES PAR LE RÉSEAU
INCIDENT NÉOULES / TRANS 225 kV
0 MW
5 MW
10 MW
15 MW
20 MW
25 MW
30 MW
35 MW
40 MW
2005
2006
2007
2008
2009
2010
2011
2012
2013
2014
2015
2016
2017
2018
2019
2020
année
défic
it
Var est Alpes-M. ouest
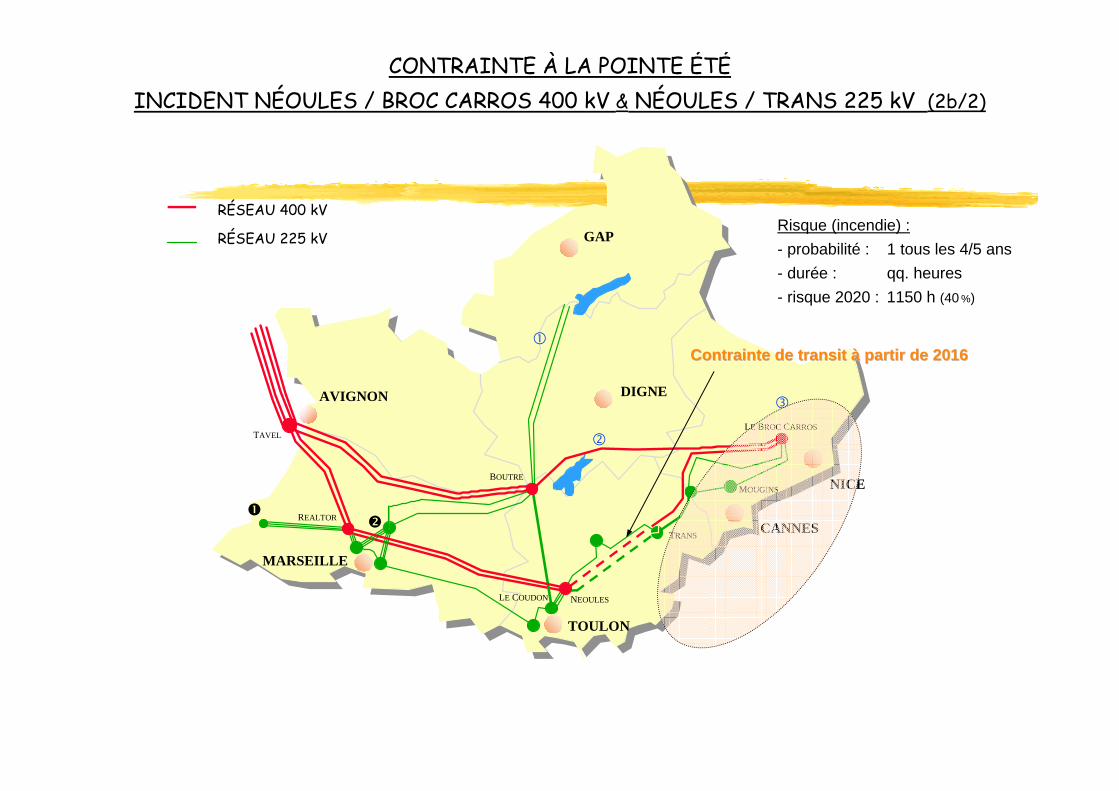
Risque (incendie) :- probabilité : 1 tous les 4/5 ans- durée : qq. heures- risque 2020 : 1150 h (40 %)
AVIGNON
TOULON
DIGNE
NICE
GAP
MARSEILLE
CANNES
TAVEL
REALTOR
NEOULES
TRANS
MOUGINS
LE BROC CARROS
BOUTRE
RÉSEAU 400 kV
RÉSEAU 225 kV
LE COUDON
CONTRAINTE À LA POINTE ÉTÉINCIDENT NÉOULES / BROC CARROS 400 kV & NÉOULES / TRANS 225 kV (2b/2)
Contrainte de transit Contrainte de transit àà partir de 2016partir de 2016
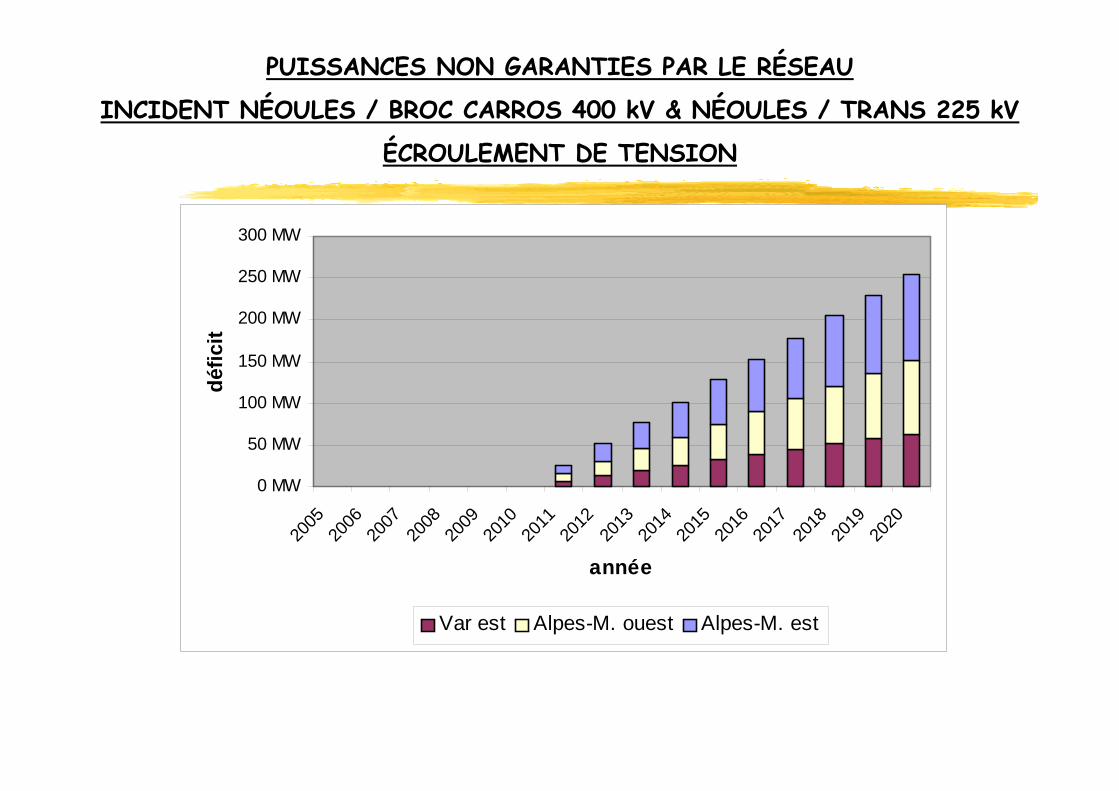
PUISSANCES NON GARANTIES PAR LE RÉSEAU
INCIDENT NÉOULES / BROC CARROS 400 kV & NÉOULES / TRANS 225 kV
ÉCROULEMENT DE TENSION
0 MW
50 MW
100 MW
150 MW
200 MW
250 MW
300 MW
2005
2006
2007
2008
2009
2010
2011
2012
2013
2014
2015
2016
2017
2018
2019
2020
année
défic
it
Var est Alpes-M. ouest Alpes-M. est
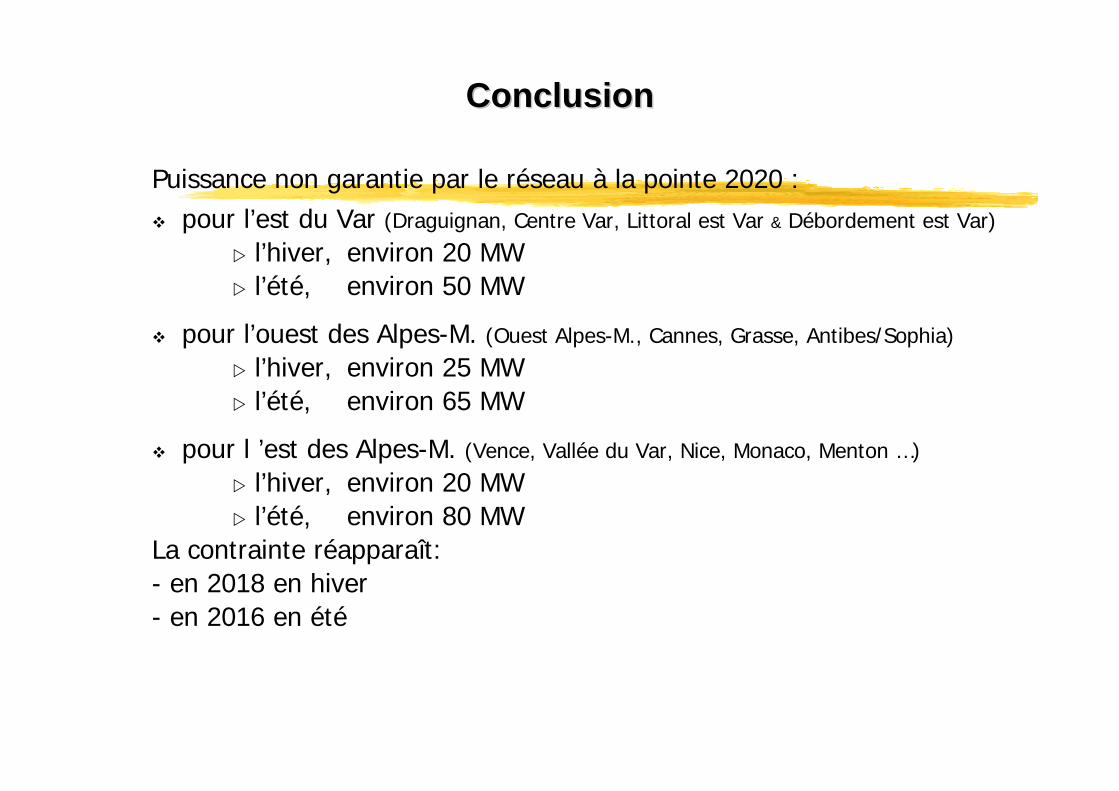
ConclusionConclusion
Puissance non garantie par le réseau à la pointe 2020 :pour l’est du Var (Draguignan, Centre Var, Littoral est Var & Débordement est Var)
l’hiver, environ 20 MWl’été, environ 50 MW
pour l’ouest des Alpes-M. (Ouest Alpes-M., Cannes, Grasse, Antibes/Sophia)
l’hiver, environ 25 MWl’été, environ 65 MW
pour l ’est des Alpes-M. (Vence, Vallée du Var, Nice, Monaco, Menton …)
l’hiver, environ 20 MWl’été, environ 80 MW
La contrainte réapparaît:- en 2018 en hiver- en 2016 en été
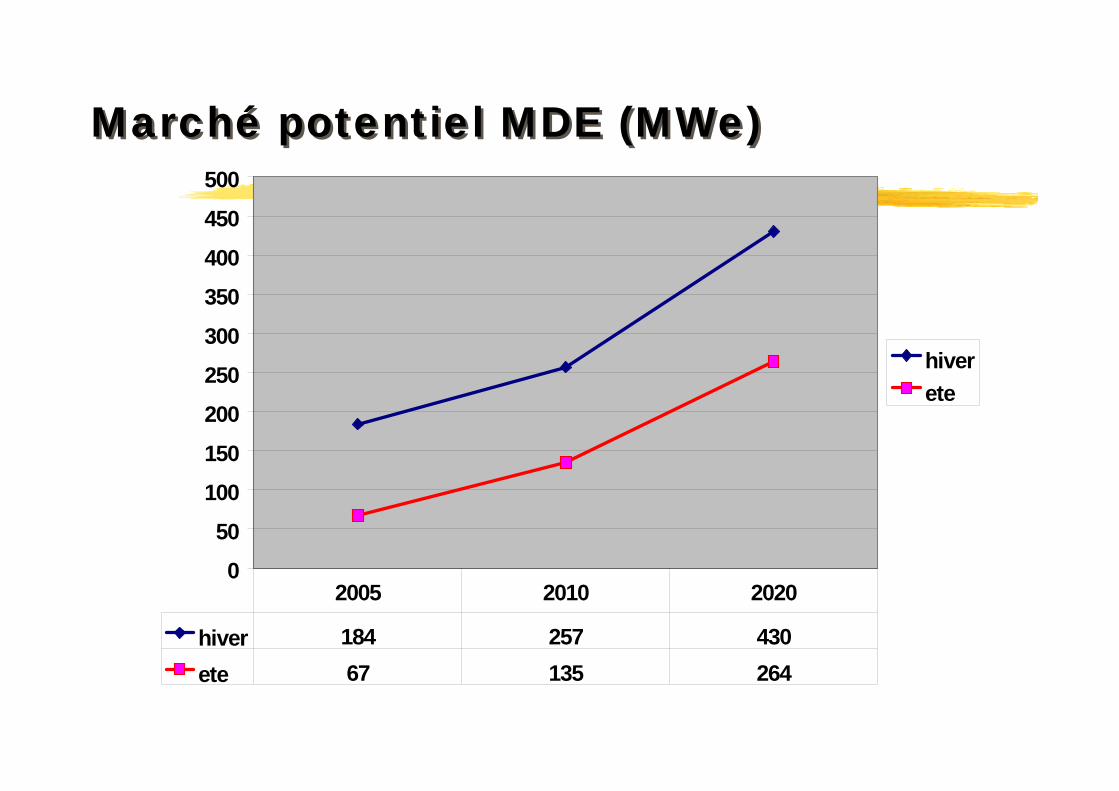
Marché potentiel MDE (MWe)Marché potentiel MDE (MWe)
0
50
100
150
200
250
300
350
400
450
500
hiverete
hiver 184 257 430ete 67 135 264
2005 2010 2020

Marché potentiel accessible PDE et EnR
POTENTIEL ACCESSIBLE
0 MWe
50 MWe
100 MWe
150 MWe
200 MWe
250 MWe
2 005 2 010 2020
HIVERETE
23 MWe53 MWe 53 MWe
191 MWe
122 MWe
45 MWe
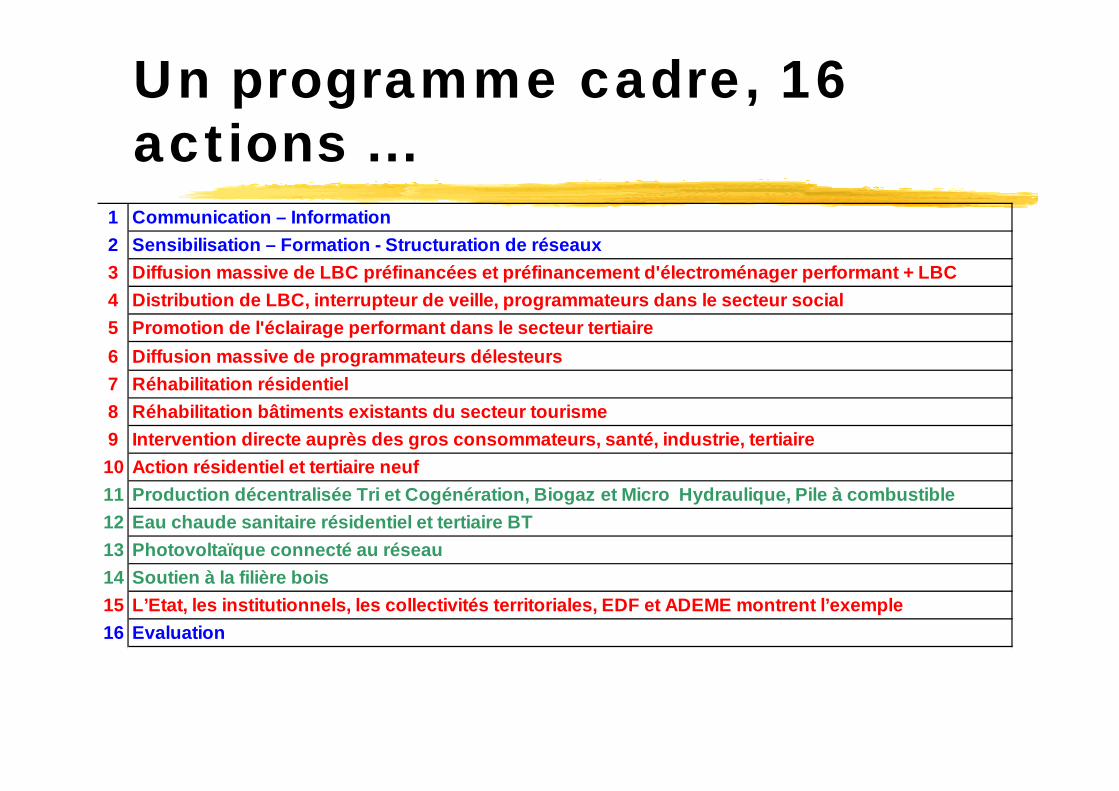
Un programme cadre, 16 actions ...
1 Communication – Information 2 Sensibilisation – Formation - Structuration de réseaux3 Diffusion massive de LBC préfinancées et préfinancement d'électroménager performant + LBC4 Distribution de LBC, interrupteur de veille, programmateurs dans le secteur social5 Promotion de l'éclairage performant dans le secteur tertiaire6 Diffusion massive de programmateurs délesteurs7 Réhabilitation résidentiel8 Réhabilitation bâtiments existants du secteur tourisme9 Intervention directe auprès des gros consommateurs, santé, industrie, tertiaire10 Action résidentiel et tertiaire neuf11 Production décentralisée Tri et Cogénération, Biogaz et Micro Hydraulique, Pile à combustible12 Eau chaude sanitaire résidentiel et tertiaire BT13 Photovoltaïque connecté au réseau14 Soutien à la filière bois15 L’Etat, les institutionnels, les collectivités territoriales, EDF et ADEME montrent l’exemple16 Evaluation
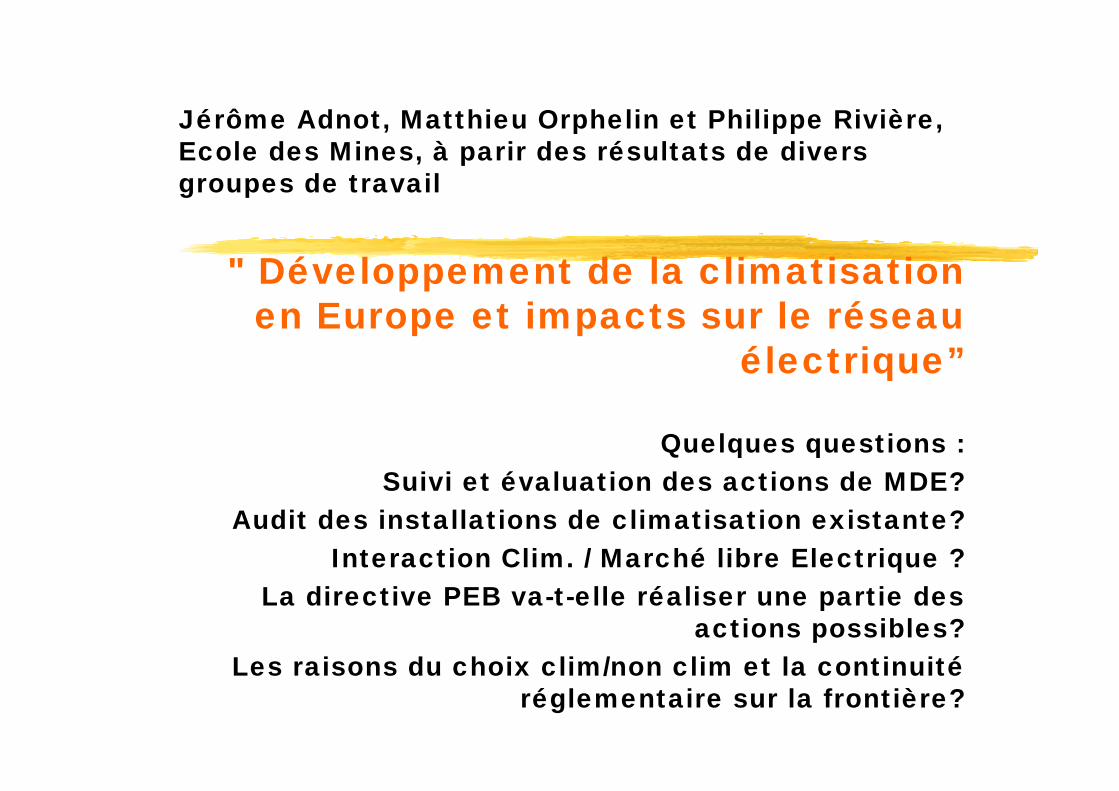
Jérôme Adnot, Matthieu Orphelin et Philippe Rivière, Ecole des Mines, à parir des résultats de divers groupes de travail
" Développement de la climatisationen Europe et impacts sur le réseau
électrique”
Quelques questions :Suivi et évaluation des actions de MDE?
Audit des installations de climatisation existante?Interaction Clim. / Marché libre Electrique ?
La directive PEB va-t-elle réaliser une partie des actions possibles?
Les raisons du choix clim/non clim et la continuitéréglementaire sur la frontière?