
S. Domas Système dExploitation Création/exécution de processus 1ère annéeIUT Belfort-Montbéliard.
Élaboration, caractérisation et propriétés de stockage d’hydrogène
électrochimique des alliages Mg2Ni1–xMnx (x = 0, 0.125, 0.25, 0.375) et
Mg2–xAlxNi (x = 0, 0.25) + 5 wt.% MWCNTs préparés par
mécanosynthèse
Thèse N° 173 Année 2012
Ecole doctorale "Science Pour l’Ingénieur et Microtechniques² Université de Technologie de Belfort-Montbéliard
THÈSE Présentée pour obtenir le grade de
Docteur de l’Université de Technologie de Belfort-Montbéliard en Matériaux
Par
Liwu HUANG
Soutenance publique le 26 janvier 2012
Jury : Monsieur Dominique PERREUX, Professeur des Universités, Université de Franche-Comté,
Président du jury
Monsieur Salim-Mourad CHERIF, Professeur des Universités, Université Paris 13,
Rapporteur
Monsieur Mieczyslaw JURCZYK, Professeur des Universités, Université de technologie de
Poznan (Pologne), Rapporteur
Monsieur Omar EL KEDIM, Maître de conférences HDR, Université de Technologie de
Belfort-Montbéliard, Directeur de thèse
Monsieur Daniel HISSEL, Professeur des Universités, Université de Franche-Comté,
Examinateur
Monsieur David BASSIR, Maître de conférences HDR, Ministère des Affaires Etrangères et
Européennes, Consulat de France – Canton (Chine), Examinateur

Remerciements
Ce travail a été effectué au sein du département Micro-Nano-Sciences &
Systèmes de l’Institut de FEMTO-ST de Université de Technologie de Belfort-Montbéliard dans le cadre du programme UT-INSA-China Scholarship Council.
Je tiens tout d’abord à remercier Monsieur Omar EL KEDIM, directeur de
cette thèse, pour m’avoir guidé lors de cette étude avec efficacité. Je le remercie pour sa disponibilité, sa patience et ses précieux conseils tout au long de ce travail de thèse.
Je voudrais également adresser mes remerciements à Monsieur Salim-
Mourad CHERIF et à Monsieur Mieczyslaw JURCZYK qui ont bien voulu donner de leur temps en étant rapporteurs de ce mémoire.
Je remercie Monsieur Dominique PERREUX pour présider le jury de cette
thèse. Je souhaite aussi remercier Monsieur David BASSIR et Monsieur Daniel HISSEL de m’avoir fait l’honneur de faire partie de mon jury de thèse.
Je remercie Madame Virginie MOUTARLIER, Monsieur Olivier
RAPAUD et Monsieur Rémi Chassagnon respectivement pour leur aide lors des analyses de diffraction des rayons X, en microscopie électronique à balayage et en microscopie électronique en transmission.
Je remercie aussi Monsieur Marek Nowak et Monsieur Maciej Jarzebski pour leur aide pour les mesures des propriétés électrochimiques. Enfin, je tiens particulièrement à exprimer ma profonde reconnaissance à mon père, ma mère, ma sœur, ma femme et ma fille pour leur soutien et leurs encouragements.

I
SOMMAIRE
INTRODUCTION GÉNÉRALE............................................................................................................................. 1
I. GÉNÉRALITÉS SUR LES MATÉRIAUX DE STOCKAGE D’HYDROGÈNE .............................................. 4
I.1. Stockage de l’hydrogène ........................................................................................................................... 4
I.1.1. Le stockage sous pression .............................................................................................................. 5
I.1.2. Le stockage liquide ........................................................................................................................ 6
I.1.3. Le stockage solide .......................................................................................................................... 7
I.2. Le système métal-hydrogène .................................................................................................................... 8
I.3. Les propriétés thermodynamiques des systèmes intermétalliques Métal-Hydrogène ............................... 9
I.3.1. Synthèse des hydrures .................................................................................................................... 9
I.3.2. Courbes isothermes PCT .............................................................................................................. 10
I.3.2.1. Comportement idéal .......................................................................................................... 10
I.3.2.2. Comportement réel ............................................................................................................ 13
I.4. Le système binaire Mg-Ni ...................................................................................................................... 14
I.4.1. Le magnésium .............................................................................................................................. 14
I.4.2. Le nickel ...................................................................................................................................... 15
I.4.3. Le diagramme de phases Mg-Ni ................................................................................................. 15
I.5. Propriétés structurales ............................................................................................................................. 16
I.6. Propriétés d’hydrogénation ..................................................................................................................... 16
I.7 Les accumulateurs Nickel Métal-Hydrure (Ni-MH) ................................................................................ 17
I.7.1 Généralités .................................................................................................................................... 17
I.7.2. Performances des accumulateurs ................................................................................................. 21
I.8. Revue bibliographique sur les effets de substitution de Mg et Ni par d’autres éléments dans le cas de l’alliage Mg2Ni .............................................................................................................................................. 22
II. LES TECHNIQUES EXPÉRIMENTALES ET THÉORIE DE LA FONCTIONNELLE DE LA DENSITÉ . 24
II.1. Méthode d’élaboration: la mécanosynthèse ........................................................................................... 24
II.1.1. Principe ....................................................................................................................................... 24
II.1.2. Conditions d’élaboration ............................................................................................................ 26
II.1.3. Cas des alliages Mg2Ni1−xMnx (x = 0, 0.125, 0.25, 0.375) ......................................................... 27
II
II.1.4. Cas des alliages Mg2−xAlxNi (x = 0, 0.25) avec ou sans 5% en masse de nanotubes de carbone multiparois (MWCNTs) ........................................................................................................................ 27
II.2. Méthodes de caractérisation .................................................................................................................. 28
II.2.1. Diffraction des rayons X ............................................................................................................. 28
II.2.2. Méthode d’analyse des profils des raies ..................................................................................... 28
II.2.3. Microscopie électronique à balayage .......................................................................................... 29
II.2.4. Microscopie électronique en transmission .................................................................................. 29
II.3. Les mesures électrochimiques ............................................................................................................... 29
II.4. Théorie de la fonctionnelle de la densité ............................................................................................... 30
III. RESULTATS EXPÉRIMENTAUX ET DISCUSSION ................................................................................. 35
III.1. Cas des alliages Mg2Ni1−xMnx (x = 0, 0.125, 0.25, 0.375) obtenus par mécanosynthèse ..................... 35
III.1.1. Etude structurale et morphologique ........................................................................................... 35
III.1.2. Caractérisations des propriétés de stockage d’hydrogène ......................................................... 41
III.1.3. Calcul des enthalpies de formation et analyse des structures électroniques par CASTEP ........ 45
III.1.3.1. Les enthalpies de formation ............................................................................................ 45
III.1.3.2. Les structures électroniques ........................................................................................... 47
III.2. Cas des alliages Mg2−xAlxNi (x = 0, 0.25) avec ou sans 5% en masse de nanotubes de carbone multiparois (5 wt. % MWCNTs) obtenus par mécanosynthèse .................................................................... 51
III.2.1. Etude structurale et morphologique ........................................................................................... 51
III.2.2. Caractérisations des propriétés de stockage d’hydrogène ......................................................... 55
IV. CONCLUSION GÉNÉRALE ET PERSEPECTIVES ................................................................................... 58
BIBLIOGRAPHIE ................................................................................................................................................ 62
ANNEXE 1 ........................................................................................................................................................... 64
ANNEXE 2 ........................................................................................................................................................... 65
ANNEXE 3 ........................................................................................................................................................... 66
ANNEXE 4 ........................................................................................................................................................... 67
ANNEXE 5 ........................................................................................................................................................... 68

INTRODUCTION GÉNÉRALE

1
INTRODUCTION GÉNÉRALE
L’électricité est une forme d’énergie très pratique à utiliser, mais plutôt difficile
à stocker en raison du manque de matériaux adéquats. Au niveau international,
la diminution des énergies combustibles fossiles (charbon, pétrole, gaz) d’une
part et l’utilisation des énergies renouvelables (hydraulique, biomasse, solaire,
éolien, géothermie et marée motrice) d’autre part, stimulent la recherche de
nouvelles technologies plus respectueuses de l’environnement et ouvrent la voie
au développement de systèmes de stockage de l’électricité plus efficaces (piles à
combustible et accumulateurs). Ces technologies nécessitent le développement
de nouveaux matériaux, mieux adaptés aux fonctions recherchées, et font appel
à des solutions totalement innovatrices, en particulier pour augmenter les
performances et faire baisser les coûts.
La perspective du marché automobile (véhicules tout électrique ou
hybrides) associée au développement des nouvelles technologies, ainsi que
l’avènement des ordinateurs portables, des téléphones cellulaires, des
caméscopes, des appareils photos numériques et des appareils médicaux ou
industriels, ont entraîné la demande croissante d’une source d’alimentation
fiable, puissante, à forte autonomie et rechargeable. Cette demande fut
accompagnée, au cours des années, d’une modification importante des types
d’accumulateurs utilisés.
Au début des années quatre-vingt-dix, principalement sous l’impulsion des
constructeurs japonais d’équipement portables (caméscopes, ordinateurs,
téléphones) et avec la croissance du marché de ces équipements, une nouvelle
technologie moins polluante (accumulateur nickel-hydrure métallique,
symbolisé Ni-MH) a émergé. Ces accumulateurs Ni-MH sont une alternative
aux accumulateurs NiCd car ils ont une densité volumique supérieure de 25% et
ne sont pas polluants pour l’environnement. Dans les accumulateurs NiMH, la
matière active de l’électrode négative est un composé intermétallique qui
absorbe l’hydrogène de façon réversible dans un domaine de pression et de
température proche de l’ambiante.
L’hydrogène est l’un des éléments les plus abondants sur terre et sa
combustion dans l’oxygène fournit une quantité de chaleur plus importante que
les sources énergétiques conventionnelles. Par ailleurs, l’absence de carbone
2
permet d’éviter toute émission de CO2 ce qui fait de l’hydrogène un vecteur
d’énergie propre, renouvelable et hautement énergétique. Utilisable dans les
Piles à Combustible, les moteurs à combustion interne ou encore les batteries
Ni-MH, l’hydrogène a toutefois deux sérieux inconvénients qui doivent être
résolus : la production en masse et le stockage.
Mon travail a concerné la problématique du stockage. Il s’effectue de nos
jours (i) sous forme gazeuse (sous forte pression dans des bouteilles lourdes et
volumineuses) ou (ii) sous forme liquide (impliquant des procédés coûteux de
liquéfaction, un faible rendement énergétique, et un phénomène gênant
d’évaporation ou boil-off). Dans ces deux cas, le stockage reste très dangereux,
l’hydrogène gazeux étant hautement explosif en présence d’air (limite
d’explosivité : 13 % en volume). Pour pallier ces inconvénients, le stockage à
l’état solide est à l’étude depuis une quarantaine d’années. Certains matériaux
sont susceptibles de réagir réversiblement avec l’hydrogène (i.e. la dangerosité
est alors quasi nulle) et présentent des densités en hydrogène intéressantes (très
bonnes capacités volumiques).
Les hydrures métalliques qui font l’objet de cette étude présentent des
caractéristiques cinétiques et thermodynamiques compatibles avec de
nombreuses applications pratiques.
Par ailleurs, du fait de leur grande capacité d’absorption de l’hydrogène
(jusqu’à 7,6 wt. %), le magnésium et les alliages à base de magnésium sont
considérés comme de bons candidats pour des applications de stockage de
l’hydrogène, d’autant plus que le magnésium est un élément abondant et
relativement bon marché. Cependant, les hydrures de composés à base de
magnésium présentent des problèmes pratiques, puisque le magnésium ne réagit
pas avec l’hydrogène à température ambiante, et la réaction d’hydrogénation est
lente (plusieurs heures) à plus haute température. De plus, les grandeurs
thermodynamiques d’hydrogénation du magnésium impliquent que la
température d’équilibre est d’environ 280 °C pour une pression de plateau de 1
bar.
Parmi les différentes méthodes qui permettent d’améliorer les propriétés de
stockage d’hydrogène de l’intermétallique Mg2Ni: la substitution partielle des
éléments et la mécanosynthèse.
Les alliages Mg2Ni avec substitution du nickel et/ou du magnésium par
3
d’autres éléments chimiques tels que Mn, Al, Ti…, obtenus par mécanosynthèse,
ont montré une amélioration importante des cinétiques d’absorption et de
désorption, même à des températures relativement basses.
D’un point de vue expérimental, ce travail de thèse vise d’une part, à
synthétiser les alliages Mg2Ni1-xMnx (x =0, 0.125, 0.25, 0.375) et les alliages
Mg2-xAlxNi (x = 0, 0.25) avec ou sans nanotubes de carbone multiparois
(MWCNTs) par mécanosynthèse et d’autre part, d’étudier les effets des
substitutions/additions sur la composition et la microstructure des alliages
Mg2Ni afin d’améliorer leurs propriétés de stockage d’hydrogène.
D’un point de vue théorique, des études de simulation par CASTEP
(Materials studio), qui est un programme de mécanique quantique qui utilise les
premiers principes basés sur la Théorie de la Fonctionnelle de la Densité (DFT),
permettront de modéliser la structure des alliages synthétisés et ainsi de prédire
ou de confirmer les résultats expérimentaux.
Dans ce mémoire, le premier chapitre est consacré aux généralités
concernant les matériaux pour le stockage d’hydrogène. Le deuxième chapitre
présente les techniques expérimentales d’élaboration et de caractérisation ainsi
que la théorie de la fonctionnelle de la densité utilisées au cours de cette étude.
Les résultats obtenus par les différentes techniques expérimentales et théoriques
sont regroupés au chapitre trois. Dans certains cas, ils seront décrits avec
précision dans le corps du document et dans d’autres, ils seront simplement
rappelés en faisant référence à une discussion plus poussée déjà présentée dans
des articles publiés, donnés en annexes. Le dernier chapitre regroupera les
conclusions et perspectives de ces travaux de recherche.

CHAPITRE I GÉNÉRALITÉS SUR LES
MATÉRIAUX DE STOCKAGE D’HYDROGÈNE

4
CHAPITRE I : GÉNÉRALITÉS SUR LES MATÉRIAUX
DE STOCKAGE D’HYDROGÈNE
Ce chapitre décrit des différents modes de stockage d’hydrogène, le système
métal-hydrogène, les propriétés thermodynamiques des systèmes
intermétalliques Métal-Hydrogène, le système binaire Mg-Ni, les propriétés
structurales, les propriétés d’hydrogénation et les accumulateurs Nickel Métal-
Hydrure [1-24]. La revue bibliographique sur les effets de substitution de Mg et
Ni par d’autres éléments et l’addition des nanotubes de carbone multiparois
(MWCNTs) dans le cas de l’alliage Mg2Ni est présentée.
I.1. Stockage de l’hydrogène
Une fois produit, l’hydrogène, doit être stocké pour pouvoir ensuite être
distribué. Le principal obstacle lié au stockage de l’hydrogène est lié au fait qu’il
soit le plus léger élément du tableau périodique. L’hydrogène est l’élément qui
contient le plus d’énergie d’un point de vue massique, mais le moins d’un point
de vue volumique (89 g d’H2/m3 à 273 K). Il peut être stocké de trois manières
différentes : gazeux, liquide ou solide. Ces trois méthodes de stockage diffèrent
par leurs densités volumiques et gravimétriques et aussi par leurs aspects
sécuritaires et leurs coûts.
Les différents modes de stockage de l’hydrogène sont donc:
- sous pression (de 350 à 700 bars);
- liquéfié (T ≤ 20,4 K);
- solide : (i) dans des hydrures métalliques dans lesquels l’hydrogène est
absorbé (chimisorption) ou (ii) dans des composés carbonés (i.e. charbon actif,
nanofibres et nanotubes de carbone) dans lesquels l’hydrogène est adsorbé
(physisorption).
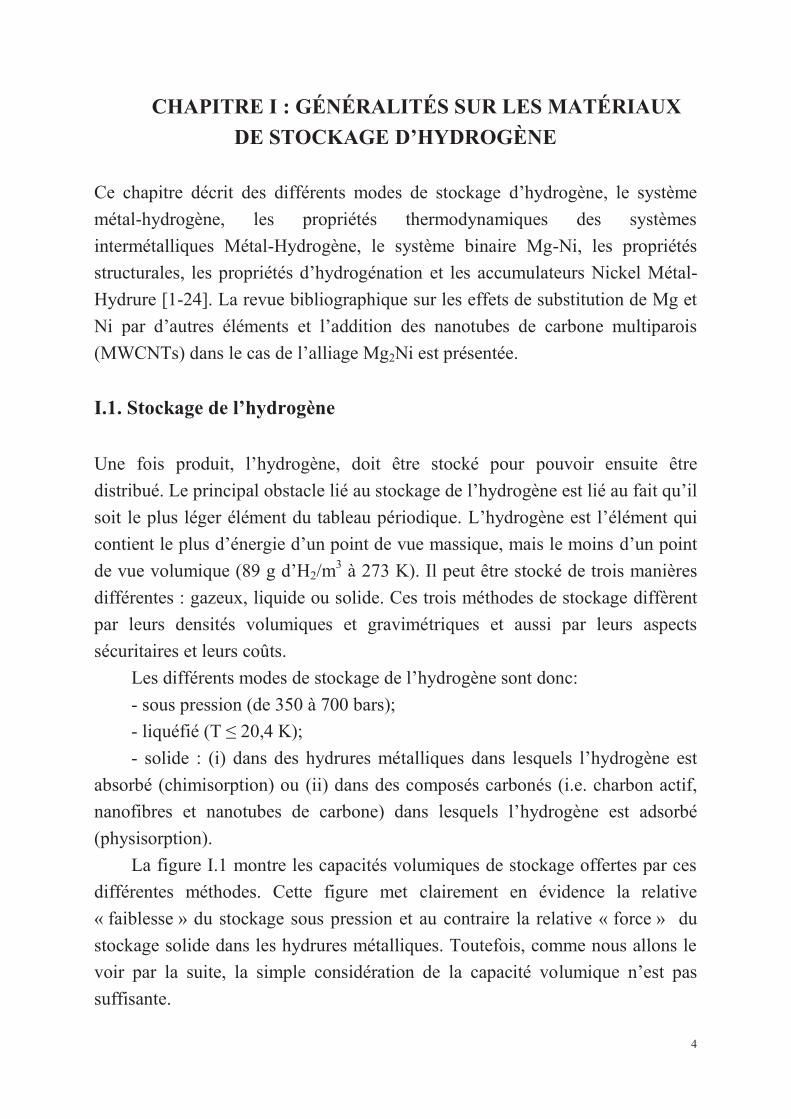
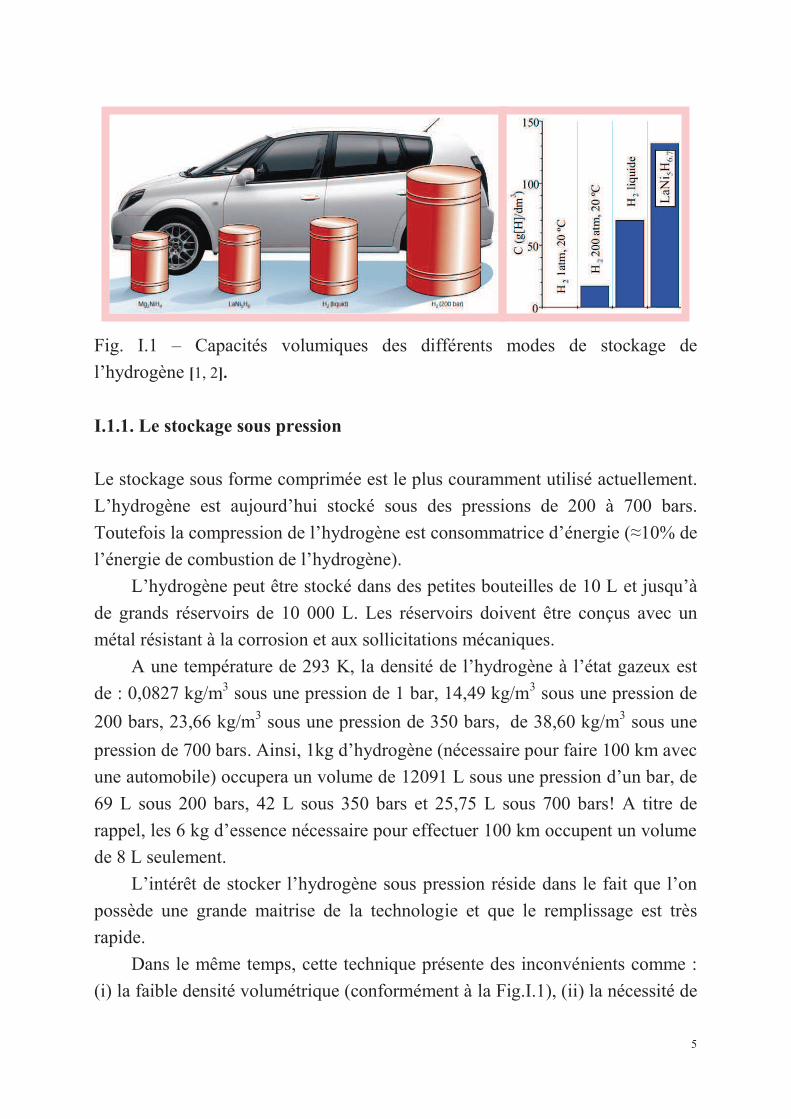
La figure I.1 montre les capacités volumiques de stockage offertes par ces
différentes méthodes. Cette figure met clairement en évidence la relative
« faiblesse » du stockage sous pression et au contraire la relative « force » du
stockage solide dans les hydrures métalliques. Toutefois, comme nous allons le
voir par la suite, la simple considération de la capacité volumique n’est pas
suffisante.
5
Fig. I.1 – Capacités volumiques des différents modes de stockage de
l’hydrogène [1, 2].
I.1.1. Le stockage sous pression
Le stockage sous forme comprimée est le plus couramment utilisé actuellement.
L’hydrogène est aujourd’hui stocké sous des pressions de 200 à 700 bars.
Toutefois la compression de l’hydrogène est consommatrice d’énergie (≈10% de
l’énergie de combustion de l’hydrogène).
L’hydrogène peut être stocké dans des petites bouteilles de 10 L et jusqu’à
de grands réservoirs de 10 000 L. Les réservoirs doivent être conçus avec un
métal résistant à la corrosion et aux sollicitations mécaniques.
A une température de 293 K, la densité de l’hydrogène à l’état gazeux est
de : 0,0827 kg/m3 sous une pression de 1 bar, 14,49 kg/m
3 sous une pression de
200 bars, 23,66 kg/m3 sous une pression de 350 bars. de 38,60 kg/m
3 sous une
pression de 700 bars. Ainsi, 1kg d’hydrogène (nécessaire pour faire 100 km avec
une automobile) occupera un volume de 12091 L sous une pression d’un bar, de
69 L sous 200 bars, 42 L sous 350 bars et 25,75 L sous 700 bars! A titre de
rappel, les 6 kg d’essence nécessaire pour effectuer 100 km occupent un volume
de 8 L seulement.
L’intérêt de stocker l’hydrogène sous pression réside dans le fait que l’on
possède une grande maitrise de la technologie et que le remplissage est très
rapide.
Dans le même temps, cette technique présente des inconvénients comme :
(i) la faible densité volumétrique (conformément à la Fig.I.1), (ii) la nécessité de
6
concevoir des réservoirs résistants aux chocs et adaptables aux véhicules pour
les applications embarquées. Enfin la technologie de tous les auxiliaires (les
vannes, les capteurs, les détendeurs,…) doit être adaptée à ces hautes pressions.
Notons toutefois que c’est ce mode de stockage qui est utilisé actuellement pour
la plupart des démonstrations grand public.
I.1.2. Le stockage liquide
Pour cette méthode, l’hydrogène est refroidi a -253 °C et devient liquide ce qui
lui confère une plus grande densité énergétique, comme le montre la Fig. I.1.
Toutefois, ce mode de stockage requiert une grande quantité d’énergie pour
le refroidissement (25% de l’énergie de combustion de l’hydrogène).
D’importants développements technologiques ont été réalisés pour maitriser le
stockage de l’hydrogène à une température aussi basse. En effet, l’hydrogène va
se réchauffer ce qui aura pour effet d’augmenter la pression au dessus du liquide
(pression de vapeur saturante). Afin de limiter cette surpression on crée une fuite
dynamique (phénomène de « boil off » ). Toutefois, cette fuite se traduit par une
perte d’hydrogène qui est de l’ordre de 1 a 2% par jour (e.g. ainsi, un réservoir
d’hydrogène liquide non utilisé pendant plus de deux mois sera vide sans avoir
été consommé!).
Pour éviter les pertes thermiques par convection, le réservoir a une double
paroi, avec entre les deux parois un espace contenant des super isolants ou de
l’air liquide (l’un des meilleurs pouvoirs isolants). Les réservoirs sont en acier
ou en matériaux composites pour réduire leur masse. La densité de l’hydrogène
à l’état liquide à une température de 20 K et une pression de 1 bar est de 71,1
kg/m3 (i.e. 1 kg d’hydrogène occupe un volume de 13 L), ce qui est bien
supérieure à celle de l’hydrogène gazeux sous pression.
Les avantages de ce mode de stockage de l’hydrogène sont : (i) le réservoir
nécessite moins de place qu’un réservoir sous pression ; (ii) le remplissage est
une technologie maitrisée avec des stations services spécialisées existantes (e.g.
développées avec l’aide de l’industrie spatiale qui est la principale utilisatrice
d’hydrogène liquide). Les problèmes de la conservation de l’hydrogène liquide
sont : (i) la nécessité d’utiliser des cryostats à forte isolation thermique, (ii) le
phénomène de boil-off (évaporation par échauffement).
7
Notons enfin, que si la capacité volumique est 2 à 3 fois supérieure à celle
de l’hydrogène gazeux, le volume total du réservoir (du fait des couches
isolantes) sera presque similaire à celui d’un réservoir sous pression contenant la
même quantité d’hydrogène.
I.1.3. Le stockage solide
L’hydrogène peut être stocké dans les hydrures métalliques, technique qui est
déjà connue et utilisée. En effet, l’hydrogène peut réagir de manière réversible
avec certains métaux et alliages. L’hydrogène réagit avec différents types de
poudres métalliques ce qui crée un stockage solide à basse pression. Les
hydrures métalliques ont une densité énergétique proche de celle de l’essence.
Le stockage dans les hydrures fait appel à un réservoir rempli de certains métaux
(V, Pd, Mg …) ou de composés intermétalliques (ABn avec en général A
correspondant à des terres rares (La...), des alcalino-terreux (Mg...) ou des
métaux de transition (Ti, Zr...) et B des métaux de transition (Fe, Ni, Cu...)) qui
peuvent stocker des atomes d’hydrogène dans leurs réseaux métalliques et créer
des liaisons chimiques. Il existe deux classes d’hydrures : les hydrures haute et
basse température. La pression de dissociation est fonction de la température:
pour des températures comprises entre 0 et 100°C, les pressions se situent entre
2 et 10 bars, mais elles atteignent 30 à 50 bars pour des températures plus
élevées. La désorption a lieu à basse pression. L’hydrogène absorbé doit être le
plus pur possible pour ne pas détériorer les propriétés absorbantes du matériau.
Les densités énergétiques sont faibles pour les hydrures basse température
(1,5MJ/kg), elles augmentent pour les hydrures haute température (4 MJ/kg).
Le pouvoir de stockage dans le cas des hydrures métalliques est souvent tel
que la quantité d’hydrogène présente dans 1cm3 d’un hydrure peut dépasser celle
présente dans 1cm3 d’hydrogène liquide. Le poids d’hydrogène adsorbé,
exprimé en pourcentage du poids de l’alliage métallique ou métal adsorbant
demeure inferieur à 7,6% (cas limite du magnésium pur). L’intérêt d’utiliser les
hydrures métalliques pour stocker l’hydrogène est de minimiser le risque associé
au stockage d’importantes quantités d’hydrogène. Cette méthode a comme
autres avantages le fait que les pressions mises en jeu, à température ambiante,
sont faibles et que l’hydrogène obtenu est très pur. Comme toutes les méthodes,
8
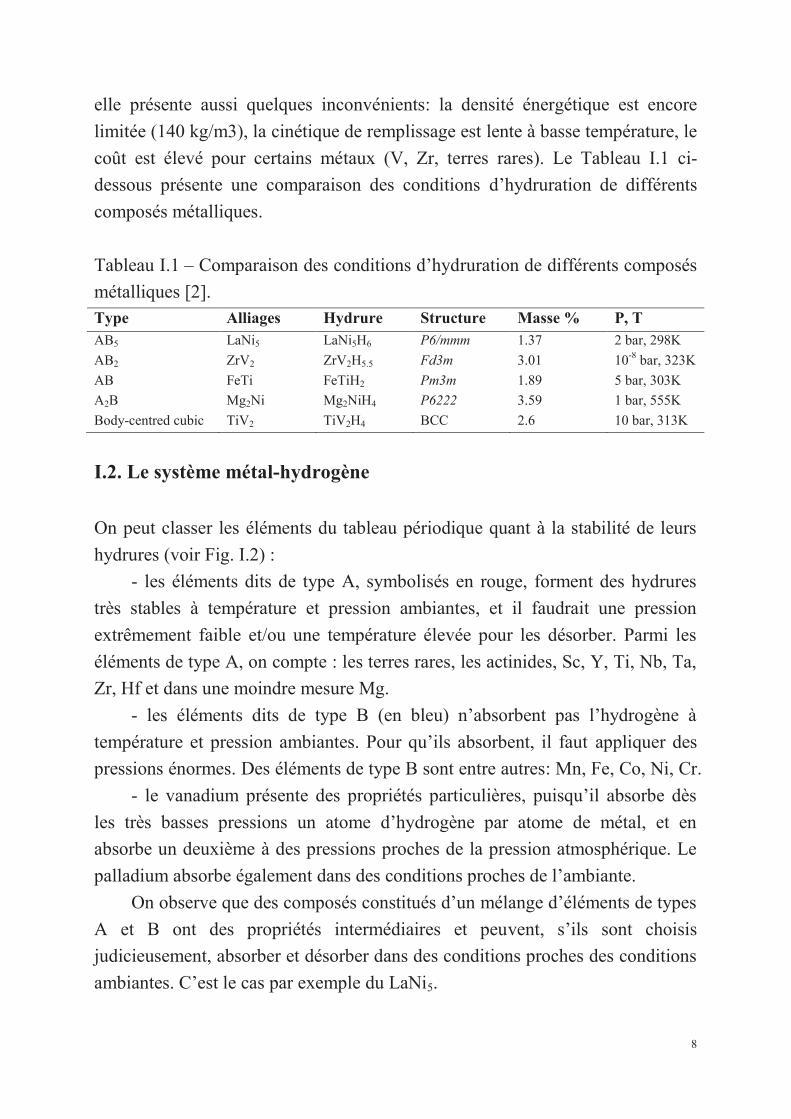
elle présente aussi quelques inconvénients: la densité énergétique est encore
limitée (140 kg/m3), la cinétique de remplissage est lente à basse température, le
coût est élevé pour certains métaux (V, Zr, terres rares). Le Tableau I.1 ci-
dessous présente une comparaison des conditions d’hydruration de différents
composés métalliques.
Tableau I.1 – Comparaison des conditions d’hydruration de différents composés
métalliques [2]. Type Alliages Hydrure Structure Masse % P, T AB5 LaNi5 LaNi5H6 P6/mmm 1.37 2 bar, 298K
AB2 ZrV2 ZrV2H5.5 Fd3m 3.01 10-8 bar, 323K
AB FeTi FeTiH2 Pm3m 1.89 5 bar, 303K
A2B Mg2Ni Mg2NiH4 P6222 3.59 1 bar, 555K
Body-centred cubic TiV2 TiV2H4 BCC 2.6 10 bar, 313K
I.2. Le système métal-hydrogène
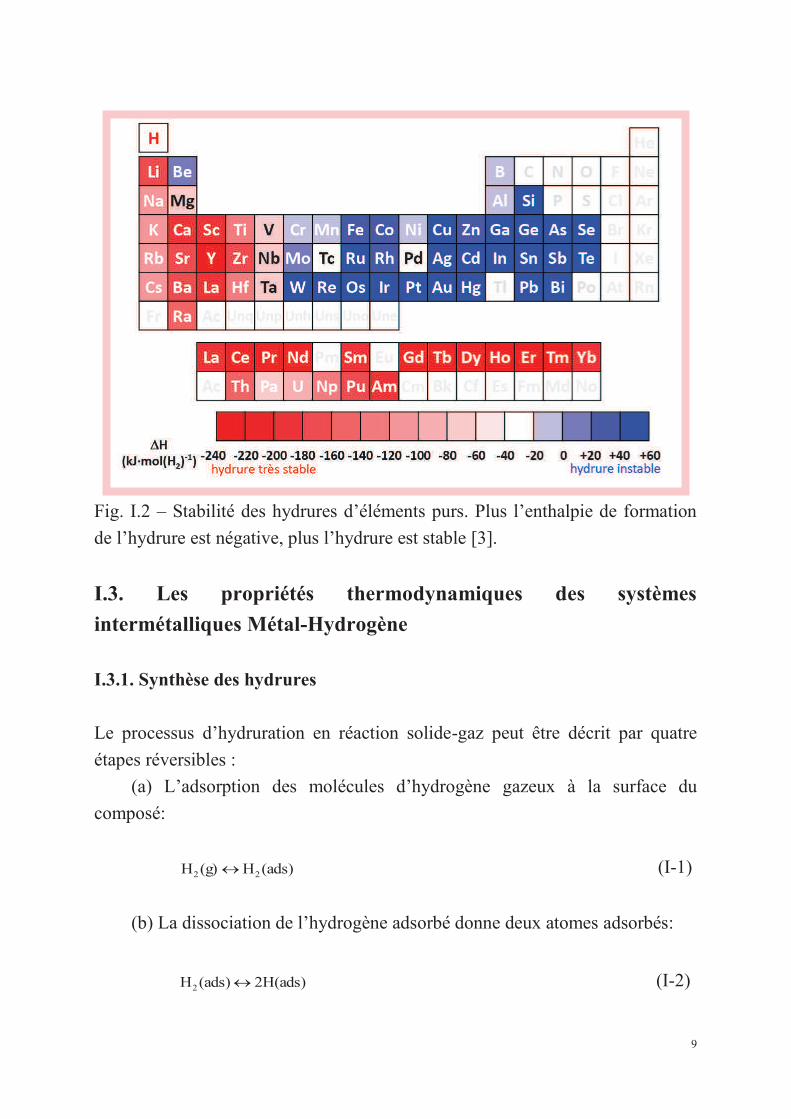
On peut classer les éléments du tableau périodique quant à la stabilité de leurs
hydrures (voir Fig. I.2) :
- les éléments dits de type A, symbolisés en rouge, forment des hydrures
très stables à température et pression ambiantes, et il faudrait une pression
extrêmement faible et/ou une température élevée pour les désorber. Parmi les
éléments de type A, on compte : les terres rares, les actinides, Sc, Y, Ti, Nb, Ta,
Zr, Hf et dans une moindre mesure Mg.
- les éléments dits de type B (en bleu) n’absorbent pas l’hydrogène à
température et pression ambiantes. Pour qu’ils absorbent, il faut appliquer des
pressions énormes. Des éléments de type B sont entre autres: Mn, Fe, Co, Ni, Cr.
- le vanadium présente des propriétés particulières, puisqu’il absorbe dès
les très basses pressions un atome d’hydrogène par atome de métal, et en
absorbe un deuxième à des pressions proches de la pression atmosphérique. Le
palladium absorbe également dans des conditions proches de l’ambiante.
On observe que des composés constitués d’un mélange d’éléments de types
A et B ont des propriétés intermédiaires et peuvent, s’ils sont choisis
judicieusement, absorber et désorber dans des conditions proches des conditions
ambiantes. C’est le cas par exemple du LaNi5.
9
Fig. I.2 – Stabilité des hydrures d’éléments purs. Plus l’enthalpie de formation
de l’hydrure est négative, plus l’hydrure est stable [3].
I.3. Les propriétés thermodynamiques des systèmes
intermétalliques Métal-Hydrogène
I.3.1. Synthèse des hydrures
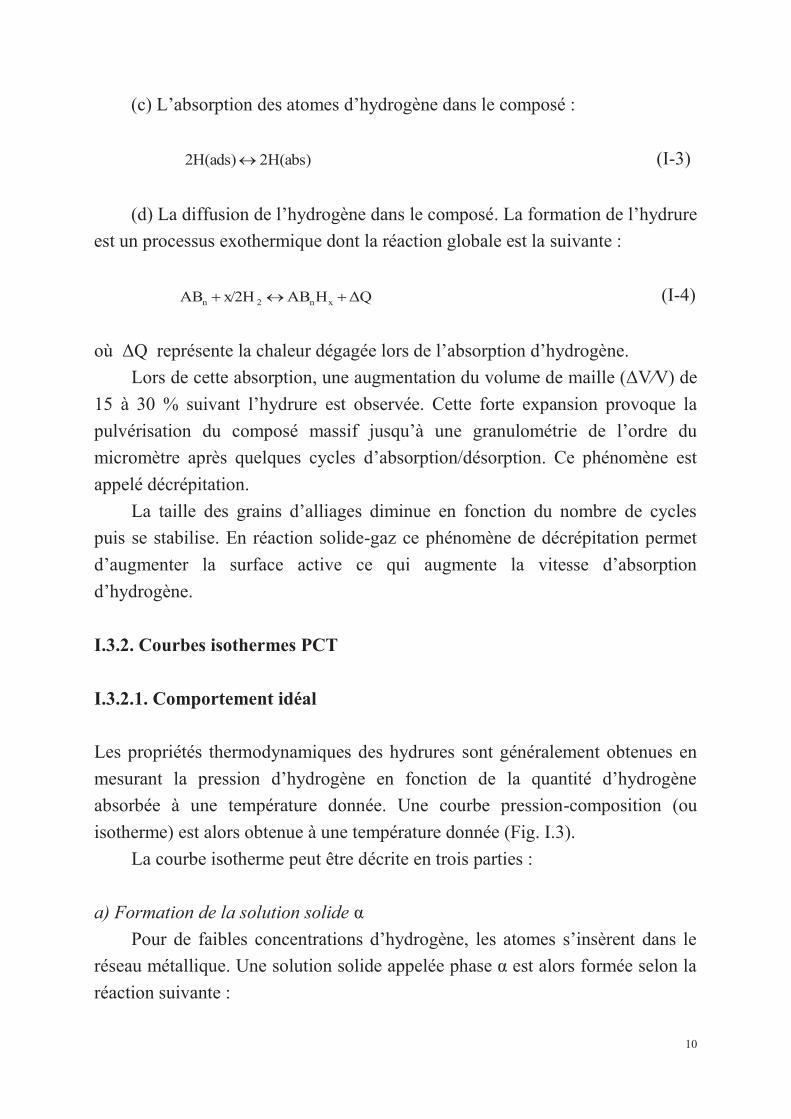
Le processus d’hydruration en réaction solide-gaz peut être décrit par quatre
étapes réversibles :
(a) L’adsorption des molécules d’hydrogène gazeux à la surface du
composé:
(ads)H(g)H 22 « (I-1)
(b) La dissociation de l’hydrogène adsorbé donne deux atomes adsorbés:
H(ads)2(ads)H2 « (I-2)
10
(c) L’absorption des atomes d’hydrogène dans le composé :
H(abs)22H(ads)« (I-3)
(d) La diffusion de l’hydrogène dans le composé. La formation de l’hydrure
est un processus exothermique dont la réaction globale est la suivante :
ΔQHABx/2HAB xn2n +«+ (I-4)
où ΔQ représente la chaleur dégagée lors de l’absorption d’hydrogène.
Lors de cette absorption, une augmentation du volume de maille (ΔV⁄V) de
15 à 30 % suivant l’hydrure est observée. Cette forte expansion provoque la
pulvérisation du composé massif jusqu’à une granulométrie de l’ordre du
micromètre après quelques cycles d’absorption/désorption. Ce phénomène est
appelé décrépitation.
La taille des grains d’alliages diminue en fonction du nombre de cycles
puis se stabilise. En réaction solide-gaz ce phénomène de décrépitation permet
d’augmenter la surface active ce qui augmente la vitesse d’absorption
d’hydrogène.
I.3.2. Courbes isothermes PCT
I.3.2.1. Comportement idéal
Les propriétés thermodynamiques des hydrures sont généralement obtenues en
mesurant la pression d’hydrogène en fonction de la quantité d’hydrogène
absorbée à une température donnée. Une courbe pression-composition (ou
isotherme) est alors obtenue à une température donnée (Fig. I.3).
La courbe isotherme peut être décrite en trois parties :
a) Formation de la solution solide α
Pour de faibles concentrations d’hydrogène, les atomes s’insèrent dans le
réseau métallique. Une solution solide appelée phase α est alors formée selon la
réaction suivante :
11
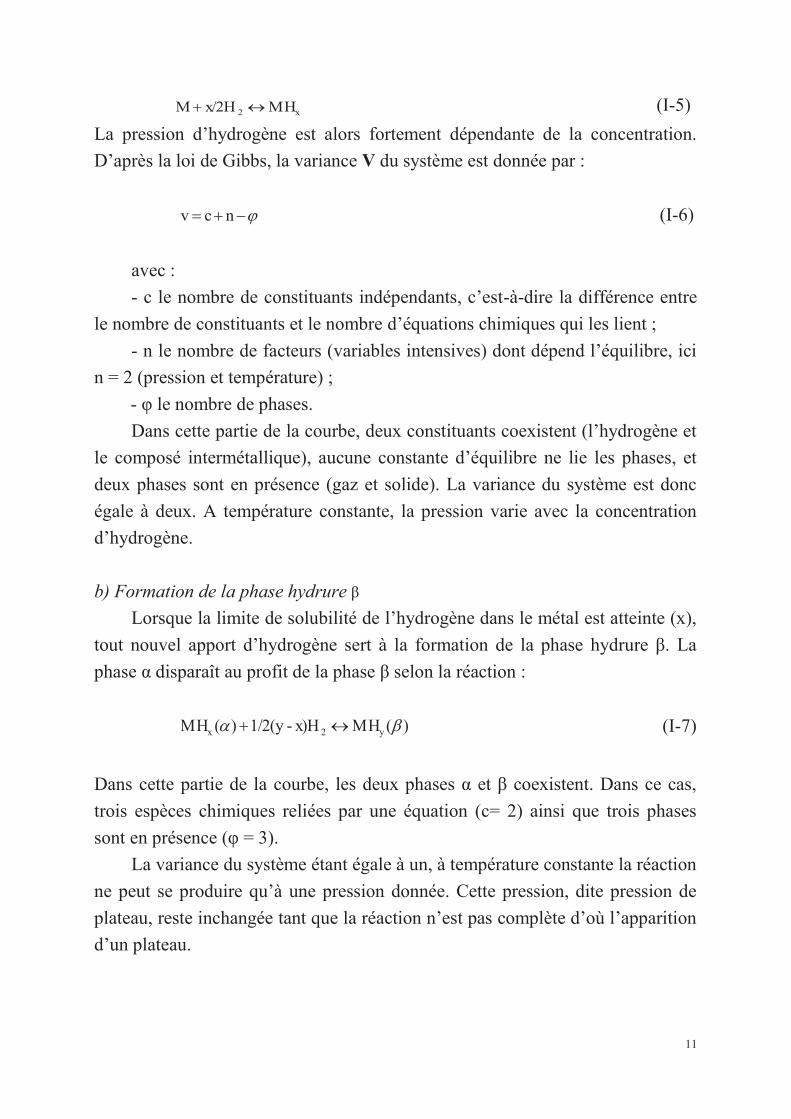
x2 MHx/2HM «+ (I-5)
La pression d’hydrogène est alors fortement dépendante de la concentration.
D’après la loi de Gibbs, la variance V du système est donnée par :
j-+= ncv (I-6)
avec :
- c le nombre de constituants indépendants, c’est-à-dire la différence entre
le nombre de constituants et le nombre d’équations chimiques qui les lient ;
- n le nombre de facteurs (variables intensives) dont dépend l’équilibre, ici
n = 2 (pression et température) ;
- φ le nombre de phases.
Dans cette partie de la courbe, deux constituants coexistent (l’hydrogène et
le composé intermétallique), aucune constante d’équilibre ne lie les phases, et
deux phases sont en présence (gaz et solide). La variance du système est donc
égale à deux. A température constante, la pression varie avec la concentration
d’hydrogène.
b) Formation de la phase hydrure β
Lorsque la limite de solubilité de l’hydrogène dans le métal est atteinte (x),
tout nouvel apport d’hydrogène sert à la formation de la phase hydrure β. La
phase α disparaît au profit de la phase β selon la réaction :
)(MHx)H-1/2(y)(MH y2x ba «+ (I-7)
Dans cette partie de la courbe, les deux phases α et β coexistent. Dans ce cas,
trois espèces chimiques reliées par une équation (c= 2) ainsi que trois phases
sont en présence (φ = 3).
La variance du système étant égale à un, à température constante la réaction
ne peut se produire qu’à une pression donnée. Cette pression, dite pression de
plateau, reste inchangée tant que la réaction n’est pas complète d’où l’apparition
d’un plateau.
12
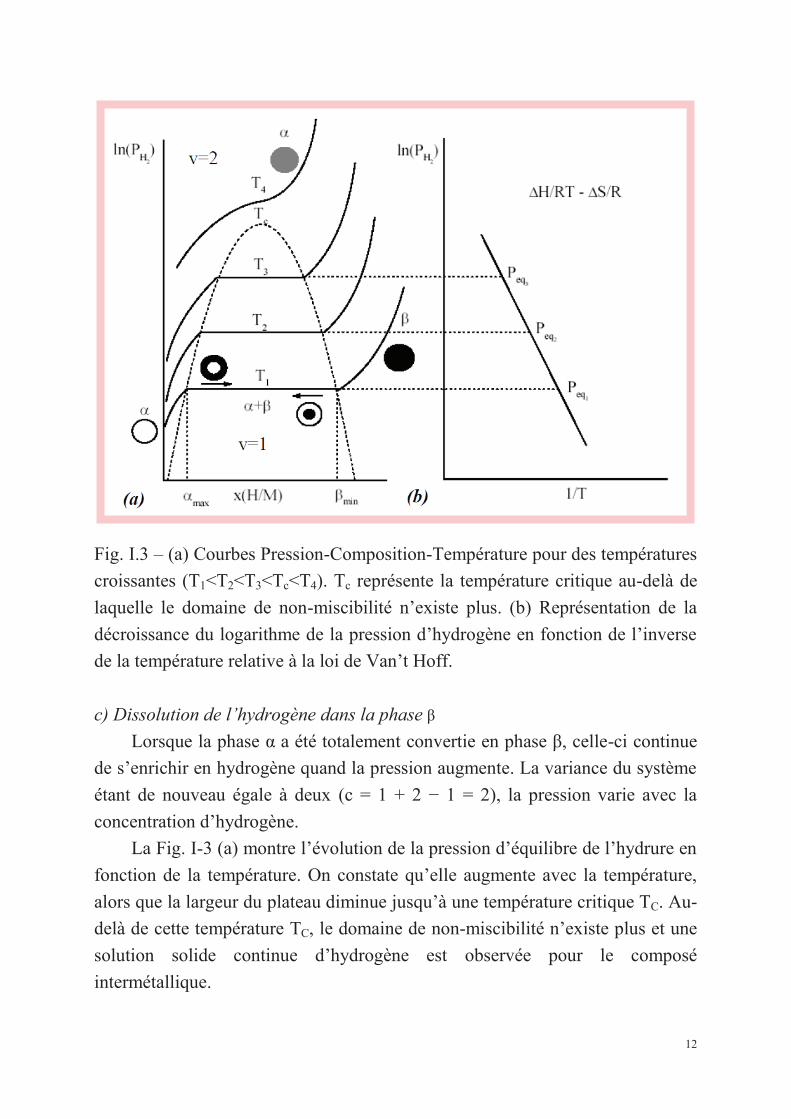
Fig. I.3 – (a) Courbes Pression-Composition-Température pour des températures
croissantes (T1<T2<T3<Tc<T4). Tc représente la température critique au-delà de
laquelle le domaine de non-miscibilité n’existe plus. (b) Représentation de la
décroissance du logarithme de la pression d’hydrogène en fonction de l’inverse
de la température relative à la loi de Van’t Hoff.
c) Dissolution de l’hydrogène dans la phase β
Lorsque la phase α a été totalement convertie en phase β, celle-ci continue
de s’enrichir en hydrogène quand la pression augmente. La variance du système
étant de nouveau égale à deux (c = 1 + 2 − 1 = 2), la pression varie avec la
concentration d’hydrogène.
La Fig. I-3 (a) montre l’évolution de la pression d’équilibre de l’hydrure en
fonction de la température. On constate qu’elle augmente avec la température,
alors que la largeur du plateau diminue jusqu’à une température critique TC. Au-
delà de cette température TC, le domaine de non-miscibilité n’existe plus et une
solution solide continue d’hydrogène est observée pour le composé
intermétallique.
13
Hysérésis=ln(Pa/Pd)
Absorption
Désorption
Cap
acité
ln (PH2)
D’après la loi de Van’t Hoff, la pression de plateau est reliée à la
température par :
ΔS/RΔH/RT)Ln(P2H -= (I-8)
où ΔH et ΔS représentent les changements d’enthalpie et d’entropie lors de la
transformation α/β. En considérant que ΔH et ΔS sont constants dans la gamme
de température étudiée, il est possible de déterminer leur valeur par la mesure
des isothermes à différentes températures.
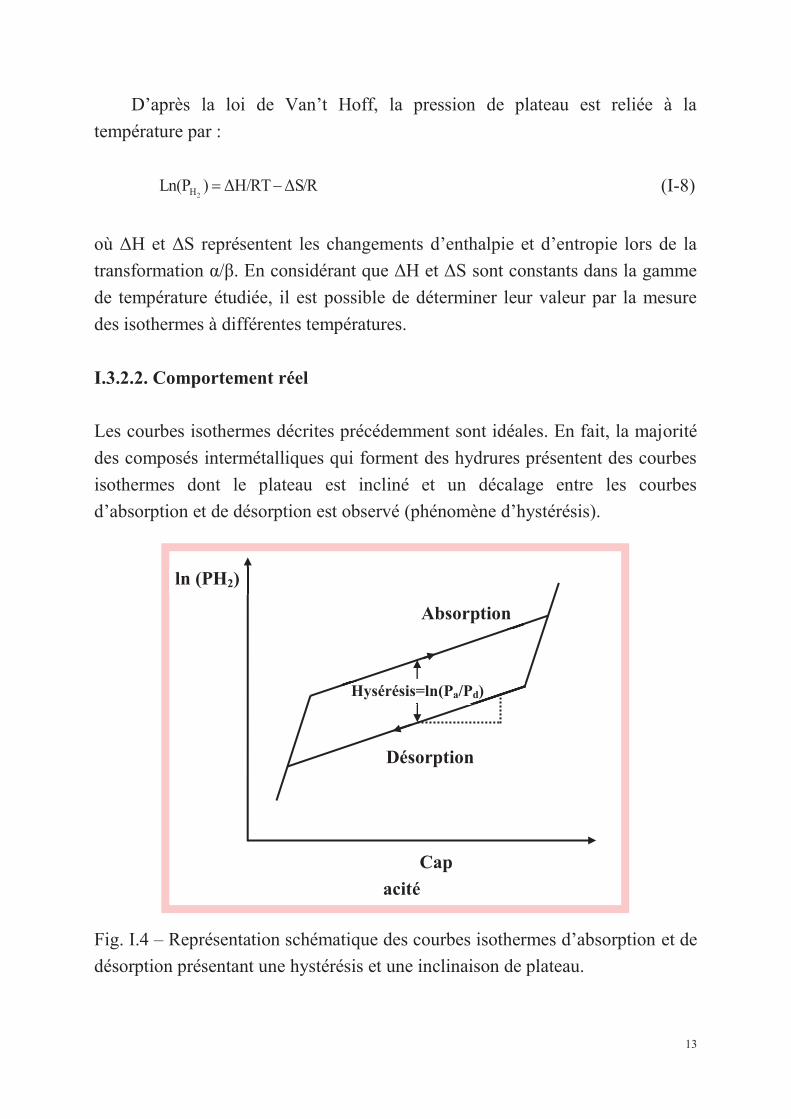
I.3.2.2. Comportement réel
Les courbes isothermes décrites précédemment sont idéales. En fait, la majorité
des composés intermétalliques qui forment des hydrures présentent des courbes
isothermes dont le plateau est incliné et un décalage entre les courbes
d’absorption et de désorption est observé (phénomène d’hystérésis).
Fig. I.4 – Représentation schématique des courbes isothermes d’absorption et de
désorption présentant une hystérésis et une inclinaison de plateau.
14
La Fig. I.4 montre une courbe isotherme schématisant un comportement
réel. L’inclinaison du plateau est en général expliquée par une inhomogénéité de
composition du composé intermétallique. En effet, le plateau d’un composé non
recuit est généralement plus incliné que celui du même composé après recuit [5].
Le phénomène d’hystérésis se manifeste par la non superposition des courbes
isothermes d’absorption et de désorption. L’hystérésis est expliquée par les
contraintes générées lors de l’insertion et la désinsertion de l’hydrogène [6]. La
pression d’équilibre de désorption (Pd) est inférieure à la pression d’équilibre
d’absorption (Pa). Cela est généralement attribué à l’excès d’énergie nécessaire
pour accommoder les contraintes associées à l’expansion de volume lors de la
formation de l’hydrure [7, 8]. L’hystérésis peut être exprimée par la différence
d’énergie libre ΔG :
)/PRTLn(P(hyst)ΔG daH2= (I-9)
I.4. Le système binaire Mg-Ni
I.4.1. Le magnésium
Le magnésium est l’élément chimique numéro 12, sa masse atomique est de
24.31 g.mol-1. Son point de fusion est à 650°C et sa pression de vapeur saturante
est à 1105°C sous 1 atm.
Du fait de leur grande capacité d’absorption de l’hydrogène (jusqu’à 7,6
wt. %), le magnésium et les alliages à base de magnésium sont considérés
comme de bons candidats pour des applications de stockage de l’hydrogène,
d’autant plus que le magnésium est un élément abondant et relativement bon
marché. Cependant, les hydrures de composés à base de magnésium présentent
des problèmes pratiques, puisque le magnésium ne réagit pas avec l’hydrogène à
température ambiante, et la réaction d’hydrogénation est lente (plusieurs heures)
à plus haute température. De plus, les grandeurs thermodynamiques
d’hydrogénation du magnésium impliquent que la température d’équilibre est
d’environ 280 °C pour une pression de plateau de 1 bar.
15
I.4.2. Le nickel
Le nickel est l’élément chimique numéro 28, sa masse atomique est de 58.70
g.mol-1. Son point de fusion est à 1453°C. Le nickel est un métal de transition, il
cristallise sous deux structures cristallographiques :
- une structure cubique à faces centrées stable jusqu’à la température de
fusion TF =1450°C. Cette phase, de paramètre de maille aNi = 0.352 nm et de
groupe d’espace Fm-3m, est ferromagnétique à température ambiante et devient
paramagnétique au-dessus de la température de Curie Tc = 368 °C.
- une phase de structure hexagonale compacte (hcp) de groupe d’espace
P63/mmc. Cette phase qui n’existe pas dans la nature apparaît à une température
qui varie entre 220 et 440°C selon la vitesse de chauffage. Les paramètres de
maille de cette phase sont : a = 0.2622 nm et c = 0.4321 nm. Le rapport c/a du
Ni hcp est égal à 1.729, il est 6 % plus élevé que la valeur idéale de 1.633 d’une
structure hexagonale compacte.
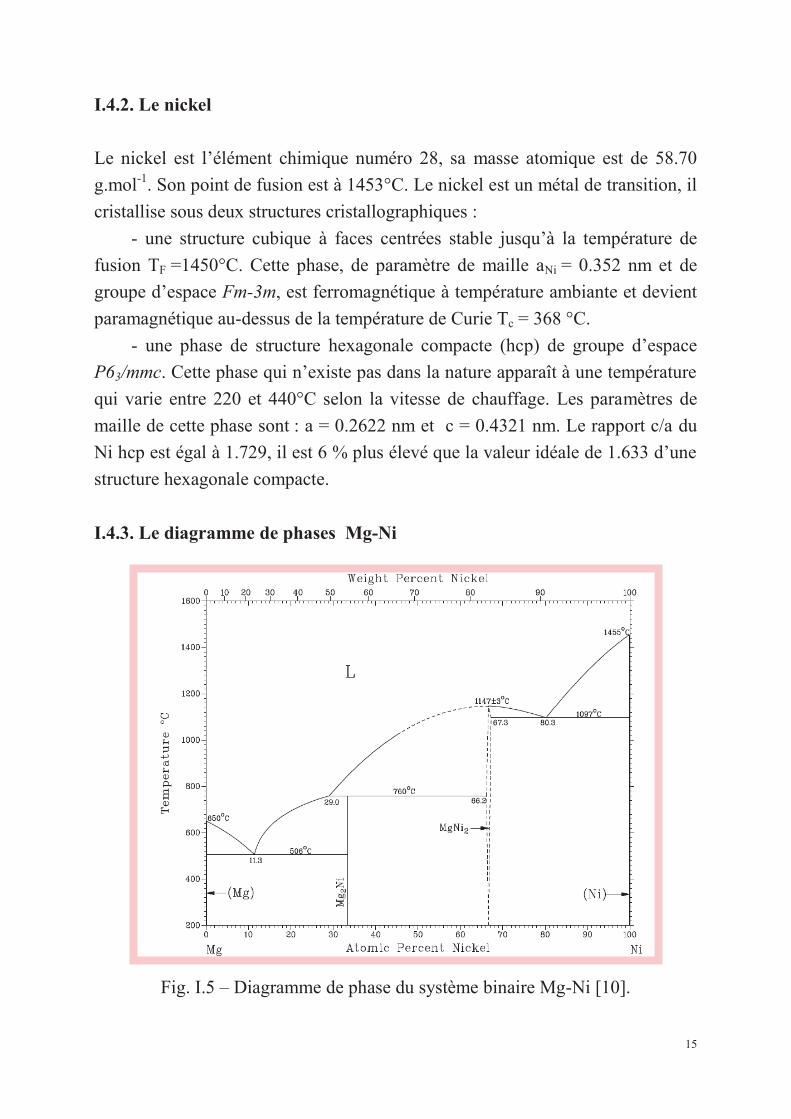
I.4.3. Le diagramme de phases Mg-Ni
Fig. I.5 – Diagramme de phase du système binaire Mg-Ni [10].
16
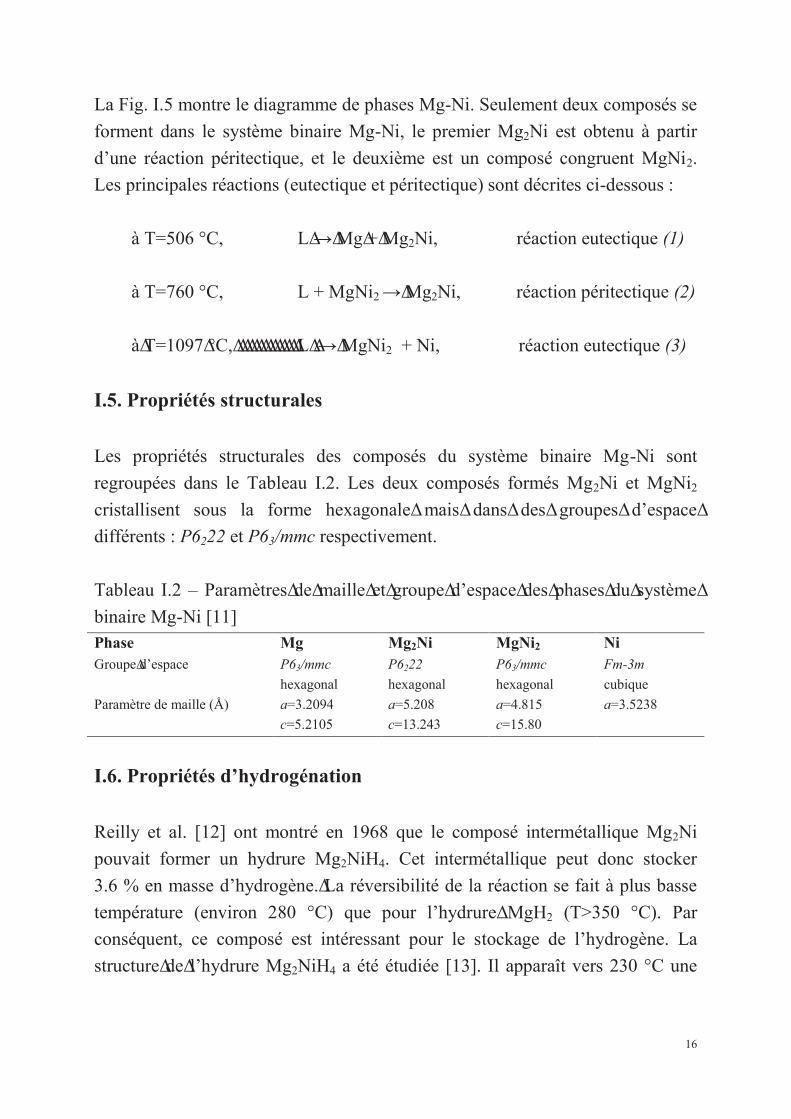
La Fig. I.5 montre le diagramme de phases Mg-Ni. Seulement deux composés se
forment dans le système binaire Mg-Ni, le premier Mg2Ni est obtenu à partir
d’une réaction péritectique, et le deuxième est un composé congruent MgNi2.
Les principales réactions (eutectique et péritectique) sont décrites ci-dessous :
à T=506 °C, LΔ→ΔMgΔ+ΔMg2Ni, réaction eutectique (1)
à T=760 °C, L + MgNi2 →ΔMg2Ni, réaction péritectique (2)
àΔT=1097Δ°C,ΔΔΔΔΔΔΔΔΔΔΔΔΔΔLΔΔ→ΔMgNi2 + Ni, réaction eutectique (3)
I.5. Propriétés structurales
Les propriétés structurales des composés du système binaire Mg-Ni sont
regroupées dans le Tableau I.2. Les deux composés formés Mg2Ni et MgNi2
cristallisent sous la forme hexagonaleΔmaisΔdansΔdesΔgroupesΔd’espaceΔ
différents : P6222 et P63/mmc respectivement.
Tableau I.2 – ParamètresΔdeΔmailleΔetΔgroupeΔd’espaceΔdesΔphasesΔduΔsystèmeΔ
binaire Mg-Ni [11] Phase Mg Mg2Ni MgNi2 Ni GroupeΔd’espace P63/mmc
hexagonal
P6222
hexagonal
P63/mmc
hexagonal
Fm-3m
cubique
Paramètre de maille (Å) a=3.2094 a=5.208 a=4.815 a=3.5238
c=5.2105 c=13.243 c=15.80
I.6. Propriétés d’hydrogénation
Reilly et al. [12] ont montré en 1968 que le composé intermétallique Mg2Ni
pouvait former un hydrure Mg2NiH4. Cet intermétallique peut donc stocker
3.6 % en masse d’hydrogène.ΔLa réversibilité de la réaction se fait à plus basse
température (environ 280 °C) que pour l’hydrureΔMgH2 (T>350 °C). Par
conséquent, ce composé est intéressant pour le stockage de l’hydrogène. La
structureΔdeΔl’hydrure Mg2NiH4 a été étudiée [13]. Il apparaît vers 230 °C une
17
transition entre la phase monoclinique (basse température) et la phase cubique
(haute température).
Le Tableau I.3 regroupe les propriétés d’hydrogénation des composés du
système binaire Mg-Ni. Des deux composés intermétalliques du système Mg-Ni,
le composé MgNi2 ne réagit pas avec l’hydrogène, pour des pressions
supérieures à 3.0 MPa et à des températures supérieures à 350 °C. Par contre le
composé Mg2Ni réagit rapidement avec l’hydrogène à 2.1 MPa et à 325 °C [12].
Tableau I.3 – Propriétés d’hydrogénation des composés du système binaire Mg-
Ni [14]. Composés Capacité (H/u.f.) (PH2 (MPa), T (@)) H/M
Mg 2 2
Mg2Ni 4 (1.0, 200) 1.33
MgNi2 - -
Ni 0.8 (6-10ナ102, 250) 0.8
I.7 Les accumulateurs Nickel Métal-Hydrure (Ni-MH)
I.7.1 Généralités
Les hydrures métalliques peuvent être utilisés comme électrodes négatives dans
des batteries Ni-MH. Ces batteries sont communément appelées piles
rechargeables. Bien que moins puissantes que les batteries Li-ion [20, 21], ces
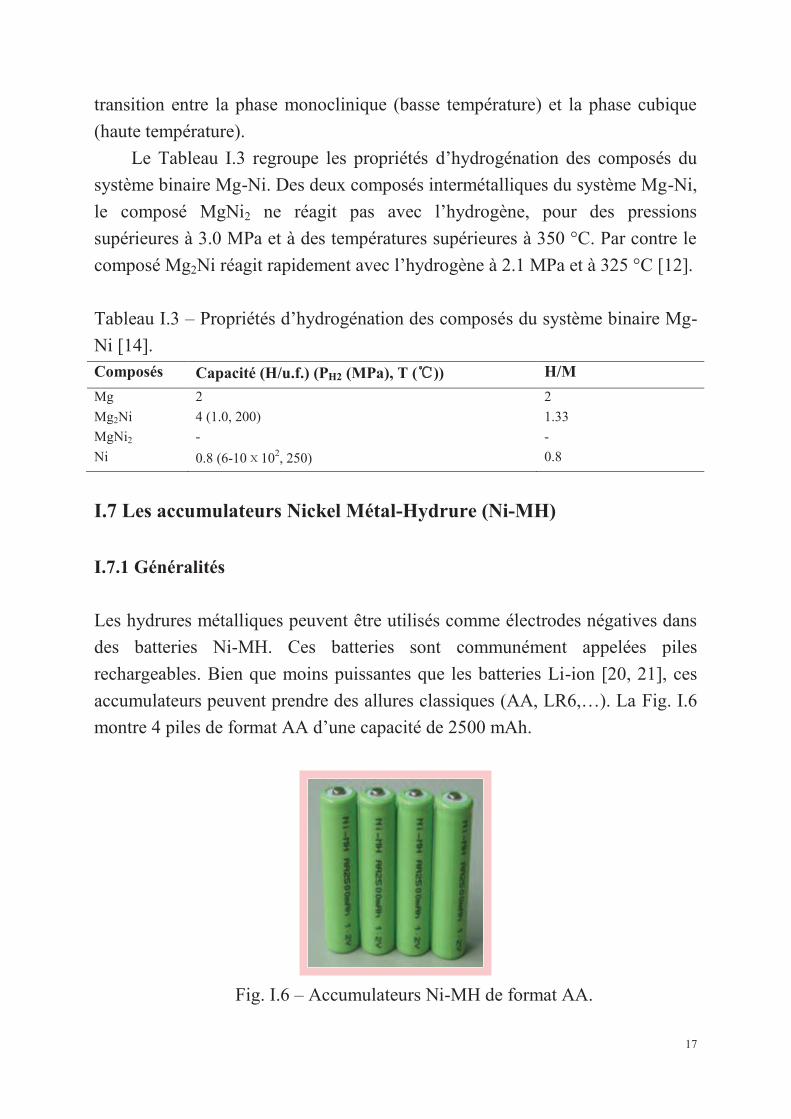
accumulateurs peuvent prendre des allures classiques (AA, LR6,…). La Fig. I.6
montre 4 piles de format AA d’une capacité de 2500 mAh.
Fig. I.6 – Accumulateurs Ni-MH de format AA.
18
H2O
NiOOH M
Ni(OH)2 MHx OH−
g" g"
Électrode positive
Séparateur
Électrode négative
Électrolyte
(KOH 6M)
Ég"
odedeg"
Charge Décharge
Un accumulateur est un système électrochimique réversible qui permet de
produire et stocker de l’énergie électrique à partir de deux réactions
électrochimiques réalisées sur deux électrodes plongées dans une solution
appelée électrolyte. Les réactions chimiques mises en jeu sont des réactions
d’oxydation et de réduction.
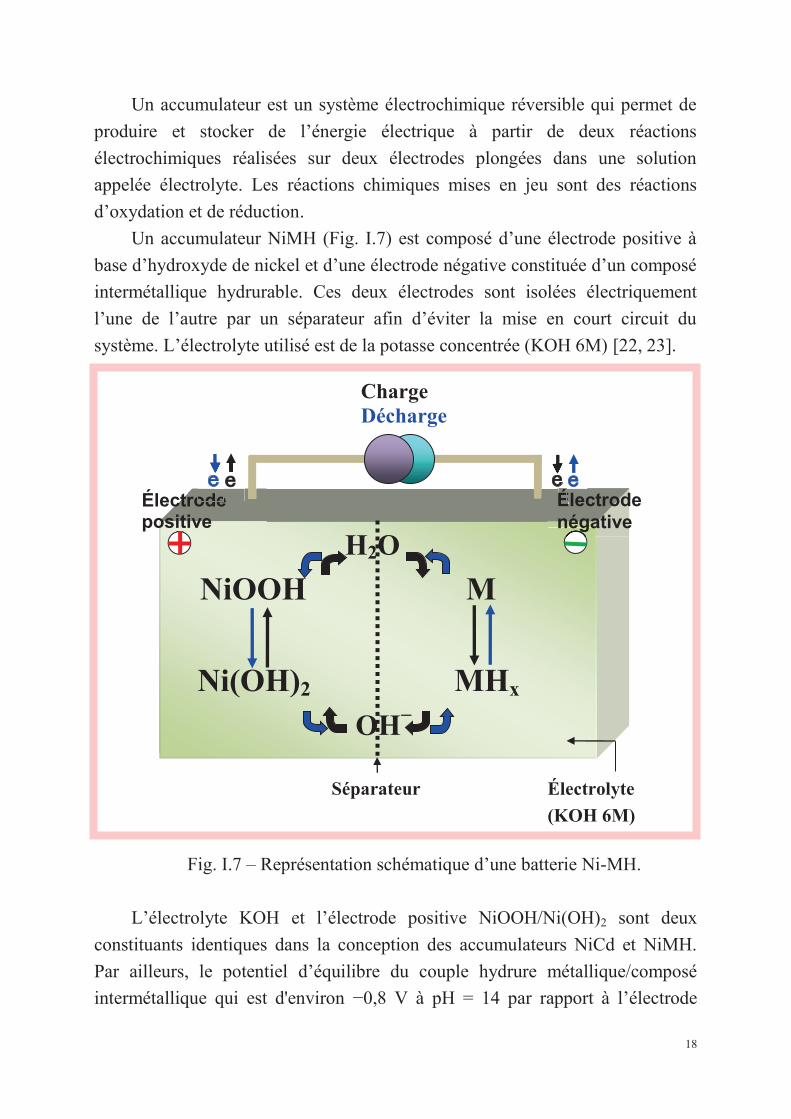
Un accumulateur NiMH (Fig. I.7) est composé d’une électrode positive à
base d’hydroxyde de nickel et d’une électrode négative constituée d’un composé
intermétallique hydrurable. Ces deux électrodes sont isolées électriquement
l’une de l’autre par un séparateur afin d’éviter la mise en court circuit du
système. L’électrolyte utilisé est de la potasse concentrée (KOH 6M) [22, 23].
Fig. I.7 – Représentation schématique d’une batterie Ni-MH.
L’électrolyte KOH et l’électrode positive NiOOH/Ni(OH)2 sont deux
constituants identiques dans la conception des accumulateurs NiCd et NiMH.
Par ailleurs, le potentiel d’équilibre du couple hydrure métallique/composé
intermétallique qui est d'environ −0,8 V à pH = 14 par rapport à l’électrode
19
normale à hydrogène (ENH), est proche de celui du couple Cd/Cd(OH)2 (E° = –
0,809 V à pH = 14 Vs ENH). Ces similitudes ont donc facilité le remplacement
du Cd par un composé intermétallique comme matière active de l’électrode
négative. De plus, si la pression de dissociation de l’hydrure est inférieure à 1
atm, ces électrodes ne s’autodéchargent pas dans l’électrolyte car :
)(M/MHE/Cd)(Cd(OH)E<ENH vsV 0,828=)O/H(HE x°
2°
22°
e/ (I-10)
Le potentiel d’équilibre du couple NiOOH/Ni(OH)2 étant de + 0,49 V Vs
ENH, le potentiel théorique de l’accumulateur est donc de 1,3 V. Les principales
réactions électrochimiques qui ont lieu entre les deux électrodes à la charge et à
la décharge peuvent être écrites par :
charge- -
2 2d charge xNi(OH) +xOH xNiOOH+xH O+xe¾¾¾¾®¬¾¾¾¾
“
(I-11)
-
2 x
charge-
d charge M H O+ OH+x xe MH +x¾¾¾¾®¬¾¾¾¾
“
(I-12)
Pendant la charge, on assiste à l’électrode positive à l’oxydation de l’espèce
Ni(OH)2 (le nickel passe d’un degré d’oxydation +II à un degré d’oxydation
+III) et à l’électrode négative à la réduction de l’eau. C’est la réduction de l’eau
qui produit l’hydrogène qui est ensuite absorbé par le composé intermétallique.
Par ailleurs, l’absorption de cet atome correspond au stockage d’un électron
dans l’électrode négative.
Pendant la décharge, les réactions inverses se produisent. On assiste donc à
l’électrode positive à la réduction de l’ion Ni (passage d’un état trivalent à un
état divalent) et à l’électrode négative à l’oxydation de l’eau. C’est à ce moment
que l’accumulateur fournit l’énergie stockée: l’hydrogène fixé dans le composé
intermétallique diffuse vers l’interface métal-électrolyte et un électron est libéré
de la recombinaison de cet atome d’hydrogène avec un ion OH−:
-- +®+ eOHHOH 2 (I-13)
20
La charge et la décharge de l’électrode négative se font donc par absorption
et désorption de l’hydrogène. Selon l’état de charge de l’électrode négative, les
réactions d’hydrogénation qui ont lieu dans le composé intermétallique peuvent
être décrites par :
- L’absorption de l’hydrogène en solution solide (α)*
-+
- +«++ dxOHMHdxeOdxHMH dxx2x (I-14)
- L’absorption de l’hydrogène qui entraîne la transformation de phase,
solution solide (α max)* → phase hydrure βmin*
-- +«++ OH)x-(y)(MHe)x-(yOH)x-(y)(MH min2maxx βα y (I-15)
Le potentiel électrochimique d’équilibre de ces réactions se déduit de la
relation de Nernst à pH = 14 et T = 25°C :
ENH vs(bar)logP 0,02960,828E(V)2H--= (I-16)
Cette expression indique que le potentiel rédox de l’électrode négative
dépend de la pression en hydrogène. Si la pression d’équilibre est de 1 atm, le
potentiel d’équilibre de l’électrode négative est alors le même que celui de
l’électrode à hydrogène en milieu basique 1M soit E° = −0,828 V. Ce potentiel
diminue de 30 mV par décade de pression et dépend donc de l’état de charge.
Remarque: L’électrode positive NiOOH/Ni(OH)2 que l’on appelle
couramment «électrode de nickel» met en jeu le couple
oxyhydroxyde/dihydroxyde de nickel. La réaction (I-11) est en fait une écriture
simplifiée de la réaction d’oxydo-réduction de NiOOH. Des espèces
intermédiaires insolubles interviennent pendant la réaction.
Pour limiter l’augmentation de pression à l’intérieur de la batterie et la
décomposition de l’électrolyte, on favorise le phénomène dit de recombinaison
d’oxygène. L’électrode de nickel a la capacité limitante; elle est chargée en
premier et il commence à s’y dégager de l’oxygène selon la réaction :
-- ++® 4eOO2H4OH 22 (I-17)
21
L’oxygène produit est transporté vers l’électrode métal-hydrure où il va être
réduit à l’interface métal-hydrure/électrolyte pour produire de l’eau :
O2xH4MxO4MH 22x +®+ (I-18)
I.7.2. Performances des accumulateurs
Quelques paramètres importants permettent de faire une comparaison des divers
types de technologie d’accumulateurs. Ces critères sont :
- la tension, c’est-à-dire la différence de potentiel entre les réactions rédox
qui ont lieu simultanément aux électrodes positive et négative.
- la capacité qui représente la quantité totale d’électricité mise en jeu dans
la réaction électrochimique. La quantité d’électricité ΔQ débitée à courant
d’intensité I fixé et constant pendant une durée déterminée Δt vaut:
Δt(h)ΔI(A)ΔQ(C) ´= (I-19)
Elle s’exprime en ampère-heure ou coulomb (1 Ah = 3600 Coulomb).
Généralement, cette quantité est rapportée à la masse de matière active (Ah/g).
- la puissance massique, en watt par kilogramme (W/kg) représente la
puissance (énergie électrique fournie par unité de temps) que peut délivrer
l’unité de masse d’un accumulateur :
m(kg)
I(A)U(V)P(W/kg)
´= (I-20)
- l’énergie électrique W fournie pendant une même durée de temps vaut:
ΔQ(Ah)U(V)W(J) ´= (I-21)
22
L’énergie s’exprime en joule (J) mais on peut également utiliser le watt
heure (Wh) qui est l’énergie fournie par un moteur de puissance égale à 1 watt
pendant la durée d’une heure soit 1 Wh = 1 W x 3600 s = 3600 J. L’énergie
électrique peut aussi s’exprimer en Wh/kg (densité d’énergie massique) ou en
Wh/l (densité d’énergie volumique).
- la durée de vie en cyclage désigne le nombre de cycles de
charge/décharge pouvant être effectués avec une perte de densité d’énergie
donnée (pour les applications portables, l’accumulateur doit restituer un niveau
d’énergie supérieur à 80% de son énergie nominale [24]; ordre de grandeur
souhaité ~1000 cycles).
- Le taux d’autodécharge représente l’aptitude de l’accumulateur à
maintenir sa capacité spécifique lorsque la batterie n’est pas en fonctionnement.
I.8. Revue bibliographique sur les effets de substitution de Mg et Ni
par d’autres éléments dans le cas de l’alliage Mg2Ni (Annexe 1)
Il existe plusieurs méthodes pour améliorer les propriétés de stockage
d’hydrogène de l’intermétallique Mg2Ni : (a) addition de catalyseurs appropriés
[25-26] ; (b) augmentation de la surface spécifique [27]; (c) substitution partielle
des éléments [28-30] et (d) utilisation de nouvelles méthodes d’élaboration pour
atteindre une échelle nanométrique telles que la mécanosynthèse [25] ou la
méthode de réduction des polyols [31]. La mécanosynthèse est plus appropriée
pour élaborer l’intermétallique Mg2Ni par rapport à une méthode métallurgique
conventionnelle telle que la fusion à cause de la faible miscibilité du magnésium
avec la plupart des métaux de transition, de la haute pression de vapeur du
magnésium et de la différence des points de fusion entre ce dernier et le nickel.
L’alliage nanocristallin Mg2Ni élaboré par mécanosynthèse a montré une
augmentation substantielle des cinétiques d’absorption et de désorption, même à
des températures relativement basses [32].
Yang et al. [33] ont trouvé que la substitution du nickel par du manganèse
dans l’alliage Mg2Ni abaissait la pression du plateau de décomposition. Kohno
et Kanda [34] ont montré que la substitution du magnésium par du manganèse
23
est responsable de l’absorption de l’hydrogène à basse température. Gasiorowski
et al. [29] ont mis en évidence que la substitution partielle du magnésium par du
manganèse augmente les capacités de décharge à température ambiante. On
remarque que certains auteurs ont substitué le nickel par Mn et que d’autres ont
substitué le magnésium par Mn. Tsushio et Akiba [35] préconisent de substituer
en premier le nickel et ensuite le magnésium pour élaborer un alliage quaternaire
de Mg2Ni. Cependant, peu d’études ont été consacrées à la substitution du Ni par
Mn (avec différents pourcentages) dans le cas de l’alliage Mg2Ni.
D’un point de vue théorique, Jurczyk et al. [36] ont calculé les énergies
totales de l’alliage Mg11/6Mn1/6Ni qui indiquent que la position interstitielle
préférentielle de Mn est Mg(6i). Beaucoup de travaux ont été consacrés à la
recherche des propriétés structurales et électroniques à haute température (HT)-
Mg2NiH4 (cubique) [37, 38] et à basse température (LT)-Mg2NiH4
(monoclinique) [38-40]. Takahashi et al [41] ont étudié la structure électronique
de l’hydrure de l’intermétallique Mg2Ni contenant une variété d’éléments
d’addition (V, Cr, Fe, Co, Cu, Zn) par la méthode Cluster DV-Xα. Van Setten et
al [42] ont étudié les effets des métaux de transition (Fe, Co, Cu) comme
dopants de Mg2NiH4 par les premiers principes basés sur la DFT.
Par ailleurs, d’un point de vue expérimental, la substitution du magnésium
par de l’aluminium dans l’alliage Mg2Ni a été étudiée par plusieurs auteurs qui
ont montré une amélioration des propriétés électrochimiques de ces alliages [43-
46]. D’un point de vue théorique, les premiers calculs utilisant les premiers
principes basés sur la DFT révèlent que la substitution partielle du magnésium
par de l’aluminium aboutit à une déstabilisation de l’hydrure Mg2NiH4 avec pour
conséquence une amélioration des propriétés de stockage d’hydrogène de
l’alliage Mg2Ni [47].
Les nanotubes de carbone multiparois (MWCNTs) sont d’excellents
additifs pour améliorer les propriétés de stockage d’hydrogène des alliages
Mg2Ni. Pandey et al. [48] ont indiqué que l’addition des nanotubes de carbone
dans l’alliage Mg2Ni a un effet bénéfique notable sur les cinétiques de
désorption et sur la capacité de stockage. Aminorroaya et al. [49] ont abouti à
une conclusion similaire : les nanotubes de carbone améliorent les cinétiques
d’hydruration/deshydruration et augmentent la capacité d’hydrogène de l’alliage
Mg-6%Ni (wt).
CHAPITRE II LES TECHNIQUES
EXPÉRIMENTALES ET THÉORIE DE LA
FONCTIONNELLE DE LA DENSITÉ

24
CHAPITRE II : LES TECHNIQUES EXPÉRIMENTALES ET
THÉORIE DE LA FONCTIONNELLE DE LA DENSITÉ
Dans ce chapitre, nous décrivons les conditions d’élaboration de nos
échantillons ainsi que le principe des diverses techniques de caractérisation
utilisées pour l’étude des propriétés morphologiques, structurales et
microstructurales des poudres obtenues par mécanosynthèse. La procédure
expérimentale qui nous a permis de mesurer les propriétés électrochimiques
ainsi que la théorie de la fonctionnelle de la densité sont aussi présentées.
II.1. Méthode d’élaboration: la mécanosynthèse
De nombreuses techniques ont été utilisées pour synthétiser les nanomatériaux
tels que: la condensation gazeuse, les procédés chimiques, la méthode sol-gel, la
solidification rapide, l’électrodéposition et la mécanosynthèse. L’avantage de la
mécanosynthèse, par rapport aux autres techniques d’élaboration, réside dans la
simplicité de sa mise en œuvre et la possibilité de produire des quantités
importantes de poudres à l’état solide et à température ambiante.
II.1.1. Principe
Le broyage mécanique est une technique d’élaboration de poudres à l’état solide.
Au cours de ce processus, les grains de poudres sont piégés et écrasés entre les
billes et la paroi des jarres, puis s’allongent sous l’effet de la pression (Fig. II.1).
Les particules sont soumises à des déformations plastiques accompagnées d’un
durcissement et d’une augmentation de l’énergie locale du système à cause de
nouvelles fractures des surfaces. Ceci provoque l’augmentation locale de la
température qui peut induire des transformations de phases. Les grains de
poudres subissent des processus de morcellement et de soudage successifs.
Pendant chaque choc, des milliers de particules environ participent à cette action.
Ainsi, les petits grains ont tendance à augmenter leur taille par ressoudage alors
que les gros grains ont une grande probabilité d’être fracturés. Cette technique
permet entre autres l’obtention de solutions solides d’amorphes et
d’intermétalliques [50].
25
Bille
Bille
Poudre “A”
Poudre “B”
Micromètre Micromètre Micromètre
Micromètre
État initial États transitoires État stationnaire
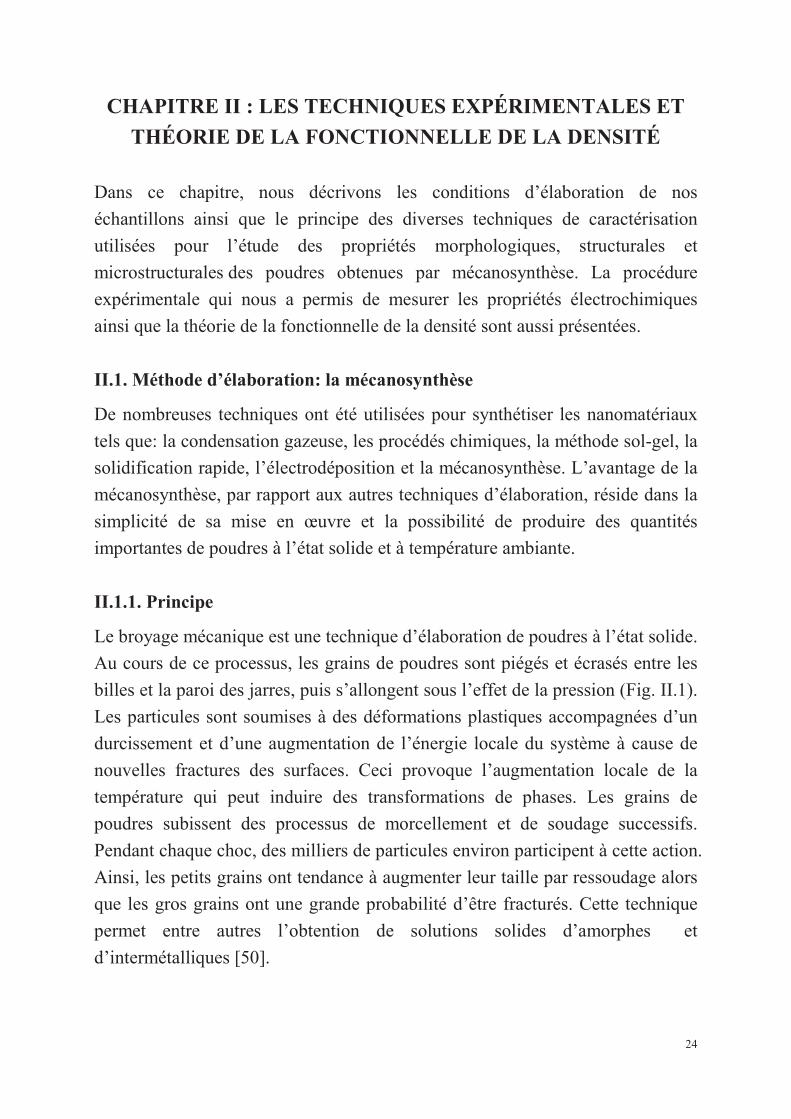
Fig. II.1 – Fracture dynamique et ressoudage des poudres lors d’un choc bille-
bille
Au cours du broyage à haute énergie, les poudres d’éléments ductiles A et
B (voir la Fig. II.2) subissent de très grandes déformations à des vitesses de
l’ordre de 103 à 104 s−1. Les chocs répétés produisent alors une morphologie en
lamelles alternées A et B, d’épaisseurs initiales de l’ordre de quelques
micromètres. Cette structure de type lamellaire à 3D s’affine au cours du temps
pour atteindre une longueur caractéristique de l’ordre du nanomètre.
Fig. II.2 – Les différentes étapes de l’évolution de poudres élémentaires sous
broyage [50].
26
a b
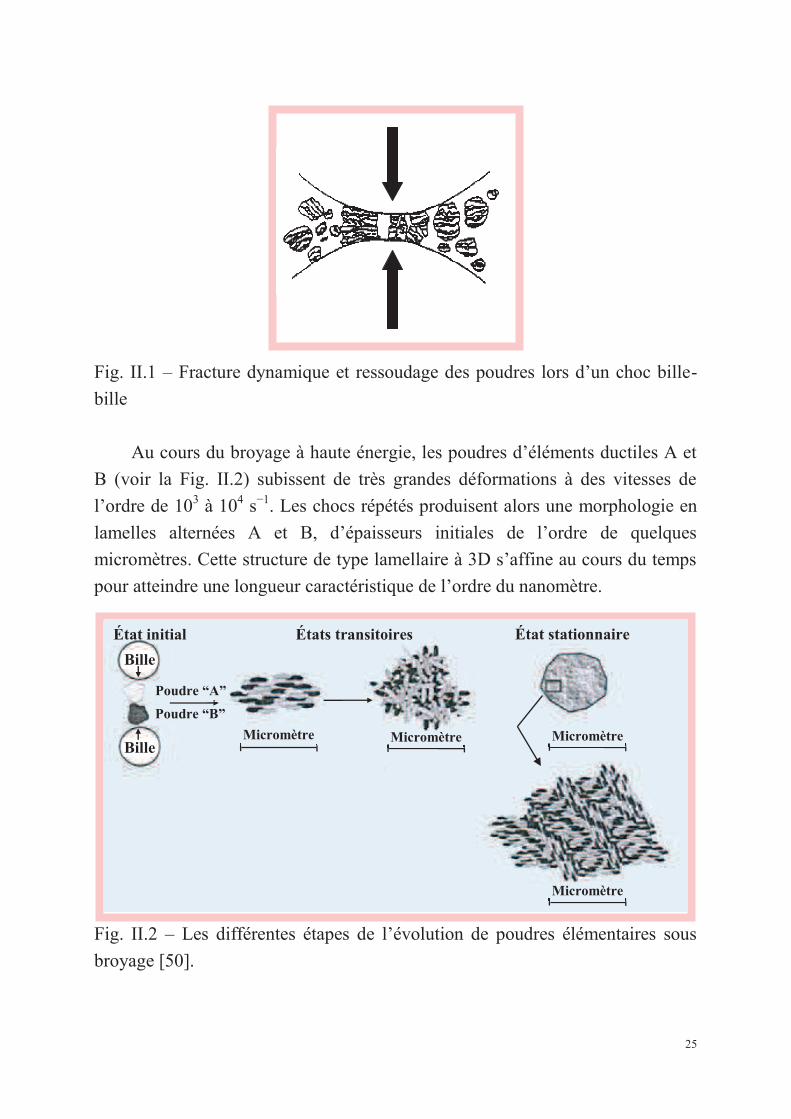
Dans le cas du broyage des poudres métalliques, cet affinement met en jeu
la création de réseaux de dislocations dans des bandes de cisaillement, suivie de
leur réorganisation en joints de grains à faible puis à forte désorientation.
Etat initial : les matériaux introduits dans le broyeur peuvent être des
poudres de constituants élémentaires ou pré-alliés.
Etats transitoires : soumis aux chocs mécaniques, une succession de
fractures et de soudures conduit à la formation de lamelles alternées formées par
les constituants initiaux.
Etat stationnaire : en fin de broyage (de quelques heures à quelques
centaines d’heures), la nature du produit broyé n’évolue plus tant du point de
vue de la nature des phases que leur distribution spatiale (« microstructure »).
II.1.2. Conditions d’élaboration
Le broyeur planétaire de type Retsch PM400 est constitué d’un plateau et de
quatre jarres qui tournent autour de leur propre axe et reposent sur un disque
tournant dans le sens opposé (Fig.II.3a). La force centrifuge créée par la rotation
des jarres et du disque agit sur la poudre et les billes qui se trouvent dans les
jarres (Fig.II.3.b).
Fig. II.3 – Principe de mise en rotation des jarres (a) mouvement des billes à
l’intérieur des jarres (b).
27
II.1.3. Cas des alliages Mg2Ni1−xMnx (x = 0, 0.125, 0.25, 0.375)
Les poudres élémentaires de Mg (pureté de 99.8%, granulométrie ≤50 µm,
GoodFellow), Ni (pureté de 99.5%, granulométrie ≤250 µm, GoodFellow) et Mn
(pureté de 99.3%, granulométrie −325 mesh, Alfa) sont placées dans 4 jarres en
acier au chrome de 50 ml de capacité avec deux billes en acier 100C6 de 20 mm
de diamètre de manière à synthétiser les alliages Mg2Ni1−xMnx (x = 0, 0.125,
0.25, 0.375).
La vitesse de rotation des jarres est de 400 tr/min. Le rapport masse billes/
masse poudre est de 20 :1. Pour éviter l’oxydation des poudres, les jarres sont
scellées sous atmosphère d’argon dans une boite à gants. Afin de minimiser
l’augmentation excessive de la température à l’intérieur des jarres, le broyage est
interrompu toutes les 30 min pendant 30 min.
II.1.4. Cas des alliages Mg2−xAlxNi (x = 0, 0.25) avec ou sans 5% en masse de
nanotubes de carbone multiparois (MWCNTs)
Dans un premier temps, les poudres élémentaires de Mg (Goodfellow) (pureté
de 99.8%, granulométrie ≤50 µm), Ni ( pureté de 99.5%, granulométrie ≤250
µm) et Al (pureté de 99.9%, granulométrie ≤60 µm ) sont placées dans 4 jarres
en acier au chrome de 50 ml de capacité avec deux billes en acier 100C6 de 20
mm de diamètre de manière à synthétiser les alliages Mg2−xAlxNi (x = 0, 0.25)
avec ou sans 5% en masse de nanotubes de carbone multiparois (MWCNTs).
La vitesse de rotation des jarres est de 400 tr/min. Le rapport masse billes/
masse poudre est de 10 :1. Pour éviter l’oxydation des poudres, les jarres sont
scellées sous atmosphère d’argon dans une boite à gants. La durée de broyage
est fixée à 20h. Afin d’éviter un soudage à froid trop sévère, le broyage est
arrêté au bout de 10h afin de « gratter » la poudre collée sur les parois des jarres
et sur les billes. Cette opération assure aussi un mélange complet des poudres
ainsi qu’une composition plus uniforme. Afin de minimiser l’augmentation
excessive de la température à l’intérieur des jarres, le broyage est interrompu
toutes les 30 min pendant 15 min. Dans un second temps, on ajoute 5 wt. % de
nanotubes de carbone multiparois (MWCNTs) (GRAPHISTRENGTH C100, de
28
pureté> 90%, Arkema France) pour élaborer les composites Mg2−xAlxNi (x = 0,
0.25)-MWCNTs.
II.2. Méthodes de caractérisation
II.2.1. Diffraction des rayons X
La méthode la plus simple et couramment utilisée pour l’investigation des
phases et l’analyse microstructurale est la diffraction des rayons X (DRX). Cette
analyse est basée sur l’étude de l’intensité des pics de Bragg et leurs positions
d’équilibre. En effet, dans le cas des poudres broyées, les pics de Bragg
deviennent larges, ce qui indique que les phases sont mal cristallisées. Ceci est
dû à l’affinement de la taille des cristallites et à l’augmentation du taux de
microdéformations. Généralement, les déformations plastiques accélèrent la
diffusion des éléments formant ainsi des solutions solides d’insertion ou de
substitution ce que traduit le décalage des pics de Bragg. Les nouvelles phases
se manifestent, sur les diffractogrammes des rayons X, par l’apparition de
nouveaux pics de diffraction [51]. Les mesures de diffraction de rayons X ont
été réalisées à l’aide d’un diffractomètre Bruker D8 Advance qui utilise la
radiation Ka du Cu de longueur d’onde l=0.15418 nm.
II.2.2. Méthode d’analyse des profils des raies
La méthode de Williamson-Hall [52] est utilisée pour la détermination de la
taille des cristallites et du taux de microdéformations à partir de l’élargissement
des pics de Bragg (Annexe 2 et 3). L’équation de Williamson-Hall [52] est
donnée par :
0.9
cos 2 sind
lb q e q= + (II/1)
29
où β est le largeur à mi-hauteur de pics de Bragg de diffraction excluant
élargissement instrumental, θ le Bragg angle, λ le longueur d’onde de rayons X,
ε la microdéformation et d la taille des cristallites.
Le diagramme de Williamson-Hall s’établit en traçant βcosθ en fonction de
sinθ. Si les points du diagramme s’alignent, la pente et l’ordonnée à l’origine
respectivement permettent de calculer la microdéformation du réseau et la taille
des cristallites.
II.2.3. Microscopie électronique à balayage
Les observations morphologiques ont été réalisées à l’aide d’un microscope
électronique à balayage (MEB) de type JEOL, JSM-5800LV. Il est équipé d’un
système de microanalyse aux rayons X (EDS) qui permet une analyse
quantitative de la composition chimique des poudres.
II.2.4. Microscopie électronique en transmission
Les observations ont été réalisées à l’aide d’un microscope électronique en
transmission JEOL JEM-2100 équipé d’une pointe LaB6 et fonctionnant sous
une tension accélératrice de 200 kV. Des images en champ clair et en champ
sombre ont été prises pour obtenir une estimation de la taille des grains des nos
alliages ainsi que leur évolution. Pour assurer la désagglomération des poudres
nous les avons broyées dans un mortier contenant de l’éthanol. Une goutte de
cette suspension est déposée sur une grille en cuivre recouverte d’une membrane
de carbone. Après séchage, la grille est introduite dans le porte-objet du
microscope éléctrononique en transmission.
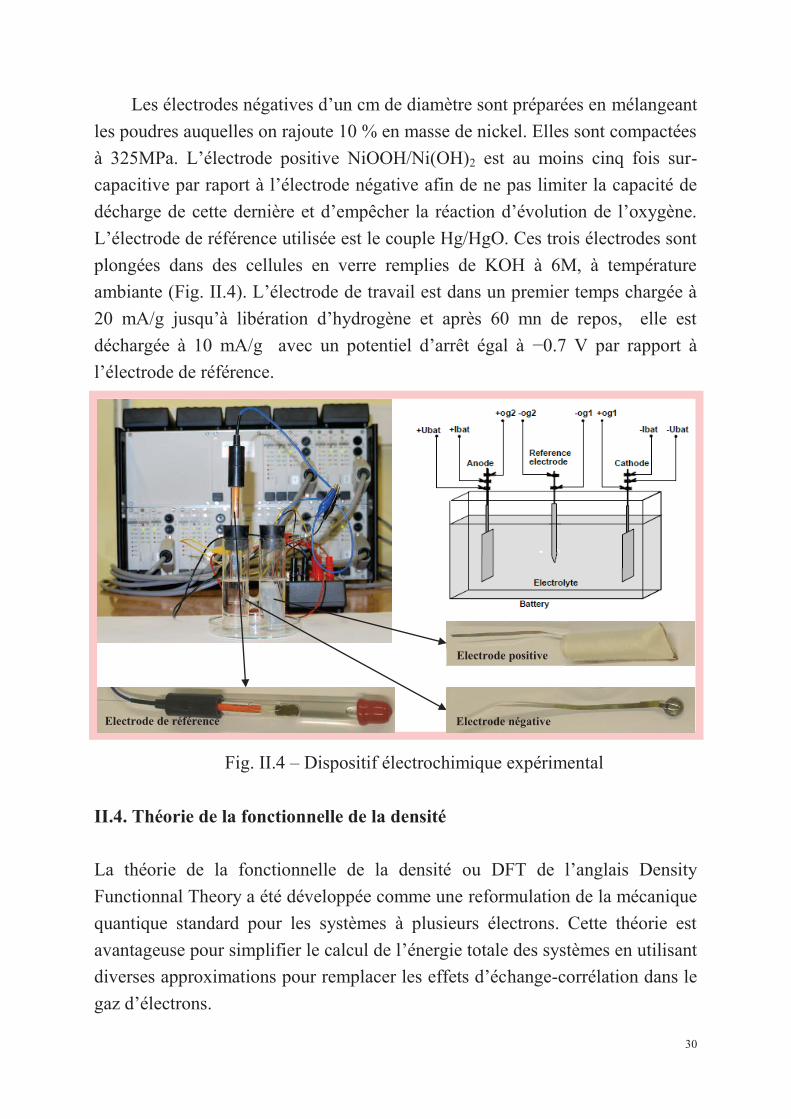
II.3. Les mesures électrochimiques
Les mesures électrochimiques ont permis de mesurer la capacité
électrochimique des électrodes négatives lors de cycles charge/décharge en
utilisant une interface de pile avec multi-canaux ATLAS 0461 montrée dans la
Fig. II.4.
30
Electrode positive
Electrode négative Electrode de référence
Les électrodes négatives d’un cm de diamètre sont préparées en mélangeant
les poudres auquelles on rajoute 10 % en masse de nickel. Elles sont compactées
à 325MPa. L’électrode positive NiOOH/Ni(OH)2 est au moins cinq fois sur-
capacitive par raport à l’électrode négative afin de ne pas limiter la capacité de
décharge de cette dernière et d’empêcher la réaction d’évolution de l’oxygène.
L’électrode de référence utilisée est le couple Hg/HgO. Ces trois électrodes sont
plongées dans des cellules en verre remplies de KOH à 6M, à température
ambiante (Fig. II.4). L’électrode de travail est dans un premier temps chargée à
20 mA/g jusqu’à libération d’hydrogène et après 60 mn de repos, elle est
déchargée à 10 mA/g avec un potentiel d’arrêt égal à −0.7 V par rapport à
l’électrode de référence.
Fig. II.4 – Dispositif électrochimique expérimental
II.4. Théorie de la fonctionnelle de la densité
La théorie de la fonctionnelle de la densité ou DFT de l’anglais Density
Functionnal Theory a été développée comme une reformulation de la mécanique
quantique standard pour les systèmes à plusieurs électrons. Cette théorie est
avantageuse pour simplifier le calcul de l’énergie totale des systèmes en utilisant
diverses approximations pour remplacer les effets d’échange-corrélation dans le
gaz d’électrons.
31
Le point de départ dans cette approche de la théorie de la matière
condensée est l’équation de Schrödinger à plusieurs corps qui peut être écrite
comme:
HΨ( ) = EΨ( )n nN N1 2 1 2 1 2 1 2r , r , ..., r ; R , R ,..., R r , r , ..., r ; R , R , ..., R (II-2)
où ri représente la position du ième électron, RI la position du Ième noyau,
Ψ( )n N1 2 1 2r , r , ..., r ; R , R ,..., R la fonction d’onde à plusieurs corps, H
l’Hamiltonien et E l’énergie totale. L’approximation de Born-Oppenheimer [53]
suppose que les noyaux soient beaucoup plus lourds que les électrons et donc
prennent plus de temps pour réagir à des stimulateurs extérieurs, ce qui indique
que les positions nucléaires peuvent être considérées comme fixées. Par
conséquent, la résolution de l’équation de Schrödinger revient à calculer les
énergies électroniques pour des positions nucléaires fixées. L’énergie pour une
configuration nucléaire donnée sera celle de l’état fondamental des électrons
dans cette configuration. L’équation II-2 peut donc être simplifiée comme:
HΨ( ) = EΨ( )n n1 2 1 2r , r , ..., r r , r , ..., r (II-3)
Bien que l’approximation de Born-Oppenheimer permette de réduire de
façon significative le degré de complexité inhérent à la résolution de l’équation
de Schrödinger, l’équation II-3 restant à résoudre demeure un problème à
plusieurs corps. Dans les systèmes de la matière condensée, à cause du nombre
très élevé de particules, de l’ordre du nombre d’Avogadro, la résolution directe
de l’équation II-3 est impossible. En raison de cette difficulté, des
approximations supplémentaires sont requises pour réaliser de façon effective la
résolution de l’équation de Schrödinger pour les matériaux réels.
La DFT débute par le théorème de Hohenberg et Kohn [54], qui stipule que
toutes les propriétés de l’état fondamental d’un système à plusieurs électrons
sont uniquement déterminées par la densité des électrons qui dépend seulement
de 3 coordonnées spatiales. Il établit les bases pour réduire les 3N coordonnées
spatiales du problème à plusieurs corps de N électrons à 3 coordonnées spatiales
en utilisant des fonctionnelles de la densité électronique. La DFT est fondée sur
les deux principes suivants [54]:
32
(1) L’énergie totale d’un système d’électrons et de noyaux est une
fonctionnelle unique de la densité électronique ;
(2) Le minimum variationnel de l’énergie, équivalent à l’état fondamental
de l’énergie totale, correspond à une densité d’électrons unique.
Spécifiquement, l’énergie totale du système à l’état fondamental est définie
dans le formalisme de la DFT comme une fonctionnelle de la densité
électronique de l’état fondamental. L’énergie totale E peut être écrite comme
[54-56]:
s xc extH ( )E=E[ρ( )] = T [ρ( )]+E [ρ( )]+E [ρ( )]+ V ρ( )dòr r r r r r r (II-4)
où sT [ρ( )]r est l’énergie cinétique d’un système d’électrons non-interactifs avec
la densité ρ( )r , HE [ρ( )]r le terme de Coulomb Hartree qui ne comprend pas les
effets d’échange-corrélation, extV ( )r le potentiel extérieur des ions. xcE [ρ( )]r est
défini comme étant l’énergie d’échange-corrélation d’un système interactif avec
une densité ρ( )r et rend compte des effets à plusieurs corps qui ne sont pas
décrits dans les autres termes. ρ( )r peut être calculée comme suit:
2
ii
ρ( )= ( )får r (II-5)
où i ( )f r est la fonction d’onde d’une particule.
Dans l’équation II-4, la seule fonctionnelle de la densité demeurant
inconnue au sein de ce formalisme correspond à la fonctionnelle d’échange-
corrélation. xcE [ρ( )]r exige une certaine approximation pour rendre cette
méthode « docile » en calcul. Une bonne et simple approximation est
l’approximation de la densité locale (LDA) qui considère le système
électronique comme un gaz d’électrons localement uniforme. La LDA suppose
que la densité de charge varie lentement à l’échelle atomique et donc la LDAxcE [ρ(r)]peut être donnée en supposant que, pour chaque élément infinitésimal
33
de la densité ρ( )dr r , l’énergie d’échange-corrélation est celle d’un gaz
d’électrons uniforme de densité ρ ρ( )= r . Puis,
LDAxc xcE [ρ( )] ρ( )ε [ρ( )]d@ òr r r r (II-6)
Son extension aux systèmes concernant la polarisation de spin prend le nom de
LSDA (local-spin-density approximation). La fonctionnelle d’échange-
corrélation distingue les densités α (spin en haut) et β (spin en bas) sous la
forme :
α β xcLSDAxc α βE [ρ ( ), ρ ( )] ρ( )ε [ρ ( ), ρ ( )]d@ òr r r r r r (II-7 )
où xcε [ρ( )]r est l’énergie d’échange-corrélation par électron dans un gaz
d’électrons uniforme de densité ρ .
La LDA permet d’obtenir des résultats précis mais elle n’est pas applicable
pour tous les systèmes. C’est pourquoi une autre approximation a été
développée : l’approximation des gradients généralisée (GGA) qui inclut la
dépendance sur le gradient de la densité. La GGAxc α βE [ρ ( ), ρ ( )]r r est définie comme:
GGA GGAxc α xc α αβ β βρ ( ), ρ ( )E [ρ ( ), ρ ( )] ε [ρ ( ), ρ ( ), ]ρ( )dÑ Ñ@ ò r rr r r r r r (II-8)
où GGAxc α αβ βρ ( ), ρ ( )[ρ ( ), ρ ( ), ]e Ñ Ñr rr r représente l’énergie d’échange-corrélation
par électron dans un système d’électrons en interaction mutuelle de densité non
uniforme. Elle dépend de la densité électronique et de son gradient. La GGA
améliore les résultats prédits pour des géométries moléculaires et les énergies de
l’état fondamental. Malgré leur succès, la LDA et la GGA ne sont pas toujours
précises et ne peuvent donc pas être universellement applicables. [ρ( )]xcE r reste
le grand défi dans la DFT [57].
CASTEP (Materials studio) [58] est un programme de mécanique
quantique qui utilise les premiers principes basés sur la DFT pour simuler les
propriétés des solides, des interfaces et des surfaces pour une large gamme de

34
classes de matériaux comme les céramiques, des semi-conducteurs et les métaux.
Le calcul par l’intermédiaire des premiers principes permet d’étudier la nature et
l’origine des propriétés électroniques, optiques et structurelles d’un système.

CHAPITRE III RÉSULTATS EXPÉRIMENTAUX
ET DISCUSSION

35
Inte
nsi
té (
Cou
ps)
2θ (degré)
CHAPITRE III : RESULTATS EXPÉRIMENTAUX ET
DISCUSSION
La première partie de ce chapitre présente l’étude structurale et morphologique,
les propriétés de stockage d’hydrogène, le calcul des enthalpies de formation et
l’analyse des structures électroniques par CASTEP des alliages Mg2Ni1−xMnx (x
= 0, 0.125, 0.25, 0.375).
La deuxième partie est consacrée à l’étude structurale et morphologique et
à la caractérisation des propriétés de stockage d’hydrogène des alliages
Mg2−xAlxNi (x = 0, 0.25) avec ou sans nanotubes de carbone multiparois (5
wt. % MWCNTs).
III.1. Cas des alliages Mg2Ni1−xMnx (x = 0, 0.125, 0.25, 0.375) obtenus par
mécanosynthèse
III.1.1. Etude structurale et morphologique
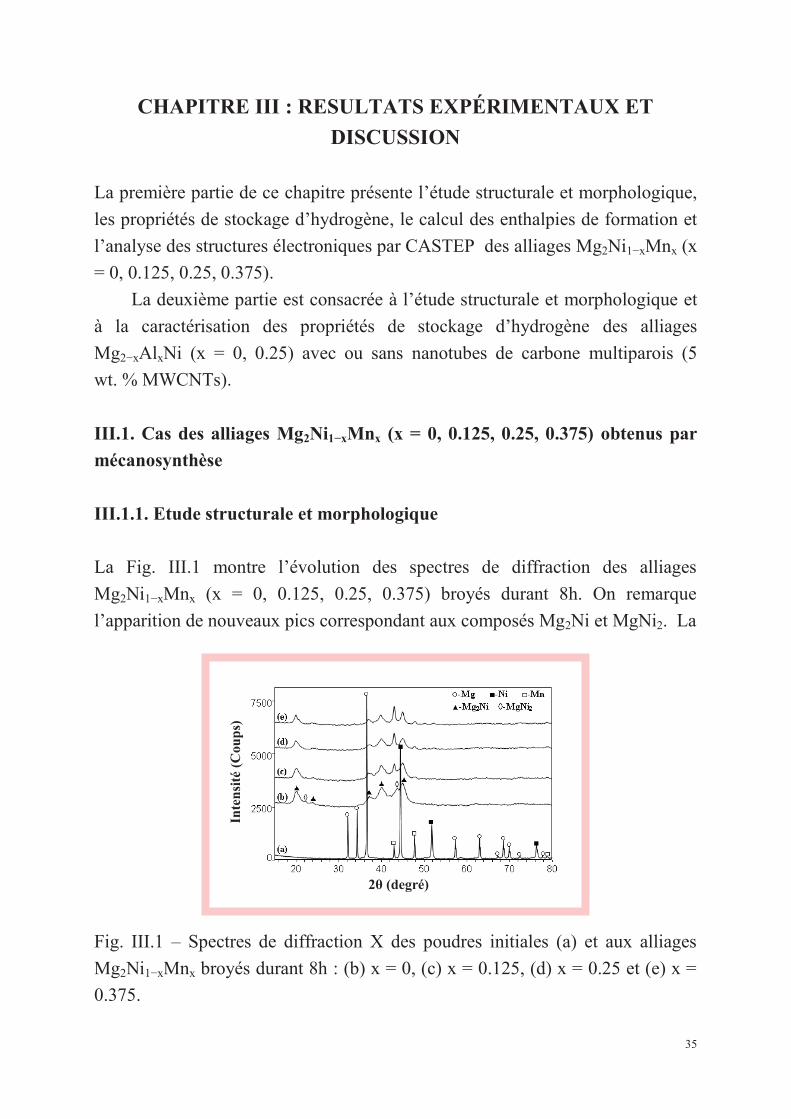
La Fig. III.1 montre l’évolution des spectres de diffraction des alliages
Mg2Ni1−xMnx (x = 0, 0.125, 0.25, 0.375) broyés durant 8h. On remarque
l’apparition de nouveaux pics correspondant aux composés Mg2Ni et MgNi2. La
Fig. III.1 – Spectres de diffraction X des poudres initiales (a) et aux alliages
Mg2Ni1−xMnx broyés durant 8h : (b) x = 0, (c) x = 0.125, (d) x = 0.25 et (e) x =
0.375.
36
phase Mg2Ni existe pour toutes les compositions alors que MgNi2 diminue
quand le pourcentage de Mn augmente. Le Tableau III.1 présente les résultats
obtenus pour toutes les compositions et les différents temps de broyage.
Tableau III.1 – Composition des alliages Mg2Ni1−xMnx (x = 0, 0.125, 0.25,
0.375) obtenus pour différents temps de broyage.
Alliage Composition
4h 8h 16h 24h Mg2Ni Mg, Ni, traces de Mg2Ni Mg2Ni, MgNi2 Mg2Ni, MgNi2 Mg2Ni, MgNi2
Mg2Ni0.875Mn0.125 Mg, Ni, Mn Mg2Ni, Mn, traces de MgNi2 Mg2Ni, Mn, traces de MgNi2 Mg2Ni, Mn, traces de MgNi2
Mg2Ni0.75Mn0.25 Mg, Ni, Mn Mg2Ni, Mn Mg2Ni, Mn Mg2Ni, Mn
Mg2Ni0.625Mn0.375 Mg, Ni, Mn Mg2Ni, Mn Mg2Ni, Mn Mg2Ni, Mn
Ce phénomène indique que la substitution du nickel par du manganèse
empêche la formation de la phase MgNi2, qui peut être attribué à un changement
dans les proportions atomiques entre Mg et Ni. Au cours de la mécanosynthèse,
Mg qui est ductile se colle facilement aux billes et aux parois des jarres, le
pourcentage réel de Ni est supérieur à et proche de 33 at. % pour x = 0 et x=
0.125 (la substitution d’une faible quantité), respectivement. Donc, Mg2Ni et
une faible quantité de MgNi2 coéxistent pour x= 0 et x=0.125. Après qu’une
quantité importante de Mn soit substituée à Ni, le pourcentage de Ni devient
inférieur à 33 at. %. Par conséquent, la phase MgNi2 disparaît pour x=0.25 et
x=0.375. Contrairement à Mg2Ni, la phase MgNi2 ne réagit pas avec
l’hydrogène [59].
La substitution de Ni par Mn favorise donc la synthèse de Mg2Ni et
améliore la capacité de stockage d’hydrogène en contribuant à la réaction entre
Mg et Ni pour former Mg2Ni.
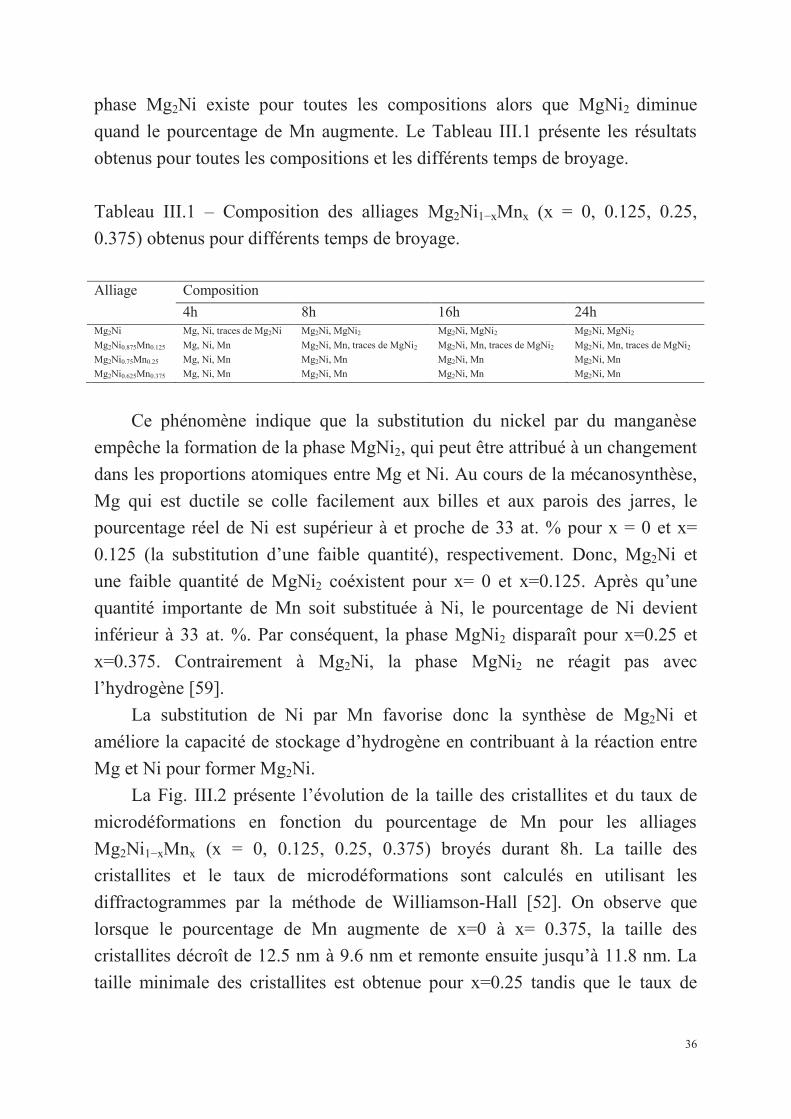
La Fig. III.2 présente l’évolution de la taille des cristallites et du taux de
microdéformations en fonction du pourcentage de Mn pour les alliages
Mg2Ni1−xMnx (x = 0, 0.125, 0.25, 0.375) broyés durant 8h. La taille des
cristallites et le taux de microdéformations sont calculés en utilisant les
diffractogrammes par la méthode de Williamson-Hall [52]. On observe que
lorsque le pourcentage de Mn augmente de x=0 à x= 0.375, la taille des
cristallites décroît de 12.5 nm à 9.6 nm et remonte ensuite jusqu’à 11.8 nm. La
taille minimale des cristallites est obtenue pour x=0.25 tandis que le taux de
37
microdéformations décroît de 1.39 % à 0.82 %. Ces valeurs ont été calculées en
utilisant l’équation II-1.
Fig. III.2 – Evolution de la taille des cristallites et du taux de microdéformations
des alliages Mg2Ni1−xMnx (x = 0, 0.125, 0.25, 0.375) broyés durant 8 h en
fonction de x (pourcentage de Mn).
Les microdéformations induites contribuent à la diffusion en réduisant
l’hystérisis d’absorption et de désorption d’hydrogène [60]. La formation de
Mg2Ni nanocristallin engendre une quantité importante de joints de grains
fournissant des canaux qui facilitent la diffusion des atomes d’hydrogène. En
même temps, l’échelle nanométrique de l’alliage Mg2Ni permet d’éviter la
diffusion de longue portée des atomes d’hydrogène à travers les phases
d’hydrure formées [32]. Ainsi les cinétiques d’hydruration et de deshydruration
peuvent être améliorées par l’introduction de microdéformations et de réduction
de la taille des cristallites.
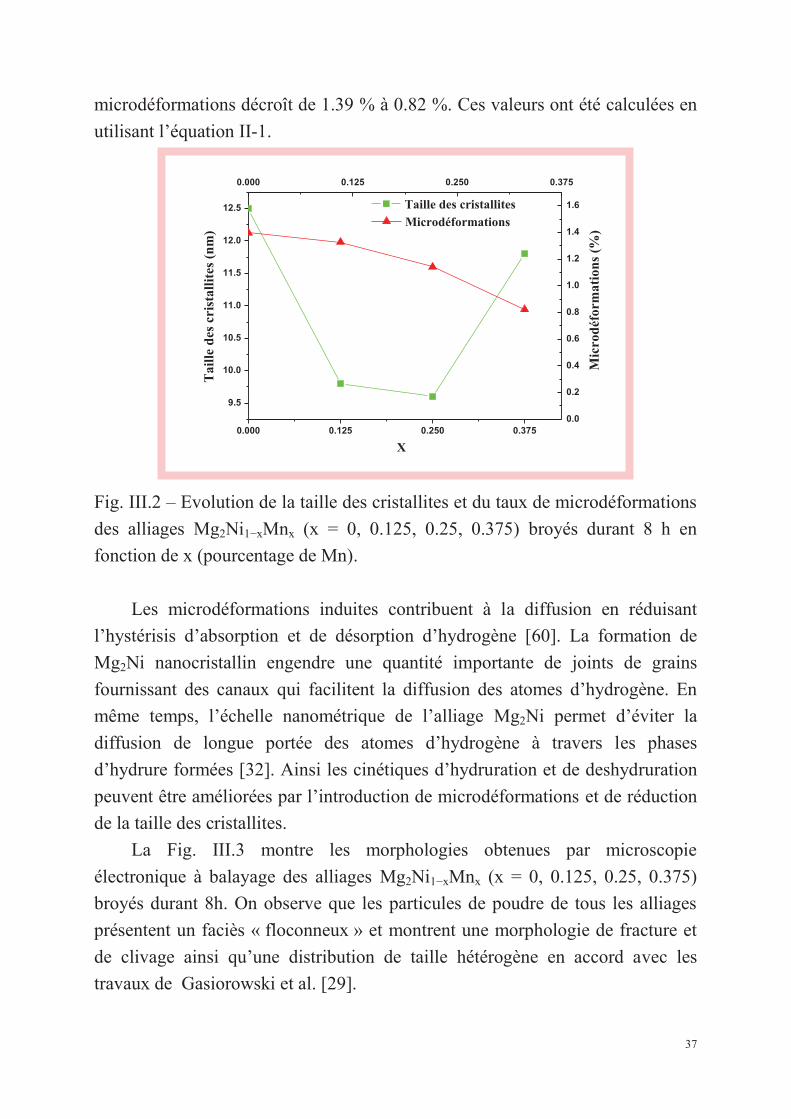
La Fig. III.3 montre les morphologies obtenues par microscopie
électronique à balayage des alliages Mg2Ni1−xMnx (x = 0, 0.125, 0.25, 0.375)
broyés durant 8h. On observe que les particules de poudre de tous les alliages
présentent un faciès « floconneux » et montrent une morphologie de fracture et
de clivage ainsi qu’une distribution de taille hétérogène en accord avec les
travaux de Gasiorowski et al. [29].
0.000 0.125 0.250 0.375
9.5
10.0
10.5
11.0
11.5
12.0
12.5
0.0
0.2
0.4
0.6
0.8
1.0
1.2
1.4
1.6
0.000 0.125 0.250 0.375
Taille des cristallites T
aill
e d
es c
rist
alli
tes
(nm
)
X
Microdéformations
Mic
rod
éfor
mat
ion
s (%
)
38
a b
c d
Fig. III.3 – Morphologies MEB des alliages Mg2Ni1−xMnx broyés pendant 8 h:
(a) x = 0, (b) x = 0.125, (c) x = 0.25 et (d) x = 0.375.
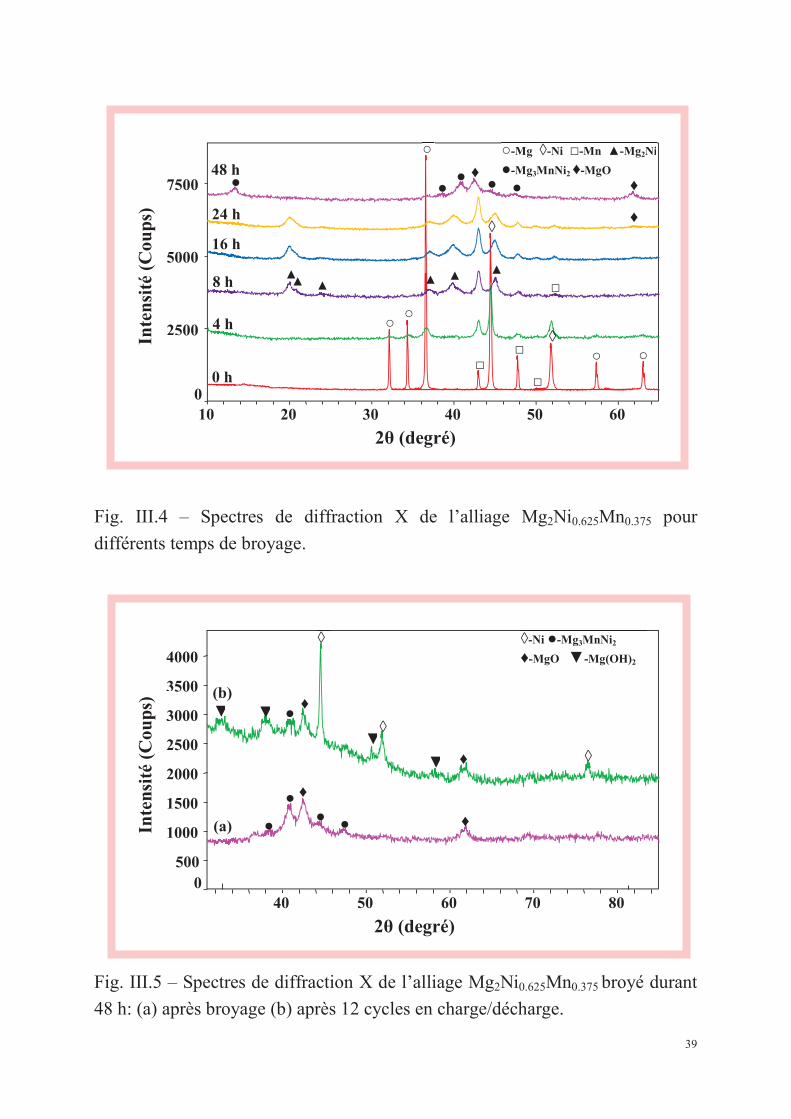
La Fig. III.4 présente les spectres de diffraction X de l’alliage
Mg2Ni0.625Mn0.375 broyé à différents temps. Après un broyage d’une durée de 48
h, on remarque l’apparition d’une nouvelle phase Mg3MnNi2. Cette nouvelle
phase est de structure cubique à faces centrées (Fd-3m) avec un paramètre de
maille égal à 1.1484 nm. La taille des cristallites et le taux de microdéformations
calculés à partir de l’équation II-1 sont respectivement égaux à 15.6 nm et
1.09%. Le mécanisme de formation de cette nouvelle phase peut s’expliquer de
la manière suivante : avec l’augmentation du temps de broyage, la structure de la
phase Mg2Ni est détruite et simultanément on a la formation d’une phase
amorphe. Ensuite, on assiste à un réarrangement des atomes Mg, Ni et Mn pour
former Mg3MnNi2 (Annex 3). Notons que les principaux pics caractéristiques de
cette nouvelle phase apparaissent uniquement pour x=0.375 et pour une durée de
broyage fixée à 48h.
39
10 20 30 40 50 60
2θ (degré)
0
2500
5000
7500
25
50
Inte
nsit
é (C
oups
) ○-Mg ◊-Ni □-Mn ▲-Mg2Ni
●-Mg3MnNi2 ♦-MgO
0 h
4 h
8 h
16 h
24 h
48 h
▲ ▲
▲▲ ▲ ▲ ▲
○ ○
○
□ □
◊
◊ ○ ○
h● ●
● ● ♦
♦ ●
□
□
♦
40 50 60 70 80 0
500
1000
1500
2000
2500
3000
3500
4000
10
15
20
25
30
35
40
Inte
nsit
é (C
oups
)
◊-Ni ●-Mg3MnNi2
♦-MgO ▼-Mg(OH)2
▼ ▼
▼
▼ ♦
●
●
◊
◊
◊
♦
♦
♦ ●
● ● (a)
▼
(b)
2θ (degré)
Fig. III.4 – Spectres de diffraction X de l’alliage Mg2Ni0.625Mn0.375 pour
différents temps de broyage.
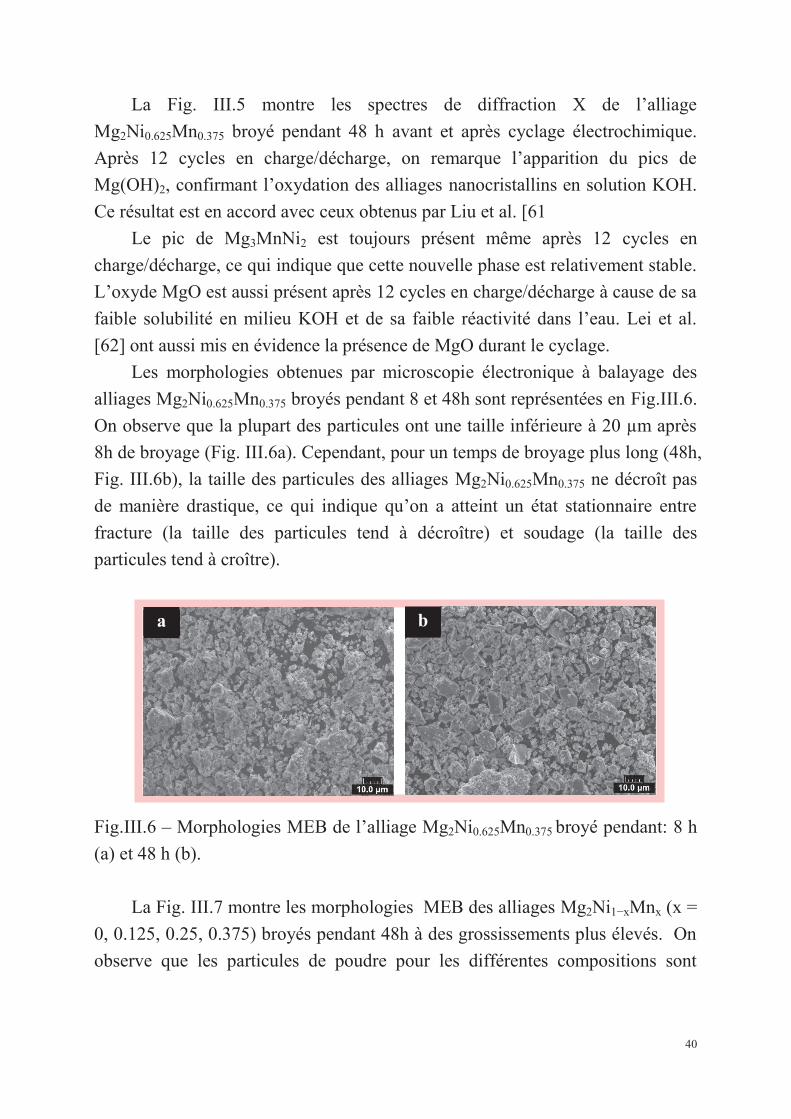
Fig. III.5 – Spectres de diffraction X de l’alliage Mg2Ni0.625Mn0.375 broyé durant
48 h: (a) après broyage (b) après 12 cycles en charge/décharge.
40
a b
La Fig. III.5 montre les spectres de diffraction X de l’alliage
Mg2Ni0.625Mn0.375 broyé pendant 48 h avant et après cyclage électrochimique.
Après 12 cycles en charge/décharge, on remarque l’apparition du pics de
Mg(OH)2, confirmant l’oxydation des alliages nanocristallins en solution KOH.
Ce résultat est en accord avec ceux obtenus par Liu et al. [61
Le pic de Mg3MnNi2 est toujours présent même après 12 cycles en
charge/décharge, ce qui indique que cette nouvelle phase est relativement stable.
L’oxyde MgO est aussi présent après 12 cycles en charge/décharge à cause de sa
faible solubilité en milieu KOH et de sa faible réactivité dans l’eau. Lei et al.
[62] ont aussi mis en évidence la présence de MgO durant le cyclage.
Les morphologies obtenues par microscopie électronique à balayage des
alliages Mg2Ni0.625Mn0.375 broyés pendant 8 et 48h sont représentées en Fig.III.6.
On observe que la plupart des particules ont une taille inférieure à 20 µm après
8h de broyage (Fig. III.6a). Cependant, pour un temps de broyage plus long (48h,
Fig. III.6b), la taille des particules des alliages Mg2Ni0.625Mn0.375 ne décroît pas
de manière drastique, ce qui indique qu’on a atteint un état stationnaire entre
fracture (la taille des particules tend à décroître) et soudage (la taille des
particules tend à croître).
Fig.III.6 – Morphologies MEB de l’alliage Mg2Ni0.625Mn0.375 broyé pendant: 8 h
(a) et 48 h (b).
La Fig. III.7 montre les morphologies MEB des alliages Mg2Ni1−xMnx (x =
0, 0.125, 0.25, 0.375) broyés pendant 48h à des grossissements plus élevés. On
observe que les particules de poudre pour les différentes compositions sont
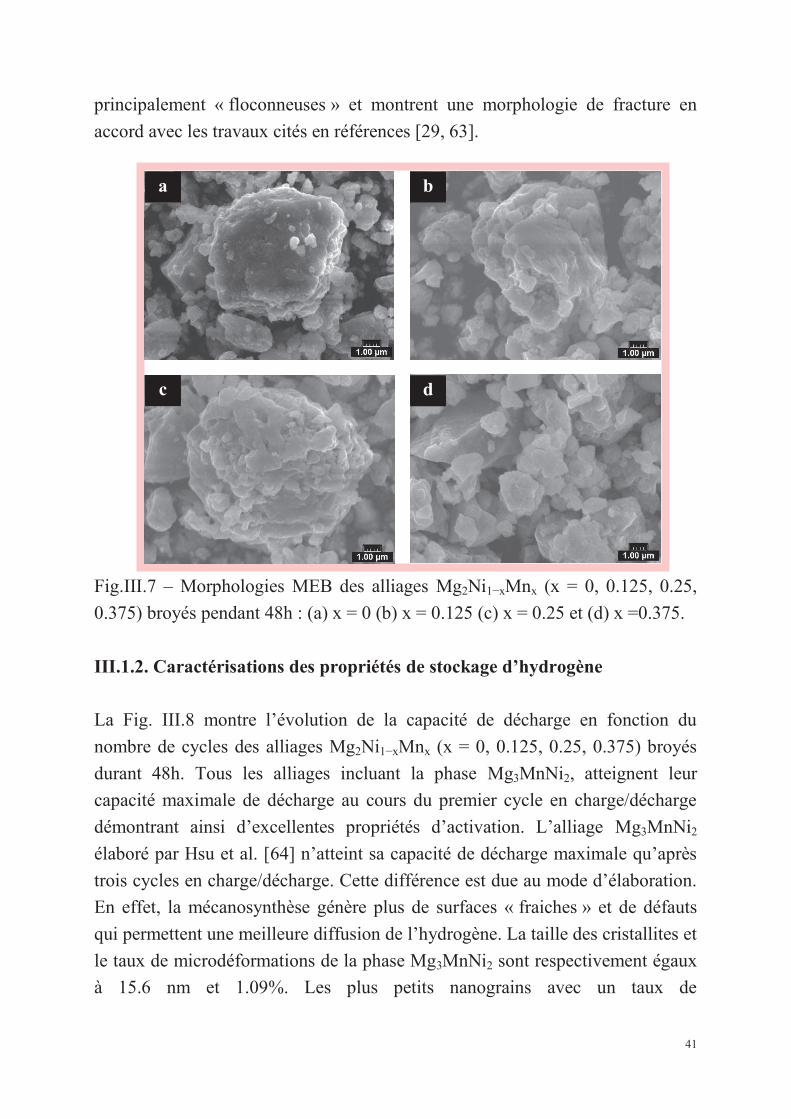
41
a b
c d
principalement « floconneuses » et montrent une morphologie de fracture en
accord avec les travaux cités en références [29, 63].
Fig.III.7 – Morphologies MEB des alliages Mg2Ni1−xMnx (x = 0, 0.125, 0.25,
0.375) broyés pendant 48h : (a) x = 0 (b) x = 0.125 (c) x = 0.25 et (d) x =0.375.
III.1.2. Caractérisations des propriétés de stockage d’hydrogène
La Fig. III.8 montre l’évolution de la capacité de décharge en fonction du
nombre de cycles des alliages Mg2Ni1−xMnx (x = 0, 0.125, 0.25, 0.375) broyés
durant 48h. Tous les alliages incluant la phase Mg3MnNi2, atteignent leur
capacité maximale de décharge au cours du premier cycle en charge/décharge
démontrant ainsi d’excellentes propriétés d’activation. L’alliage Mg3MnNi2
élaboré par Hsu et al. [64] n’atteint sa capacité de décharge maximale qu’après
trois cycles en charge/décharge. Cette différence est due au mode d’élaboration.
En effet, la mécanosynthèse génère plus de surfaces « fraiches » et de défauts
qui permettent une meilleure diffusion de l’hydrogène. La taille des cristallites et
le taux de microdéformations de la phase Mg3MnNi2 sont respectivement égaux
à 15.6 nm et 1.09%. Les plus petits nanograins avec un taux de
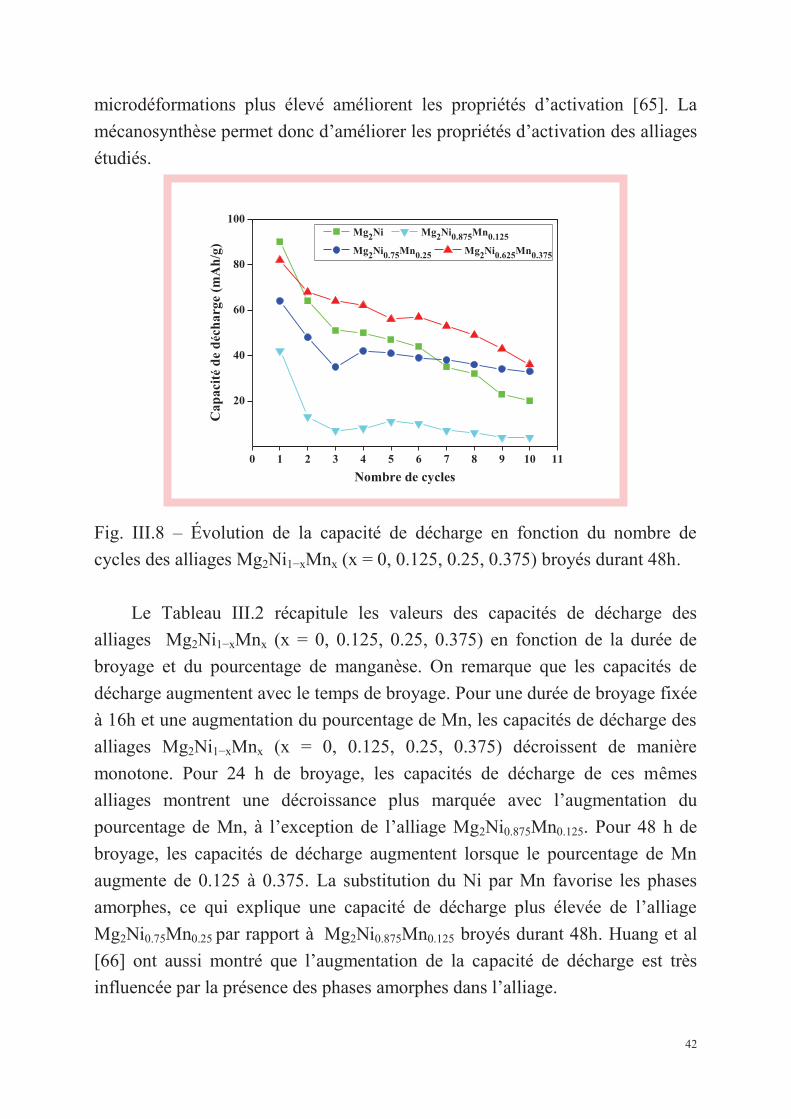
42
microdéformations plus élevé améliorent les propriétés d’activation [65]. La
mécanosynthèse permet donc d’améliorer les propriétés d’activation des alliages
étudiés.
Fig. III.8 – Évolution de la capacité de décharge en fonction du nombre de
cycles des alliages Mg2Ni1−xMnx (x = 0, 0.125, 0.25, 0.375) broyés durant 48h.
Le Tableau III.2 récapitule les valeurs des capacités de décharge des
alliages Mg2Ni1−xMnx (x = 0, 0.125, 0.25, 0.375) en fonction de la durée de
broyage et du pourcentage de manganèse. On remarque que les capacités de
décharge augmentent avec le temps de broyage. Pour une durée de broyage fixée
à 16h et une augmentation du pourcentage de Mn, les capacités de décharge des
alliages Mg2Ni1−xMnx (x = 0, 0.125, 0.25, 0.375) décroissent de manière
monotone. Pour 24 h de broyage, les capacités de décharge de ces mêmes
alliages montrent une décroissance plus marquée avec l’augmentation du
pourcentage de Mn, à l’exception de l’alliage Mg2Ni0.875Mn0.125. Pour 48 h de
broyage, les capacités de décharge augmentent lorsque le pourcentage de Mn
augmente de 0.125 à 0.375. La substitution du Ni par Mn favorise les phases
amorphes, ce qui explique une capacité de décharge plus élevée de l’alliage
Mg2Ni0.75Mn0.25 par rapport à Mg2Ni0.875Mn0.125 broyés durant 48h. Huang et al
[66] ont aussi montré que l’augmentation de la capacité de décharge est très
influencée par la présence des phases amorphes dans l’alliage.
0 1 2 3 4 5 6 7 8 9 10 11
20
40
60
80
100 Mg2Ni Mg2Ni0.875Mn0.125
Mg2Ni0.75Mn0.25 Mg2Ni0.625Mn0.375
Cap
acit
é d
e d
éch
arge
(m
Ah
/g)
Nombre de cycles
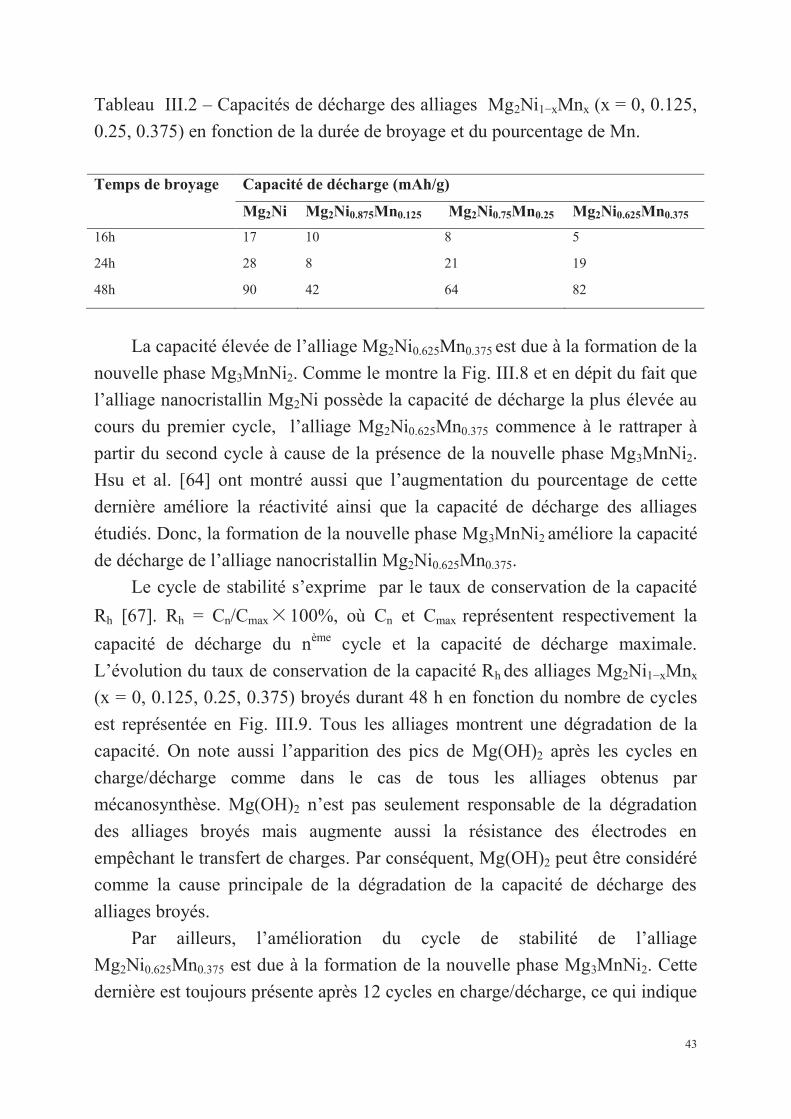
43
Tableau III.2 – Capacités de décharge des alliages Mg2Ni1−xMnx (x = 0, 0.125,
0.25, 0.375) en fonction de la durée de broyage et du pourcentage de Mn.
Temps de broyage Capacité de décharge (mAh/g)
Mg2Ni Mg2Ni0.875Mn0.125 Mg2Ni0.75Mn0.25 Mg2Ni0.625Mn0.375
16h 17 10 8 5
24h 28 8 21 19
48h 90 42 64 82
La capacité élevée de l’alliage Mg2Ni0.625Mn0.375 est due à la formation de la
nouvelle phase Mg3MnNi2. Comme le montre la Fig. III.8 et en dépit du fait que
l’alliage nanocristallin Mg2Ni possède la capacité de décharge la plus élevée au
cours du premier cycle, l’alliage Mg2Ni0.625Mn0.375 commence à le rattraper à
partir du second cycle à cause de la présence de la nouvelle phase Mg3MnNi2.
Hsu et al. [64] ont montré aussi que l’augmentation du pourcentage de cette
dernière améliore la réactivité ainsi que la capacité de décharge des alliages
étudiés. Donc, la formation de la nouvelle phase Mg3MnNi2 améliore la capacité
de décharge de l’alliage nanocristallin Mg2Ni0.625Mn0.375.
Le cycle de stabilité s’exprime par le taux de conservation de la capacité
Rh [67]. Rh = Cn/Cmax⁄100%, où Cn et Cmax représentent respectivement la
capacité de décharge du nème cycle et la capacité de décharge maximale.
L’évolution du taux de conservation de la capacité Rh des alliages Mg2Ni1−xMnx
(x = 0, 0.125, 0.25, 0.375) broyés durant 48 h en fonction du nombre de cycles
est représentée en Fig. III.9. Tous les alliages montrent une dégradation de la
capacité. On note aussi l’apparition des pics de Mg(OH)2 après les cycles en
charge/décharge comme dans le cas de tous les alliages obtenus par
mécanosynthèse. Mg(OH)2 n’est pas seulement responsable de la dégradation
des alliages broyés mais augmente aussi la résistance des électrodes en
empêchant le transfert de charges. Par conséquent, Mg(OH)2 peut être considéré
comme la cause principale de la dégradation de la capacité de décharge des
alliages broyés.
Par ailleurs, l’amélioration du cycle de stabilité de l’alliage
Mg2Ni0.625Mn0.375 est due à la formation de la nouvelle phase Mg3MnNi2. Cette
dernière est toujours présente après 12 cycles en charge/décharge, ce qui indique
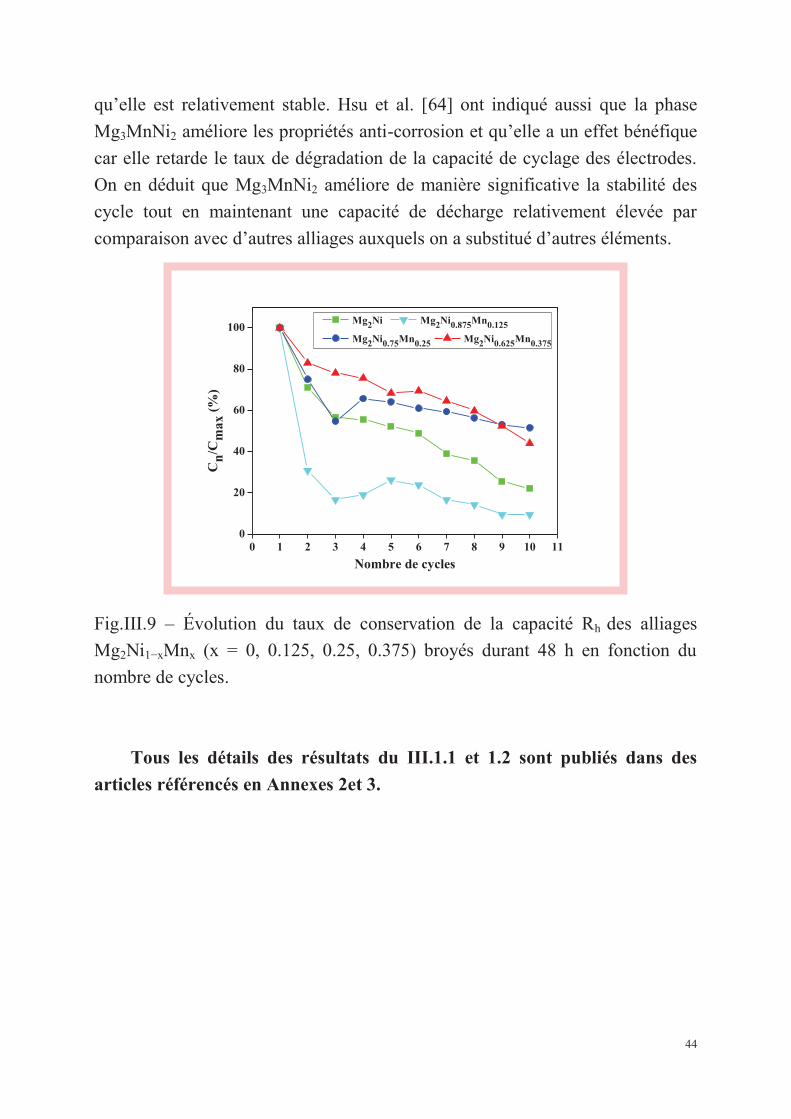
44
qu’elle est relativement stable. Hsu et al. [64] ont indiqué aussi que la phase
Mg3MnNi2 améliore les propriétés anti-corrosion et qu’elle a un effet bénéfique
car elle retarde le taux de dégradation de la capacité de cyclage des électrodes.
On en déduit que Mg3MnNi2 améliore de manière significative la stabilité des
cycle tout en maintenant une capacité de décharge relativement élevée par
comparaison avec d’autres alliages auxquels on a substitué d’autres éléments.
Fig.III.9 – Évolution du taux de conservation de la capacité Rh des alliages
Mg2Ni1−xMnx (x = 0, 0.125, 0.25, 0.375) broyés durant 48 h en fonction du
nombre de cycles.
Tous les détails des résultats du III.1.1 et 1.2 sont publiés dans des
articles référencés en Annexes 2et 3.
0 1 2 3 4 5 6 7 8 9 10 110
20
40
60
80
100 Mg2Ni Mg2Ni0.875Mn0.125
Mg2Ni0.75Mn0.25 Mg2Ni0.625Mn0.375
Cn
/Cm
ax (
%)
Nombre de cycles
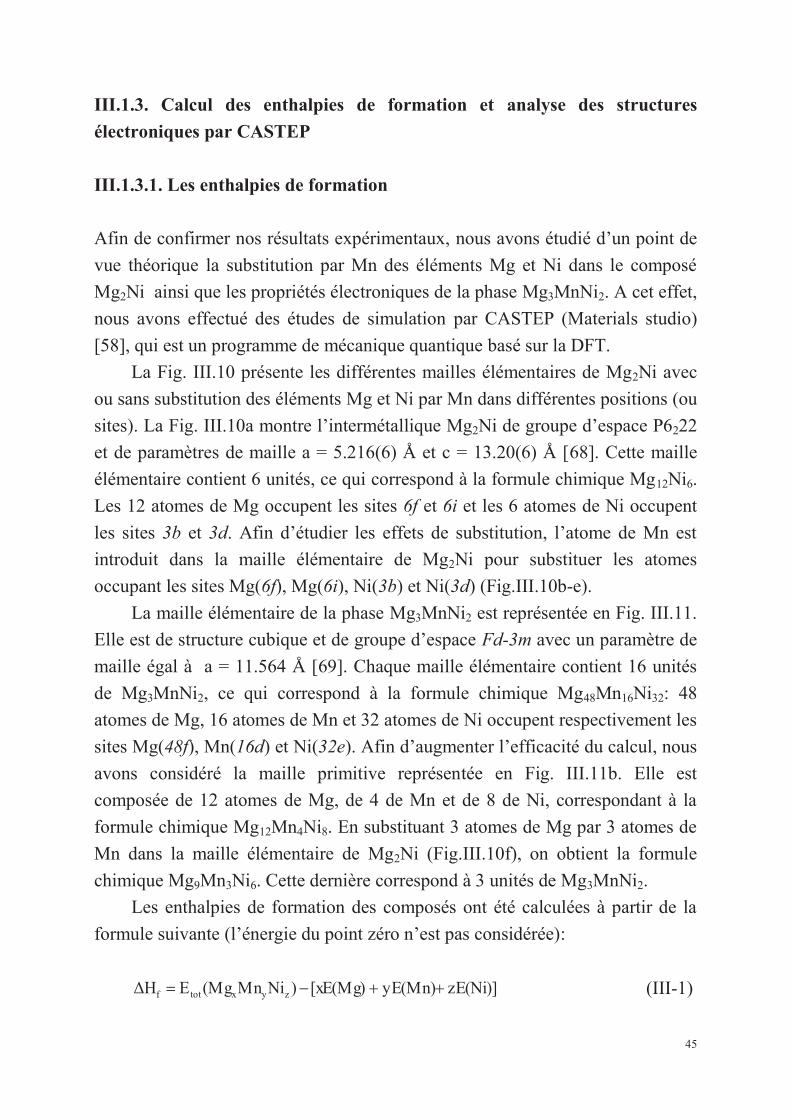
45
III.1.3. Calcul des enthalpies de formation et analyse des structures
électroniques par CASTEP
III.1.3.1. Les enthalpies de formation
Afin de confirmer nos résultats expérimentaux, nous avons étudié d’un point de
vue théorique la substitution par Mn des éléments Mg et Ni dans le composé
Mg2Ni ainsi que les propriétés électroniques de la phase Mg3MnNi2. A cet effet,
nous avons effectué des études de simulation par CASTEP (Materials studio)
[58], qui est un programme de mécanique quantique basé sur la DFT.
La Fig. III.10 présente les différentes mailles élémentaires de Mg2Ni avec
ou sans substitution des éléments Mg et Ni par Mn dans différentes positions (ou
sites). La Fig. III.10a montre l’intermétallique Mg2Ni de groupe d’espace P6222
et de paramètres de maille a = 5.216(6) Å et c = 13.20(6) Å [68]. Cette maille
élémentaire contient 6 unités, ce qui correspond à la formule chimique Mg12Ni6.
Les 12 atomes de Mg occupent les sites 6f et 6i et les 6 atomes de Ni occupent
les sites 3b et 3d. Afin d’étudier les effets de substitution, l’atome de Mn est
introduit dans la maille élémentaire de Mg2Ni pour substituer les atomes
occupant les sites Mg(6f), Mg(6i), Ni(3b) et Ni(3d) (Fig.III.10b-e).
La maille élémentaire de la phase Mg3MnNi2 est représentée en Fig. III.11.
Elle est de structure cubique et de groupe d’espace Fd-3m avec un paramètre de
maille égal à a = 11.564 Å [69]. Chaque maille élémentaire contient 16 unités
de Mg3MnNi2, ce qui correspond à la formule chimique Mg48Mn16Ni32: 48
atomes de Mg, 16 atomes de Mn et 32 atomes de Ni occupent respectivement les
sites Mg(48f), Mn(16d) et Ni(32e). Afin d’augmenter l’efficacité du calcul, nous
avons considéré la maille primitive représentée en Fig. III.11b. Elle est
composée de 12 atomes de Mg, de 4 de Mn et de 8 de Ni, correspondant à la
formule chimique Mg12Mn4Ni8. En substituant 3 atomes de Mg par 3 atomes de
Mn dans la maille élémentaire de Mg2Ni (Fig.III.10f), on obtient la formule
chimique Mg9Mn3Ni6. Cette dernière correspond à 3 unités de Mg3MnNi2.
Les enthalpies de formation des composés ont été calculées à partir de la
formule suivante (l’énergie du point zéro n’est pas considérée):
zE(Ni)]yE(Mn)[xE(Mg))NiMn(MgEΔH zyxtotf ++-= (III-1)
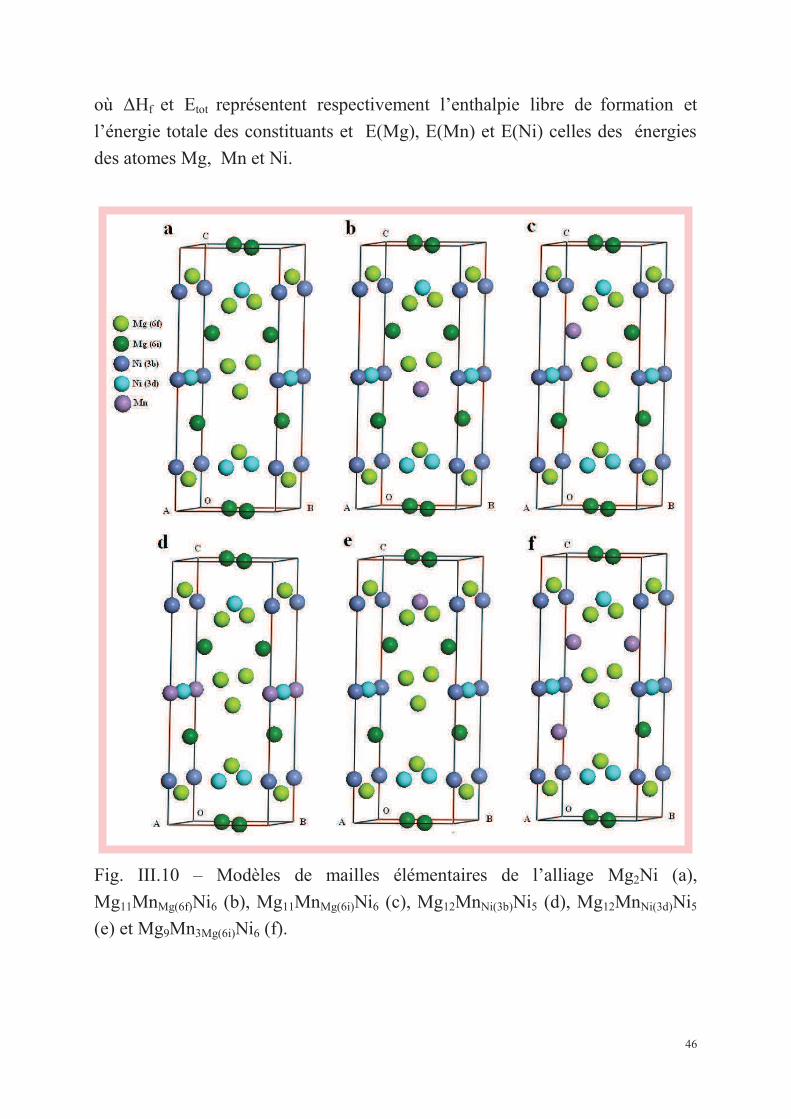
46
où ΔHf et Etot représentent respectivement l’enthalpie libre de formation et
l’énergie totale des constituants et E(Mg), E(Mn) et E(Ni) celles des énergies
des atomes Mg, Mn et Ni.
Fig. III.10 – Modèles de mailles élémentaires de l’alliage Mg2Ni (a),
Mg11MnMg(6f)Ni6 (b), Mg11MnMg(6i)Ni6 (c), Mg12MnNi(3b)Ni5 (d), Mg12MnNi(3d)Ni5
(e) et Mg9Mn3Mg(6i)Ni6 (f).
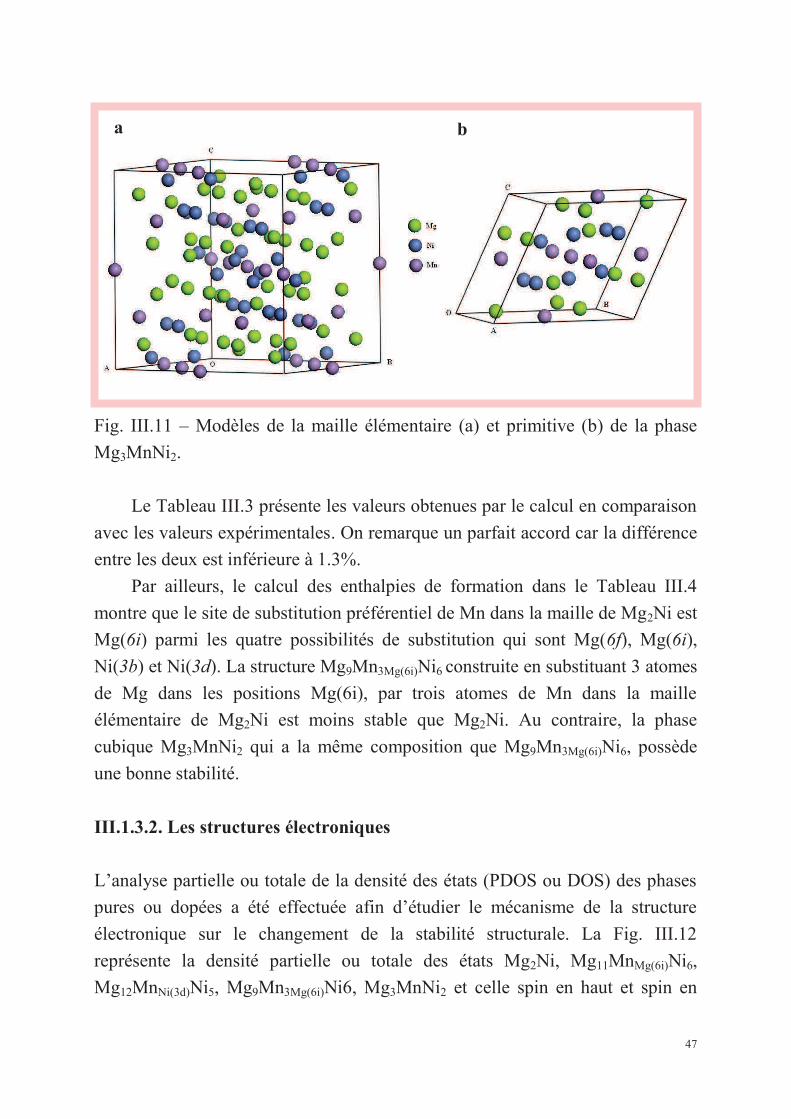
47
a b
Fig. III.11 – Modèles de la maille élémentaire (a) et primitive (b) de la phase
Mg3MnNi2.
Le Tableau III.3 présente les valeurs obtenues par le calcul en comparaison
avec les valeurs expérimentales. On remarque un parfait accord car la différence
entre les deux est inférieure à 1.3%.
Par ailleurs, le calcul des enthalpies de formation dans le Tableau III.4
montre que le site de substitution préférentiel de Mn dans la maille de Mg2Ni est
Mg(6i) parmi les quatre possibilités de substitution qui sont Mg(6f), Mg(6i),
Ni(3b) et Ni(3d). La structure Mg9Mn3Mg(6i)Ni6 construite en substituant 3 atomes
de Mg dans les positions Mg(6i), par trois atomes de Mn dans la maille
élémentaire de Mg2Ni est moins stable que Mg2Ni. Au contraire, la phase
cubique Mg3MnNi2 qui a la même composition que Mg9Mn3Mg(6i)Ni6, possède
une bonne stabilité.
III.1.3.2. Les structures électroniques
L’analyse partielle ou totale de la densité des états (PDOS ou DOS) des phases
pures ou dopées a été effectuée afin d’étudier le mécanisme de la structure
électronique sur le changement de la stabilité structurale. La Fig. III.12
représente la densité partielle ou totale des états Mg2Ni, Mg11MnMg(6i)Ni6,
Mg12MnNi(3d)Ni5, Mg9Mn3Mg(6i)Ni6, Mg3MnNi2 et celle spin en haut et spin en
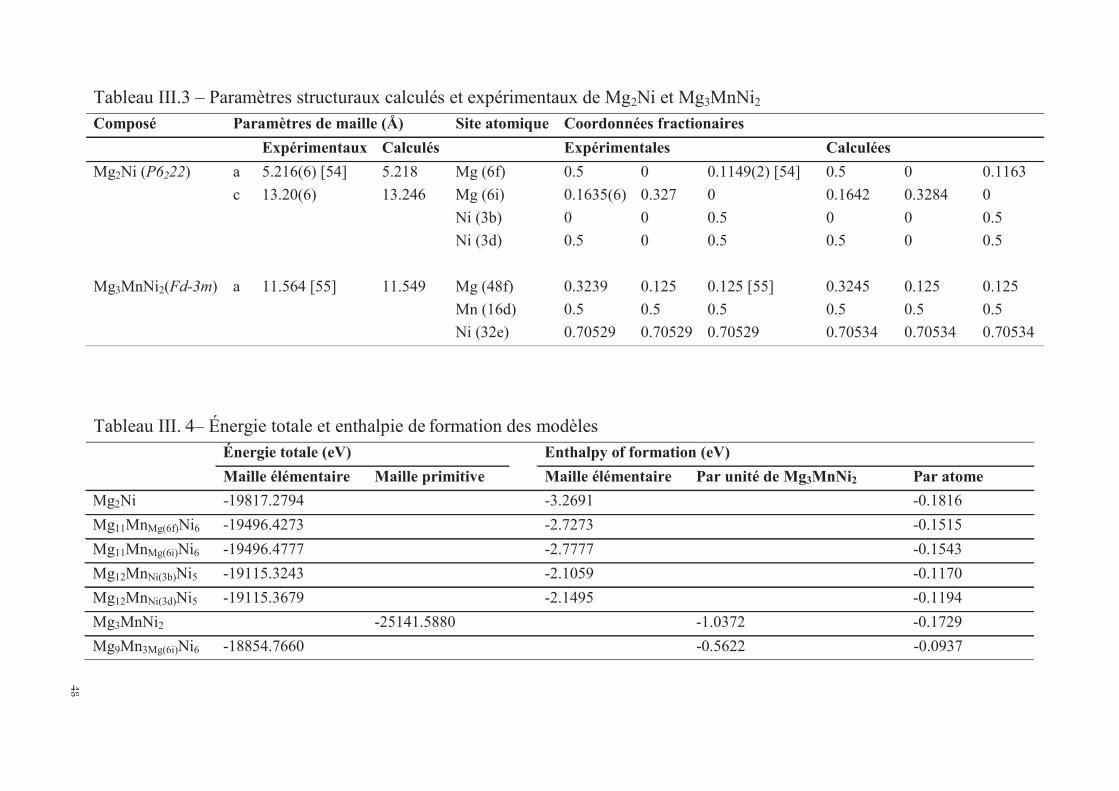
48
48
Tableau III.3 – Paramètres structuraux calculés et expérimentaux de Mg2Ni et Mg3MnNi2
Composé Paramètres de maille (Å) Site atomique Coordonnées fractionaires
Expérimentaux Calculés Expérimentales Calculées
Mg2Ni (P6222) a 5.216(6) [54] 5.218 Mg (6f) 0.5 0 0.1149(2) [54] 0.5 0 0.1163
c 13.20(6) 13.246 Mg (6i) 0.1635(6) 0.327 0 0.1642 0.3284 0
Ni (3b) 0 0 0.5 0 0 0.5
Ni (3d) 0.5 0 0.5 0.5 0 0.5
Mg3MnNi2(Fd-3m) a 11.564 [55] 11.549 Mg (48f) 0.3239 0.125 0.125 [55] 0.3245 0.125 0.125
Mn (16d) 0.5 0.5 0.5 0.5 0.5 0.5
Ni (32e) 0.70529 0.70529 0.70529 0.70534 0.70534 0.70534
Tableau III. 4– Énergie totale et enthalpie de formation des modèles
Énergie totale (eV) Enthalpy of formation (eV)
Maille élémentaire Maille primitive Maille élémentaire Par unité de Mg3MnNi2 Par atome
Mg2Ni -19817.2794 -3.2691 -0.1816
Mg11MnMg(6f)Ni6 -19496.4273 -2.7273 -0.1515
Mg11MnMg(6i)Ni6 -19496.4777 -2.7777 -0.1543
Mg12MnNi(3b)Ni5 -19115.3243 -2.1059 -0.1170
Mg12MnNi(3d)Ni5 -19115.3679 -2.1495 -0.1194
Mg3MnNi2 -25141.5880 -1.0372 -0.1729
Mg9Mn3Mg(6i)Ni6 -18854.7660 -0.5622 -0.0937
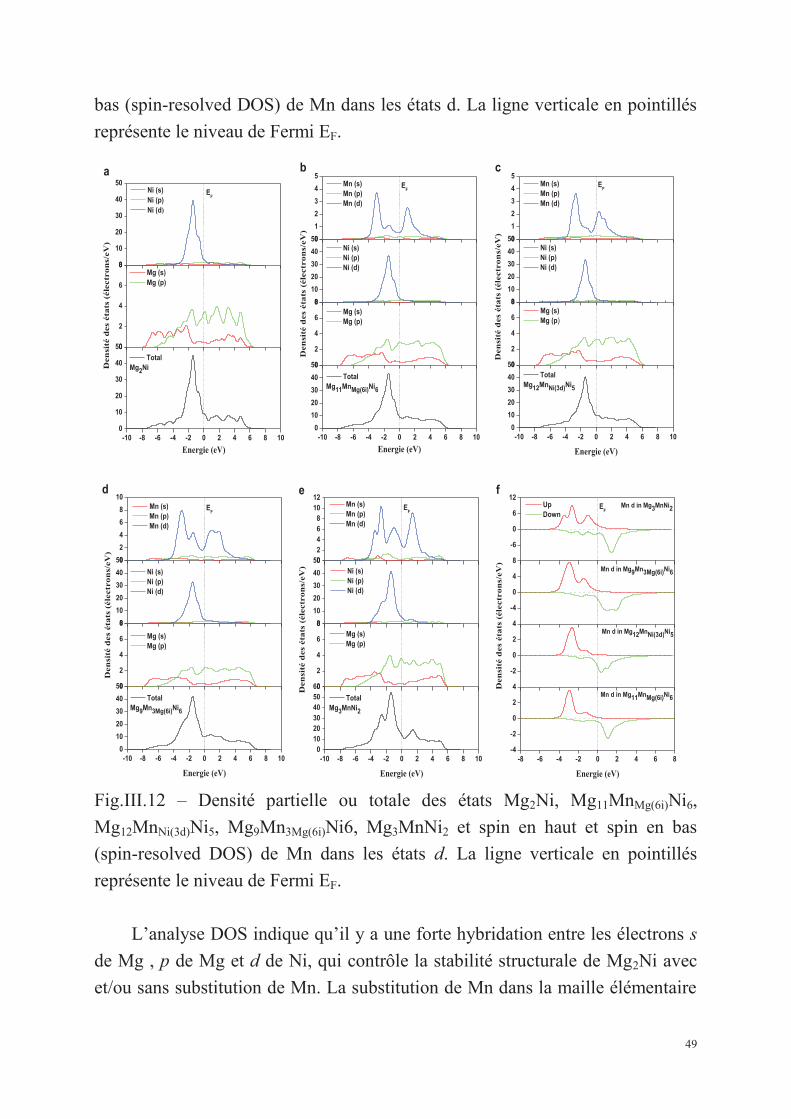
49
-10 -8 -6 -4 -2 0 2 4 6 8 100
10
20
30
40
500
2
4
6
80
10
20
30
40
50
Energie (eV)
TotalMg2Ni
Den
sité
des
éta
ts (
élec
tro
ns/
eV)
Mg (s) Mg (p)
EF
Ni (s) Ni (p) Ni (d)
a
-10 -8 -6 -4 -2 0 2 4 6 8 100
10
20
30
40
500
2
4
6
80
10
20
30
40
500
1
2
3
4
5
Energie (eV)
TotalMg11MnMg(6i)Ni6
Den
sité
des
éta
ts (
élec
tro
ns/
eV)
Mg (s) Mg (p)
Ni (s) Ni (p) Ni (d)
bE
F
Mn (s) Mn (p) Mn (d)
-10 -8 -6 -4 -2 0 2 4 6 8 100
10
20
30
40
500
2
4
6
80
10
20
30
40
500
1
2
3
4
5
Energie (eV)
TotalMg12MnNi(3d)Ni5
Den
sité
des
éta
ts (
élec
tro
ns/
eV)
Mg (s) Mg (p)
Ni (s) Ni (p) Ni (d)
cE
F
Mn (s) Mn (p) Mn (d)
-8 -6 -4 -2 0 2 4 6 8-4
-2
0
2
4
-2
0
2
4
-4
0
4
8
-6
0
6
12
Mn d in Mg11MnMg(6i)Ni6
Energie (eV)
Den
sité
des
éta
ts (
élec
tro
ns/
eV)
Mn d in Mg12MnNi(3d)Ni5
f
Mn d in Mg9Mn3Mg(6i)Ni6
Mn d in Mg3MnNi2EF
Up Down
-10 -8 -6 -4 -2 0 2 4 6 8 100
1020304050600
2
4
6
80
10
20
30
40
5002468
1012
Energie (eV)
TotalMg3MnNi2
Mg (s) Mg (p)
Ni (s) Ni (p) Ni (d)
eE
F
Den
sité
des
éta
ts (
élec
tro
ns/
eV)
Mn (s) Mn (p) Mn (d)
-10 -8 -6 -4 -2 0 2 4 6 8 100
10
20
30
40
500
2
4
6
80
10
20
30
40
500
2
4
6
8
10
Energie (eV)
TotalMg9Mn3Mg(6i)Ni6
Den
sité
des
éta
ts (
élec
tro
ns/
eV)
Mg (s) Mg (p)
Ni (s) Ni (p) Ni (d)
dE
F
Mn (s) Mn (p) Mn (d)
bas (spin-resolved DOS) de Mn dans les états d. La ligne verticale en pointillés
représente le niveau de Fermi EF.
Fig.III.12 – Densité partielle ou totale des états Mg2Ni, Mg11MnMg(6i)Ni6,
Mg12MnNi(3d)Ni5, Mg9Mn3Mg(6i)Ni6, Mg3MnNi2 et spin en haut et spin en bas
(spin-resolved DOS) de Mn dans les états d. La ligne verticale en pointillés
représente le niveau de Fermi EF.
L’analyse DOS indique qu’il y a une forte hybridation entre les électrons s
de Mg , p de Mg et d de Ni, qui contrôle la stabilité structurale de Mg2Ni avec
et/ou sans substitution de Mn. La substitution de Mn dans la maille élémentaire
50
de Mg2Ni affaiblit l’interaction entre les électrons s de Mg , p de Mg et d de Ni
et en particulier pour Mg9Mn3Mg(6i)Ni6. La phase cubique Mg3MnNi2 possède
une forte hybridation entre les orbitales Mn, Mg en conservant simultanément
une forte liaison entre les électrons s de Mg, p de Mg et d de Ni. Les résultats
obtenus par l’analyse DOS sont en accord avec le calcul des enthalpies de
formation. Les résultats obtenus par calcul montrent que la stabilité des phases
décroit graduellement selon l’ordre suivant : Mg2Ni sans aucune substitution
>Mg3MnNi2 > Mg2Ni avec substitution par Mn.
Tous les détails des résultats du chapitre III.1.3 sont publiés dans l’article
référencé en Annexe 4.
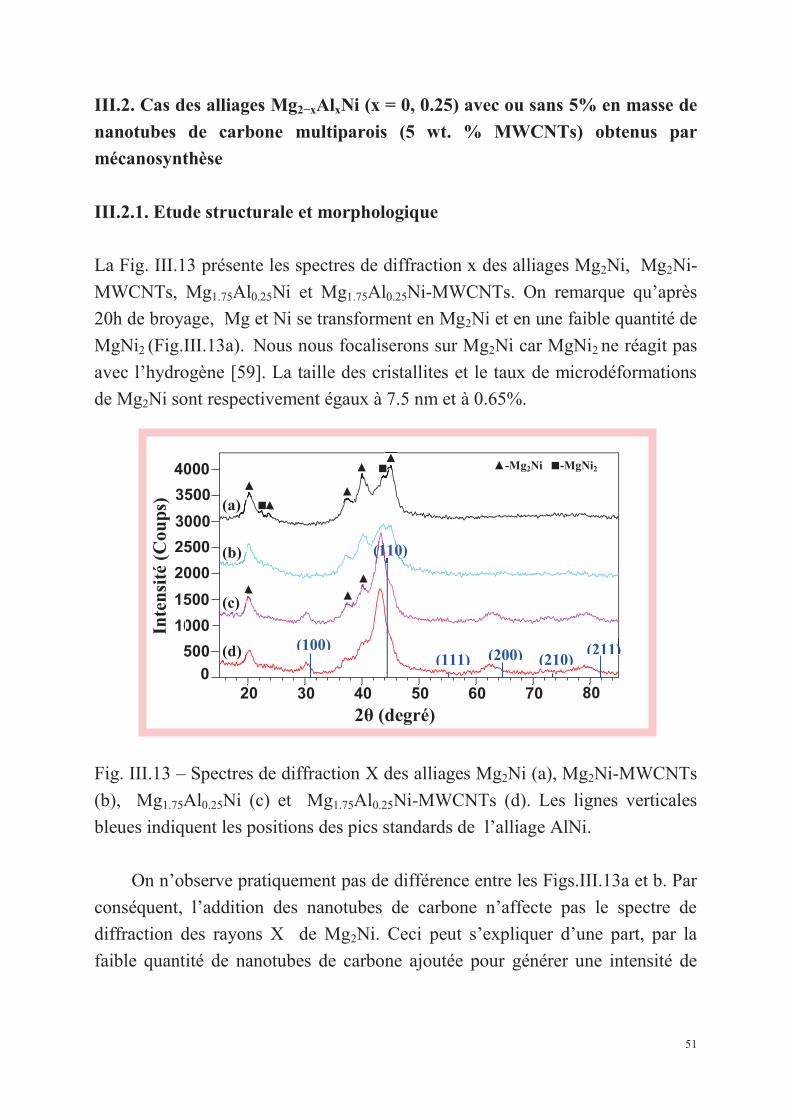
51
III.2. Cas des alliages Mg2−xAlxNi (x = 0, 0.25) avec ou sans 5% en masse de
nanotubes de carbone multiparois (5 wt. % MWCNTs) obtenus par
mécanosynthèse
III.2.1. Etude structurale et morphologique
La Fig. III.13 présente les spectres de diffraction x des alliages Mg2Ni, Mg2Ni-
MWCNTs, Mg1.75Al0.25Ni et Mg1.75Al0.25Ni-MWCNTs. On remarque qu’après
20h de broyage, Mg et Ni se transforment en Mg2Ni et en une faible quantité de
MgNi2 (Fig.III.13a). Nous nous focaliserons sur Mg2Ni car MgNi2 ne réagit pas
avec l’hydrogène [59]. La taille des cristallites et le taux de microdéformations
de Mg2Ni sont respectivement égaux à 7.5 nm et à 0.65%.
Fig. III.13 – Spectres de diffraction X des alliages Mg2Ni (a), Mg2Ni-MWCNTs
(b), Mg1.75Al0.25Ni (c) et Mg1.75Al0.25Ni-MWCNTs (d). Les lignes verticales
bleues indiquent les positions des pics standards de l’alliage AlNi.
On n’observe pratiquement pas de différence entre les Figs.III.13a et b. Par
conséquent, l’addition des nanotubes de carbone n’affecte pas le spectre de
diffraction des rayons X de Mg2Ni. Ceci peut s’expliquer d’une part, par la
faible quantité de nanotubes de carbone ajoutée pour générer une intensité de
(100)
(110)
20 30 40 50 60 70 80 0
500
1000
1500
2000
2500
3000
3500
4000
(a)
▲-Mg2Ni ■-MgNi2
▲
▲ ▲■ ▲
▲ ▲ ▲
■
(111) (200) (210) (211)
▲ ▲
▲
(b)
▲(c)
(d)
10
15
20
25
30
35
Inte
nsit
é (C
oups
)
2θ (degré)
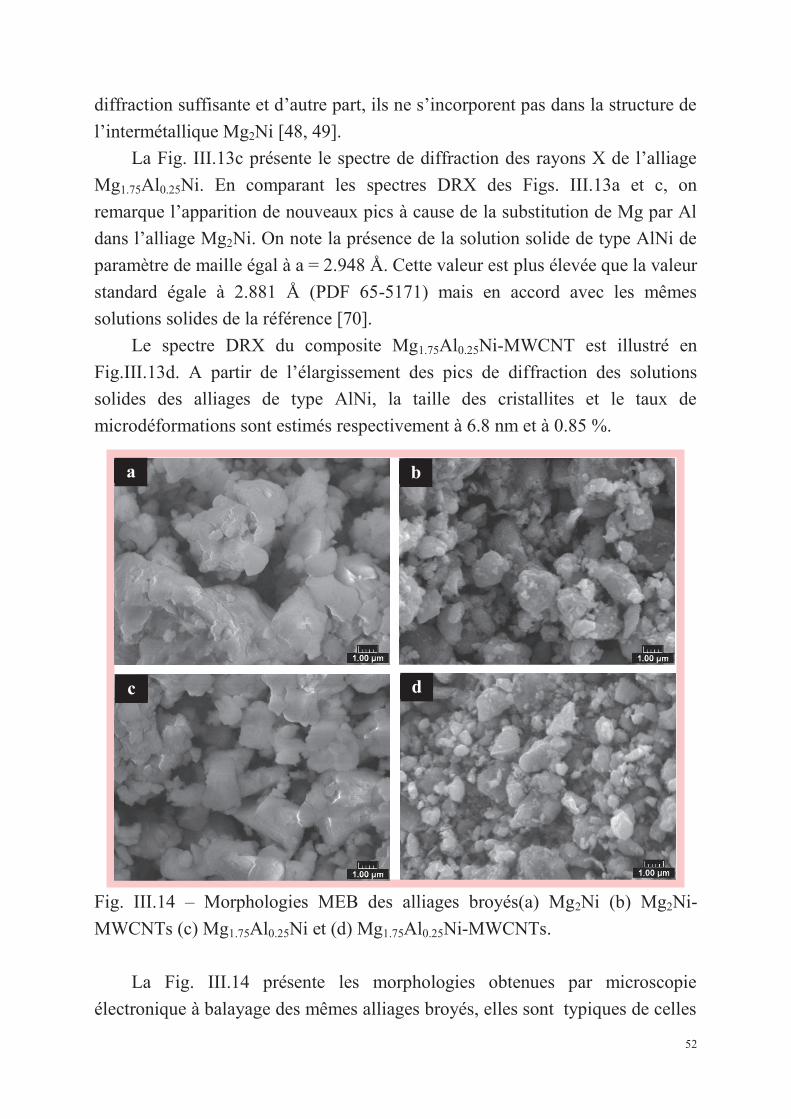
52
a b
c d
diffraction suffisante et d’autre part, ils ne s’incorporent pas dans la structure de
l’intermétallique Mg2Ni [48, 49].
La Fig. III.13c présente le spectre de diffraction des rayons X de l’alliage
Mg1.75Al0.25Ni. En comparant les spectres DRX des Figs. III.13a et c, on
remarque l’apparition de nouveaux pics à cause de la substitution de Mg par Al
dans l’alliage Mg2Ni. On note la présence de la solution solide de type AlNi de
paramètre de maille égal à a = 2.948 Å. Cette valeur est plus élevée que la valeur
standard égale à 2.881 Å (PDF 65-5171) mais en accord avec les mêmes
solutions solides de la référence [70].
Le spectre DRX du composite Mg1.75Al0.25Ni-MWCNT est illustré en
Fig.III.13d. A partir de l’élargissement des pics de diffraction des solutions
solides des alliages de type AlNi, la taille des cristallites et le taux de
microdéformations sont estimés respectivement à 6.8 nm et à 0.85 %.
Fig. III.14 – Morphologies MEB des alliages broyés(a) Mg2Ni (b) Mg2Ni-
MWCNTs (c) Mg1.75Al0.25Ni et (d) Mg1.75Al0.25Ni-MWCNTs.
La Fig. III.14 présente les morphologies obtenues par microscopie
électronique à balayage des mêmes alliages broyés, elles sont typiques de celles
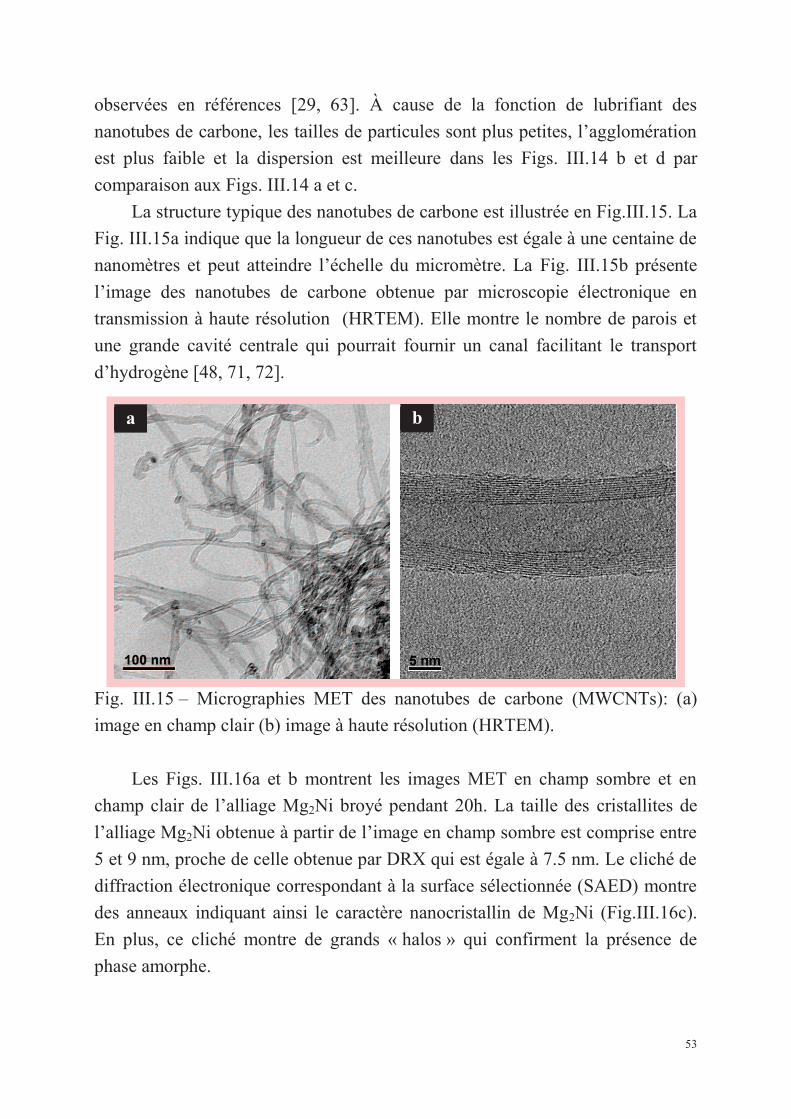
53
a b
observées en références [29, 63]. À cause de la fonction de lubrifiant des
nanotubes de carbone, les tailles de particules sont plus petites, l’agglomération
est plus faible et la dispersion est meilleure dans les Figs. III.14 b et d par
comparaison aux Figs. III.14 a et c.
La structure typique des nanotubes de carbone est illustrée en Fig.III.15. La
Fig. III.15a indique que la longueur de ces nanotubes est égale à une centaine de
nanomètres et peut atteindre l’échelle du micromètre. La Fig. III.15b présente
l’image des nanotubes de carbone obtenue par microscopie électronique en
transmission à haute résolution (HRTEM). Elle montre le nombre de parois et
une grande cavité centrale qui pourrait fournir un canal facilitant le transport
d’hydrogène [48, 71, 72].
Fig. III.15 – Micrographies MET des nanotubes de carbone (MWCNTs): (a)
image en champ clair (b) image à haute résolution (HRTEM).
Les Figs. III.16a et b montrent les images MET en champ sombre et en
champ clair de l’alliage Mg2Ni broyé pendant 20h. La taille des cristallites de
l’alliage Mg2Ni obtenue à partir de l’image en champ sombre est comprise entre
5 et 9 nm, proche de celle obtenue par DRX qui est égale à 7.5 nm. Le cliché de
diffraction électronique correspondant à la surface sélectionnée (SAED) montre
des anneaux indiquant ainsi le caractère nanocristallin de Mg2Ni (Fig.III.16c).
En plus, ce cliché montre de grands « halos » qui confirment la présence de
phase amorphe.
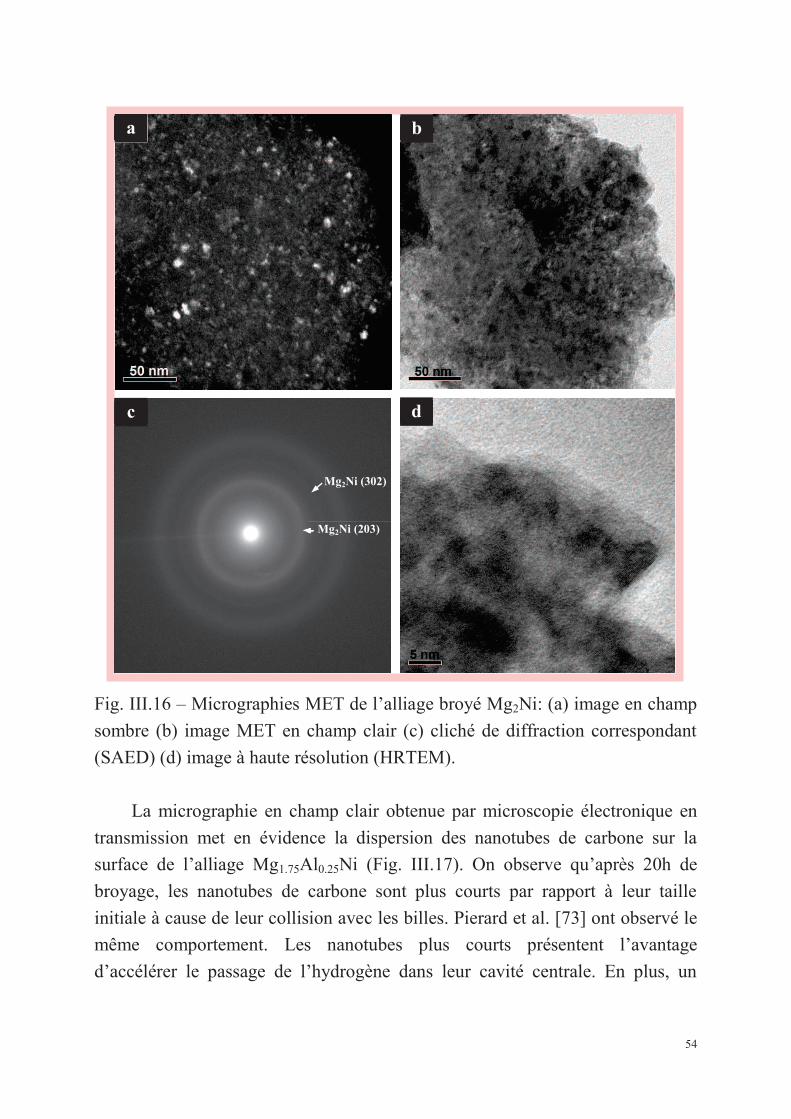
54
a b
c d
Mg2Ni (302)
Mg2Ni (203)
Fig. III.16 – Micrographies MET de l’alliage broyé Mg2Ni: (a) image en champ
sombre (b) image MET en champ clair (c) cliché de diffraction correspondant
(SAED) (d) image à haute résolution (HRTEM).
La micrographie en champ clair obtenue par microscopie électronique en
transmission met en évidence la dispersion des nanotubes de carbone sur la
surface de l’alliage Mg1.75Al0.25Ni (Fig. III.17). On observe qu’après 20h de
broyage, les nanotubes de carbone sont plus courts par rapport à leur taille
initiale à cause de leur collision avec les billes. Pierard et al. [73] ont observé le
même comportement. Les nanotubes plus courts présentent l’avantage
d’accélérer le passage de l’hydrogène dans leur cavité centrale. En plus, un
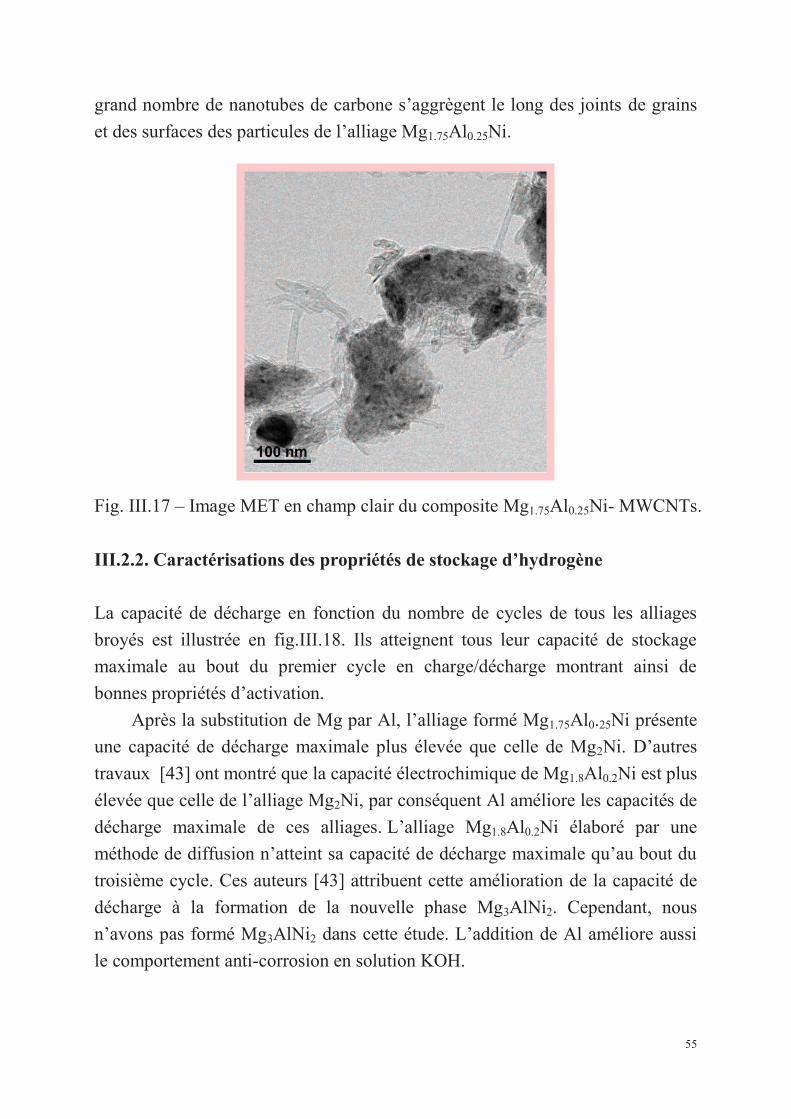
55
grand nombre de nanotubes de carbone s’aggrègent le long des joints de grains
et des surfaces des particules de l’alliage Mg1.75Al0.25Ni.
Fig. III.17 – Image MET en champ clair du composite Mg1.75Al0.25Ni- MWCNTs.
III.2.2. Caractérisations des propriétés de stockage d’hydrogène
La capacité de décharge en fonction du nombre de cycles de tous les alliages
broyés est illustrée en fig.III.18. Ils atteignent tous leur capacité de stockage
maximale au bout du premier cycle en charge/décharge montrant ainsi de
bonnes propriétés d’activation.
Après la substitution de Mg par Al, l’alliage formé Mg1.75Al0.25Ni présente
une capacité de décharge maximale plus élevée que celle de Mg2Ni. D’autres
travaux [43] ont montré que la capacité électrochimique de Mg1.8Al0.2Ni est plus
élevée que celle de l’alliage Mg2Ni, par conséquent Al améliore les capacités de
décharge maximale de ces alliages. L’alliage Mg1.8Al0.2Ni élaboré par une
méthode de diffusion n’atteint sa capacité de décharge maximale qu’au bout du
troisième cycle. Ces auteurs [43] attribuent cette amélioration de la capacité de
décharge à la formation de la nouvelle phase Mg3AlNi2. Cependant, nous
n’avons pas formé Mg3AlNi2 dans cette étude. L’addition de Al améliore aussi
le comportement anti-corrosion en solution KOH.
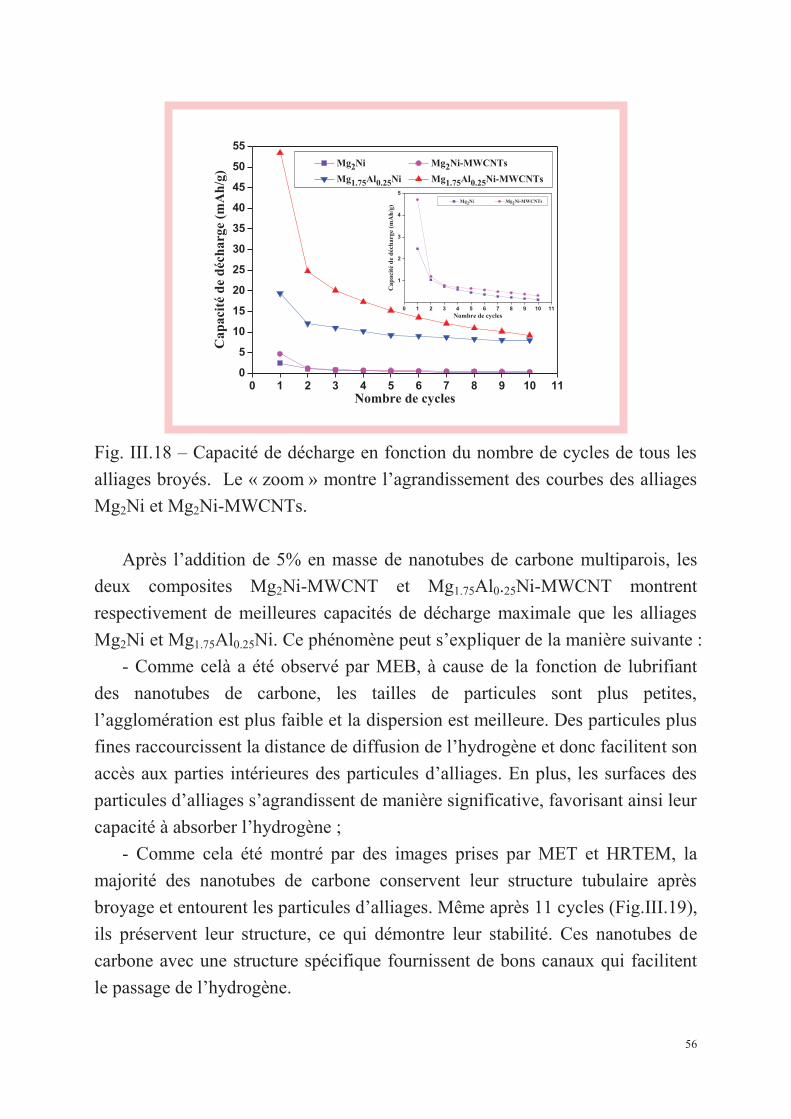
56
0 1 2 3 4 5 6 7 8 9 10 110
5
10
15
20
25
30
35
40
45
50
55
Cap
acit
é d
e d
éch
arge
(m
Ah
/g)
Nombre de cycles
Mg2Ni Mg2Ni-MWCNTs
Mg1.75Al0.25Ni Mg1.75Al0.25Ni-MWCNTs
0 1 2 3 4 5 6 7 8 9 10 11
1
2
3
4
5
Mg2Ni Mg2Ni-MWCNTs
Cap
acit
é d
e d
éch
arge
(m
Ah
/g)
Nombre de cycles
Fig. III.18 – Capacité de décharge en fonction du nombre de cycles de tous les
alliages broyés. Le « zoom » montre l’agrandissement des courbes des alliages
Mg2Ni et Mg2Ni-MWCNTs.
Après l’addition de 5% en masse de nanotubes de carbone multiparois, les
deux composites Mg2Ni-MWCNT et Mg1.75Al0.25Ni-MWCNT montrent
respectivement de meilleures capacités de décharge maximale que les alliages
Mg2Ni et Mg1.75Al0.25Ni. Ce phénomène peut s’expliquer de la manière suivante :
- Comme celà a été observé par MEB, à cause de la fonction de lubrifiant
des nanotubes de carbone, les tailles de particules sont plus petites,
l’agglomération est plus faible et la dispersion est meilleure. Des particules plus
fines raccourcissent la distance de diffusion de l’hydrogène et donc facilitent son
accès aux parties intérieures des particules d’alliages. En plus, les surfaces des
particules d’alliages s’agrandissent de manière significative, favorisant ainsi leur
capacité à absorber l’hydrogène ;
- Comme cela été montré par des images prises par MET et HRTEM, la
majorité des nanotubes de carbone conservent leur structure tubulaire après
broyage et entourent les particules d’alliages. Même après 11 cycles (Fig.III.19),
ils préservent leur structure, ce qui démontre leur stabilité. Ces nanotubes de
carbone avec une structure spécifique fournissent de bons canaux qui facilitent
le passage de l’hydrogène.
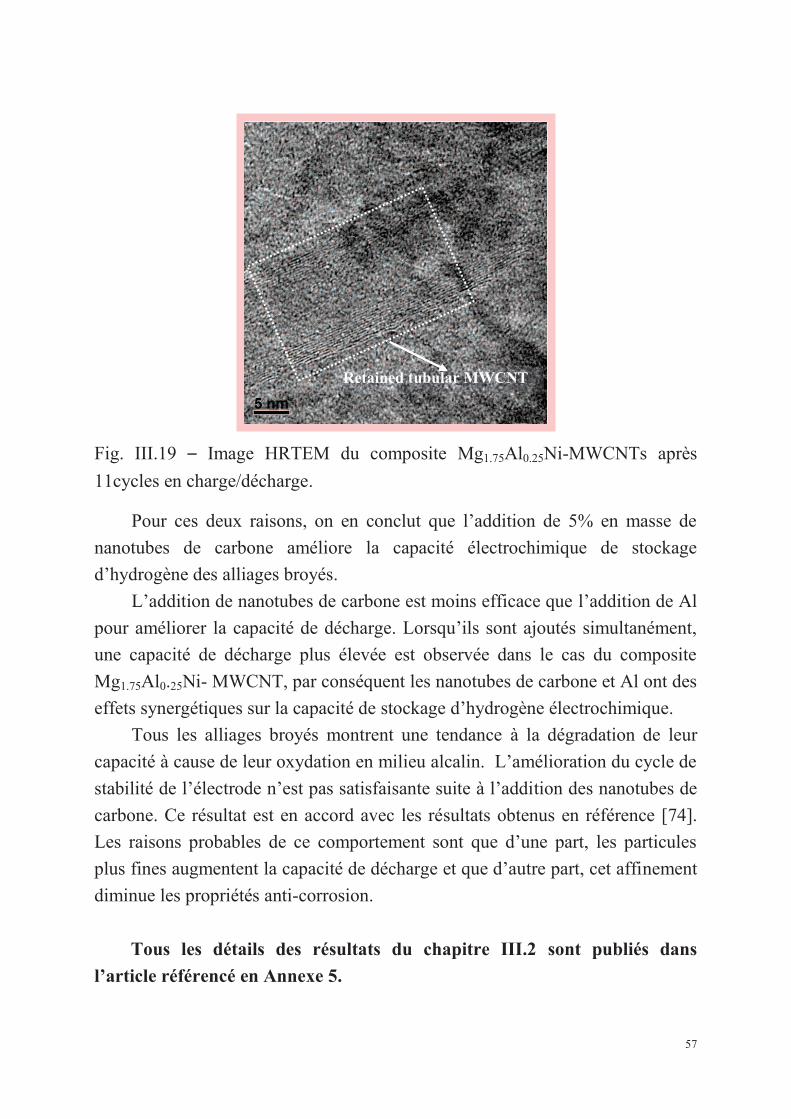
57
Retained tubular MWCNT
Fig. III.19 – Image HRTEM du composite Mg1.75Al0.25Ni-MWCNTs après
11cycles en charge/décharge.
Pour ces deux raisons, on en conclut que l’addition de 5% en masse de
nanotubes de carbone améliore la capacité électrochimique de stockage
d’hydrogène des alliages broyés.
L’addition de nanotubes de carbone est moins efficace que l’addition de Al
pour améliorer la capacité de décharge. Lorsqu’ils sont ajoutés simultanément,
une capacité de décharge plus élevée est observée dans le cas du composite
Mg1.75Al0.25Ni- MWCNT, par conséquent les nanotubes de carbone et Al ont des
effets synergétiques sur la capacité de stockage d’hydrogène électrochimique.
Tous les alliages broyés montrent une tendance à la dégradation de leur
capacité à cause de leur oxydation en milieu alcalin. L’amélioration du cycle de
stabilité de l’électrode n’est pas satisfaisante suite à l’addition des nanotubes de
carbone. Ce résultat est en accord avec les résultats obtenus en référence [74].
Les raisons probables de ce comportement sont que d’une part, les particules
plus fines augmentent la capacité de décharge et que d’autre part, cet affinement
diminue les propriétés anti-corrosion.
Tous les détails des résultats du chapitre III.2 sont publiés dans
l’article référencé en Annexe 5.

CHAPITRE IV CONCLUSION GÉNÉRALE ET
PERSEPECTIVES

58
CHAPITRE IV : CONCLUSION GÉNÉRALE ET
PERSEPECTIVES
Parmi les différentes méthodes qui permettent d’améliorer les propriétés de
stockage d’hydrogène de l’intermétallique Mg2Ni, nous avons utilisé la
substitution partielle des éléments et la mécanosynthèse. Notre travail a donc
consisté à élaborer par mécanosynthèse les alliages Mg2Ni avec substitution du
nickel et du magnésium par d’autres éléments chimiques tels que Mn, Al.
Nous avons dans un premier temps substitué le nickel par le manganèse et
synthétisé les alliages Mg2Ni1-xMnx (x=0,0.125, 0.25, 0.375) par
mécanosynthèse. Les résultats obtenus sont résumés de la manière suivante :
- la substitution de Ni par Mn empêche la formation de la phase MgNi2 qui
ne réagit pas avec l’hydrogène ;
- la solubilité de Mn dans Mg2Ni est faible ;
- lorsque le pourcentage de Mn augmente de x=0 à x= 0.375, la taille des
cristallites décroît de 12.5 nm pour atteindre 9.6 nm et croît ensuite jusqu’à 11.8
nm. La taille minimale des cristallites est obtenue pour x=0.25 tandis que le taux
de microdéformations décroît de 1.39% à 0.82 % ;
- les tailles des sous-particules de l’alliage Mg2Ni0.75Mn0.25 sont plus petites
que celles des autres compositions. Ceci indique que la substitution de Ni par
Mn correspondant à la composition x= 0.25 favorise l’accroissement des
surfaces de l’intermétallique Mg2Ni.
En ce qui concerne l’alliage Mg2Ni0.625Mn0.375 broyé durant 48 h, nous
avons mis en évidence la formation d’une nouvelle phase Mg3MnNi2. Cette
nouvelle phase est de structure cubique à faces centrées (Fd-3m) avec
respectivement, un paramètre de maille, une taille des cristallites et un taux de
microdéformations égaux à 1.1484 nm, 15.6 nm et 1.09%.
Le mécanisme de formation de cette nouvelle phase peut s’expliquer de la
manière suivante : avec l’augmentation du temps de broyage, la structure de la
phase Mg2Ni est détruite et simultanément on a la formation d’une phase
amorphe. On assiste ensuite à un réarrangement des atomes Mg, Ni et Mn pour
former Mg3MnNi2. Notons que les principaux pics caractéristiques de cette
nouvelle phase apparaissent uniquement pour x=0.375 et pour une durée de
broyage fixée à 48h. Tous les alliages incluant la phase Mg3MnNi2, atteignent
59
leur capacité maximale de décharge au cours du premier cycle en
charge/décharge indiquant ainsi d’excellentes propriétés d’activation.
Les capacités de décharge des alliages Mg2Ni1−xMnx (x=0, 0.125, 0.25,
0.375) augmentent avec le temps de broyage. Pour une durée de broyage fixée à
16h et une augmentation du pourcentage de Mn, les capacités de décharge des
alliages Mg2Ni1−xMnx (x = 0, 0.125, 0.25, 0.375) décroissent de manière
monotone. Pour 24 h de broyage, les capacités de décharge de ces mêmes
alliages montrent une décroissance plus marquée, avec l’augmentation du
pourcentage de Mn, à l’exception de l’alliage Mg2Ni0.875Mn0.125. Pour 48 h de
broyage, les capacités de décharge augmentent lorsque le pourcentage de Mn
augmente de 0.125 à 0.375. La substitution du Ni par Mn favorise les phases
amorphes, ce qui explique une capacité de décharge plus élevée de l’alliage
Mg2Ni0.75Mn0.25 par rapport à Mg2Ni0.875Mn0.125. La capacité élevée de l’alliage
Mg2Ni0.625Mn0.375 est due à la formation de la nouvelle phase Mg3MnNi2.
Tous les alliages broyés montrent une dégradation de leur capacité. On note
aussi l’apparition des pics de Mg(OH)2 après 12 cycles en charge/décharge.
Mg(OH)2 ne dégrade pas seulement les alliages broyés mais augmente aussi la
résistance des électrodes en empêchant le transfert de charges. Par conséquent,
Mg(OH)2 peut être considéré comme étant la cause principale de la dégradation
de la capacité de décharge des alliages broyés.
Par ailleurs, l’amélioration du cycle de stabilité de l’alliage
Mg2Ni0.625Mn0.375 est due à la formation de la nouvelle phase Mg3MnNi2. Cette
dernière est toujours présente même après 12 cycles en charge/décharge, ce qui
indique sa relative stabilité.
Le dopage substitutionnel par Mn de l’intermétallique Mg2Ni et les
structures électroniques de la phase Mg3MnNi2 ont été étudiées par la DFT en
utilisant le programme CASTEP. Les résultats obtenus montrent que les
paramètres de maille et les coordinations atomiques sont en parfait accord avec
les résultats expérimentaux.
Le calcul des enthalpies de formation montre que le site de substitution
préférentiel de Mn dans la maille de Mg2Ni est Mg(6i) parmi les quatre
possibilités de substitution qui sont Mg(6f), Mg(6i), Ni(3b) et Ni(3d). La
structure Mg9Mn3Mg(6i)Ni6 construite en substituant 3 atomes de Mg dans les
positions Mg(6i), par trois atomes de Mn dans la maille élémentaire de Mg2Ni
60
est moins stable que Mg2Ni. Au contraire, la phase cubique Mg3MnNi2 qui a la
même structure que Mg9Mn3Mg(6i)Ni6, possède une bonne stabilité.
L’analyse partielle ou totale de la densité des états (PDOS et DOS) des
phases pures ou dopées a été effectuée afin d’étudier le mécanisme de la
structure électronique sur le changement de la stabilité structurale. L’analyse
DOS indique qu’il y a une forte hybridation entre les électrons s de Mg, p de Mg
et d de Ni, qui contrôle la stabilité structurale de Mg2Ni avec et/ou sans
substitution de Mn. La substitution de Mn dans la maille élémentaire de Mg2Ni
affaiblit l’interaction entre les électrons s de Mg, p de Mg et d de Ni et en
particulier pour Mg9Mn3Mg(6i)Ni6. La phase cubique Mg3MnNi2 possède une
forte hybridation des orbitales Mn, Mg en conservant simultanément une forte
liaison entre les électrons s de Mg, p de Mg et d de Ni. Les résultats obtenus par
l’analyse DOS sont en accord avec les calculs des enthalpies de formation. Les
résultats obtenus par calcul montrent que la stabilité des phases décroit
graduellement selon l’ordre suivant : Mg2Ni sans aucune substitution
>Mg3MnNi2 > Mg2Ni avec substitution par Mn.
Dans un second temps, nous avons élaboré les alliages Mg2-xAlxNi (x = 0,
0.25) +5 wt. % MWCNT par mécanosynthèse et étudié leur effet synergétique
sur les propriétés de stockage d’hydrogène. Tous les alliages broyés atteignent
leur capacité de stockage maximale dès le premier cycle en charge/décharge, ce
qui indique qu’ils possèdent de bonnes propriétés d’activation. Après la
substitution de Mg par Al, l’alliage formé Mg1.75Al0.25Ni présente une capacité
de décharge maximale plus élevée que celle de Mg2Ni. En plus, l’addition de Al
améliore le comportement anti-corrosion en solution KOH.
Après l’addition de 5% en masse de nanotubes de carbone multiparois, les
deux composites Mg2Ni-MWCNT et Mg1.75Al0.25Ni-MWCNT montrent
respectivement, de meilleures capacités de décharge maximale que les alliages
Mg2Ni et Mg1.75Al0.25Ni.
L’addition de nanotubes de carbone est moins efficace que celle de Al pour
l’amélioration de la capacité de décharge. Lorsqu’ils sont ajoutés simultanément,
une capacité de décharge plus élevée est observée dans le cas du composite
Mg1.75Al0.25Ni-MWCNT. Par conséquent, les nanotubes de carbone et
l’aluminium ont des effets synergétiques sur la capacité de stockage
d’hydrogène électrochimique.
61
Tous les alliages broyés montrent une tendance à la dégradation de leur
capacité à cause de leur oxydation en milieu alcalin. L’amélioration du cycle de
stabilité des électrodes n’est pas satisfaisante après l’addition des nanotubes de
carbone.
La substitution partielle des éléments Mg et Ni améliore les propriétés
électrochimiques des alliages de type Mg2Ni. Il est donc important de continuer
à élaborer de nouveaux alliages à base de magnésium pour développer encore la
technologie du stockage d’hydrogène. Nous envisageons ainsi d’étudier l’effet
de la substitution de Mg par Ti sur les propriétés de stockage d’hydrogène dans
le cas de l’alliage Mg2Ni.
Par ailleurs, Il a été montré que le graphite, le fullerène, le carbone activé,
le carbone noir et les nanotubes de carbone ont des effets positifs sur les
propriétés de stockage dans le cas des alliages à base de magnésium. C’est
pourquoi, on peut envisager l’addition de ces matériaux « carbonés » aux
alliages de type Mg2Ni afin d’améliorer leurs propriétés de stockage
d’hydrogène.
Les perspectives de ce travail concernent aussi l’aspect théorique qui, par
l’intermédiaire de la modélisation de la structure des alliages élaborés, permettra
de prédire ou de confirmer les résultats expérimentaux.

BIBLIOGRAPHIE

62
BIBLIOGRAPHIE [1] Stan CI. Thèse présentée à l’Université de Bucarest (2008).
[2] Schlapbach L, Züttel A. Nature 2001;414 :353–8.
[3] Massicot B. Thèse présentée à l’Université Paris XII (2009).
[4] Petit Frérey MA. Thèse présentée à l’Université Paris XII (2008).
[5] Van Essen RM, Buschow KHJ . Mater Res Bull 1980; 15 :1149–55.
[6] Flanagan TB. Thermodynamics of metal-gas reaction. In: Grandjean F, Long GJ,
Buschow KHJ, editors. Interstitial Intermetallic Alloys 1994; 281:46–76.
[7] Balasubramaniam R. J Alloys Compd 1997 ;253-254:203–6.
[8] Flanagan TB et al. J Less Common Metals 1982; 83:127–41.
[9] Lemort L. Thèse présentée à l’Université Paris XII (2010).
[10] ASM International, Binary Alloy Phase Diagrams, Second Edition Plus Updates, 1996.
[11] Villars P et al. Pearson’s Handbook of Crystallographic Data for Intermetallics, Phases
– Second Edition 1991.
[12] Reilly JJ et al. Inorg Chem 1968;7 : 2254–6.
[13] Zeng K et al. J Alloys Compd 1999; 283:213-24.
[14] Janot R et al. Intermetallics 2006; 14:163–9.
[15] Guiose B. Thèse présentée à l’Université Paris XII (2007).
[16] Roquefere JG. Thèse présentée à l’Université Bordeaux I (2009).
[17] Bergeron G. Mémoire (M.Sc.) présenté à l’Université Laval (2001).
[18] Campesi R. Thèse présentée à l’Université Paris XII (2008).
[19] Prigent J. Thèse présentée à l’Université Paris XI (2008).
[20] Chen H et al. Progress in Natural Science, 2009;19:291–312.
[21] Delmas C et al. Nature Materials,2008;7:665–71
[22] Willems JJG. Philips Journal of Research. 1984;3:1-94
[23] Percheron-Guégan A et al. Proceedings of the International Symposium Hydrides for
Energy Storage, A.F. Andersen and A.J. Maeland, Pergamon, Geilo, Norway, Oxford
(1978), p.485–490.
[24] Clefs du CEA n°50/51 (2004-2005).
[25] Zaluski L et al. J Alloys Compd 1995;217:245–9.
[26] Zaluski L et al. J Alloys Compd 1995;217: 295–300.
[27] Huot J et al. J Alloys Compd 1998;266 :307–10.
[28] Zhang YH et al. J Alloys Compd 2008;450 :208–14.
[29] Gasiorowski A et al. J Alloys Compd 2004;364:283-8.
[30] Yuan HT et al. J Alloys Compd 2000;309 : 208–11.
[31] Hima Kumar L et al. J Alloys Compd 2008;461:72–6.
[32] Zaluski L et al. J Alloys Compd 1997;253–254 :70–9.
[33] Yang HB et al. J Alloys Compd 2002;330–332:640–644.
[34] Kohno T, Kanda M. J Electrochem Soc 1997;144: 2384–8.
[35] Tsushio Y, Akiba E.J Alloys Compd 1998;267 : 246–51.
63
[36] Jurczyk M et al. Mater Sci Eng B 2004;108: 67–75.
[37] Garcia GN et al. Phys Rev B 1999;59 :11746–54.
[38] Zhang J et al. J Phys Chem Solids 2009;70:32–9.
[39] Myers WR et al. J Appl Phys 2002;91:4879–85.
[40] Jasen PV et al. Int J Hydrogen Energy 2007;32 : 4943–8.
[41] Takahashi Y et al. J Alloys Compd 1996;242 : 98–107.
[42] Van Setten MJ et al.Phys Rev.B 2007;76 :075125.
[43] Yuan HT et al. J Alloys Compd 2000; 309:208–11.
[44] Gasiorowski A et al.J Alloys Compd 2004;364:283–8.
[45] Orimo S et al.J Alloys Compd 1998;266:L1–3.
[46] Wang LB et al. J Alloys Compd 2004;385: 304–8.
[47] Zhang J et al.Int J Hydrogen Energy 2011;36:5375–82.
[48] Pandey SK et al. Int J Hydrogen Energy 2009;34: 9379–84.
[49] Aminorroaya S et al. Int J Hydrogen Energy 2010;35:4144–53.
[50] Gaffet E, Le Caër G. Les nansciences 2. Nanomatériaux et nanochimie, collection
Echelles sous la direction de M. Lahamani, C. Brechignac et P. Houdy, pp 437–451.
[51] Bobet JL et al. Int J Hydrogen Energy 2007 ;32 :2422–8.
[52] Williamson GK, Hall WH. Acta Metall 1953;1 : 22–31.
[53] Born M, Oppenheimer R. Ann Physik 1927;84:457–84.
[54] Hohenberg P, Kohn W. Phys Rev B 1964;136; 864–71.
[55] Kohn W, Sham LJ. Phys Rev A 1965;140: 1133–8.
[56] Segall M D et al. J Phys: Condens Matter 2002;14 : 2717–44.
[57] Parr RG, Yang W. Density-functional theory of atoms and molecules 1989, Oxford.
[58] Clark SJ et al. Z Kristallogr 2005;220: 567–70.
[59] Terzieva M et al. J Alloys Compd 1998;267 : 235–9.
[60] Liang G et al. J Alloys Compd 1995;223: 111–4.
[61] Liu W et al. J Power Sources 1996;58:243–7.
[62] Lei YQ et al. Z Phys Chem 1994;183: 379–84.
[63] Ebrahimi-Purkani A, Kashani-Bozorg SF. J Alloys Compd 2008;456:211–5.
[64] Hsu F et al. J. Power Sources 2010;195:374–9.
[65] Niu H, Northwood DO. Int J Hydrogen Energy 2002;27:69–77.
[66] Huang LJ et al. J Power Sources 2006;160:684–7.
[67] Zhang Y et al. Int J Hydrogen Energy 2009;34:8144–51.
[68] Schefer J et al. J. Less-Common Met 1980;74: 65–73.
[69] PDF No. 00-057-0388, International Centre for Data Diffraction.
[70] Parente A et al. J Alloys Compd 2009;477: 420–4.
[71] Ranjbar A et al. Int J Hydrogen Energy 2010;35:7821–6.
[72] Yao XD et al. J Phys Chem B 2006;110:1697–703.
[73] Pierard N et al. Chem Phys Lett 2001;335:1–8.
[74] Gao XP et al. J ElectrochemSoc 2002;149:A1616–9.
ANNEXE 1:
Huang LW, Elkedim O. Mg-Ni-based systems for hydrogen storage. Chapter to be published in Handbook of Nanomaterials for Hydrogen Storage.
ANNEXE 2:
Huang LW, Elkedim O, Moutarlier V. Synthesis and characterization of nanocrystalline Mg2Ni prepared by mechanical alloying: Effects of substitution of Mn for Ni. Journal of Alloys and Compounds 2010 ; 504S : S311–4.
ANNEXE 3 :
Huang LW, Elkedim O, Jarzebski M, Hamzaoui R, Jurczyk M. Structural characterization and electrochemical hydrogen storage properties of Mg2Ni1-xMnx (x = 0, 0.125, 0.25, 0.375) alloys prepared by mechanical alloying. International Journal of Hydrogen Energy 2010 ; 35: 6794-803.
ANNEXE 4 :
Huang LW, Elkedim O, Hamzaoui R. First principles investigation of the substitutional doping of Mn in Mg2Ni phase and the electronic structure of Mg3MnNi2 phase. Journal of Alloys and Compounds 2011; 509S : S328–33.
ANNEXE 5:
Huang LW, Elkedim O, Nowak M, Jurczyk M, Chassagnon R, Meng DW. Synergistic effects of multiwalled carbon nanotubes and Al on the electrochemical hydrogen storage properties of Mg2Ni-type alloy prepared by mechanical alloying. International Journal of Hydrogen Energy 2012 ; 37 : 1538-45.
ANNEXES

64
ANNEXE 1
Huang LW, Elkedim O. Mg-Ni-based systems for hydrogen storage. Chapter
to be published in Handbook of Nanomaterials for Hydrogen Storage.

1
Mg-Ni-based systems for hydrogen storage
L.W. Huang a,*, O. Elkedim
a,*
a FEMTO-ST, MN2S, Université de Technologie de Belfort-Montbéliard, Site de Sévenans, 90010
Belfort cedex, France
*Corresponding author. Tel.: + 33 3 84583545 ; Fax: + 33 3 84583000
E-mail address: [email protected] (L.W. Huang); [email protected] (O. Elkedim)
1. Introduction
Mg-Ni-based alloys are considered to be promising candidates for hydrogen storage
applications because of their low cost, light weight and rich mineral resources, as well
as high theoretical hydrogen storage capacity (assuming the formation of Mg2NiH4, it
is 3.6 mass%, equivalent to 999 mAh/g for the discharge capacity, which is
approximately 2.7 times that of LaNi5 [1]). However, the high thermodynamical
stability, sluggish hydriding/dehydriding kinetics and poor cycle stability of
Mg-Ni-based alloys become the obstacle for the practical use for hydrogen storage.
In this chapter, firstly, the fundamental data on Mg-Ni-based systems and their
hydrides are briefly summarized, including phase diagrams, crystal structures and
thermodynamical properties etc. Meantime, the phase compositions of Mg-Ni-based
alloys, especially nanostructured and amorphous phases are discussed. Secondly, the
methods of improving hydrogen storage properties of Mg-Ni-based systems, such as
(1) partial element substitution; (2) adding suitable catalysts; (3) adding carbon
materials; (4) different preparing methods for synthesizing Mg-Ni-based alloys, are
presented. Thirdly, first principles investigation on Mg-Ni-based alloys (including
substitutional doping of other elements) and their hydrides (e.g. high temperature
(HT)-Mg2NiH4 and low temperature (LT)-Mg2NiH4 ) is discussed. Finally, the
conclusions are given.
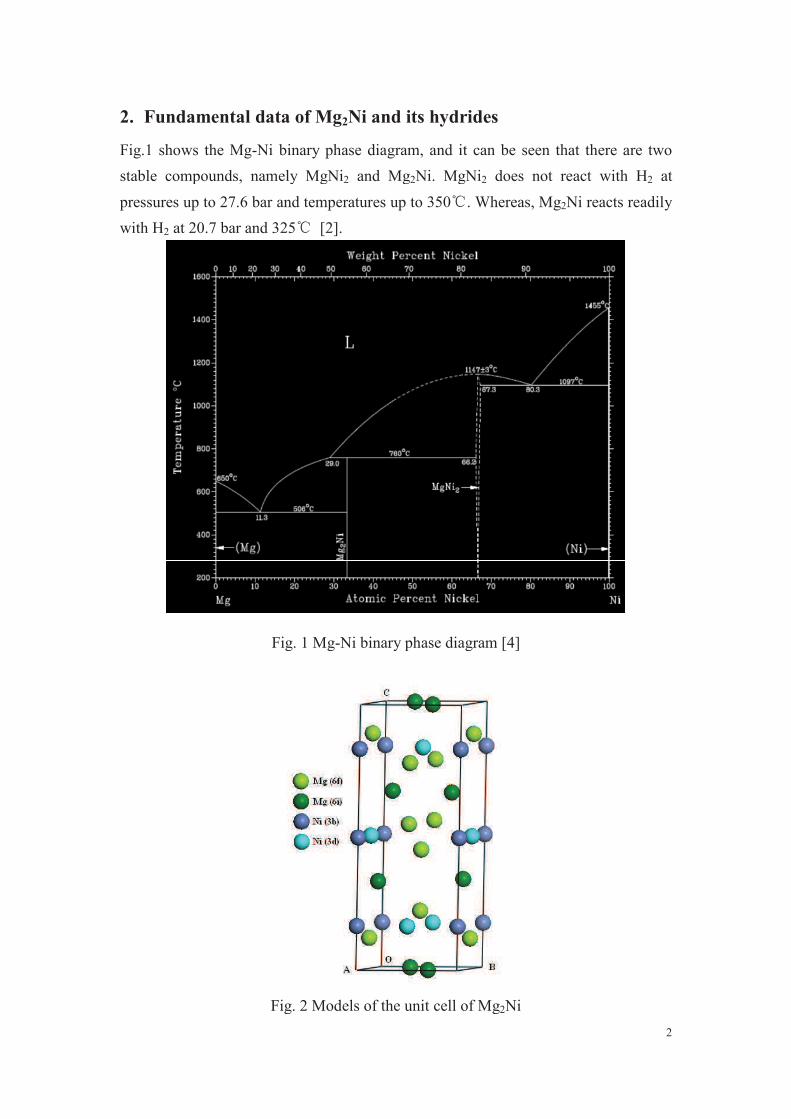
2
2. Fundamental data of Mg2Ni and its hydrides
Fig.1 shows the Mg-Ni binary phase diagram, and it can be seen that there are two
stable compounds, namely MgNi2 and Mg2Ni. MgNi2 does not react with H2 at
pressures up to 27.6 bar and temperatures up to 350@. Whereas, Mg2Ni reacts readily
with H2 at 20.7 bar and 325@ [2].
Fig. 1 Mg-Ni binary phase diagram [4]
Fig. 2 Models of the unit cell of Mg2Ni
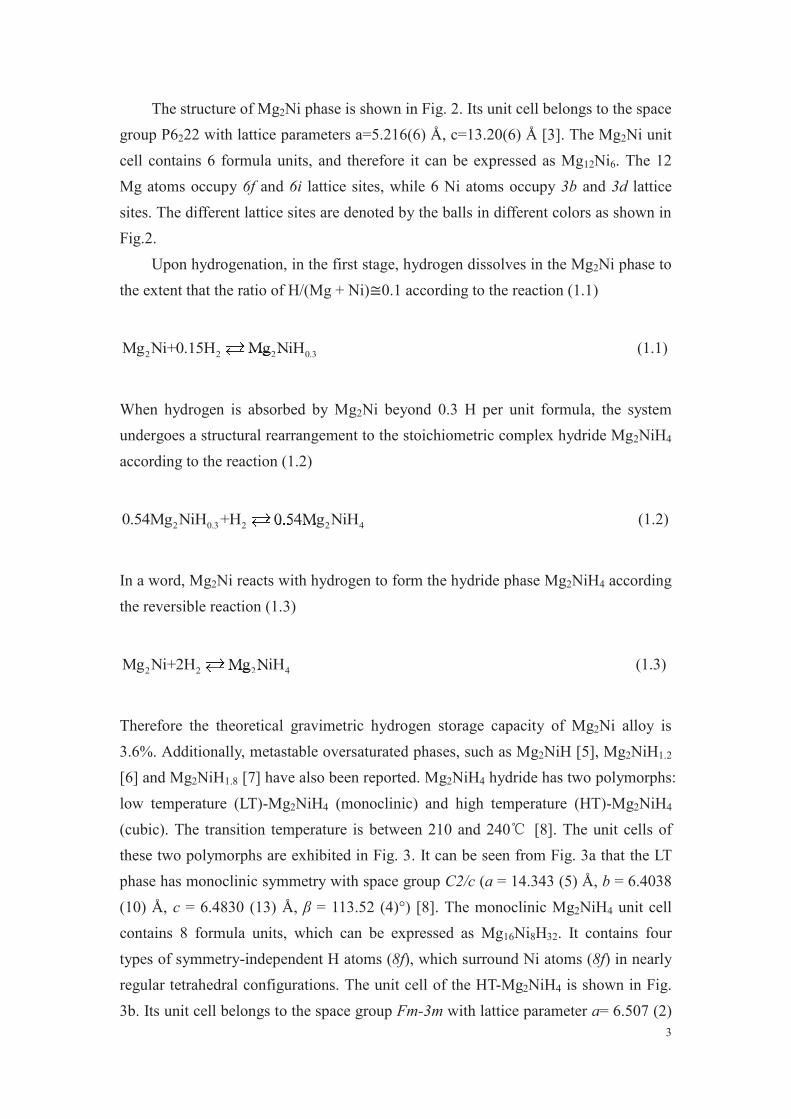
3
The structure of Mg2Ni phase is shown in Fig. 2. Its unit cell belongs to the space
group P6222 with lattice parameters a=5.216(6) Å, c=13.20(6) Å [3]. The Mg2Ni unit
cell contains 6 formula units, and therefore it can be expressed as Mg12Ni6. The 12
Mg atoms occupy 6f and 6i lattice sites, while 6 Ni atoms occupy 3b and 3d lattice
sites. The different lattice sites are denoted by the balls in different colors as shown in
Fig.2.
Upon hydrogenation, in the first stage, hydrogen dissolves in the Mg2Ni phase to
the extent that the ratio of H/(Mg + Ni)簡0.1 according to the reaction (1.1)
2 2 2 0.3Mg Ni+0.15H Mg NiH2 2Mg Ni2 22 2 (1.1)
When hydrogen is absorbed by Mg2Ni beyond 0.3 H per unit formula, the system
undergoes a structural rearrangement to the stoichiometric complex hydride Mg2NiH4
according to the reaction (1.2)
2 0.3 2 2 40.54Mg NiH +H 0.54Mg NiH3 2 20.54M3 2 22 2 (1.2)
In a word, Mg2Ni reacts with hydrogen to form the hydride phase Mg2NiH4 according
the reversible reaction (1.3)
2 2 2 4Mg Ni+2H Mg NiH2 2Mg Ni2 22 2 (1.3)
Therefore the theoretical gravimetric hydrogen storage capacity of Mg2Ni alloy is
3.6%. Additionally, metastable oversaturated phases, such as Mg2NiH [5], Mg2NiH1.2
[6] and Mg2NiH1.8 [7] have also been reported. Mg2NiH4 hydride has two polymorphs:
low temperature (LT)-Mg2NiH4 (monoclinic) and high temperature (HT)-Mg2NiH4
(cubic). The transition temperature is between 210 and 240@"[8]. The unit cells of
these two polymorphs are exhibited in Fig. 3. It can be seen from Fig. 3a that the LT
phase has monoclinic symmetry with space group C2/c (a = 14.343 (5) Å, b = 6.4038
(10) Å, c = 6.4830 (13) Å, β = 113.52 (4)°) [8]. The monoclinic Mg2NiH4 unit cell
contains 8 formula units, which can be expressed as Mg16Ni8H32. It contains four
types of symmetry-independent H atoms (8f), which surround Ni atoms (8f) in nearly
regular tetrahedral configurations. The unit cell of the HT-Mg2NiH4 is shown in Fig.
3b. Its unit cell belongs to the space group Fm-3m with lattice parameter a= 6.507 (2)
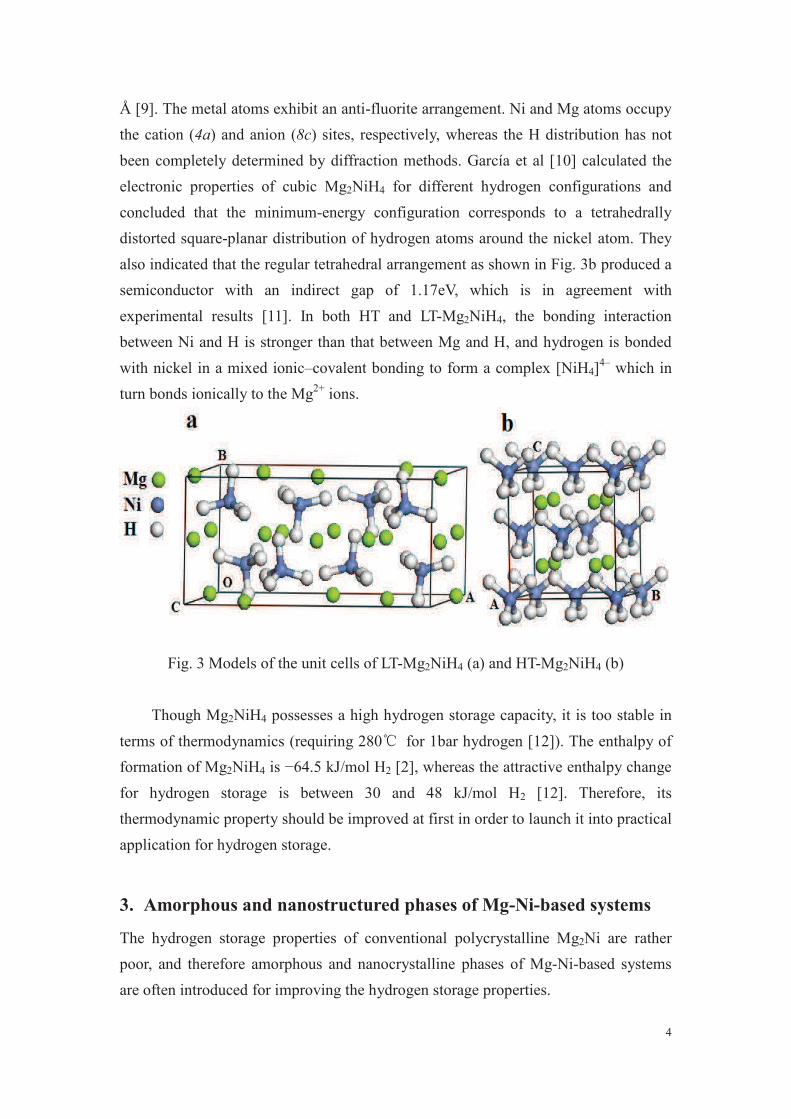
4
Å [9]. The metal atoms exhibit an anti-fluorite arrangement. Ni and Mg atoms occupy
the cation (4a) and anion (8c) sites, respectively, whereas the H distribution has not
been completely determined by diffraction methods. García et al [10] calculated the
electronic properties of cubic Mg2NiH4 for different hydrogen configurations and
concluded that the minimum-energy configuration corresponds to a tetrahedrally
distorted square-planar distribution of hydrogen atoms around the nickel atom. They
also indicated that the regular tetrahedral arrangement as shown in Fig. 3b produced a
semiconductor with an indirect gap of 1.17eV, which is in agreement with
experimental results [11]. In both HT and LT-Mg2NiH4, the bonding interaction
between Ni and H is stronger than that between Mg and H, and hydrogen is bonded
with nickel in a mixed ionic–covalent bonding to form a complex [NiH4]4– which in
turn bonds ionically to the Mg2+ ions.
Fig. 3 Models of the unit cells of LT-Mg2NiH4 (a) and HT-Mg2NiH4 (b)
Though Mg2NiH4 possesses a high hydrogen storage capacity, it is too stable in
terms of thermodynamics (requiring 280@ for 1bar hydrogen [12]). The enthalpy of
formation of Mg2NiH4 is −64.5 kJ/mol H2 [2], whereas the attractive enthalpy change
for hydrogen storage is between 30 and 48 kJ/mol H2 [12]. Therefore, its
thermodynamic property should be improved at first in order to launch it into practical
application for hydrogen storage.
3. Amorphous and nanostructured phases of Mg-Ni-based systems
The hydrogen storage properties of conventional polycrystalline Mg2Ni are rather
poor, and therefore amorphous and nanocrystalline phases of Mg-Ni-based systems
are often introduced for improving the hydrogen storage properties.
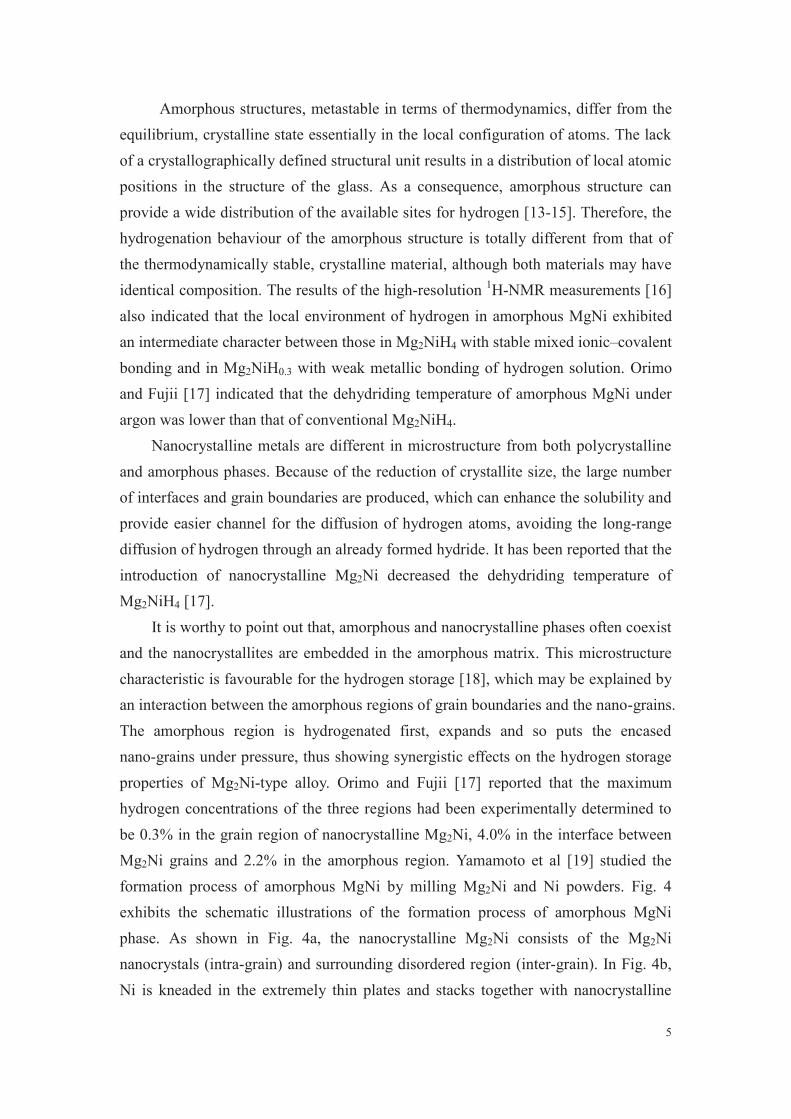
5
Amorphous structures, metastable in terms of thermodynamics, differ from the
equilibrium, crystalline state essentially in the local configuration of atoms. The lack
of a crystallographically defined structural unit results in a distribution of local atomic
positions in the structure of the glass. As a consequence, amorphous structure can
provide a wide distribution of the available sites for hydrogen [13-15]. Therefore, the
hydrogenation behaviour of the amorphous structure is totally different from that of
the thermodynamically stable, crystalline material, although both materials may have
identical composition. The results of the high-resolution 1H-NMR measurements [16]
also indicated that the local environment of hydrogen in amorphous MgNi exhibited
an intermediate character between those in Mg2NiH4 with stable mixed ionic–covalent
bonding and in Mg2NiH0.3 with weak metallic bonding of hydrogen solution. Orimo
and Fujii [17] indicated that the dehydriding temperature of amorphous MgNi under
argon was lower than that of conventional Mg2NiH4.
Nanocrystalline metals are different in microstructure from both polycrystalline
and amorphous phases. Because of the reduction of crystallite size, the large number
of interfaces and grain boundaries are produced, which can enhance the solubility and
provide easier channel for the diffusion of hydrogen atoms, avoiding the long-range
diffusion of hydrogen through an already formed hydride. It has been reported that the
introduction of nanocrystalline Mg2Ni decreased the dehydriding temperature of
Mg2NiH4 [17].
It is worthy to point out that, amorphous and nanocrystalline phases often coexist
and the nanocrystallites are embedded in the amorphous matrix. This microstructure
characteristic is favourable for the hydrogen storage [18], which may be explained by
an interaction between the amorphous regions of grain boundaries and the nano-grains.
The amorphous region is hydrogenated first, expands and so puts the encased
nano-grains under pressure, thus showing synergistic effects on the hydrogen storage
properties of Mg2Ni-type alloy. Orimo and Fujii [17] reported that the maximum
hydrogen concentrations of the three regions had been experimentally determined to
be 0.3% in the grain region of nanocrystalline Mg2Ni, 4.0% in the interface between
Mg2Ni grains and 2.2% in the amorphous region. Yamamoto et al [19] studied the
formation process of amorphous MgNi by milling Mg2Ni and Ni powders. Fig. 4
exhibits the schematic illustrations of the formation process of amorphous MgNi
phase. As shown in Fig. 4a, the nanocrystalline Mg2Ni consists of the Mg2Ni
nanocrystals (intra-grain) and surrounding disordered region (inter-grain). In Fig. 4b,
Ni is kneaded in the extremely thin plates and stacks together with nanocrystalline
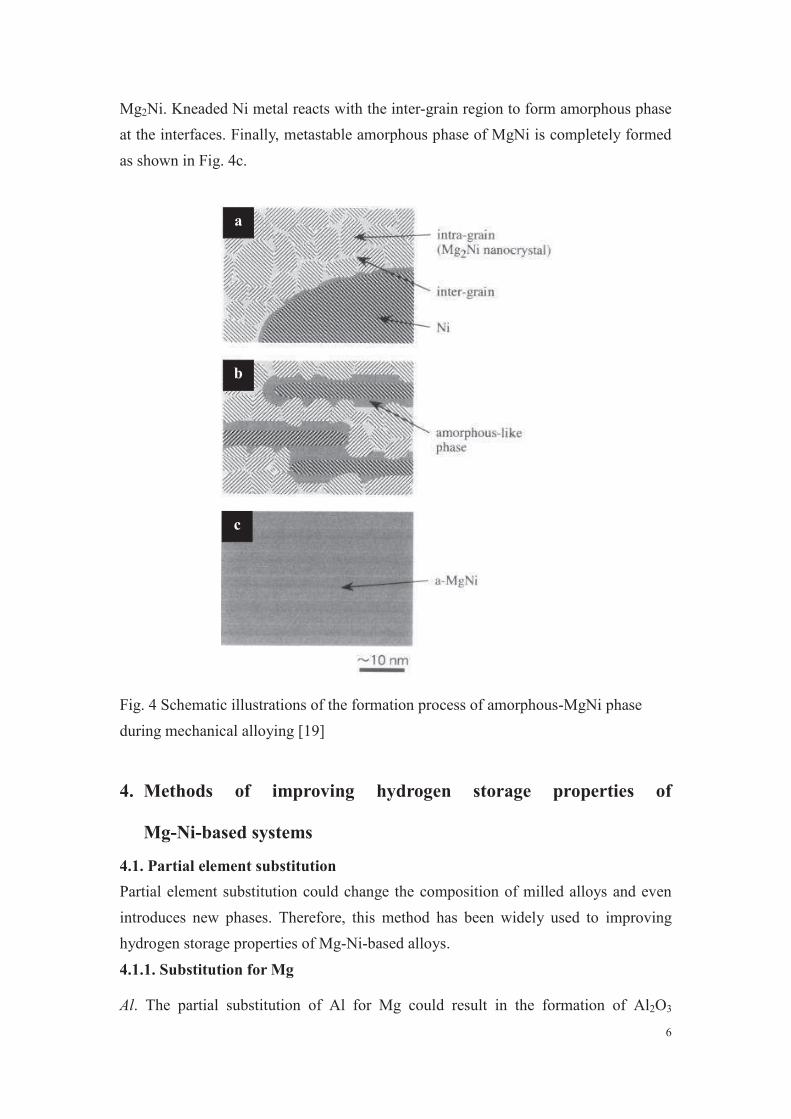
6
b"
c"
a"
Mg2Ni. Kneaded Ni metal reacts with the inter-grain region to form amorphous phase
at the interfaces. Finally, metastable amorphous phase of MgNi is completely formed
as shown in Fig. 4c.
Fig. 4 Schematic illustrations of the formation process of amorphous-MgNi phase
during mechanical alloying [19]
4. Methods of improving hydrogen storage properties of
Mg-Ni-based systems
4.1. Partial element substitution
Partial element substitution could change the composition of milled alloys and even
introduces new phases. Therefore, this method has been widely used to improving
hydrogen storage properties of Mg-Ni-based alloys.
4.1.1. Substitution for Mg
Al. The partial substitution of Al for Mg could result in the formation of Al2O3
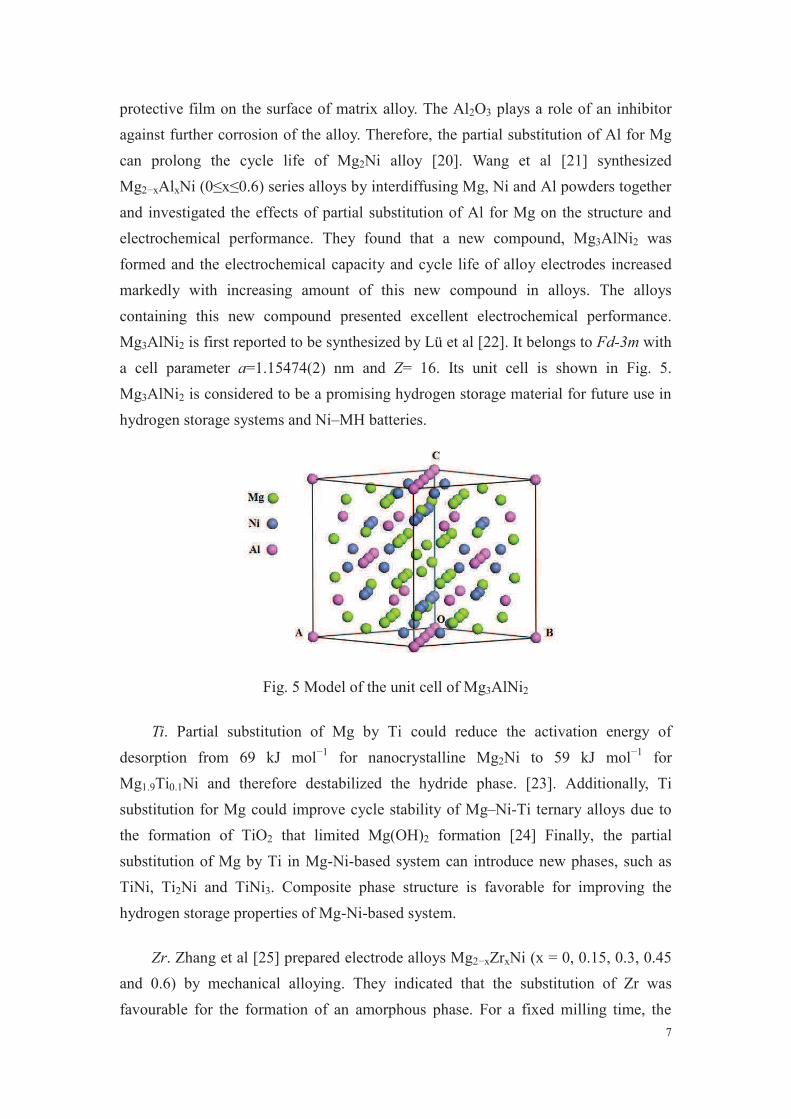
7
protective film on the surface of matrix alloy. The Al2O3 plays a role of an inhibitor
against further corrosion of the alloy. Therefore, the partial substitution of Al for Mg
can prolong the cycle life of Mg2Ni alloy [20]. Wang et al [21] synthesized
Mg2−xAlxNi (0≤x≤0.6) series alloys by interdiffusing Mg, Ni and Al powders together
and investigated the effects of partial substitution of Al for Mg on the structure and
electrochemical performance. They found that a new compound, Mg3AlNi2 was
formed and the electrochemical capacity and cycle life of alloy electrodes increased
markedly with increasing amount of this new compound in alloys. The alloys
containing this new compound presented excellent electrochemical performance.
Mg3AlNi2 is first reported to be synthesized by Lü et al [22]. It belongs to Fd-3m with
a cell parameter a=1.15474(2) nm and Z= 16. Its unit cell is shown in Fig. 5.
Mg3AlNi2 is considered to be a promising hydrogen storage material for future use in
hydrogen storage systems and Ni–MH batteries.
Fig. 5 Model of the unit cell of Mg3AlNi2
Ti. Partial substitution of Mg by Ti could reduce the activation energy of
desorption from 69 kJ mol−1 for nanocrystalline Mg2Ni to 59 kJ mol−1 for
Mg1.9Ti0.1Ni and therefore destabilized the hydride phase. [23]. Additionally, Ti
substitution for Mg could improve cycle stability of Mg–Ni-Ti ternary alloys due to
the formation of TiO2 that limited Mg(OH)2 formation [24] Finally, the partial
substitution of Mg by Ti in Mg-Ni-based system can introduce new phases, such as
TiNi, Ti2Ni and TiNi3. Composite phase structure is favorable for improving the
hydrogen storage properties of Mg-Ni-based system.
Zr. Zhang et al [25] prepared electrode alloys Mg2−xZrxNi (x = 0, 0.15, 0.3, 0.45
and 0.6) by mechanical alloying. They indicated that the substitution of Zr was
favourable for the formation of an amorphous phase. For a fixed milling time, the
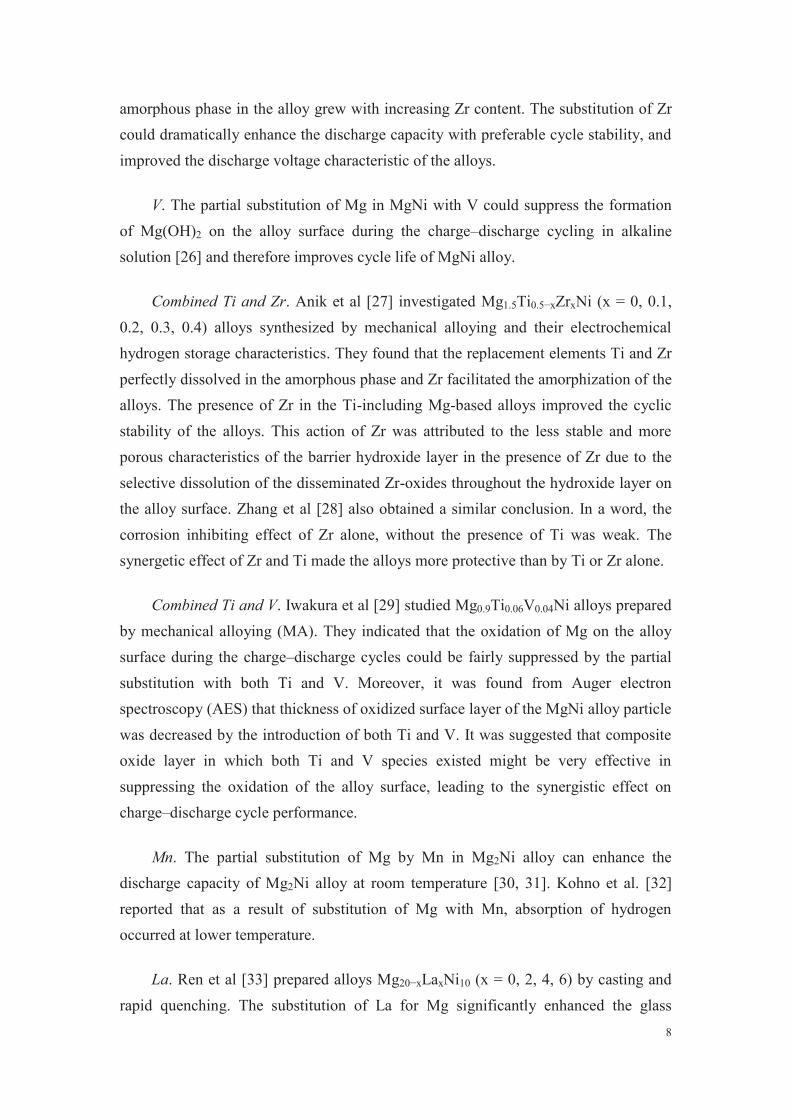
8
amorphous phase in the alloy grew with increasing Zr content. The substitution of Zr
could dramatically enhance the discharge capacity with preferable cycle stability, and
improved the discharge voltage characteristic of the alloys.
V. The partial substitution of Mg in MgNi with V could suppress the formation
of Mg(OH)2 on the alloy surface during the charge–discharge cycling in alkaline
solution [26] and therefore improves cycle life of MgNi alloy.
Combined Ti and Zr. Anik et al [27] investigated Mg1.5Ti0.5−xZrxNi (x = 0, 0.1,
0.2, 0.3, 0.4) alloys synthesized by mechanical alloying and their electrochemical
hydrogen storage characteristics. They found that the replacement elements Ti and Zr
perfectly dissolved in the amorphous phase and Zr facilitated the amorphization of the
alloys. The presence of Zr in the Ti-including Mg-based alloys improved the cyclic
stability of the alloys. This action of Zr was attributed to the less stable and more
porous characteristics of the barrier hydroxide layer in the presence of Zr due to the
selective dissolution of the disseminated Zr-oxides throughout the hydroxide layer on
the alloy surface. Zhang et al [28] also obtained a similar conclusion. In a word, the
corrosion inhibiting effect of Zr alone, without the presence of Ti was weak. The
synergetic effect of Zr and Ti made the alloys more protective than by Ti or Zr alone.
Combined Ti and V. Iwakura et al [29] studied Mg0.9Ti0.06V0.04Ni alloys prepared
by mechanical alloying (MA). They indicated that the oxidation of Mg on the alloy
surface during the charge–discharge cycles could be fairly suppressed by the partial
substitution with both Ti and V. Moreover, it was found from Auger electron
spectroscopy (AES) that thickness of oxidized surface layer of the MgNi alloy particle
was decreased by the introduction of both Ti and V. It was suggested that composite
oxide layer in which both Ti and V species existed might be very effective in
suppressing the oxidation of the alloy surface, leading to the synergistic effect on
charge–discharge cycle performance.
Mn. The partial substitution of Mg by Mn in Mg2Ni alloy can enhance the
discharge capacity of Mg2Ni alloy at room temperature [30, 31]. Kohno et al. [32]
reported that as a result of substitution of Mg with Mn, absorption of hydrogen
occurred at lower temperature.
La. Ren et al [33] prepared alloys Mg20−xLaxNi10 (x = 0, 2, 4, 6) by casting and
rapid quenching. The substitution of La for Mg significantly enhanced the glass
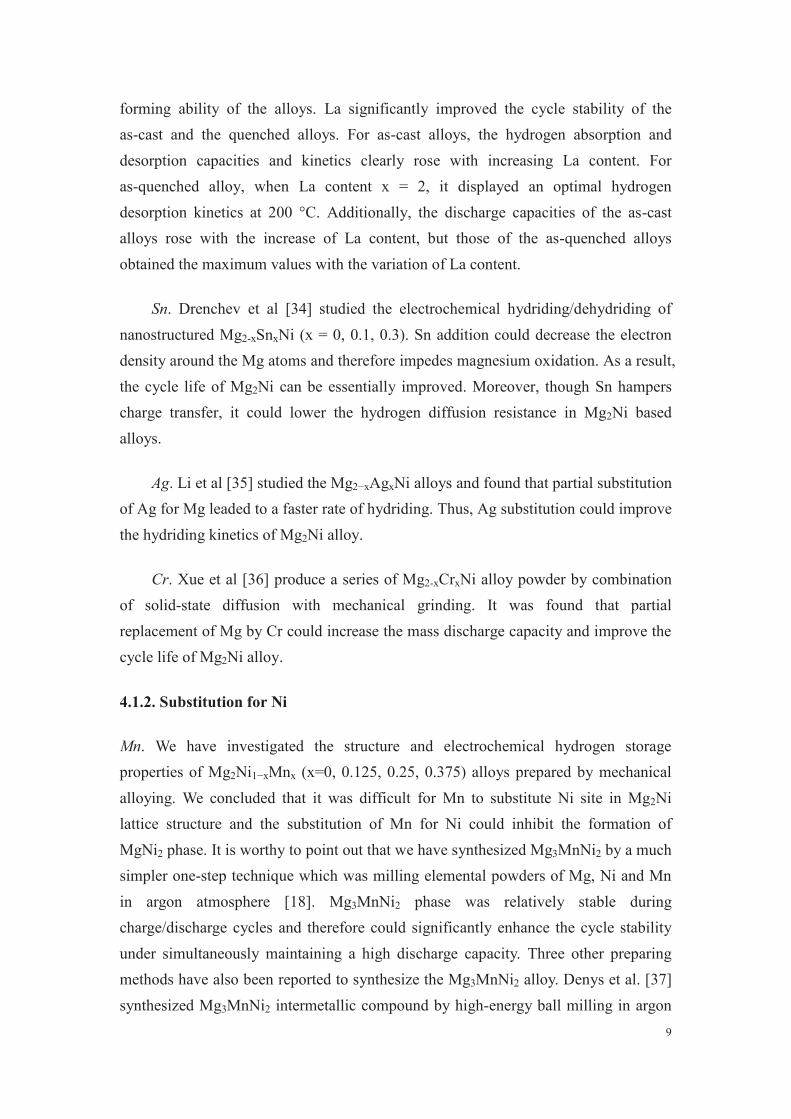
9
forming ability of the alloys. La significantly improved the cycle stability of the
as-cast and the quenched alloys. For as-cast alloys, the hydrogen absorption and
desorption capacities and kinetics clearly rose with increasing La content. For
as-quenched alloy, when La content x = 2, it displayed an optimal hydrogen
desorption kinetics at 200 °C. Additionally, the discharge capacities of the as-cast
alloys rose with the increase of La content, but those of the as-quenched alloys
obtained the maximum values with the variation of La content.
Sn. Drenchev et al [34] studied the electrochemical hydriding/dehydriding of
nanostructured Mg2-xSnxNi (x = 0, 0.1, 0.3). Sn addition could decrease the electron
density around the Mg atoms and therefore impedes magnesium oxidation. As a result,
the cycle life of Mg2Ni can be essentially improved. Moreover, though Sn hampers
charge transfer, it could lower the hydrogen diffusion resistance in Mg2Ni based
alloys.
Ag. Li et al [35] studied the Mg2−xAgxNi alloys and found that partial substitution
of Ag for Mg leaded to a faster rate of hydriding. Thus, Ag substitution could improve
the hydriding kinetics of Mg2Ni alloy.
Cr. Xue et al [36] produce a series of Mg2-xCrxNi alloy powder by combination
of solid-state diffusion with mechanical grinding. It was found that partial
replacement of Mg by Cr could increase the mass discharge capacity and improve the
cycle life of Mg2Ni alloy.
4.1.2. Substitution for Ni
Mn. We have investigated the structure and electrochemical hydrogen storage
properties of Mg2Ni1−xMnx (x=0, 0.125, 0.25, 0.375) alloys prepared by mechanical
alloying. We concluded that it was difficult for Mn to substitute Ni site in Mg2Ni
lattice structure and the substitution of Mn for Ni could inhibit the formation of
MgNi2 phase. It is worthy to point out that we have synthesized Mg3MnNi2 by a much
simpler one-step technique which was milling elemental powders of Mg, Ni and Mn
in argon atmosphere [18]. Mg3MnNi2 phase was relatively stable during
charge/discharge cycles and therefore could significantly enhance the cycle stability
under simultaneously maintaining a high discharge capacity. Three other preparing
methods have also been reported to synthesize the Mg3MnNi2 alloy. Denys et al. [37]
synthesized Mg3MnNi2 intermetallic compound by high-energy ball milling in argon
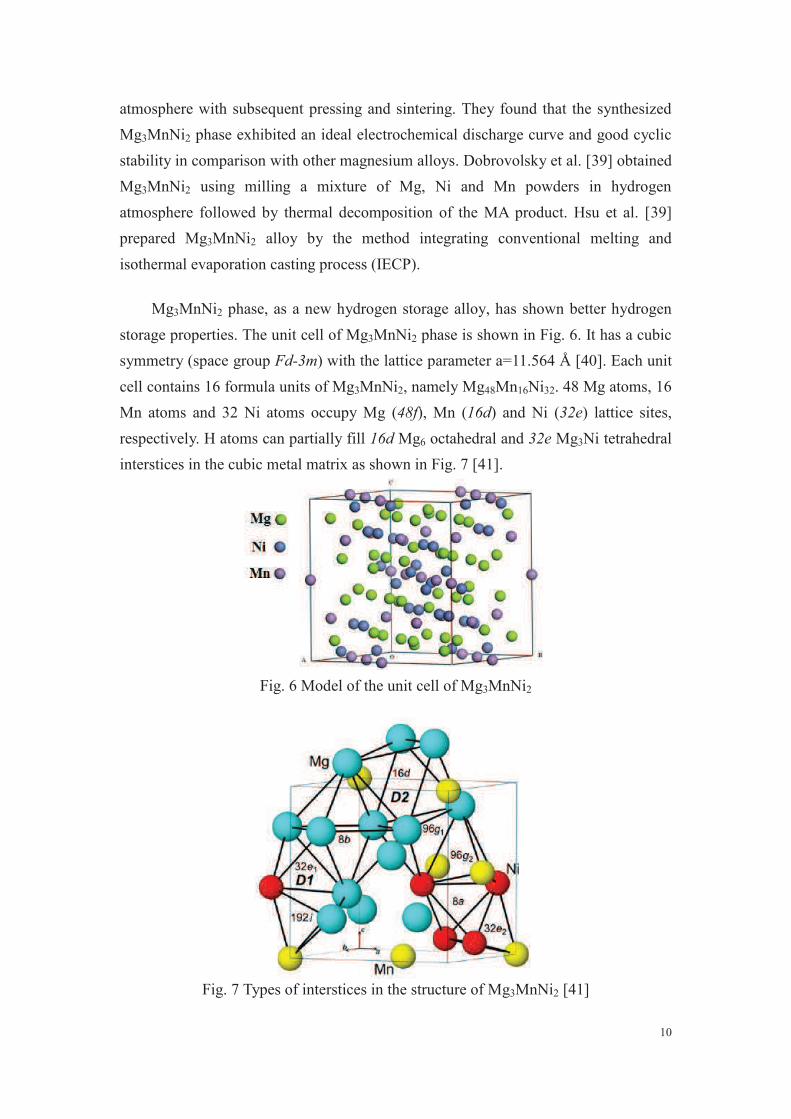
10
atmosphere with subsequent pressing and sintering. They found that the synthesized
Mg3MnNi2 phase exhibited an ideal electrochemical discharge curve and good cyclic
stability in comparison with other magnesium alloys. Dobrovolsky et al. [39] obtained
Mg3MnNi2 using milling a mixture of Mg, Ni and Mn powders in hydrogen
atmosphere followed by thermal decomposition of the MA product. Hsu et al. [39]
prepared Mg3MnNi2 alloy by the method integrating conventional melting and
isothermal evaporation casting process (IECP).
Mg3MnNi2 phase, as a new hydrogen storage alloy, has shown better hydrogen
storage properties. The unit cell of Mg3MnNi2 phase is shown in Fig. 6. It has a cubic
symmetry (space group Fd-3m) with the lattice parameter a=11.564 Å [40]. Each unit
cell contains 16 formula units of Mg3MnNi2, namely Mg48Mn16Ni32. 48 Mg atoms, 16
Mn atoms and 32 Ni atoms occupy Mg (48f), Mn (16d) and Ni (32e) lattice sites,
respectively. H atoms can partially fill 16d Mg6 octahedral and 32e Mg3Ni tetrahedral
interstices in the cubic metal matrix as shown in Fig. 7 [41].
Fig. 6 Model of the unit cell of Mg3MnNi2
Fig. 7 Types of interstices in the structure of Mg3MnNi2 [41]
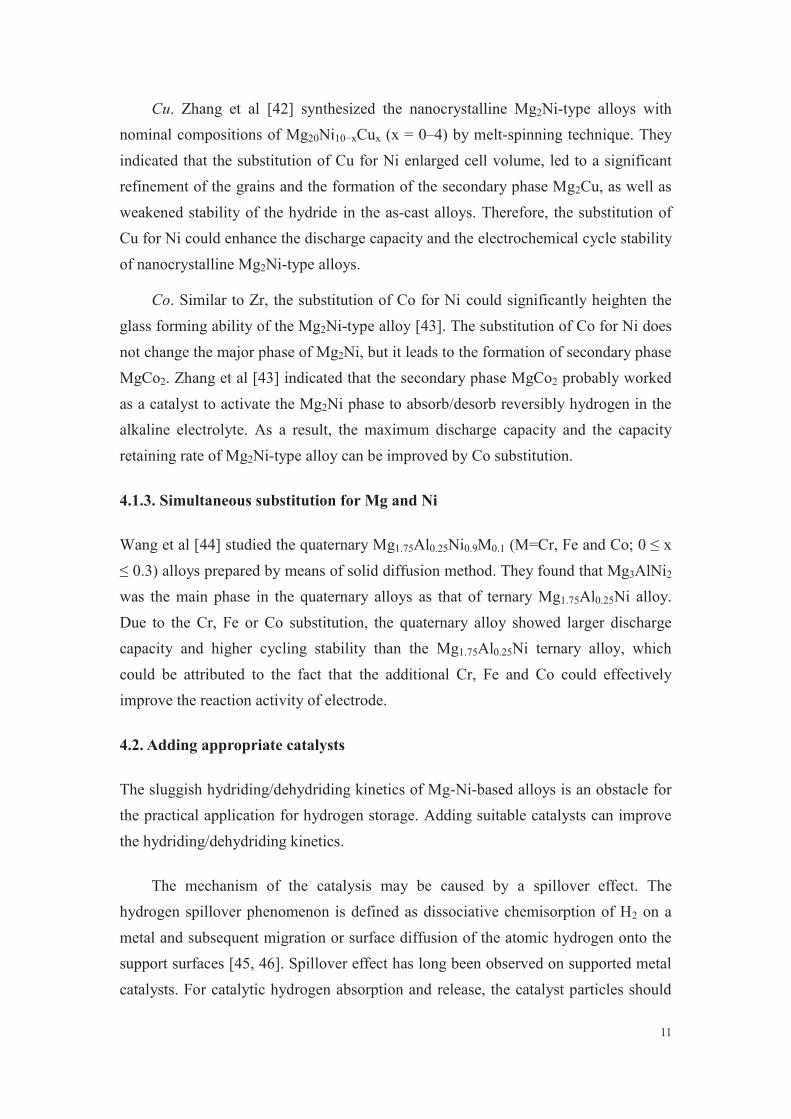
11
Cu. Zhang et al [42] synthesized the nanocrystalline Mg2Ni-type alloys with
nominal compositions of Mg20Ni10−xCux (x = 0–4) by melt-spinning technique. They
indicated that the substitution of Cu for Ni enlarged cell volume, led to a significant
refinement of the grains and the formation of the secondary phase Mg2Cu, as well as
weakened stability of the hydride in the as-cast alloys. Therefore, the substitution of
Cu for Ni could enhance the discharge capacity and the electrochemical cycle stability
of nanocrystalline Mg2Ni-type alloys.
Co. Similar to Zr, the substitution of Co for Ni could significantly heighten the
glass forming ability of the Mg2Ni-type alloy [43]. The substitution of Co for Ni does
not change the major phase of Mg2Ni, but it leads to the formation of secondary phase
MgCo2. Zhang et al [43] indicated that the secondary phase MgCo2 probably worked
as a catalyst to activate the Mg2Ni phase to absorb/desorb reversibly hydrogen in the
alkaline electrolyte. As a result, the maximum discharge capacity and the capacity
retaining rate of Mg2Ni-type alloy can be improved by Co substitution.
4.1.3. Simultaneous substitution for Mg and Ni
Wang et al [44] studied the quaternary Mg1.75Al0.25Ni0.9M0.1 (M=Cr, Fe and Co; 0 ≤ x
≤ 0.3) alloys prepared by means of solid diffusion method. They found that Mg3AlNi2
was the main phase in the quaternary alloys as that of ternary Mg1.75Al0.25Ni alloy.
Due to the Cr, Fe or Co substitution, the quaternary alloy showed larger discharge
capacity and higher cycling stability than the Mg1.75Al0.25Ni ternary alloy, which
could be attributed to the fact that the additional Cr, Fe and Co could effectively
improve the reaction activity of electrode.
4.2. Adding appropriate catalysts
The sluggish hydriding/dehydriding kinetics of Mg-Ni-based alloys is an obstacle for
the practical application for hydrogen storage. Adding suitable catalysts can improve
the hydriding/dehydriding kinetics.
The mechanism of the catalysis may be caused by a spillover effect. The
hydrogen spillover phenomenon is defined as dissociative chemisorption of H2 on a
metal and subsequent migration or surface diffusion of the atomic hydrogen onto the
support surfaces [45, 46]. Spillover effect has long been observed on supported metal
catalysts. For catalytic hydrogen absorption and release, the catalyst particles should
12
preferably be deposited on the outer surface of the alloy particles to ensure the best
catalytic effect [47]. If the catalyst particles are capsulated in the alloy particles,
hydrogen molecules cannot contact with the catalyst and the “catalyst” has no
promotional effect for hydrogen absorption. Gutfleisch et al [48] found that co-milling
Mg2Ni with Ru for a short time, such as 1 h, made the onset temperature of hydrogen
desorption be decreased as low as 80 °C. However Co-milling the nanocrystalline
hydride with platinum group metals (PGM) catalysts for long durations made the
catalysts diffuse into the bulk and consequently destroyed its effectiveness at the
surface. Moreover, the coating of Mg2Ni-type hydrides with the PGM catalyst could
protect the surface from oxidation, which led to an improved cycle stability.
Pd is one of the most important catalysts used to improve the the
hydriding/dehydriding kinetics of Mg-Ni-based alloys. Zaluski et al [49] prepared
nanocrystalline Mg2Ni by ball milling and small amounts of Pd (less than 1 wt. %)
were added for the catalytic modification of the surface of the Mg2Ni powder. They
concluded that the powders modified with Pd showed substantially enhanced
hydrogen absorption kinetics and were much less sensitive to air exposures, which
normally poisoned the surface and created a barrier for hydrogen dissociation and
transfer into the material. Spillover mechanism can be used to explain the catalytic
effect of palladium. The Pd catalyst acted effectively when present in the form of
small clusters or particles dispersed on the surface of the absorbing material.
Xu et al [50] deposited nano-particles of various metal catalysts (palladium,
platinum and ruthenium) on the outer surface of magnesium powders through a wet
chemistry process. As a result, both the hydrogen absorption and hydrogen release
kinetics of magnesium were significantly improved by doping the nano-particle
catalysts. Palladium showed the best catalytic effect among the three metals-doped
and examined. Doping 0.5 mol % nano-particle palladium made the hydrogen
absorption and hydrogen release rates of magnesium increase 1 and 14 times,
respectively. The added nano-particle palladium probably acts as hydrogen pumps,
during the desorption process and consequently leads to a faster hydrogen release.
4.3. Adding carbon materials
Carbon materials exhibit certain properties that make them in combination with metal
hydrides more suitable compared to other potential supports or additives [51].
Generally speaking, all of the carbon allotropes, such as graphite, fullerene, activated
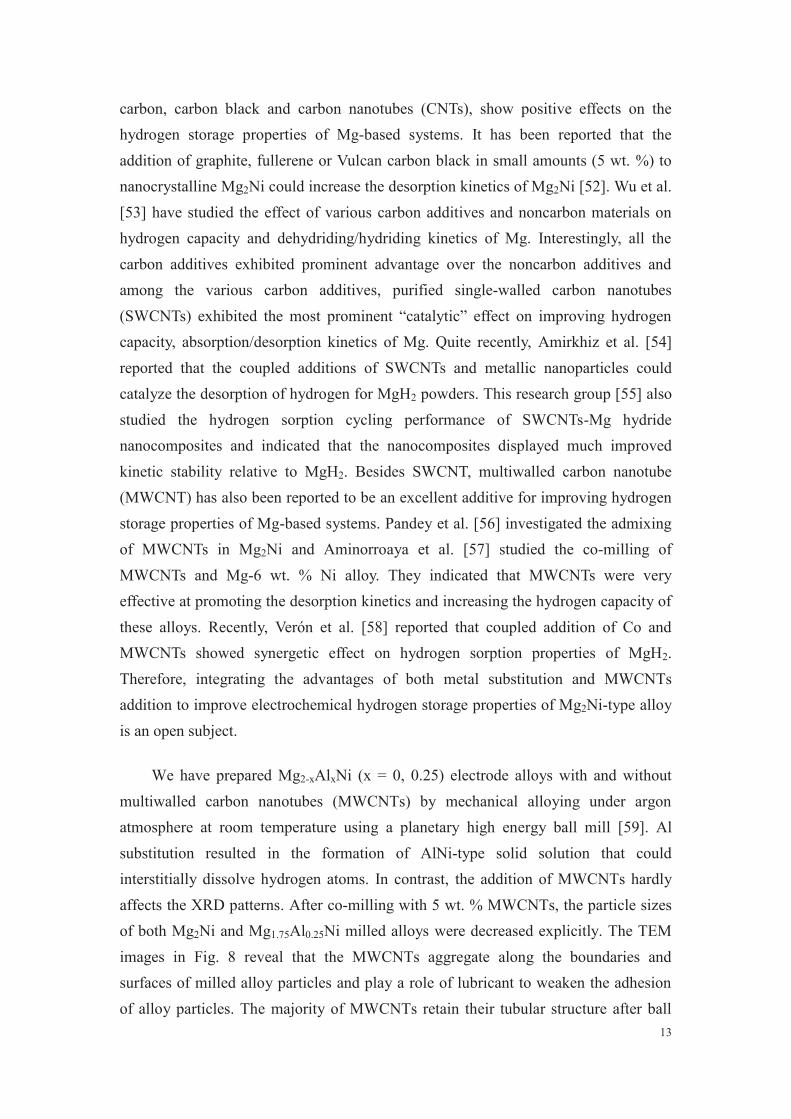
13
carbon, carbon black and carbon nanotubes (CNTs), show positive effects on the
hydrogen storage properties of Mg-based systems. It has been reported that the
addition of graphite, fullerene or Vulcan carbon black in small amounts (5 wt. %) to
nanocrystalline Mg2Ni could increase the desorption kinetics of Mg2Ni [52]. Wu et al.
[53] have studied the effect of various carbon additives and noncarbon materials on
hydrogen capacity and dehydriding/hydriding kinetics of Mg. Interestingly, all the
carbon additives exhibited prominent advantage over the noncarbon additives and
among the various carbon additives, purified single-walled carbon nanotubes
(SWCNTs) exhibited the most prominent “catalytic” effect on improving hydrogen
capacity, absorption/desorption kinetics of Mg. Quite recently, Amirkhiz et al. [54]
reported that the coupled additions of SWCNTs and metallic nanoparticles could
catalyze the desorption of hydrogen for MgH2 powders. This research group [55] also
studied the hydrogen sorption cycling performance of SWCNTs-Mg hydride
nanocomposites and indicated that the nanocomposites displayed much improved
kinetic stability relative to MgH2. Besides SWCNT, multiwalled carbon nanotube
(MWCNT) has also been reported to be an excellent additive for improving hydrogen
storage properties of Mg-based systems. Pandey et al. [56] investigated the admixing
of MWCNTs in Mg2Ni and Aminorroaya et al. [57] studied the co-milling of
MWCNTs and Mg-6 wt. % Ni alloy. They indicated that MWCNTs were very
effective at promoting the desorption kinetics and increasing the hydrogen capacity of
these alloys. Recently, Verón et al. [58] reported that coupled addition of Co and
MWCNTs showed synergetic effect on hydrogen sorption properties of MgH2.
Therefore, integrating the advantages of both metal substitution and MWCNTs
addition to improve electrochemical hydrogen storage properties of Mg2Ni-type alloy
is an open subject.
We have prepared Mg2-xAlxNi (x = 0, 0.25) electrode alloys with and without
multiwalled carbon nanotubes (MWCNTs) by mechanical alloying under argon
atmosphere at room temperature using a planetary high energy ball mill [59]. Al
substitution resulted in the formation of AlNi-type solid solution that could
interstitially dissolve hydrogen atoms. In contrast, the addition of MWCNTs hardly
affects the XRD patterns. After co-milling with 5 wt. % MWCNTs, the particle sizes
of both Mg2Ni and Mg1.75Al0.25Ni milled alloys were decreased explicitly. The TEM
images in Fig. 8 reveal that the MWCNTs aggregate along the boundaries and
surfaces of milled alloy particles and play a role of lubricant to weaken the adhesion
of alloy particles. The majority of MWCNTs retain their tubular structure after ball
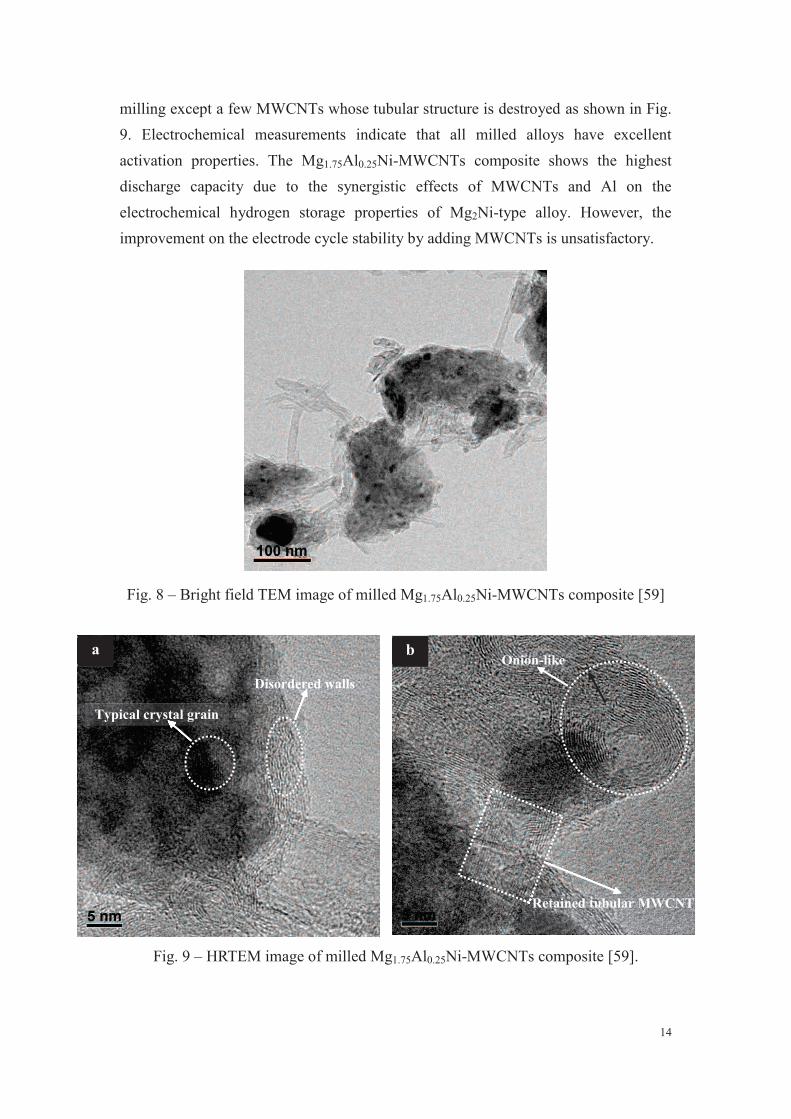
14
a
Typical crystal grain
Disordered walls
b
Retained tubular MWCNT
Onion-like
milling except a few MWCNTs whose tubular structure is destroyed as shown in Fig.
9. Electrochemical measurements indicate that all milled alloys have excellent
activation properties. The Mg1.75Al0.25Ni-MWCNTs composite shows the highest
discharge capacity due to the synergistic effects of MWCNTs and Al on the
electrochemical hydrogen storage properties of Mg2Ni-type alloy. However, the
improvement on the electrode cycle stability by adding MWCNTs is unsatisfactory.
Fig. 8 – Bright field TEM image of milled Mg1.75Al0.25Ni-MWCNTs composite [59]
Fig. 9 – HRTEM image of milled Mg1.75Al0.25Ni-MWCNTs composite [59].
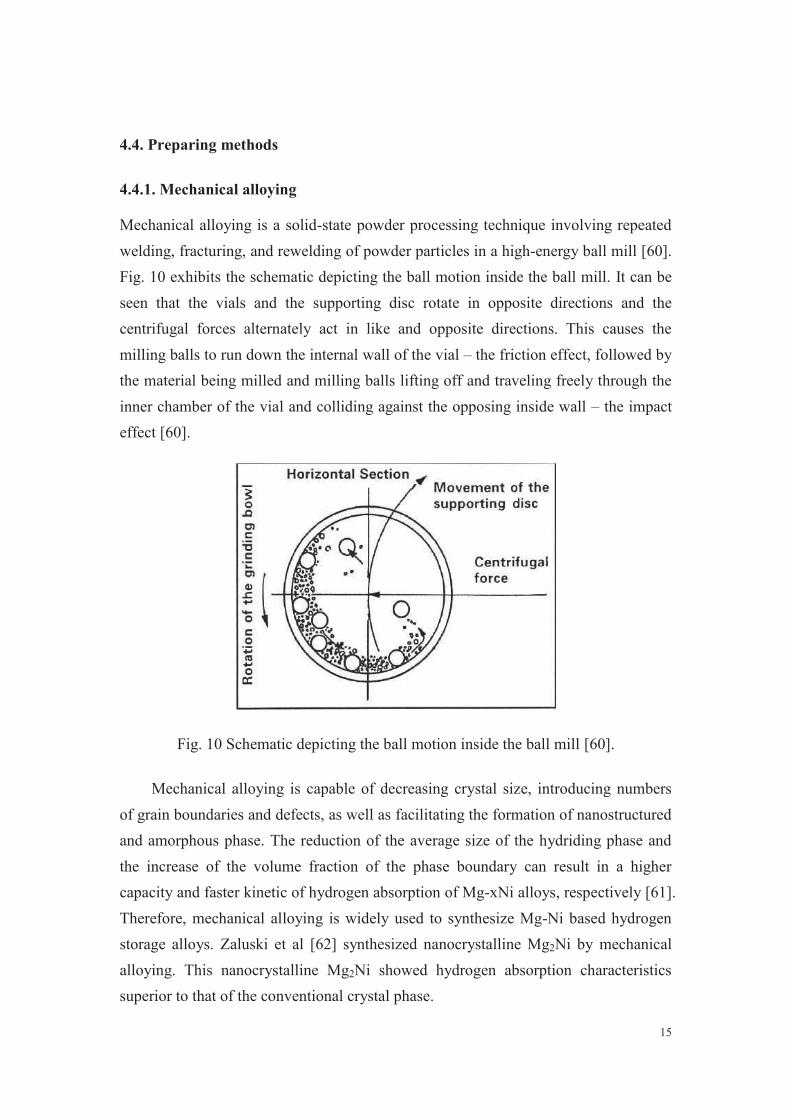
15
4.4. Preparing methods
4.4.1. Mechanical alloying
Mechanical alloying is a solid-state powder processing technique involving repeated
welding, fracturing, and rewelding of powder particles in a high-energy ball mill [60].
Fig. 10 exhibits the schematic depicting the ball motion inside the ball mill. It can be
seen that the vials and the supporting disc rotate in opposite directions and the
centrifugal forces alternately act in like and opposite directions. This causes the
milling balls to run down the internal wall of the vial – the friction effect, followed by
the material being milled and milling balls lifting off and traveling freely through the
inner chamber of the vial and colliding against the opposing inside wall – the impact
effect [60].
Fig. 10 Schematic depicting the ball motion inside the ball mill [60].
Mechanical alloying is capable of decreasing crystal size, introducing numbers
of grain boundaries and defects, as well as facilitating the formation of nanostructured
and amorphous phase. The reduction of the average size of the hydriding phase and
the increase of the volume fraction of the phase boundary can result in a higher
capacity and faster kinetic of hydrogen absorption of Mg-xNi alloys, respectively [61].
Therefore, mechanical alloying is widely used to synthesize Mg-Ni based hydrogen
storage alloys. Zaluski et al [62] synthesized nanocrystalline Mg2Ni by mechanical
alloying. This nanocrystalline Mg2Ni showed hydrogen absorption characteristics
superior to that of the conventional crystal phase.
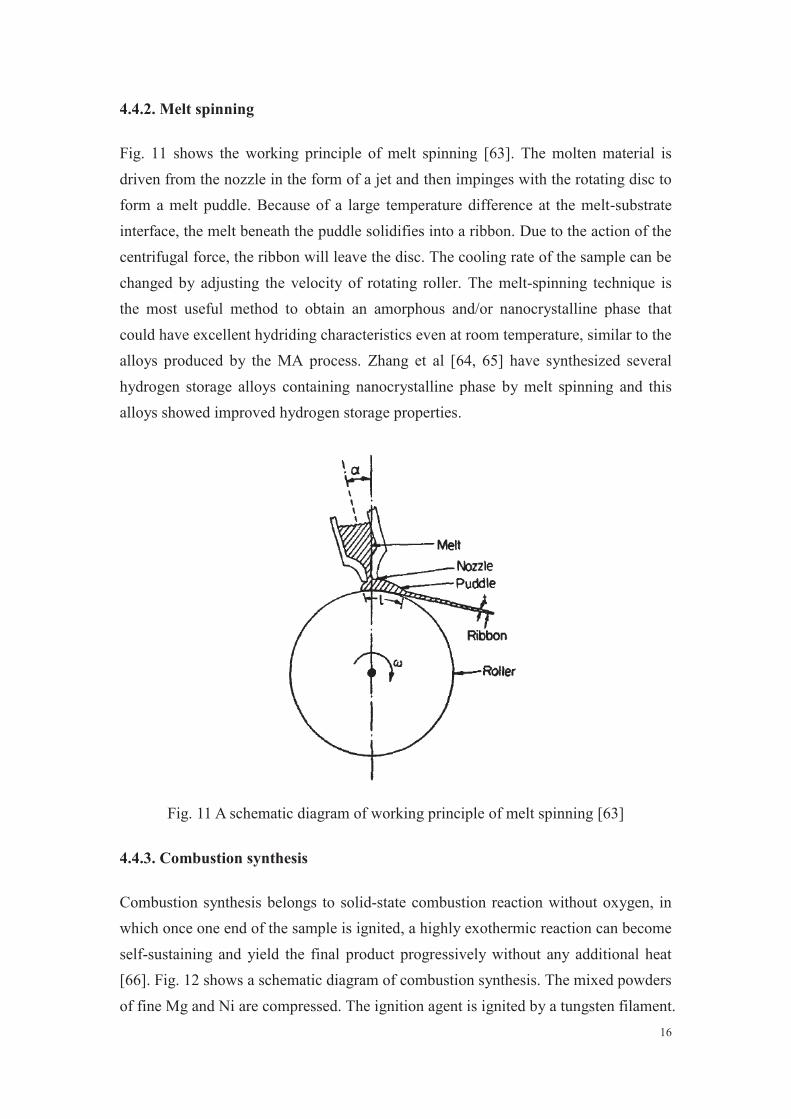
16
4.4.2. Melt spinning
Fig. 11 shows the working principle of melt spinning [63]. The molten material is
driven from the nozzle in the form of a jet and then impinges with the rotating disc to
form a melt puddle. Because of a large temperature difference at the melt-substrate
interface, the melt beneath the puddle solidifies into a ribbon. Due to the action of the
centrifugal force, the ribbon will leave the disc. The cooling rate of the sample can be
changed by adjusting the velocity of rotating roller. The melt-spinning technique is
the most useful method to obtain an amorphous and/or nanocrystalline phase that
could have excellent hydriding characteristics even at room temperature, similar to the
alloys produced by the MA process. Zhang et al [64, 65] have synthesized several
hydrogen storage alloys containing nanocrystalline phase by melt spinning and this
alloys showed improved hydrogen storage properties.
Fig. 11 A schematic diagram of working principle of melt spinning [63]
4.4.3. Combustion synthesis
Combustion synthesis belongs to solid-state combustion reaction without oxygen, in
which once one end of the sample is ignited, a highly exothermic reaction can become
self-sustaining and yield the final product progressively without any additional heat
[66]. Fig. 12 shows a schematic diagram of combustion synthesis. The mixed powders
of fine Mg and Ni are compressed. The ignition agent is ignited by a tungsten filament.
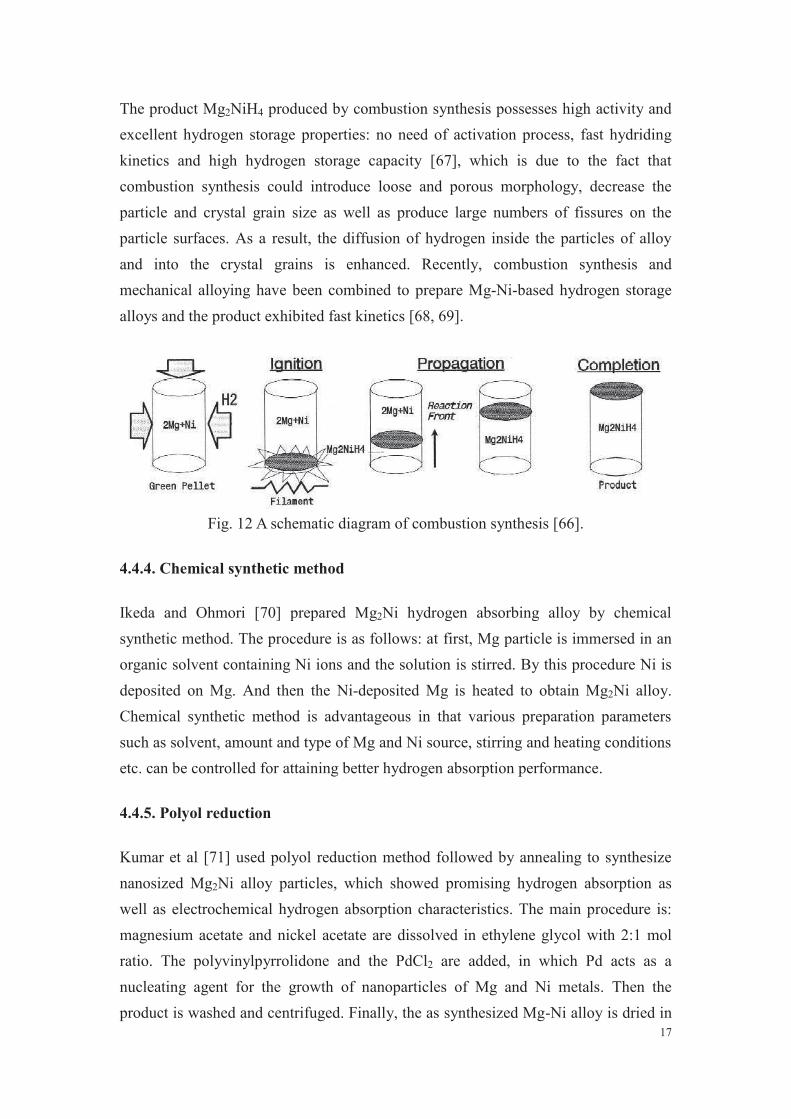
17
The product Mg2NiH4 produced by combustion synthesis possesses high activity and
excellent hydrogen storage properties: no need of activation process, fast hydriding
kinetics and high hydrogen storage capacity [67], which is due to the fact that
combustion synthesis could introduce loose and porous morphology, decrease the
particle and crystal grain size as well as produce large numbers of fissures on the
particle surfaces. As a result, the diffusion of hydrogen inside the particles of alloy
and into the crystal grains is enhanced. Recently, combustion synthesis and
mechanical alloying have been combined to prepare Mg-Ni-based hydrogen storage
alloys and the product exhibited fast kinetics [68, 69].
Fig. 12 A schematic diagram of combustion synthesis [66].
4.4.4. Chemical synthetic method
Ikeda and Ohmori [70] prepared Mg2Ni hydrogen absorbing alloy by chemical
synthetic method. The procedure is as follows: at first, Mg particle is immersed in an
organic solvent containing Ni ions and the solution is stirred. By this procedure Ni is
deposited on Mg. And then the Ni-deposited Mg is heated to obtain Mg2Ni alloy.
Chemical synthetic method is advantageous in that various preparation parameters
such as solvent, amount and type of Mg and Ni source, stirring and heating conditions
etc. can be controlled for attaining better hydrogen absorption performance.
4.4.5. Polyol reduction
Kumar et al [71] used polyol reduction method followed by annealing to synthesize
nanosized Mg2Ni alloy particles, which showed promising hydrogen absorption as
well as electrochemical hydrogen absorption characteristics. The main procedure is:
magnesium acetate and nickel acetate are dissolved in ethylene glycol with 2:1 mol
ratio. The polyvinylpyrrolidone and the PdCl2 are added, in which Pd acts as a
nucleating agent for the growth of nanoparticles of Mg and Ni metals. Then the
product is washed and centrifuged. Finally, the as synthesized Mg-Ni alloy is dried in
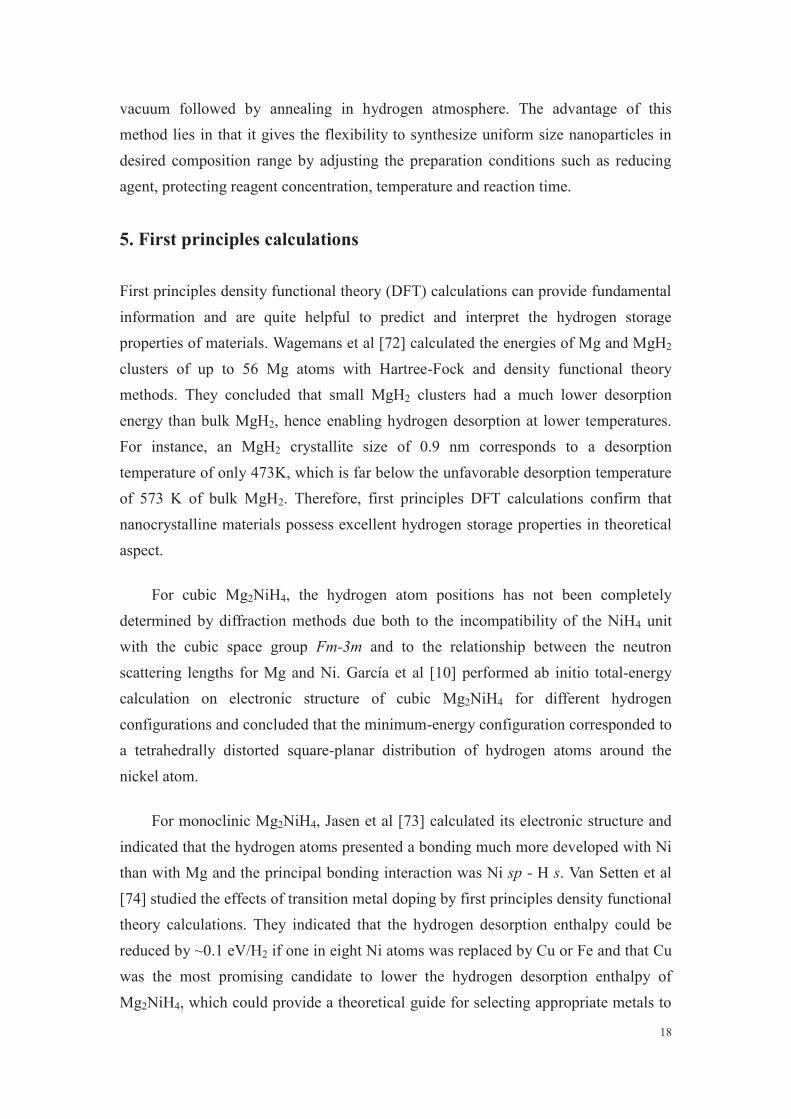
18
vacuum followed by annealing in hydrogen atmosphere. The advantage of this
method lies in that it gives the flexibility to synthesize uniform size nanoparticles in
desired composition range by adjusting the preparation conditions such as reducing
agent, protecting reagent concentration, temperature and reaction time.
5. First principles calculations
First principles density functional theory (DFT) calculations can provide fundamental
information and are quite helpful to predict and interpret the hydrogen storage
properties of materials. Wagemans et al [72] calculated the energies of Mg and MgH2
clusters of up to 56 Mg atoms with Hartree-Fock and density functional theory
methods. They concluded that small MgH2 clusters had a much lower desorption
energy than bulk MgH2, hence enabling hydrogen desorption at lower temperatures.
For instance, an MgH2 crystallite size of 0.9 nm corresponds to a desorption
temperature of only 473K, which is far below the unfavorable desorption temperature
of 573 K of bulk MgH2. Therefore, first principles DFT calculations confirm that
nanocrystalline materials possess excellent hydrogen storage properties in theoretical
aspect.
For cubic Mg2NiH4, the hydrogen atom positions has not been completely
determined by diffraction methods due both to the incompatibility of the NiH4 unit
with the cubic space group Fm-3m and to the relationship between the neutron
scattering lengths for Mg and Ni. García et al [10] performed ab initio total-energy
calculation on electronic structure of cubic Mg2NiH4 for different hydrogen
configurations and concluded that the minimum-energy configuration corresponded to
a tetrahedrally distorted square-planar distribution of hydrogen atoms around the
nickel atom.
For monoclinic Mg2NiH4, Jasen et al [73] calculated its electronic structure and
indicated that the hydrogen atoms presented a bonding much more developed with Ni
than with Mg and the principal bonding interaction was Ni sp - H s. Van Setten et al
[74] studied the effects of transition metal doping by first principles density functional
theory calculations. They indicated that the hydrogen desorption enthalpy could be
reduced by ~0.1 eV/H2 if one in eight Ni atoms was replaced by Cu or Fe and that Cu
was the most promising candidate to lower the hydrogen desorption enthalpy of
Mg2NiH4, which could provide a theoretical guide for selecting appropriate metals to
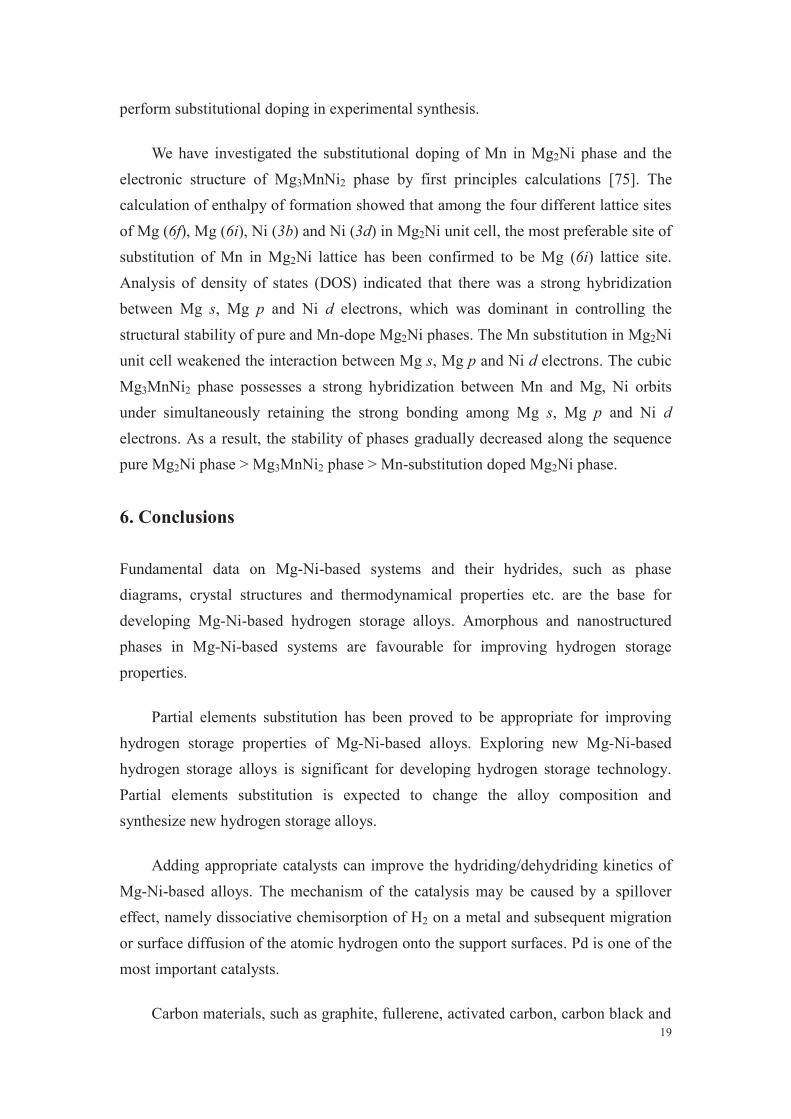
19
perform substitutional doping in experimental synthesis.
We have investigated the substitutional doping of Mn in Mg2Ni phase and the
electronic structure of Mg3MnNi2 phase by first principles calculations [75]. The
calculation of enthalpy of formation showed that among the four different lattice sites
of Mg (6f), Mg (6i), Ni (3b) and Ni (3d) in Mg2Ni unit cell, the most preferable site of
substitution of Mn in Mg2Ni lattice has been confirmed to be Mg (6i) lattice site.
Analysis of density of states (DOS) indicated that there was a strong hybridization
between Mg s, Mg p and Ni d electrons, which was dominant in controlling the
structural stability of pure and Mn-dope Mg2Ni phases. The Mn substitution in Mg2Ni
unit cell weakened the interaction between Mg s, Mg p and Ni d electrons. The cubic
Mg3MnNi2 phase possesses a strong hybridization between Mn and Mg, Ni orbits
under simultaneously retaining the strong bonding among Mg s, Mg p and Ni d
electrons. As a result, the stability of phases gradually decreased along the sequence
pure Mg2Ni phase > Mg3MnNi2 phase > Mn-substitution doped Mg2Ni phase.
6. Conclusions
Fundamental data on Mg-Ni-based systems and their hydrides, such as phase
diagrams, crystal structures and thermodynamical properties etc. are the base for
developing Mg-Ni-based hydrogen storage alloys. Amorphous and nanostructured
phases in Mg-Ni-based systems are favourable for improving hydrogen storage
properties.
Partial elements substitution has been proved to be appropriate for improving
hydrogen storage properties of Mg-Ni-based alloys. Exploring new Mg-Ni-based
hydrogen storage alloys is significant for developing hydrogen storage technology.
Partial elements substitution is expected to change the alloy composition and
synthesize new hydrogen storage alloys.
Adding appropriate catalysts can improve the hydriding/dehydriding kinetics of
Mg-Ni-based alloys. The mechanism of the catalysis may be caused by a spillover
effect, namely dissociative chemisorption of H2 on a metal and subsequent migration
or surface diffusion of the atomic hydrogen onto the support surfaces. Pd is one of the
most important catalysts.
Carbon materials, such as graphite, fullerene, activated carbon, carbon black and
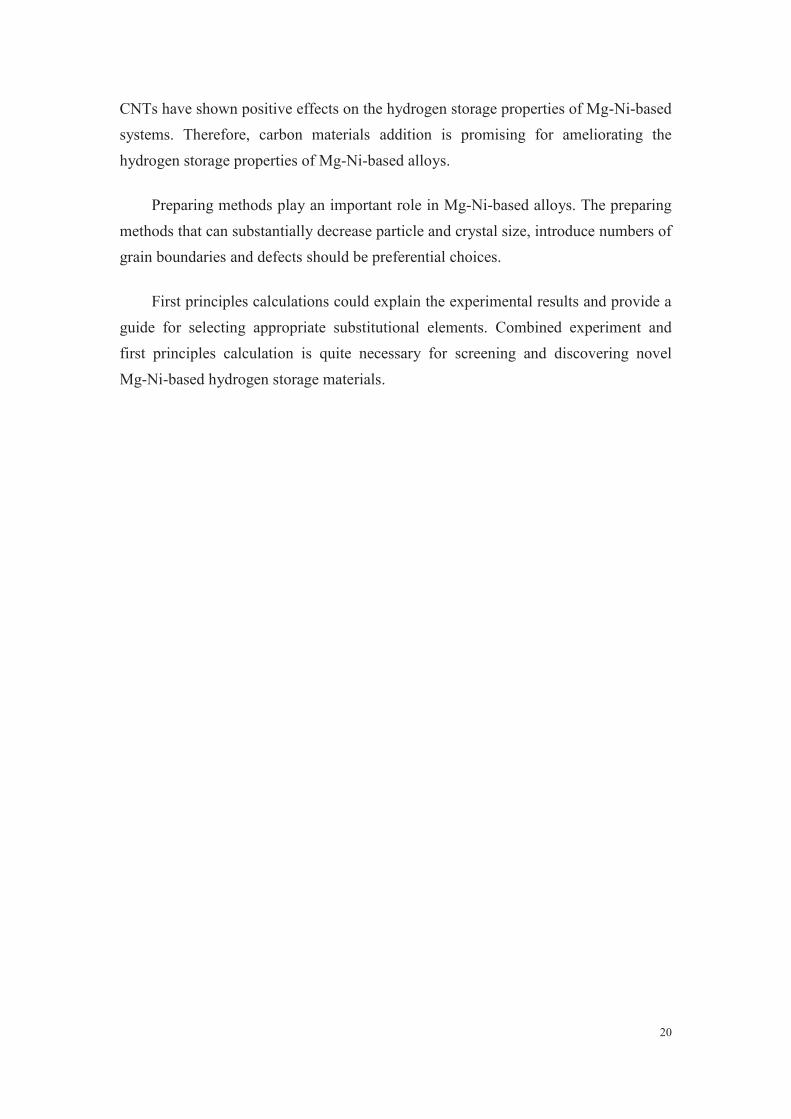
20
CNTs have shown positive effects on the hydrogen storage properties of Mg-Ni-based
systems. Therefore, carbon materials addition is promising for ameliorating the
hydrogen storage properties of Mg-Ni-based alloys.
Preparing methods play an important role in Mg-Ni-based alloys. The preparing
methods that can substantially decrease particle and crystal size, introduce numbers of
grain boundaries and defects should be preferential choices.
First principles calculations could explain the experimental results and provide a
guide for selecting appropriate substitutional elements. Combined experiment and
first principles calculation is quite necessary for screening and discovering novel
Mg-Ni-based hydrogen storage materials.
21
References
[1] Kohno T, Tsuruta S, Kanda M. J Electrochem Soc 1996;143: L198–9.
[2] Reilly JJ, Wiswall RH. Inorg Chem 1968; 7:2254–6.
[3] Schefer J, Fischer P, Hälg W, Stucki F, Schlapbach L, Didisheim JJ, Yvon K, Andresen AF.
J Less-Common Met 1980;74:65–73.
[4] ASM International, Binary Alloy Phase Diagrams, Second Edition Plus Updates,1996.
[5] Selvam P, Viswanathan B, Swamy CS, Srinivasan V. Thermochim Acta 1988;125:1–8.
[6] Liu FJ, Sandrock G, Suda S. Z Phys Chem 1994;183 : 163–7.
[7] Orimo S, Seto H, Ikeda K, Nagao M, Fujii H. Physica B 1996;226:370–4.
[8] Zolliker P, Yvon K, Jorgensen JD, Rotella FJ. 1986;25:3590–3.
[9] Yvon K, Schefer J, Stucki F. Inorg Chem 1981;20:2776–8.
[10] García GN, Abriata JP, Sofo JO. Phys Rev B 1999;59:11746–54.
[11] Lupu D, Sârbu R, Biriş A, Lupu D, Sârbu R, Biriş A. Int J Hydrogen Energy 1987;12:425–
6.
[12] Schlapbach L, Züttel A. Nature 2001;414: 353–8.
[13] Griessen R. Phys Rev B 1983; 27 : 7575–82.
[14] Batalla E, Ström-Olsen JO, Altounian Z, Boothroyd D, Harris R. J Mater Res 1986;1:765.
[15] Bowman JRC. Mater Sci Forum 1988;31 : 197.
[16] Hayashi S, Orimo S, Fujii H. J Alloys Compd 1997;261:145–9.
[17] Orimo S, Fujii H. Appl Phys A 2001;72:167–86 .
[18] Huang LW, Elkedim O, Jarzebski M, Hamzaoui R, Jurczyk M. Int J Hydrogen Energy
2010;35:6794–803.
[19] Yamamoto K, Fujikawa Y, Ikeda K, Orimo S, Fujii H, Kitano Y. J Electron Microsc
1998;47:461–70.
[20] Xue JS, Li GX, Hu YQ, Du J, Wang CQ, Hu GY. J Alloy Compd 2000;307:240–4.
[21] Wang LB, Wang JB,Yuan, HT, Wang YJ, Li QD. J Alloy Compd 2004;385:304–8.
[22] Lü GL, Chen LS, Wang LB ,Yuan HT. J Alloy Compd 2001;321:L1–4.
[23] Liang G, Huot J, Boily S, Van Neste A, Schulz R. J Alloy Compd 1999;282:286–90.
[24] Ruggeri S, Roué L, Huot J ,Schulz R, Aymard L, Tarascon JM. J Power Sources
2002;112:547–56.
[25] Zhang YH, Han XY, Li BW, Ren HP, Dong XP, Wang XL. J Alloy Compd 2008;450:208–
14.
[26] Nohara S, Hamasaki K, Zhang SG, Inoue H, Iwakura C. J Alloy Compd 1998;280:104–6.
[27] Anik M, Akay I, Özdemir G, Baksan B. Int J Hydrogen Energy 2009;34:9765–72.
[28] Zhang Y, Lei YQ, Chen LX, Yuan J, Zhang ZH, Wang QD. J Alloy Compd 2004;337:296–
302.
[29] Iwakura C, Shin-ya R, Miyanohara K, Nohara S, Inoue H. Electrochim Acta 2001;46:2781–
6.
[30] Jurczyk M, Smardz L, Szajek A. Mater Sci Eng B 2004;10: 67–75.
[31] Gasiorowski A, Iwasieczko W, Skoryna D, Drulis H, Jurczyk M. J Alloys Compd 2004;364:
283–8.
[32] Kohno T, Kanda M. J Electrochem Soc 1997;144: 2384–8.
[33] Ren HP ,Zhang YH, Li BW, Zhao DL, Guo SH, Wang XL. Int J Hydrogen Energy
22
2009;34:1429–36.
[34] Drenchev N, Spassov T, Kanazirski I . J Appl Electrochem 2008;38:197–202.
[35] Li Q , Jiang LJ, Chou KC, Lin Q, Zhan F, Xu KD, Lu XG, Zhang JY. J Alloy Compd
2005;339:101–5.
[36] Xue JS, Wang LJ, Luo YH, Li GX, Du J, Hu GY, Wang CQ. Rare Metals 2003;22:144–9.
[37] Denys RV, Saldan IV, Delaplane RG, Berezovets VV, Zavaliy IY. IX International
Conference on Hydrogen Materials Science & Chemistry of Carbon Nanomaterials,
Sevastopol, Ukraine, 2005, pp. 152.
[38] Dobrovolsky VD, Еrshova ОG, Solonin YM. in: Baranowski B, Zaginaichenko SY, Schur
DV, Skorokhod VV, Veziroglu A (Eds.), Carbon Nanomaterials in Clean Energy Hydrogen
Systems, Springer, Netherlands, 2008, pp. 467–72.
[39] Hsu F, Lin C, Lee S, Lin C, Bor H. J Power Sources 2010;195:374–9.
[40] PDF No. 00-057-0388, International Centre for Data Diffraction.
[41] Denys RV, Riabov AR, Berezovets VV, Koval’chuk IV, Černý R, Yu Zavaliy I.
Intermetallics 2011;19:1563–6.
[42] Zhang YH, Li BW, Ren HP, Guo SH, Zhao DL, Wang XL. Mater Chem Phys
2010;124:795–802.
[43] Zhang, YH, Ren HP, Li BW, Guo SH, Pang ZG, Wang XL. Int J Hydrogen Energy
2009;34:8144–51.
[44] Wang MH, Zhang Y, Zhang LZ, Sun LX, Tan ZC, Xu F, Yuan HT, Zhang T. J Power
Sources 2006;159:159-62. Wang MH, Zhang LZ, Zhang Y, Sun LX, Tan ZC, Xu F, Yuan
HT, Zhang T. Int J Hydrogen Energy 2006;31:775–9.
[45] Robell AJ, Ballou E V, Boudart M. J Phys Chem 1964;68: 2748–53.
[46] Conner W C, Falconer J L. Chem Rev 1995;95: 759–88.
[47] Gross KJ, Chartouni D, Leroy E, Züttel A, Schlapbach L. J Alloys Compd 1998;269:259–
70.
[48] Gutfleisch O, Schlorke-de Boer N,Ismail N, Herrich M, Walton A, Speight J, Harris
IR,Pratt AS, Züttel A. J Alloys Compd 2003;356-357:598–602.
[49] Zaluski L, Zaluska A, Tessier P, Ström-Olsen JO, Schulz R. J Alloys
Compd 1995;217:295–300.
[50] Xu XC, Song CS. Appl Catal A-Gen 2006;300:130–8.
[51] Adelhelm P, de Jongh PE. J Mater Chem 2011;21: 2417–27.
[52] Bouaricha S, Dodelet JP, Guay D, Huot J, Boily S, Schulz R. J Alloys Compd 2000;307:
226–33.
[53] Wu CZ, Wang P, Yao X, Liu C, Chen DM, Lu GQ, Cheng HM. J Alloys Compd 2006;414:
259–64.
[54] Amirkhiz BS, Danaie M, Mitlin D. Nanotechnology 2009; 20: 204016.
[55] Amirkhiz BS, Danaie M, Barnes M, Simard B, Mitlin D. J Phys Chem C 2010;114:3265–
75.
[56] Pandey SK, Singh RK, Srivastava ON. Int J Hydrogen Energy 2009;34:9379–84.
[57] Aminorroaya S, Liu HK, Cho Y, Arne Dahle. Int J Hydrogen Energy 2010;35:4144–53.
[58] Verón MG, Troiani H, Gennari FC. Carbon 2011; 49:2413–23.
[59] Huang LW, Elkedim O, Nowak M, Jurczyk M, Chassagnon R, Meng DW. Int J Hydrogen
Energy 2012;37:1538–45.
23
[60] Suryanarayana C. Progr Mater Sci 2001;46: 1–184.
[61] Yim CD, You BS, Na YS, Bae JS. Catal Today 2007;120:276–80.
[62] Zaluski L, Zaluska A, Ström-Olsen JO. J Alloys Compd 1995;217:245–9.
[63] Budhani RC, Goel TC, Chopra KL. Bull Mater Sci1982; 4:549–61.
[64] Zhang, YH, Ren HP, Li BW, Guo SH, Pang ZG, Wang XL. Int J Hydrogen Energy
2009;34:8144–51.
[65] Zhang YH, Li BW, Ren HP, Guo SH, Zhao DL, Wang XL. Mater Chem Phys
2010;124:795–802.
[66] Akiyama T, Isogai H, Yagi J. J Alloys Compd 1997;252:L1–4.
[67] Liu DM, Zhu YF, Li LQ. Int J Hydrogen Energy 2007;32:2455–60.
[68] Liu XF, Zhu YF, Li LQ. J Alloy Compd 2006;425:235–8.
[69] Liu XF, Zhu YF, Li LQ. Int J Hydrogen Energy 2007;32:2450–4.
[70] Ikeda Y, Ohmori T. Int. J. Hydrogen Energy 2009;34 : 5439–5443.
[71] Kumar LH, Viswanathan B, Murthy SS. J. Alloys Compd 2008;461: 72–76.
[72] Wagemans RWP, van Lenthe JH, de Jongh PE, van Dillen AJ, de Jong KP. J Am Chem Soc
2005; 127:16675–80.
[73] Jasen P V, Gonzalez EA, Brizuela G, Nagel O A, González GA, Juan A. Int J Hydrogen
Energy 2007;32 :4943 –8.
[74] van Setten M J, de Wijs GA, Brocks G. Phys. Rev. B 76 (2007) 075125.
[75] Huang LW, Elkedim O, Hamzaoui R. J Alloys Compd 2011;509S :S328–33.

65
ANNEXE 2
Huang LW, Elkedim O, Moutarlier V. Synthesis and characterization of
nanocrystalline Mg2Ni prepared by mechanical alloying: Effects of
substitution of Mn for Ni. Journal of Alloys and Compounds 2010 ; 504 :
S311–4.

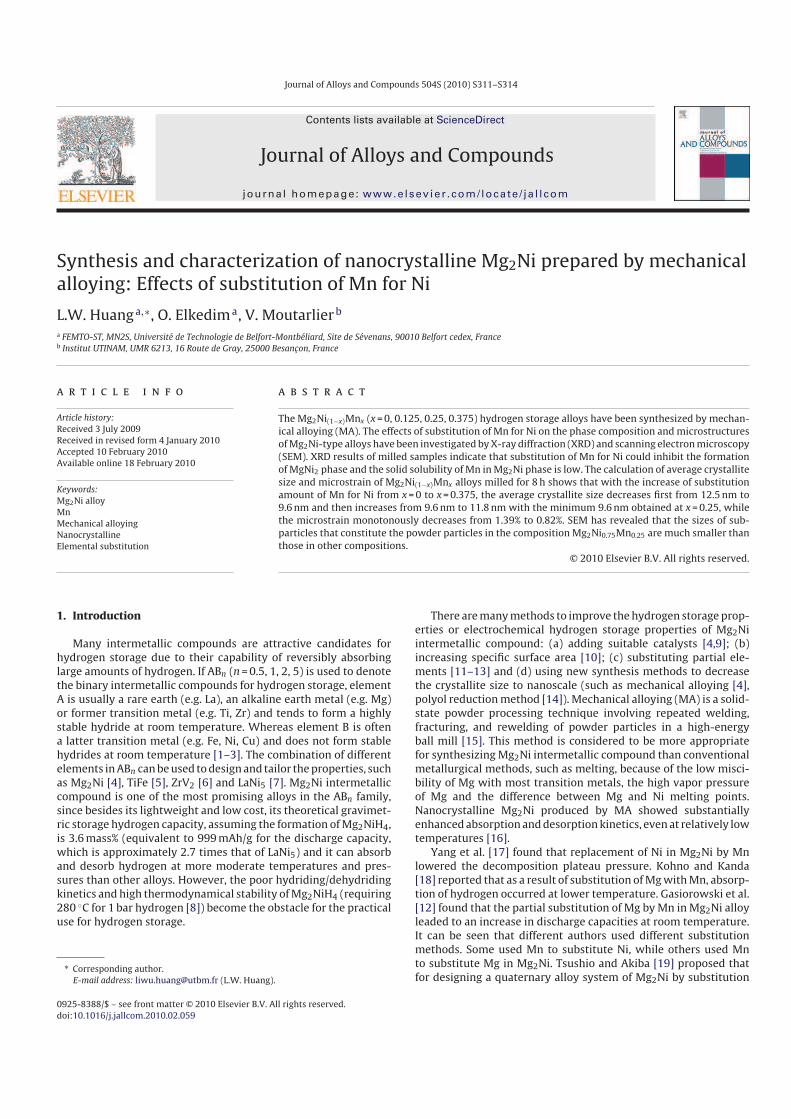
Journal of Alloys and Compounds 504S (2010) S311–S314
Contents lists available at ScienceDirect
Journal of Alloys and Compounds
journa l homepage: www.e lsev ier .com/ locate / ja l l com
Synthesis and characterization of nanocrystalline Mg2Ni prepared by mechanicalalloying: Effects of substitution of Mn for Ni
L.W. Huang a,∗, O. Elkedim a, V. Moutarlierb
a FEMTO-ST, MN2S, Université de Technologie de Belfort-Montbéliard, Site de Sévenans, 90010 Belfort cedex, Franceb Institut UTINAM, UMR 6213, 16 Route de Gray, 25000 Besancon, France
a r t i c l e i n f o
Article history:
Received 3 July 2009
Received in revised form 4 January 2010
Accepted 10 February 2010
Available online 18 February 2010
Keywords:
Mg2Ni alloy
Mn
Mechanical alloying
Nanocrystalline
Elemental substitution
a b s t r a c t
The Mg2Ni(1−x)Mnx (x = 0, 0.125, 0.25, 0.375) hydrogen storage alloys have been synthesized by mechan-
ical alloying (MA). The effects of substitution of Mn for Ni on the phase composition and microstructures
of Mg2Ni-type alloys have been investigated by X-ray diffraction (XRD) and scanning electron microscopy
(SEM). XRD results of milled samples indicate that substitution of Mn for Ni could inhibit the formation
of MgNi2 phase and the solid solubility of Mn in Mg2Ni phase is low. The calculation of average crystallite
size and microstrain of Mg2Ni(1−x)Mnx alloys milled for 8 h shows that with the increase of substitution
amount of Mn for Ni from x = 0 to x = 0.375, the average crystallite size decreases first from 12.5 nm to
9.6 nm and then increases from 9.6 nm to 11.8 nm with the minimum 9.6 nm obtained at x = 0.25, while
the microstrain monotonously decreases from 1.39% to 0.82%. SEM has revealed that the sizes of sub-
particles that constitute the powder particles in the composition Mg2Ni0.75Mn0.25 are much smaller than
those in other compositions.
© 2010 Elsevier B.V. All rights reserved.
1. Introduction
Many intermetallic compounds are attractive candidates for
hydrogen storage due to their capability of reversibly absorbing
large amounts of hydrogen. If ABn (n = 0.5, 1, 2, 5) is used to denote
the binary intermetallic compounds for hydrogen storage, element
A is usually a rare earth (e.g. La), an alkaline earth metal (e.g. Mg)
or former transition metal (e.g. Ti, Zr) and tends to form a highly
stable hydride at room temperature. Whereas element B is often
a latter transition metal (e.g. Fe, Ni, Cu) and does not form stable
hydrides at room temperature [1–3]. The combination of different
elements in ABn can be used to design and tailor the properties, such
as Mg2Ni [4], TiFe [5], ZrV2 [6] and LaNi5 [7]. Mg2Ni intermetallic
compound is one of the most promising alloys in the ABn family,
since besides its lightweight and low cost, its theoretical gravimet-
ric storage hydrogen capacity, assuming the formation of Mg2NiH4,
is 3.6 mass% (equivalent to 999 mAh/g for the discharge capacity,
which is approximately 2.7 times that of LaNi5) and it can absorb
and desorb hydrogen at more moderate temperatures and pres-
sures than other alloys. However, the poor hydriding/dehydriding
kinetics and high thermodynamical stability of Mg2NiH4 (requiring
280 ◦C for 1 bar hydrogen [8]) become the obstacle for the practical
use for hydrogen storage.
∗ Corresponding author.
E-mail address: [email protected] (L.W. Huang).
There are many methods to improve the hydrogen storage prop-
erties or electrochemical hydrogen storage properties of Mg2Ni
intermetallic compound: (a) adding suitable catalysts [4,9]; (b)
increasing specific surface area [10]; (c) substituting partial ele-
ments [11–13] and (d) using new synthesis methods to decrease
the crystallite size to nanoscale (such as mechanical alloying [4],
polyol reduction method [14]). Mechanical alloying (MA) is a solid-
state powder processing technique involving repeated welding,
fracturing, and rewelding of powder particles in a high-energy
ball mill [15]. This method is considered to be more appropriate
for synthesizing Mg2Ni intermetallic compound than conventional
metallurgical methods, such as melting, because of the low misci-
bility of Mg with most transition metals, the high vapor pressure
of Mg and the difference between Mg and Ni melting points.
Nanocrystalline Mg2Ni produced by MA showed substantially
enhanced absorption and desorption kinetics, even at relatively low
temperatures [16].
Yang et al. [17] found that replacement of Ni in Mg2Ni by Mn
lowered the decomposition plateau pressure. Kohno and Kanda
[18] reported that as a result of substitution of Mg with Mn, absorp-
tion of hydrogen occurred at lower temperature. Gasiorowski et al.
[12] found that the partial substitution of Mg by Mn in Mg2Ni alloy
leaded to an increase in discharge capacities at room temperature.
It can be seen that different authors used different substitution
methods. Some used Mn to substitute Ni, while others used Mn
to substitute Mg in Mg2Ni. Tsushio and Akiba [19] proposed that
for designing a quaternary alloy system of Mg2Ni by substitution
0925-8388/$ – see front matter © 2010 Elsevier B.V. All rights reserved.
doi:10.1016/j.jallcom.2010.02.059
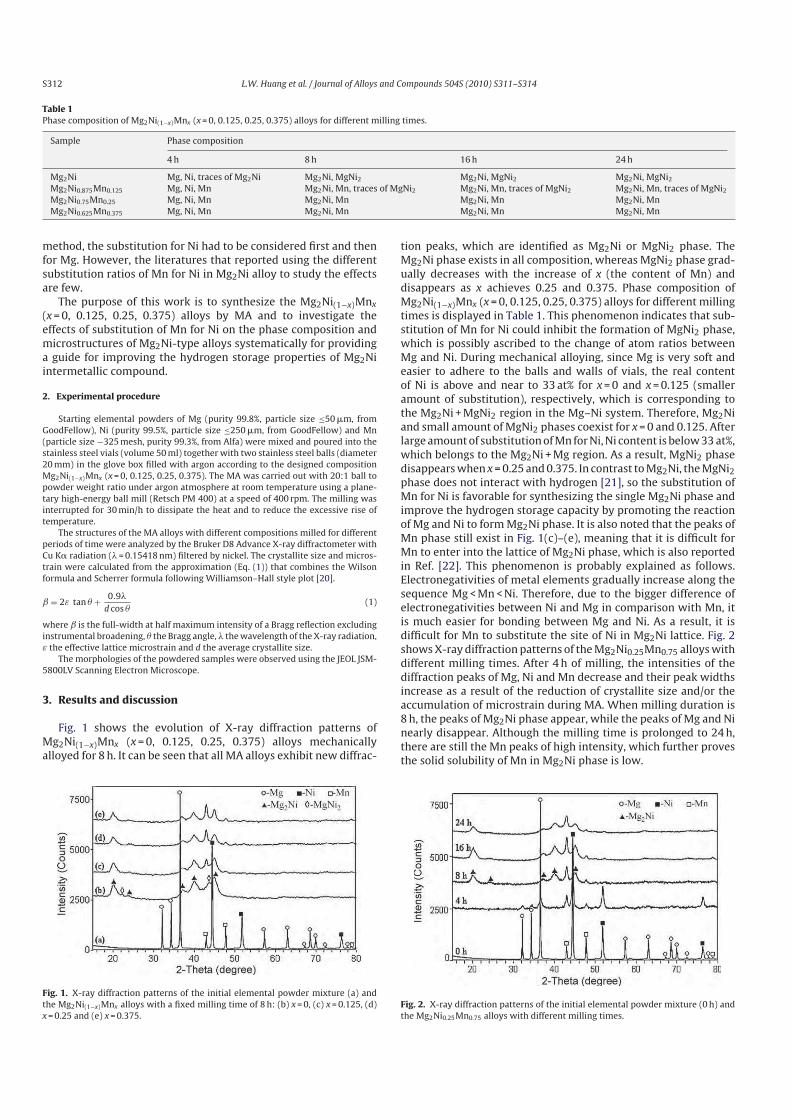
S312 L.W. Huang et al. / Journal of Alloys and Compounds 504S (2010) S311–S314
Table 1
Phase composition of Mg2Ni(1−x)Mnx (x = 0, 0.125, 0.25, 0.375) alloys for different milling times.
Sample Phase composition
4 h 8 h 16 h 24 h
Mg2Ni Mg, Ni, traces of Mg2Ni Mg2Ni, MgNi2 Mg2Ni, MgNi2 Mg2Ni, MgNi2Mg2Ni0.875Mn0.125 Mg, Ni, Mn Mg2Ni, Mn, traces of MgNi2 Mg2Ni, Mn, traces of MgNi2 Mg2Ni, Mn, traces of MgNi2Mg2Ni0.75Mn0.25 Mg, Ni, Mn Mg2Ni, Mn Mg2Ni, Mn Mg2Ni, Mn
Mg2Ni0.625Mn0.375 Mg, Ni, Mn Mg2Ni, Mn Mg2Ni, Mn Mg2Ni, Mn
method, the substitution for Ni had to be considered first and then
for Mg. However, the literatures that reported using the different
substitution ratios of Mn for Ni in Mg2Ni alloy to study the effects
are few.
The purpose of this work is to synthesize the Mg2Ni(1−x)Mnx
(x = 0, 0.125, 0.25, 0.375) alloys by MA and to investigate the
effects of substitution of Mn for Ni on the phase composition and
microstructures of Mg2Ni-type alloys systematically for providing
a guide for improving the hydrogen storage properties of Mg2Ni
intermetallic compound.
2. Experimental procedure
Starting elemental powders of Mg (purity 99.8%, particle size ≤50 mm, from
GoodFellow), Ni (purity 99.5%, particle size ≤250 mm, from GoodFellow) and Mn
(particle size −325 mesh, purity 99.3%, from Alfa) were mixed and poured into the
stainless steel vials (volume 50 ml) together with two stainless steel balls (diameter
20 mm) in the glove box filled with argon according to the designed composition
Mg2Ni(1−x)Mnx (x = 0, 0.125, 0.25, 0.375). The MA was carried out with 20:1 ball to
powder weight ratio under argon atmosphere at room temperature using a plane-
tary high-energy ball mill (Retsch PM 400) at a speed of 400 rpm. The milling was
interrupted for 30 min/h to dissipate the heat and to reduce the excessive rise of
temperature.
The structures of the MA alloys with different compositions milled for different
periods of time were analyzed by the Bruker D8 Advance X-ray diffractometer with
Cu Ka radiation (� = 0.15418 nm) filtered by nickel. The crystallite size and micros-
train were calculated from the approximation (Eq. (1)) that combines the Wilson
formula and Scherrer formula following Williamson–Hall style plot [20].
ˇ = 2ε tan � +0.9�
d cos �(1)
where ˇ is the full-width at half maximum intensity of a Bragg reflection excluding
instrumental broadening, � the Bragg angle, � the wavelength of the X-ray radiation,
ε the effective lattice microstrain and d the average crystallite size.
The morphologies of the powdered samples were observed using the JEOL JSM-
5800LV Scanning Electron Microscope.
3. Results and discussion
Fig. 1 shows the evolution of X-ray diffraction patterns of
Mg2Ni(1−x)Mnx (x = 0, 0.125, 0.25, 0.375) alloys mechanically
alloyed for 8 h. It can be seen that all MA alloys exhibit new diffrac-
Fig. 1. X-ray diffraction patterns of the initial elemental powder mixture (a) and
the Mg2Ni(1−x)Mnx alloys with a fixed milling time of 8 h: (b) x = 0, (c) x = 0.125, (d)
x = 0.25 and (e) x = 0.375.
tion peaks, which are identified as Mg2Ni or MgNi2 phase. The
Mg2Ni phase exists in all composition, whereas MgNi2 phase grad-
ually decreases with the increase of x (the content of Mn) and
disappears as x achieves 0.25 and 0.375. Phase composition of
Mg2Ni(1−x)Mnx (x = 0, 0.125, 0.25, 0.375) alloys for different milling
times is displayed in Table 1. This phenomenon indicates that sub-
stitution of Mn for Ni could inhibit the formation of MgNi2 phase,
which is possibly ascribed to the change of atom ratios between
Mg and Ni. During mechanical alloying, since Mg is very soft and
easier to adhere to the balls and walls of vials, the real content
of Ni is above and near to 33 at% for x = 0 and x = 0.125 (smaller
amount of substitution), respectively, which is corresponding to
the Mg2Ni + MgNi2 region in the Mg–Ni system. Therefore, Mg2Ni
and small amount of MgNi2 phases coexist for x = 0 and 0.125. After
large amount of substitution of Mn for Ni, Ni content is below 33 at%,
which belongs to the Mg2Ni + Mg region. As a result, MgNi2 phase
disappears when x = 0.25 and 0.375. In contrast to Mg2Ni, the MgNi2phase does not interact with hydrogen [21], so the substitution of
Mn for Ni is favorable for synthesizing the single Mg2Ni phase and
improve the hydrogen storage capacity by promoting the reaction
of Mg and Ni to form Mg2Ni phase. It is also noted that the peaks of
Mn phase still exist in Fig. 1(c)–(e), meaning that it is difficult for
Mn to enter into the lattice of Mg2Ni phase, which is also reported
in Ref. [22]. This phenomenon is probably explained as follows.
Electronegativities of metal elements gradually increase along the
sequence Mg < Mn < Ni. Therefore, due to the bigger difference of
electronegativities between Ni and Mg in comparison with Mn, it
is much easier for bonding between Mg and Ni. As a result, it is
difficult for Mn to substitute the site of Ni in Mg2Ni lattice. Fig. 2
shows X-ray diffraction patterns of the Mg2Ni0.25Mn0.75 alloys with
different milling times. After 4 h of milling, the intensities of the
diffraction peaks of Mg, Ni and Mn decrease and their peak widths
increase as a result of the reduction of crystallite size and/or the
accumulation of microstrain during MA. When milling duration is
8 h, the peaks of Mg2Ni phase appear, while the peaks of Mg and Ni
nearly disappear. Although the milling time is prolonged to 24 h,
there are still the Mn peaks of high intensity, which further proves
the solid solubility of Mn in Mg2Ni phase is low.
Fig. 2. X-ray diffraction patterns of the initial elemental powder mixture (0 h) and
the Mg2Ni0.25Mn0.75 alloys with different milling times.
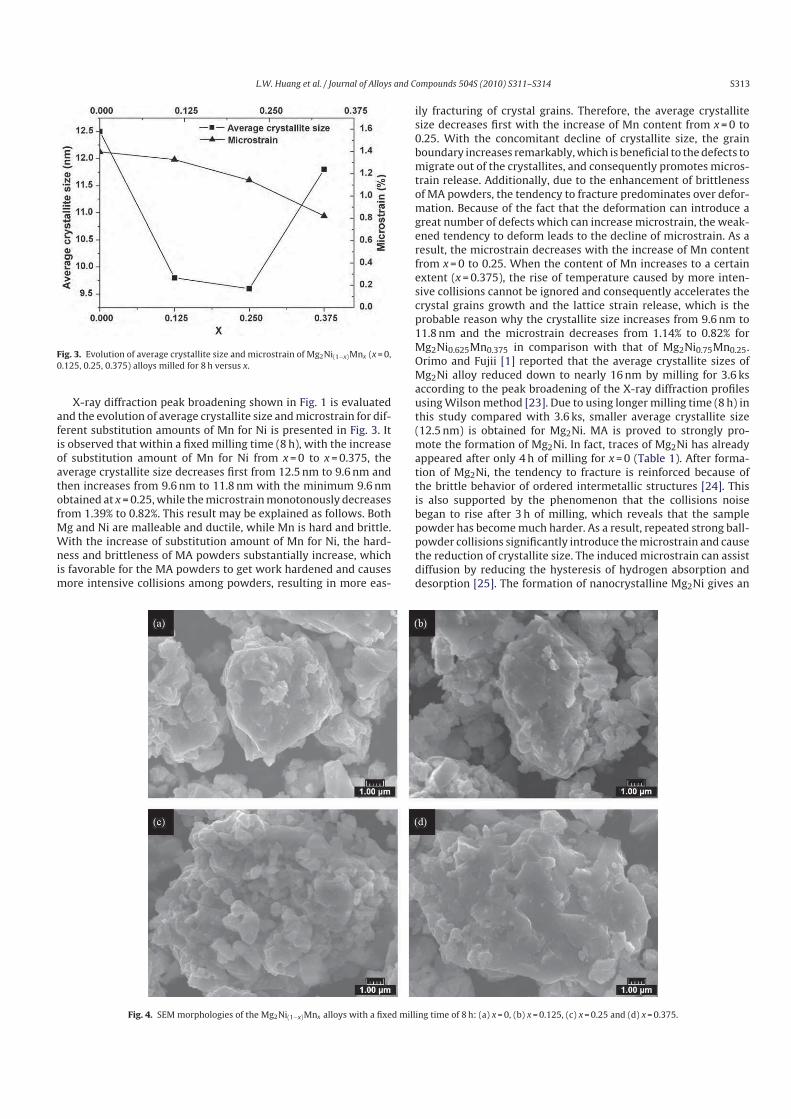
L.W. Huang et al. / Journal of Alloys and Compounds 504S (2010) S311–S314 S313
Fig. 3. Evolution of average crystallite size and microstrain of Mg2Ni(1−x)Mnx (x = 0,
0.125, 0.25, 0.375) alloys milled for 8 h versus x.
X-ray diffraction peak broadening shown in Fig. 1 is evaluated
and the evolution of average crystallite size and microstrain for dif-
ferent substitution amounts of Mn for Ni is presented in Fig. 3. It
is observed that within a fixed milling time (8 h), with the increase
of substitution amount of Mn for Ni from x = 0 to x = 0.375, the
average crystallite size decreases first from 12.5 nm to 9.6 nm and
then increases from 9.6 nm to 11.8 nm with the minimum 9.6 nm
obtained at x = 0.25, while the microstrain monotonously decreases
from 1.39% to 0.82%. This result may be explained as follows. Both
Mg and Ni are malleable and ductile, while Mn is hard and brittle.
With the increase of substitution amount of Mn for Ni, the hard-
ness and brittleness of MA powders substantially increase, which
is favorable for the MA powders to get work hardened and causes
more intensive collisions among powders, resulting in more eas-
ily fracturing of crystal grains. Therefore, the average crystallite
size decreases first with the increase of Mn content from x = 0 to
0.25. With the concomitant decline of crystallite size, the grain
boundary increases remarkably, which is beneficial to the defects to
migrate out of the crystallites, and consequently promotes micros-
train release. Additionally, due to the enhancement of brittleness
of MA powders, the tendency to fracture predominates over defor-
mation. Because of the fact that the deformation can introduce a
great number of defects which can increase microstrain, the weak-
ened tendency to deform leads to the decline of microstrain. As a
result, the microstrain decreases with the increase of Mn content
from x = 0 to 0.25. When the content of Mn increases to a certain
extent (x = 0.375), the rise of temperature caused by more inten-
sive collisions cannot be ignored and consequently accelerates the
crystal grains growth and the lattice strain release, which is the
probable reason why the crystallite size increases from 9.6 nm to
11.8 nm and the microstrain decreases from 1.14% to 0.82% for
Mg2Ni0.625Mn0.375 in comparison with that of Mg2Ni0.75Mn0.25.
Orimo and Fujii [1] reported that the average crystallite sizes of
Mg2Ni alloy reduced down to nearly 16 nm by milling for 3.6 ks
according to the peak broadening of the X-ray diffraction profiles
using Wilson method [23]. Due to using longer milling time (8 h) in
this study compared with 3.6 ks, smaller average crystallite size
(12.5 nm) is obtained for Mg2Ni. MA is proved to strongly pro-
mote the formation of Mg2Ni. In fact, traces of Mg2Ni has already
appeared after only 4 h of milling for x = 0 (Table 1). After forma-
tion of Mg2Ni, the tendency to fracture is reinforced because of
the brittle behavior of ordered intermetallic structures [24]. This
is also supported by the phenomenon that the collisions noise
began to rise after 3 h of milling, which reveals that the sample
powder has become much harder. As a result, repeated strong ball-
powder collisions significantly introduce the microstrain and cause
the reduction of crystallite size. The induced microstrain can assist
diffusion by reducing the hysteresis of hydrogen absorption and
desorption [25]. The formation of nanocrystalline Mg2Ni gives an
Fig. 4. SEM morphologies of the Mg2Ni(1−x)Mnx alloys with a fixed milling time of 8 h: (a) x = 0, (b) x = 0.125, (c) x = 0.25 and (d) x = 0.375.
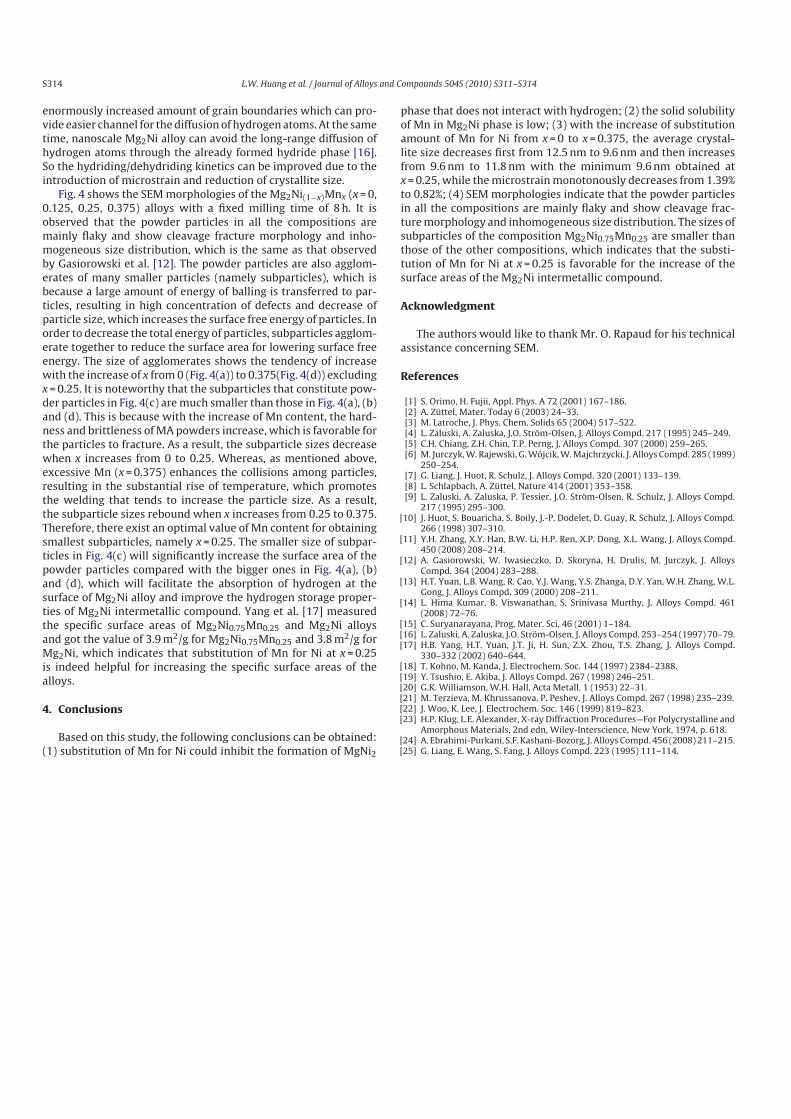
S314 L.W. Huang et al. / Journal of Alloys and Compounds 504S (2010) S311–S314
enormously increased amount of grain boundaries which can pro-
vide easier channel for the diffusion of hydrogen atoms. At the same
time, nanoscale Mg2Ni alloy can avoid the long-range diffusion of
hydrogen atoms through the already formed hydride phase [16].
So the hydriding/dehydriding kinetics can be improved due to the
introduction of microstrain and reduction of crystallite size.
Fig. 4 shows the SEM morphologies of the Mg2Ni(1−x)Mnx (x = 0,
0.125, 0.25, 0.375) alloys with a fixed milling time of 8 h. It is
observed that the powder particles in all the compositions are
mainly flaky and show cleavage fracture morphology and inho-
mogeneous size distribution, which is the same as that observed
by Gasiorowski et al. [12]. The powder particles are also agglom-
erates of many smaller particles (namely subparticles), which is
because a large amount of energy of balling is transferred to par-
ticles, resulting in high concentration of defects and decrease of
particle size, which increases the surface free energy of particles. In
order to decrease the total energy of particles, subparticles agglom-
erate together to reduce the surface area for lowering surface free
energy. The size of agglomerates shows the tendency of increase
with the increase of x from 0 (Fig. 4(a)) to 0.375(Fig. 4(d)) excluding
x = 0.25. It is noteworthy that the subparticles that constitute pow-
der particles in Fig. 4(c) are much smaller than those in Fig. 4(a), (b)
and (d). This is because with the increase of Mn content, the hard-
ness and brittleness of MA powders increase, which is favorable for
the particles to fracture. As a result, the subparticle sizes decrease
when x increases from 0 to 0.25. Whereas, as mentioned above,
excessive Mn (x = 0.375) enhances the collisions among particles,
resulting in the substantial rise of temperature, which promotes
the welding that tends to increase the particle size. As a result,
the subparticle sizes rebound when x increases from 0.25 to 0.375.
Therefore, there exist an optimal value of Mn content for obtaining
smallest subparticles, namely x = 0.25. The smaller size of subpar-
ticles in Fig. 4(c) will significantly increase the surface area of the
powder particles compared with the bigger ones in Fig. 4(a), (b)
and (d), which will facilitate the absorption of hydrogen at the
surface of Mg2Ni alloy and improve the hydrogen storage proper-
ties of Mg2Ni intermetallic compound. Yang et al. [17] measured
the specific surface areas of Mg2Ni0.75Mn0.25 and Mg2Ni alloys
and got the value of 3.9 m2/g for Mg2Ni0.75Mn0.25 and 3.8 m2/g for
Mg2Ni, which indicates that substitution of Mn for Ni at x = 0.25
is indeed helpful for increasing the specific surface areas of the
alloys.
4. Conclusions
Based on this study, the following conclusions can be obtained:
(1) substitution of Mn for Ni could inhibit the formation of MgNi2
phase that does not interact with hydrogen; (2) the solid solubility
of Mn in Mg2Ni phase is low; (3) with the increase of substitution
amount of Mn for Ni from x = 0 to x = 0.375, the average crystal-
lite size decreases first from 12.5 nm to 9.6 nm and then increases
from 9.6 nm to 11.8 nm with the minimum 9.6 nm obtained at
x = 0.25, while the microstrain monotonously decreases from 1.39%
to 0.82%; (4) SEM morphologies indicate that the powder particles
in all the compositions are mainly flaky and show cleavage frac-
ture morphology and inhomogeneous size distribution. The sizes of
subparticles of the composition Mg2Ni0.75Mn0.25 are smaller than
those of the other compositions, which indicates that the substi-
tution of Mn for Ni at x = 0.25 is favorable for the increase of the
surface areas of the Mg2Ni intermetallic compound.
Acknowledgment
The authors would like to thank Mr. O. Rapaud for his technical
assistance concerning SEM.
References
[1] S. Orimo, H. Fujii, Appl. Phys. A 72 (2001) 167–186.[2] A. Züttel, Mater. Today 6 (2003) 24–33.[3] M. Latroche, J. Phys. Chem. Solids 65 (2004) 517–522.[4] L. Zaluski, A. Zaluska, J.O. Ström-Olsen, J. Alloys Compd. 217 (1995) 245–249.[5] C.H. Chiang, Z.H. Chin, T.P. Perng, J. Alloys Compd. 307 (2000) 259–265.[6] M. Jurczyk, W. Rajewski, G. Wójcik, W. Majchrzycki, J. Alloys Compd. 285 (1999)
250–254.[7] G. Liang, J. Huot, R. Schulz, J. Alloys Compd. 320 (2001) 133–139.[8] L. Schlapbach, A. Züttel, Nature 414 (2001) 353–358.[9] L. Zaluski, A. Zaluska, P. Tessier, J.O. Ström-Olsen, R. Schulz, J. Alloys Compd.
217 (1995) 295–300.[10] J. Huot, S. Bouaricha, S. Boily, J.-P. Dodelet, D. Guay, R. Schulz, J. Alloys Compd.
266 (1998) 307–310.[11] Y.H. Zhang, X.Y. Han, B.W. Li, H.P. Ren, X.P. Dong, X.L. Wang, J. Alloys Compd.
450 (2008) 208–214.[12] A. Gasiorowski, W. Iwasieczko, D. Skoryna, H. Drulis, M. Jurczyk, J. Alloys
Compd. 364 (2004) 283–288.[13] H.T. Yuan, L.B. Wang, R. Cao, Y.J. Wang, Y.S. Zhanga, D.Y. Yan, W.H. Zhang, W.L.
Gong, J. Alloys Compd. 309 (2000) 208–211.[14] L. Hima Kumar, B. Viswanathan, S. Srinivasa Murthy, J. Alloys Compd. 461
(2008) 72–76.[15] C. Suryanarayana, Prog. Mater. Sci. 46 (2001) 1–184.[16] L. Zaluski, A. Zaluska, J.O. Ström-Olsen, J. Alloys Compd. 253–254 (1997) 70–79.[17] H.B. Yang, H.T. Yuan, J.T. Ji, H. Sun, Z.X. Zhou, T.S. Zhang, J. Alloys Compd.
330–332 (2002) 640–644.[18] T. Kohno, M. Kanda, J. Electrochem. Soc. 144 (1997) 2384–2388.[19] Y. Tsushio, E. Akiba, J. Alloys Compd. 267 (1998) 246–251.[20] G.K. Williamson, W.H. Hall, Acta Metall. 1 (1953) 22–31.[21] M. Terzieva, M. Khrussanova, P. Peshev, J. Alloys Compd. 267 (1998) 235–239.[22] J. Woo, K. Lee, J. Electrochem. Soc. 146 (1999) 819–823.[23] H.P. Klug, L.E. Alexander, X-ray Diffraction Procedures—For Polycrystalline and
Amorphous Materials, 2nd edn, Wiley-Interscience, New York, 1974, p. 618.[24] A. Ebrahimi-Purkani, S.F. Kashani-Bozorg, J. Alloys Compd. 456 (2008) 211–215.[25] G. Liang, E. Wang, S. Fang, J. Alloys Compd. 223 (1995) 111–114.
66
ANNEXE 3
Huang LW, Elkedim O, Jarzebski M, Hamzaoui R, Jurczyk M. Structural
characterization and electrochemical hydrogen storage properties of
Mg2Ni1−xMnx (x = 0, 0.125, 0.25, 0.375) alloys prepared by mechanical
alloying. International Journal of Hydrogen Energy 2010 ; 35: 6794-803.

Structural characterization and electrochemical hydrogen
storage properties of Mg2Ni1LxMnx(x [ 0, 0.125, 0.25, 0.375)
alloys prepared by mechanical alloying
L.W. Huang a, O. Elkedim a,*, M. Jarzebski b, R. Hamzaoui a, M. Jurczyk b
aFEMTO-ST, MN2S, Universite de Technologie de Belfort-Montbeliard, Site de Sevenans, 90010 Belfort cedex, Franceb Institute of Materials Science and Engineering, Poznan University of Technology, M. Sklodowska-Curie 5 Sq., 60-965 Poznan, Poland
a r t i c l e i n f o
Article history:
Received 10 February 2010
Received in revised form
2 April 2010
Accepted 2 April 2010
Available online 8 May 2010
Keywords:
Mg2Ni-type alloy
Mechanical alloying
Mn substitution
Electrochemical characteristics
Mg3MnNi2 alloy
a b s t r a c t
Mg2Ni1!xMnx(x ¼ 0, 0.125, 0.25, 0.375) electrode alloys are prepared by mechanical
alloying (MA) under argon atmosphere at room temperature using a planetary high-
energy ball mill. The microstructures are characterized by XRD and SEM. XRD analysis
results indicate that the substitution of Mn for Ni could inhibit the formation of MgNi2phase with the increases of x from 0 to 0.375. Replacing Ni with Mn can also promote the
formation of the amorphous phase when x increases from 0 to 0.25 for the MA alloys
milled for 48 h. The new phase Mg3MnNi2 is formed only when x ¼ 0.375 after 48 h of
milling. This new phase belongs to the face-centered cubic lattice (Fd-3m) with the lattice
constant a being 1.1484 nm. Estimated from the peaks broadening, the crystallite size and
lattice strain of Mg3MnNi2 phase are 15.6 # 3.6 nm and 1.09 # 0.34%, respectively. Curve
fit of XRD shows that amorphous and nanocrystalline Mg2Ni coexist in the Mg2Ni1!xMnx
(x ¼ 0, 0.125, 0.25) alloys milled for 48 h. The SEM observation reveals that all the MA
alloys particles are mainly flaky and show cleavage fracture morphology and these
particles are agglomerates of many smaller particles, namely subparticles. Electro-
chemical measurements indicate that all MA alloys have excellent activation properties.
The discharge capacities of MA alloys increase with the prolongation of milling time. For
16 h of milling, with the increase of Mn content, the discharge capacities of Mg2Ni1!xMnx
(x ¼ 0, 0.125, 0.25, 0.375) MA alloys monotonously decrease. For 24 h of milling, the
discharge capacities of the Mg2Ni1!xMnx (x ¼ 0, 0.125, 0.25, 0.375) alloys also show a rough
tendency to decrease with the increase of Mn content except Mg2Ni0.875Mn0.125 MA alloy.
On the other hand, for 48 h of milling, as the rise of Mn content from x ¼ 0.125 to 0.375,
the discharge capacities increase. Mg(OH)2 is formed during charge/discharge cycles in
the KOH solution for all MA alloys. After 48 h of milling, the substitution of Mn for Ni for
x ¼ 0.25 improves the cycle stability at the expense of decreasing the discharge capacity.
In contrast, Mg3MnNi2 phase is relatively stable during charge/discharge cycles and
therefore can significantly enhance the cycle stability under simultaneously maintaining
a high discharge capacity.
ª 2010 Professor T. Nejat Veziroglu. Published by Elsevier Ltd. All rights reserved.
* Corresponding author. Tel.: þ33 3 84583037; fax: þ33 3 84583000.E-mail address: [email protected] (O. Elkedim).
Avai lab le at www.sc iencedi rect .com
journa l homepage : www.e lsev ie r . com/ loca te /he
i n t e rn a t i o n a l j o u r n a l o f h y d r o g e n en e r g y 3 5 ( 2 0 1 0 ) 6 7 9 4e6 8 0 3
0360-3199/$ e see front matter ª 2010 Professor T. Nejat Veziroglu. Published by Elsevier Ltd. All rights reserved.doi:10.1016/j.ijhydene.2010.04.023
1. Introduction
Mg-based (Mg2Ni-type) hydrogen storage alloys are consid-
ered to be promising negative electrode materials for nickel-
metal hydride (Ni-MH) batteries because of their low cost, light
weight, rich mineral resources and high theoretical discharge
capacity [1,2]. However, the poor hydriding/dehydriding
kinetics and low electrochemical discharge capacity at room
temperature [3], as well as severe oxidation in alkaline solu-
tion of Mg2Ni-type electrode become the obstacle for the
practical use in Ni-MH batteries. Mechanical alloying (MA) is
a solid-state powder processing technique involving repeated
welding, fracturing, and rewelding of powder particles in
a high-energy ball mill [4]. This technique is capable of
decreasing crystal size, introducing numbers of grain bound-
aries and defects, as well as facilitating the formation of
nanostructured and amorphous phase. Therefore, MA has
been widely used to prepare Mg2Ni-type alloy possessing
favourable electrochemical properties [5e7]. Partial elements
substitution has been proved to be appropriate for improving
electrochemical properties of Mg2Ni-type alloy [8e10]. Theo-
retical calculation has indicated that partial substitution of
alloying element M for Ni in Mg2Ni canmodify the enthalpy of
formation for hydride, resulting in altering the phase stability
[11]. The substitution of Mn for Ni or Mg in Mg2Ni-type alloys
has been reported in many literatures. Woo et al. [6] per-
formed the substitution of Mn for Ni in Mg2Ni alloy to improve
the electrochemical properties. Yang et al. [12] found that
replacement of Ni in Mg2Ni by Mn lowered the decomposition
plateau pressure. Jurczyk et al. [13] obtained an enhanced
discharge capacity by substituting Mg with Mn in Mg2Ni alloy.
Kohno et al. [14] reported that as a result of substitution of Mg
with Mn, absorption of hydrogen occurred at lower tempera-
ture. Gasiorowski et al. [15] found that the partial substitution
of Mg by Mn in Mg2Ni alloy leaded to an increase in discharge
capacity at room temperature. It can be seen that different
authors used different substitution method. Some used Mn to
substitute Ni, while others used Mn to substitute Mg in Mg2Ni.
Tsushio et al. [16] proposed that for designing a quaternary
alloy system of Mg2Ni by substitution method, the substitu-
tion for Ni had to be considered first and then for Mg.
However, none of these literatures have reported the forma-
tion of the new Mg3MnNi2 phase.
Three preparingmethods have been reported to synthesize
the Mg3MnNi2 alloy. Denys et al. [17] synthesized Mg3MnNi2intermetallic compound by high-energy ball milling in argon
atmosphere with subsequent pressing and sintering. They
found that the synthesized Mg3MnNi2 phase exhibited an
ideal electrochemical discharge curve and good cyclic stability
in comparison with other magnesium alloys. Dobrovolsky
et al. [18] obtainedMg3MnNi2 usingmilling amixture of Mg, Ni
and Mn powders in hydrogen atmosphere followed by
thermal decomposition of the MA product. Hsu et al. [2]
prepared Mg3MnNi2 alloy by the method integrating conven-
tional melting and isothermal evaporation casting process
(IECP).
In this work, the method integrating mechanical alloying
and partial elements substitution is carried out to produce
Mg2Ni-type alloy. The effects of the substitution of Mn for Ni
and milling time on microstructures and electrochemical
properties of Mg2Ni-type alloy are investigated. It is worthy
to note that the new Mg3MnNi2 phase has been synthesized
in this research by much simpler one-step technique which
is milling elemental powders of Mg, Ni and Mn in argon
atmosphere. Therefore, this one-step technique is different
from the three-step technique in Ref. [17], the milling in
hydrogen atmosphere followed by thermal decomposition in
Ref. [18] and the method integrating conventional melting
and IECP in Ref. [2]. To the best of our knowledge, this is the
first time that the one-step mechanical alloying in argon
atmosphere is reported to synthesize the new Mg3MnNi2phase. The influence of Mg3MnNi2 phase on electrochemical
properties of Mg2Ni-type alloy is also studied. Exploring new
Mg-based hydrogen storage alloy is significant for devel-
oping hydrogen storage technology. Mg3MnNi2 phase, as
a new hydrogen storage alloy, has been proved to possess
better electrochemical hydrogen storage properties. This
work may provide a guide for improving the electrochemical
characteristics of Mg2Ni-type alloy, especially the anti-
oxidation property, and developing new Mg-based electrode
materials.
2. Experimental procedure
Starting elemental powders of Mg (purity 99.8%, particle size
%50 mm, from GoodFellow), Ni (purity 99.5%, particle size
%250 mm, from GoodFellow) and Mn (purity 99.3%, particle
size e325 mesh, from Alfa) were mixed according to the
designed composition Mg2Ni1!xMnx (x ¼ 0, 0.125, 0.25, 0.375).
And then the mixtures were poured into the stainless steel
vials (volume 50 ml) together with two stainless steel balls
(diameter 20mm) in the glove box filledwith argon. The ball to
powder weight ratio is 20:1. The MA was carried out under
argon atmosphere at room temperature using a planetary
high-energy ball mill (Retsch PM 400) at a speed of 400rpm.
The milling was performed for 4 h, 8 h, 16 h, 24 h and 48 h
respectively. In order to avoid severe cold welding during
high-energy milling, for 16 h, 24 h and 48 h of the milling, the
ball milling was stopped every 8 h to crush the bulk materials
in vials as well as scrape the powder adhered to the balls and
the walls of vials in the glove box filled with argon. This also
ensured that all elemental powders were fully mixed and the
composition was uniform. The milling was interrupted for
30min per hour to dissipate the heat and to reduce the
excessive rise of temperature.
The structures of the MA alloys with different composi-
tions milled for different periods of time were analyzed by the
Bruker D8 Advance X-ray diffractometer with Cu Ka radiation
(l ¼ 0.15418 nm) filtered by nickel. The crystallite size and
lattice strain were calculated based on the approximation (Eq.
(1)) that combines the Wilson formula and Scherrer formula
following Williamson-Hall style plot [19].
b ¼ 23tanqþ0:9ldcosq
(1)
where b is the full-width at half maximum intensity of a Bragg
reflection excluding instrumental broadening, q the Bragg
i n t e r n a t i o n a l j o u r n a l o f h y d r o g e n en e r g y 3 5 ( 2 0 1 0 ) 6 7 9 4e6 8 0 3 6795
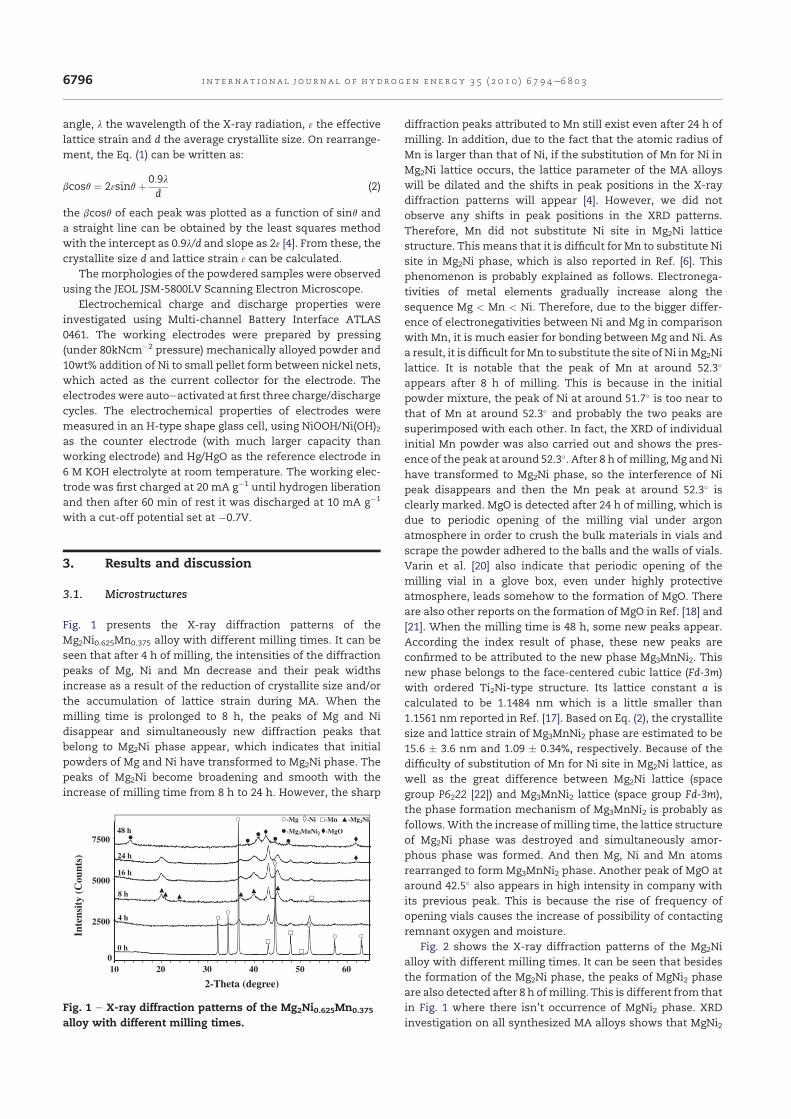
angle, l the wavelength of the X-ray radiation, 3 the effective
lattice strain and d the average crystallite size. On rearrange-
ment, the Eq. (1) can be written as:
bcosq ¼ 23sinqþ0:9ld
(2)
the bcosq of each peak was plotted as a function of sinq and
a straight line can be obtained by the least squares method
with the intercept as 0.9l/d and slope as 23 [4]. From these, the
crystallite size d and lattice strain 3 can be calculated.
Themorphologies of the powdered samples were observed
using the JEOL JSM-5800LV Scanning Electron Microscope.
Electrochemical charge and discharge properties were
investigated using Multi-channel Battery Interface ATLAS
0461. The working electrodes were prepared by pressing
(under 80kNcm!2 pressure) mechanically alloyed powder and
10wt% addition of Ni to small pellet form between nickel nets,
which acted as the current collector for the electrode. The
electrodes were autoeactivated at first three charge/discharge
cycles. The electrochemical properties of electrodes were
measured in an H-type shape glass cell, using NiOOH/Ni(OH)2as the counter electrode (with much larger capacity than
working electrode) and Hg/HgO as the reference electrode in
6 M KOH electrolyte at room temperature. The working elec-
trode was first charged at 20 mA g!1 until hydrogen liberation
and then after 60 min of rest it was discharged at 10 mA g!1
with a cut-off potential set at !0.7V.
3. Results and discussion
3.1. Microstructures
Fig. 1 presents the X-ray diffraction patterns of the
Mg2Ni0.625Mn0.375 alloy with different milling times. It can be
seen that after 4 h of milling, the intensities of the diffraction
peaks of Mg, Ni and Mn decrease and their peak widths
increase as a result of the reduction of crystallite size and/or
the accumulation of lattice strain during MA. When the
milling time is prolonged to 8 h, the peaks of Mg and Ni
disappear and simultaneously new diffraction peaks that
belong to Mg2Ni phase appear, which indicates that initial
powders of Mg and Ni have transformed to Mg2Ni phase. The
peaks of Mg2Ni become broadening and smooth with the
increase of milling time from 8 h to 24 h. However, the sharp
diffraction peaks attributed to Mn still exist even after 24 h of
milling. In addition, due to the fact that the atomic radius of
Mn is larger than that of Ni, if the substitution of Mn for Ni in
Mg2Ni lattice occurs, the lattice parameter of the MA alloys
will be dilated and the shifts in peak positions in the X-ray
diffraction patterns will appear [4]. However, we did not
observe any shifts in peak positions in the XRD patterns.
Therefore, Mn did not substitute Ni site in Mg2Ni lattice
structure. This means that it is difficult for Mn to substitute Ni
site in Mg2Ni phase, which is also reported in Ref. [6]. This
phenomenon is probably explained as follows. Electronega-
tivities of metal elements gradually increase along the
sequence Mg < Mn < Ni. Therefore, due to the bigger differ-
ence of electronegativities between Ni and Mg in comparison
with Mn, it is much easier for bonding between Mg and Ni. As
a result, it is difficult forMn to substitute the site of Ni inMg2Ni
lattice. It is notable that the peak of Mn at around 52.3&
appears after 8 h of milling. This is because in the initial
powder mixture, the peak of Ni at around 51.7& is too near to
that of Mn at around 52.3& and probably the two peaks are
superimposed with each other. In fact, the XRD of individual
initial Mn powder was also carried out and shows the pres-
ence of the peak at around 52.3&. After 8 h ofmilling, Mg andNi
have transformed to Mg2Ni phase, so the interference of Ni
peak disappears and then the Mn peak at around 52.3& is
clearly marked. MgO is detected after 24 h of milling, which is
due to periodic opening of the milling vial under argon
atmosphere in order to crush the bulk materials in vials and
scrape the powder adhered to the balls and the walls of vials.
Varin et al. [20] also indicate that periodic opening of the
milling vial in a glove box, even under highly protective
atmosphere, leads somehow to the formation of MgO. There
are also other reports on the formation of MgO in Ref. [18] and
[21]. When the milling time is 48 h, some new peaks appear.
According the index result of phase, these new peaks are
confirmed to be attributed to the new phase Mg3MnNi2. This
new phase belongs to the face-centered cubic lattice (Fd-3m)
with ordered Ti2Ni-type structure. Its lattice constant a is
calculated to be 1.1484 nm which is a little smaller than
1.1561 nm reported in Ref. [17]. Based on Eq. (2), the crystallite
size and lattice strain of Mg3MnNi2 phase are estimated to be
15.6 # 3.6 nm and 1.09 # 0.34%, respectively. Because of the
difficulty of substitution of Mn for Ni site in Mg2Ni lattice, as
well as the great difference between Mg2Ni lattice (space
group P6222 [22]) and Mg3MnNi2 lattice (space group Fd-3m),
the phase formation mechanism of Mg3MnNi2 is probably as
follows.With the increase ofmilling time, the lattice structure
of Mg2Ni phase was destroyed and simultaneously amor-
phous phase was formed. And then Mg, Ni and Mn atoms
rearranged to form Mg3MnNi2 phase. Another peak of MgO at
around 42.5& also appears in high intensity in company with
its previous peak. This is because the rise of frequency of
opening vials causes the increase of possibility of contacting
remnant oxygen and moisture.
Fig. 2 shows the X-ray diffraction patterns of the Mg2Ni
alloy with different milling times. It can be seen that besides
the formation of the Mg2Ni phase, the peaks of MgNi2 phase
are also detected after 8 h ofmilling. This is different from that
in Fig. 1 where there isn’t occurrence of MgNi2 phase. XRD
investigation on all synthesized MA alloys shows that MgNi2
10 20 30 40 50 60
2-Theta (degree)
0
2500
5000
7500
Inte
nsi
ty (
Co
un
ts)
-Mg -Ni -Mn -Mg Ni
-Mg MnNi -MgO
0 h
4 h
8 h
16 h
24 h
48 h
Fig. 1 e X-ray diffraction patterns of the Mg2Ni0.625Mn0.375
alloy with different milling times.
i n t e rn a t i o n a l j o u r n a l o f h y d r o g e n en e r g y 3 5 ( 2 0 1 0 ) 6 7 9 4e6 8 0 36796
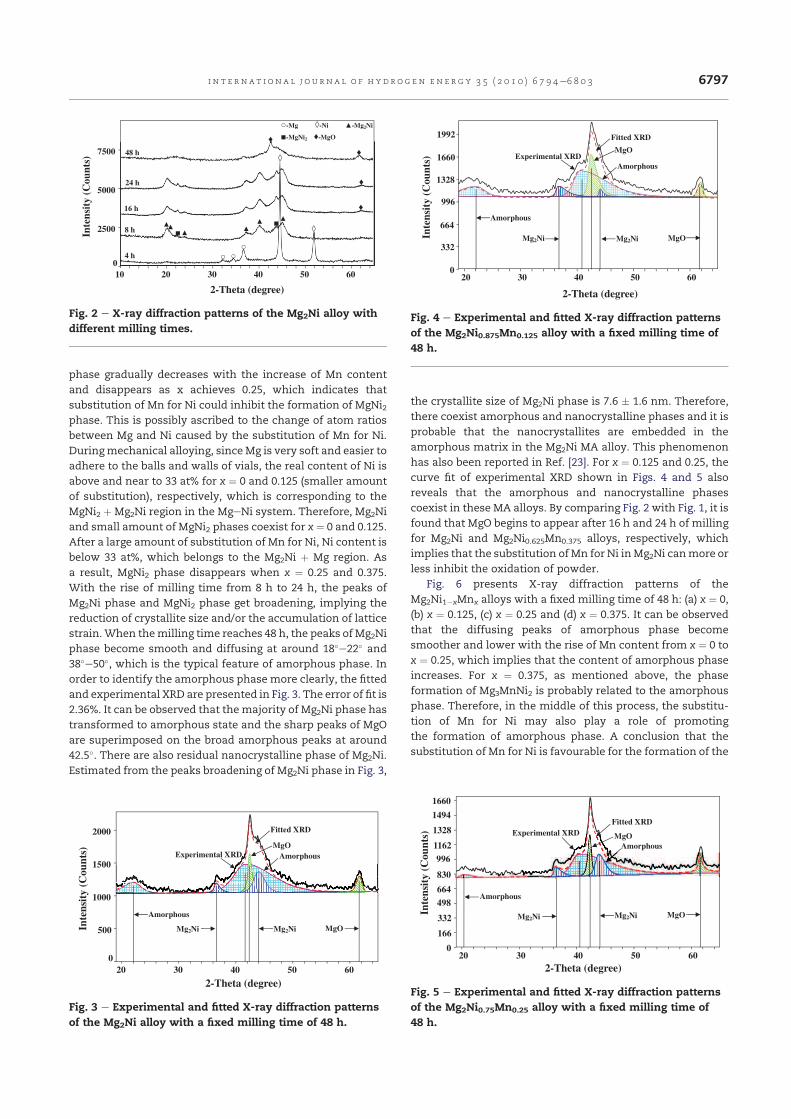
phase gradually decreases with the increase of Mn content
and disappears as x achieves 0.25, which indicates that
substitution of Mn for Ni could inhibit the formation of MgNi2phase. This is possibly ascribed to the change of atom ratios
between Mg and Ni caused by the substitution of Mn for Ni.
Duringmechanical alloying, since Mg is very soft and easier to
adhere to the balls and walls of vials, the real content of Ni is
above and near to 33 at% for x ¼ 0 and 0.125 (smaller amount
of substitution), respectively, which is corresponding to the
MgNi2 þ Mg2Ni region in the MgeNi system. Therefore, Mg2Ni
and small amount of MgNi2 phases coexist for x ¼ 0 and 0.125.
After a large amount of substitution of Mn for Ni, Ni content is
below 33 at%, which belongs to the Mg2Ni þ Mg region. As
a result, MgNi2 phase disappears when x ¼ 0.25 and 0.375.
With the rise of milling time from 8 h to 24 h, the peaks of
Mg2Ni phase and MgNi2 phase get broadening, implying the
reduction of crystallite size and/or the accumulation of lattice
strain.When themilling time reaches 48 h, the peaks of Mg2Ni
phase become smooth and diffusing at around 18&e22& and
38&e50&, which is the typical feature of amorphous phase. In
order to identify the amorphous phase more clearly, the fitted
and experimental XRD are presented in Fig. 3. The error of fit is
2.36%. It can be observed that themajority of Mg2Ni phase has
transformed to amorphous state and the sharp peaks of MgO
are superimposed on the broad amorphous peaks at around
42.5&. There are also residual nanocrystalline phase of Mg2Ni.
Estimated from the peaks broadening of Mg2Ni phase in Fig. 3,
the crystallite size of Mg2Ni phase is 7.6 # 1.6 nm. Therefore,
there coexist amorphous and nanocrystalline phases and it is
probable that the nanocrystallites are embedded in the
amorphous matrix in the Mg2Ni MA alloy. This phenomenon
has also been reported in Ref. [23]. For x ¼ 0.125 and 0.25, the
curve fit of experimental XRD shown in Figs. 4 and 5 also
reveals that the amorphous and nanocrystalline phases
coexist in these MA alloys. By comparing Fig. 2 with Fig. 1, it is
found that MgO begins to appear after 16 h and 24 h of milling
for Mg2Ni and Mg2Ni0.625Mn0.375 alloys, respectively, which
implies that the substitution ofMn for Ni inMg2Ni canmore or
less inhibit the oxidation of powder.
Fig. 6 presents X-ray diffraction patterns of the
Mg2Ni1!xMnx alloys with a fixed milling time of 48 h: (a) x ¼ 0,
(b) x ¼ 0.125, (c) x ¼ 0.25 and (d) x ¼ 0.375. It can be observed
that the diffusing peaks of amorphous phase become
smoother and lower with the rise of Mn content from x ¼ 0 to
x ¼ 0.25, which implies that the content of amorphous phase
increases. For x ¼ 0.375, as mentioned above, the phase
formation of Mg3MnNi2 is probably related to the amorphous
phase. Therefore, in the middle of this process, the substitu-
tion of Mn for Ni may also play a role of promoting
the formation of amorphous phase. A conclusion that the
substitution of Mn for Ni is favourable for the formation of the
10 20 30 40 50 60
2-Theta (degree)
0
2500
5000
7500
Inte
nsi
ty (
Co
un
ts)
-Mg -Ni -Mg Ni
-MgNi -MgO
4 h
8 h
16 h
24 h
48 h
Fig. 2 e X-ray diffraction patterns of the Mg2Ni alloy with
different milling times.
20 30 40 50 60
2-Theta (degree)
0
500
1000
1500
2000
Inte
nsi
ty (
Co
un
ts)
Amorphous
Fitted XRD
Experimental XRD
MgO
MgOMg2NiMg2Ni
Amorphous
Fig. 3 e Experimental and fitted X-ray diffraction patterns
of the Mg2Ni alloy with a fixed milling time of 48 h.
20 30 40 50 60
2-Theta (degree)
0
332
664
996
1328
1660
1992
Experimental XRD
Fitted XRD
MgO
Amorphous
Amorphous
Mg Ni Mg Ni MgOInte
nsi
ty (
Co
un
ts)
Fig. 4 e Experimental and fitted X-ray diffraction patterns
of the Mg2Ni0.875Mn0.125 alloy with a fixed milling time of
48 h.
20 30 40 50 60
2-Theta (degree)
0
166
332
498
664
830
996
1162
1328
1494
1660
Inte
nsi
ty (
Co
un
ts) Experimental XRD
Fitted XRD
MgO
Amorphous
Amorphous
Mg2Ni Mg2Ni MgO
Fig. 5 e Experimental and fitted X-ray diffraction patterns
of the Mg2Ni0.75Mn0.25 alloy with a fixed milling time of
48 h.
i n t e r n a t i o n a l j o u r n a l o f h y d r o g e n en e r g y 3 5 ( 2 0 1 0 ) 6 7 9 4e6 8 0 3 6797
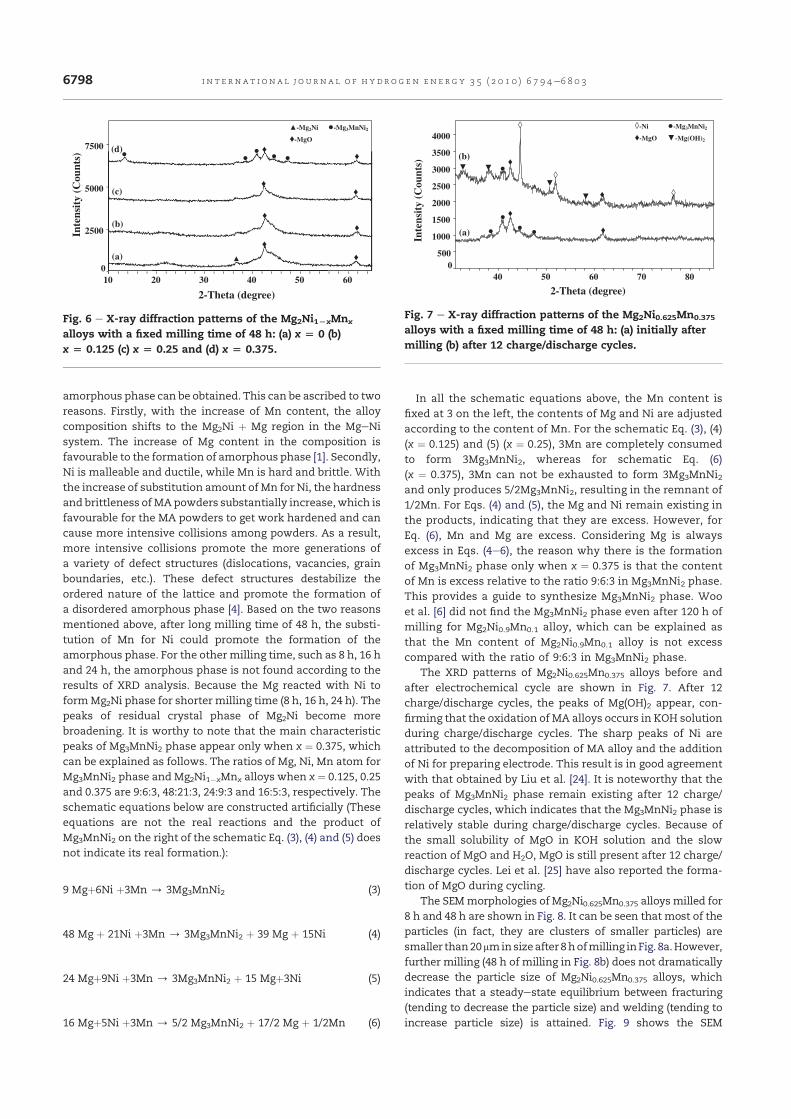
amorphous phase can be obtained. This can be ascribed to two
reasons. Firstly, with the increase of Mn content, the alloy
composition shifts to the Mg2Ni þ Mg region in the MgeNi
system. The increase of Mg content in the composition is
favourable to the formation of amorphous phase [1]. Secondly,
Ni is malleable and ductile, while Mn is hard and brittle. With
the increase of substitution amount of Mn for Ni, the hardness
and brittleness ofMApowders substantially increase,which is
favourable for the MA powders to get work hardened and can
cause more intensive collisions among powders. As a result,
more intensive collisions promote the more generations of
a variety of defect structures (dislocations, vacancies, grain
boundaries, etc.). These defect structures destabilize the
ordered nature of the lattice and promote the formation of
a disordered amorphous phase [4]. Based on the two reasons
mentioned above, after long milling time of 48 h, the substi-
tution of Mn for Ni could promote the formation of the
amorphous phase. For the othermilling time, such as 8 h, 16 h
and 24 h, the amorphous phase is not found according to the
results of XRD analysis. Because the Mg reacted with Ni to
formMg2Ni phase for shorter milling time (8 h, 16 h, 24 h). The
peaks of residual crystal phase of Mg2Ni become more
broadening. It is worthy to note that the main characteristic
peaks of Mg3MnNi2 phase appear only when x ¼ 0.375, which
can be explained as follows. The ratios of Mg, Ni, Mn atom for
Mg3MnNi2 phase and Mg2Ni1!xMnx alloys when x ¼ 0.125, 0.25
and 0.375 are 9:6:3, 48:21:3, 24:9:3 and 16:5:3, respectively. The
schematic equations below are constructed artificially (These
equations are not the real reactions and the product of
Mg3MnNi2 on the right of the schematic Eq. (3), (4) and (5) does
not indicate its real formation.):
9 Mgþ6Ni þ3Mn / 3Mg3MnNi2 (3)
48 Mg þ 21Ni þ3Mn / 3Mg3MnNi2 þ 39 Mg þ 15Ni (4)
24 Mgþ9Ni þ3Mn / 3Mg3MnNi2 þ 15 Mgþ3Ni (5)
16 Mgþ5Ni þ3Mn / 5/2 Mg3MnNi2 þ 17/2 Mg þ 1/2Mn (6)
In all the schematic equations above, the Mn content is
fixed at 3 on the left, the contents of Mg and Ni are adjusted
according to the content of Mn. For the schematic Eq. (3), (4)
(x ¼ 0.125) and (5) (x ¼ 0.25), 3Mn are completely consumed
to form 3Mg3MnNi2, whereas for schematic Eq. (6)
(x ¼ 0.375), 3Mn can not be exhausted to form 3Mg3MnNi2and only produces 5/2Mg3MnNi2, resulting in the remnant of
1/2Mn. For Eqs. (4) and (5), the Mg and Ni remain existing in
the products, indicating that they are excess. However, for
Eq. (6), Mn and Mg are excess. Considering Mg is always
excess in Eqs. (4e6), the reason why there is the formation
of Mg3MnNi2 phase only when x ¼ 0.375 is that the content
of Mn is excess relative to the ratio 9:6:3 in Mg3MnNi2 phase.
This provides a guide to synthesize Mg3MnNi2 phase. Woo
et al. [6] did not find the Mg3MnNi2 phase even after 120 h of
milling for Mg2Ni0.9Mn0.1 alloy, which can be explained as
that the Mn content of Mg2Ni0.9Mn0.1 alloy is not excess
compared with the ratio of 9:6:3 in Mg3MnNi2 phase.
The XRD patterns of Mg2Ni0.625Mn0.375 alloys before and
after electrochemical cycle are shown in Fig. 7. After 12
charge/discharge cycles, the peaks of Mg(OH)2 appear, con-
firming that the oxidation of MA alloys occurs in KOH solution
during charge/discharge cycles. The sharp peaks of Ni are
attributed to the decomposition of MA alloy and the addition
of Ni for preparing electrode. This result is in good agreement
with that obtained by Liu et al. [24]. It is noteworthy that the
peaks of Mg3MnNi2 phase remain existing after 12 charge/
discharge cycles, which indicates that the Mg3MnNi2 phase is
relatively stable during charge/discharge cycles. Because of
the small solubility of MgO in KOH solution and the slow
reaction of MgO and H2O, MgO is still present after 12 charge/
discharge cycles. Lei et al. [25] have also reported the forma-
tion of MgO during cycling.
The SEMmorphologies of Mg2Ni0.625Mn0.375 alloysmilled for
8 h and 48 h are shown in Fig. 8. It can be seen that most of the
particles (in fact, they are clusters of smaller particles) are
smaller than20mminsizeafter 8hofmilling inFig. 8a.However,
further milling (48 h of milling in Fig. 8b) does not dramatically
decrease the particle size of Mg2Ni0.625Mn0.375 alloys, which
indicates that a steadyestate equilibrium between fracturing
(tending to decrease the particle size) and welding (tending to
increase particle size) is attained. Fig. 9 shows the SEM
10 20 30 40 50 60
2-Theta (degree)
0
2500
5000
7500
Inte
nsi
ty (
Co
un
ts)
-Mg Ni -Mg MnNi
-MgO
(a)
(b)
(c)
(d)
Fig. 6 e X-ray diffraction patterns of the Mg2Ni1LxMnx
alloys with a fixed milling time of 48 h: (a) x [ 0 (b)
x [ 0.125 (c) x [ 0.25 and (d) x [ 0.375.
40 50 60 70 80
2-Theta (degree)
0
500
1000
1500
2000
2500
3000
3500
4000
Inte
nsi
ty (
Co
un
ts)
-Ni -Mg3MnNi2
-MgO -Mg(OH)2
(a)
(b)
Fig. 7 e X-ray diffraction patterns of the Mg2Ni0.625Mn0.375
alloys with a fixed milling time of 48 h: (a) initially after
milling (b) after 12 charge/discharge cycles.
i n t e rn a t i o n a l j o u r n a l o f h y d r o g e n en e r g y 3 5 ( 2 0 1 0 ) 6 7 9 4e6 8 0 36798
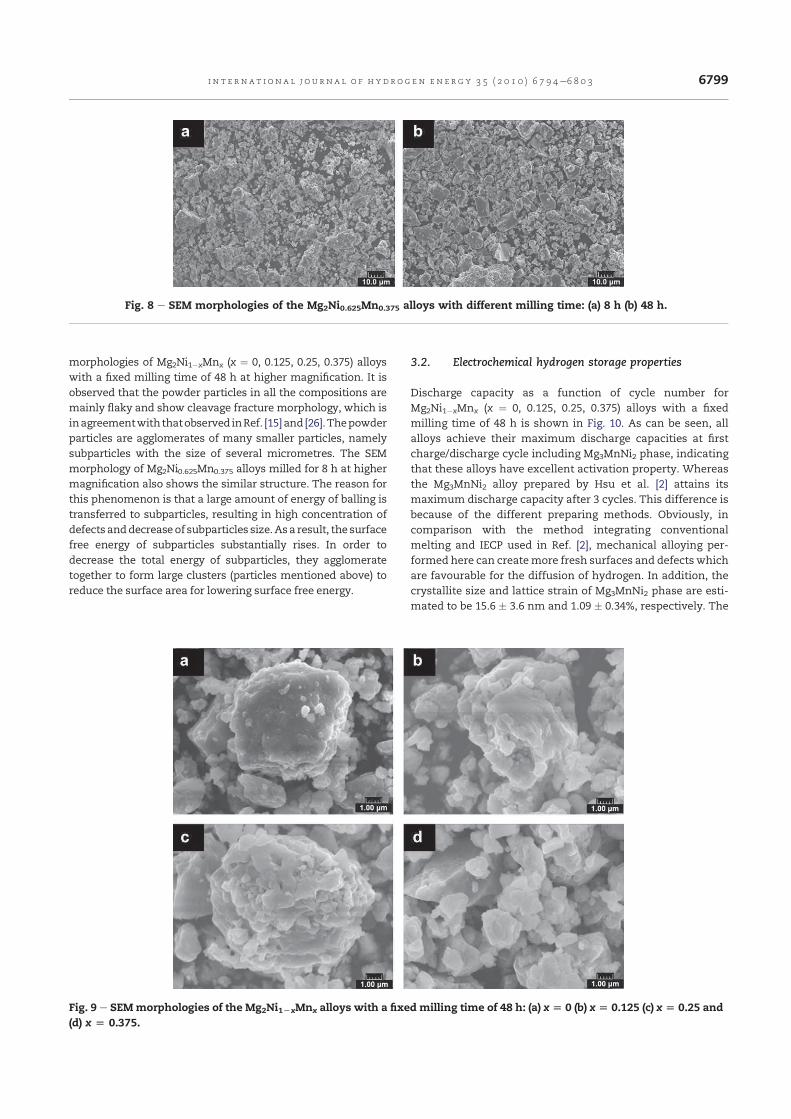
morphologies of Mg2Ni1!xMnx (x ¼ 0, 0.125, 0.25, 0.375) alloys
with a fixed milling time of 48 h at higher magnification. It is
observed that the powder particles in all the compositions are
mainly flaky and show cleavage fracture morphology, which is
inagreementwiththatobserved inRef. [15]and[26].Thepowder
particles are agglomerates of many smaller particles, namely
subparticles with the size of several micrometres. The SEM
morphology of Mg2Ni0.625Mn0.375 alloys milled for 8 h at higher
magnification also shows the similar structure. The reason for
this phenomenon is that a large amount of energy of balling is
transferred to subparticles, resulting in high concentration of
defects anddecreaseof subparticles size.Asa result, the surface
free energy of subparticles substantially rises. In order to
decrease the total energy of subparticles, they agglomerate
together to form large clusters (particles mentioned above) to
reduce the surface area for lowering surface free energy.
3.2. Electrochemical hydrogen storage properties
Discharge capacity as a function of cycle number for
Mg2Ni1!xMnx (x ¼ 0, 0.125, 0.25, 0.375) alloys with a fixed
milling time of 48 h is shown in Fig. 10. As can be seen, all
alloys achieve their maximum discharge capacities at first
charge/discharge cycle including Mg3MnNi2 phase, indicating
that these alloys have excellent activation property. Whereas
the Mg3MnNi2 alloy prepared by Hsu et al. [2] attains its
maximum discharge capacity after 3 cycles. This difference is
because of the different preparing methods. Obviously, in
comparison with the method integrating conventional
melting and IECP used in Ref. [2], mechanical alloying per-
formed here can createmore fresh surfaces and defects which
are favourable for the diffusion of hydrogen. In addition, the
crystallite size and lattice strain of Mg3MnNi2 phase are esti-
mated to be 15.6 # 3.6 nm and 1.09 # 0.34%, respectively. The
Fig. 8 e SEM morphologies of the Mg2Ni0.625Mn0.375 alloys with different milling time: (a) 8 h (b) 48 h.
Fig. 9 e SEMmorphologies of the Mg2Ni1LxMnx alloys with a fixed milling time of 48 h: (a) x [ 0 (b) x [ 0.125 (c) x [ 0.25 and
(d) x [ 0.375.
i n t e r n a t i o n a l j o u r n a l o f h y d r o g e n en e r g y 3 5 ( 2 0 1 0 ) 6 7 9 4e6 8 0 3 6799
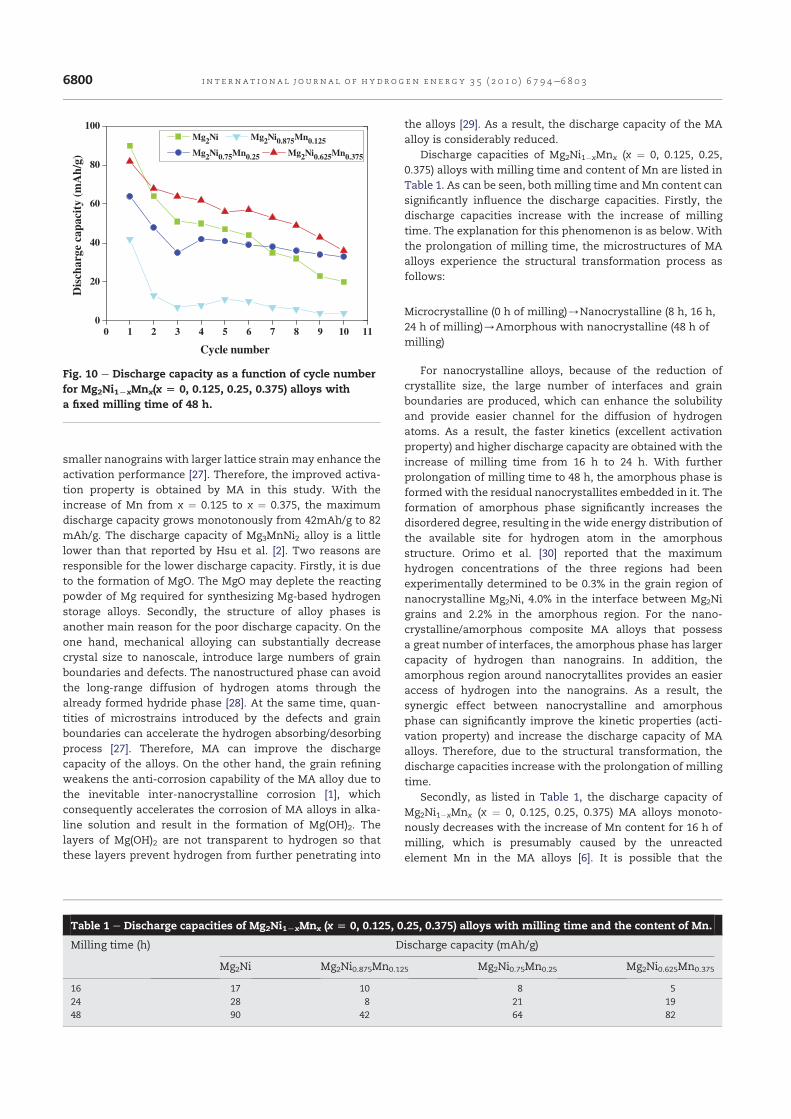
smaller nanograins with larger lattice strain may enhance the
activation performance [27]. Therefore, the improved activa-
tion property is obtained by MA in this study. With the
increase of Mn from x ¼ 0.125 to x ¼ 0.375, the maximum
discharge capacity grows monotonously from 42mAh/g to 82
mAh/g. The discharge capacity of Mg3MnNi2 alloy is a little
lower than that reported by Hsu et al. [2]. Two reasons are
responsible for the lower discharge capacity. Firstly, it is due
to the formation of MgO. The MgO may deplete the reacting
powder of Mg required for synthesizing Mg-based hydrogen
storage alloys. Secondly, the structure of alloy phases is
another main reason for the poor discharge capacity. On the
one hand, mechanical alloying can substantially decrease
crystal size to nanoscale, introduce large numbers of grain
boundaries and defects. The nanostructured phase can avoid
the long-range diffusion of hydrogen atoms through the
already formed hydride phase [28]. At the same time, quan-
tities of microstrains introduced by the defects and grain
boundaries can accelerate the hydrogen absorbing/desorbing
process [27]. Therefore, MA can improve the discharge
capacity of the alloys. On the other hand, the grain refining
weakens the anti-corrosion capability of the MA alloy due to
the inevitable inter-nanocrystalline corrosion [1], which
consequently accelerates the corrosion of MA alloys in alka-
line solution and result in the formation of Mg(OH)2. The
layers of Mg(OH)2 are not transparent to hydrogen so that
these layers prevent hydrogen from further penetrating into
the alloys [29]. As a result, the discharge capacity of the MA
alloy is considerably reduced.
Discharge capacities of Mg2Ni1!xMnx (x ¼ 0, 0.125, 0.25,
0.375) alloys with milling time and content of Mn are listed in
Table 1. As can be seen, both milling time and Mn content can
significantly influence the discharge capacities. Firstly, the
discharge capacities increase with the increase of milling
time. The explanation for this phenomenon is as below. With
the prolongation of milling time, the microstructures of MA
alloys experience the structural transformation process as
follows:
Microcrystalline (0 h of milling)/Nanocrystalline (8 h, 16 h,
24 h of milling)/Amorphous with nanocrystalline (48 h of
milling)
For nanocrystalline alloys, because of the reduction of
crystallite size, the large number of interfaces and grain
boundaries are produced, which can enhance the solubility
and provide easier channel for the diffusion of hydrogen
atoms. As a result, the faster kinetics (excellent activation
property) and higher discharge capacity are obtained with the
increase of milling time from 16 h to 24 h. With further
prolongation of milling time to 48 h, the amorphous phase is
formed with the residual nanocrystallites embedded in it. The
formation of amorphous phase significantly increases the
disordered degree, resulting in the wide energy distribution of
the available site for hydrogen atom in the amorphous
structure. Orimo et al. [30] reported that the maximum
hydrogen concentrations of the three regions had been
experimentally determined to be 0.3% in the grain region of
nanocrystalline Mg2Ni, 4.0% in the interface between Mg2Ni
grains and 2.2% in the amorphous region. For the nano-
crystalline/amorphous composite MA alloys that possess
a great number of interfaces, the amorphous phase has larger
capacity of hydrogen than nanograins. In addition, the
amorphous region around nanocrytallites provides an easier
access of hydrogen into the nanograins. As a result, the
synergic effect between nanocrystalline and amorphous
phase can significantly improve the kinetic properties (acti-
vation property) and increase the discharge capacity of MA
alloys. Therefore, due to the structural transformation, the
discharge capacities increase with the prolongation of milling
time.
Secondly, as listed in Table 1, the discharge capacity of
Mg2Ni1!xMnx (x ¼ 0, 0.125, 0.25, 0.375) MA alloys monoto-
nously decreases with the increase of Mn content for 16 h of
milling, which is presumably caused by the unreacted
element Mn in the MA alloys [6]. It is possible that the
0 1 2 3 4 5 6 7 8 9 10 110
20
40
60
80
100Mg
2Ni Mg
2Ni
0.875Mn
0.125
Mg2Ni
0.75Mn
0.25Mg
2Ni
0.625Mn
0.375
Dis
cha
rge
cap
aci
ty (
mA
h/g
)
Cycle number
Fig. 10 e Discharge capacity as a function of cycle number
for Mg2Ni1LxMnx(x [ 0, 0.125, 0.25, 0.375) alloys with
a fixed milling time of 48 h.
Table 1 e Discharge capacities of Mg2Ni1LxMnx (x [ 0, 0.125, 0.25, 0.375) alloys with milling time and the content of Mn.
Milling time (h) Discharge capacity (mAh/g)
Mg2Ni Mg2Ni0.875Mn0.125 Mg2Ni0.75Mn0.25 Mg2Ni0.625Mn0.375
16 17 10 8 5
24 28 8 21 19
48 90 42 64 82
i n t e rn a t i o n a l j o u r n a l o f h y d r o g e n en e r g y 3 5 ( 2 0 1 0 ) 6 7 9 4e6 8 0 36800
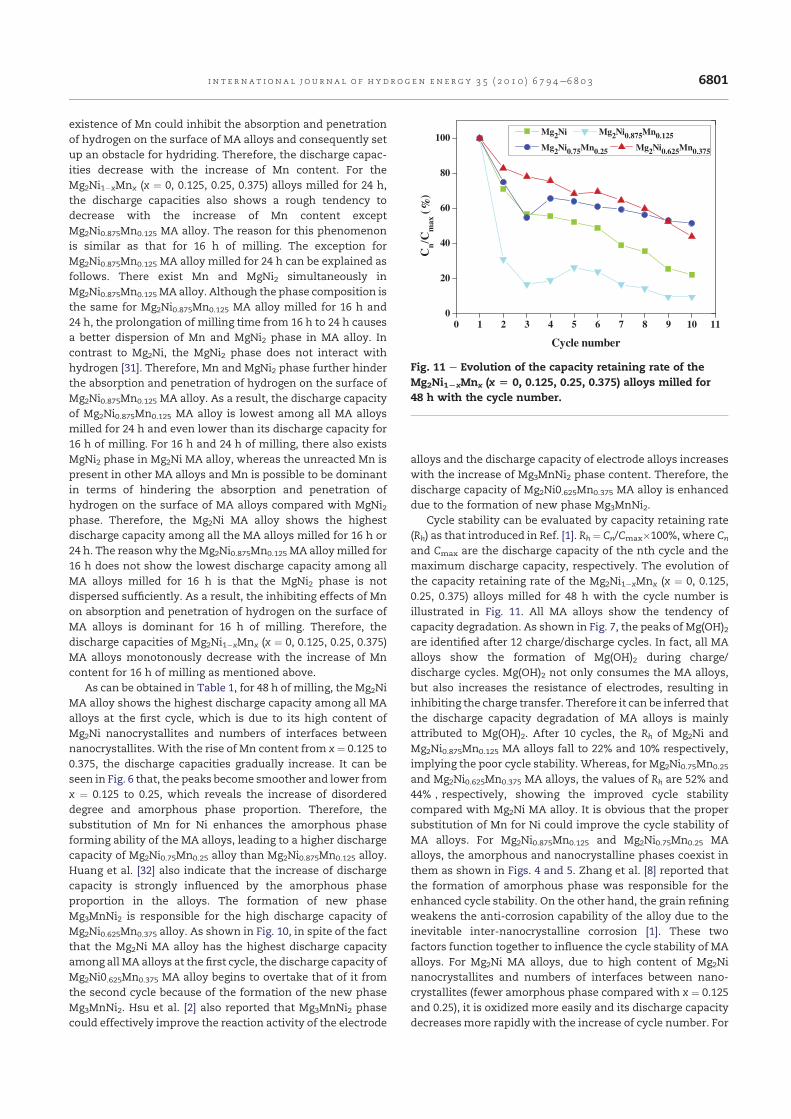
existence of Mn could inhibit the absorption and penetration
of hydrogen on the surface of MA alloys and consequently set
up an obstacle for hydriding. Therefore, the discharge capac-
ities decrease with the increase of Mn content. For the
Mg2Ni1!xMnx (x ¼ 0, 0.125, 0.25, 0.375) alloys milled for 24 h,
the discharge capacities also shows a rough tendency to
decrease with the increase of Mn content except
Mg2Ni0.875Mn0.125 MA alloy. The reason for this phenomenon
is similar as that for 16 h of milling. The exception for
Mg2Ni0.875Mn0.125 MA alloy milled for 24 h can be explained as
follows. There exist Mn and MgNi2 simultaneously in
Mg2Ni0.875Mn0.125MAalloy. Although the phase composition is
the same for Mg2Ni0.875Mn0.125 MA alloy milled for 16 h and
24 h, the prolongation of milling time from 16 h to 24 h causes
a better dispersion of Mn and MgNi2 phase in MA alloy. In
contrast to Mg2Ni, the MgNi2 phase does not interact with
hydrogen [31]. Therefore, Mn and MgNi2 phase further hinder
the absorption and penetration of hydrogen on the surface of
Mg2Ni0.875Mn0.125 MA alloy. As a result, the discharge capacity
of Mg2Ni0.875Mn0.125 MA alloy is lowest among all MA alloys
milled for 24 h and even lower than its discharge capacity for
16 h of milling. For 16 h and 24 h of milling, there also exists
MgNi2 phase in Mg2Ni MA alloy, whereas the unreacted Mn is
present in other MA alloys and Mn is possible to be dominant
in terms of hindering the absorption and penetration of
hydrogen on the surface of MA alloys compared with MgNi2phase. Therefore, the Mg2Ni MA alloy shows the highest
discharge capacity among all the MA alloys milled for 16 h or
24 h. The reasonwhy theMg2Ni0.875Mn0.125 MA alloymilled for
16 h does not show the lowest discharge capacity among all
MA alloys milled for 16 h is that the MgNi2 phase is not
dispersed sufficiently. As a result, the inhibiting effects of Mn
on absorption and penetration of hydrogen on the surface of
MA alloys is dominant for 16 h of milling. Therefore, the
discharge capacities of Mg2Ni1!xMnx (x ¼ 0, 0.125, 0.25, 0.375)
MA alloys monotonously decrease with the increase of Mn
content for 16 h of milling as mentioned above.
As can be obtained in Table 1, for 48 h of milling, the Mg2Ni
MA alloy shows the highest discharge capacity among all MA
alloys at the first cycle, which is due to its high content of
Mg2Ni nanocrystallites and numbers of interfaces between
nanocrystallites. With the rise of Mn content from x ¼ 0.125 to
0.375, the discharge capacities gradually increase. It can be
seen in Fig. 6 that, the peaks become smoother and lower from
x ¼ 0.125 to 0.25, which reveals the increase of disordered
degree and amorphous phase proportion. Therefore, the
substitution of Mn for Ni enhances the amorphous phase
forming ability of the MA alloys, leading to a higher discharge
capacity of Mg2Ni0.75Mn0.25 alloy than Mg2Ni0.875Mn0.125 alloy.
Huang et al. [32] also indicate that the increase of discharge
capacity is strongly influenced by the amorphous phase
proportion in the alloys. The formation of new phase
Mg3MnNi2 is responsible for the high discharge capacity of
Mg2Ni0.625Mn0.375 alloy. As shown in Fig. 10, in spite of the fact
that the Mg2Ni MA alloy has the highest discharge capacity
among all MA alloys at the first cycle, the discharge capacity of
Mg2Ni0.625Mn0.375 MA alloy begins to overtake that of it from
the second cycle because of the formation of the new phase
Mg3MnNi2. Hsu et al. [2] also reported that Mg3MnNi2 phase
could effectively improve the reaction activity of the electrode
alloys and the discharge capacity of electrode alloys increases
with the increase of Mg3MnNi2 phase content. Therefore, the
discharge capacity of Mg2Ni0.625Mn0.375 MA alloy is enhanced
due to the formation of new phase Mg3MnNi2.
Cycle stability can be evaluated by capacity retaining rate
(Rh) as that introduced in Ref. [1]. Rh¼ Cn/Cmax'100%, where Cn
and Cmax are the discharge capacity of the nth cycle and the
maximum discharge capacity, respectively. The evolution of
the capacity retaining rate of the Mg2Ni1!xMnx (x ¼ 0, 0.125,
0.25, 0.375) alloys milled for 48 h with the cycle number is
illustrated in Fig. 11. All MA alloys show the tendency of
capacity degradation. As shown in Fig. 7, the peaks of Mg(OH)2are identified after 12 charge/discharge cycles. In fact, all MA
alloys show the formation of Mg(OH)2 during charge/
discharge cycles. Mg(OH)2 not only consumes the MA alloys,
but also increases the resistance of electrodes, resulting in
inhibiting the charge transfer. Therefore it can be inferred that
the discharge capacity degradation of MA alloys is mainly
attributed to Mg(OH)2. After 10 cycles, the Rh of Mg2Ni and
Mg2Ni0.875Mn0.125 MA alloys fall to 22% and 10% respectively,
implying the poor cycle stability. Whereas, for Mg2Ni0.75Mn0.25
and Mg2Ni0.625Mn0.375 MA alloys, the values of Rh are 52% and
44%,respectively, showing the improved cycle stability
compared with Mg2Ni MA alloy. It is obvious that the proper
substitution of Mn for Ni could improve the cycle stability of
MA alloys. For Mg2Ni0.875Mn0.125 and Mg2Ni0.75Mn0.25 MA
alloys, the amorphous and nanocrystalline phases coexist in
them as shown in Figs. 4 and 5. Zhang et al. [8] reported that
the formation of amorphous phase was responsible for the
enhanced cycle stability. On the other hand, the grain refining
weakens the anti-corrosion capability of the alloy due to the
inevitable inter-nanocrystalline corrosion [1]. These two
factors function together to influence the cycle stability of MA
alloys. For Mg2Ni MA alloys, due to high content of Mg2Ni
nanocrystallites and numbers of interfaces between nano-
crystallites (fewer amorphous phase compared with x ¼ 0.125
and 0.25), it is oxidized more easily and its discharge capacity
decreasesmore rapidly with the increase of cycle number. For
0 1 2 3 4 5 6 7 8 9 10 110
20
40
60
80
100Mg
2Ni Mg
2Ni
0.875Mn
0.125
Mg2Ni
0.75Mn
0.25Mg
2Ni
0.625Mn
0.375
Cn/C
max
()
Cycle number
Fig. 11 e Evolution of the capacity retaining rate of the
Mg2Ni1LxMnx (x [ 0, 0.125, 0.25, 0.375) alloys milled for
48 h with the cycle number.
i n t e r n a t i o n a l j o u r n a l o f h y d r o g e n en e r g y 3 5 ( 2 0 1 0 ) 6 7 9 4e6 8 0 3 6801
Mg2Ni0.75Mn0.25 MA alloy, its significantly improved amor-
phous phase forming ability is dominant, therefore its cycle
stability is enhanced. Whereas for Mg2Ni0.875Mn0.125 MA alloy,
the latter factor is dominant, as a result, its cycle stability is
weakened. The improvement of cycle stability of
Mg2Ni0.625Mn0.375 MA alloy is due to the formation of the new
phase Mg3MnNi2. As shown in Fig. 7, the Mg3MnNi2 phase
remains existing after 12 charge/discharge cycles, which
indicates that Mg3MnNi2 phase is relatively stable. Hsu et al.
[2] also indicated that Mg3MnNi2 phase could enhance the
anti-corrosive performance and possesses a positive effect on
the retardation of cycling capacity degradation rate of the
electrode alloys. The improved cycle stability of
Mg2Ni0.75Mn0.25 alloy is at the expense of the reduction of the
discharge capacity. In contrast, the Mg3MnNi2 phase can
significantly improve the cycle stability under maintaining
a relative high discharge capacity compared with other
substituted MA alloys.
4. Conclusions
The structure and electrochemical hydrogen storage proper-
ties ofMg2Ni1!xMnx (x¼ 0, 0.125, 0.25, 0.375) alloys prepared by
mechanical alloying have been investigated. Based on this
study, the following conclusions can be obtained: (1) it is
difficult for Mn to substitute Ni site in Mg2Ni lattice structure.
The substitution of Mn for Ni could inhibit the formation of
MgNi2 phase with the increases of x from 0 to 0.375. After 48 h
of milling, the results of XRD analysis indicates that the
substitution of Mn for Ni could promote the formation of the
amorphous phase when x increases from 0 to 0.25. The
amorphous and nanocrystalline Mg2Ni coexist in the
Mg2Ni1!xMnx(x ¼ 0, 0.125, 0.25) alloys milled for 48 h with
nanocrystallites embedded in the amorphous matrix. (2) The
new phase Mg3MnNi2 is synthesized only when x ¼ 0.375 after
48 h of milling. To the best of our knowledge, this is the first
time that the one-step mechanical alloying in argon atmo-
sphere is reported to synthesize the new Mg3MnNi2 phase.
This new phase belongs to the face-centered cubic lattice
(Fd-3m) with the lattice constant a being 1.1484 nm. Estimated
from the peaks broadening, the crystallite size and lattice
strain of Mg3MnNi2 phase are 15.6 # 3.6 nm and 1.09 # 0.34%,
respectively. The phase formationmechanism of Mg3MnNi2 is
probably that with the increase of milling time, the lattice
structure of Mg2Ni phase was destroyed and simultaneously
amorphous phasewas formed. And thenMg, Ni andMn atoms
rearranged to form Mg3MnNi2 phase. In the middle of this
process, the substitution of Mn for Ni may also play a role of
promoting the formation of amorphous phase. It is suggested
that in order to synthesize Mg3MnNi2, the content of Mn
should be excess relative to the ratio 9:6:3 of Mg, Ni and Mn in
Mg3MnNi2 phase. (3) The SEM observation reveals that all the
MA alloys particles are mainly flaky and show cleavage frac-
ture morphology and these particles are agglomerates of
many smaller particles, namely subparticles. (4) All MA alloys
have excellent activation properties. With the increase of
milling time, the discharge capacities of MA alloys rise. The
discharge capacities of Mg2Ni1!xMnx (x ¼ 0, 0.125, 0.25, 0.375)
MA alloys monotonously decrease with the increase of Mn
content for 16 h of milling, which is presumably caused by the
unreacted element Mn in the MA alloys. It is possible that the
existence of Mn could inhibit the absorption and penetration
of hydrogen on the surface of MA alloys and consequently set
up an obstacle for hydriding. For theMg2Ni1!xMnx (x¼ 0, 0.125,
0.25, 0.375) alloys milled for 24 h, the discharge capacities also
show a rough tendency to decrease with the increase of Mn
content except Mg2Ni0.875Mn0.125 MA alloy. For the
Mg2Ni1!xMnx (x ¼ 0.125, 0.25, 0.375) MA alloys with a fixed
milling time of 48 h, the discharge capacities rise with the
increase of substitution of Mn for Ni. From x ¼ 0.125 to 0.25,
the substitution of Mn for Ni enhances the amorphous phase
forming ability of MA alloys and consequently improves the
discharge capacity. Mg2Ni0.625Mn0.375 MA alloy shows the
highest discharge capacity among these three MA alloys due
to the formation of new phase Mg3MnNi2. The appearance of
MgO in MA alloys is one reason for causing a poor discharge
capacity. Furthermore, nanocrystallites and numbers of
interfaces between nanocrystallites introduced by mechan-
ical alloying cause an easier inter-nanocrystalline corrosion,
which also results in a lower discharge capacity and a poor
cycle stability. Reducing the formation of MgO and improving
the inter-nanocrystalline corrosion is the next aim of
research. Mg(OH)2 is produced during charge/discharge cycle
in all MA alloys, which leads to the degradation of discharge
capacity. Amorphous phase is favourable for improving cycle
stability. Mg3MnNi2 phase is relatively stable during charge/
discharge cycles and therefore can significantly enhance the
cycle stability under simultaneously maintaining a high
discharge capacity.
Acknowledgments
This work is supported by China Scholarship Council (China)
and UTBM (France) in the framework of UT-INSA project
(2008). The authors would like to thank Dr. O. Rapaud
(LERMPS, UTBM, France) and V. Moutarlier (Institut UTINAM,
UMR 6213, France) for their technical assistance concerning
SEM and XRD experiments.
r e f e r e n c e s
[1] Zhang Y, Ren H, Li B, Guo S, Pang Z, Wang X. Electrochemicalhydrogen storage characteristics of nanocrystalline andamorphous Mg20Ni10!xCox(x ¼ 0e4) alloys prepared by meltspinning. Int J Hydrogen Energy 2009;34:8144e51.
[2] Hsu F, Lin C, Lee S, Lin C, Bor H. Effect of Mg3MnNi2 on theelectrochemical characteristics of Mg2Ni electrode alloy. JPower Sources 2010;195:374e9.
[3] Anik M, Gasan H, Topcu S, Akay I, Aydinbeyli N.Electrochemical hydrogen storage characteristics of Mg1.5Al0.5!xZrxNi (x ¼ 0, 0.1, 0.2, 0.3, 0.4, 0.5) alloys synthesized bymechanical alloying. Int J Hydrogen Energy 2009;34:2692e700.
[4] Suryanarayana C. Mechanical alloying and milling. ProgrMater Sci 2001;46:1e184.
[5] Kohno T, Tsuruta S, Kanda M. The hydrogen storageproperties of new Mg2Ni alloy. J Electrochem Soc 1996;143:L198e9.
i n t e rn a t i o n a l j o u r n a l o f h y d r o g e n en e r g y 3 5 ( 2 0 1 0 ) 6 7 9 4e6 8 0 36802
[6] Woo J, Lee K. Electrode characteristics of nanostructuredMg2Ni-type alloys prepared by mechanical alloying.J Electrochem Soc 1999;146:819e23.
[7] Abdellaoui M, Mokbli S, Cuevas F, Latroche M, Guegan AP,Zarrouk H. Structural, solidegas and electrochemicalcharacterization of Mg2Ni-rich and MgxNi100!x amorphous-rich nanomaterials obtained by mechanical alloying. IntJ Hydrogen Energy 2006;31:247e50.
[8] Zhang Y, Han X, Li B, Ren H, Dong X, Wang X.Electrochemical characteristics of Mg2!xZrxNi (x ¼ 0e0.6)electrode alloys prepared by mechanical alloying. J AlloysCompd 2008;450:208e14.
[9] Jurczyk M, Smardz L, Okonska I, Jankowska E, Nowak M,Smardz K. Nanoscale Mg-based materials for hydrogenstorage. Int J Hydrogen Energy 2008;33:374e80.
[10] Wang M, Zhang L, Zhang Y, Sun L, Tan Z, Xu F, et al. Effectsof partial substitution by Fe and Co for Ni in the Mg1.75Al0.25Nielectrode alloy on their electrochemical performances.Int J Hydrogen Energy 2006;31:775e9.
[11] Takahashi Y, Yukawa H, Morinaga M. Alloying effects on theelectronic structure of Mg2Ni intermetallic hydride. J AlloysCompd 1996;242:98e107.
[12] Yang HB, Yuan HT, Ji JT, Sun H, Zhou ZX, S Zhang Y.Characteristics of Mg2Ni0.75M0.25 (M ¼ Ti, Cr, Mn, Fe, Co, Ni,Cu and Zn) alloys after surface treatment. J Alloys Compd2002;330e332:640e4.
[13] Jurczyk M, Smardz L, Szajek A. Nanocrystalline materials forNieMH batteries. Mater Sci Eng B 2004;108:67e75.
[14] Kohno T, Kanda M. Effect of partial substitution on hydrogenstorage properties of Mg2Ni alloy. J Electrochem Soc 1997;144:2384e8.
[15] Gasiorowski A, Iwasieczko W, Skoryna D, Drulis H,Jurczyk M. Hydriding properties of nanocrystallineMg2!xMxNi alloys synthesized by mechanical alloying(M ¼ Mn, Al). J Alloys Compd 2004;364:283e8.
[16] Tsushio Y, Akiba E. Hydrogen desorption properties of thequaternary alloy system Mg2!xM1xNi1!Y M2Y. J Alloys Compd1998;267:246e51.
[17] Denys RV, Saldan IV, Delaplane RG, Berezovets VV, ZavaliyIY. Structure and hydrogenation properties of newmagnesium-based alloys. IX International Conference onHydrogen Materials Science & Chemistry of CarbonNanomaterials, Sevastopol, Ukraine, 2005, pp. 152.
[18] Dobrovolsky VD, Ershova OG, Solonin YM. Thermal stabilityand H-desorption properties of Mg3MnNi2Hx prepared byreactive mechanical alloying of powders Mg, Mn, Ni inH2-atmosphere. In: Baranowski B, Zaginaichenko SY,
Schur DV, Skorokhod VV, Veziroglu A, editors. CarbonNanomaterials in Clean Energy Hydrogen Systems.Netherlands: Springer; 2008. p. 467e72.
[19] Williamson GK, Hall WH. X-ray line broadening from filedaluminium and wolfram. Acta Metall 1953;1:22e31.
[20] Varin RA, Li S, Wronski Z, Morozova O, Khomenko T. Theeffect of sequential and continuous high-energy impactmode on the mechano-chemical synthesis ofnanostructured complex hydride Mg2FeH6. J Alloys Compd2005;390:282e96.
[21] Li S, VarinRA,MorozovaO,KhomenkoT. Controlledmechano-chemicalsynthesisofnanostructuredternarycomplexhydrideMg2FeH6under low-energy impactmodewithandwithoutpre-milling. J Alloys Compd 2004;384:231e48.
[22] Soubeyroux JL, Fruchart D, Mikou A, Pezat M, Darriet B. Etudestructurale du systeme Mg2NieH2 I e La solution solideMg2NiHx (x ¼ 0.30). Mat Res Bull 1984;19:895e904.
[23] Orimo S, Fujii H. Hydriding properties of nanostructured Mg-x at.% Ni (x ¼ 33e50) with a different amount of amorphousMgNi. Int J Hydrogen Energy 1999;24:933e7.
[24] Liu W, Lei Y, Sun D, Wu J, Wang Q. A study of the degradationof the electrochemical capacity of amorphous Mg50Ni50 alloy.J Power Sources 1996;58:243e7.
[25] Lei YQ, Wu YM, Yang QM, Wu J, Wang QD. Electrochemical-behavior of some mechanically alloyed Mg-Ni-basedamorphous hydrogen storage alloys. Z Phys Chem 1994;183:379e84.
[26] Ebrahimi-Purkani A, Kashani-Bozorg SF. NanocrystallineMg2Ni-based powders produced by high-energy ball millingand subsequent annealing. J Alloys Compd 2008;456:211e5.
[27] Niu H, Northwood DO. Enhanced electrochemical propertiesof ball-milled Mg2Ni electrodes. Int J Hydrogen Energy 2002;27:69e77.
[28] Zaluski L, Zaluska A, Strom-Olsen JO. Nanocrystalline metalhydrides. J Alloys Compd 1997;253e254:70e9.
[29] Zaluska A, Zaluski L, StromeOlsen JO. Nanocrystallinemagnesium for hydrogen storage. J Alloys Compd 1999;288:217e25.
[30] Orimo S, Fujii H. Materials science of Mg-Ni-based newhydrides. Appl Phys A 2001;72:167e86.
[31] Terzieva M, Khrussanova M, Peshev P. Hydriding anddehydriding characteristics of MgeLaNi5 compositematerials prepared by mechanical alloying. J Alloys Compd1998;267:235e9.
[32] Huang LJ, Liang GY, Sun ZB, Wu DC. Electrode properties ofmelt-spun MgeNieNd amorphous alloys. J Power Sources2006;160:684e7.
i n t e r n a t i o n a l j o u r n a l o f h y d r o g e n en e r g y 3 5 ( 2 0 1 0 ) 6 7 9 4e6 8 0 3 6803
67
ANNEXE 4
Huang LW, Elkedim O, Hamzaoui R. First principles investigation of the
substitutional doping of Mn in Mg2Ni phase and the electronic structure of
Mg3MnNi2 phase. Journal of Alloys and Compounds 2011; 509 : S328–33.

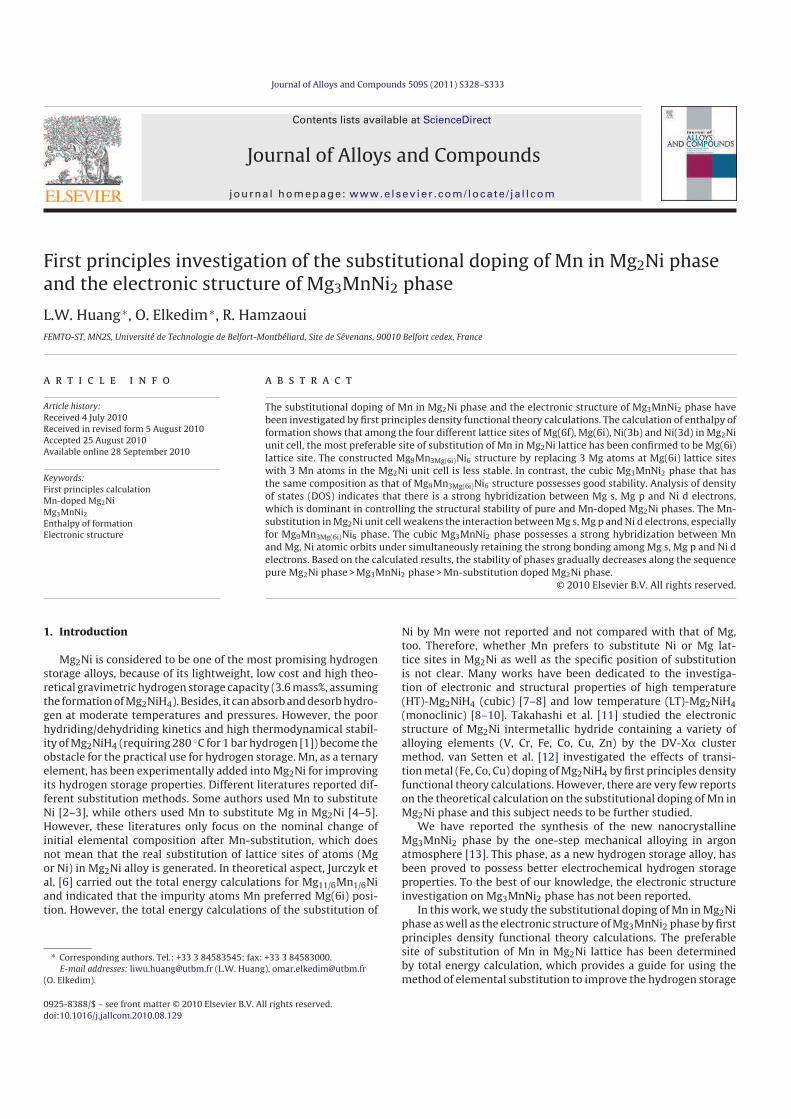
Journal of Alloys and Compounds 509S (2011) S328–S333
Contents lists available at ScienceDirect
Journal of Alloys and Compounds
journa l homepage: www.e lsev ier .com/ locate / ja l l com
First principles investigation of the substitutional doping of Mn in Mg2Ni phaseand the electronic structure of Mg3MnNi2 phase
L.W. Huang ∗, O. Elkedim ∗, R. HamzaouiFEMTO-ST, MN2S, Université de Technologie de Belfort-Montbéliard, Site de Sévenans, 90010 Belfort cedex, France
a r t i c l e i n f o
Article history:
Received 4 July 2010Received in revised form 5 August 2010Accepted 25 August 2010Available online 28 September 2010
Keywords:
First principles calculationMn-doped Mg2NiMg3MnNi2Enthalpy of formationElectronic structure
a b s t r a c t
The substitutional doping of Mn in Mg2Ni phase and the electronic structure of Mg3MnNi2 phase havebeen investigated by first principles density functional theory calculations. The calculation of enthalpy offormation shows that among the four different lattice sites of Mg(6f), Mg(6i), Ni(3b) and Ni(3d) in Mg2Niunit cell, the most preferable site of substitution of Mn in Mg2Ni lattice has been confirmed to be Mg(6i)lattice site. The constructed Mg9Mn3Mg(6i)Ni6 structure by replacing 3 Mg atoms at Mg(6i) lattice siteswith 3 Mn atoms in the Mg2Ni unit cell is less stable. In contrast, the cubic Mg3MnNi2 phase that hasthe same composition as that of Mg9Mn3Mg(6i)Ni6 structure possesses good stability. Analysis of densityof states (DOS) indicates that there is a strong hybridization between Mg s, Mg p and Ni d electrons,which is dominant in controlling the structural stability of pure and Mn-doped Mg2Ni phases. The Mn-substitution in Mg2Ni unit cell weakens the interaction between Mg s, Mg p and Ni d electrons, especiallyfor Mg9Mn3Mg(6i)Ni6 phase. The cubic Mg3MnNi2 phase possesses a strong hybridization between Mnand Mg, Ni atomic orbits under simultaneously retaining the strong bonding among Mg s, Mg p and Ni delectrons. Based on the calculated results, the stability of phases gradually decreases along the sequencepure Mg2Ni phase > Mg3MnNi2 phase > Mn-substitution doped Mg2Ni phase.
© 2010 Elsevier B.V. All rights reserved.
1. Introduction
Mg2Ni is considered to be one of the most promising hydrogenstorage alloys, because of its lightweight, low cost and high theo-retical gravimetric hydrogen storage capacity (3.6 mass%, assumingthe formation of Mg2NiH4). Besides, it can absorb and desorb hydro-gen at moderate temperatures and pressures. However, the poorhydriding/dehydriding kinetics and high thermodynamical stabil-ity of Mg2NiH4 (requiring 280 ◦C for 1 bar hydrogen [1]) become theobstacle for the practical use for hydrogen storage. Mn, as a ternaryelement, has been experimentally added into Mg2Ni for improvingits hydrogen storage properties. Different literatures reported dif-ferent substitution methods. Some authors used Mn to substituteNi [2–3], while others used Mn to substitute Mg in Mg2Ni [4–5].However, these literatures only focus on the nominal change ofinitial elemental composition after Mn-substitution, which doesnot mean that the real substitution of lattice sites of atoms (Mgor Ni) in Mg2Ni alloy is generated. In theoretical aspect, Jurczyk etal. [6] carried out the total energy calculations for Mg11/6Mn1/6Niand indicated that the impurity atoms Mn preferred Mg(6i) posi-tion. However, the total energy calculations of the substitution of
∗ Corresponding authors. Tel.: +33 3 84583545; fax: +33 3 84583000.E-mail addresses: [email protected] (L.W. Huang), [email protected]
(O. Elkedim).
Ni by Mn were not reported and not compared with that of Mg,too. Therefore, whether Mn prefers to substitute Ni or Mg lat-tice sites in Mg2Ni as well as the specific position of substitutionis not clear. Many works have been dedicated to the investiga-tion of electronic and structural properties of high temperature(HT)-Mg2NiH4 (cubic) [7–8] and low temperature (LT)-Mg2NiH4
(monoclinic) [8–10]. Takahashi et al. [11] studied the electronicstructure of Mg2Ni intermetallic hydride containing a variety ofalloying elements (V, Cr, Fe, Co, Cu, Zn) by the DV-Xa clustermethod. van Setten et al. [12] investigated the effects of transi-tion metal (Fe, Co, Cu) doping of Mg2NiH4 by first principles densityfunctional theory calculations. However, there are very few reportson the theoretical calculation on the substitutional doping of Mn inMg2Ni phase and this subject needs to be further studied.
We have reported the synthesis of the new nanocrystallineMg3MnNi2 phase by the one-step mechanical alloying in argonatmosphere [13]. This phase, as a new hydrogen storage alloy, hasbeen proved to possess better electrochemical hydrogen storageproperties. To the best of our knowledge, the electronic structureinvestigation on Mg3MnNi2 phase has not been reported.
In this work, we study the substitutional doping of Mn in Mg2Niphase as well as the electronic structure of Mg3MnNi2 phase by firstprinciples density functional theory calculations. The preferablesite of substitution of Mn in Mg2Ni lattice has been determinedby total energy calculation, which provides a guide for using themethod of elemental substitution to improve the hydrogen storage
0925-8388/$ – see front matter © 2010 Elsevier B.V. All rights reserved.
doi:10.1016/j.jallcom.2010.08.129
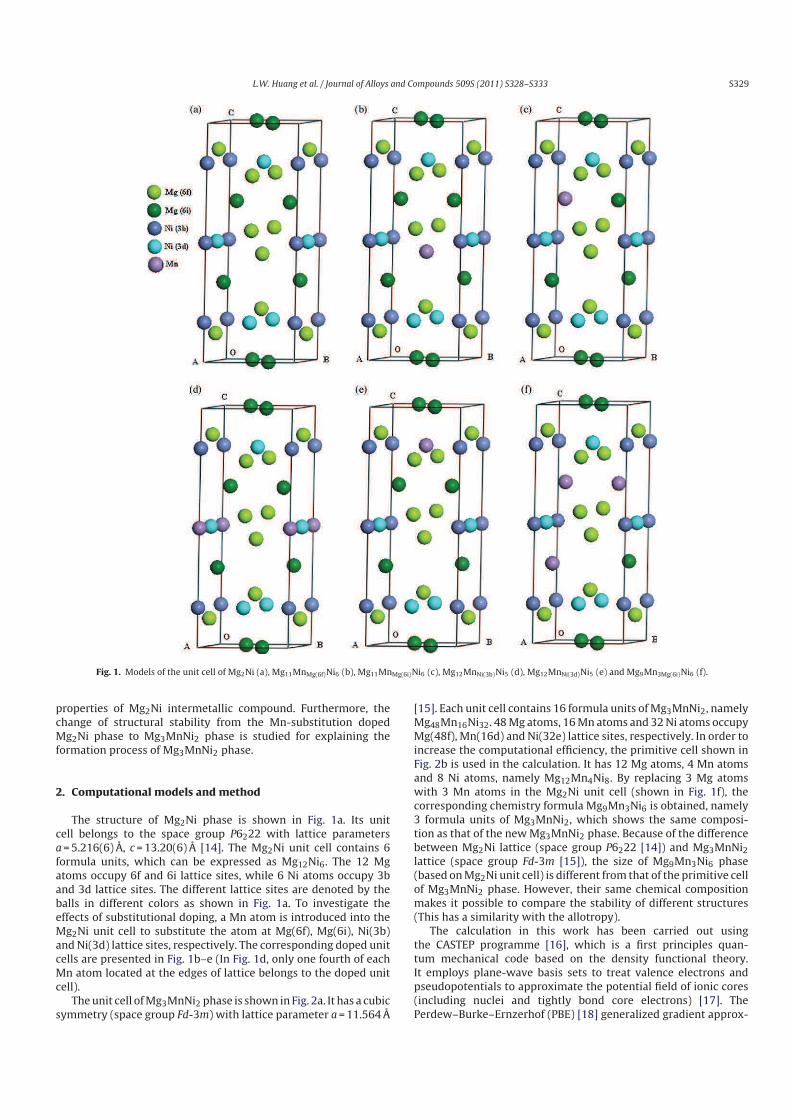
L.W. Huang et al. / Journal of Alloys and Compounds 509S (2011) S328–S333 S329
Fig. 1. Models of the unit cell of Mg2Ni (a), Mg11MnMg(6f)Ni6 (b), Mg11MnMg(6i)Ni6 (c), Mg12MnNi(3b)Ni5 (d), Mg12MnNi(3d)Ni5 (e) and Mg9Mn3Mg(6i)Ni6 (f).
properties of Mg2Ni intermetallic compound. Furthermore, thechange of structural stability from the Mn-substitution dopedMg2Ni phase to Mg3MnNi2 phase is studied for explaining theformation process of Mg3MnNi2 phase.
2. Computational models and method
The structure of Mg2Ni phase is shown in Fig. 1a. Its unitcell belongs to the space group P6222 with lattice parametersa = 5.216(6) A, c = 13.20(6) A [14]. The Mg2Ni unit cell contains 6formula units, which can be expressed as Mg12Ni6. The 12 Mgatoms occupy 6f and 6i lattice sites, while 6 Ni atoms occupy 3band 3d lattice sites. The different lattice sites are denoted by theballs in different colors as shown in Fig. 1a. To investigate theeffects of substitutional doping, a Mn atom is introduced into theMg2Ni unit cell to substitute the atom at Mg(6f), Mg(6i), Ni(3b)and Ni(3d) lattice sites, respectively. The corresponding doped unitcells are presented in Fig. 1b–e (In Fig. 1d, only one fourth of eachMn atom located at the edges of lattice belongs to the doped unitcell).
The unit cell of Mg3MnNi2 phase is shown in Fig. 2a. It has a cubicsymmetry (space group Fd-3m) with lattice parameter a = 11.564 A
[15]. Each unit cell contains 16 formula units of Mg3MnNi2, namelyMg48Mn16Ni32. 48 Mg atoms, 16 Mn atoms and 32 Ni atoms occupyMg(48f), Mn(16d) and Ni(32e) lattice sites, respectively. In order toincrease the computational efficiency, the primitive cell shown inFig. 2b is used in the calculation. It has 12 Mg atoms, 4 Mn atomsand 8 Ni atoms, namely Mg12Mn4Ni8. By replacing 3 Mg atomswith 3 Mn atoms in the Mg2Ni unit cell (shown in Fig. 1f), thecorresponding chemistry formula Mg9Mn3Ni6 is obtained, namely3 formula units of Mg3MnNi2, which shows the same composi-tion as that of the new Mg3MnNi2 phase. Because of the differencebetween Mg2Ni lattice (space group P6222 [14]) and Mg3MnNi2lattice (space group Fd-3m [15]), the size of Mg9Mn3Ni6 phase(based on Mg2Ni unit cell) is different from that of the primitive cellof Mg3MnNi2 phase. However, their same chemical compositionmakes it possible to compare the stability of different structures(This has a similarity with the allotropy).
The calculation in this work has been carried out usingthe CASTEP programme [16], which is a first principles quan-tum mechanical code based on the density functional theory.It employs plane-wave basis sets to treat valence electrons andpseudopotentials to approximate the potential field of ionic cores(including nuclei and tightly bond core electrons) [17]. ThePerdew–Burke–Ernzerhof (PBE) [18] generalized gradient approx-
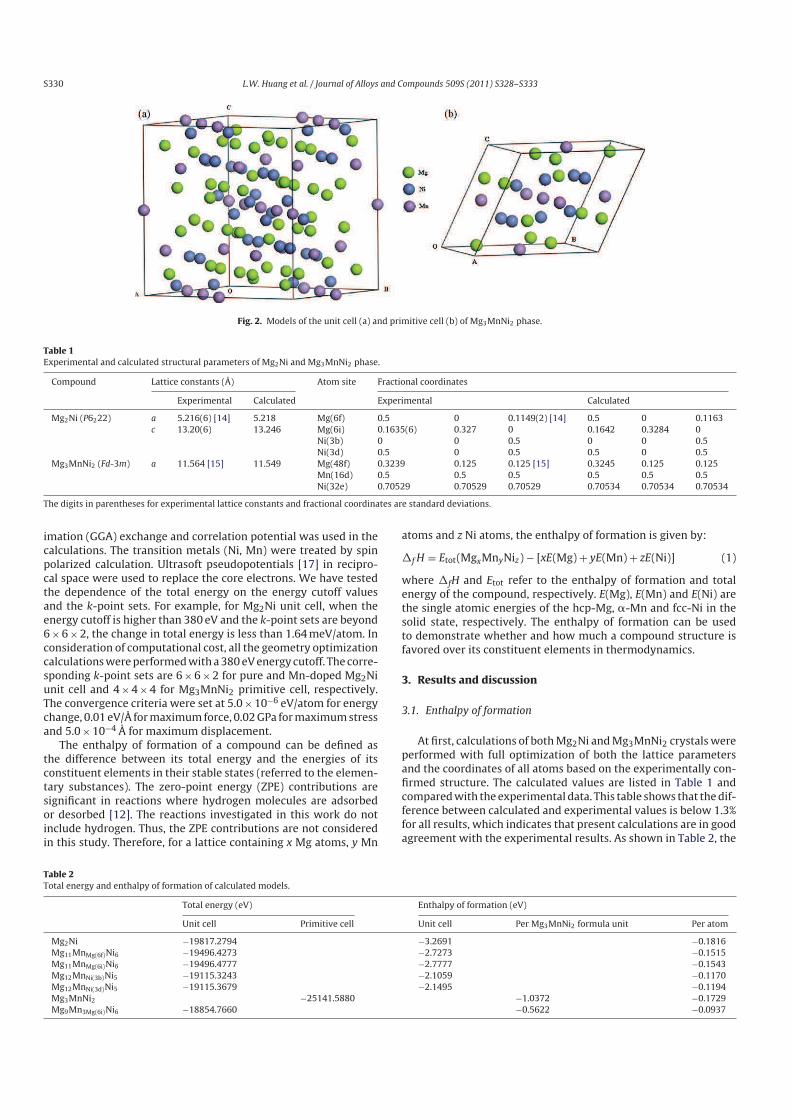
S330 L.W. Huang et al. / Journal of Alloys and Compounds 509S (2011) S328–S333
Fig. 2. Models of the unit cell (a) and primitive cell (b) of Mg3MnNi2 phase.
Table 1
Experimental and calculated structural parameters of Mg2Ni and Mg3MnNi2 phase.
Compound Lattice constants (Å) Atom site Fractional coordinates
Experimental Calculated Experimental Calculated
Mg2Ni (P6222) a 5.216(6) [14] 5.218 Mg(6f) 0.5 0 0.1149(2) [14] 0.5 0 0.1163c 13.20(6) 13.246 Mg(6i) 0.1635(6) 0.327 0 0.1642 0.3284 0
Ni(3b) 0 0 0.5 0 0 0.5Ni(3d) 0.5 0 0.5 0.5 0 0.5
Mg3MnNi2 (Fd-3m) a 11.564 [15] 11.549 Mg(48f) 0.3239 0.125 0.125 [15] 0.3245 0.125 0.125Mn(16d) 0.5 0.5 0.5 0.5 0.5 0.5Ni(32e) 0.70529 0.70529 0.70529 0.70534 0.70534 0.70534
The digits in parentheses for experimental lattice constants and fractional coordinates are standard deviations.
imation (GGA) exchange and correlation potential was used in thecalculations. The transition metals (Ni, Mn) were treated by spinpolarized calculation. Ultrasoft pseudopotentials [17] in recipro-cal space were used to replace the core electrons. We have testedthe dependence of the total energy on the energy cutoff valuesand the k-point sets. For example, for Mg2Ni unit cell, when theenergy cutoff is higher than 380 eV and the k-point sets are beyond6 × 6 × 2, the change in total energy is less than 1.64 meV/atom. Inconsideration of computational cost, all the geometry optimizationcalculations were performed with a 380 eV energy cutoff. The corre-sponding k-point sets are 6 × 6 × 2 for pure and Mn-doped Mg2Niunit cell and 4 × 4 × 4 for Mg3MnNi2 primitive cell, respectively.The convergence criteria were set at 5.0 × 10⁻⁶ eV/atom for energychange, 0.01 eV/Å for maximum force, 0.02 GPa for maximum stressand 5.0 × 10⁻⁴ A for maximum displacement.
The enthalpy of formation of a compound can be defined asthe difference between its total energy and the energies of itsconstituent elements in their stable states (referred to the elemen-tary substances). The zero-point energy (ZPE) contributions aresignificant in reactions where hydrogen molecules are adsorbedor desorbed [12]. The reactions investigated in this work do notinclude hydrogen. Thus, the ZPE contributions are not consideredin this study. Therefore, for a lattice containing x Mg atoms, y Mn
atoms and z Ni atoms, the enthalpy of formation is given by:
1f H = Etot(MgxMnyNiz) − [xE(Mg) + yE(Mn) + zE(Ni)] (1)
where 1fH and Etot refer to the enthalpy of formation and totalenergy of the compound, respectively. E(Mg), E(Mn) and E(Ni) arethe single atomic energies of the hcp-Mg, a-Mn and fcc-Ni in thesolid state, respectively. The enthalpy of formation can be usedto demonstrate whether and how much a compound structure isfavored over its constituent elements in thermodynamics.
3. Results and discussion
3.1. Enthalpy of formation
At first, calculations of both Mg2Ni and Mg3MnNi2 crystals wereperformed with full optimization of both the lattice parametersand the coordinates of all atoms based on the experimentally con-firmed structure. The calculated values are listed in Table 1 andcompared with the experimental data. This table shows that the dif-ference between calculated and experimental values is below 1.3%for all results, which indicates that present calculations are in goodagreement with the experimental results. As shown in Table 2, the
Table 2
Total energy and enthalpy of formation of calculated models.
Total energy (eV) Enthalpy of formation (eV)
Unit cell Primitive cell Unit cell Per Mg3MnNi2 formula unit Per atom
Mg2Ni −19817.2794 −3.2691 −0.1816Mg11MnMg(6f)Ni6 −19496.4273 −2.7273 −0.1515Mg11MnMg(6i)Ni6 −19496.4777 −2.7777 −0.1543Mg12MnNi(3b)Ni5 −19115.3243 −2.1059 −0.1170Mg12MnNi(3d)Ni5 −19115.3679 −2.1495 −0.1194Mg3MnNi2 −25141.5880 −1.0372 −0.1729Mg9Mn3Mg(6i)Ni6 −18854.7660 −0.5622 −0.0937
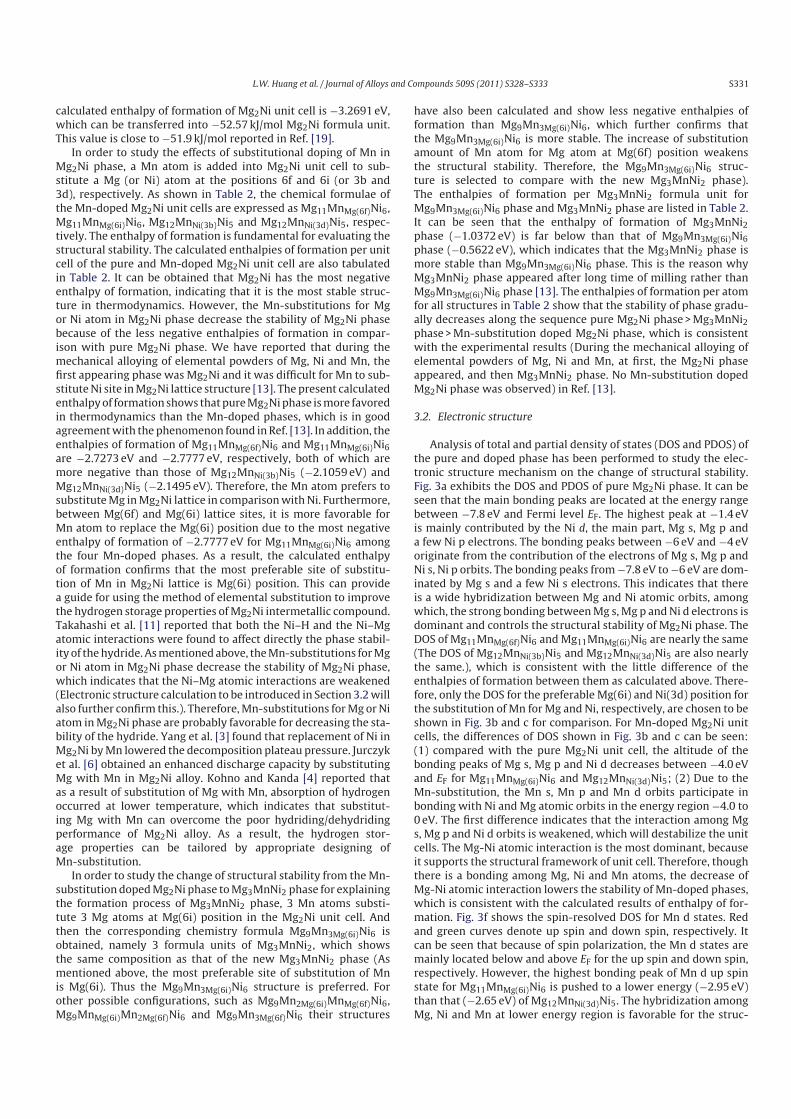
L.W. Huang et al. / Journal of Alloys and Compounds 509S (2011) S328–S333 S331
calculated enthalpy of formation of Mg2Ni unit cell is −3.2691 eV,which can be transferred into −52.57 kJ/mol Mg2Ni formula unit.This value is close to −51.9 kJ/mol reported in Ref. [19].
In order to study the effects of substitutional doping of Mn inMg2Ni phase, a Mn atom is added into Mg2Ni unit cell to sub-stitute a Mg (or Ni) atom at the positions 6f and 6i (or 3b and3d), respectively. As shown in Table 2, the chemical formulae ofthe Mn-doped Mg2Ni unit cells are expressed as Mg11MnMg(6f)Ni6,Mg11MnMg(6i)Ni6, Mg12MnNi(3b)Ni5 and Mg12MnNi(3d)Ni5, respec-tively. The enthalpy of formation is fundamental for evaluating thestructural stability. The calculated enthalpies of formation per unitcell of the pure and Mn-doped Mg2Ni unit cell are also tabulatedin Table 2. It can be obtained that Mg2Ni has the most negativeenthalpy of formation, indicating that it is the most stable struc-ture in thermodynamics. However, the Mn-substitutions for Mgor Ni atom in Mg2Ni phase decrease the stability of Mg2Ni phasebecause of the less negative enthalpies of formation in compar-ison with pure Mg2Ni phase. We have reported that during themechanical alloying of elemental powders of Mg, Ni and Mn, thefirst appearing phase was Mg2Ni and it was difficult for Mn to sub-stitute Ni site in Mg2Ni lattice structure [13]. The present calculatedenthalpy of formation shows that pure Mg2Ni phase is more favoredin thermodynamics than the Mn-doped phases, which is in goodagreement with the phenomenon found in Ref. [13]. In addition, theenthalpies of formation of Mg11MnMg(6f)Ni6 and Mg11MnMg(6i)Ni6are −2.7273 eV and −2.7777 eV, respectively, both of which aremore negative than those of Mg12MnNi(3b)Ni5 (−2.1059 eV) andMg12MnNi(3d)Ni5 (−2.1495 eV). Therefore, the Mn atom prefers tosubstitute Mg in Mg2Ni lattice in comparison with Ni. Furthermore,between Mg(6f) and Mg(6i) lattice sites, it is more favorable forMn atom to replace the Mg(6i) position due to the most negativeenthalpy of formation of −2.7777 eV for Mg11MnMg(6i)Ni6 amongthe four Mn-doped phases. As a result, the calculated enthalpyof formation confirms that the most preferable site of substitu-tion of Mn in Mg2Ni lattice is Mg(6i) position. This can providea guide for using the method of elemental substitution to improvethe hydrogen storage properties of Mg2Ni intermetallic compound.Takahashi et al. [11] reported that both the Ni–H and the Ni–Mgatomic interactions were found to affect directly the phase stabil-ity of the hydride. As mentioned above, the Mn-substitutions for Mgor Ni atom in Mg2Ni phase decrease the stability of Mg2Ni phase,which indicates that the Ni–Mg atomic interactions are weakened(Electronic structure calculation to be introduced in Section 3.2 willalso further confirm this.). Therefore, Mn-substitutions for Mg or Niatom in Mg2Ni phase are probably favorable for decreasing the sta-bility of the hydride. Yang et al. [3] found that replacement of Ni inMg2Ni by Mn lowered the decomposition plateau pressure. Jurczyket al. [6] obtained an enhanced discharge capacity by substitutingMg with Mn in Mg2Ni alloy. Kohno and Kanda [4] reported thatas a result of substitution of Mg with Mn, absorption of hydrogenoccurred at lower temperature, which indicates that substitut-ing Mg with Mn can overcome the poor hydriding/dehydridingperformance of Mg2Ni alloy. As a result, the hydrogen stor-age properties can be tailored by appropriate designing ofMn-substitution.
In order to study the change of structural stability from the Mn-substitution doped Mg2Ni phase to Mg3MnNi2 phase for explainingthe formation process of Mg3MnNi2 phase, 3 Mn atoms substi-tute 3 Mg atoms at Mg(6i) position in the Mg2Ni unit cell. Andthen the corresponding chemistry formula Mg9Mn3Mg(6i)Ni6 isobtained, namely 3 formula units of Mg3MnNi2, which showsthe same composition as that of the new Mg3MnNi2 phase (Asmentioned above, the most preferable site of substitution of Mnis Mg(6i). Thus the Mg9Mn3Mg(6i)Ni6 structure is preferred. Forother possible configurations, such as Mg9Mn2Mg(6i)MnMg(6f)Ni6,Mg9MnMg(6i)Mn2Mg(6f)Ni6 and Mg9Mn3Mg(6f)Ni6 their structures
have also been calculated and show less negative enthalpies offormation than Mg9Mn3Mg(6i)Ni6, which further confirms thatthe Mg9Mn3Mg(6i)Ni6 is more stable. The increase of substitutionamount of Mn atom for Mg atom at Mg(6f) position weakensthe structural stability. Therefore, the Mg9Mn3Mg(6i)Ni6 struc-ture is selected to compare with the new Mg3MnNi2 phase).The enthalpies of formation per Mg3MnNi2 formula unit forMg9Mn3Mg(6i)Ni6 phase and Mg3MnNi2 phase are listed in Table 2.It can be seen that the enthalpy of formation of Mg3MnNi2phase (−1.0372 eV) is far below than that of Mg9Mn3Mg(6i)Ni6phase (−0.5622 eV), which indicates that the Mg3MnNi2 phase ismore stable than Mg9Mn3Mg(6i)Ni6 phase. This is the reason whyMg3MnNi2 phase appeared after long time of milling rather thanMg9Mn3Mg(6i)Ni6 phase [13]. The enthalpies of formation per atomfor all structures in Table 2 show that the stability of phase gradu-ally decreases along the sequence pure Mg2Ni phase > Mg3MnNi2phase > Mn-substitution doped Mg2Ni phase, which is consistentwith the experimental results (During the mechanical alloying ofelemental powders of Mg, Ni and Mn, at first, the Mg2Ni phaseappeared, and then Mg3MnNi2 phase. No Mn-substitution dopedMg2Ni phase was observed) in Ref. [13].
3.2. Electronic structure
Analysis of total and partial density of states (DOS and PDOS) ofthe pure and doped phase has been performed to study the elec-tronic structure mechanism on the change of structural stability.Fig. 3a exhibits the DOS and PDOS of pure Mg2Ni phase. It can beseen that the main bonding peaks are located at the energy rangebetween −7.8 eV and Fermi level EF. The highest peak at −1.4 eVis mainly contributed by the Ni d, the main part, Mg s, Mg p anda few Ni p electrons. The bonding peaks between −6 eV and −4 eVoriginate from the contribution of the electrons of Mg s, Mg p andNi s, Ni p orbits. The bonding peaks from −7.8 eV to −6 eV are dom-inated by Mg s and a few Ni s electrons. This indicates that thereis a wide hybridization between Mg and Ni atomic orbits, amongwhich, the strong bonding between Mg s, Mg p and Ni d electrons isdominant and controls the structural stability of Mg2Ni phase. TheDOS of Mg11MnMg(6f)Ni6 and Mg11MnMg(6i)Ni6 are nearly the same(The DOS of Mg12MnNi(3b)Ni5 and Mg12MnNi(3d)Ni5 are also nearlythe same.), which is consistent with the little difference of theenthalpies of formation between them as calculated above. There-fore, only the DOS for the preferable Mg(6i) and Ni(3d) position forthe substitution of Mn for Mg and Ni, respectively, are chosen to beshown in Fig. 3b and c for comparison. For Mn-doped Mg2Ni unitcells, the differences of DOS shown in Fig. 3b and c can be seen:(1) compared with the pure Mg2Ni unit cell, the altitude of thebonding peaks of Mg s, Mg p and Ni d decreases between −4.0 eVand EF for Mg11MnMg(6i)Ni6 and Mg12MnNi(3d)Ni5; (2) Due to theMn-substitution, the Mn s, Mn p and Mn d orbits participate inbonding with Ni and Mg atomic orbits in the energy region −4.0 to0 eV. The first difference indicates that the interaction among Mgs, Mg p and Ni d orbits is weakened, which will destabilize the unitcells. The Mg-Ni atomic interaction is the most dominant, becauseit supports the structural framework of unit cell. Therefore, thoughthere is a bonding among Mg, Ni and Mn atoms, the decrease ofMg-Ni atomic interaction lowers the stability of Mn-doped phases,which is consistent with the calculated results of enthalpy of for-mation. Fig. 3f shows the spin-resolved DOS for Mn d states. Redand green curves denote up spin and down spin, respectively. Itcan be seen that because of spin polarization, the Mn d states aremainly located below and above EF for the up spin and down spin,respectively. However, the highest bonding peak of Mn d up spinstate for Mg11MnMg(6i)Ni6 is pushed to a lower energy (−2.95 eV)than that (−2.65 eV) of Mg12MnNi(3d)Ni5. The hybridization amongMg, Ni and Mn at lower energy region is favorable for the struc-
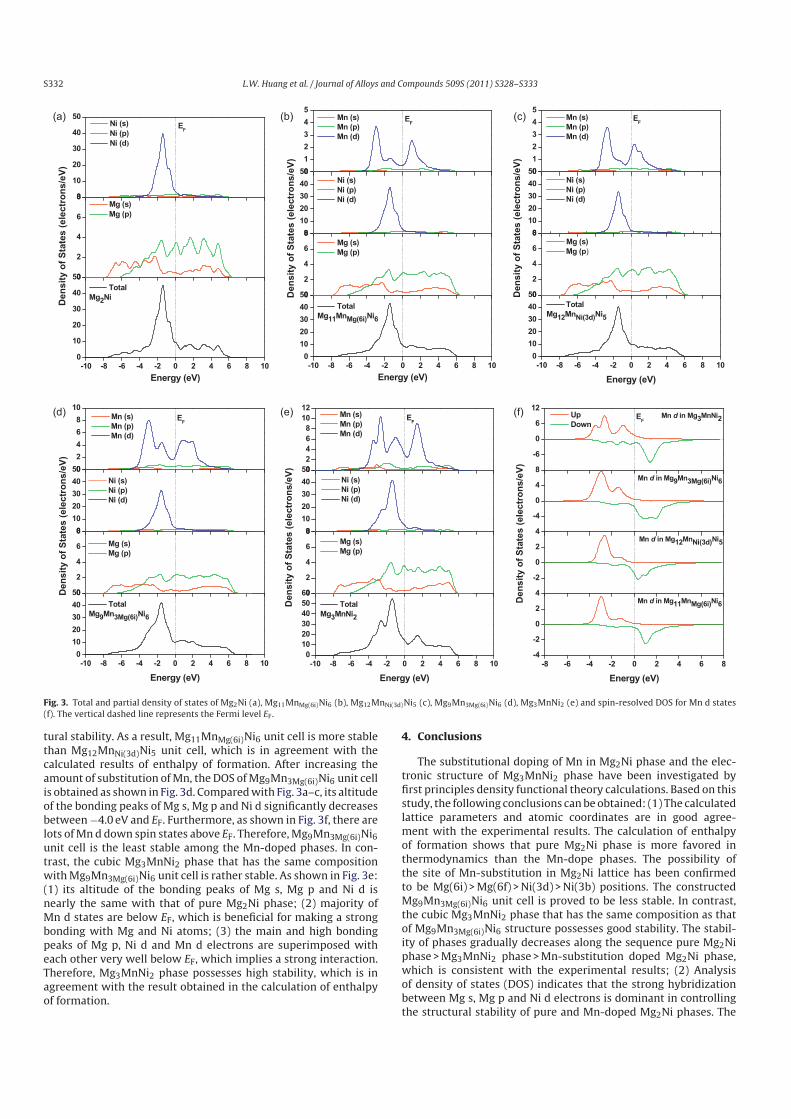
S332 L.W. Huang et al. / Journal of Alloys and Compounds 509S (2011) S328–S333
-10 -8 -6 -4 -2 0 2 4 6 8 100
10
20
30
40
500
2
4
6
80
10
20
30
40
50
Energy (eV)
Total
Mg2Ni
De
ns
ity o
f S
tate
s (
ele
ctr
on
s/e
V)
Mg (s)
Mg (p)
EF
Ni (s)
Ni (p)
Ni (d)
(a)
-10 -8 -6 -4 -2 0 2 4 6 8 100
10
20
30
40
500
2
4
6
80
10
20
30
40
500
1
2
3
4
5
Energy (eV)
Total
Mg11MnMg(6i)Ni6
De
ns
ity o
f S
tate
s (
ele
ctr
on
s/e
V)
Mg (s)
Mg (p)
Ni (s)
Ni (p)
Ni (d)
(b) EF
Mn (s)
Mn (p)
Mn (d)
-10 -8 -6 -4 -2 0 2 4 6 8 100
10
20
30
40
500
2
4
6
80
10
20
30
40
500
1
2
3
4
5
Energy (eV)
Total
Mg12MnNi(3d)Ni5
Den
sit
y o
f S
tate
s (
ele
ctr
on
s/e
V)
Mg (s)
Mg (p)
Ni (s)
Ni (p)
Ni (d)
(c)
(d) (e) (f)
EF
Mn (s)
Mn (p)
Mn (d)
-8 -6 -4 -2 0 2 4 6 8-4
-2
0
2
4
-2
0
2
4
-4
0
4
8
-6
0
6
12
Mn d in Mg11MnMg(6i)Ni6
Energy (eV)
De
ns
ity
of
Sta
tes
(e
lec
tro
ns
/eV
)
Mn d in Mg12MnNi(3d)Ni5
Mn d in Mg9Mn3Mg(6i)Ni6
Mn d in Mg3MnNi2EF
Up
Down
-10 -8 -6 -4 -2 0 2 4 6 8 100
10
20
30
40
50
600
2
4
6
80
10
20
30
40
500
2
4
6
8
10
12
Energy (eV)
Total
Mg3MnNi2
Mg (s)
Mg (p)
Ni (s)
Ni (p)
Ni (d)
EF
Den
sit
y o
f S
tate
s (
ele
ctr
on
s/e
V)
Mn (s)
Mn (p)
Mn (d)
-10 -8 -6 -4 -2 0 2 4 6 8 100
10
20
30
40
500
2
4
6
80
10
20
30
40
500
2
4
6
8
10
Energy (eV)
Total
Mg9Mn3Mg(6i)Ni6
De
ns
ity o
f S
tate
s (
ele
ctr
on
s/e
V)
Mg (s)
Mg (p)
Ni (s)
Ni (p)
Ni (d)
EF
Mn (s)
Mn (p)
Mn (d)
Fig. 3. Total and partial density of states of Mg2Ni (a), Mg11MnMg(6i)Ni6 (b), Mg12MnNi(3d)Ni5 (c), Mg9Mn3Mg(6i)Ni6 (d), Mg3MnNi2 (e) and spin-resolved DOS for Mn d states(f). The vertical dashed line represents the Fermi level EF .
tural stability. As a result, Mg11MnMg(6i)Ni6 unit cell is more stablethan Mg12MnNi(3d)Ni5 unit cell, which is in agreement with thecalculated results of enthalpy of formation. After increasing theamount of substitution of Mn, the DOS of Mg9Mn3Mg(6i)Ni6 unit cellis obtained as shown in Fig. 3d. Compared with Fig. 3a–c, its altitudeof the bonding peaks of Mg s, Mg p and Ni d significantly decreasesbetween −4.0 eV and EF. Furthermore, as shown in Fig. 3f, there arelots of Mn d down spin states above EF. Therefore, Mg9Mn3Mg(6i)Ni6unit cell is the least stable among the Mn-doped phases. In con-trast, the cubic Mg3MnNi2 phase that has the same compositionwith Mg9Mn3Mg(6i)Ni6 unit cell is rather stable. As shown in Fig. 3e:(1) its altitude of the bonding peaks of Mg s, Mg p and Ni d isnearly the same with that of pure Mg2Ni phase; (2) majority ofMn d states are below EF, which is beneficial for making a strongbonding with Mg and Ni atoms; (3) the main and high bondingpeaks of Mg p, Ni d and Mn d electrons are superimposed witheach other very well below EF, which implies a strong interaction.Therefore, Mg3MnNi2 phase possesses high stability, which is inagreement with the result obtained in the calculation of enthalpyof formation.
4. Conclusions
The substitutional doping of Mn in Mg2Ni phase and the elec-tronic structure of Mg3MnNi2 phase have been investigated byfirst principles density functional theory calculations. Based on thisstudy, the following conclusions can be obtained: (1) The calculatedlattice parameters and atomic coordinates are in good agree-ment with the experimental results. The calculation of enthalpyof formation shows that pure Mg2Ni phase is more favored inthermodynamics than the Mn-dope phases. The possibility ofthe site of Mn-substitution in Mg2Ni lattice has been confirmedto be Mg(6i) > Mg(6f) > Ni(3d) > Ni(3b) positions. The constructedMg9Mn3Mg(6i)Ni6 unit cell is proved to be less stable. In contrast,the cubic Mg3MnNi2 phase that has the same composition as thatof Mg9Mn3Mg(6i)Ni6 structure possesses good stability. The stabil-ity of phases gradually decreases along the sequence pure Mg2Niphase > Mg3MnNi2 phase > Mn-substitution doped Mg2Ni phase,which is consistent with the experimental results; (2) Analysisof density of states (DOS) indicates that the strong hybridizationbetween Mg s, Mg p and Ni d electrons is dominant in controllingthe structural stability of pure and Mn-doped Mg2Ni phases. The
L.W. Huang et al. / Journal of Alloys and Compounds 509S (2011) S328–S333 S333
Mn-substitution for Mg and Ni atoms in Mg2Ni unit cell weakensthe interaction between Mg s, Mg p and Ni d electrons. The Mn dstates in Mn-doped phases and Mg3MnNi2 phase are mainly locatedbelow and above EF for the up spin and down spin, respectively. Thebonding among Ni d and Mg s, Mg p electrons in Mg9Mn3Mg(6i)Ni6phase is significantly decreased. The cubic Mg3MnNi2 phase pos-sesses a strong hybridization between Mn and Mg, Ni atomic orbitsunder simultaneously retaining the strong bonding between Mgs, Mg p and Ni d electrons. The results of analysis of DOS are inagreement with that of calculation of enthalpies of formation.
Acknowledgments
This work is supported by China Scholarship Council (China)and UTBM (France) in the framework of UT-INSA project (2008).The authors would like to thank S. Guessasma from INRA Nantes(France) for providing the CASTEP programme and computationalassistance.
References
[1] L. Schlapbach, A. Züttel, Nature 414 (2001) 353–358.[2] J. Woo, K. Lee, J. Electrochem. Soc. 146 (1999) 819–823.
[3] H.B. Yang, H.T. Yuan, J.T. Ji, H. Sun, Z.X. Zhou, Y.S. Zhang, J. Alloys Compd.330–332 (2002) 640–644.
[4] T. Kohno, M. Kanda, J. Electrochem. Soc. 144 (1997) 2384–2388.[5] A. Gasiorowski, W. Iwasieczko, D. Skoryna, H. Drulis, M. Jurczyk, J. Alloys
Compd. 364 (2004) 283–288.[6] M. Jurczyk, L. Smardz, A. Szajek, Mater. Sci. Eng. B 108 (2004) 67–75.[7] G.N. García, J.P. Abriata, J.O. Sofo, Phys. Rev. B 59 (1999) 11746–11754.[8] J. Zhang, D.W. Zhou, L.P. He, P. Peng, J.S. Liu, J. Phys. Chem. Solids 70 (2009)
32–39.[9] W.R. Myers, L.W. Wang, T.J. Richardson, M.D. Rubin, J. Appl. Phys. 91 (2002)
4879–4885.[10] P.V. Jasen, E.A. Gonzalez, G. Brizuela, O.A. Nagel, G.A. González, A. Juan, Int. J.
Hydrogen Energy 32 (2007) 4943–4948.[11] Y. Takahashi, H. Yukawa, M. Morinaga, J. Alloys Compd. 242 (1996) 98–107.[12] M.J. van Setten, G.A. de Wijs, G. Brocks, Phys. Rev. B 76 (2007) 075125.[13] L.W. Huang, O. Elkedim, M. Jarzebski, R. Hamzaoui, M. Jurczyk, Int. J. Hydrogen
Energy 35 (2010) 6794–6803.[14] J. Schefer, P. Fischer, W. Hälg, F. Stucki, L. Schlapbach, J.J. Didisheim, K. Yvon,
A.F. Andresen, J. Less-Common Met 74 (1980) 65–73.[15] PDF No. 00-057-0388, International Centre for Data Diffraction.[16] S.J. Clark, M.D. Segall, C.J. Pickard, P.J. Hasnip, M.J. Probert, K. Refson, M.C. Payne,
Z. Kristallogr. 220 (2005) 567–570.[17] D. Vanderbilt, Phys. Rev. B 41 (1990) 7892–7895.[18] J.P. Perdew, K. Burke, M. Ernzerhof, Phys. Rev. Lett. 77 (1996) 3865–3868.[19] O. Kubaschewski, C.B. Alcock, Metallurgical Thermochemistry, in: International
Series on Materials Science and Technology, vol.24, 5th Ed., Pergamon Press,Oxford, 1979.
68
ANNEXE 5
Huang LW, Elkedim O, Nowak M, Jurczyk M, Chassagnon R, Meng DW.
Synergistic effects of multiwalled carbon nanotubes and Al on the
electrochemical hydrogen storage properties of Mg2Ni-type alloy prepared by
mechanical alloying. International Journal of Hydrogen Energy 2012 ; 37 :
1538-45.

Synergistic effects of multiwalled carbon nanotubes
and Al on the electrochemical hydrogen storage properties
of Mg2Ni-type alloy prepared by mechanical alloying
L.W. Huang a,b,**, O. Elkedim b,*, M. Nowak c, M. Jurczyk c, R. Chassagnon d, D.W. Meng a,***aFaculty of Materials Science and Chemical Engineering, China University of Geosciences, Wuhan 430074, Chinab FEMTO-ST, MN2S, Universite de Technologie de Belfort-Montbeliard, Site de Sevenans, 90010 Belfort cedex, Francec Institute of Materials Science and Engineering, Poznan University of Technology, Sklodowska-Curie 5 Sq., 60-965 Poznan, Polandd Laboratoire Interdisciplinaire Carnot de Bourgogne, UMR 5209 CNRS, Universite de Bourgogne 9 Av. A. Savary, BP 47870, F-21078 Dijon,
France
a r t i c l e i n f o
Article history:
Received 3 September 2011
Received in revised form
7 October 2011
Accepted 16 October 2011
Available online 13 November 2011
Keywords:
Mg2Ni-type alloy
Mechanical alloying
Multiwalled carbon nanotubes
Al substitution
Electrochemical hydrogen storage
properties
a b s t r a c t
Mg2!xAlxNi (x ¼ 0, 0.25) electrode alloys with and without multiwalled carbon nanotubes
(MWCNTs) have been prepared by mechanical alloying (MA) under argon atmosphere at
room temperature using a planetary high-energy ball mill. The microstructures of
synthesized alloys are characterized by XRD, SEM and TEM. XRD analysis results indicate
that Al substitution results in the formation of AlNi-type solid solution that can intersti-
tially dissolve hydrogen atoms. In contrast, the addition of MWCNTs hardly affects the XRD
patterns. SEM observations show that after co-milling with 5 wt. % MWCNTs, the particle
sizes of both Mg2Ni and Mg1.75Al0.25Ni milled alloys are decreased explicitly. The TEM
images reveal that ball milling is a good method to cut long MWCNTs into short ones.
These MWCNTs aggregate along the boundaries and surfaces of milled alloy particles and
play a role of lubricant to weaken the adhesion of alloy particles. The majority of MWCNTs
retain their tubular structure after ball milling except a few MWCNTs whose tubular
structure is destroyed. Electrochemical measurements indicate that all milled alloys have
excellent activation properties. The Mg1.75Al0.25Ni-MWCNTs composite shows the highest
discharge capacity due to the synergistic effects of MWCNTs and Al on the electrochemical
hydrogen storage properties of Mg2Ni-type alloy. However, the improvement on the elec-
trode cycle stability by adding MWCNTs is unsatisfactory.
Copyright ª 2011, Hydrogen Energy Publications, LLC. Published by Elsevier Ltd. All rights
reserved.
1. Introduction
Mg-based hydrogen storage alloys have attracted great
attention as negative electrode materials for nickel-metal
hydride (Ni-MH) batteries because of their low cost, light
weight, rich mineral resources and high theoretical discharge
capacity [1,2]. For example, theoretical gravimetric storage
hydrogen capacity of Mg2Ni alloy, assuming the formation of
Mg2NiH4, is 3.6 mass% (equivalent to 999 mAh/g for the
discharge capacity), which is approximately 2.7 times as large
as that of LaNi5. However, the practical applications of Mg2Ni-
type alloy for Ni-MH batteries are full of challenges because of
* Corresponding author.** Corresponding author. Faculty of Materials Science and Chemical Engineering, China University of Geosciences, Wuhan 430074, China.*** Corresponding author.
E-mail addresses: [email protected] (L.W. Huang), [email protected] (O. Elkedim), [email protected] (D.W. Meng).
Available online at www.sciencedirect.com
journal homepage: www.elsevier .com/locate/he
i n t e rn a t i o n a l j o u r n a l o f h y d r o g e n en e r g y 3 7 ( 2 0 1 2 ) 1 5 3 8e1 5 4 5
0360-3199/$ e see front matter Copyright ª 2011, Hydrogen Energy Publications, LLC. Published by Elsevier Ltd. All rights reserved.doi:10.1016/j.ijhydene.2011.10.045
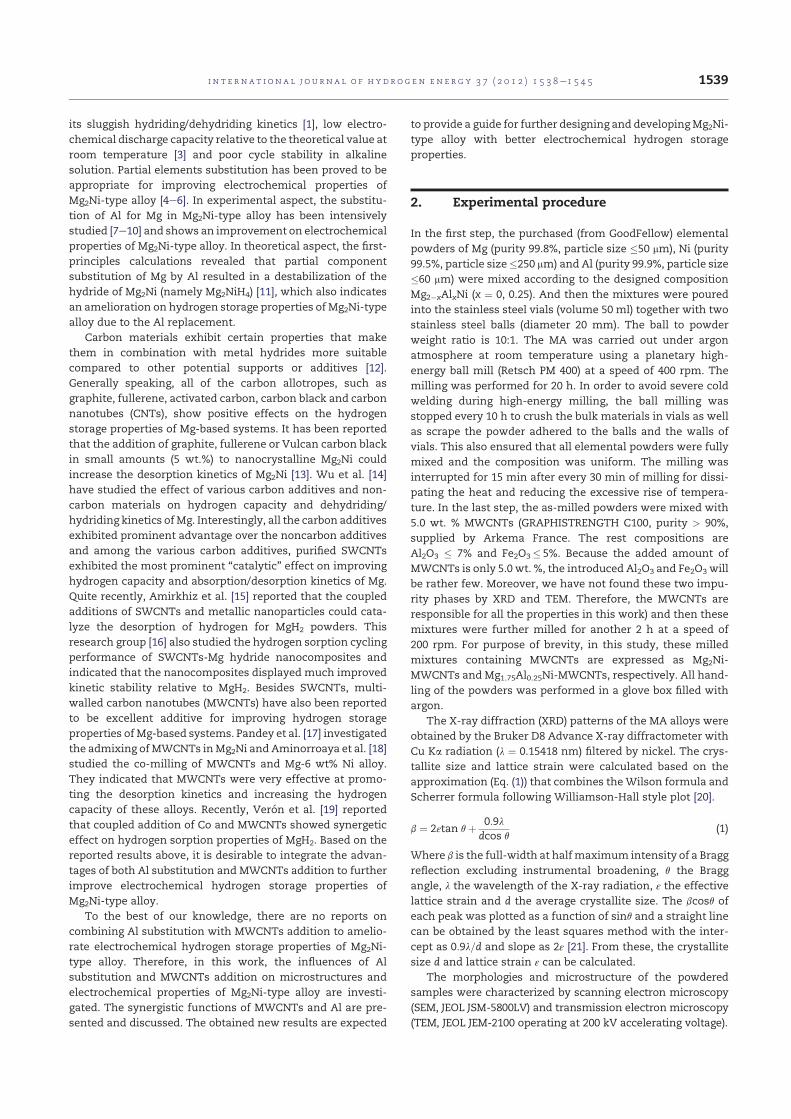
its sluggish hydriding/dehydriding kinetics [1], low electro-
chemical discharge capacity relative to the theoretical value at
room temperature [3] and poor cycle stability in alkaline
solution. Partial elements substitution has been proved to be
appropriate for improving electrochemical properties of
Mg2Ni-type alloy [4e6]. In experimental aspect, the substitu-
tion of Al for Mg in Mg2Ni-type alloy has been intensively
studied [7e10] and shows an improvement on electrochemical
properties of Mg2Ni-type alloy. In theoretical aspect, the first-
principles calculations revealed that partial component
substitution of Mg by Al resulted in a destabilization of the
hydride of Mg2Ni (namely Mg2NiH4) [11], which also indicates
an amelioration on hydrogen storage properties of Mg2Ni-type
alloy due to the Al replacement.
Carbon materials exhibit certain properties that make
them in combination with metal hydrides more suitable
compared to other potential supports or additives [12].
Generally speaking, all of the carbon allotropes, such as
graphite, fullerene, activated carbon, carbon black and carbon
nanotubes (CNTs), show positive effects on the hydrogen
storage properties of Mg-based systems. It has been reported
that the addition of graphite, fullerene or Vulcan carbon black
in small amounts (5 wt.%) to nanocrystalline Mg2Ni could
increase the desorption kinetics of Mg2Ni [13]. Wu et al. [14]
have studied the effect of various carbon additives and non-
carbon materials on hydrogen capacity and dehydriding/
hydriding kinetics ofMg. Interestingly, all the carbon additives
exhibited prominent advantage over the noncarbon additives
and among the various carbon additives, purified SWCNTs
exhibited the most prominent “catalytic” effect on improving
hydrogen capacity and absorption/desorption kinetics of Mg.
Quite recently, Amirkhiz et al. [15] reported that the coupled
additions of SWCNTs and metallic nanoparticles could cata-
lyze the desorption of hydrogen for MgH2 powders. This
research group [16] also studied the hydrogen sorption cycling
performance of SWCNTs-Mg hydride nanocomposites and
indicated that the nanocomposites displayed much improved
kinetic stability relative to MgH2. Besides SWCNTs, multi-
walled carbon nanotubes (MWCNTs) have also been reported
to be excellent additive for improving hydrogen storage
properties of Mg-based systems. Pandey et al. [17] investigated
the admixing ofMWCNTs inMg2Ni and Aminorroaya et al. [18]
studied the co-milling of MWCNTs and Mg-6 wt% Ni alloy.
They indicated that MWCNTs were very effective at promo-
ting the desorption kinetics and increasing the hydrogen
capacity of these alloys. Recently, Veron et al. [19] reported
that coupled addition of Co and MWCNTs showed synergetic
effect on hydrogen sorption properties of MgH2. Based on the
reported results above, it is desirable to integrate the advan-
tages of both Al substitution and MWCNTs addition to further
improve electrochemical hydrogen storage properties of
Mg2Ni-type alloy.
To the best of our knowledge, there are no reports on
combining Al substitution with MWCNTs addition to amelio-
rate electrochemical hydrogen storage properties of Mg2Ni-
type alloy. Therefore, in this work, the influences of Al
substitution and MWCNTs addition on microstructures and
electrochemical properties of Mg2Ni-type alloy are investi-
gated. The synergistic functions of MWCNTs and Al are pre-
sented and discussed. The obtained new results are expected
to provide a guide for further designing and developingMg2Ni-
type alloy with better electrochemical hydrogen storage
properties.
2. Experimental procedure
In the first step, the purchased (from GoodFellow) elemental
powders of Mg (purity 99.8%, particle size #50 mm), Ni (purity
99.5%, particle size#250 mm) and Al (purity 99.9%, particle size
#60 mm) were mixed according to the designed composition
Mg2!xAlxNi (x ¼ 0, 0.25). And then the mixtures were poured
into the stainless steel vials (volume 50 ml) together with two
stainless steel balls (diameter 20 mm). The ball to powder
weight ratio is 10:1. The MA was carried out under argon
atmosphere at room temperature using a planetary high-
energy ball mill (Retsch PM 400) at a speed of 400 rpm. The
milling was performed for 20 h. In order to avoid severe cold
welding during high-energy milling, the ball milling was
stopped every 10 h to crush the bulk materials in vials as well
as scrape the powder adhered to the balls and the walls of
vials. This also ensured that all elemental powders were fully
mixed and the composition was uniform. The milling was
interrupted for 15 min after every 30 min of milling for dissi-
pating the heat and reducing the excessive rise of tempera-
ture. In the last step, the as-milled powders were mixed with
5.0 wt. % MWCNTs (GRAPHISTRENGTH C100, purity > 90%,
supplied by Arkema France. The rest compositions are
Al2O3 # 7% and Fe2O3# 5%. Because the added amount of
MWCNTs is only 5.0 wt. %, the introduced Al2O3 and Fe2O3 will
be rather few. Moreover, we have not found these two impu-
rity phases by XRD and TEM. Therefore, the MWCNTs are
responsible for all the properties in this work) and then these
mixtures were further milled for another 2 h at a speed of
200 rpm. For purpose of brevity, in this study, these milled
mixtures containing MWCNTs are expressed as Mg2Ni-
MWCNTs and Mg1.75Al0.25Ni-MWCNTs, respectively. All hand-
ling of the powders was performed in a glove box filled with
argon.
The X-ray diffraction (XRD) patterns of the MA alloys were
obtained by the Bruker D8 Advance X-ray diffractometer with
Cu Ka radiation (l ¼ 0.15418 nm) filtered by nickel. The crys-
tallite size and lattice strain were calculated based on the
approximation (Eq. (1)) that combines theWilson formula and
Scherrer formula following Williamson-Hall style plot [20].
b ¼ 2εtan qþ0:9l
dcos q(1)
Where b is the full-width at halfmaximum intensity of a Bragg
reflection excluding instrumental broadening, q the Bragg
angle, l the wavelength of the X-ray radiation, ε the effective
lattice strain and d the average crystallite size. The bcosq of
each peak was plotted as a function of sinq and a straight line
can be obtained by the least squares method with the inter-
cept as 0:9l=d and slope as 2ε [21]. From these, the crystallite
size d and lattice strain ε can be calculated.
The morphologies and microstructure of the powdered
samples were characterized by scanning electron microscopy
(SEM, JEOL JSM-5800LV) and transmission electron microscopy
(TEM, JEOL JEM-2100 operating at 200 kV accelerating voltage).
i n t e r n a t i o n a l j o u r n a l o f h y d r o g e n en e r g y 3 7 ( 2 0 1 2 ) 1 5 3 8e1 5 4 5 1539
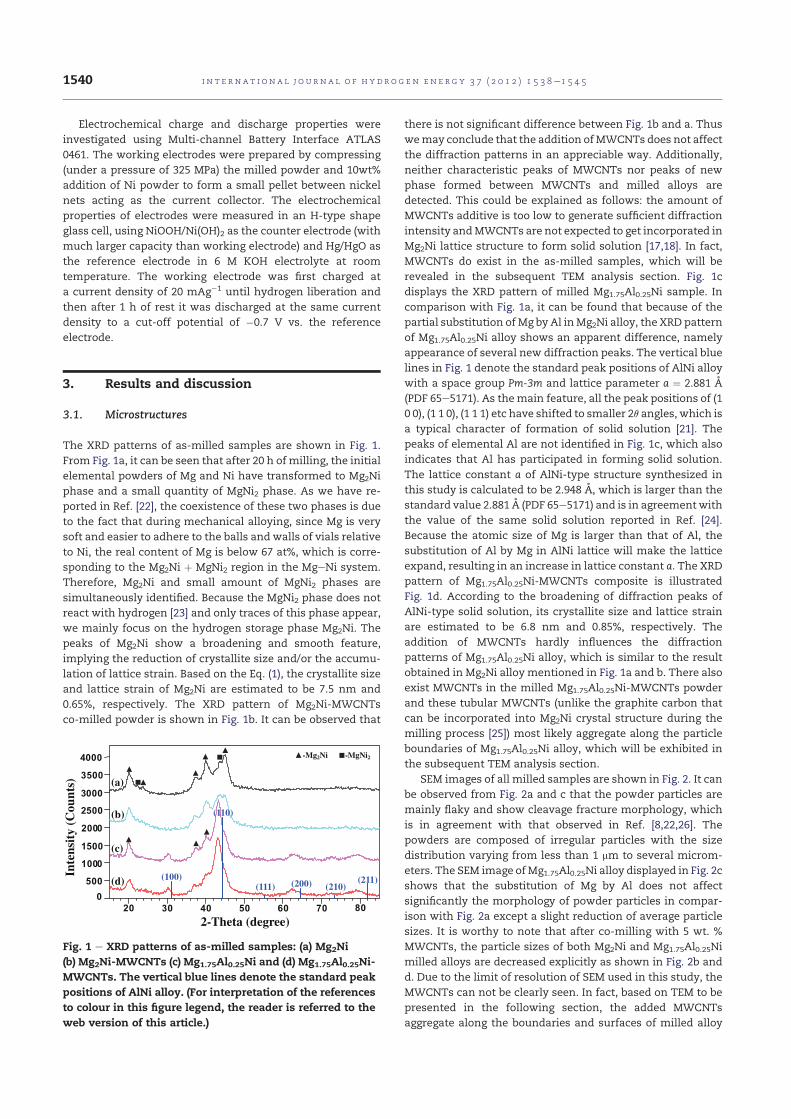
Electrochemical charge and discharge properties were
investigated using Multi-channel Battery Interface ATLAS
0461. The working electrodes were prepared by compressing
(under a pressure of 325 MPa) the milled powder and 10wt%
addition of Ni powder to form a small pellet between nickel
nets acting as the current collector. The electrochemical
properties of electrodes were measured in an H-type shape
glass cell, using NiOOH/Ni(OH)2 as the counter electrode (with
much larger capacity than working electrode) and Hg/HgO as
the reference electrode in 6 M KOH electrolyte at room
temperature. The working electrode was first charged at
a current density of 20 mAg!1 until hydrogen liberation and
then after 1 h of rest it was discharged at the same current
density to a cut-off potential of !0.7 V vs. the reference
electrode.
3. Results and discussion
3.1. Microstructures
The XRD patterns of as-milled samples are shown in Fig. 1.
From Fig. 1a, it can be seen that after 20 h of milling, the initial
elemental powders of Mg and Ni have transformed to Mg2Ni
phase and a small quantity of MgNi2 phase. As we have re-
ported in Ref. [22], the coexistence of these two phases is due
to the fact that during mechanical alloying, since Mg is very
soft and easier to adhere to the balls and walls of vials relative
to Ni, the real content of Mg is below 67 at%, which is corre-
sponding to the Mg2Ni þ MgNi2 region in the MgeNi system.
Therefore, Mg2Ni and small amount of MgNi2 phases are
simultaneously identified. Because the MgNi2 phase does not
react with hydrogen [23] and only traces of this phase appear,
we mainly focus on the hydrogen storage phase Mg2Ni. The
peaks of Mg2Ni show a broadening and smooth feature,
implying the reduction of crystallite size and/or the accumu-
lation of lattice strain. Based on the Eq. (1), the crystallite size
and lattice strain of Mg2Ni are estimated to be 7.5 nm and
0.65%, respectively. The XRD pattern of Mg2Ni-MWCNTs
co-milled powder is shown in Fig. 1b. It can be observed that
there is not significant difference between Fig. 1b and a. Thus
wemay conclude that the addition ofMWCNTs does not affect
the diffraction patterns in an appreciable way. Additionally,
neither characteristic peaks of MWCNTs nor peaks of new
phase formed between MWCNTs and milled alloys are
detected. This could be explained as follows: the amount of
MWCNTs additive is too low to generate sufficient diffraction
intensity andMWCNTs are not expected to get incorporated in
Mg2Ni lattice structure to form solid solution [17,18]. In fact,
MWCNTs do exist in the as-milled samples, which will be
revealed in the subsequent TEM analysis section. Fig. 1c
displays the XRD pattern of milled Mg1.75Al0.25Ni sample. In
comparison with Fig. 1a, it can be found that because of the
partial substitution of Mg by Al inMg2Ni alloy, the XRD pattern
of Mg1.75Al0.25Ni alloy shows an apparent difference, namely
appearance of several new diffraction peaks. The vertical blue
lines in Fig. 1 denote the standard peak positions of AlNi alloy
with a space group Pm-3m and lattice parameter a ¼ 2.881 A
(PDF 65e5171). As themain feature, all the peak positions of (1
0 0), (1 1 0), (1 1 1) etc have shifted to smaller 2q angles, which is
a typical character of formation of solid solution [21]. The
peaks of elemental Al are not identified in Fig. 1c, which also
indicates that Al has participated in forming solid solution.
The lattice constant a of AlNi-type structure synthesized in
this study is calculated to be 2.948 A, which is larger than the
standard value 2.881 A (PDF 65e5171) and is in agreementwith
the value of the same solid solution reported in Ref. [24].
Because the atomic size of Mg is larger than that of Al, the
substitution of Al by Mg in AlNi lattice will make the lattice
expand, resulting in an increase in lattice constant a. The XRD
pattern of Mg1.75Al0.25Ni-MWCNTs composite is illustrated
Fig. 1d. According to the broadening of diffraction peaks of
AlNi-type solid solution, its crystallite size and lattice strain
are estimated to be 6.8 nm and 0.85%, respectively. The
addition of MWCNTs hardly influences the diffraction
patterns of Mg1.75Al0.25Ni alloy, which is similar to the result
obtained in Mg2Ni alloy mentioned in Fig. 1a and b. There also
exist MWCNTs in the milled Mg1.75Al0.25Ni-MWCNTs powder
and these tubular MWCNTs (unlike the graphite carbon that
can be incorporated into Mg2Ni crystal structure during the
milling process [25]) most likely aggregate along the particle
boundaries of Mg1.75Al0.25Ni alloy, which will be exhibited in
the subsequent TEM analysis section.
SEM images of all milled samples are shown in Fig. 2. It can
be observed from Fig. 2a and c that the powder particles are
mainly flaky and show cleavage fracture morphology, which
is in agreement with that observed in Ref. [8,22,26]. The
powders are composed of irregular particles with the size
distribution varying from less than 1 mm to several microm-
eters. The SEM image ofMg1.75Al0.25Ni alloy displayed in Fig. 2c
shows that the substitution of Mg by Al does not affect
significantly the morphology of powder particles in compar-
ison with Fig. 2a except a slight reduction of average particle
sizes. It is worthy to note that after co-milling with 5 wt. %
MWCNTs, the particle sizes of both Mg2Ni and Mg1.75Al0.25Ni
milled alloys are decreased explicitly as shown in Fig. 2b and
d. Due to the limit of resolution of SEM used in this study, the
MWCNTs can not be clearly seen. In fact, based on TEM to be
presented in the following section, the added MWCNTs
aggregate along the boundaries and surfaces of milled alloy
(100)
(110)
20 30 40 50 60 70 80
0
500
1000
1500
2000
2500
3000
3500
4000
(a)
-Mg2Ni -MgNi2
(111) (200) (210)(211)
(b)
(c)
(d)
Inte
nsi
ty (
Co
un
ts)
2-Theta (degree)
Fig. 1 e XRD patterns of as-milled samples: (a) Mg2Ni
(b) Mg2Ni-MWCNTs (c) Mg1.75Al0.25Ni and (d) Mg1.75Al0.25Ni-
MWCNTs. The vertical blue lines denote the standard peak
positions of AlNi alloy. (For interpretation of the references
to colour in this figure legend, the reader is referred to the
web version of this article.)
i n t e rn a t i o n a l j o u r n a l o f h y d r o g e n en e r g y 3 7 ( 2 0 1 2 ) 1 5 3 8e1 5 4 51540
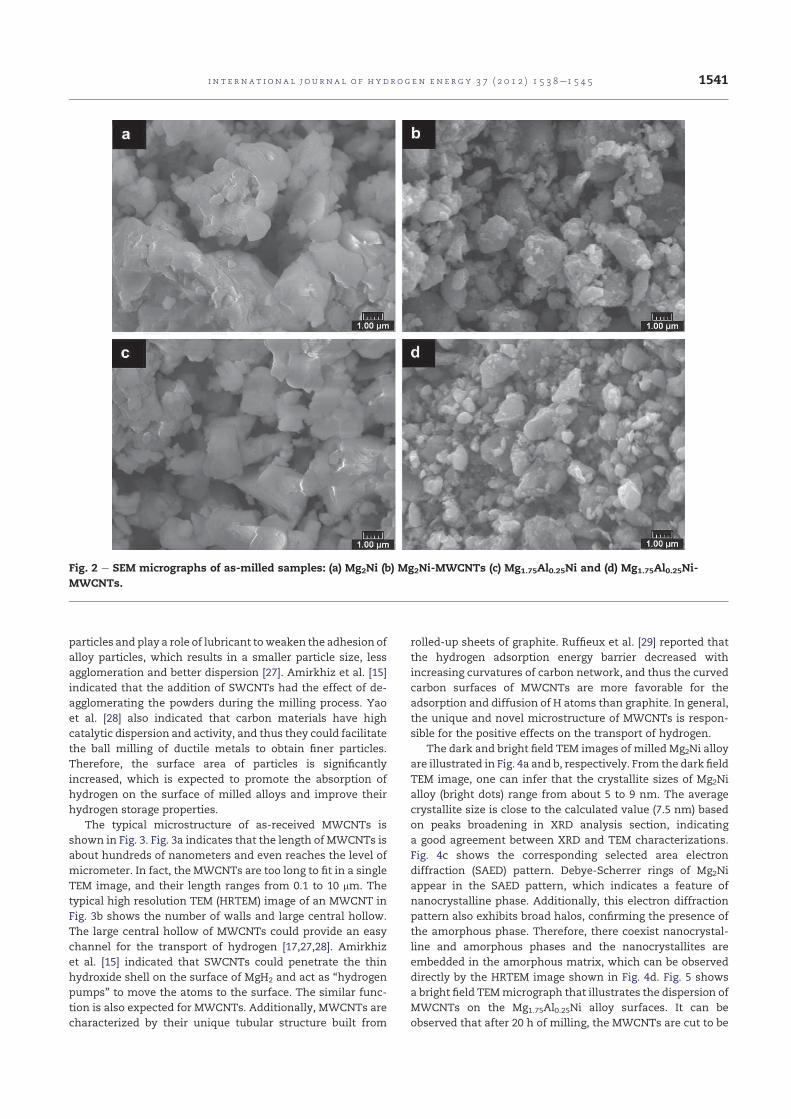
particles and play a role of lubricant toweaken the adhesion of
alloy particles, which results in a smaller particle size, less
agglomeration and better dispersion [27]. Amirkhiz et al. [15]
indicated that the addition of SWCNTs had the effect of de-
agglomerating the powders during the milling process. Yao
et al. [28] also indicated that carbon materials have high
catalytic dispersion and activity, and thus they could facilitate
the ball milling of ductile metals to obtain finer particles.
Therefore, the surface area of particles is significantly
increased, which is expected to promote the absorption of
hydrogen on the surface of milled alloys and improve their
hydrogen storage properties.
The typical microstructure of as-received MWCNTs is
shown in Fig. 3. Fig. 3a indicates that the length of MWCNTs is
about hundreds of nanometers and even reaches the level of
micrometer. In fact, the MWCNTs are too long to fit in a single
TEM image, and their length ranges from 0.1 to 10 mm. The
typical high resolution TEM (HRTEM) image of an MWCNT in
Fig. 3b shows the number of walls and large central hollow.
The large central hollow of MWCNTs could provide an easy
channel for the transport of hydrogen [17,27,28]. Amirkhiz
et al. [15] indicated that SWCNTs could penetrate the thin
hydroxide shell on the surface of MgH2 and act as “hydrogen
pumps” to move the atoms to the surface. The similar func-
tion is also expected for MWCNTs. Additionally, MWCNTs are
characterized by their unique tubular structure built from
rolled-up sheets of graphite. Ruffieux et al. [29] reported that
the hydrogen adsorption energy barrier decreased with
increasing curvatures of carbon network, and thus the curved
carbon surfaces of MWCNTs are more favorable for the
adsorption and diffusion of H atoms than graphite. In general,
the unique and novel microstructure of MWCNTs is respon-
sible for the positive effects on the transport of hydrogen.
The dark and bright field TEM images of milled Mg2Ni alloy
are illustrated in Fig. 4a and b, respectively. From the dark field
TEM image, one can infer that the crystallite sizes of Mg2Ni
alloy (bright dots) range from about 5 to 9 nm. The average
crystallite size is close to the calculated value (7.5 nm) based
on peaks broadening in XRD analysis section, indicating
a good agreement between XRD and TEM characterizations.
Fig. 4c shows the corresponding selected area electron
diffraction (SAED) pattern. Debye-Scherrer rings of Mg2Ni
appear in the SAED pattern, which indicates a feature of
nanocrystalline phase. Additionally, this electron diffraction
pattern also exhibits broad halos, confirming the presence of
the amorphous phase. Therefore, there coexist nanocrystal-
line and amorphous phases and the nanocrystallites are
embedded in the amorphous matrix, which can be observed
directly by the HRTEM image shown in Fig. 4d. Fig. 5 shows
a bright field TEMmicrograph that illustrates the dispersion of
MWCNTs on the Mg1.75Al0.25Ni alloy surfaces. It can be
observed that after 20 h of milling, the MWCNTs are cut to be
Fig. 2 e SEM micrographs of as-milled samples: (a) Mg2Ni (b) Mg2Ni-MWCNTs (c) Mg1.75Al0.25Ni and (d) Mg1.75Al0.25Ni-
MWCNTs.
i n t e r n a t i o n a l j o u r n a l o f h y d r o g e n en e r g y 3 7 ( 2 0 1 2 ) 1 5 3 8e1 5 4 5 1541
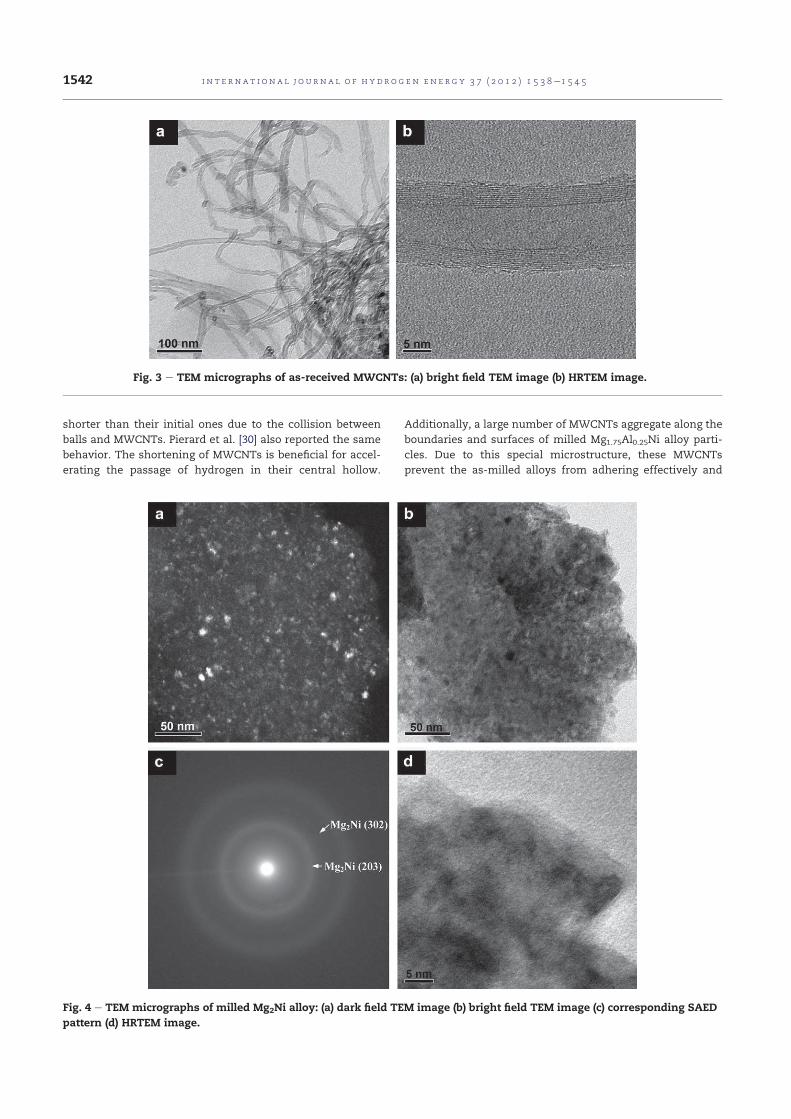
shorter than their initial ones due to the collision between
balls and MWCNTs. Pierard et al. [30] also reported the same
behavior. The shortening of MWCNTs is beneficial for accel-
erating the passage of hydrogen in their central hollow.
Additionally, a large number of MWCNTs aggregate along the
boundaries and surfaces of milled Mg1.75Al0.25Ni alloy parti-
cles. Due to this special microstructure, these MWCNTs
prevent the as-milled alloys from adhering effectively and
Fig. 3 e TEM micrographs of as-received MWCNTs: (a) bright field TEM image (b) HRTEM image.
Fig. 4 e TEM micrographs of milled Mg2Ni alloy: (a) dark field TEM image (b) bright field TEM image (c) corresponding SAED
pattern (d) HRTEM image.
i n t e rn a t i o n a l j o u r n a l o f h y d r o g e n en e r g y 3 7 ( 2 0 1 2 ) 1 5 3 8e1 5 4 51542
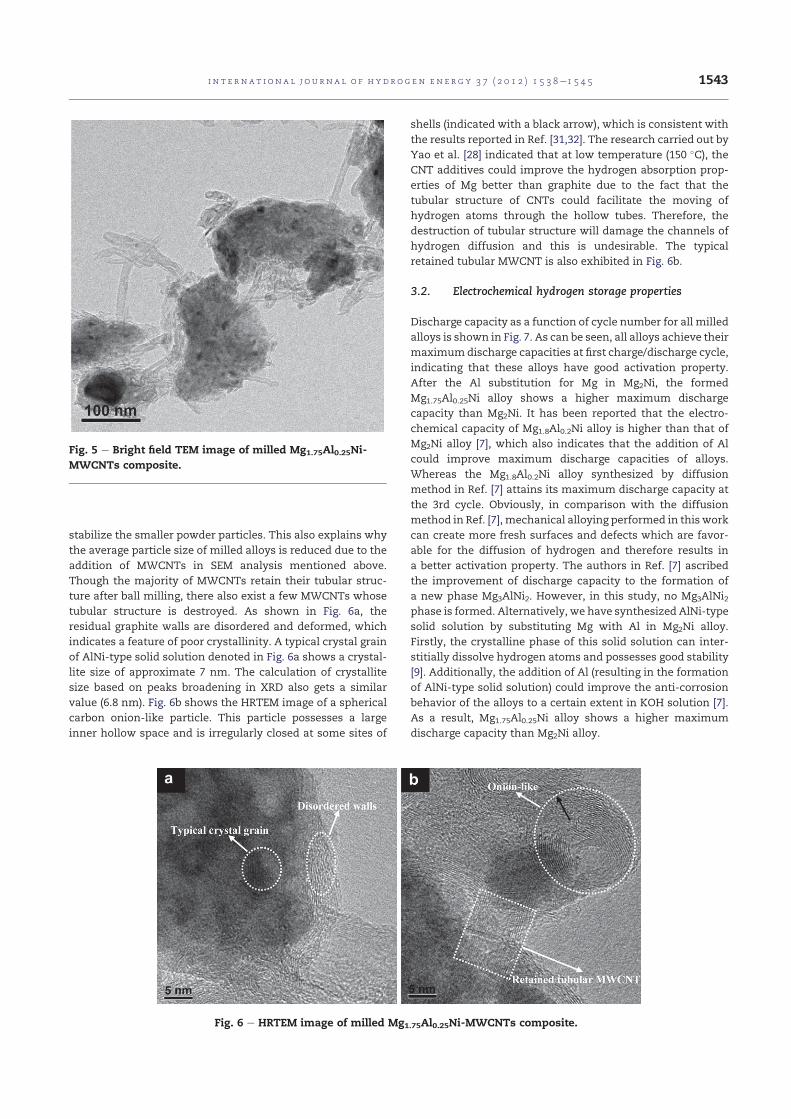
stabilize the smaller powder particles. This also explains why
the average particle size of milled alloys is reduced due to the
addition of MWCNTs in SEM analysis mentioned above.
Though the majority of MWCNTs retain their tubular struc-
ture after ball milling, there also exist a few MWCNTs whose
tubular structure is destroyed. As shown in Fig. 6a, the
residual graphite walls are disordered and deformed, which
indicates a feature of poor crystallinity. A typical crystal grain
of AlNi-type solid solution denoted in Fig. 6a shows a crystal-
lite size of approximate 7 nm. The calculation of crystallite
size based on peaks broadening in XRD also gets a similar
value (6.8 nm). Fig. 6b shows the HRTEM image of a spherical
carbon onion-like particle. This particle possesses a large
inner hollow space and is irregularly closed at some sites of
shells (indicated with a black arrow), which is consistent with
the results reported in Ref. [31,32]. The research carried out by
Yao et al. [28] indicated that at low temperature (150 %C), the
CNT additives could improve the hydrogen absorption prop-
erties of Mg better than graphite due to the fact that the
tubular structure of CNTs could facilitate the moving of
hydrogen atoms through the hollow tubes. Therefore, the
destruction of tubular structure will damage the channels of
hydrogen diffusion and this is undesirable. The typical
retained tubular MWCNT is also exhibited in Fig. 6b.
3.2. Electrochemical hydrogen storage properties
Discharge capacity as a function of cycle number for all milled
alloys is shown in Fig. 7. As can be seen, all alloys achieve their
maximumdischarge capacities at first charge/discharge cycle,
indicating that these alloys have good activation property.
After the Al substitution for Mg in Mg2Ni, the formed
Mg1.75Al0.25Ni alloy shows a higher maximum discharge
capacity than Mg2Ni. It has been reported that the electro-
chemical capacity of Mg1.8Al0.2Ni alloy is higher than that of
Mg2Ni alloy [7], which also indicates that the addition of Al
could improve maximum discharge capacities of alloys.
Whereas the Mg1.8Al0.2Ni alloy synthesized by diffusion
method in Ref. [7] attains its maximum discharge capacity at
the 3rd cycle. Obviously, in comparison with the diffusion
method in Ref. [7], mechanical alloying performed in thiswork
can create more fresh surfaces and defects which are favor-
able for the diffusion of hydrogen and therefore results in
a better activation property. The authors in Ref. [7] ascribed
the improvement of discharge capacity to the formation of
a new phase Mg3AlNi2. However, in this study, no Mg3AlNi2phase is formed. Alternatively, we have synthesized AlNi-type
solid solution by substituting Mg with Al in Mg2Ni alloy.
Firstly, the crystalline phase of this solid solution can inter-
stitially dissolve hydrogen atoms and possesses good stability
[9]. Additionally, the addition of Al (resulting in the formation
of AlNi-type solid solution) could improve the anti-corrosion
behavior of the alloys to a certain extent in KOH solution [7].
As a result, Mg1.75Al0.25Ni alloy shows a higher maximum
discharge capacity than Mg2Ni alloy.
Fig. 5 e Bright field TEM image of milled Mg1.75Al0.25Ni-
MWCNTs composite.
Fig. 6 e HRTEM image of milled Mg1.75Al0.25Ni-MWCNTs composite.
i n t e r n a t i o n a l j o u r n a l o f h y d r o g e n en e r g y 3 7 ( 2 0 1 2 ) 1 5 3 8e1 5 4 5 1543
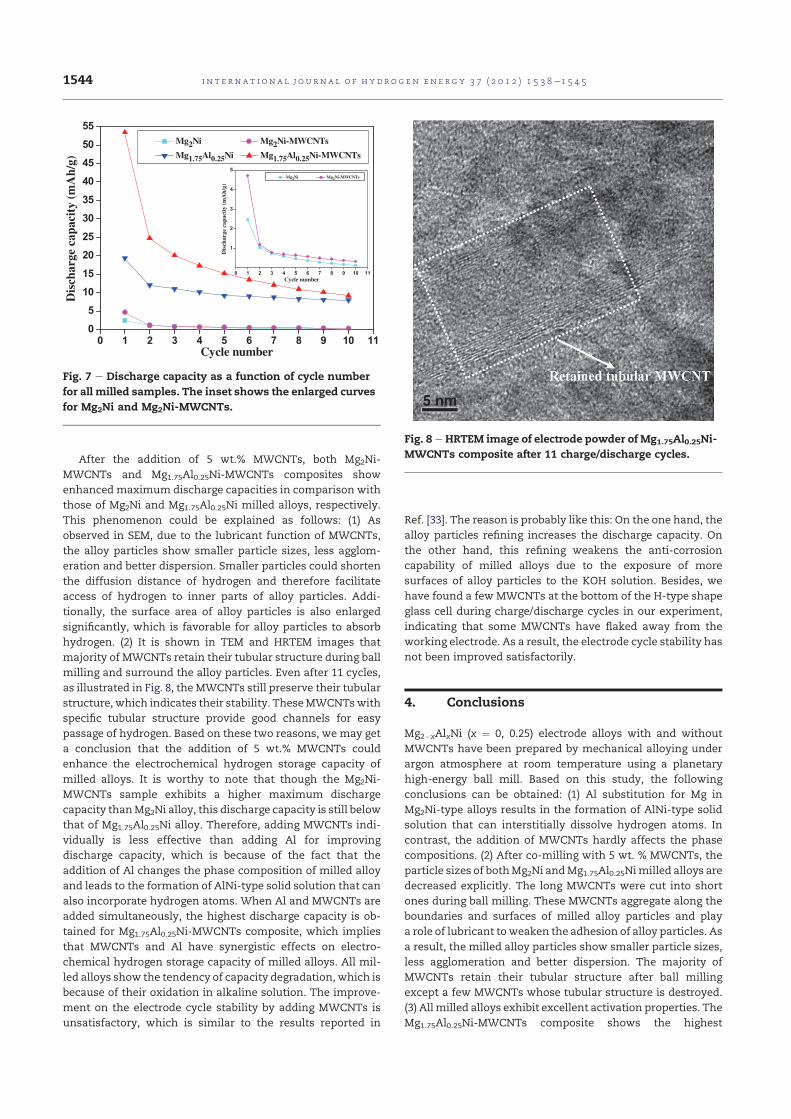
After the addition of 5 wt.% MWCNTs, both Mg2Ni-
MWCNTs and Mg1.75Al0.25Ni-MWCNTs composites show
enhanced maximum discharge capacities in comparison with
those of Mg2Ni and Mg1.75Al0.25Ni milled alloys, respectively.
This phenomenon could be explained as follows: (1) As
observed in SEM, due to the lubricant function of MWCNTs,
the alloy particles show smaller particle sizes, less agglom-
eration and better dispersion. Smaller particles could shorten
the diffusion distance of hydrogen and therefore facilitate
access of hydrogen to inner parts of alloy particles. Addi-
tionally, the surface area of alloy particles is also enlarged
significantly, which is favorable for alloy particles to absorb
hydrogen. (2) It is shown in TEM and HRTEM images that
majority of MWCNTs retain their tubular structure during ball
milling and surround the alloy particles. Even after 11 cycles,
as illustrated in Fig. 8, the MWCNTs still preserve their tubular
structure, which indicates their stability. TheseMWCNTswith
specific tubular structure provide good channels for easy
passage of hydrogen. Based on these two reasons, we may get
a conclusion that the addition of 5 wt.% MWCNTs could
enhance the electrochemical hydrogen storage capacity of
milled alloys. It is worthy to note that though the Mg2Ni-
MWCNTs sample exhibits a higher maximum discharge
capacity thanMg2Ni alloy, this discharge capacity is still below
that of Mg1.75Al0.25Ni alloy. Therefore, adding MWCNTs indi-
vidually is less effective than adding Al for improving
discharge capacity, which is because of the fact that the
addition of Al changes the phase composition of milled alloy
and leads to the formation of AlNi-type solid solution that can
also incorporate hydrogen atoms. When Al and MWCNTs are
added simultaneously, the highest discharge capacity is ob-
tained for Mg1.75Al0.25Ni-MWCNTs composite, which implies
that MWCNTs and Al have synergistic effects on electro-
chemical hydrogen storage capacity of milled alloys. All mil-
led alloys show the tendency of capacity degradation, which is
because of their oxidation in alkaline solution. The improve-
ment on the electrode cycle stability by adding MWCNTs is
unsatisfactory, which is similar to the results reported in
Ref. [33]. The reason is probably like this: On the one hand, the
alloy particles refining increases the discharge capacity. On
the other hand, this refining weakens the anti-corrosion
capability of milled alloys due to the exposure of more
surfaces of alloy particles to the KOH solution. Besides, we
have found a few MWCNTs at the bottom of the H-type shape
glass cell during charge/discharge cycles in our experiment,
indicating that some MWCNTs have flaked away from the
working electrode. As a result, the electrode cycle stability has
not been improved satisfactorily.
4. Conclusions
Mg2!xAlxNi (x ¼ 0, 0.25) electrode alloys with and without
MWCNTs have been prepared by mechanical alloying under
argon atmosphere at room temperature using a planetary
high-energy ball mill. Based on this study, the following
conclusions can be obtained: (1) Al substitution for Mg in
Mg2Ni-type alloys results in the formation of AlNi-type solid
solution that can interstitially dissolve hydrogen atoms. In
contrast, the addition of MWCNTs hardly affects the phase
compositions. (2) After co-milling with 5 wt. % MWCNTs, the
particle sizes of bothMg2Ni andMg1.75Al0.25Nimilled alloys are
decreased explicitly. The long MWCNTs were cut into short
ones during ball milling. These MWCNTs aggregate along the
boundaries and surfaces of milled alloy particles and play
a role of lubricant toweaken the adhesion of alloy particles. As
a result, the milled alloy particles show smaller particle sizes,
less agglomeration and better dispersion. The majority of
MWCNTs retain their tubular structure after ball milling
except a few MWCNTs whose tubular structure is destroyed.
(3) Allmilled alloys exhibit excellent activation properties. The
Mg1.75Al0.25Ni-MWCNTs composite shows the highest
0 1 2 3 4 5 6 7 8 9 10 11
0
5
10
15
20
25
30
35
40
45
50
55
Dis
cha
rge c
ap
aci
ty (
mA
h/g
)
Cycle number
Mg2Ni Mg2Ni-MWCNTs
Mg1.75Al0.25Ni Mg1.75Al0.25Ni-MWCNTs
Fig. 7 e Discharge capacity as a function of cycle number
for all milled samples. The inset shows the enlarged curves
for Mg2Ni and Mg2Ni-MWCNTs.
Fig. 8 e HRTEM image of electrode powder of Mg1.75Al0.25Ni-
MWCNTs composite after 11 charge/discharge cycles.
i n t e rn a t i o n a l j o u r n a l o f h y d r o g e n en e r g y 3 7 ( 2 0 1 2 ) 1 5 3 8e1 5 4 51544
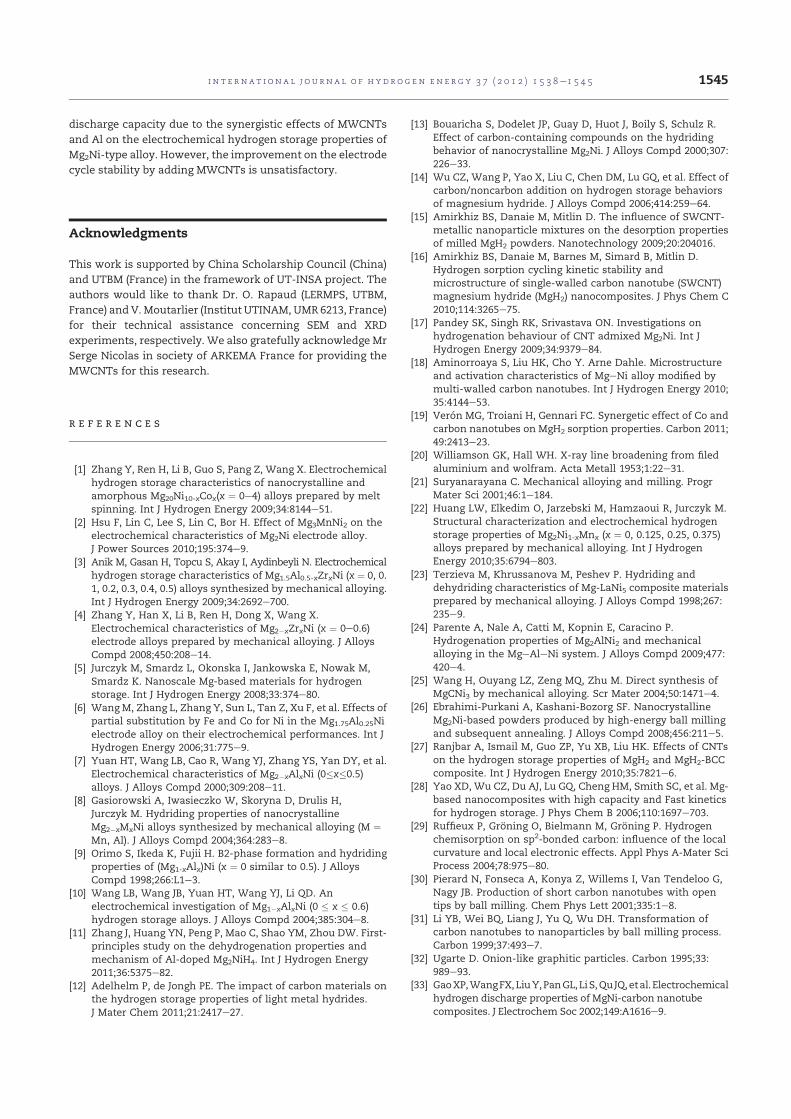
discharge capacity due to the synergistic effects of MWCNTs
and Al on the electrochemical hydrogen storage properties of
Mg2Ni-type alloy. However, the improvement on the electrode
cycle stability by adding MWCNTs is unsatisfactory.
Acknowledgments
This work is supported by China Scholarship Council (China)
and UTBM (France) in the framework of UT-INSA project. The
authors would like to thank Dr. O. Rapaud (LERMPS, UTBM,
France) and V.Moutarlier (Institut UTINAM, UMR 6213, France)
for their technical assistance concerning SEM and XRD
experiments, respectively. We also gratefully acknowledge Mr
Serge Nicolas in society of ARKEMA France for providing the
MWCNTs for this research.
r e f e r e n c e s
[1] Zhang Y, Ren H, Li B, Guo S, Pang Z, Wang X. Electrochemicalhydrogen storage characteristics of nanocrystalline andamorphous Mg20Ni10-xCox(x ¼ 0e4) alloys prepared by meltspinning. Int J Hydrogen Energy 2009;34:8144e51.
[2] Hsu F, Lin C, Lee S, Lin C, Bor H. Effect of Mg3MnNi2 on theelectrochemical characteristics of Mg2Ni electrode alloy.J Power Sources 2010;195:374e9.
[3] Anik M, Gasan H, Topcu S, Akay I, Aydinbeyli N. Electrochemicalhydrogen storage characteristics of Mg1.5Al0.5-xZrxNi (x ¼ 0, 0.1, 0.2, 0.3, 0.4, 0.5) alloys synthesized by mechanical alloying.Int J Hydrogen Energy 2009;34:2692e700.
[4] Zhang Y, Han X, Li B, Ren H, Dong X, Wang X.Electrochemical characteristics of Mg2!xZrxNi (x ¼ 0e0.6)electrode alloys prepared by mechanical alloying. J AlloysCompd 2008;450:208e14.
[5] Jurczyk M, Smardz L, Okonska I, Jankowska E, Nowak M,Smardz K. Nanoscale Mg-based materials for hydrogenstorage. Int J Hydrogen Energy 2008;33:374e80.
[6] Wang M, Zhang L, Zhang Y, Sun L, Tan Z, Xu F, et al. Effects ofpartial substitution by Fe and Co for Ni in the Mg1.75Al0.25Nielectrode alloy on their electrochemical performances. Int JHydrogen Energy 2006;31:775e9.
[7] Yuan HT, Wang LB, Cao R, Wang YJ, Zhang YS, Yan DY, et al.Electrochemical characteristics of Mg2!xAlxNi (0#x#0.5)alloys. J Alloys Compd 2000;309:208e11.
[8] Gasiorowski A, Iwasieczko W, Skoryna D, Drulis H,Jurczyk M. Hydriding properties of nanocrystallineMg2!xMxNi alloys synthesized by mechanical alloying (M ¼
Mn, Al). J Alloys Compd 2004;364:283e8.[9] Orimo S, Ikeda K, Fujii H. B2-phase formation and hydriding
properties of (Mg1-xAlx)Ni (x ¼ 0 similar to 0.5). J AlloysCompd 1998;266:L1e3.
[10] Wang LB, Wang JB, Yuan HT, Wang YJ, Li QD. Anelectrochemical investigation of Mg1!xAlxNi (0 # x # 0.6)hydrogen storage alloys. J Alloys Compd 2004;385:304e8.
[11] Zhang J, Huang YN, Peng P, Mao C, Shao YM, Zhou DW. First-principles study on the dehydrogenation properties andmechanism of Al-doped Mg2NiH4. Int J Hydrogen Energy2011;36:5375e82.
[12] Adelhelm P, de Jongh PE. The impact of carbon materials onthe hydrogen storage properties of light metal hydrides.J Mater Chem 2011;21:2417e27.
[13] Bouaricha S, Dodelet JP, Guay D, Huot J, Boily S, Schulz R.Effect of carbon-containing compounds on the hydridingbehavior of nanocrystalline Mg2Ni. J Alloys Compd 2000;307:226e33.
[14] Wu CZ, Wang P, Yao X, Liu C, Chen DM, Lu GQ, et al. Effect ofcarbon/noncarbon addition on hydrogen storage behaviorsof magnesium hydride. J Alloys Compd 2006;414:259e64.
[15] Amirkhiz BS, Danaie M, Mitlin D. The influence of SWCNT-metallic nanoparticle mixtures on the desorption propertiesof milled MgH2 powders. Nanotechnology 2009;20:204016.
[16] Amirkhiz BS, Danaie M, Barnes M, Simard B, Mitlin D.Hydrogen sorption cycling kinetic stability andmicrostructure of single-walled carbon nanotube (SWCNT)magnesium hydride (MgH2) nanocomposites. J Phys Chem C2010;114:3265e75.
[17] Pandey SK, Singh RK, Srivastava ON. Investigations onhydrogenation behaviour of CNT admixed Mg2Ni. Int JHydrogen Energy 2009;34:9379e84.
[18] Aminorroaya S, Liu HK, Cho Y. Arne Dahle. Microstructureand activation characteristics of MgeNi alloy modified bymulti-walled carbon nanotubes. Int J Hydrogen Energy 2010;35:4144e53.
[19] Veron MG, Troiani H, Gennari FC. Synergetic effect of Co andcarbon nanotubes on MgH2 sorption properties. Carbon 2011;49:2413e23.
[20] Williamson GK, Hall WH. X-ray line broadening from filedaluminium and wolfram. Acta Metall 1953;1:22e31.
[21] Suryanarayana C. Mechanical alloying and milling. ProgrMater Sci 2001;46:1e184.
[22] Huang LW, Elkedim O, Jarzebski M, Hamzaoui R, Jurczyk M.Structural characterization and electrochemical hydrogenstorage properties of Mg2Ni1-xMnx (x ¼ 0, 0.125, 0.25, 0.375)alloys prepared by mechanical alloying. Int J HydrogenEnergy 2010;35:6794e803.
[23] Terzieva M, Khrussanova M, Peshev P. Hydriding anddehydriding characteristics of Mg-LaNi5 composite materialsprepared by mechanical alloying. J Alloys Compd 1998;267:235e9.
[24] Parente A, Nale A, Catti M, Kopnin E, Caracino P.Hydrogenation properties of Mg2AlNi2 and mechanicalalloying in the MgeAleNi system. J Alloys Compd 2009;477:420e4.
[25] Wang H, Ouyang LZ, Zeng MQ, Zhu M. Direct synthesis ofMgCNi3 by mechanical alloying. Scr Mater 2004;50:1471e4.
[26] Ebrahimi-Purkani A, Kashani-Bozorg SF. NanocrystallineMg2Ni-based powders produced by high-energy ball millingand subsequent annealing. J Alloys Compd 2008;456:211e5.
[27] Ranjbar A, Ismail M, Guo ZP, Yu XB, Liu HK. Effects of CNTson the hydrogen storage properties of MgH2 and MgH2-BCCcomposite. Int J Hydrogen Energy 2010;35:7821e6.
[28] Yao XD, Wu CZ, Du AJ, Lu GQ, Cheng HM, Smith SC, et al. Mg-based nanocomposites with high capacity and Fast kineticsfor hydrogen storage. J Phys Chem B 2006;110:1697e703.
[29] Ruffieux P, Groning O, Bielmann M, Groning P. Hydrogenchemisorption on sp2-bonded carbon: influence of the localcurvature and local electronic effects. Appl Phys A-Mater SciProcess 2004;78:975e80.
[30] Pierard N, Fonseca A, Konya Z, Willems I, Van Tendeloo G,Nagy JB. Production of short carbon nanotubes with opentips by ball milling. Chem Phys Lett 2001;335:1e8.
[31] Li YB, Wei BQ, Liang J, Yu Q, Wu DH. Transformation ofcarbon nanotubes to nanoparticles by ball milling process.Carbon 1999;37:493e7.
[32] Ugarte D. Onion-like graphitic particles. Carbon 1995;33:989e93.
[33] GaoXP,WangFX,LiuY,PanGL,LiS,QuJQ,etal. Electrochemicalhydrogen discharge properties of MgNi-carbon nanotubecomposites. J Electrochem Soc 2002;149:A1616e9.
i n t e r n a t i o n a l j o u r n a l o f h y d r o g e n en e r g y 3 7 ( 2 0 1 2 ) 1 5 3 8e1 5 4 5 1545
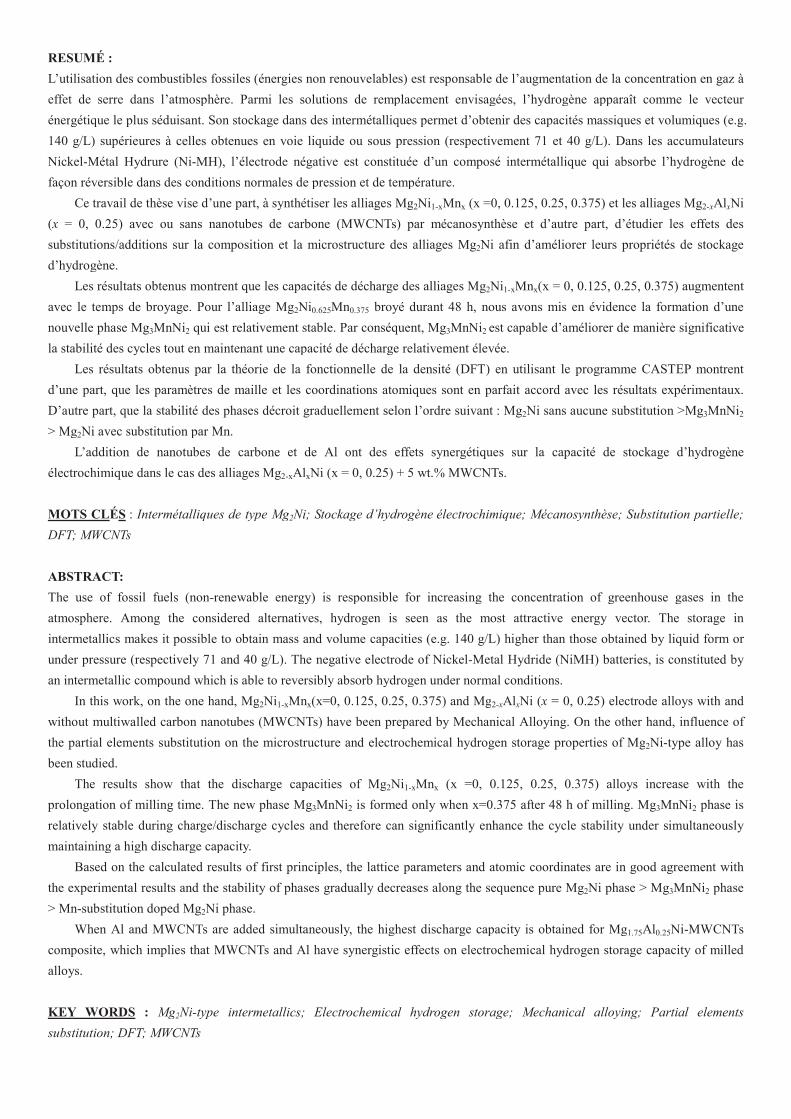
RESUMÉ :
L’utilisation des combustibles fossiles (énergies non renouvelables) est responsable de l’augmentation de la concentration en gaz à
effet de serre dans l’atmosphère. Parmi les solutions de remplacement envisagées, l’hydrogène apparaît comme le vecteur
énergétique le plus séduisant. Son stockage dans des intermétalliques permet d’obtenir des capacités massiques et volumiques (e.g.
140 g/L) supérieures à celles obtenues en voie liquide ou sous pression (respectivement 71 et 40 g/L). Dans les accumulateurs
Nickel-Métal Hydrure (Ni-MH), l’électrode négative est constituée d’un composé intermétallique qui absorbe l’hydrogène de
façon réversible dans des conditions normales de pression et de température.
Ce travail de thèse vise d’une part, à synthétiser les alliages Mg2Ni1-xMnx (x =0, 0.125, 0.25, 0.375) et les alliages Mg2-xAlxNi
(x = 0, 0.25) avec ou sans nanotubes de carbone (MWCNTs) par mécanosynthèse et d’autre part, d’étudier les effets des
substitutions/additions sur la composition et la microstructure des alliages Mg2Ni afin d’améliorer leurs propriétés de stockage
d’hydrogène.
Les résultats obtenus montrent que les capacités de décharge des alliages Mg2Ni1-xMnx(x = 0, 0.125, 0.25, 0.375) augmentent
avec le temps de broyage. Pour l’alliage Mg2Ni0.625Mn0.375 broyé durant 48 h, nous avons mis en évidence la formation d’une
nouvelle phase Mg3MnNi2 qui est relativement stable. Par conséquent, Mg3MnNi2 est capable d’améliorer de manière significative
la stabilité des cycles tout en maintenant une capacité de décharge relativement élevée.
Les résultats obtenus par la théorie de la fonctionnelle de la densité (DFT) en utilisant le programme CASTEP montrent
d’une part, que les paramètres de maille et les coordinations atomiques sont en parfait accord avec les résultats expérimentaux.
D’autre part, que la stabilité des phases décroit graduellement selon l’ordre suivant : Mg2Ni sans aucune substitution >Mg3MnNi2
> Mg2Ni avec substitution par Mn.
L’addition de nanotubes de carbone et de Al ont des effets synergétiques sur la capacité de stockage d’hydrogène
électrochimique dans le cas des alliages Mg2-xAlxNi (x = 0, 0.25) + 5 wt.% MWCNTs.
MOTS CLÉS : Intermétalliques de type Mg2Ni; Stockage d’hydrogène électrochimique; Mécanosynthèse; Substitution partielle;
DFT; MWCNTs
ABSTRACT:
The use of fossil fuels (non-renewable energy) is responsible for increasing the concentration of greenhouse gases in the
atmosphere. Among the considered alternatives, hydrogen is seen as the most attractive energy vector. The storage in
intermetallics makes it possible to obtain mass and volume capacities (e.g. 140 g/L) higher than those obtained by liquid form or
under pressure (respectively 71 and 40 g/L). The negative electrode of Nickel-Metal Hydride (NiMH) batteries, is constituted by
an intermetallic compound which is able to reversibly absorb hydrogen under normal conditions.
In this work, on the one hand, Mg2Ni1-xMnx(x=0, 0.125, 0.25, 0.375) and Mg2-xAlxNi (x = 0, 0.25) electrode alloys with and
without multiwalled carbon nanotubes (MWCNTs) have been prepared by Mechanical Alloying. On the other hand, influence of
the partial elements substitution on the microstructure and electrochemical hydrogen storage properties of Mg2Ni-type alloy has
been studied.
The results show that the discharge capacities of Mg2Ni1-xMnx (x =0, 0.125, 0.25, 0.375) alloys increase with the
prolongation of milling time. The new phase Mg3MnNi2 is formed only when x=0.375 after 48 h of milling. Mg3MnNi2 phase is
relatively stable during charge/discharge cycles and therefore can significantly enhance the cycle stability under simultaneously
maintaining a high discharge capacity.
Based on the calculated results of first principles, the lattice parameters and atomic coordinates are in good agreement with
the experimental results and the stability of phases gradually decreases along the sequence pure Mg2Ni phase > Mg3MnNi2 phase
> Mn-substitution doped Mg2Ni phase.
When Al and MWCNTs are added simultaneously, the highest discharge capacity is obtained for Mg1.75Al0.25Ni-MWCNTs
composite, which implies that MWCNTs and Al have synergistic effects on electrochemical hydrogen storage capacity of milled
alloys.
KEY WORDS : Mg2Ni-type intermetallics; Electrochemical hydrogen storage; Mechanical alloying; Partial elements
substitution; DFT; MWCNTs


![Act[IUT] - iut-bm.univ- · PDF fileLA LETTRE D’INFORMATION DE L’IUT DE BELFORT-MONTBÉLIARD EDITO ... Personne (SaP) : « Reprendre des études demande de la persévérance, du](https://static.fdocuments.fr/doc/165x107/5ab5a3757f8b9a2f438cce03/actiut-iut-bmuniv-lettre-dinformation-de-liut-de-belfort-montbliard.jpg)


![Université de Technologie de Belfort Montbéliard par S. Lamrous Le 04/04/2007 1 « Il n'y a pas d'image sans lumière » [J.P.Achard] Le spectre des radiations.](https://static.fdocuments.fr/doc/165x107/551d9d8e497959293b8c325c/universite-de-technologie-de-belfort-montbeliard-par-s-lamrous-le-04042007-1-il-ny-a-pas-dimage-sans-lumiere-jpachard-le-spectre-des-radiations.jpg)


![CAMPUS UNIVERSITAIRE - UFR STGIstgi.univ-fcomte.fr/download/ufr-stgi/document/vie... · Université de Technologie de Belfort-Montbéliard [UTBM] MyUTBM site : 90010 Belfort cedex](https://static.fdocuments.fr/doc/165x107/5fe8b242e9c981243829db3f/campus-universitaire-ufr-universit-de-technologie-de-belfort-montbliard-utbm.jpg)