DMD 2012, brain drug transporters
309
Université de Montréal Les répercussions de l’insuffisance rénale chronique sur le transport des médicaments par Judith Naud Département de Pharmacologie Faculté de Médecine Thèse présentée à la Faculté de Médecine en vue de l’obtention du grade de Doctorat en Pharmacologie Mai 2012 © Judith Naud, 2012
-
Upload
phungxuyen -
Category
Documents
-
view
227 -
download
0
Transcript of DMD 2012, brain drug transporters
Université de Montréal
Les répercussions de l’insuffisance rénale chronique sur
le transport des médicaments
par
Judith Naud
Département de Pharmacologie
Faculté de Médecine
Thèse présentée à la Faculté de Médecine
en vue de l’obtention du grade de Doctorat
en Pharmacologie
Mai 2012
© Judith Naud, 2012
Université de Montréal
Faculté des études supérieures et postdoctorales
Cette thèse intitulée :
Les répercussions de l’insuffisance rénale chronique sur le transport des médicaments.
Présentée par :
Judith Naud
a été évaluée par un jury composé des personnes suivantes :
Dr Martin Sirois, président-rapporteur
Dr Vincent Pichette, directeur de recherche
Dr Éric Thorin, membre du jury
Dr Paul Isenring, examinateur externe
Dr Édouard Kouassi, représentant du doyen de la FES
i
Résumé
L’insuffisance rénale chronique (IRC) affecte 13 % de la population américaine et
son incidence ne cesse d’augmenter. Malgré un ajustement des doses de médicaments
administrés en fonction du taux de filtration glomérulaire du patient urémique, près de
40 % des patients reçoivent une dose trop élevée en raison de modifications de
l’élimination extrarénale des médicaments chez ces patients. Il est connu que l’IRC affecte
l’élimination métabolique des médicaments par les cytochromes P450 et les enzymes de
biotransformation de phase II. Nous avons aussi démontré, chez le rat, que l’IRC affecte
l’expression et l’activité de transporteurs de médicaments intestinaux entraînant une
augmentation de la biodisponibilité de certains médicaments. On retrouve des transporteurs
de médicaments dans de nombreux organes comme le foie, les reins et la barrière
hématoencéphalique (BHE) où ils jouent des rôles importants dans les éliminations biliaire
et rénale et la pénétration des médicaments au cerveau.
Le but de ce travail était de mesurer, chez des rats néphrectomisés, les impacts de
l’IRC sur l’expression protéique et génique et l’activité des transporteurs de médicaments
hépatiques, rénaux et cérébraux. Les transporteurs étudiés sont de la famille des
transporteurs ABC (P-glycoprotéine, multidrug-resistance related protein, breast cancer
resistance protein) ou des solute carriers (organic anion transporter, organic anion
transporting protein). Aussi, une étude réalisée chez l’humain visait à évaluer la
pharmacocinétique de deux médicaments : la fexofénadine, un médicament majoritairement
transporté, et le midazolam, un substrat du cytochrome P450 3A4, chez des sujets dialysés.
Nos résultats montrent que, chez le rat, l’IRC entraîne des modulations de
l’expression des transporteurs d’influx et d’efflux hépatiques pouvant entraîner des
diminutions du métabolisme hépatique et de l’excrétion biliaire des médicaments. Dans le
rein, nous avons démontré des modulations de l’expression des transporteurs de
médicaments. Nous avons aussi démontré que l’IRC diminue l’élimination urinaire de la
rhodamine 123 et favorise l’accumulation intrarénale de médicaments transportés comme la
benzylpénicilline et la digoxine. À la BHE, nous avons démontré des diminutions de
ii
l’expression des transporteurs de médicaments. Toutefois, nous n’avons pas observé
d’accumulation intracérébrale de trois substrats utilisés (digoxine, doxorubicine et
vérapamil) et même une diminution de l’accumulation intracérébrale de la
benzylpénicilline. Il semble donc que, malgré les modulations de l’expression des différents
transporteurs de médicaments, l’intégrité et la fonction de la BHE soient conservées en
IRC.
Chez l’humain, nous avons démontré une augmentation de la surface sous la courbe
de la fexofénadine chez les sujets dialysés, comparativement aux témoins, suggérant une
altération des mécanismes de transport des médicaments chez ces patients. Nous n’avons,
toutefois, pas observé de modification de la pharmacocinétique du midazolam chez les
patients dialysés, suggérant une activité métabolique normale chez ces patients.
Un ou des facteurs s’accumulant dans le sérum des sujets urémiques semblent
responsables des modulations de l’expression et de l’activité des transporteurs de
médicaments observées chez le rat et l’humain. Ces travaux mettent en évidence une
nouvelle problématique chez les sujets urémiques. Nous devons maintenant identifier les
mécanismes impliqués afin d’éventuellement développer des stratégies pour prévenir la
toxicité et la morbidité chez ces patients.
Mots-clés : Barrière hématoencéphalique, biodisponibilité, cerveau, élimination biliaire,
foie, Mrp, Oat, Oatp, P-gp, réabsorption tubulaire, rein, sécrétion tubulaire, transport des
médicaments
iii
Abstract
Chronic renal failure (CRF) affects 13% of the American population and its
incidence is rising. Despite dose adjustment of drugs administered to CRF patients
according to their glomerular filtration rate, nearly 40% of patients receive up to 6,45-times
the recommended dose due to modifications in the extra-renal elimination of drugs. It is
known that CRF affects the metabolic elimination of drugs via cytochrome P450s and
Phase II biotransformation enzymes. Also, we showed modulations in the expression and
activity of intestinal drug transporters in CRF rats that could lead to increases in the
bioavailability of drugs. Drug transporters are expressed in various organs including the
liver, the kidneys and the blood-brain barrier (BBB) where they play important roles in the
biliary and renal elimination, and the brain penetration of drugs.
The objective of this work was to measure, using a rat model of CRF, the impacts of
CRF on the protein and mRNA expression and the activity of liver, kidney and brain drug
transporters. We studied ABC transporters (P-glycoprotein, multidrug-resistance related
protein, breast cancer resistance protein) and solute carriers (organic anion transporters,
organic anion transporting proteins). Also, a study conducted in human aimed to evaluate
the pharmacokinetics of two drugs: fexofenadine, a transported drug, and midazolam, a
substrate of cytochrome P450 3A4, in dialyzed patients.
In rats, our results show modulations in the expression and activity of hepatic influx
and efflux drug transporters that could lead to decreases in the hepatic metabolism and
biliary excretion of drugs. In the kidney, we demonstrated modulations in the expression of
drug transporters in CRF rats. We also demonstrated that CRF causes a reduction of the
urinary elimination of rhodamine 123, a P-glycoprotein substrate, and the intra-renal
accumulation of at least two transported drugs: benzylpenicillin and digoxin. Finally, we
demonstrated decreases in the expression of influx and efflux drug transporters at the BBB
of CRF rats. However, these decreases did not correlate with in vivo changes since BBB
permeability of benzylpenicillin was decreased in CRF rats while digoxin, doxorubicin and
iv
verapamil permeabilities were unchanged. It thus appears that, even with decreased drug
transporters, BBB integrity and function is conserved in CRF.
In human, we showed an increase in the area under the curve of fexofenadine in
dialyzed subjects compared to healthy controls, suggesting alterations of drug transport
mechanisms in these patients. However, we observed no modifications in the
pharmacokinetics of midazolam in dialyzed patients, suggesting a normal metabolic
activity in these patients.
Results from in vitro studies suggest that one or many uremic factors accumulating
in the serum of uremic rats and patients are responsible for the observed modulations in
drug transporter expression and activity observed in rat and human. This work
demonstrates the impacts of CRF on the expression and activity of drug transporters and
how they could affect drug pharmacokinetics in patients. Now, the mechanisms leading to
these modulations need to be identified in order to eventually develop strategies to prevent
drug toxicity and morbidity in uremic patients.
Keywords : Biliary elimination, bioavailability, blood-brain barrier, brain, drug transport,
kidney, liver, Mrp, Oat, Oatp, P-gp, tubular reabsorption, tubular secretion
v
Table des matières
Résumé ................................................................................................................................................................ i
Abstract ............................................................................................................................................................ iii
Table des matières ............................................................................................................................................. v
Liste des tableaux ............................................................................................................................................. ix
Liste des figures ................................................................................................................................................. x
Liste des abréviations et des sigles ................................................................................................................ xii
Remerciements ............................................................................................................................................... xvi
INTRODUCTION ..................................................................................................... 1
1. L’INSUFFISANCE RÉNALE CHRONIQUE ........................................................................................................... 1
2. LA CINÉTIQUE DES MÉDICAMENTS ................................................................................................................. 3
2.1. L’ABSORPTION DES MÉDICAMENTS ............................................................................................................. 3
2.2. L’ABSORPTION DES MÉDICAMENTS EN INSUFFISANCE RÉNALE CHRONIQUE .................................................. 6
2.3. LA DISTRIBUTION DES MÉDICAMENTS ......................................................................................................... 9
2.4. L’ÉLIMINATION HÉPATIQUE DES MÉDICAMENTS ........................................................................................ 11
2.5. L’ÉLIMINATION RÉNALE DES MÉDICAMENTS .............................................................................................. 15
2.6. LA PÉNÉTRATION DES MÉDICAMENTS À TRAVERS LA BARRIÈRE HÉMATOENCÉPHALIQUE .............................. 17
3. LES TRANSPORTEURS DE MEDICAMENTS ..................................................................................................... 19
3.1. LES « ABC-TRANSPORTERS » ................................................................................................................... 20
3.2. LES « SOLUTE CARRIERS » ........................................................................................................................ 39
3.3. LES TRANSPORTEURS DANS LES DIFFÉRENTS ORGANES À L’ÉTUDE .............................................................. 61
4. HYPOTHESE .................................................................................................................................................. 65
5. OBJECTIFS .................................................................................................................................................... 66
MÉTHODOLOGIE ................................................................................................. 68
vi
1. LE MODÈLE DE RAT URÉMIQUE .................................................................................................................... 68
2. MESURE DE L’EXPRESSION PROTÉIQUE DES TRANSPORTEURS DANS LES TISSUS ....................................... 68
3. IMMUNOBUVARDAGE DE TYPE WESTERN .................................................................................................... 69
4. MESURE DE L’EXPRESSION GÉNIQUE DES TRANSPORTEURS DANS LES TISSUS ........................................... 69
5. MESURE, IN VIVO, DE L’ACTIVITÉ DES TRANSPORTEURS DE MÉDICAMENTS .............................................. 70
5.1 EXCRÉTION DE RHODAMINE 123 ............................................................................................................... 70
5.2 ACCUMULATION INTRARÉNALE ET INTRACÉRÉBRALE DE MÉDICAMENTS RADIOMARQUÉS.............................. 70
6. EFFET DU SÉRUM DE RATS URÉMIQUES SUR L’EXPRESSION DES TRANSPORTEURS DE MÉDICAMENTS...... 71
7. EFFET DU SÉRUM DE RATS URÉMIQUES SUR L’ACTIVITÉ DE LA P-GLYCOPROTÉINE RÉNALE ................... 72
PRÉSENTATION DES MANUSCRITS .................................................................. 74
Effects of chronic renal failure on liver drug transporters.......................................................................... 75
1. ABSTRACT ................................................................................................................................................. 78
2. INTRODUCTION .......................................................................................................................................... 79
3. MATERIALS AND METHODS ....................................................................................................................... 81
4. RESULTS .................................................................................................................................................... 86
5. DISCUSSION ............................................................................................................................................... 88
6. REFERENCES.............................................................................................................................................. 91
7. FOOTNOTES ............................................................................................................................................... 94
8. TABLES...................................................................................................................................................... 95
9. FIGURES AND LEGENDS ............................................................................................................................. 97
Effects of chronic renal failure on kidney drug transporters and cytochrome P450 in rats. ................. 102
1. ABSTRACT ............................................................................................................................................... 105
2. INTRODUCTION ........................................................................................................................................ 106
3. MATERIALS AND METHODS ..................................................................................................................... 108
4. RESULTS .................................................................................................................................................. 114
5. DISCUSSION ............................................................................................................................................. 117
6. AUTHORSHIP CONTRIBUTIONS ................................................................................................................ 121
7. REFERENCES............................................................................................................................................ 122
8. FOOTNOTES ............................................................................................................................................. 127
9. TABLES.................................................................................................................................................... 128
vii
10. FIGURES AND LEGENDS ......................................................................................................................... 130
Effects of chronic renal failure on brain drug transporters in rats .......................................................... 137
1. ABSTRACT ................................................................................................................................................... 140
2. INTRODUCTION ........................................................................................................................................ 141
3. MATERIALS AND METHODS ..................................................................................................................... 143
4. RESULTS .................................................................................................................................................. 149
5. DISCUSSION ............................................................................................................................................. 151
6. AUTHORSHIP CONTRIBUTIONS ................................................................................................................ 155
7. REFERENCES............................................................................................................................................ 156
8. FOOTNOTES ............................................................................................................................................. 163
9. Tables ..................................................................................................................................................... 164
10. FIGURES AND LEGENDS ......................................................................................................................... 166
ESRD impairs nonrenal clearance of fexofenadine but not midazolam ................................................... 174
1. ABSTRACT ............................................................................................................................................... 176
2. INTRODUCTION ........................................................................................................................................ 177
3. RESULTS .................................................................................................................................................. 179
4. DISCUSSION ............................................................................................................................................. 181
5. CONCISE METHODS ................................................................................................................................. 187
6. ACKNOWLEDGMENTS .............................................................................................................................. 192
7. REFERENCES............................................................................................................................................ 193
8. TABLES.................................................................................................................................................... 198
9. FIGURES AND LEGENDS ........................................................................................................................... 200
DISCUSSION ....................................................................................................... 206
1. LES ETUDES CHEZ LE RAT .......................................................................................................................... 207
1.1 LES IMPACTS DE L’IRC SUR LE TRANSPORT DES MEDICAMENTS DANS LE FOIE DE RATS .............................. 207
1.2. LES IMPACTS DE L’IRC SUR LE TRANSPORT DES MEDICAMENTS DANS LE REIN DE RATS ............................. 213
1.3. LES IMPACTS DE L’IRC SUR LE TRANSPORT DES MEDICAMENTS DANS LE CERVEAU DE RATS ...................... 219
1.4. QUELS FACTEURS URÉMIQUES? ............................................................................................................. 223
2. IMPACTS DE L’IRC SUR LA PHARMACOCINÉTIQUE DES MÉDICAMENTS CHEZ L’HUMAIN ....................... 229
CONCLUSION ..................................................................................................... 237
viii
BIBLIOGRAPHIE ................................................................................................ 242
ix
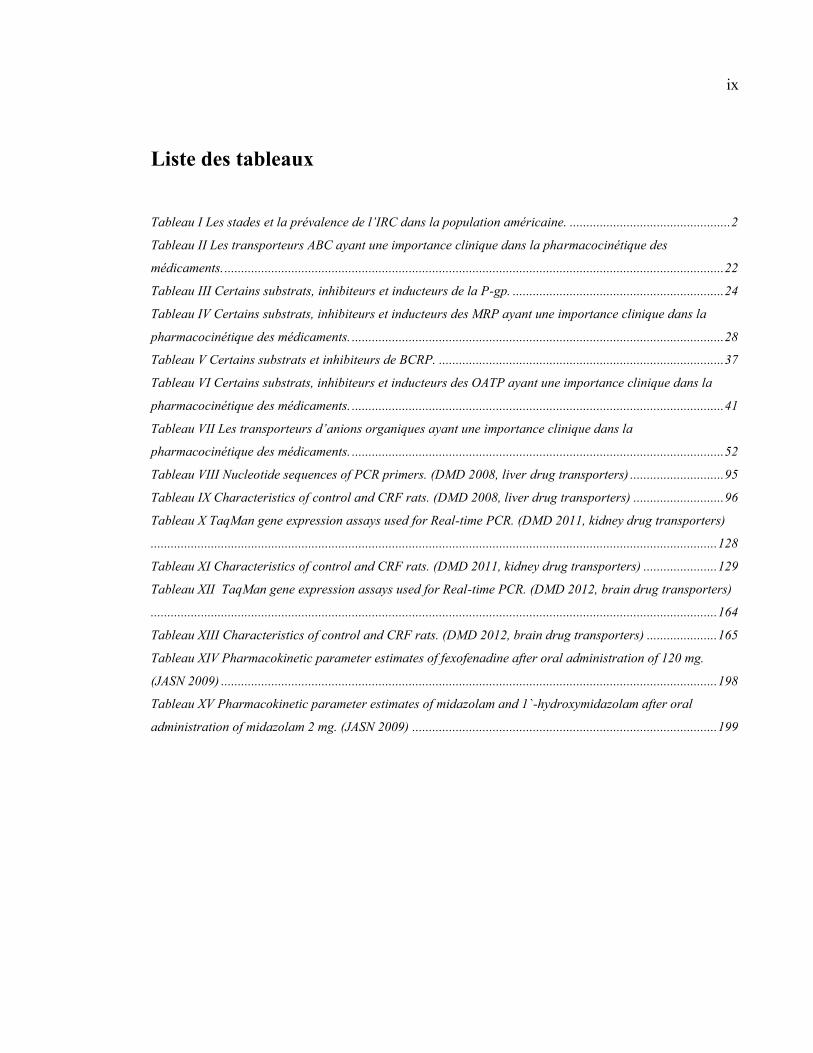
Liste des tableaux
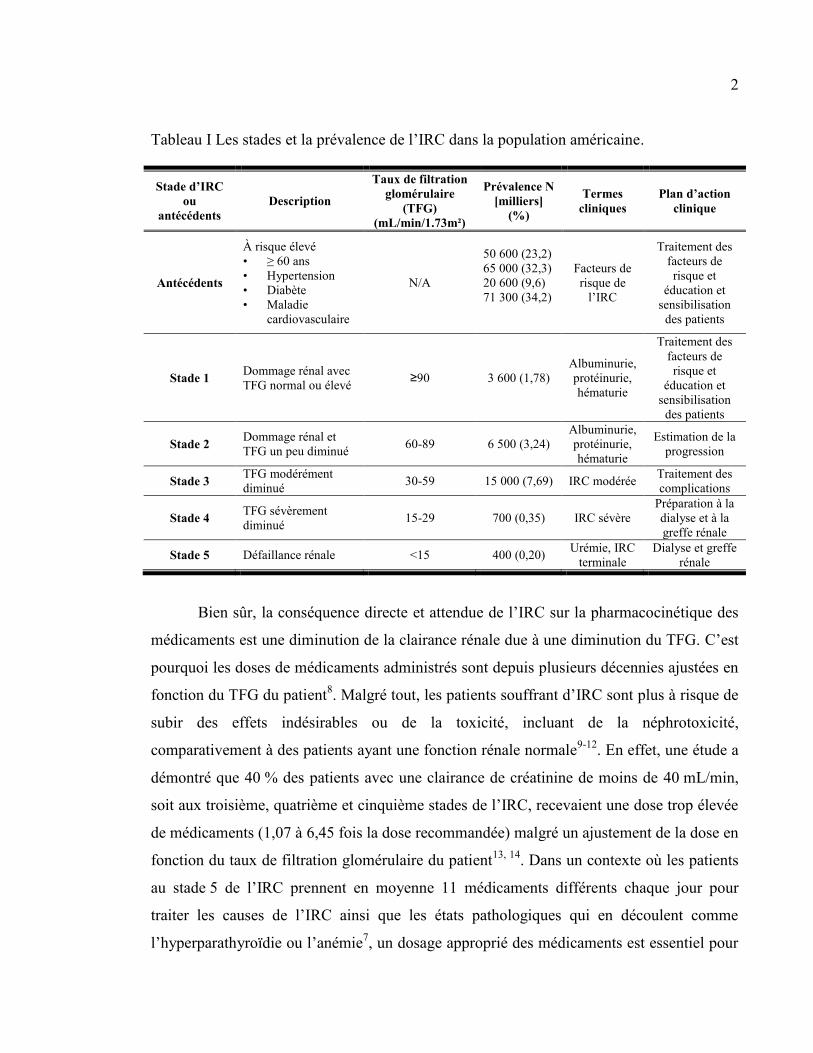
Tableau I Les stades et la prévalence de l’IRC dans la population américaine. ................................................ 2
Tableau II Les transporteurs ABC ayant une importance clinique dans la pharmacocinétique des
médicaments. ..................................................................................................................................................... 22
Tableau III Certains substrats, inhibiteurs et inducteurs de la P-gp. ............................................................... 24
Tableau IV Certains substrats, inhibiteurs et inducteurs des MRP ayant une importance clinique dans la
pharmacocinétique des médicaments. ............................................................................................................... 28
Tableau V Certains substrats et inhibiteurs de BCRP. ..................................................................................... 37
Tableau VI Certains substrats, inhibiteurs et inducteurs des OATP ayant une importance clinique dans la
pharmacocinétique des médicaments. ............................................................................................................... 41
Tableau VII Les transporteurs d’anions organiques ayant une importance clinique dans la
pharmacocinétique des médicaments. ............................................................................................................... 52
Tableau VIII Nucleotide sequences of PCR primers. (DMD 2008, liver drug transporters) ............................ 95
Tableau IX Characteristics of control and CRF rats. (DMD 2008, liver drug transporters) ........................... 96
Tableau X TaqMan gene expression assays used for Real-time PCR. (DMD 2011, kidney drug transporters)
......................................................................................................................................................................... 128
Tableau XI Characteristics of control and CRF rats. (DMD 2011, kidney drug transporters) ...................... 129
Tableau XII TaqMan gene expression assays used for Real-time PCR. (DMD 2012, brain drug transporters)
......................................................................................................................................................................... 164
Tableau XIII Characteristics of control and CRF rats. (DMD 2012, brain drug transporters) ..................... 165
Tableau XIV Pharmacokinetic parameter estimates of fexofenadine after oral administration of 120 mg.
(JASN 2009) .................................................................................................................................................... 198
Tableau XV Pharmacokinetic parameter estimates of midazolam and 1`-hydroxymidazolam after oral
administration of midazolam 2 mg. (JASN 2009) ........................................................................................... 199
x
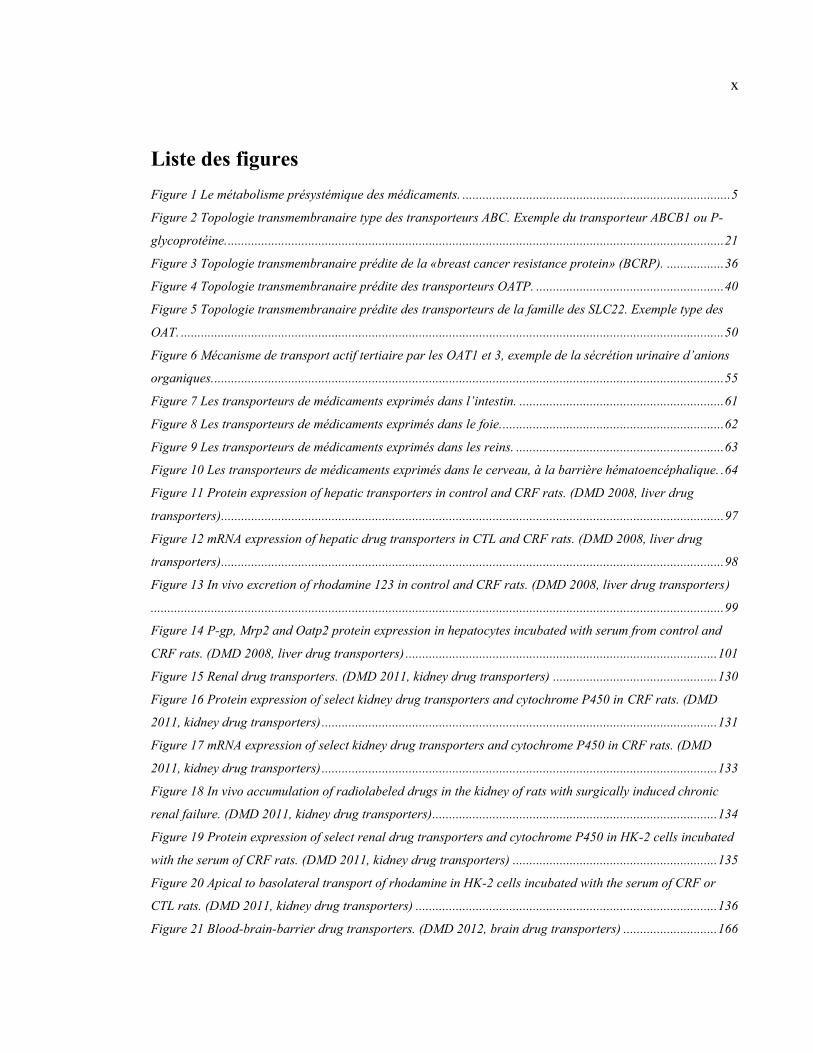
Liste des figures
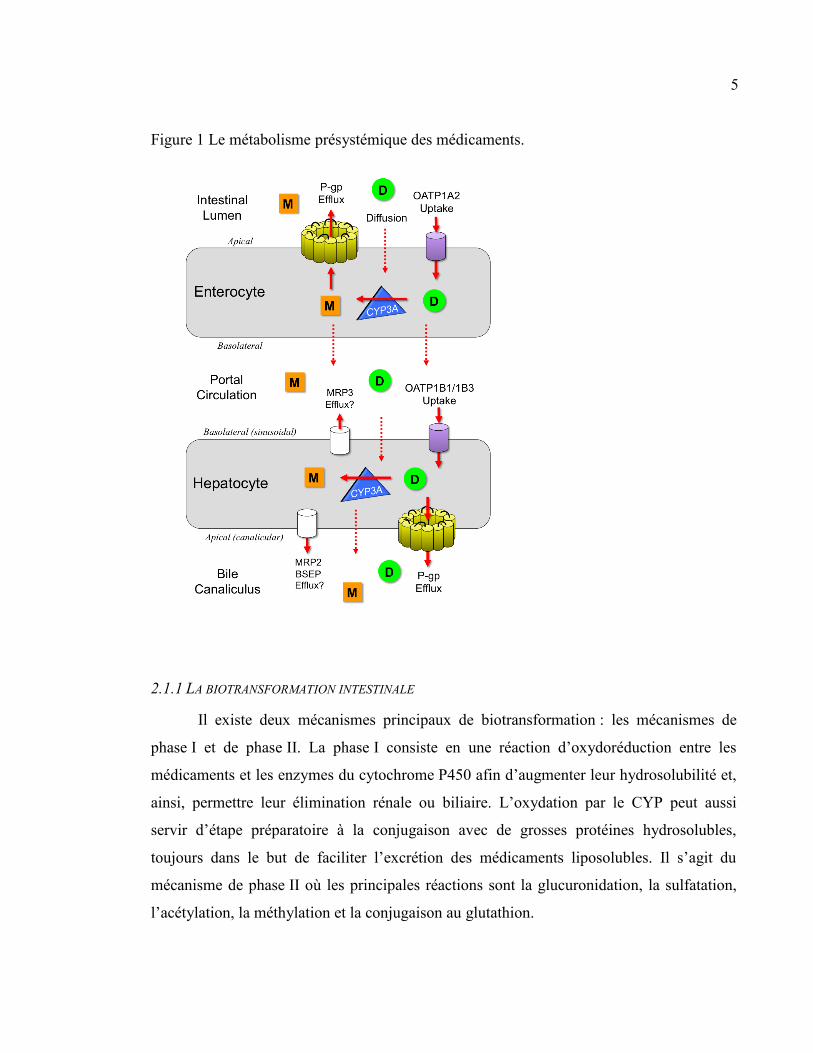
Figure 1 Le métabolisme présystémique des médicaments. ................................................................................ 5
Figure 2 Topologie transmembranaire type des transporteurs ABC. Exemple du transporteur ABCB1 ou P-
glycoprotéine. .................................................................................................................................................... 21
Figure 3 Topologie transmembranaire prédite de la «breast cancer resistance protein» (BCRP). ................. 36
Figure 4 Topologie transmembranaire prédite des transporteurs OATP. ........................................................ 40
Figure 5 Topologie transmembranaire prédite des transporteurs de la famille des SLC22. Exemple type des
OAT. .................................................................................................................................................................. 50
Figure 6 Mécanisme de transport actif tertiaire par les OAT1 et 3, exemple de la sécrétion urinaire d’anions
organiques. ........................................................................................................................................................ 55
Figure 7 Les transporteurs de médicaments exprimés dans l’intestin. ............................................................. 61
Figure 8 Les transporteurs de médicaments exprimés dans le foie. .................................................................. 62
Figure 9 Les transporteurs de médicaments exprimés dans les reins. .............................................................. 63
Figure 10 Les transporteurs de médicaments exprimés dans le cerveau, à la barrière hématoencéphalique. . 64
Figure 11 Protein expression of hepatic transporters in control and CRF rats. (DMD 2008, liver drug
transporters) ...................................................................................................................................................... 97
Figure 12 mRNA expression of hepatic drug transporters in CTL and CRF rats. (DMD 2008, liver drug
transporters) ...................................................................................................................................................... 98
Figure 13 In vivo excretion of rhodamine 123 in control and CRF rats. (DMD 2008, liver drug transporters)
........................................................................................................................................................................... 99
Figure 14 P-gp, Mrp2 and Oatp2 protein expression in hepatocytes incubated with serum from control and
CRF rats. (DMD 2008, liver drug transporters) ............................................................................................. 101
Figure 15 Renal drug transporters. (DMD 2011, kidney drug transporters) ................................................. 130
Figure 16 Protein expression of select kidney drug transporters and cytochrome P450 in CRF rats. (DMD
2011, kidney drug transporters) ...................................................................................................................... 131
Figure 17 mRNA expression of select kidney drug transporters and cytochrome P450 in CRF rats. (DMD
2011, kidney drug transporters) ...................................................................................................................... 133
Figure 18 In vivo accumulation of radiolabeled drugs in the kidney of rats with surgically induced chronic
renal failure. (DMD 2011, kidney drug transporters)..................................................................................... 134
Figure 19 Protein expression of select renal drug transporters and cytochrome P450 in HK-2 cells incubated
with the serum of CRF rats. (DMD 2011, kidney drug transporters) ............................................................. 135
Figure 20 Apical to basolateral transport of rhodamine in HK-2 cells incubated with the serum of CRF or
CTL rats. (DMD 2011, kidney drug transporters) .......................................................................................... 136
Figure 21 Blood-brain-barrier drug transporters. (DMD 2012, brain drug transporters) ............................ 166
xi
Figure 22 Protein expression of various brain drug transporters in CRF rats. (DMD 2012, brain drug
transporters) .................................................................................................................................................... 168
Figure 23 mRNA expression of various brain drug transporters in CRF rats. (DMD 2012, brain drug
transporters) .................................................................................................................................................... 170
Figure 24 In vivo accumulation of radiolabeled drugs in the brain of rats with surgically-induced chronic
renal failure. (DMD 2012, brain drug transporters) ...................................................................................... 171
Figure 25 Protein expression of various drug transporters in rat brain endothelial (RBEC) cells incubated
with the serum of CRF rats. (DMD 2012, brain drug transporters) ............................................................... 172
Figure 26 Protein expression of various drug transporters in astrocytes incubated with the serum of CRF
rats. (DMD 2012, brain drug transporters) .................................................................................................... 173
Figure 27 OATP, P-gp, and CYP3A interplay in the disposition of drugs. ..................................................... 200
Figure 28 Effect of ESRD on the pharmacokinetics of fexofenadine. (JASN 2009) ........................................ 202
Figure 29 Effect of ESRD on the pharmacokinetics of midazolam and 1`-hydroxymidazolam (JASN 2009) . 203
Figure 30 Expression of Oatp, P-gp, and Cyp3a in rat hepatocytes and enterocytes incubated with serum
from patients with ESRD (JASN 2009) ............................................................................................................ 204
Figure 31 Les impacts de l'insuffisance rénale chronique sur la pharmacocinétique des médicaments ........ 238
xii
Liste des abréviations et des sigles
λz : constante d’élimination
14C : carbone 14
3H : tritium
ABC : ATP-binding cassette
ATP : adénosine triphosphate
AH : acide hippurique
AMPc : adénosine 3’, 5’— monophosphate
ARNm : acide ribonucléique messager
ATP : adénosine triphosphate
AUC : area under the curve
AUC0 to 12 : area under the curve from time 0 to 12 hours
AUC0 to ∞ : area under the curve from time 0 to infinity
BBB : blood-brain barrier
Bcrp : breast cancer resistance protein
BHE : barrière hématoencéphalique
BMI : body mass index
BUN : blood urea nitrogen
C12 : concentration plasmatique 12 heures post-administration
Cb : concentration biliaire
Cmax : concentration plasmatique maximale
Cp,ss : concentration plasmatique à l’état d’équilibre
Cu : concentration urinaire
CAR : constitutive androstane-receptor
CKD : chronic kidney disease
CL/F : clearance after oral administration of a drug
CL : clairance
CLb : clairance biliaire
CLNR : clairance non rénale
CLo : clairance après l’administration orale d’un médicament
xiii
CLu : clairance urinaire
CMPF : acide 3-carboxy-4-methyl-5-propyl-2-furan-propanoïque
CRF : chronic renal failure
CTL : contrôle
CYP : cytochrome P450
DPDPE : D-pénicillamine (2, 5)— enképhaline
EHBR : rat Eisai hyperbilirubinémique
ErBT : erythromycin breath test (test d’exhalation à l’érythromycine)
ESRD : end-stage renal disease
F : biodisponibilité
GMPc : guanosine 3’, 5’ — monophosphate
GFR : glomerular filtration rate
HK-2 : Human Kidney-2 (lignée cellulaire)
HPLC : high pressure liquid chromatography
IL-1 : interleukine-1
IL-6 : interleukine-6
IRC : insuffisance rénale chronique
IS : indoxyl sulfate
LPS : lipopolysaccharide (endotoxine)
Mdr : multidrug resistance
Mrp : multidrug-resistance related protein
NAT : N-acétyltransférase
NBD : nucleotide binding domain
Npt1 : type 1 sodium-dependent phosphate transporter
NS : non significatif
Oat : organic anion transporter
Oatp : organic anion transporting polypeptide
Oct : organic cation transporter
Octn : novel organic cation transporter
P450 : cytochrome P450
Papp: perméabilité apparente
xiv
P-gp : P-glycoprotéine
PABA : acide para-aminobenzoïque
PAH : acide para-aminohippurique
PBS : phosphate buffered saline
PCR : réaction de polymérase en chaîne
PhIP : 2-amino-1-méthyl-6-phénylimidazo[4-5-b]pyridine
PKA : protéine kinase A
PKC : protéine kinase C
PMSF : phénylméthylsulfonylfluoride
PTH : hormone parathyroïdienne
PXR : pregnane-X-receptor
qPCR : réaction de polymérase en chaîne quantitative
RBEC : rat brain endothelial cells (cellules endothéliales de cerveau de rat)
Rho-123 : rhodamine 123
SCR : créatinine sérique
SD : écart-type
Slc : solute carrier
SSC : surface sous la courbe
SSC0-12 : surface sous la courbe de temps 0 à temps 12 h
SSC0-∞ : surface sous la courbe de temps 0 à l’infini
t : temps
t½ : temps de demie-vie
tmax : temps nécessaire pour atteindre la concentration plasmatique maximale
TMD : domaine transmembranaire
TFG : taux de filtration glomérulaire
TNF - : facteur de nécrose tumorale
TR- : rat Groninger Yellow/transporter deficient
UGT : uridine diphosphate-glucuronosyl transférase
Urat1 : transporteur d’urate 1
Vb : volume biliaire
Vd : volume de distribution
xv
Vu : volume urinaire
VDR : vitamin-D-receptor
VIH : virus de l’immunodéficience humaine
xvi
Remerciements
Merci à Dr Vincent Pichette de m’avoir accueillie dans son laboratoire, de m’avoir
offert un projet aussi intéressant, d’avoir cru en moi et de m’avoir apporté un soutien
constant tout au long de mes études.
Merci à Dr Thomas D Nolin de m’avoir invitée à participer à son étude sur la
pharmacocinétique des médicaments chez les patients dialysés. Ce fut une occasion
incroyable de transposer mon travail chez les animaux à la réalité humaine.
Merci à tous les coauteurs des articles présentés dans cette thèse. Chacun de vous
avez apporté votre grain de sel à ce travail. Votre aide, vos commentaires et suggestions ont
été grandement appréciés.
Merci à Dr Francois Leblond pour sa générosité dans le soutien technique et
intellectuel qu’il m’a apporté de même que pour son incroyable expertise dans
d’innombrables domaines.
Merci à tous les étudiants, stagiaires et membres du laboratoire de Vincent Pichette
que j’ai côtoyés dans les dernières années. Votre aide technique et morale a été cruciale à la
réussite de ce projet. Vous m’avez tous apporté beaucoup.
Merci à Julie Dubeau et au personnel de l’animalerie de l’HMR, car ils ont été
indispensables à la réussite de ce projet.
xvii
Merci à Stéphanie Leblond pour la préparation des figures représentant les
transporteurs de médicaments dans les différents organes. On n’a pas tous ton talent!
Merci à toute ma famille, particulièrement mes parents et mes sœurs. Ils ont été un
soutien incroyable et m’ont encouragée tout au long de mon parcours. Merci aussi d’avoir
parfait vos connaissances en pharmacologie en acceptant de relire et corriger ma thèse. Je
vous aime tous.
Merci à mes amis, particulièrement Val, CB et Christian, vous m’avez encouragée
et permis de ventiler mon stress. J’adore passer du temps en votre compagnie. Je vous aime
tous.
Merci à Novalie, Myriam, Marina, Laurianne, Chloé et les autres. Votre amour, vos
sourires et votre curiosité face au monde qui nous entoure illuminent mes journées comme
personne d’autre ne peut le faire. Vous êtes mes amours et je vous adore.
Un merci particulier à Dr Martin Sirois, Dr Éric Thorin, Dr Paul Isenring et Dr
Édouard Kouassi pour le temps qu’ils ont consacré à l’évaluation de cette thèse de doctorat.
Finalement, je remercie les Fonds de recherche en santé du Québec, Letko &
Brosseau Inc., la fondation J.A. De Sève et la Faculté des études supérieures et
postdoctorales de l’Université de Montréal pour le soutien financier qu’ils m’ont accordé.
Introduction
1. L’INSUFFISANCE RÉNALE CHRONIQUE
L’insuffisance rénale chronique (IRC) est caractérisée par une perte de néphrons
fonctionnels entraînant une diminution de la filtration glomérulaire et de la sécrétion
tubulaire. Les causes sont multiples, les plus courantes étant : le diabète, l’hypertension, les
maladies rénales ischémiques et les glomérulonéphrites1, 2
. L’incidence de l’IRC augmente
régulièrement depuis les dernières décennies. En effet, au Canada en 2009, on dénotait
37 744 patients traités en dialyse, le stade terminal de l’IRC, une augmentation de plus de
300 % par rapport à 1990 alors que seulement 11 042 Canadiens souffraient d’insuffisance
rénale terminale3. De plus, depuis 1990, le taux de prévalence des patients en dialyse est
passé de 211,6 par million d’habitants à 661,2 par million d’habitants, une augmentation de
212 %3. Aux États-Unis, l’incidence et la prévalence de tous les stades de l’IRC ne cessent
d’augmenter atteignant, en 2000, environ 26 millions d’adultes américains, soit environ
13 % de la population américaine, comparativement à 10 % en 1994, incluant près de 50 %
des adultes de plus de 70 ans4. Une prévalence semblable a été rapportée en Chine et en
Australie où 13 et 16 % de la population, respectivement, sont atteints d’IRC aux différents
stades5. La hausse de la prévalence de l’IRC a été associée à la hausse de la prévalence du
diabète, de l’hypertension artérielle et de l’obésité, les plus grands facteurs de risque de
l’IRC2, 4
.
L’IRC est séparée en 5 stades selon le taux de filtration glomérulaire (TFG) du
patient. Les stades 1 et 2 sont caractérisés par la présence d’un dommage rénal sans
modification du taux de filtration glomérulaire ou avec une légère diminution. Des
complications de l’IRC commencent à apparaître au stade 3 alors que le patient présente un
TFG inférieur à 60 mL/min/1,73m² pendant une période d’au moins 3 mois. Au stade
terminal (stade 5), le patient présente un TFG inférieur à 15 ml/min/1,73 m² et doit avoir
recours à la dialyse1, 2, 6, 7
. Seule une greffe rénale peut guérir l’IRC7. Les différents stades
sont présentés dans le tableau I de même que leur prévalence dans la population américaine
selon des articles de Levey et al. en 2002 et 20091, 2
2
Tableau I Les stades et la prévalence de l’IRC dans la population américaine.
Stade d’IRC
ou
antécédents
Description
Taux de filtration
glomérulaire
(TFG)
(mL/min/1.73m²)
Prévalence N
[milliers]
(%)
Termes
cliniques
Plan d’action
clinique
Antécédents
À risque élevé
• ≥ 60 ans
• Hypertension
• Diabète
• Maladie
cardiovasculaire
N/A
50 600 (23,2)
65 000 (32,3)
20 600 (9,6)
71 300 (34,2)
Facteurs de
risque de
l’IRC
Traitement des
facteurs de
risque et
éducation et
sensibilisation
des patients
Stade 1 Dommage rénal avec
TFG normal ou élevé ≥90 3 600 (1,78)
Albuminurie,
protéinurie,
hématurie
Traitement des
facteurs de
risque et
éducation et
sensibilisation
des patients
Stade 2 Dommage rénal et
TFG un peu diminué 60-89 6 500 (3,24)
Albuminurie,
protéinurie,
hématurie
Estimation de la
progression
Stade 3 TFG modérément
diminué 30-59 15 000 (7,69) IRC modérée
Traitement des
complications
Stade 4 TFG sévèrement
diminué 15-29 700 (0,35) IRC sévère
Préparation à la
dialyse et à la
greffe rénale
Stade 5 Défaillance rénale <15 400 (0,20) Urémie, IRC
terminale
Dialyse et greffe
rénale
Bien sûr, la conséquence directe et attendue de l’IRC sur la pharmacocinétique des
médicaments est une diminution de la clairance rénale due à une diminution du TFG. C’est
pourquoi les doses de médicaments administrés sont depuis plusieurs décennies ajustées en
fonction du TFG du patient8. Malgré tout, les patients souffrant d’IRC sont plus à risque de
subir des effets indésirables ou de la toxicité, incluant de la néphrotoxicité,
comparativement à des patients ayant une fonction rénale normale9-12
. En effet, une étude a
démontré que 40 % des patients avec une clairance de créatinine de moins de 40 mL/min,
soit aux troisième, quatrième et cinquième stades de l’IRC, recevaient une dose trop élevée
de médicaments (1,07 à 6,45 fois la dose recommandée) malgré un ajustement de la dose en
fonction du taux de filtration glomérulaire du patient13, 14
. Dans un contexte où les patients
au stade 5 de l’IRC prennent en moyenne 11 médicaments différents chaque jour pour
traiter les causes de l’IRC ainsi que les états pathologiques qui en découlent comme
l’hyperparathyroïdie ou l’anémie7, un dosage approprié des médicaments est essentiel pour
3
éviter l’apparition d’effets indésirables, pour minimiser le temps et les coûts associés au
traitement des patients souffrant de ces effets et pour assurer le bien-être des patients. Il est
donc important de bien comprendre comment l’IRC affecte la pharmacocinétique des
médicaments.
Les impacts de l’IRC sur la pharmacocinétique des médicaments sont présentés
dans la section 2. Le transport des médicaments est directement impliqué dans ces
processus pharmacologiques. Les différentes familles de transporteurs sont présentées de
façon exhaustive dans la section 3.
2. LA CINÉTIQUE DES MÉDICAMENTS
La pharmacocinétique d’un médicament comprend son absorption, sa distribution et
son élimination. Il a été démontré que l’IRC affecte chacune de ces étapes compromettant
ainsi l’administration des médicaments7, 8, 14-24
. Au cours deux dernières décennies, plusieurs
études ont démontré que l’IRC affecte non seulement l’élimination rénale des médicaments,
mais aussi leur absorption, leur distribution ainsi que leur élimination non rénale. Chaque
étape est présentée en détail ci-dessous.
2.1. L’ABSORPTION DES MÉDICAMENTS
L’absorption d’un médicament est une étape clé de sa pharmacocinétique, car elle
influence directement sa biodisponibilité (F). La biodisponibilité d’un médicament
correspond à la proportion d’une dose donnée qui atteint la circulation sanguine systémique
et elle dépend de plusieurs facteurs. Dans le cas d’un médicament administré par voie orale,
les propriétés physico-chimiques du médicament telles que son poids moléculaire, son pKa,
sa lipophilicité et son hydrosolubilité sont très importantes de même que la physiologie du
tractus gastro-intestinal soit le pH, le transit, la vidange gastrique et l’interaction des
médicaments avec divers aliments25
. Les deux autres facteurs majeurs pouvant influencer la
biodisponibilité d’un médicament administré par voie orale sont son métabolisme
présystémique et son transport actif26-29
.
4
Lors de leur arrivée dans le tractus gastro-intestinal, pour être absorbés, les
médicaments doivent pénétrer à l’intérieur des entérocytes par diffusion passive ou encore
par transport actif par des transporteurs d’influx (p.ex. organic anion transporting polypeptide
[OATP]). Une fois dans les entérocytes, les médicaments peuvent être biotransformés par les
enzymes intestinales du cytochrome P450 (CYP), particulièrement le CYP3A. La molécule
mère (ou son métabolite) peut ensuite être A) rejetée dans la lumière intestinale par transport
actif par des transporteurs d’efflux (p.ex. P-glycoprotéine [P-gp], multidrug resistance-related
protein 2 [MRP2]) et réintégrer le cycle en pénétrant de nouveau dans les entérocytes par
diffusion passive ou transport actif ou B) transférée dans la veine porte par diffusion passive
ou par transport actif par des transporteurs d’efflux (p.ex. MRP3). La circulation portale
dirige ainsi les médicaments au foie où ils peuvent diffuser librement ou être transportés
activement dans les hépatocytes par des transporteurs tels que les OATP, puis être
biotransformés par les CYP ou les enzymes du métabolisme de phase II. La molécule mère
(ou son métabolite) peut ensuite être excrétée dans la bile par transport actif (P-gp, MRP), ce
qui la rend disponible à une réabsorption intestinale (ceci correspond au cycle entéro-
hépatique), ou atteindre la circulation sanguine systémique par diffusion passive ou transport
actif hors de l’hépatocyte (MRP)24, 30
. Toutes ces étapes correspondent au métabolisme
présystémique (ou de premier passage) des médicaments et sont schématisées dans la
Figure 1 où le médicament est représenté par un D dans un cercle et son métabolite est
représenté par un M dans un carré orange.
La biodisponibilité d’un médicament correspond à la quantité d’une dose donnée
atteignant (intacte) la circulation sanguine systémique après avoir franchi toutes ces étapes.
Il est donc évident que toute modification de l’expression et de l’activité des enzymes de
biotransformation intestinales et des transporteurs intestinaux de médicaments par
l’insuffisance rénale chronique pourra affecter la biodisponibilité des médicaments.
5
Figure 1 Le métabolisme présystémique des médicaments.
2.1.1 LA BIOTRANSFORMATION INTESTINALE
Il existe deux mécanismes principaux de biotransformation : les mécanismes de
phase I et de phase II. La phase I consiste en une réaction d’oxydoréduction entre les
médicaments et les enzymes du cytochrome P450 afin d’augmenter leur hydrosolubilité et,
ainsi, permettre leur élimination rénale ou biliaire. L’oxydation par le CYP peut aussi
servir d’étape préparatoire à la conjugaison avec de grosses protéines hydrosolubles,
toujours dans le but de faciliter l’excrétion des médicaments liposolubles. Il s’agit du
mécanisme de phase II où les principales réactions sont la glucuronidation, la sulfatation,
l’acétylation, la méthylation et la conjugaison au glutathion.
6
Le système de biotransformation prédominant dans l’intestin est le CYP que l’on
retrouve dans le réticulum endoplasmique des entérocytes28, 31, 32
. Le CYP intestinal est le
premier site de biotransformation pour les médicaments administrés par voie orale. En effet,
il est impliqué dans le métabolisme présystémique, c’est-à-dire la biotransformation d’une
fraction des doses administrées avant leur entrée dans la circulation systémique27
.Chez
l’humain, l’isoforme 3A du CYP est la plus abondante et représente environ 80 % du CYP
total de l’intestin33
. Cette isoforme est aussi celle ayant le plus vaste spectre de substrats. En
effet, elle participe à la biotransformation de près de 60 % des médicaments biotransformés
par les CYP. Parmi ses substrats, on compte l’érythromycine, le midazolam, la nifédipine et
la cyclosporine34
. Le CYP2C9 représente environ 14 % du CYP intestinal total33
. Ses
substrats comptent le tolbutamide, la phénytoïne et la warfarine34
. Plusieurs autres CYP sont
exprimés dans l’intestin. Parmi eux, on retrouve le CYP1A, le CYP2C19 et le CYP2D6,
mais leur niveau d’expression est faible et ils représentent chacun moins de 2 % du CYP
intestinal total33, 35, 36
.
Toutes modifications du CYP450 intestinal pourraient aussi avoir d’importantes
répercussions sur la biodisponibilité des médicaments par diminution de leur
biotransformation dans l’étape intestinale du métabolisme de premier passage27
.
2.2. L’ABSORPTION DES MÉDICAMENTS EN INSUFFISANCE RÉNALE CHRONIQUE
Au début de mes études de doctorat, aucune étude in vivo chez l’humain n’avait
démontré les répercussions de l’IRC sur le métabolisme de premier passage intestinal des
médicaments. Toutefois, il avait déjà été démontré que la biodisponibilité de plusieurs
médicaments incluant le dextropropoxyphène, la dihydrocodéine, l’érythromycine,
l’oxprénolol, le propranolol, le bufuralol, plusieurs médicaments immunosuppresseurs ainsi
que plusieurs inhibiteurs de protéases du VIH était augmentée chez les patients souffrant
d’insuffisance rénale chronique11, 37-43
. Plusieurs de ces médicaments sont des substrats des
CYP (p.ex. propranolol) et/ou des transporteurs de médicaments intestinaux (p.ex.
immunosuppresseurs), et sont sujets au métabolisme de premier passage44, 45
. Puisque leur
biodisponibilité est augmentée lors de l’IRC, il est possible que leur métabolisme intestinal
7
soit diminué et/ou que leur transport intestinal soit modifié par l’IRC. L’expression et
l’activité des enzymes de biotransformation et des transporteurs de médicaments
intestinaux en insuffisance rénale ont été évaluées à l’aide de modèles animaux. Les
principales études sont présentées dans les sections suivantes.
2.2.1 LES FACTEURS PHYSIOLOGIQUES AFFECTANT L’ABSORPTION DES MÉDICAMENTS EN IRC
L’IRC affecte la physiologie du tractus gastro-intestinal de plusieurs façons. Tout
d’abord, il a été rapporté que plusieurs patients souffrent d’un ralentissement de la motilité
intestinale46
. Toutefois, ce ralentissement ne devrait pas affecter la biodisponibilité des
médicaments puisqu’un changement de la motilité gastrique affecte le temps nécessaire pour
atteindre la concentration sanguine maximale, mais pas la biodisponibilité21, 47, 48
. De plus,
l’IRC entraîne une augmentation du pH gastrique due à un excès d’urée dans la salive qui est
transformée en ammoniaque par l’uréase gastrique47, 49
. Le pH gastrique peut aussi être
augmenté par la prise de plusieurs médicaments couramment utilisés en IRC comme les
antiacides, les inhibiteurs de la pompe à protons et les inhibiteurs du récepteur H2 de
l’histamine qui réduisent la biodisponibilité des médicaments absorbés en milieu acide21, 47
.
L’alcalinisation du tractus gastro-intestinal peut affecter l’ionisation et la dissolution des
médicaments dont l’absorption est optimale dans un environnement acide, par exemple le
furosémide, et en réduire la biodisponibilité21, 47, 48
. Au contraire, une augmentation de la
biodisponibilité de certains médicaments faiblement acides comme l’ibuprofène et le
tolbutamide qui sont mieux absorbés en environnement plus alcalin a été observée en IRC47
.
2.2.2 LA BIOTRANSFORMATION INTESTINALE DES MÉDICAMENTS EN IRC
Les impacts de l’IRC sur la biotransformation intestinale des médicaments par les
CYP ont été étudiés au début des années 2000 dans un modèle de rats ayant subi une
néphrectomie 5/6 qui consiste à retirer chirurgicalement les 2/3 d’un rein et à retirer l’autre
rein entier une semaine plus tard. Chez ces rats, le CYP intestinal total était réduit de 30 %
comparativement aux rats témoins50
. Plus spécifiquement, les auteurs ont rapporté que
l’expression protéique des Cyp1a et Cyp3a intestinaux était diminuée de 43 % et 71 %,
8
respectivement50
. Ces diminutions étaient associées à une diminution de plus de 30 % de
l’ARNm de chacune des 2 isoformes50
. Finalement, les tests d’activité in vitro mesurant la
O-dééthylation de l’éthoxyrésorufine et la N-déméthylation de l’érythromycine dans des
microsomes intestinaux ont démontré une baisse d’au moins 25 % de l’activité métabolique
des Cyp1a et Cyp3a50
. Il a donc été suggéré que ces changements de l’expression et de
l’activité des CYP intestinaux pouvaient expliquer l’augmentation de la biodisponibilité de
plusieurs médicaments en IRC20, 50
. Toutefois, un autre groupe étudiant les effets de
l’insuffisance rénale aigüe induite par le cisplatin chez des rats a démontré que la
biodisponibilité du tacrolimus (un substrat du Cyp3a) était augmentée de 35 % chez ces
animaux sans qu’il y ait de changement de la biotransformation du tacrolimus par le Cyp3a42,
51. Selon les auteurs, l’augmentation de la biodisponibilité du tacrolimus était plutôt due à
une augmentation de la quantité absorbée de tacrolimus51
.
2.2.3 LE TRANSPORT INTESTINAL DES MÉDICAMENTS EN IRC
L’étude des effets de l’insuffisance rénale sur le transport intestinal des médicaments
a commencé au début des années 2000. Les premières études ont démontré in vitro, puis
in vivo, une diminution de l’activité de la P-gp, sans diminution de son expression protéique,
dans une monocouche de cellules Caco-2 incubées avec du sérum de rats souffrant
d’insuffisance rénale aigüe et dans l’intestin de rats souffrant d’insuffisance rénale aigüe
induite par le glycérol52, 53
. Veau et al. ont obtenu des résultats similaires chez des rats
souffrant d’IRC induite par néphrectomie 5/6 chez lesquels ils ont démontré ex vivo une
diminution de l’activité de la P-gp, mais pas de son expression protéique ou génique
intestinale54
. Plus tard, nous avons confirmé la réduction de l’activité de la P-gp intestinale en
IRC55
. Toutefois, nous avons aussi observé une diminution de l’expression protéique des
transporteurs d’efflux P-gp, Mrp2 et Mrp3, sans modification de leur expression génique,
dans l’intestin de rats néphrectomisés55
. L’expression des transporteurs d’influx Oatp2 et
Oatp3 n’était toutefois pas affectée par l’IRC55
. Ces résultats ont aussi été confirmés in vitro
en incubant des entérocytes de rats ainsi que des cellules Caco-2 avec du sérum provenant
des rats souffrant d’IRC55
. Une diminution de l’activité de la P-gp en IRC pourrait expliquer
9
l’augmentation de la quantité absorbée et de la biodisponibilité du tacrolimus décrite ci-
dessus puisque le tacrolimus est un substrat de la P-gp51
.
Les résultats d’études in vitro et dans des modèles animaux démontrent donc que des
diminutions de l’expression et de l’activité des CYP et des transporteurs de médicaments
intestinaux causées par l’IRC pourraient entraîner une augmentation de la biodisponibilité de
médicaments administrés par voie orale chez des patients souffrant d’insuffisance rénale.
2.3. LA DISTRIBUTION DES MÉDICAMENTS
Le volume de distribution (Vd) d’un médicament est aussi très important pour
déterminer la dose qui doit être administrée. Il permet de déterminer la capacité d’un
médicament à pénétrer dans les différents organes. Le Vd, de façon abstraite, représente le
volume fictif de liquide ou de tissus nécessaire pour obtenir une concentration de
médicament égale à celle retrouvée dans le sang pour une dose donnée7, 18
. Le Vd dépend
de la liaison du médicament aux protéines tissulaires et de la liaison aux protéines
plasmatiques. En effet, un haut taux de liaison aux protéines tissulaires a pour effet
d’abaisser les concentrations plasmatiques des médicaments et d’augmenter le Vd, alors
qu’un haut taux de liaison aux protéines plasmatiques a pour effet d’augmenter les
concentrations plasmatiques de médicaments et de faire paraître le Vd plus petit. C’est
toutefois seulement la fraction libre d’un médicament, c’est-à-dire la portion de
médicament non liée aux protéines plasmatiques et tissulaires, qui peut passer au travers
des membranes cellulaires et produire l’effet recherché. Aussi, seule la fraction libre peut
être extraite du sang par le foie et/ou les reins et être biotransformée et/ou excrétée dans
l’urine ou la bile. Un changement physiopathologique qui entraînerait une augmentation ou
une réduction de la fraction libre et pourrait causer de la toxicité ou une perte d’efficacité,
surtout pour des médicaments à faible indice thérapeutique.
10
2.3.1 LA DISTRIBUTION DES MÉDICAMENTS EN IRC
Il a été démontré que l’IRC affecte la liaison aux protéines plasmatiques de plusieurs
médicaments18, 46, 56
. Les médicaments acides, par exemple la pénicilline, le furosémide, les
barbituriques, les sulphonamides et la phénytoïne, sont surtout liés à l’albumine
plasmatique57
. Les patients insuffisants rénaux souffrent d’hypoalbuminémie due à une
augmentation de l’albuminurie ou à la malnutrition. De plus, l’urémie causée par l’IRC
entraîne la carbamylation de l’albumine, ce qui réduit l’affinité de l’albumine pour les
médicaments acides11, 21, 46, 47, 56, 58
et les patients prennent de nombreux médicaments
pouvant compétitionner pour les sites de liaison de l’albumine avec des molécules acides
organiques endogènes s’accumulant à cause de la fonction rénale réduite11, 21, 46, 47, 56
. Par
exemple, des réductions de 16 % et 20 % de la liaison aux protéines plasmatiques de la
phénytoïne et de la théophylline ont été rapportées chez des patients dialysés. Ces
réductions ont été attribuées à une compétition entre les médicaments et l’acide hippurique
s’accumulant en IRC pour la liaison à l’albumine plasmatique56
. Il semble donc clair que la
liaison des médicaments acides à l’albumine peut être réduite en IRC.
Toutefois, les médicaments basiques (alcalins), par exemple le propranolol, la
morphine et la vancomycine, se lient surtout à l’α1-glycoprotéine, dont les concentrations
plasmatiques sont élevées chez les patients souffrant de maladie rénale21, 47
. Bien qu’une
augmentation de la liaison aux protéines plasmatiques de médicaments basiques
(propranolol, cimétidine, clonidine, imipramine) ait été rapportée in vitro dans du sérum de
patients dialysés59
, la liaison aux protéines plasmatiques des médicaments basiques ne
semble pas être modifiée in vivo chez les patients souffrant d’IRC18, 21
.
Il ne faut pas oublier qu’une réduction de la liaison aux protéines plasmatiques d’un
médicament entraîne une augmentation de sa concentration libre et peut entraîner une
augmentation de son efficacité thérapeutique ou de la toxicité. Toutefois, la fraction ainsi
libérée du médicament devient disponible pour la liaison aux protéines tissulaires. Ceci
aurait pour effet d’augmenter le Vd du médicament. La fraction libérée serait aussi
disponible pour l’extraction rénale ou hépatique, ce qui aurait pour effet d’augmenter la
11
clairance du médicament. Une diminution de la liaison aux protéines plasmatiques aurait
donc théoriquement peu d’impact sur l’exposition aux médicaments21
. La clairance de
nombreux médicaments est réduite en IRC, l’élimination de la nouvelle fraction libre du
médicament ne peut donc pas nécessairement contrebalancer l’augmentation de la fraction
libre et empêcher l’apparition de toxicité. Par exemple, la fraction libre du cérivastatin est
augmentée chez les patients insuffisants rénaux et on observe aussi une forte augmentation
de sa surface sous la courbe qui est plus que doublée chez ces patients comparativement
aux témoins60
. Cette augmentation de l’exposition au cérivastatin en IRC a été attribuée à
une diminution de clairance hépatique due à une diminution de l’entrée du cérivastatin dans
les hépatocytes par les OATP, l’étape limitante de l’élimination de plusieurs statines61, 62
.
2.4. L’ÉLIMINATION HÉPATIQUE DES MÉDICAMENTS
L’élimination hépatique d’un médicament peut se diviser en trois étapes. Tout
d’abord, le médicament doit être importé dans les hépatocytes par diffusion passive ou par
transport actif par des transporteurs d’influx tel que l’OATP. Le médicament peut ensuite
être biotransformé par les enzymes de phase I et de phase II hépatiques. Finalement, le
médicament, biotransformé ou non, peut être rejeté dans la bile par des transporteurs d’efflux
tels que la P-gp ou les MRP. Les médicaments biotransformés peuvent aussi être retournés
dans la circulation systémique et éliminés par les reins. Comme mentionné précédemment, il
est connu, que l’IRC peut affecter la biotransformation et le transport intestinal des
médicaments, au moins dans des modèles animaux, il est donc tout à fait possible que ces
processus soient aussi modifiés dans le foie en IRC.
2.4.1 LA BIOTRANSFORMATION HÉPATIQUE DES MÉDICAMENTS EN IRC
Chez des patients souffrant d’IRC, une augmentation de la demi-vie de certains
médicaments à élimination majoritairement métabolique a été observée. Par exemple, le
repaglinide, un agent hypoglycémiant métabolisé par les CYP2C8 et CYP3A4 hépatiques
excrété par voie biliaire, présente une demi-vie 4 fois plus longue chez les patients
souffrant d’IRC à un stade avancé. Ceci démontre une importante diminution des
12
clairances biliaire et métabolique du repaglinide chez les patients souffrant d’IRC21
. De
plus, une étude in vivo portant sur le métabolisme de l’érythromycine, mesuré par test
d’exhalation, a permis de démontrer une diminution de 28 % de sa biotransformation dans
des cas de maladies rénales au stade terminal63
. Le test d’exhalation de l’érythromycine
consiste à administrer, par voie intraveineuse, de la N-méthyl-érythromycine marquée au
carbone 14 (14
C) sur son groupement méthyle. La biotransformation de l’érythromycine par
le CYP3A4 entraîne la libération du groupement méthyle. On retrouve le 14
C ainsi libéré
dans le CO2 expiré par le patient. Il a été démontré que la quantité de 14
C expiré est
directement proportionnelle à l’activité du CYP3A464
. Les résultats de Dowling et al.
suggèrent donc une réduction de 28 % de l’activité du CYP3A4 chez les patients atteints de
maladies rénales au stade terminal, cette isoforme étant responsable du métabolisme de la
majorité des xénobiotiques chez l’humain63
.
Des observations semblables ont été rapportées pour les réactions de phase II. Par
exemple, la diacéréine, un anti-inflammatoire non stéroïdien majoritairement métabolisé
par le foie par deux réactions de phase II, c.-à-d. 60 % de chaque dose administrée est
glucuronidé, 20 % est sulfaté alors que seulement 20 % est éliminé inchangé par les reins,
voit sa pharmacocinétique affectée par l’IRC65
. En effet, une étude de
Debord et al. (1994)66
démontre que le métabolisme non rénal de la diacéréine est diminué
de 40 % chez les patients souffrant d’IRC sévère. La diminution du métabolisme non rénal
de la diacéréine observée est assez importante pour que l’auteur recommande une
diminution de 50 % de la dose administrée chez un patient souffrant d’IRC par rapport à un
patient en santé66
. D’autres études ont aussi démontré que la glucuronidation de la
morphine et de la zidovudine était aussi diminuée en IRC. En effet, un groupe a observé
une clairance métabolique réduite de la morphine chez des patients avec insuffisance rénale
sévère ou dialysés67
et un autre groupe a rapporté une clairance non rénale de la zidovudine
diminuée de 48 % chez des sujets souffrant d’insuffisance rénale sévère68
. De plus,
plusieurs études ont démontré que l’acétylation était réduite chez les patients ayant une
fonction rénale réduite comme démontré par la diminution de la clairance non rénale du
procaïnamide69-71
et de l’isoniazide72
. La clairance de l’isoniazide est normalisée après une
greffe rénale72
.
13
De nombreuses études dans des modèles animaux ont tenté de démontrer les effets de
l’IRC sur la biotransformation hépatique des médicaments. La plupart des groupes se sont
concentrés sur le Cyp3a puisqu’il est le plus abondant dans le foie et puisqu’il est le CYP le
plus impliqué dans le métabolisme des médicaments actuellement sur le marché34, 73, 74
.
Plusieurs groupes ont démontré d’importantes réductions de l’expression et de l’activité
in vivo et in vitro des Cyp2c11, Cyp3a1 et Cyp3a2 dans le foie de rats néphrectomisés75-79
résultant d’une diminution de l’expression génique des différentes enzymes en réponse à des
facteurs urémiques présents dans le sérum de rats néphrectomisés et de patients souffrant
d’insuffisance rénale terminale75, 80, 81
. De plus, l’hémodialyse semble pouvoir retirer les
facteurs responsables de ces diminutions puisque le sérum de patients souffrant
d’insuffisance rénale terminale prélevé immédiatement après l’hémodialyse n’a pas d’effet
modulateur sur l’expression du CYP dans des hépatocytes de rats77
.
Quelques groupes ont étudié les impacts de l’IRC sur le métabolisme de phase II
hépatique dans des modèles animaux. L’expression et l’activité des enzymes catalysant la
glucuronidation, les uridines diphosphate-glucuronosyl transférases (UGT), et les enzymes
catalysant l’acétylation, les N-acétyltransférases (NAT), ont été mesurées dans le foie de rats
IRC. Alors que les UGT ne sont pas affectées par l’IRC dans un modèle de rat82
, des
réductions de plus de 30 % des expressions protéiques et géniques de Nat1 et Nat2 ont été
rapportées dans le foie de rats néphrectomisés83
. De plus, la N-acétylation de l’acide
para-aminobenzoïque (PABA) par Nat2, mesurée in vitro dans des cytosols de foie de rat,
était réduite de 50 % chez ces mêmes rats83
. Encore une fois, l’incubation d’hépatocytes de
rats avec du sérum d’animaux néphrectomisés pouvait entraîner la diminution de l’expression
protéique des NAT83
. Ceci suggère que des facteurs urémiques présents dans le sérum
d’animaux néphrectomisés causent les changements de l’expression des NAT.
Plusieurs facteurs urémiques pourraient être impliqués dans la diminution de
l’expression et de l’activité des CYP et des NAT. Un de ceux-ci est l’hormone
parathyroïdienne (PTH) dont les concentrations plasmatiques sont fortement augmentées en
IRC à cause d’une hyperparathyroïdie secondaire84
. En effet, la PTH peut moduler
14
l’expression du Cyp3a dans des hépatocytes de rat de façon dose-dépendante. De plus, chez
des rats ayant subi une parathyroïdectomie (ablation des glandes parathyroïdes) avant
l’induction de l’insuffisance rénale, la diminution de l’expression et de l’activité du Cyp3a et
des NAT est moindre que chez des animaux souffrant seulement d’IRC83, 84
. Ceci indique
que la parathyroïdectomie semble prévenir la diminution de l’expression et de l’activité du
Cyp3a et des NAT chez le rat néphrectomisé suggérant l’implication de la PTH dans ces
diminutions83, 84
.
D’autres facteurs comme les cytokines pro-inflammatoires qui sont fortement
augmentées en IRC85-88
et capables de moduler l’expression du CYP hépatique89
, de même
que des toxines urémiques telles que l’indoxyl sulfate (IS) et l’acide 3-carboxy-4-méthyl-5-
propyl-2-furan-propanoïque (CMPF) pourrait aussi être impliquées dans la réduction de
l’activité des CYP en IRC. En effet, l’IS peut inhiber la biotransformation du losartan par les
Cyp2c et Cyp3a dans des microsomes de foie de rat de façon non compétitive90
. De plus, il a
été démontré que l’IS et le CMPF peuvent, à de fortes concentrations, directement inhiber
l’activité du Cyp3a dans des microsomes de foie de rat tel que mesuré par la
N-déméthylation de l’érythromycine91
.
2.4.2 LE TRANSPORT HÉPATIQUE DES MÉDICAMENTS EN IRC
Dans le foie, des transporteurs d’influx et d’efflux permettent aux médicaments de
traverser les membranes plasmiques. Les transporteurs d’influx, situés sur la membrane
basolatérale des hépatocytes, extraient leurs substrats de la circulation sanguine et les
transportent jusqu’à l’intérieur des cellules hépatiques. Les médicaments sont ainsi
accessibles aux enzymes de biotransformation hépatiques et aux transporteurs d’extrusion
situés sur la membrane apicale des hépatocytes qui les rejettent dans la bile. Les principaux
transporteurs d’influx hépatiques sont les OATP, les organic anion transporters (OAT) et les
organic cation transporters (OCT). Parmi les transporteurs d’extrusion, les plus importants
sont la P-gp, les MRP et la breast cancer resistance protein (BCRP). La P-gp et MRP2 sont
toutefois les transporteurs d’efflux les plus impliqués dans l’élimination des médicaments92-
94.
15
Avant le début de mon doctorat, très peu d’études avaient évalué les répercussions de
l’IRC sur le transport hépatique des médicaments. Un groupe avait rapporté que les
expressions protéique et génique de Mrp2 étaient augmentées six semaines post-
néphrectomie. Le même groupe n’avait toutefois pas observé de modification de la P-gp dans
le foie des mêmes animaux comparativement aux témoins95
. Toutefois, les auteurs n’avaient
pas mesuré l’expression et l’activité des transporteurs d’influx en IRC95
. L’activité de ces
transporteurs en IRC avait été étudiée indirectement dans une étude de Sun et al. portant sur
les effets de différentes toxines urémiques sur l’import de l’érythromycine dans des
hépatocytes de rat91
. Ils ont ainsi démontré que le CMPF peut directement inhiber l’import de
l’érythromycine dans l’hépatocyte par Oatp2 ce qui suggérait que l’activité de l’Oatp2
hépatique pouvait être diminuée en IRC, bien qu’aucune étude in vivo ne l’ait confirmé91
.
Une telle diminution de l’activité de l’Oatp2 hépatique en IRC laissait supposer que
des diminutions du transport et de la biotransformation hépatique des médicaments sont
responsables de la clairance hépatique réduite de certains médicaments en IRC91
. Toutefois,
plus d’études étaient nécessaires pour bien identifier les impacts de l’IRC sur le transport
hépatique des médicaments.
2.5. L’ÉLIMINATION RÉNALE DES MÉDICAMENTS
L’élimination rénale des médicaments ne dépend pas seulement de leur filtration
glomérulaire. En effet, la clairance rénale dépend aussi de la sécrétion tubulaire et de la
réabsorption tubulaire des médicaments. La sécrétion et la réabsorption tubulaires sont toutes
deux régulées par les transporteurs d’influx et d’efflux exprimés dans les cellules tubulaires
rénales96-103
. Parmi les transporteurs exprimés dans les cellules tubulaires rénales, on
retrouve la P-gp et les MRP2, 3 et 4. La majorité sont exprimés à la membrane apicale des
cellules tubulaires proximales (P-gp, MRP2, MRP4) et rejettent les substrats transportés
dans l’urine. MRP3 est plutôt exprimée à la membrane basolatérale des cellules tubulaires
distales et participe à la réabsorption de ses substrats de l’urine. On retrouve aussi le
type 1 sodium-dependent phosphate transporter (NPT1), les OAT1, 2 et 3, les OATK1/K2,
16
les OATP1, 2, 3 et 4C1 et le transporteur d’urate URAT1. La plupart de ces transporteurs
sont des transporteurs d’influx situés à la membrane basolatérale ou apicale des cellules
tubulaires proximales où ils participent à l’excrétion des composés du sang ou de l’urine
vers les cellules tubulaires rénales100, 102, 104
.
2.5.1 L’ÉLIMINATION RÉNALE DES MÉDICAMENTS EN IRC
Il est bien connu que l’IRC est caractérisée par une importante diminution du taux
de filtration glomérulaire affectant directement le processus d’élimination rénale de
plusieurs médicaments comme la metformine, la vancomycine et l’acétazolamide7, 105
.
Toutefois, très peu de données ont été rapportées concernant les effets de l’IRC sur la
sécrétion rénale des médicaments. Quelques études cliniques ont quand même rapporté que
l’élimination rénale de médicaments éliminés majoritairement par sécrétion tubulaire était
réduite en IRC ce qui avait pour effet d’augmenter leur surface sous la courbe. Parmi ces
médicaments, on retrouve le sitagliptin (un substrat de OAT3 et de la P-gp), l’entecavir et
le gémifloxacin (des substrats potentiels des OAT et OCT106, 107
), la varénicline (un substrat
d’OCT2) et l’emtricitabine (un substrat potentiel des OCT108
)105
. De plus, un groupe ayant
mesuré l’expression de l’ARNm des transporteurs OAT1, OAT2, OAT3 et OAT4 dans le
rein de sujets humains souffrant de légère dysfonction rénale ont rapporté une diminution
significative de l’expression de OAT1 comparativement à des sujets témoins sains109
. Ces
données cliniques suggèrent que la sécrétion tubulaire active et les transporteurs de
médicaments rénaux sont altérés chez les patients souffrant d’insuffisance rénale.
Peu d’études dans des modèles animaux ont tenté de confirmer cette hypothèse.
Tout d’abord, une étude réalisée dans un modèle de rats néphrectomisés a démontré une
augmentation de 200 % de l’expression protéique de Mrp2 dans le rein restant trois et six
semaines après la néphrectomie par rapport aux rats témoins95
. Le même groupe n’a
toutefois pas observé d’altération de l’expression de la P-gp chez les mêmes animaux95
. Un
autre groupe a observé une diminution de 65 % de l’expression protéique de l’organic
cation transporter 2 (Oct2) dans le rein de rats deux semaines post-néphrectomie
comparativement aux témoins et cette diminution était associée à une diminution de la
17
sécrétion tubulaire de la cimétidine110
. Le même groupe a aussi mesuré l’expression de
Oat1 et Oat3 sans observer de modification bien qu’ils aient observé une diminution de la
sécrétion de para-aminohippurate, un de leurs substrats110
. Par contre, un autre groupe
ayant mesuré l’expression protéique de Oat1 et Oat3 quatre semaines post-néphrectomie
ont observé une diminution d’environ 50 % de leur expression protéique comparativement
aux animaux témoins111
. De plus, ils ont démontré que l’expression protéique de ces
transporteurs corrélait avec le transport rénal de l’acide hippurique chez ces animaux111
.
Finalement, un dernier groupe a démontré une baisse de l’expression génique de OatK1 et
OatK2 dans le rein de rats quatre semaines post-néphrectomie sans changement de
l’expression de Mrp2112
.
À ce jour, les études dans les modèles animaux semblent donc confirmer que l’IRC
affecte la sécrétion tubulaire, donc les transporteurs de médicaments rénaux, bien que
certains résultats soient contradictoires. D’autres études sont donc nécessaires pour bien
identifier les impacts de l’IRC sur le transport actif rénal des médicaments.
2.6. LA PÉNÉTRATION DES MÉDICAMENTS À TRAVERS LA BARRIÈRE
HÉMATOENCÉPHALIQUE
La barrière hématoencéphalique (BHE) est une barrière physique et biochimique
hautement sélective entre le cerveau et la circulation sanguine systémique. Elle est formée
par une monocouche de cellules endothéliales non fenestrées et jointes entre elles par des
jonctions étanches de type zonula occludens maintenues par des facteurs trophiques relâchés
par les astrocytes entourant les microvaisseaux cérébraux. Ces cellules endothéliales bordent
les microvaisseaux formant un réseau de capillaires qui, chez l’humain, s’étend sur 600 km
avec une distance moyenne de 40 µm entre chaque capillaire113-117
. La présence de jonctions
étanches zonula occludens entre les cellules endothéliales les rend quasi imperméables au
passage paracellulaire de substances endogènes et exogènes forçant les molécules à
emprunter un mécanisme de transport transcellulaire pour entrer au cerveau. Seules de très
petites molécules gazeuses comme le CO2 et l’O2 de même que de très petites molécules
lipidiques comme les barbituriques et l’éthanol peuvent diffuser librement à travers les
18
membranes plasmiques. Des systèmes de transport spécifiques incluant de nombreux
récepteurs, des canaux ioniques et des transporteurs d’influx et d’efflux sont exprimés aux
membranes luminales et abluminales de la BHE afin de réguler le trafic transcellulaire de
petites molécules hydrophiles en facilitant l’entrée de nutriments comme le glucose ou les
acides aminés dans le cerveau et en exportant ou en bloquant l’entrée de composés
potentiellement toxique comme le glutamate113, 114, 116
.
Parmi les transporteurs exprimés à la BHE, on retrouve, à la membrane luminale, les
transporteurs d’efflux P-gp, MRP2, 4 et 5 qui exportent les molécules de la cellule
endothéliale vers le sang116, 118-122
. Les transporteurs OATP2 et OAT3 sont exprimés aux
membranes luminales et abluminales des cellules endothéliales cérébrales et participent à
l’entrée des médicaments du sang vers le cerveau et à la sortie des médicaments du cerveau
vers le sang. OATP3, exprimé à la membrane luminale effectue aussi le transport
bidirectionnel de ses substrats116, 118, 121-128
.
2.5.1 LA PÉNÉTRATION DES MÉDICAMENTS À TRAVERS LA BARRIÈRE HÉMATOENCÉPHALIQUE EN
IRC
À ce jour, aucune étude ne rapporte les impacts de l’IRC sur l’expression et
l’activité des transporteurs de médicaments à la BHE. Toutefois, des évidences cliniques
suggèrent que leur activité pourrait être modulée par l’IRC. En effet, des cas de
neurotoxicité par des céphalosporines et des antibiotiques de la famille des bêta-lactames
ont été rapportés chez des patients ayant une fonction rénale réduite malgré des
concentrations plasmatiques normales de médicaments129-131
. Les transporteurs de
médicaments exprimés à la BHE empêchent normalement l’entrée de ces médicaments au
cerveau123
. En effet, les céphalosporines et les antibiotiques de la famille des bêta-lactames
sont des substrats connus de OAT3 et des MRP à la BHE et dans les reins123, 132-134
. Des
perturbations du transport de ces antibiotiques à la BHE en insuffisance rénale causant une
augmentation de leur concentration intracérébrale pourraient expliquer les cas de
neurotoxicités observés malgré des concentrations plasmatiques normales.
19
De plus, des études ont démontré que l’inflammation intracérébrale et
l’inflammation systémique pouvaient réduire l’expression de la P-gp à la BHE et dans le
foie, entraînant l’accumulation de ses substrats dans le cerveau et le plasma135-137
. Comme
l’IRC correspond à un état inflammatoire chronique138-142
, il est tout à fait possible que
l’expression de la P-gp soit réduite à la BHE chez des sujets souffrant d’IRC favorisant
ainsi l’accumulation de médicaments dans leur cerveau. Des études sont toutefois
nécessaires pour bien caractériser les impacts de l’insuffisance rénale chronique sur les
transporteurs de médicaments exprimés à la BHE et sur la perméabilité de la BHE.
3. LES TRANSPORTEURS DE MEDICAMENTS
Il est donc clair que l’IRC affecte plusieurs étapes de la pharmacocinétique des
médicaments. En effet, des modifications de l’absorption, de la distribution et de
l’élimination des médicaments par l’IRC ont été rapportées. Les transporteurs de
médicaments sont fortement impliqués dans ces processus. Ma thèse porte sur les impacts
de l’IRC sur le transport des médicaments dans l’intestin, le foie, les reins et le cerveau.
Cette section de l’introduction se veut donc une description détaillée des différentes
familles de transporteurs de médicaments et tout particulièrement des transporteurs dont il
sera question tout au long de cette thèse. On y présente les transporteurs, leurs principaux
substrats et leurs fonctions physiologiques.
À ce jour, plus de 400 transporteurs membranaires ont été identifiés dans le génome
humain98
. Ils sont classés en deux grandes familles : les transporteurs ABC (ABC signifiant
ATP-binding cassette) et les « solute carriers » (SLC). Ces transporteurs sont exprimés dans
les diverses membranes cellulaires du corps humain et facilitent l’entrée (l’influx) ou la
sortie (l’efflux) de substrats endogènes tels des acides aminés, des nucléotides, des
hormones ou des sucres dans les cellules membranaires ou dans les organelles. Certains
transporteurs sont toutefois aussi reconnus pour effectuer le transport de xénobiotiques, des
20
substrats exogènes, en plus du transport de molécules endogènes. C’est de ces transporteurs
dont il sera question dans le cadre de cette thèse. On les retrouve surtout dans des organes
ayant une fonction biologique de barrières tels l’intestin, le foie, les reins, le placenta et la
barrière hématoencéphalique où ils jouent un rôle important dans la biodisponibilité,
l’élimination biliaire, la sécrétion et la réabsorption tubulaires rénales, l’exposition fœtale
aux xénobiotiques et la distribution des médicaments au cerveau.
3.1. LES « ABC-TRANSPORTERS »
La superfamille des transporteurs ABC est une des plus importantes classes de
protéines identifiées à ce jour143
. On y retrouve de nombreuses protéines impliquées dans le
transport de molécules biologiques endogènes et exogènes à travers les membranes
cellulaires143
. Bien qu’il existe une grande variété de transporteurs ABC, ils partagent la
même structure de base, illustrée dans la Figure 2, composée de domaines
transmembranaires (TMD) hydrophobes généralement formés de 6 hélices alpha et de deux
domaines cytoplasmiques de liaison de nucléotides (nucleotide binding domains [NBD])
capables de lier et hydrolyser des molécules d’ATP pour fournir l’énergie nécessaire au
transport des molécules144
. La séquence des acides aminés des NBD est très bien conservée
parmi les différentes sous-familles de transporteurs ABC et présente de 30 à 40 %
d’homologie dans une région clé de 200-250 acides aminés143, 145
. Ce sont les TMD, avec
leur grande variabilité de séquence, qui confèrent la spécificité des transporteurs ABC pour
leurs substrats. En effet, les TMD forment le canal transmembranaire et contiennent les
sites de liaison des substrats96
. De plus, les transporteurs ABC possèdent tous une ou
plusieurs branches de N-glycosylation sur leurs boucles extracellulaires qui ne semblent pas
nécessaires à l’activité des transporteurs, mais qui semblent impliquées dans
l’acheminement du transporteur vers la membrane cellulaire de même que dans son
insertion et sa stabilité à la membranaire cellulaire146
.
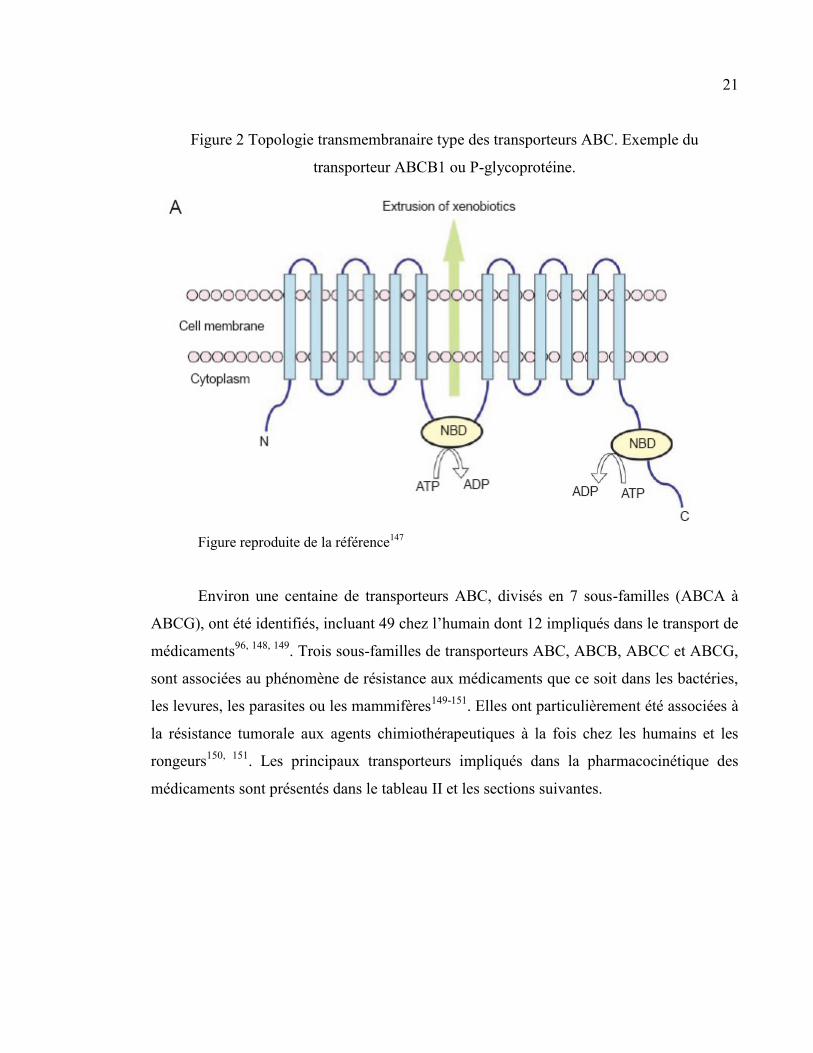
21
Figure 2 Topologie transmembranaire type des transporteurs ABC. Exemple du
transporteur ABCB1 ou P-glycoprotéine.
Figure reproduite de la référence147
Environ une centaine de transporteurs ABC, divisés en 7 sous-familles (ABCA à
ABCG), ont été identifiés, incluant 49 chez l’humain dont 12 impliqués dans le transport de
médicaments96, 148, 149
. Trois sous-familles de transporteurs ABC, ABCB, ABCC et ABCG,
sont associées au phénomène de résistance aux médicaments que ce soit dans les bactéries,
les levures, les parasites ou les mammifères149-151
. Elles ont particulièrement été associées à
la résistance tumorale aux agents chimiothérapeutiques à la fois chez les humains et les
rongeurs150, 151
. Les principaux transporteurs impliqués dans la pharmacocinétique des
médicaments sont présentés dans le tableau II et les sections suivantes.
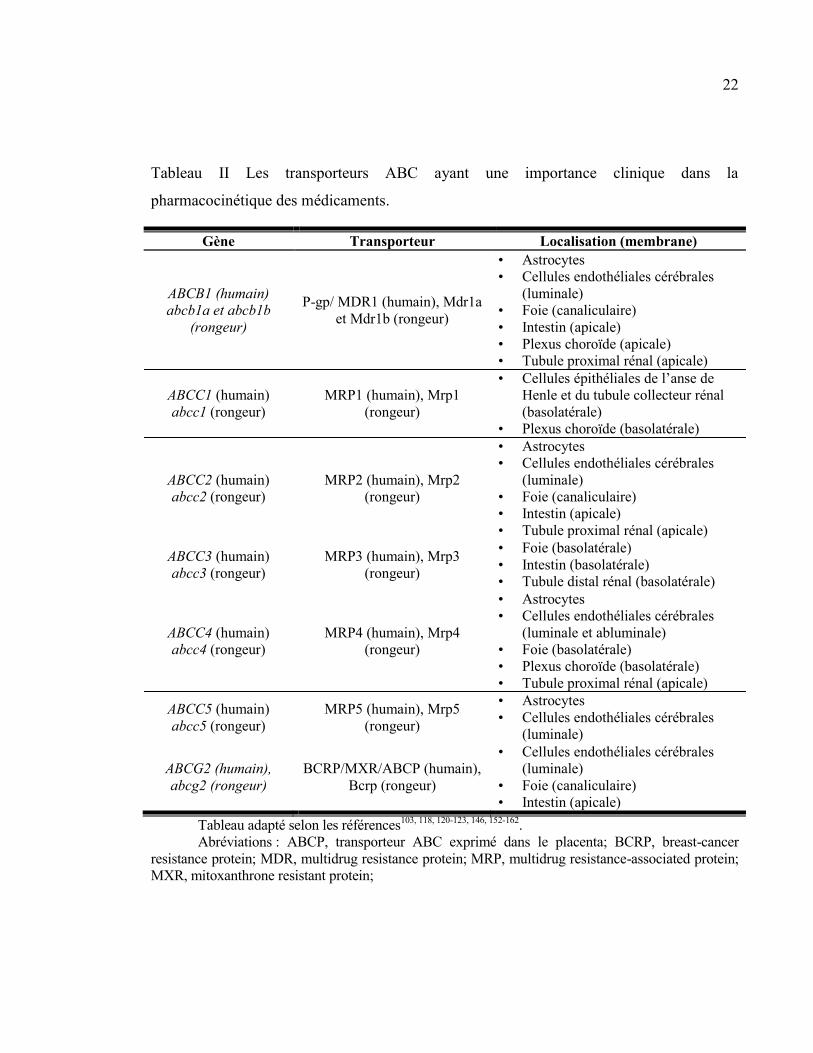
22
Tableau II Les transporteurs ABC ayant une importance clinique dans la
pharmacocinétique des médicaments.
Gène Transporteur Localisation (membrane)
ABCB1 (humain)
abcb1a et abcb1b
(rongeur)
P-gp/ MDR1 (humain), Mdr1a
et Mdr1b (rongeur)
• Astrocytes
• Cellules endothéliales cérébrales
(luminale)
• Foie (canaliculaire)
• Intestin (apicale)
• Plexus choroïde (apicale)
• Tubule proximal rénal (apicale)
ABCC1 (humain)
abcc1 (rongeur)
MRP1 (humain), Mrp1
(rongeur)
• Cellules épithéliales de l’anse de
Henle et du tubule collecteur rénal
(basolatérale)
• Plexus choroïde (basolatérale)
ABCC2 (humain)
abcc2 (rongeur)
MRP2 (humain), Mrp2
(rongeur)
• Astrocytes
• Cellules endothéliales cérébrales
(luminale)
• Foie (canaliculaire)
• Intestin (apicale)
• Tubule proximal rénal (apicale)
ABCC3 (humain)
abcc3 (rongeur)
MRP3 (humain), Mrp3
(rongeur)
• Foie (basolatérale)
• Intestin (basolatérale)
• Tubule distal rénal (basolatérale)
ABCC4 (humain)
abcc4 (rongeur)
MRP4 (humain), Mrp4
(rongeur)
• Astrocytes
• Cellules endothéliales cérébrales
(luminale et abluminale)
• Foie (basolatérale)
• Plexus choroïde (basolatérale)
• Tubule proximal rénal (apicale)
ABCC5 (humain)
abcc5 (rongeur)
MRP5 (humain), Mrp5
(rongeur)
• Astrocytes
• Cellules endothéliales cérébrales
(luminale)
ABCG2 (humain),
abcg2 (rongeur)
BCRP/MXR/ABCP (humain),
Bcrp (rongeur)
• Cellules endothéliales cérébrales
(luminale)
• Foie (canaliculaire)
• Intestin (apicale)
Tableau adapté selon les références103, 118, 120-123, 146, 152-162
.
Abréviations : ABCP, transporteur ABC exprimé dans le placenta; BCRP, breast-cancer
resistance protein; MDR, multidrug resistance protein; MRP, multidrug resistance-associated protein;
MXR, mitoxanthrone resistant protein;
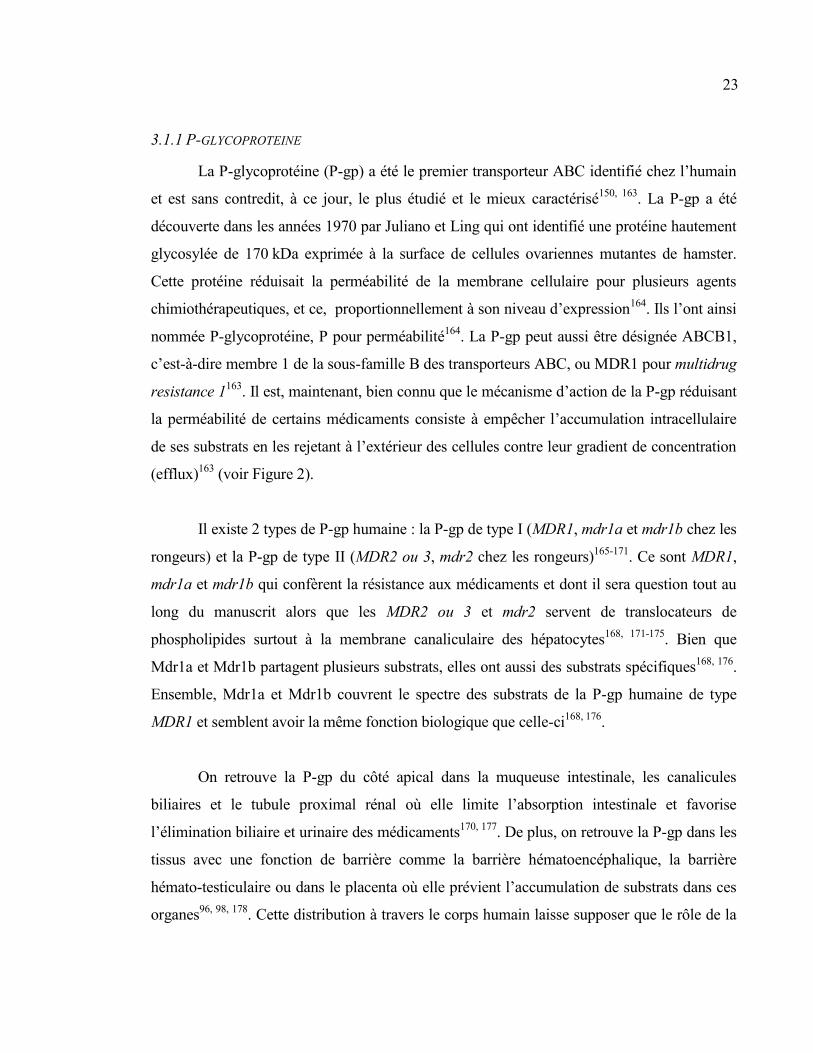
23
3.1.1 P-GLYCOPROTEINE
La P-glycoprotéine (P-gp) a été le premier transporteur ABC identifié chez l’humain
et est sans contredit, à ce jour, le plus étudié et le mieux caractérisé150, 163
. La P-gp a été
découverte dans les années 1970 par Juliano et Ling qui ont identifié une protéine hautement
glycosylée de 170 kDa exprimée à la surface de cellules ovariennes mutantes de hamster.
Cette protéine réduisait la perméabilité de la membrane cellulaire pour plusieurs agents
chimiothérapeutiques, et ce, proportionnellement à son niveau d’expression164
. Ils l’ont ainsi
nommée P-glycoprotéine, P pour perméabilité164
. La P-gp peut aussi être désignée ABCB1,
c’est-à-dire membre 1 de la sous-famille B des transporteurs ABC, ou MDR1 pour multidrug
resistance 1163
. Il est, maintenant, bien connu que le mécanisme d’action de la P-gp réduisant
la perméabilité de certains médicaments consiste à empêcher l’accumulation intracellulaire
de ses substrats en les rejetant à l’extérieur des cellules contre leur gradient de concentration
(efflux)163
(voir Figure 2).
Il existe 2 types de P-gp humaine : la P-gp de type I (MDR1, mdr1a et mdr1b chez les
rongeurs) et la P-gp de type II (MDR2 ou 3, mdr2 chez les rongeurs)165-171
. Ce sont MDR1,
mdr1a et mdr1b qui confèrent la résistance aux médicaments et dont il sera question tout au
long du manuscrit alors que les MDR2 ou 3 et mdr2 servent de translocateurs de
phospholipides surtout à la membrane canaliculaire des hépatocytes168, 171-175
. Bien que
Mdr1a et Mdr1b partagent plusieurs substrats, elles ont aussi des substrats spécifiques168, 176
.
Ensemble, Mdr1a et Mdr1b couvrent le spectre des substrats de la P-gp humaine de type
MDR1 et semblent avoir la même fonction biologique que celle-ci168, 176
.
On retrouve la P-gp du côté apical dans la muqueuse intestinale, les canalicules
biliaires et le tubule proximal rénal où elle limite l’absorption intestinale et favorise
l’élimination biliaire et urinaire des médicaments170, 177
. De plus, on retrouve la P-gp dans les
tissus avec une fonction de barrière comme la barrière hématoencéphalique, la barrière
hémato-testiculaire ou dans le placenta où elle prévient l’accumulation de substrats dans ces
organes96, 98, 178
. Cette distribution à travers le corps humain laisse supposer que le rôle de la
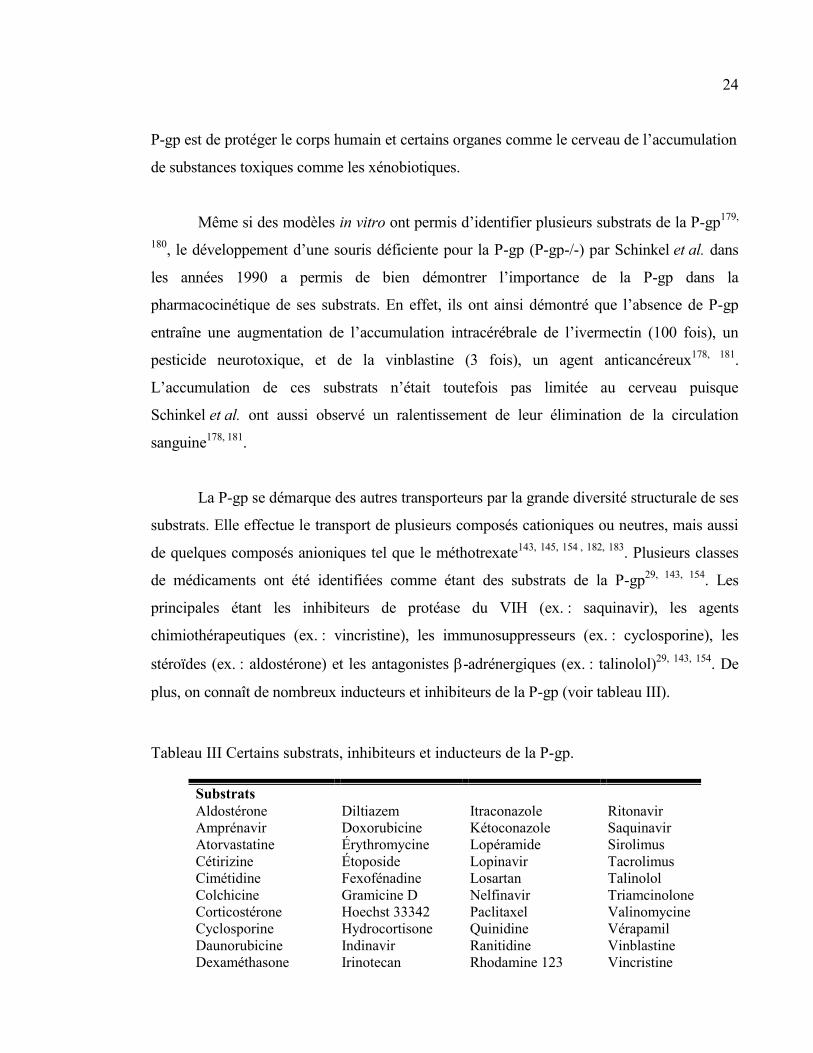
24
P-gp est de protéger le corps humain et certains organes comme le cerveau de l’accumulation
de substances toxiques comme les xénobiotiques.
Même si des modèles in vitro ont permis d’identifier plusieurs substrats de la P-gp179,
180, le développement d’une souris déficiente pour la P-gp (P-gp-/-) par Schinkel et al. dans
les années 1990 a permis de bien démontrer l’importance de la P-gp dans la
pharmacocinétique de ses substrats. En effet, ils ont ainsi démontré que l’absence de P-gp
entraîne une augmentation de l’accumulation intracérébrale de l’ivermectin (100 fois), un
pesticide neurotoxique, et de la vinblastine (3 fois), un agent anticancéreux178, 181
.
L’accumulation de ces substrats n’était toutefois pas limitée au cerveau puisque
Schinkel et al. ont aussi observé un ralentissement de leur élimination de la circulation
sanguine178, 181
.
La P-gp se démarque des autres transporteurs par la grande diversité structurale de ses
substrats. Elle effectue le transport de plusieurs composés cationiques ou neutres, mais aussi
de quelques composés anioniques tel que le méthotrexate143, 145, 154 , 182, 183
. Plusieurs classes
de médicaments ont été identifiées comme étant des substrats de la P-gp29, 143, 154
. Les
principales étant les inhibiteurs de protéase du VIH (ex. : saquinavir), les agents
chimiothérapeutiques (ex. : vincristine), les immunosuppresseurs (ex. : cyclosporine), les
stéroïdes (ex. : aldostérone) et les antagonistes -adrénergiques (ex. : talinolol)29, 143, 154
. De
plus, on connaît de nombreux inducteurs et inhibiteurs de la P-gp (voir tableau III).
Tableau III Certains substrats, inhibiteurs et inducteurs de la P-gp.
Substrats
Aldostérone
Amprénavir
Atorvastatine
Cétirizine
Cimétidine
Colchicine
Corticostérone
Cyclosporine
Daunorubicine
Dexaméthasone
Diltiazem
Doxorubicine
Érythromycine
Étoposide
Fexofénadine
Gramicine D
Hoechst 33342
Hydrocortisone
Indinavir
Irinotecan
Itraconazole
Kétoconazole
Lopéramide
Lopinavir
Losartan
Nelfinavir
Paclitaxel
Quinidine
Ranitidine
Rhodamine 123
Ritonavir
Saquinavir
Sirolimus
Tacrolimus
Talinolol
Triamcinolone
Valinomycine
Vérapamil
Vinblastine
Vincristine
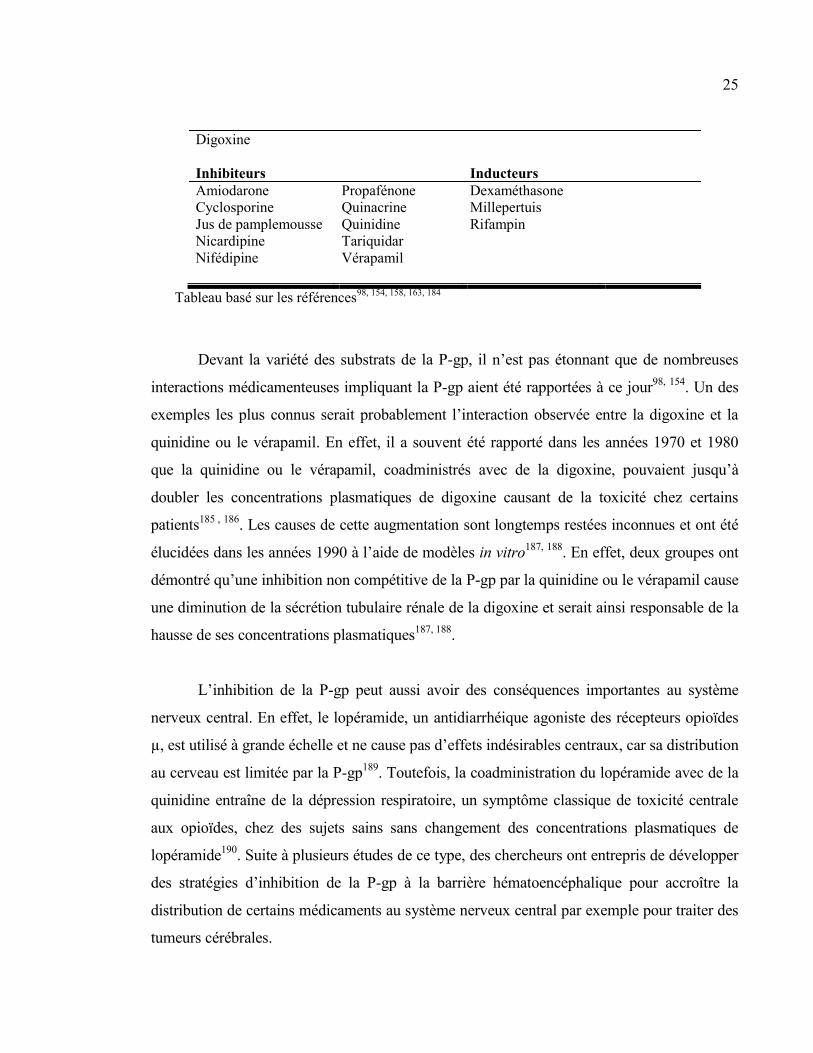
25
Digoxine
Inhibiteurs Inducteurs
Amiodarone
Cyclosporine
Jus de pamplemousse
Nicardipine
Nifédipine
Propafénone
Quinacrine
Quinidine
Tariquidar
Vérapamil
Dexaméthasone
Millepertuis
Rifampin
Tableau basé sur les références98, 154, 158, 163, 184
Devant la variété des substrats de la P-gp, il n’est pas étonnant que de nombreuses
interactions médicamenteuses impliquant la P-gp aient été rapportées à ce jour98, 154
. Un des
exemples les plus connus serait probablement l’interaction observée entre la digoxine et la
quinidine ou le vérapamil. En effet, il a souvent été rapporté dans les années 1970 et 1980
que la quinidine ou le vérapamil, coadministrés avec de la digoxine, pouvaient jusqu’à
doubler les concentrations plasmatiques de digoxine causant de la toxicité chez certains
patients185 , 186
. Les causes de cette augmentation sont longtemps restées inconnues et ont été
élucidées dans les années 1990 à l’aide de modèles in vitro187, 188
. En effet, deux groupes ont
démontré qu’une inhibition non compétitive de la P-gp par la quinidine ou le vérapamil cause
une diminution de la sécrétion tubulaire rénale de la digoxine et serait ainsi responsable de la
hausse de ses concentrations plasmatiques187, 188
.
L’inhibition de la P-gp peut aussi avoir des conséquences importantes au système
nerveux central. En effet, le lopéramide, un antidiarrhéique agoniste des récepteurs opioïdes
µ, est utilisé à grande échelle et ne cause pas d’effets indésirables centraux, car sa distribution
au cerveau est limitée par la P-gp189
. Toutefois, la coadministration du lopéramide avec de la
quinidine entraîne de la dépression respiratoire, un symptôme classique de toxicité centrale
aux opioïdes, chez des sujets sains sans changement des concentrations plasmatiques de
lopéramide190
. Suite à plusieurs études de ce type, des chercheurs ont entrepris de développer
des stratégies d’inhibition de la P-gp à la barrière hématoencéphalique pour accroître la
distribution de certains médicaments au système nerveux central par exemple pour traiter des
tumeurs cérébrales.
26
L’induction de la P-gp peut aussi causer des interactions médicamenteuses et avoir
des répercussions pharmacocinétiques importantes. Par exemple, l’induction de la P-gp
intestinale peut entraîner une diminution de la biodisponibilité de ses substrats et ainsi, une
diminution de leur efficacité. Un très bon exemple de ce phénomène est celui de l’interaction
entre le millepertuis et la cyclosporine. Le millepertuis, un produit naturel offert sans
ordonnance et souvent utilisé pour le traitement de la dépression légère, est un inducteur
connu de l’expression de la P-gp intestinale. Cette propriété aurait pu avoir des conséquences
désastreuses chez deux patients ayant reçu une greffe cardiaque qui prenaient de la
cyclosporine comme médication antirejet. L’immunosuppression chez ces patients était
stable depuis plusieurs mois lorsqu’ils ont décidé, par initiative personnelle, de prendre du
millepertuis pour traiter de légers symptômes dépressifs. Environ 3 semaines plus tard, les
deux patients se sont présentés à l’hôpital pour subir une biopsie endomyocardique élective.
Tous deux présentaient des signes de rejet aigu du greffon et des concentrations plasmatiques
de cyclosporine inférieures au seuil thérapeutique qui ont été attribuées à une interaction
médicamenteuse entre le millepertuis et la cyclosporine. La cessation du traitement au
millepertuis a permis un retour à la normale des concentrations de cyclosporine et les patients
n’ont pas subi d’autres épisodes de rejet191
.
3.1.2 LES « MULTIDRUG RESISTANCE-ASSOCIATED PROTEINS » (MRP)
Les « mutlidrug resistance-associated proteins » (MRP) font partie de la
sous-famille ABCC des transporteurs ABC. Il s’agit de transporteurs d’efflux exprimés
dans plusieurs membranes cellulaires, particulièrement dans l’intestin, le foie, les reins, la
barrière hématoencéphalique et la barrière placentaire, ce qui témoigne de leur implication
dans l’absorption, la distribution et l’élimination des médicaments ainsi que dans leur
fonction de barrière, protégeant les milieux essentiels et vulnérables aux xénobiotiques
toxiques. Les MRP ont été décrits pour la première fois dans la lignée de cellules
pulmonaires cancéreuses H69AR résistante à la doxorubicine, ainsi qu’à plusieurs agents
chimiothérapeutiques, ne surexprimant pas la P-gp192
. Les auteurs y ont découvert une
protéine de 1522 acides aminés fortement surexprimée qu’ils ont appelée « multidrug
resistance-associated protein » et qu’ils ont identifiée comme faisant partie de la
27
superfamille des transporteurs ABC192
. Cette protéine est maintenant connue sous le nom
de MRP1 ou ABCC1, le premier de plusieurs MRP.
Les MRP présentent une grande diversité de substrats lipophiliques anioniques
endogènes et exogènes avec un certain chevauchement entre les différents transporteurs.
Les MRP transportent de nombreuses molécules endogènes ou exogènes conjuguées au
glutathion (p. ex : leukotriène C4), à l’acide glucuronique (p. ex : bilirubine) ou au sulfate
(p. ex : sels biliaires) par le métabolisme de phase II143, 193-195
. L’efflux des métabolites de
médicaments ou de molécules endogènes conjugués est souvent la dernière étape dans leur
processus de détoxification. Les MRP y jouent donc un rôle clé puisqu’il s’agit de la plus
grande famille de transporteurs d’efflux impliqués dans l’excrétion biliaire, urinaire ou
intestinale des molécules conjuguées156
. De plus, les MRP confèrent de la résistance à
plusieurs xénobiotiques comme des agents chimiothérapeutiques (p. ex : doxorubicine) ou
antiviraux (p. ex : ganciclovir) non conjugués par un mécanisme de cotransport avec le
glutathion (voir tableau IV).
Il existe 9 différents MRP chez l’humain et de nombreux gènes et protéines
orthologues ont été identifiés dans différentes espèces mammifères. À ce jour, 7 et 8 gènes
orthologues ont été identifiés chez le rat et la souris, respectivement. Les MRP2, MRP3 et
MRP4, ainsi que leurs orthologues Mrp2, Mrp3 et Mrp4 chez le rat, sont toutefois les plus
impliquées dans l’absorption et l’élimination des médicaments98
. À la barrière
hématoencéphalique, ce sont les transporteurs MRP2 (Mrp2), MRP4 (Mrp4) et MRP5
(Mrp5) qui jouent un rôle dans la protection du cerveau contre les xénobiotiques158
.
L’expression de ces transporteurs peut être induite par de nombreuses molécules,
particulièrement par des inducteurs connus des enzymes de biotransformation du cytochrome
P450196
. Ces transporteurs sont présentés dans les tableaux II et IV et dans les sections
suivantes.
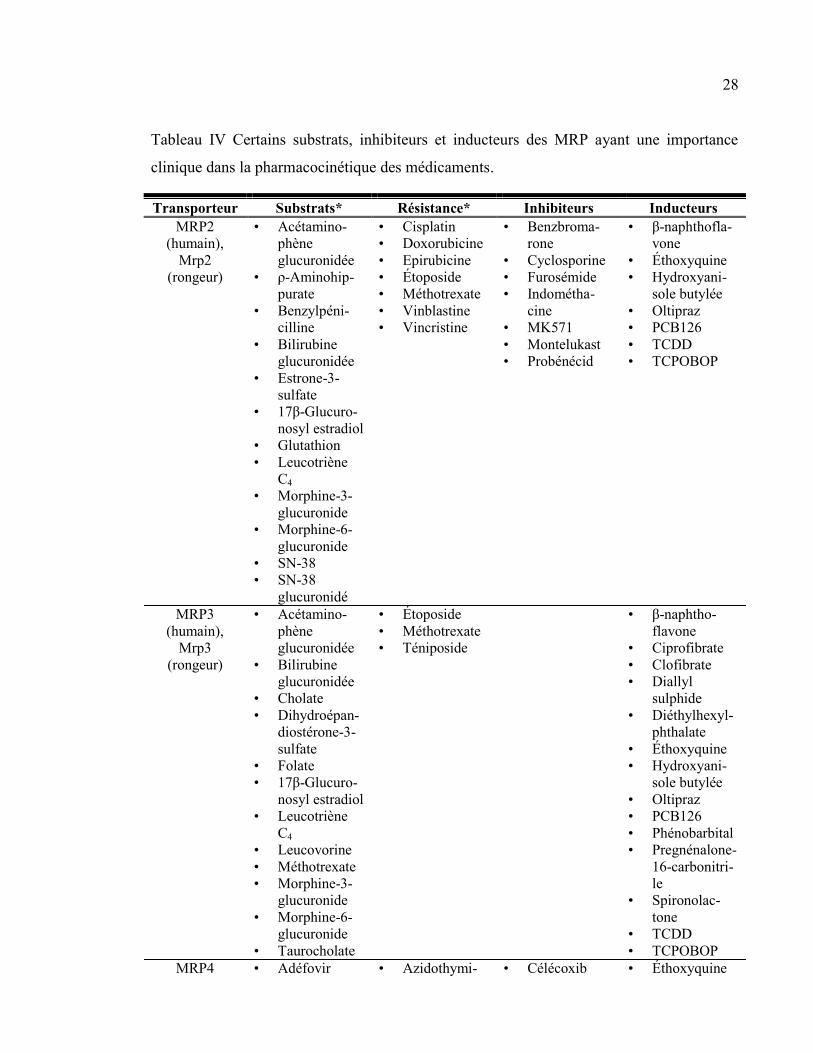
28
Tableau IV Certains substrats, inhibiteurs et inducteurs des MRP ayant une importance
clinique dans la pharmacocinétique des médicaments.
Transporteur Substrats* Résistance* Inhibiteurs Inducteurs
MRP2
(humain),
Mrp2
(rongeur)
• Acétamino-
phène
glucuronidée
• ρ-Aminohip-
purate
• Benzylpéni-
cilline
• Bilirubine
glucuronidée
• Estrone-3-
sulfate
• 17β-Glucuro-
nosyl estradiol
• Glutathion
• Leucotriène
C4
• Morphine-3-
glucuronide
• Morphine-6-
glucuronide
• SN-38
• SN-38
glucuronidé
• Cisplatin
• Doxorubicine
• Epirubicine
• Étoposide
• Méthotrexate
• Vinblastine
• Vincristine
• Benzbroma-
rone
• Cyclosporine
• Furosémide
• Indométha-
cine
• MK571
• Montelukast
• Probénécid
• β-naphthofla-
vone
• Éthoxyquine
• Hydroxyani-
sole butylée
• Oltipraz
• PCB126
• TCDD
• TCPOBOP
MRP3
(humain),
Mrp3
(rongeur)
• Acétamino-
phène
glucuronidée
• Bilirubine
glucuronidée
• Cholate
• Dihydroépan-
diostérone-3-
sulfate
• Folate
• 17β-Glucuro-
nosyl estradiol
• Leucotriène
C4
• Leucovorine
• Méthotrexate
• Morphine-3-
glucuronide
• Morphine-6-
glucuronide
• Taurocholate
• Étoposide
• Méthotrexate
• Téniposide
• β-naphtho-
flavone
• Ciprofibrate
• Clofibrate
• Diallyl
sulphide
• Diéthylhexyl-
phthalate
• Éthoxyquine
• Hydroxyani-
sole butylée
• Oltipraz
• PCB126
• Phénobarbital
• Pregnénalone-
16-carbonitri-
le
• Spironolac-
tone
• TCDD
• TCPOBOP
MRP4 • Adéfovir • Azidothymi- • Célécoxib • Éthoxyquine
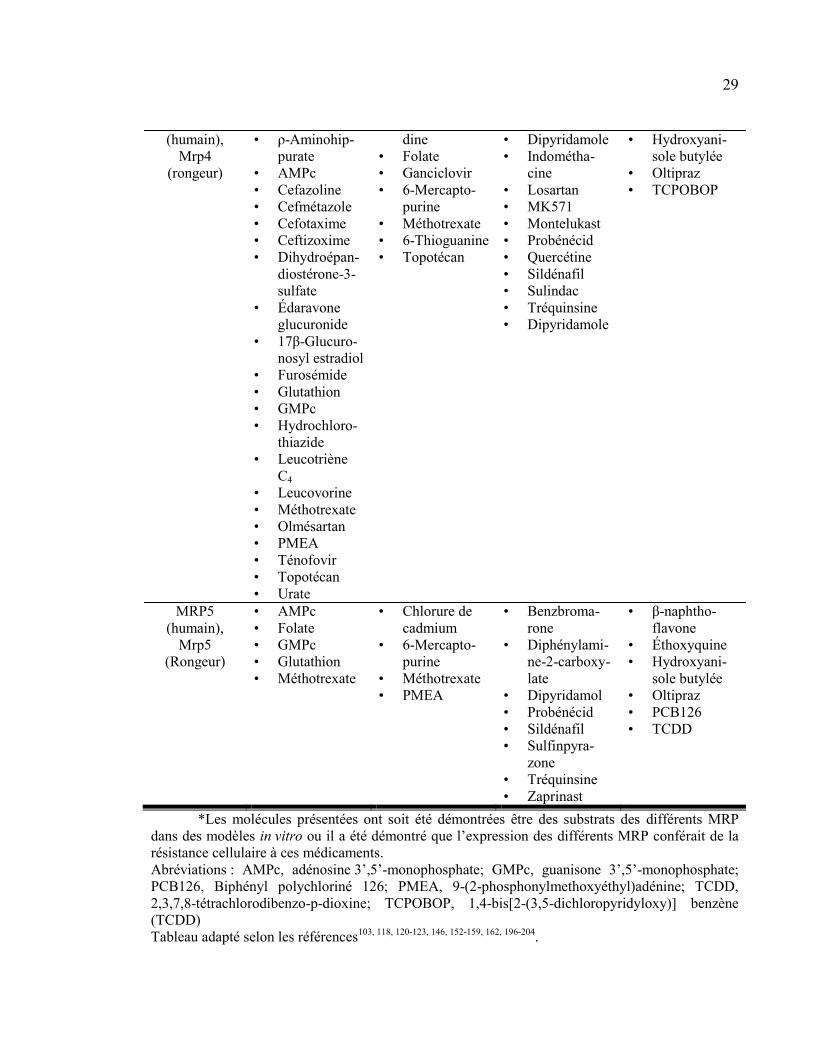
29
(humain),
Mrp4
(rongeur)
• ρ-Aminohip-
purate
• AMPc
• Cefazoline
• Cefmétazole
• Cefotaxime
• Ceftizoxime
• Dihydroépan-
diostérone-3-
sulfate
• Édaravone
glucuronide
• 17β-Glucuro-
nosyl estradiol
• Furosémide
• Glutathion
• GMPc
• Hydrochloro-
thiazide
• Leucotriène
C4
• Leucovorine
• Méthotrexate
• Olmésartan
• PMEA
• Ténofovir
• Topotécan
• Urate
dine
• Folate
• Ganciclovir
• 6-Mercapto-
purine
• Méthotrexate
• 6-Thioguanine
• Topotécan
• Dipyridamole
• Indométha-
cine
• Losartan
• MK571
• Montelukast
• Probénécid
• Quercétine
• Sildénafil
• Sulindac
• Tréquinsine
• Dipyridamole
• Hydroxyani-
sole butylée
• Oltipraz
• TCPOBOP
MRP5
(humain),
Mrp5
(Rongeur)
• AMPc
• Folate
• GMPc
• Glutathion
• Méthotrexate
• Chlorure de
cadmium
• 6-Mercapto-
purine
• Méthotrexate
• PMEA
• Benzbroma-
rone
• Diphénylami-
ne-2-carboxy-
late
• Dipyridamol
• Probénécid
• Sildénafil
• Sulfinpyra-
zone
• Tréquinsine
• Zaprinast
• β-naphtho-
flavone
• Éthoxyquine
• Hydroxyani-
sole butylée
• Oltipraz
• PCB126
• TCDD
*Les molécules présentées ont soit été démontrées être des substrats des différents MRP
dans des modèles in vitro ou il a été démontré que l’expression des différents MRP conférait de la
résistance cellulaire à ces médicaments.
Abréviations : AMPc, adénosine 3’,5’-monophosphate; GMPc, guanisone 3’,5’-monophosphate;
PCB126, Biphényl polychloriné 126; PMEA, 9-(2-phosphonylmethoxyéthyl)adénine; TCDD,
2,3,7,8-tétrachlorodibenzo-p-dioxine; TCPOBOP, 1,4-bis[2-(3,5-dichloropyridyloxy)] benzène
(TCDD)
Tableau adapté selon les références103, 118, 120-123, 146, 152-159, 162, 196-204
.
30
3.1.2.1 MRP1
Comme mentionné précédemment, MRP1 a été le premier transporteur de la famille
des ABCC à être identifié dans les années 1990192
. Il transporte de nombreux anions
organiques ainsi que de nombreux substrats conjugués au glutathion ou glucuronidés. En
effet, de nombreux substrats (par exemple la daunorubicine, l’estrone-3-sulfate et la
vincristine) ne sont transportés par MRP1 que lorsqu’ils sont conjugués au glutathion.
MRP1 est toutefois très peu exprimé dans les organes étudiés dans le cadre de cette
thèse et n’est donc pas étudié dans cette thèse.
3.1.2.2 MRP2
MRP2 a été découvert quelques années après MRP1 lorsqu’un transporteur
canaliculaire biliaire d’anions organiques qui semblait être absent dans une lignée de rats
hyperbilirubinémiques (rat Eisai hyperbilirubinémiques [EHBR]) a été identifié. On l’a
alors nommé « canalicular multispecific organic anion transporter » (cMOAT). Quand il a
été démontré qu’il s’agissait bien d’un transporteur ABC ayant 50 % d’homologie avec
MRP1, on l’a renommé MRP2162, 205
. On l’a ensuite retrouvé dans plusieurs organes
impliqués dans l’absorption et l’élimination des médicaments. Sa localisation sur la
membrane apicale des hépatocytes, des cellules du tubule proximal rénal et des entérocytes
témoigne de son implication dans la sécrétion biliaire et urinaire de ses substrats de même
que dans la limitation de l’absorption orale des médicaments en rejetant les composés
absorbés par les entérocytes dans la lumière intestinale. Finalement, plusieurs auteurs ont
rapporté une expression de Mrp2 dans la barrière hématoencéphalique de rats normaux118,
122, 205-207.
Les principaux substrats de MRP2 sont des molécules endogènes ou des métabolites
conjugués au glutathion et au sulfate ou glucuronidés résultant de la biotransformation de
phase II. Quelques substrats sont présentés dans le tableau IV. Par exemple, le métabolite
actif de l’irinotécan, le SN-38, ainsi que son métabolite glucuronidé, le SN-38 glucuronidé,
sont des substrats connus de MRP2 de même que la bilirubine glucuronidée qui est un
31
produit de dégradation de l’hémoglobine. De plus, la surexpression de MRP2 entraîne de la
résistance à de multiples médicaments incluant la vinblastine, l’étoposide, le cisplatin et la
doxorubicine154, 158
. Au contraire, l’inhibition de MRP2 par le probénécid entraîne une
diminution de 2,6 fois de l’excrétion biliaire de SN-38 ce qui a pour effet d’en augmenter
l’exposition systémique comme en démontre l’augmentation de la surface sous la courbe de
1,5 fois de SN-38154, 208
.
Deux lignées de rats déficientes en MRP2 : EHBR et TR− (rat Groninger
Yellow/transporter deficient) ont joué un rôle prépondérant dans la caractérisation de ce
transporteur et dans la démonstration de son importance pour l’élimination biliaire des
anions organiques. Une lignée de souris déficientes en Mrp2 (Mrp2-/-) a aussi été mise au
point. Elle aussi a joué un rôle crucial dans la caractérisation de MRP2. En fait, les deux
modèles de rat ainsi que le modèle de souris Mrp2-/- sont de bons modèles pour reproduire
le Syndrome de Dubin-Johnson observé chez les patients ayant une déficience héréditaire
en MRP2. Tout comme les patients, les animaux présentent des taux anormalement élevés
de bilirubine glucuronidée sérique et urinaire, des taux intrahépatiques élevés de glutathion,
une concentration biliaire diminuée de glutathion ainsi qu’une diminution du flux
biliaire193, 194
. Grâce à ces deux modèles, il a été démontré que la diminution de l’extrusion
du glutathion et de la bilirubine glucuronidée dans la bile des animaux et patients déficients
en MRP2 cause une augmentation du transport de la bilirubine glucuronidée à travers la
membrane sinusoïdale des hépatocytes vers la circulation sanguine par le transporteur
MRP3. La bilirubine est ensuite excrétée dans l’urine par le transporteur MRP4 à la
membrane apicale des tubules proximaux rénaux. Ces deux transporteurs (MRP3 et MRP4)
sont surexprimés chez les sujets déficients en MRP2, d’où l’augmentation des
concentrations sériques et urinaires de bilirubine glucuronidée observée156, 159, 193, 194, 209
.
Cette surexpression de MRP3 et MRP4 est donc un mécanisme biologique de
compensation et d’hépatoprotection contre une accumulation intrahépatique de bilirubine
potentiellement toxique. D’ailleurs, les animaux et les patients souffrant de déficience en
MRP2 ne présentent pas de symptômes sévères d’hépatotoxicité et jouissent d’une
espérance de vie normale155, 156
. Une telle dérivation de l’élimination biliaire vers
l’élimination rénale de substrats conjugués a aussi été observée en condition de cholestase
32
(c’est-à-dire lorsque le débit de la bile est diminué) où on observe une diminution de MRP2
hépatique et une surexpression de MRP3 et MRP4 à la membrane sinusoïdale des
hépatocytes162, 210
.
3.1.2.3 MRP3
MRP3 est exprimé à la membrane basolatérale des cellules du tubule distal rénal et
des cellules épithéliales intestinales ainsi qu’à la membrane sinusoïdale des hépatocytes. On
le retrouve aussi, entre autres, dans le pancréas, la prostate ou le placenta. Son expression
peut être induite par de nombreuses molécules (voir tableau IV)196
. Cette induction a été
associée à une augmentation de l’excrétion sinusoïdale de métabolites conjugués de
médicaments hépatotoxiques comme l’acétaminophène, drogue pour laquelle MRP3 est
presque entièrement responsable de l’excrétion sinusoïdale des métabolites glucuronidés198,
211. Aussi, comme décrit précédemment, MRP3 est surexprimé à la membrane sinusoïdale
des hépatocytes en situation de cholestase ou lors de déficience en MRP2 comme dans le
Syndrome de Dublin-Johnson. Il s’agirait d’un mécanisme d’hépatoprotection contre
l’accumulation d’acides biliaires et de bilirubine glucuronidée en augmentant leur excrétion
dans le sang sinusoïdal194
.
Contrairement à MRP2, l’expression de MRP3 confère très peu de résistance aux
médicaments. On a seulement noté une faible résistance à l’étoposide, au méthotrexate et au
téniposide (voir tableau IV)159, 193
. De plus, contrairement à MRP2, MRP3 ne nécessite pas
de cotransport avec le glutathion pour l’excrétion de médicaments non conjugués et
transporte peu les molécules conjuguées au glutathion même que, dans des essais in vitro, on
n’a pas détecté de transport de glutathion lorsque MRP3 était surexprimé dans des cellules
d’insecte159, 162, 193
. En effet, MRP3 transporte surtout des composés glucuronidés ou des
acides biliaires monovalents comme le cholate ou le taurocholate qui, eux, ne sont pas des
substrats de MRP2162, 193, 194
.
33
3.1.2.4 MRP4
MRP4 se distingue des autres MRP du fait qu’il est exprimé dans les membranes
basolatérales de certaines cellules et dans les membranes apicales d’autres. Il a pour la
première fois été identifié sur la membrane basolatérale des cellules glandulaires
épithéliales de la prostate. Il a ensuite été identifié dans la membrane apicale des cellules
épithéliales rénales, dans la membrane basolatérale des hépatocytes et des cellules
épithéliales du plexus choroïde ainsi que dans la membrane luminale des cellules
endothéliales cérébrales118, 120-122, 156, 197
. On en retrouve aussi, entre autres, dans les
plaquettes, les érythrocytes, les astrocytes, les cellules dendritiques et les glandes
surrénales156
. Comme les autres MRP, son expression peut être induite par plusieurs
molécules et, tout comme MRP3, il est induit à la membrane basolatérale des hépatocytes
dans les situations de cholestase dans un mécanisme d’hépatoprotection194, 210
.
Les premiers substrats identifiés pour MRP4 étaient des analogues de nucléotides
monophosphates utilisés comme antirétroviraux comme le
9-(2-phosphonylméthoxyéthyl)adénine (PMEA). D’ailleurs les nucléotides cycliques
adénosine 3’,5’-monophosphate (AMPc) et guanosine 3’,5’-monophosphate (GMPc) sont
des substrats physiologiques de MRP4. Toutefois, certaines études semblent démontrer
qu’il ne joue pas un rôle important dans la détermination de leurs concentrations
intracellulaires156, 162
. D’autres études suggèrent plutôt que MRP4 jouerait un rôle dans la
détermination des concentrations extracellulaires d’AMPc et de GMPc en favorisant leur
excrétion rénale212
.
MRP4 semble aussi jouer un rôle important dans l’excrétion urinaire des acides
biliaires, comme en démontre sa surexpression dans le Syndrome de Dublin Johnson et en
situation de cholestase (voir section MRP2), et des anions organiques. En effet, MRP4
transporte le ρ-aminohippurate (PAH), le substrat typiquement utilisé pour la
caractérisation du transport d’anions organiques dans les cellules tubulaires rénales, avec
34
une plus grande affinité que MRP2 auquel on attribuait autrefois l’excrétion rénale des
anions organiques. Aussi, l’excrétion du PAH est normale chez des rats TR- déficients en
Mrp2213
.
Finalement, des souris déficientes en Mrp4 (Mrp4-/-) présentent des concentrations
intracérébrales et intracérébrospinales accrues de topotécan comparativement à des souris
de type sauvage, ce qui démontre bien ses rôles aux barrières hématoencéphaliques et
cérébro-spinales. MRP4 semble donc jouer un rôle important dans la protection du cerveau
contre les cytotoxines et les auteurs de cette étude suggèrent que l’efficacité thérapeutique
des médicaments destinés à traiter le système nerveux central pourrait être améliorée par
l’utilisation d’inhibiteurs spécifiques de MRP4214
. Bien que plusieurs bons inhibiteurs de
MRP4 comme l’indométacine, le montelukast et le sildénafil aient été identifiés, aucun
inhibiteur sélectif et spécifique n’a été identifié à ce jour156
.
3.1.2.5 MRP5
MRP5 a été identifié, entre autres, dans les cellules épithéliales de l’urètre, les
cellules musculaires lisses et les cellules endothéliales cardiaques. Dans le cerveau, il a été
identifié dans plusieurs populations cellulaires comme les astrocytes, les neurones
pyramidaux et dans les cellules endothéliales cérébrales où il est exprimé à la membrane
luminale156
. Tout comme pour MRP4, il est capable de transporter des nucléotides
cycliques AMPc et GMPc avec une faible affinité et ne semble pas jouer de rôle dans la
détermination de leurs concentrations intracellulaires162, 200
. Le transport de l’AMPc et du
GMPc par MRP5 dans les cellules musculaires lisses du tractus génito-urinaire, peut
toutefois être inhibé par des inhibiteurs de phosphodiestérase comme le sildénafil ce qui
laisse supposer que cette inhibition pourrait participer à l’efficacité des inhibiteurs de
phosphodiestérases en augmentant les concentrations intracellulaires de nucléotides
cycliques par deux mécanismes, c’est-à-dire en inhibant leur excrétion en plus de leur
dégradation156, 215
.
35
Comme il n’existe pas de lignée de souris déficientes en Mrp5, la caractérisation des
substrats de MRP5 a été réalisée dans des essais in vitro. Il a été démontré que MRP5 peut
transporter la fluorescéine diacétate sans cotransport avec le glutathion bien qu’il soit aussi
un transporteur de glutathion. Il a aussi été démontré que MRP5 peut conférer une faible
résistance cellulaire contre le chlorure de cadmium, la 6-mercaptopurine, l’oxaliplatine et le
PMEA et une forte résistance cellulaire contre la 6-thioguanine et le 5-fluorouracil ainsi
qu’une résistance un peu moindre contre le méthotrexate156, 197
. Toutefois, comme MRP4,
MRP5 ne confère pas de résistance contre l’étoposide, les anthracyclines ou les
vinca-alcaloïdes159, 193
. Finalement, il n’existe, à ce jour, pas d’inhibiteur spécifique de
MRP5. Par contre, MRP5 peut être inhibé par différents inhibiteurs de phosphodiestérases
et par des inhibiteurs non sélectifs comme le probénécid et le benzbromarone156
.
3.1.3 LA « BREAST CANCER RESISTANCE PROTEIN » (BCRP)
De la famille ABCG des transporteurs ABC, le membre ABCG2 est le plus
impliqué dans la pharmacocinétique des médicaments. ABCG2 diffère des autres
transporteurs ABC de par sa structure. En effet, ABCG2 est un demi-transporteur avec un
seul NBD et 6 TMD (voir Figure 3). Son homodimérisation est nécessaire à son activité216,
217.
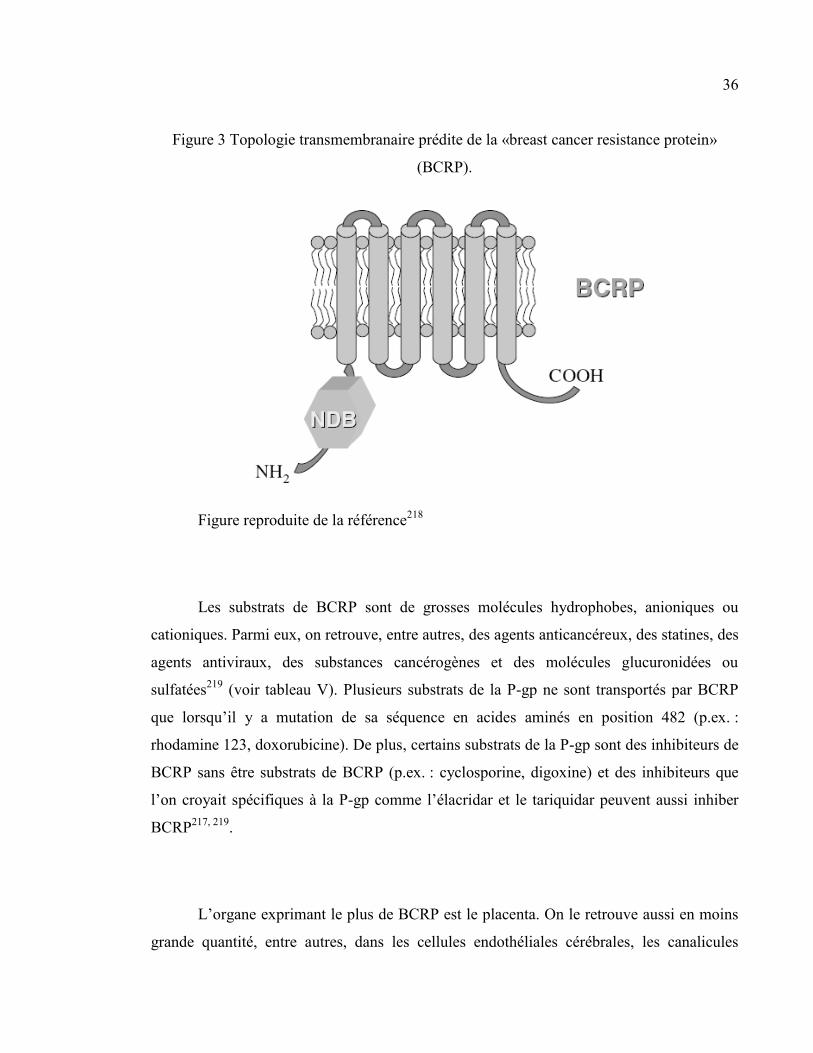
36
Figure 3 Topologie transmembranaire prédite de la «breast cancer resistance protein»
(BCRP).
Figure reproduite de la référence218
Les substrats de BCRP sont de grosses molécules hydrophobes, anioniques ou
cationiques. Parmi eux, on retrouve, entre autres, des agents anticancéreux, des statines, des
agents antiviraux, des substances cancérogènes et des molécules glucuronidées ou
sulfatées219
(voir tableau V). Plusieurs substrats de la P-gp ne sont transportés par BCRP
que lorsqu’il y a mutation de sa séquence en acides aminés en position 482 (p.ex. :
rhodamine 123, doxorubicine). De plus, certains substrats de la P-gp sont des inhibiteurs de
BCRP sans être substrats de BCRP (p.ex. : cyclosporine, digoxine) et des inhibiteurs que
l’on croyait spécifiques à la P-gp comme l’élacridar et le tariquidar peuvent aussi inhiber
BCRP217, 219
.
L’organe exprimant le plus de BCRP est le placenta. On le retrouve aussi en moins
grande quantité, entre autres, dans les cellules endothéliales cérébrales, les canalicules
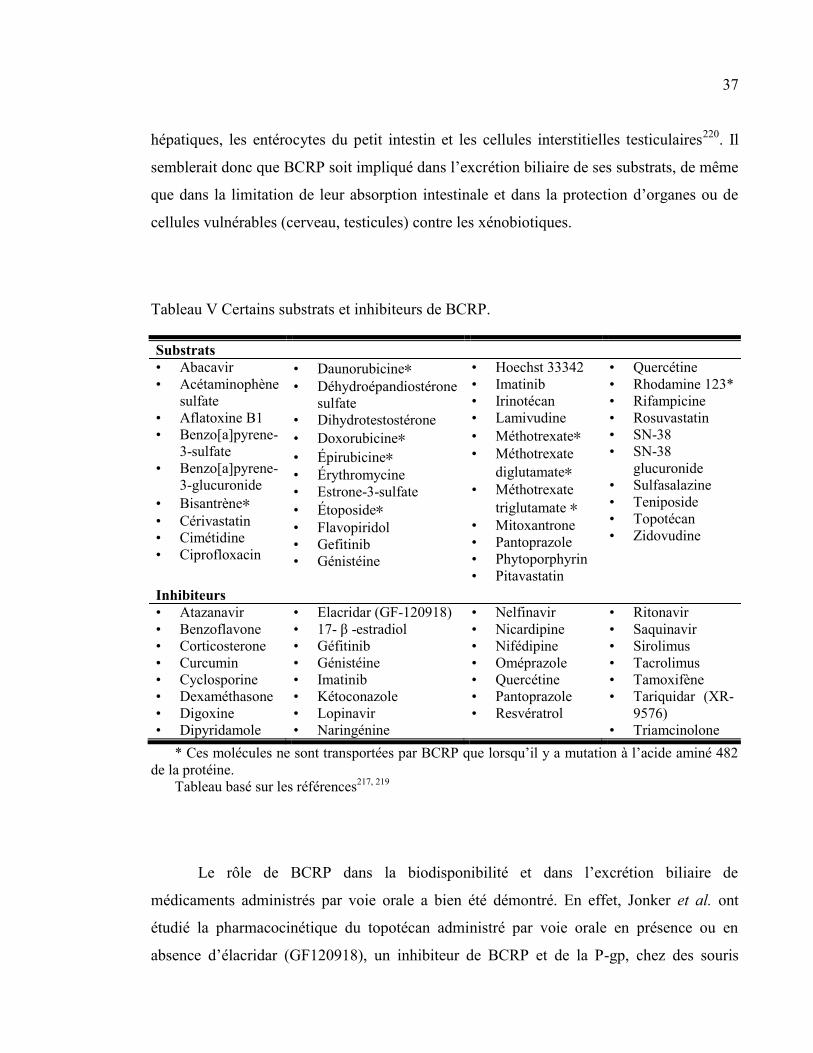
37
hépatiques, les entérocytes du petit intestin et les cellules interstitielles testiculaires220
. Il
semblerait donc que BCRP soit impliqué dans l’excrétion biliaire de ses substrats, de même
que dans la limitation de leur absorption intestinale et dans la protection d’organes ou de
cellules vulnérables (cerveau, testicules) contre les xénobiotiques.
Tableau V Certains substrats et inhibiteurs de BCRP.
Substrats
• Abacavir
• Acétaminophène
sulfate
• Aflatoxine B1
• Benzo[a]pyrene-
3-sulfate
• Benzo[a]pyrene-
3-glucuronide
• Bisantrène∗
• Cérivastatin
• Cimétidine
• Ciprofloxacin
• Daunorubicine∗ • Déhydroépandiostérone
sulfate
• Dihydrotestostérone
• Doxorubicine∗
• Épirubicine∗
• Érythromycine
• Estrone-3-sulfate
• Étoposide∗ • Flavopiridol
• Gefitinib
• Génistéine
• Hoechst 33342
• Imatinib
• Irinotécan
• Lamivudine
• Méthotrexate∗ • Méthotrexate
diglutamate∗ • Méthotrexate
triglutamate ∗
• Mitoxantrone
• Pantoprazole
• Phytoporphyrin
• Pitavastatin
• Quercétine
• Rhodamine 123*
• Rifampicine
• Rosuvastatin
• SN-38
• SN-38
glucuronide
• Sulfasalazine
• Teniposide
• Topotécan
• Zidovudine
Inhibiteurs
• Atazanavir
• Benzoflavone
• Corticosterone
• Curcumin
• Cyclosporine
• Dexaméthasone
• Digoxine
• Dipyridamole
• Elacridar (GF-120918)
• 17- β -estradiol
• Géfitinib
• Génistéine
• Imatinib
• Kétoconazole
• Lopinavir
• Naringénine
• Nelfinavir
• Nicardipine
• Nifédipine
• Oméprazole
• Quercétine
• Pantoprazole
• Resvératrol
• Ritonavir
• Saquinavir
• Sirolimus
• Tacrolimus
• Tamoxifène
• Tariquidar (XR-
9576)
• Triamcinolone
* Ces molécules ne sont transportées par BCRP que lorsqu’il y a mutation à l’acide aminé 482
de la protéine.
Tableau basé sur les références217, 219
Le rôle de BCRP dans la biodisponibilité et dans l’excrétion biliaire de
médicaments administrés par voie orale a bien été démontré. En effet, Jonker et al. ont
étudié la pharmacocinétique du topotécan administré par voie orale en présence ou en
absence d’élacridar (GF120918), un inhibiteur de BCRP et de la P-gp, chez des souris
38
P-gp-/- comparativement à des souris de type sauvage221
. Ils ont ainsi démontré, chez les
souris P-gp-/- ayant reçu de l’élacridar, une augmentation de 6 fois de la biodisponibilité du
topotécan comparativement aux souris ayant reçu le véhicule. Chez les souris de type
sauvage, l’augmentation de la biodisponibilité du topotécan était de 9 fois comparativement
aux souris ayant reçu le véhicule. L’élacridar avait aussi pour effet de réduire la clairance
plasmatique et l’excrétion biliaire du topotécan tout en en augmentant la réabsorption
intestinale chez les deux types de souris221
. Le même groupe a aussi démontré une
redérivation de l’excrétion biliaire de la 2-amino-1-méthyl-6-phénylimidazo[4,5-b]pyridine
(PhIP), un agent carcinogène alimentaire, vers une élimination urinaire chez des souris
Abcg2 déficientes (abcg2-/-)222
.
L’importance du rôle de BCRP à la barrière hématoencéphalique semble plutôt
controversée. En effet, les études se contredisent sur le sujet. Un premier groupe a en effet
démontré, à l’aide de souris P-gp-/- et d’élacridar, l’implication de Abcg2 dans le transport
du mitoxantrone à la barrière hématoencéphalique de souris223
. Un autre groupe a démontré
une augmentation de 2,5 fois de la perméabilité cérébrale de l’imatinib, un substrat de
BCRP, chez des souris déficientes en Bcrp comparées aux souris de type sauvage. De plus,
lorsque les souris sauvages étaient prétraitées au pantoprazole, un inhibiteur de BCRP, cette
perméabilité était 5 fois plus élevée. Ceci indique bien un rôle de BCRP dans la
perméabilité de l’imatinib à la barrière hématoencéphalique224
. Toutefois, dans une étude
avec des souris Bcrp-/- évaluant le rôle de Bcrp à la barrière hématoencéphalique de souris,
la déficience en Bcrp ne semblait pas affecter la pénétration du mitoxantrone et du
déhydroépandiostérone sulfate, deux substrats de BCRP225
. De plus, les auteurs de l’étude
mesurant les modifications de la pharmacocinétique de PhIP chez des souris abcg2-/- n’ont
pas observé d’augmentation de la concentration intracérébrale de PhIP chez les souris
abcg2-/- comparativement aux souris de type sauvage222
. L’importance du rôle de BCRP
dans la perméabilité de la barrière hématoencéphalique reste donc à déterminer.
39
3.2. LES « SOLUTE CARRIERS »
Contrairement aux transporteurs ABC, les transporteurs de médicaments faisant
partie de la famille des « solute carriers » (SLC) n’utilisent pas l’énergie de l’ATP pour
transporter leurs substrats. Ils effectuent plutôt le transport des médicaments par transport
facilité, c’est-à-dire que leur substrat est transporté selon son gradient de concentration, ou
par transport secondaire actif, c’est-à-dire qu’ils transportent leur substrat contre leur propre
gradient électrochimique grâce à un second substrat (p.ex. sodium, hydrogène) voyageant
en sens inverse selon son propre gradient de concentration. Il existe au moins 48 familles de
SLC chez l’humain et dans plusieurs espèces226
. Par contre, toutes ne sont pas impliquées
dans le transport des médicaments. Les SLC appartenant à la même famille comptent au
moins 20-25 % d’homologie de séquence en acides aminés entre eux227
. Seules quelques
familles jouant un rôle important dans la pharmacocinétique des médicaments seront
présentées ici.
3.2.1 LES « ORGANIC ANION TRANSPORTING POLYPEPTIDES » (OATP)
Les OATP sont des glycoprotéines à 12 passages transmembranaires, d’un poids
moléculaire de 80 à 90 kDa, ayant leurs extrémités carboxy et amino terminales dans le
milieu intracellulaire (voir Figure 4). Depuis la découverte de Oatp1a1 en 1994228
, on les a
isolées dans une grande variété de tissus chez les vertébrés. Ils sont des transporteurs
sodium-indépendants d’anions organiques. Bien que certaines études suggèrent que les
OATP sont des échangeurs d’anions organiques, les mécanismes du transport des substrats
par les OATP n’ont pas été très bien caractérisés23, 229-231
.
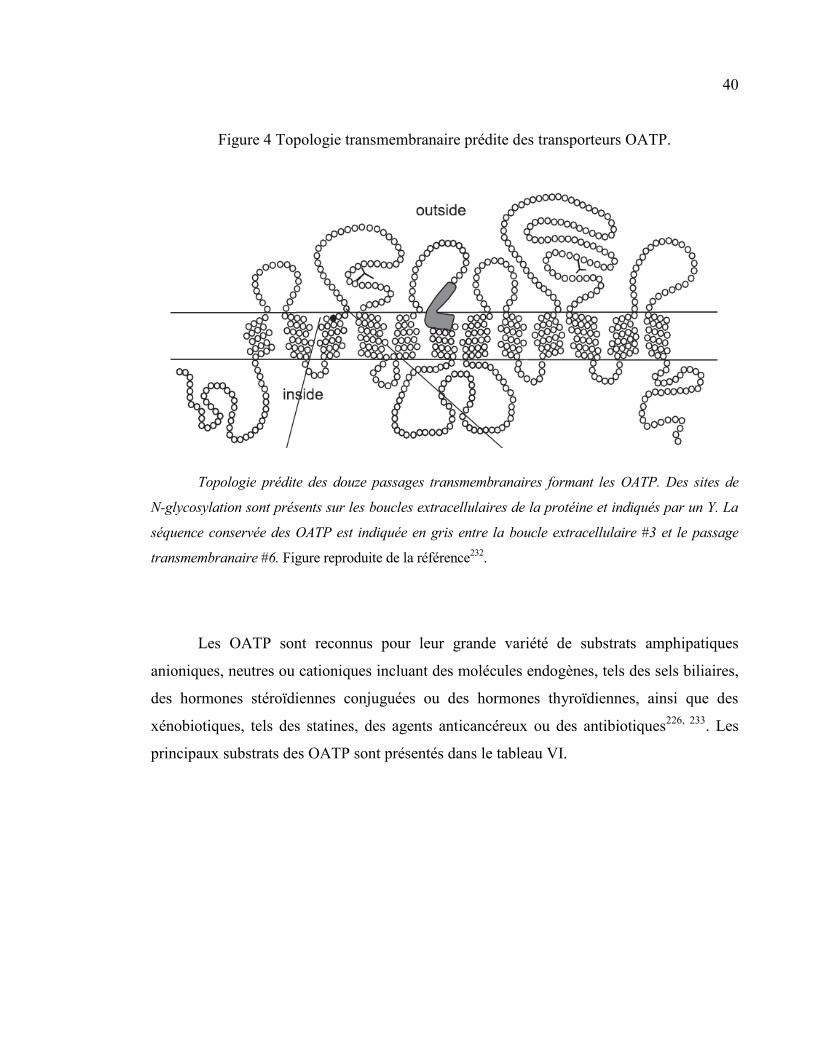
40
Figure 4 Topologie transmembranaire prédite des transporteurs OATP.
Topologie prédite des douze passages transmembranaires formant les OATP. Des sites de
N-glycosylation sont présents sur les boucles extracellulaires de la protéine et indiqués par un Y. La
séquence conservée des OATP est indiquée en gris entre la boucle extracellulaire #3 et le passage
transmembranaire #6. Figure reproduite de la référence232
.
Les OATP sont reconnus pour leur grande variété de substrats amphipatiques
anioniques, neutres ou cationiques incluant des molécules endogènes, tels des sels biliaires,
des hormones stéroïdiennes conjuguées ou des hormones thyroïdiennes, ainsi que des
xénobiotiques, tels des statines, des agents anticancéreux ou des antibiotiques226, 233
. Les
principaux substrats des OATP sont présentés dans le tableau VI.
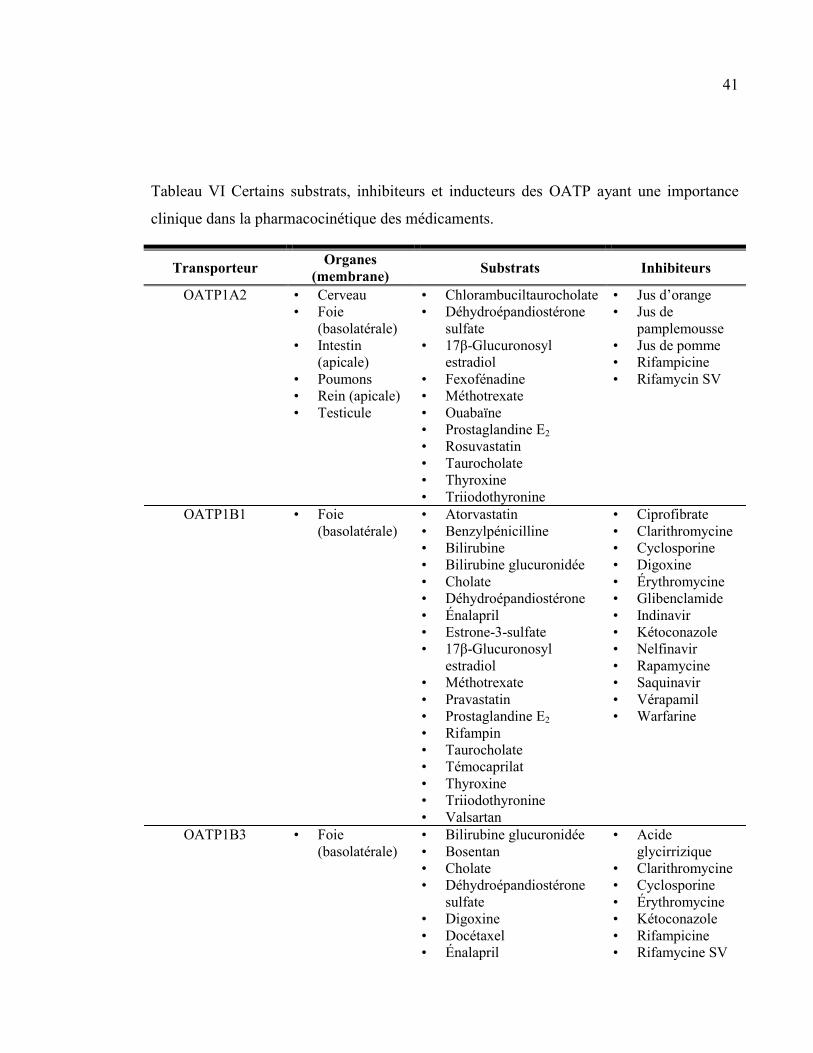
41
Tableau VI Certains substrats, inhibiteurs et inducteurs des OATP ayant une importance
clinique dans la pharmacocinétique des médicaments.
Transporteur Organes
(membrane) Substrats Inhibiteurs
OATP1A2 • Cerveau
• Foie
(basolatérale)
• Intestin
(apicale)
• Poumons
• Rein (apicale)
• Testicule
• Chlorambuciltaurocholate
• Déhydroépandiostérone
sulfate
• 17β-Glucuronosyl
estradiol
• Fexofénadine
• Méthotrexate
• Ouabaïne
• Prostaglandine E2
• Rosuvastatin
• Taurocholate
• Thyroxine
• Triiodothyronine
• Jus d’orange
• Jus de
pamplemousse
• Jus de pomme
• Rifampicine
• Rifamycin SV
OATP1B1 • Foie
(basolatérale)
• Atorvastatin
• Benzylpénicilline
• Bilirubine
• Bilirubine glucuronidée
• Cholate
• Déhydroépandiostérone
• Énalapril
• Estrone-3-sulfate
• 17β-Glucuronosyl
estradiol
• Méthotrexate
• Pravastatin
• Prostaglandine E2
• Rifampin
• Taurocholate
• Témocaprilat
• Thyroxine
• Triiodothyronine
• Valsartan
• Ciprofibrate
• Clarithromycine
• Cyclosporine
• Digoxine
• Érythromycine
• Glibenclamide
• Indinavir
• Kétoconazole
• Nelfinavir
• Rapamycine
• Saquinavir
• Vérapamil
• Warfarine
OATP1B3 • Foie
(basolatérale)
• Bilirubine glucuronidée
• Bosentan
• Cholate
• Déhydroépandiostérone
sulfate
• Digoxine
• Docétaxel
• Énalapril
• Acide
glycirrizique
• Clarithromycine
• Cyclosporine
• Érythromycine
• Kétoconazole
• Rifampicine
• Rifamycine SV
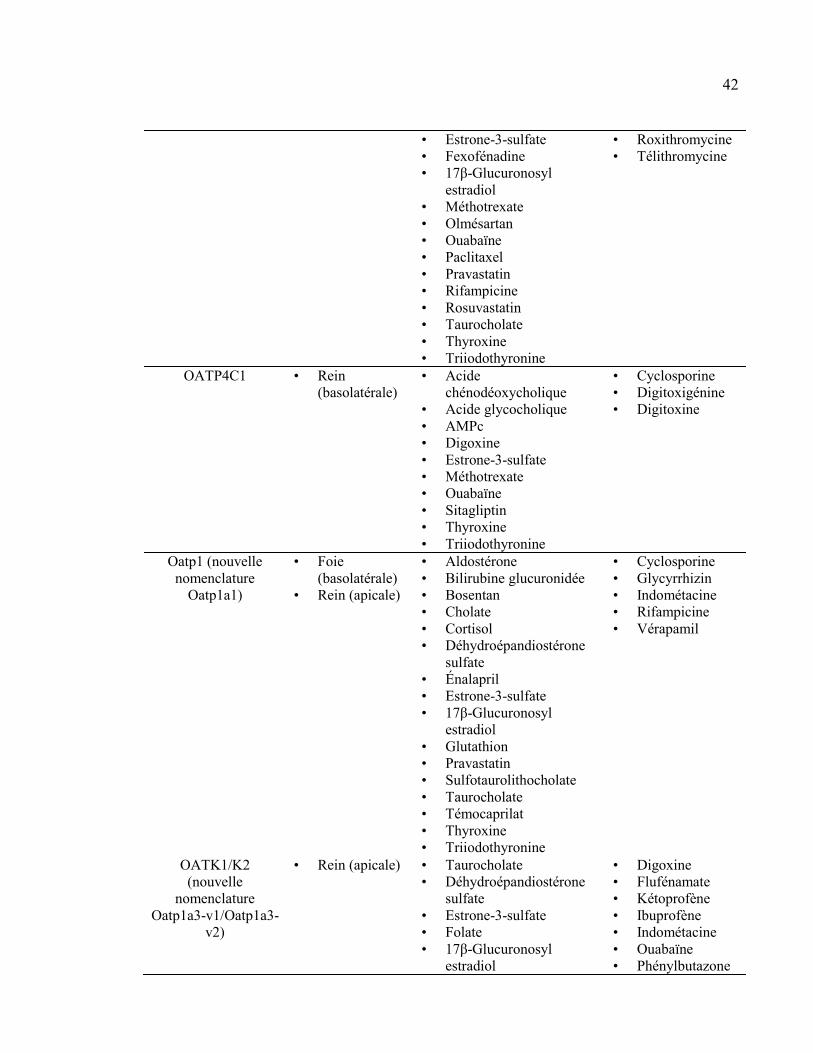
42
• Estrone-3-sulfate
• Fexofénadine
• 17β-Glucuronosyl
estradiol
• Méthotrexate
• Olmésartan
• Ouabaïne
• Paclitaxel
• Pravastatin
• Rifampicine
• Rosuvastatin
• Taurocholate
• Thyroxine
• Triiodothyronine
• Roxithromycine
• Télithromycine
OATP4C1 • Rein
(basolatérale)
• Acide
chénodéoxycholique
• Acide glycocholique
• AMPc
• Digoxine
• Estrone-3-sulfate
• Méthotrexate
• Ouabaïne
• Sitagliptin
• Thyroxine
• Triiodothyronine
• Cyclosporine
• Digitoxigénine
• Digitoxine
Oatp1 (nouvelle
nomenclature
Oatp1a1)
• Foie
(basolatérale)
• Rein (apicale)
• Aldostérone
• Bilirubine glucuronidée
• Bosentan
• Cholate
• Cortisol
• Déhydroépandiostérone
sulfate
• Énalapril
• Estrone-3-sulfate
• 17β-Glucuronosyl
estradiol
• Glutathion
• Pravastatin
• Sulfotaurolithocholate
• Taurocholate
• Témocaprilat
• Thyroxine
• Triiodothyronine
• Cyclosporine
• Glycyrrhizin
• Indométacine
• Rifampicine
• Vérapamil
OATK1/K2
(nouvelle
nomenclature
Oatp1a3-v1/Oatp1a3-
v2)
• Rein (apicale) • Taurocholate
• Déhydroépandiostérone
sulfate
• Estrone-3-sulfate
• Folate
• 17β-Glucuronosyl
estradiol
• Digoxine
• Flufénamate
• Kétoprofène
• Ibuprofène
• Indométacine
• Ouabaïne
• Phénylbutazone
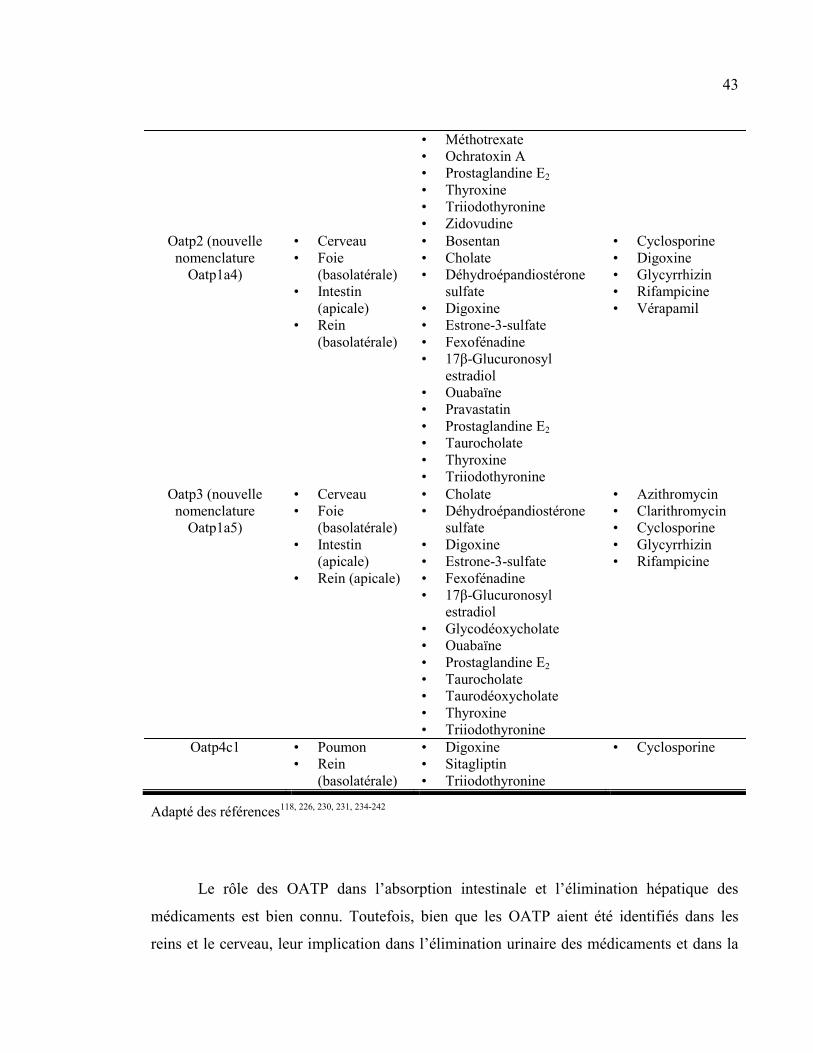
43
• Méthotrexate
• Ochratoxin A
• Prostaglandine E2
• Thyroxine
• Triiodothyronine
• Zidovudine
Oatp2 (nouvelle
nomenclature
Oatp1a4)
• Cerveau
• Foie
(basolatérale)
• Intestin
(apicale)
• Rein
(basolatérale)
• Bosentan
• Cholate
• Déhydroépandiostérone
sulfate
• Digoxine
• Estrone-3-sulfate
• Fexofénadine
• 17β-Glucuronosyl
estradiol
• Ouabaïne
• Pravastatin
• Prostaglandine E2
• Taurocholate
• Thyroxine
• Triiodothyronine
• Cyclosporine
• Digoxine
• Glycyrrhizin
• Rifampicine
• Vérapamil
Oatp3 (nouvelle
nomenclature
Oatp1a5)
• Cerveau
• Foie
(basolatérale)
• Intestin
(apicale)
• Rein (apicale)
• Cholate
• Déhydroépandiostérone
sulfate
• Digoxine
• Estrone-3-sulfate
• Fexofénadine
• 17β-Glucuronosyl
estradiol
• Glycodéoxycholate
• Ouabaïne
• Prostaglandine E2
• Taurocholate
• Taurodéoxycholate
• Thyroxine
• Triiodothyronine
• Azithromycin
• Clarithromycin
• Cyclosporine
• Glycyrrhizin
• Rifampicine
Oatp4c1 • Poumon
• Rein
(basolatérale)
• Digoxine
• Sitagliptin
• Triiodothyronine
• Cyclosporine
Adapté des références118, 226, 230, 231, 234-242
Le rôle des OATP dans l’absorption intestinale et l’élimination hépatique des
médicaments est bien connu. Toutefois, bien que les OATP aient été identifiés dans les
reins et le cerveau, leur implication dans l’élimination urinaire des médicaments et dans la
44
distribution des médicaments au cerveau reste à déterminer230, 231
. De plus, de nombreuses
interactions médicamenteuses impliquant les OATP intestinaux et hépatiques ont été
rapportées, ce qui démontre leur importance dans la pharmacocinétique des médicaments.
Les Oatp/OATP identifiés chez les rongeurs et les humains ont été classés en 6
familles et 13 sous-familles231
. Toutefois, il n’y a pas, chez les rongeurs, de protéine
orthologue pour les transporteurs OATP1A2, OATP1B1 et OATP1B3 humains qui ont une
distribution importante dans l’intestin, le foie et la barrière hématoencéphalique. Malgré
tout, les Oatp exprimés chez le rat présentent une bonne homologie de substrats avec les
transporteurs exprimés chez l’humain226, 231
.
Comme il n’existe pas de protéines orthologues entre les OATP humains et de rat,
au lieu de présenter chaque isoforme comme il a été fait précédemment, je présenterai ici
certains des différents OATP exprimés, chez l’humain et le rat, dans les organes étudiés
dans le cadre de cette thèse.
3.2.1.1 Les OATP intestinaux
Dans l’intestin humain, on retrouve plusieurs OATP, notamment, OATP1A2,
OATP1B3, OATP2A1, OATP2B1 et OATP4A1 exprimés à la membrane apicale des
entérocytes. Chez le rat, on retrouve seulement Oatp3 (nouvelle nomenclature Oatp1a5)
ainsi qu’une très faible quantité d’Oatp2 (nouvelle nomenclature Oatp1a4)231, 243
. On les
retrouve sur la membrane apicale des entérocytes matures à l’extrémité des villi. Ils
effectuent le transport vers l’entérocyte de plusieurs anions organiques et de plusieurs
composés neutres comme la pravastatine, la digoxine, la fexofénadine, les sels biliaires et la
bilirubine23, 229
. Il a été démontré qu’une augmentation de l’activité des OATP intestinaux a
pour effet d’augmenter la biodisponibilité de leurs substrats, puisque leur passage de la
45
lumière intestinale vers la circulation sanguine est ainsi facilité. À l’inverse, une diminution
de l’activité des OATP intestinaux cause une diminution de la biodisponibilité orale de ses
substrats.
De nombreuses interactions pharmacologiques impliquant les OATP intestinaux ont
été rapportées. Un des exemples les plus connus est celui de leur inhibition par le jus de
pamplemousse et la diminution de la biodisponibilité de la fexofénadine. En effet, il a été
démontré par le transport in vitro de taurocholate et de fexofénadine que les jus de
pamplemousse, d’orange et de pomme, de même que des extraits de jus de pamplemousse,
réduisaient l’activité de l’OATP1A2 humain et des Oatp1, 2 et 3 chez le rat244
. Cette
inhibition a même été reproduite in vivo chez des volontaires sains ayant reçu une dose de
fexofénadine avec, au total, 1,2 L de jus de pamplemousse, d’orange ou de pomme. Les
auteurs ont ainsi observé des diminutions de l’aire sous la courbe des concentrations
plasmatiques, de la concentration maximale et de l’excrétion urinaire de la fexofénadine, les
ramenant à seulement 30 à 40 % des valeurs obtenues chez les gens ayant reçu la
fexofénadine avec de l’eau. Aucun changement du temps nécessaire pour atteindre la
concentration maximale, de la demi-vie d’élimination, de la clairance rénale ou du volume
urinaire n’a toutefois été observé244
. Une étude subséquente a démontré qu’un volume
normal (300 mL) de jus de pamplemousse était suffisant pour affecter la pharmacocinétique
de la fexofénadine245
.
3.2.1.2 Les OATP hépatiques
Dans le foie humain, on retrouve plusieurs OATP, notamment, OATP1A2,
OATP1B1 et OATP1B3 exprimés à la membrane sinusoïdale des hépatocytes. Chez le rat,
on retrouve seulement Oatp1 (nouvelle nomenclature Oatp1a1) et Oatp2 (nouvelle
nomenclature Oatp1a4) ainsi qu’une très faible quantité d’Oatp3 (nouvelle nomenclature
Oatp1a5) à la membrane sinusoïdale des hépatocytes231, 243
. Ils permettent l’extraction de
plusieurs anions organiques et de plusieurs composés neutres du sang vers l’intérieur des
46
hépatocytes23, 229
. Il s’agit d’une étape importante dans la pharmacocinétique des
médicaments. En effet, cette étape peut limiter la biotransformation hépatique puisque la
biotransformation dépend de l’entrée du substrat dans l’hépatocyte23, 91, 246
. Une
augmentation de l’activité des OATP hépatiques pourrait ainsi augmenter la clairance
hépatique de médicaments alors qu’une diminution de leur activité pourrait causer une
diminution de la clairance hépatique.
De nombreuses interactions pharmacologiques impliquant les OATP hépatiques ont
été rapportées. Par exemple, une forte interaction entre le rosuvastatin et la cyclosporine a été
observée chez des greffés cardiaques immunosupprimés par la cyclosporine. En effet, une
augmentation de 700 % de la surface sous la courbe du rosuvastatin et une augmentation de
1000 % de la concentration maximale ont été observées chez les sujets recevant de la
cyclosporine comparativement à des sujets témoins. In vitro, les auteurs ont démontré que le
rosuvastatin est un excellent substrat de OATP1B1 et que la cyclosporine peut fortement
inhiber ce transport. Ils en concluent donc que l’inhibition de l’OATP1B1 hépatique par la
cyclosporine est responsable de cette interaction médicamenteuse247
. De la même façon, il a
été démontré, chez des volontaires sains, que la clarithromycine pouvait augmenter les
concentrations plasmatiques du pravastatin, de l’atorvastatin et du simvastatin248
.
Contrairement à l’atorvastatin et au simvastatin qui sont en partie métabolisés par le
cytochrome P450 (CYP450) hépatique, le pravastatin est éliminé presque intact dans la bile.
L’augmentation des concentrations de pravastatin ne peut donc pas être attribuée à une
diminution de son métabolisme par le CYP450. Elle serait plutôt attribuée à l’inhibition par la
clarithromycine de l’import du pravastatin par les OATP1B1 et OATP1B3 dans les
hépatocytes249
. Finalement, chez l’humain, de nombreux polymorphismes pouvant modifier
l’activité des OATP et modifier la pharmacocinétique des médicaments ont été identifiés243
.
3.2.1.3 Les OATP rénaux
Dans le rein humain, on retrouve l’OATP1A2 à la membrane apicale des cellules
épithéliales du tubule distal250
. On retrouve aussi l’OATP4C1 à la membrane basolatérale
47
des cellules épithéliales du tubule proximal239
. Chez le rat, on retrouve les Oatp1 (nouvelle
nomenclature Oatp1a1), OatK1/K2 (nouvelle nomenclature Oatp1a3-v1/v2) et Oatp3 à la
membrane apicale des cellules épithéliales du tubule proximal. On retrouve aussi les Oatp2
et Oatp4c1 à la membrane basolatérale des mêmes cellules100, 102, 104
. Toutefois, comme les
OATP sont des transporteurs bidirectionnels, il n’est pas encore déterminé clairement si
elles réabsorbent ou sécrètent les anions organiques dans le tubule rénal100
.
Malgré tout, le rôle de OATP4C1 et de son orthologue Oatp4c1 chez le rat, dans
l’élimination rénale de la digoxine, d’au moins trois toxines urémiques (le guanidino
succinate, la diméthylarginine asymétrique et le trans-aconitate), de la ouabaïne, des
hormones thyroïdiennes et de l’estrone-3-sulfate, a bien été démontré233, 239, 242, 251
. De plus,
il a été démontré que de nombreuses statines incluant le fluvastatin, le pravastatin, le
simvastatin, le cérivastatin et l’atorvastatin augmentaient la transcription du gène de
l’OATP4C1 et, ainsi, l’excrétion tubulaire de toxines urémiques233
.
3.2.1.4 Les OATP à la barrière hématoencéphalique
Chez l’humain, l’OATP1A2 a été identifié à la membrane luminale des cellules
endothéliales des capillaires cérébraux118, 122, 252
. Chez le rat, l’Oatp2 est localisé sur la
membrane luminale et abluminale de ces mêmes cellules. On retrouve aussi l’Oatp3 à leur
membrane luminale118
. Bien que leur expression à la barrière hématoencéphalique ait été
clairement démontrée, de même que leur capacité à importer de nombreux substrats
physiologiques tels que les hormones thyroïdiennes, l’estrone-3-sulfate ou la
prostaglandine E2 dans des études in vitro, l’importance physiologique in vivo des OATP
n’a pas été clairement établie122
.
48
Des études in vitro ont démontré que l’OATP1A2 est impliqué dans l’importation
d’agonistes des récepteurs δ-opioïdes comme le DPDPE (D-penicillamine (2,5)-
enkephalin) ou la deltorphine253
. Ceci laisse croire que l’OATP1A2 pourrait être impliqué
dans l’entrée de médicaments opioïdes agissant sur le système nerveux central dans le
cerveau117, 250, 253, 254
. De plus, Urquhart et Kim suggèrent que le polymorphisme
OATP1A2(Ile13Thr), présent chez 16 % de la population américaine d’origine européenne
et entraînant une augmentation de l’activité du transporteur, pourrait être impliqué dans la
neurotoxicité du méthotrexate bien que ceci n’ait pas encore été démontré dans des études
cliniques254
.
Chez les rongeurs, à l’aide de modèles in vitro, l’Oatp2 a été impliqué dans le
transport de la digoxine et de la fexofénadine à la barrière hématoencéphalique255, 256
. De
plus, des études de transport in vivo suite à la micro-injection d’inhibiteurs et de substrats
d’Oatp2 dans le cortex de rats ont permis de démontrer que l’Oatp2 est fortement impliqué
dans le transport du DHEAS257
, du 17β-estradiol glucuronide258
et du pitavastatin259
du
cerveau vers le sang. À l’inverse, des études de perfusion in situ de cerveau de souris
déficientes en P-gp avec des inhibiteurs et des substrats d’Oatp2 ont démontré son
implication dans le transport du DPDPE260
et de la morphine-6-glucuronide261
du sang vers
le cerveau.
Finalement, une étude récente utilisant un modèle de souris déficientes en Oatp2
(Oatp2-/-) a tenté de caractériser le rôle de l’Oatp2 à la barrière hématoencéphalique128
. Ils
ont ainsi démontré que le transport du cerveau vers le sang du pitavastatin, du rosuvastatin,
du pravastatin et du taurocholate, après micro-injection dans le cortex cérébral, était réduit
chez les souris Oatp2-/- comparativement aux souris de type sauvage128
. Le transport du
sang vers le cerveau du pitavastatin, du rosuvastatin, du taurocholate et de l’ochratoxine A,
mesuré par perfusion in situ du cerveau, était aussi réduit chez les animaux Oatp2-/-
comparativement aux souris de type sauvage128
. Ces résultats démontrent que l’Oatp2 est
49
impliqué dans le transport de ses substrats du cerveau vers le sang et du sang vers le
cerveau à travers la barrière hématoencéphalique128
.
3.2.2 LES « ORGANIC ANION TRANSPORTERS » (OAT)
Les transporteurs d’anions organiques (organic anion transporters) font partie de la
sous-famille SLC22 de la grande famille des SLC. Les SLC22 transportent une grande
variété de composés incluant des médicaments, des toxines environnementales ou des
métabolites endogènes à travers les membranes cellulaires117, 262
. Il s’agit de transporteurs
polyspécifiques ayant de multiples substrats et de nombreux ligands pouvant inhiber leur
activité262
. Les SLC22 sont exprimés dans de nombreux organes incluant l’intestin, le foie,
les reins et le cerveau, ce qui témoigne de leur important rôle dans l’absorption et
l’élimination des médicaments en plus de leur distribution à travers la barrière
hématoencéphalique117, 262, 263
.
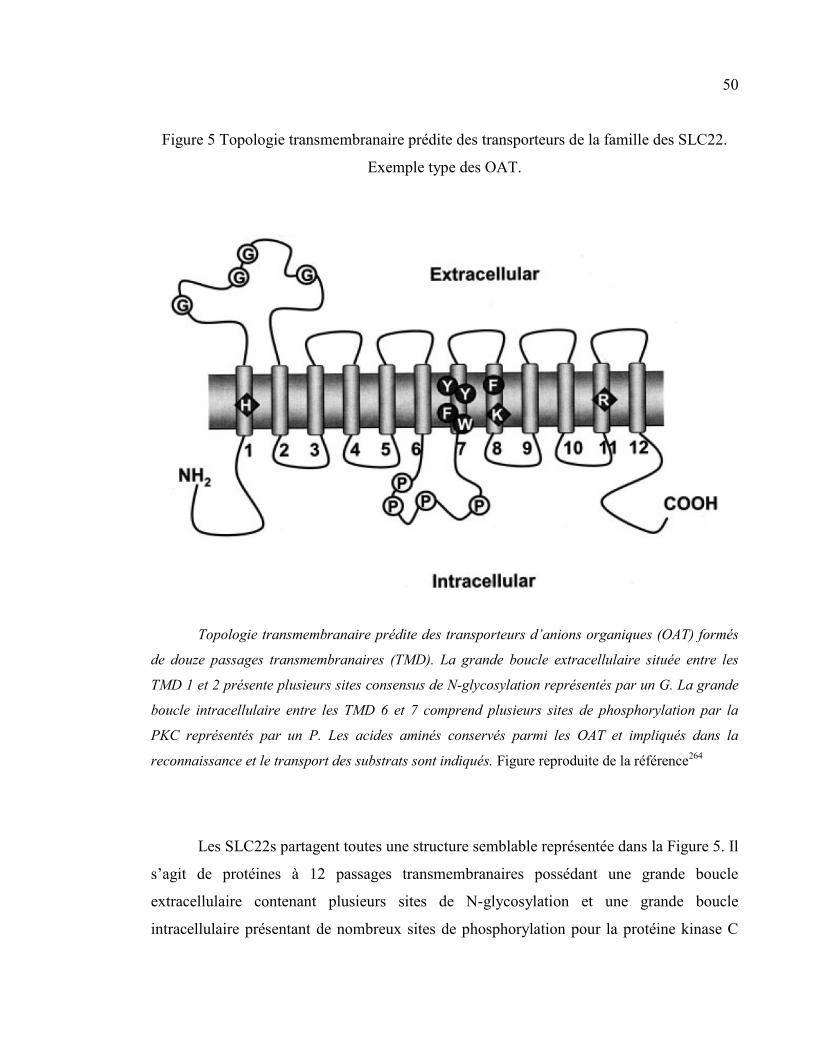
50
Figure 5 Topologie transmembranaire prédite des transporteurs de la famille des SLC22.
Exemple type des OAT.
Topologie transmembranaire prédite des transporteurs d’anions organiques (OAT) formés
de douze passages transmembranaires (TMD). La grande boucle extracellulaire située entre les
TMD 1 et 2 présente plusieurs sites consensus de N-glycosylation représentés par un G. La grande
boucle intracellulaire entre les TMD 6 et 7 comprend plusieurs sites de phosphorylation par la
PKC représentés par un P. Les acides aminés conservés parmi les OAT et impliqués dans la
reconnaissance et le transport des substrats sont indiqués. Figure reproduite de la référence264
Les SLC22s partagent toutes une structure semblable représentée dans la Figure 5. Il
s’agit de protéines à 12 passages transmembranaires possédant une grande boucle
extracellulaire contenant plusieurs sites de N-glycosylation et une grande boucle
intracellulaire présentant de nombreux sites de phosphorylation pour la protéine kinase C
51
(PKC)262, 265
. Dans cette sous-famille des SLC, on retrouve principalement 3 sous-groupes
de transporteurs divisés selon leurs substrats et leur mécanisme de transport.
Le premier sous-groupe comprend les transporteurs de cations organiques (organic
cation transporters [OCT]) médiant la diffusion facilitée de cations organiques, incluant les
bases faibles, par un mécanisme électrogénique indépendant du sodium pouvant être
réversible. Le gradient électrochimique du cation organique transporté fournit l’énergie
nécessaire au transport. Trois OCT1-3 (SLC22A1-3) ont été identifiés et sont exprimés
majoritairement dans le foie et les reins, et OCT2 a aussi été retrouvé en moindre quantité
dans le cerveau. Parmi les substrats des OCT, on retrouve des neurotransmetteurs (p.ex.
acétylcholine, dopamine, sérotonine), des hormones (p.ex. progestérone, corticostérone) et
différents médicaments (p.ex. vérapamil, metformine, quinine, morphine, cimétidine)209, 262,
263, 266-268. Le second sous-groupe comprend les « organic cation/carnitine transporters »
ou « novel organic cation transporters » [OCTN]. Les OCTN1-3 sont exprimés dans
l’intestin, le foie et les reins où ils jouent un rôle essentiel dans la coabsorption et
l’excrétion de la carnitine et de certains médicaments comme la quinidine et le
vérapamil262, 263, 265, 267, 269
. Les OCT et les OCTN seront peu abordés dans le cadre de ce
travail et ne seront donc pas révisés en détail.
Le troisième sous-groupe comprend les transporteurs d’anions organiques (organic
anion transporters [OAT]) dont il sera question dans le cadre de ce travail. Les OAT sont
capables d’effectuer le transport bidirectionnel d’anions organiques à travers les
membranes cellulaires. Les OAT effectuent le transport actif secondaire ou tertiaire de leurs
substrats à travers la membrane cellulaire par le gradient électrochimique du substrat ou un
gradient électrochimique créé par un autre substrat265
. Au moins trois (OAT1, OAT3 et
URAT1) effectuent leur transport par un mécanisme d’échange avec des anions organiques
divalents270-272
. Parmi les substrats des OAT, on retrouve des prostaglandines, des acides
biliaires, des hormones stéroïdiennes, des neurotransmetteurs et leurs métabolites ainsi que
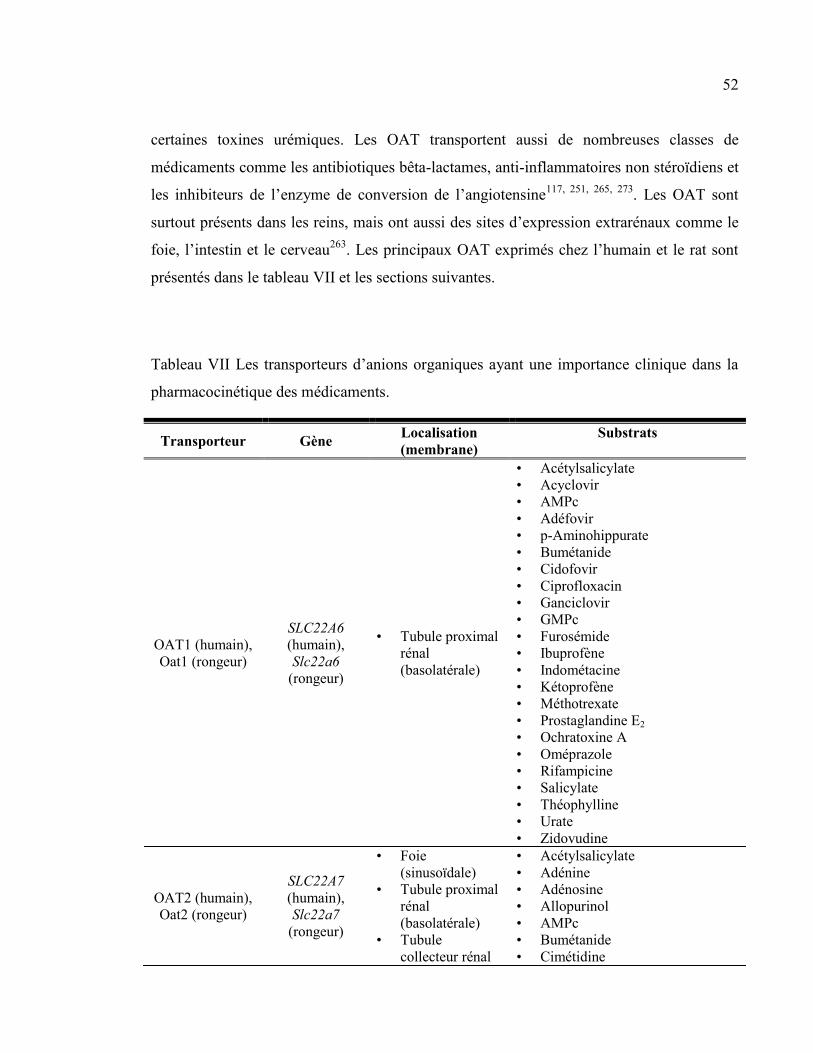
52
certaines toxines urémiques. Les OAT transportent aussi de nombreuses classes de
médicaments comme les antibiotiques bêta-lactames, anti-inflammatoires non stéroïdiens et
les inhibiteurs de l’enzyme de conversion de l’angiotensine117, 251, 265, 273
. Les OAT sont
surtout présents dans les reins, mais ont aussi des sites d’expression extrarénaux comme le
foie, l’intestin et le cerveau263
. Les principaux OAT exprimés chez l’humain et le rat sont
présentés dans le tableau VII et les sections suivantes.
Tableau VII Les transporteurs d’anions organiques ayant une importance clinique dans la
pharmacocinétique des médicaments.
Transporteur Gène Localisation
(membrane)
Substrats
OAT1 (humain),
Oat1 (rongeur)
SLC22A6
(humain),
Slc22a6
(rongeur)
• Tubule proximal
rénal
(basolatérale)
• Acétylsalicylate
• Acyclovir
• AMPc
• Adéfovir
• p-Aminohippurate
• Bumétanide
• Cidofovir
• Ciprofloxacin
• Ganciclovir
• GMPc
• Furosémide
• Ibuprofène
• Indométacine
• Kétoprofène
• Méthotrexate
• Prostaglandine E2
• Ochratoxine A
• Oméprazole
• Rifampicine
• Salicylate
• Théophylline
• Urate
• Zidovudine
OAT2 (humain),
Oat2 (rongeur)
SLC22A7
(humain),
Slc22a7
(rongeur)
• Foie
(sinusoïdale)
• Tubule proximal
rénal
(basolatérale)
• Tubule
collecteur rénal
• Acétylsalicylate
• Adénine
• Adénosine
• Allopurinol
• AMPc
• Bumétanide
• Cimétidine
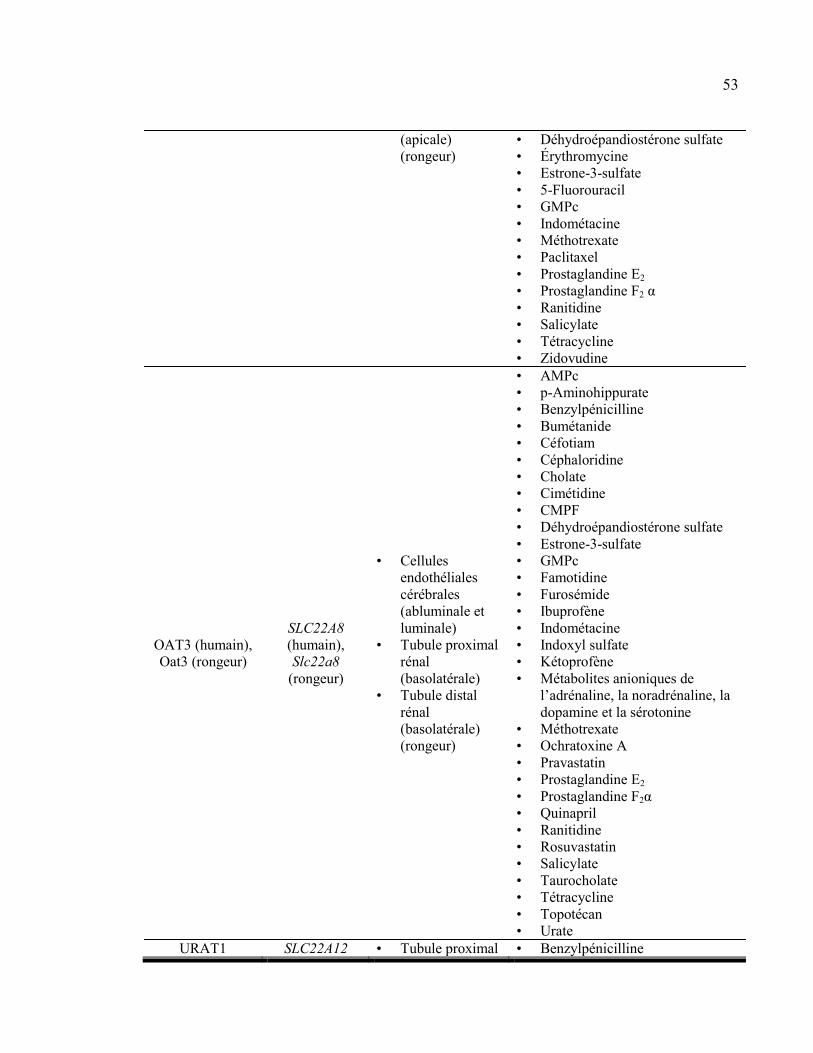
53
(apicale)
(rongeur)
• Déhydroépandiostérone sulfate
• Érythromycine
• Estrone-3-sulfate
• 5-Fluorouracil
• GMPc
• Indométacine
• Méthotrexate
• Paclitaxel
• Prostaglandine E2
• Prostaglandine F2 α
• Ranitidine
• Salicylate
• Tétracycline
• Zidovudine
OAT3 (humain),
Oat3 (rongeur)
SLC22A8
(humain),
Slc22a8
(rongeur)
• Cellules
endothéliales
cérébrales
(abluminale et
luminale)
• Tubule proximal
rénal
(basolatérale)
• Tubule distal
rénal
(basolatérale)
(rongeur)
• AMPc
• p-Aminohippurate
• Benzylpénicilline
• Bumétanide
• Céfotiam
• Céphaloridine
• Cholate
• Cimétidine
• CMPF
• Déhydroépandiostérone sulfate
• Estrone-3-sulfate
• GMPc
• Famotidine
• Furosémide
• Ibuprofène
• Indométacine
• Indoxyl sulfate
• Kétoprofène
• Métabolites anioniques de
l’adrénaline, la noradrénaline, la
dopamine et la sérotonine
• Méthotrexate
• Ochratoxine A
• Pravastatin
• Prostaglandine E2
• Prostaglandine F2α
• Quinapril
• Ranitidine
• Rosuvastatin
• Salicylate
• Taurocholate
• Tétracycline
• Topotécan
• Urate
URAT1 SLC22A12 • Tubule proximal • Benzylpénicilline
54
(humain), Urat1
(rongeur)
(humain),
Slc22a12
(rongeur)
rénal (apicale) • Candésartan
• Losartan
• Nicotinate
• Urate
Tableau adapté selon les références98, 100, 117, 118, 121-125, 132-134, 251, 273-278
.
Abréviations : AMPc, adénosine 3’,5’-monophosphate; CMPF, 3-carboxyl-4-methyl-5-
propyl-2-furonapropionate; GMPc, guanisone 3’,5’-monophosphate
3.2.2.1 OAT1
Les Oat1 (Slc22a6) de rat et de souris ont été caractérisés par clonage dans les années
1990270, 272, 279
. Chez le rat, il avait été nommé ROAT1 (OAT1 de rat) alors que chez la
souris, il avait été nommé « novel kidney specific transporter » (NKT)270, 272, 279
. Finalement,
l’appellation OAT1 a été conservée. L’orthologue humain a été caractérisé peu après280, 281
.
Des orthologues de OAT1 ont aussi été identifiés chez le singe, le cochon et le lapin273
. Chez
le rat et l’humain, OAT1 est exprimé principalement à la membrane basolatérale des tubules
proximaux rénaux et c’est pourquoi il est considéré comme étant un transporteur spécifique
aux reins. Toutefois, de faibles niveaux d’expression ont été retrouvés dans d’autres organes
comme le foie, l’estomac, le pancréas, la vessie et le muscle squelettique262, 273
.
OAT1 est un échangeur anion organique/dicarboxylate (préférablement le
α-ketoglutarate) selon un mécanisme de transport actif tertiaire représenté à la Figure 6. À la
première étape, un gradient de sodium est maintenu par la Na+/K+-ATPase (Na/K ATPase),
ensuite, l’entrée de sodium par cette pompe entraîne une entrée de α-ketoglutarate dans la
cellule par le Na+/dicarboxylate transporter 3 (NaDC3). L’action du NaDC3 de même que la
production de α-ketoglutarate par le métabolisme de l’acide citrique dans les mitochondries
permettent de maintenir le gradient de concentration en α-ketoglutarate entre les milieux
intra- et extracellulaires. Ce gradient permet l’échange par OAT1 entre l’α-ketoglutarate qui
sort de la cellule selon son gradient et un anion organique qui entre dans la cellule267, 273
.
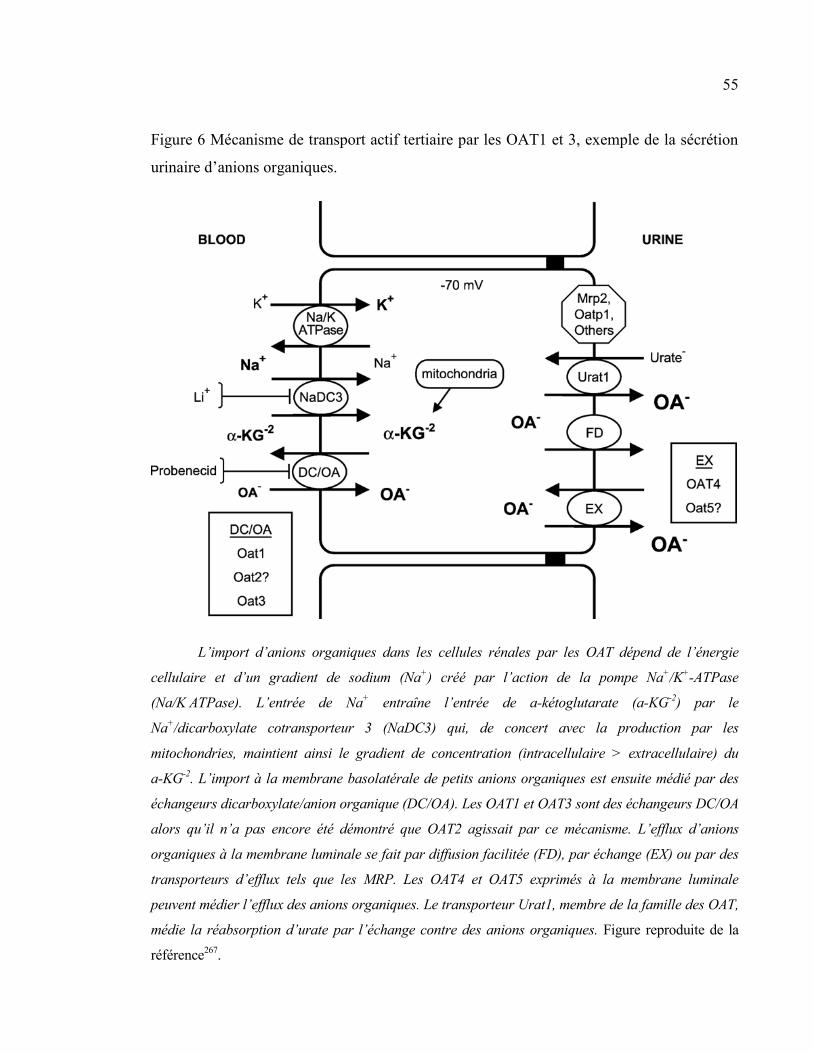
55
Figure 6 Mécanisme de transport actif tertiaire par les OAT1 et 3, exemple de la sécrétion
urinaire d’anions organiques.
L’import d’anions organiques dans les cellules rénales par les OAT dépend de l’énergie
cellulaire et d’un gradient de sodium (Na+) créé par l’action de la pompe Na
+/K
+-ATPase
(Na/K ATPase). L’entrée de Na+ entraîne l’entrée de a-kétoglutarate (a-KG
-2) par le
Na+/dicarboxylate cotransporteur 3 (NaDC3) qui, de concert avec la production par les
mitochondries, maintient ainsi le gradient de concentration (intracellulaire > extracellulaire) du
a-KG-2
. L’import à la membrane basolatérale de petits anions organiques est ensuite médié par des
échangeurs dicarboxylate/anion organique (DC/OA). Les OAT1 et OAT3 sont des échangeurs DC/OA
alors qu’il n’a pas encore été démontré que OAT2 agissait par ce mécanisme. L’efflux d’anions
organiques à la membrane luminale se fait par diffusion facilitée (FD), par échange (EX) ou par des
transporteurs d’efflux tels que les MRP. Les OAT4 et OAT5 exprimés à la membrane luminale
peuvent médier l’efflux des anions organiques. Le transporteur Urat1, membre de la famille des OAT,
médie la réabsorption d’urate par l’échange contre des anions organiques. Figure reproduite de la
référence267
.
56
Les OAT présentent une grande variété de substrats incluant des substrats endogènes
tels que l’AMPc et le GMPc, les prostaglandines et l’acide urique de même que plusieurs
médicaments incluant des antibiotiques, des diurétiques, des anti-inflammatoires non
stéroïdiens et des agents anticancéreux (voir tableau VII). En ce qui concerne les
antibiotiques, il semblerait que les antibiotiques de type céphalosporines sont ceux ayant la
plus grande affinité pour OAT1, les antibiotiques de type pénicilline ayant une meilleure
affinité pour OAT3273
. Toutefois, le substrat type de l’OAT1 est l’acide ρ-aminohippurique
(PAH) qui s’accumule chez des souris déficientes en Oat1 (Oat1-/-)282, 283
. Aussi, l’inhibiteur
le plus connu et le mieux caractérisé de l’OAT1 est le probénécid, un médicament
uricosurique utilisé dans le traitement de la goutte et de l’hyperuricémie, qui l’inhibe sans
toutefois être un substrat273
.
D’ailleurs, plusieurs interactions médicamenteuses impliquant le probénécid et des
anions organiques ont été rapportées. Par exemple, le probénécid réduit l’excrétion rénale des
céphalosporines, ce qui entraîne une augmentation de leur surface sous la courbe, c’est-à-dire
des concentrations élevées de céphalosporine plus longtemps97, 284
. L’usage de probénécid a
ainsi été envisagé pour améliorer l’efficacité du traitement de la gonorrhée par les
céphalosporines284
. De la même façon, le probénécid réduit l’excrétion rénale du cidofovir,
un médicament antiviral pouvant être néphrotoxique transporté par OAT1278
, ce qui a pour
effet de réduire son accumulation rénale et aussi sa néphrotoxicité. Il est même suggéré
d’utiliser le probénécid pour prévenir la néphrotoxicité du cidofovir285-289
.
3.2.2.2 OAT2
Le « novel liver transporter » (NLT) a été identifié dans le foie de rat par clonage en
1994 par le groupe de Simonson et al.290
. Quelques années plus tard, le groupe de
Sekine et al. a caractérisé ce nouveau transporteur et a suggéré qu’il soit renommé Oat2
57
puisque ce transporteur présentait 42 % de similarité avec l’Oat1 et puisqu’il transportait de
nombreux anions organiques comme le salicylate, l’acétylsalicylate, la prostaglandine E2, des
dicarboxylates et l’acide ρ-amminohippurique vers l’intérieur des cellules lorsqu’il était
surexprimé dans des ovocytes de Xenopus laevis. Ils ont ainsi trouvé l’ARNm du nouvel
Oat2 (Slc22a7) dans le foie et le rein de rats avec une expression beaucoup plus élevée dans
le foie291
. Depuis ce temps, OAT2 (SLC22A7) a été identifié dans le foie et le rein
humains292
.
Bien qu’aucune étude d’immunolocalisation de OAT2 n’ait été faite chez le rat ou
l’humain, il est généralement considéré que OAT2 est exprimé à la membrane basolatérale
des sinusoïdes hépatiques et il transporte ses substrats du sang vers l’hépatocyte où ils
peuvent être métabolisés ou éliminés dans la bile262, 273
. La localisation de OAT2 semble
différer dans le rein humain et de rat. En effet, chez l’humain, OAT2 est exprimé à la
membrane basolatérale des tubules proximaux, alors que chez le rat, on l’a aussi identifié à la
membrane apicale des cellules du tubule collecteur293-295
. L’OAT2 exprimé à la membrane
basolatérale du tubule proximal transporte les substrats du sang vers la cellule tubulaire,
toutefois, il n’est pas encore déterminé si l’Oat2 retrouvé à la membrane apicale du tubule
collecteur rénal sert à la sécrétion ou à la réabsorption urinaire d’anions organiques273
.
En plus des substrats nommés ci-dessus, OAT2 peut transporter de nombreuses
molécules, mais avec des affinités moindres que OAT1 et OAT3, incluant des diurétiques,
des antibiotiques, des agents anticancéreux et des bloqueurs du récepteur 2 de l’histamine. À
ce jour, aucun inhibiteur spécifique de OAT2 n’a été identifié, mais le probénécid est un bon
inhibiteur de tous les OAT y compris l’OAT2. De plus, aucune interaction médicamenteuse
impliquant OAT2 n’a été rapportée à ce jour273
.
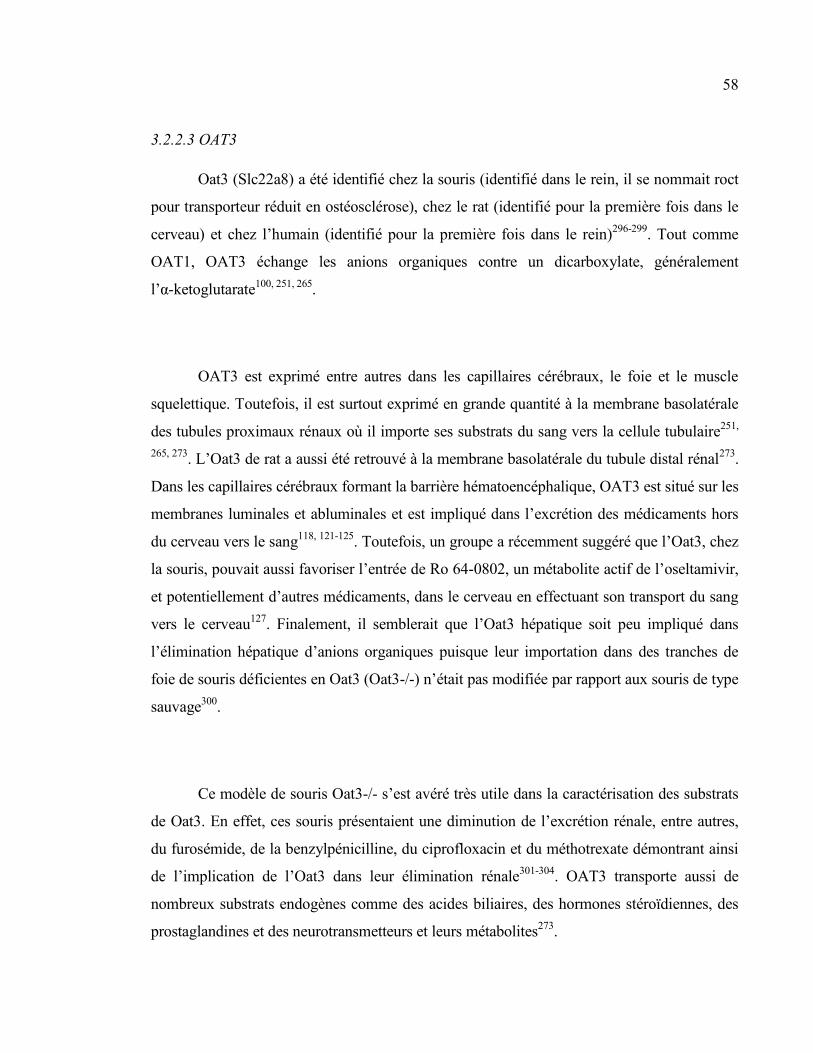
58
3.2.2.3 OAT3
Oat3 (Slc22a8) a été identifié chez la souris (identifié dans le rein, il se nommait roct
pour transporteur réduit en ostéosclérose), chez le rat (identifié pour la première fois dans le
cerveau) et chez l’humain (identifié pour la première fois dans le rein)296-299
. Tout comme
OAT1, OAT3 échange les anions organiques contre un dicarboxylate, généralement
l’α-ketoglutarate100, 251, 265
.
OAT3 est exprimé entre autres dans les capillaires cérébraux, le foie et le muscle
squelettique. Toutefois, il est surtout exprimé en grande quantité à la membrane basolatérale
des tubules proximaux rénaux où il importe ses substrats du sang vers la cellule tubulaire251,
265, 273. L’Oat3 de rat a aussi été retrouvé à la membrane basolatérale du tubule distal rénal
273.
Dans les capillaires cérébraux formant la barrière hématoencéphalique, OAT3 est situé sur les
membranes luminales et abluminales et est impliqué dans l’excrétion des médicaments hors
du cerveau vers le sang118, 121-125
. Toutefois, un groupe a récemment suggéré que l’Oat3, chez
la souris, pouvait aussi favoriser l’entrée de Ro 64-0802, un métabolite actif de l’oseltamivir,
et potentiellement d’autres médicaments, dans le cerveau en effectuant son transport du sang
vers le cerveau127
. Finalement, il semblerait que l’Oat3 hépatique soit peu impliqué dans
l’élimination hépatique d’anions organiques puisque leur importation dans des tranches de
foie de souris déficientes en Oat3 (Oat3-/-) n’était pas modifiée par rapport aux souris de type
sauvage300
.
Ce modèle de souris Oat3-/- s’est avéré très utile dans la caractérisation des substrats
de Oat3. En effet, ces souris présentaient une diminution de l’excrétion rénale, entre autres,
du furosémide, de la benzylpénicilline, du ciprofloxacin et du méthotrexate démontrant ainsi
de l’implication de l’Oat3 dans leur élimination rénale301-304
. OAT3 transporte aussi de
nombreux substrats endogènes comme des acides biliaires, des hormones stéroïdiennes, des
prostaglandines et des neurotransmetteurs et leurs métabolites273
.
59
Plusieurs interactions médicamenteuses impliquant OAT3 ont été rapportées. Un
exemple bien connu est celui de la diminution de l’excrétion rénale de la pénicilline par le
probénécid305, 306
. Cette interaction est certainement due à l’inhibition de plusieurs OAT par
le probénécid, mais l’OAT3 est probablement le plus impliqué puisque la pénicilline a une
plus grande affinité avec l’OAT3 qu’avec les autres OAT273
.
De la même façon, l’inhibition des OAT par le probénécid307
ou par les
anti-inflammatoires non stéroïdiens308, 309
est aussi fort probablement responsable de la
toxicité du méthotrexate lorsqu’il est coadministré avec un de ces médicaments. Toutefois,
OAT3 a une meilleure affinité pour le méthotrexate et est aussi plus sensible à l’inhibition par
le probénécid ou les anti-inflammatoires non stéroïdiens à des concentrations plasmatiques
normales ce qui laisse croire que l’inhibition de l’élimination du méthotrexate par OAT3 est
la plus impliquée dans cette interaction médicamenteuse273
.
3.2.2.4 URAT1
L’acide urique est un produit du métabolisme des purines. Les humains ont des
concentrations plasmatiques élevées d’acide urique parce qu’ils le réabsorbent par le
transporteur URAT1 (SLC22A12) spécifique au rein310
.
URAT1 a été identifié pour la première fois dans les reins de souris et a été nommé
« renal specific transporter » (Rst) toutefois sa fonction n’était pas connue311
. C’est lors de la
caractérisation de son orthologue humain qu’on a découvert son implication dans la
réabsorption de l’acide urique et qu’il a été nommé URAT1312, 313
. URAT1 est exprimé à la
membrane apicale des cellules des tubules proximaux et réabsorbe l’acide urique de l’urine
par un échange avec des anions intracellulaires organiques ou inorganiques comme le lactate,
60
le nicotinate ou le chlorure310, 314
. Les anions organiques qui sont importés dans les cellules
proximales par des transporteurs apicaux ou basolatéraux, ou ceux qui sont produits dans les
cellules proximales facilitent la réabsorption de l’acide urique en quittant la cellule en
échange d’acide urique luminal310
. Des médicaments peuvent aussi être échangés contre
l’urate. Par exemple, le candésartan, le losartan et l’olmésartan peuvent être expulsés dans le
tubule rénal en échange de l’absorption de l’urate315
. Finalement, l’Urat1 surexprimé dans des
ovocytes de Xenopus lavei peut importer la benzylpénicilline, ce qui laisse supposer que
l’Urat1 peut réabsorber la benzylpénicilline du filtrat rénal313
.
3.2.3 LE « TYPE 1 SODIUM-DEPENDENT PHOSPHATE TRANSPORTER» (NPT1)
Initialement le « type 1 sodium-dependent phosphate transporter » (NaPi1), exprimé
à la membrane apicale des cellules du tubule proximal rénal et à la membrane sinusoïdale des
hépatocytes de lapin, a été identifié comme un transporteur de phosphate
sodium-dépendant316, 317
. Son orthologue humain NPT1 (SLC17A1) a ensuite rapidement été
identifié ainsi qu’un orthologue chez le rat251, 318, 319
. L’analyse moléculaire de NPT1 a
ensuite démontré que NPT1 pouvait transporter des anions organiques320
incluant la
benzylpénicilline et le PAH avec une meilleure affinité que le phosphate320, 321
. Le NPT1
permet ainsi l’élimination rénale en favorisant l’excrétion de ses substrats dans l’urine à
travers la membrane apicale des cellules du tubule proximal rénal322
alors que dans le foie, il
effectue le transport de ces substrats de l’hépatocyte vers le sang323
. D’autres anions
organiques substrats de NPT1 incluant l’acide urique, la benzylpénicilline, le 17β-estradiol
glucuronide ainsi que le salicylate et l’acide acétylsalicylique, le faropenem, un antibiotique
de la famille des β-lactames et le foscarnet, un médicament antiviral, sont transportés par
NPT1 par un mécanisme dépendant du potentiel membranaire321-323
.
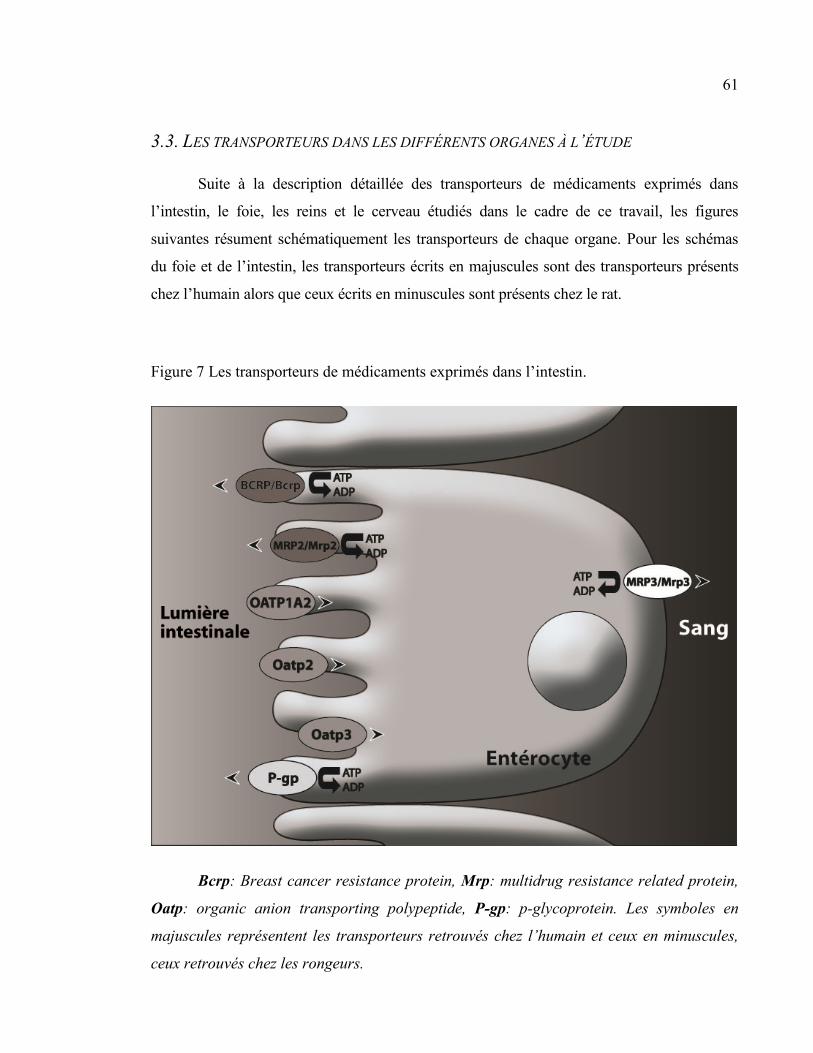
61
3.3. LES TRANSPORTEURS DANS LES DIFFÉRENTS ORGANES À L’ÉTUDE
Suite à la description détaillée des transporteurs de médicaments exprimés dans
l’intestin, le foie, les reins et le cerveau étudiés dans le cadre de ce travail, les figures
suivantes résument schématiquement les transporteurs de chaque organe. Pour les schémas
du foie et de l’intestin, les transporteurs écrits en majuscules sont des transporteurs présents
chez l’humain alors que ceux écrits en minuscules sont présents chez le rat.
Figure 7 Les transporteurs de médicaments exprimés dans l’intestin.
Bcrp: Breast cancer resistance protein, Mrp: multidrug resistance related protein,
Oatp: organic anion transporting polypeptide, P-gp: p-glycoprotein. Les symboles en
majuscules représentent les transporteurs retrouvés chez l’humain et ceux en minuscules,
ceux retrouvés chez les rongeurs.
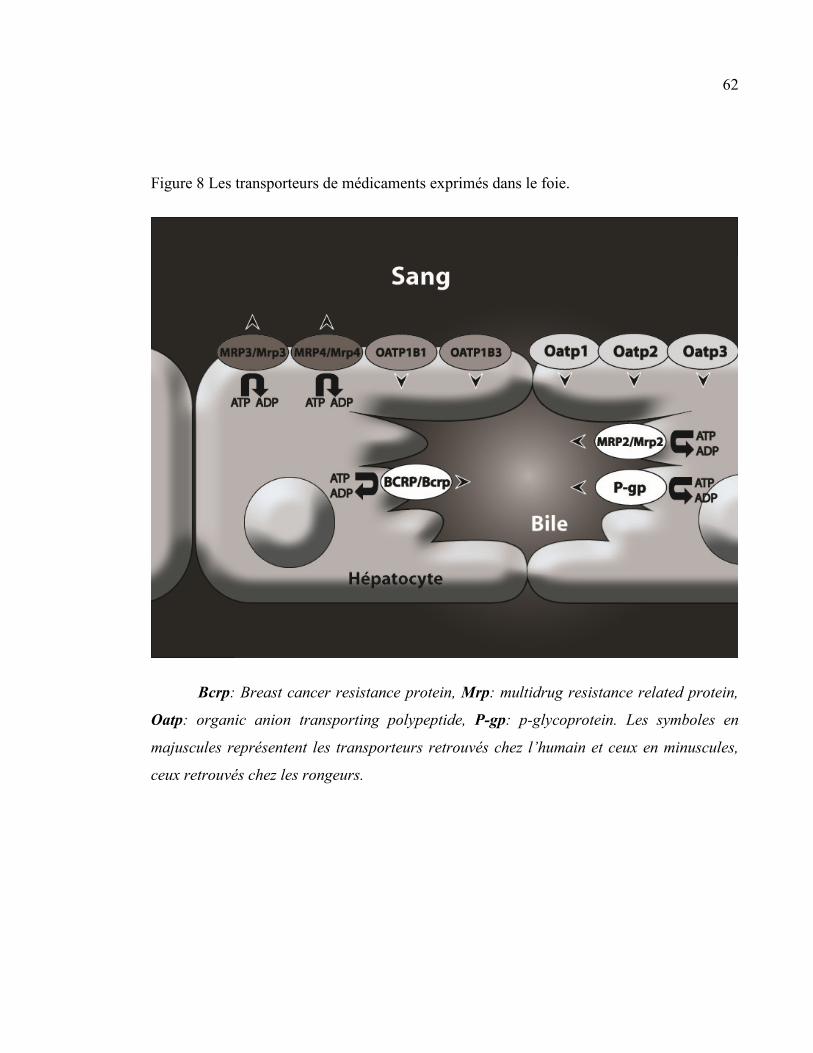
62
Figure 8 Les transporteurs de médicaments exprimés dans le foie.
Bcrp: Breast cancer resistance protein, Mrp: multidrug resistance related protein,
Oatp: organic anion transporting polypeptide, P-gp: p-glycoprotein. Les symboles en
majuscules représentent les transporteurs retrouvés chez l’humain et ceux en minuscules,
ceux retrouvés chez les rongeurs.
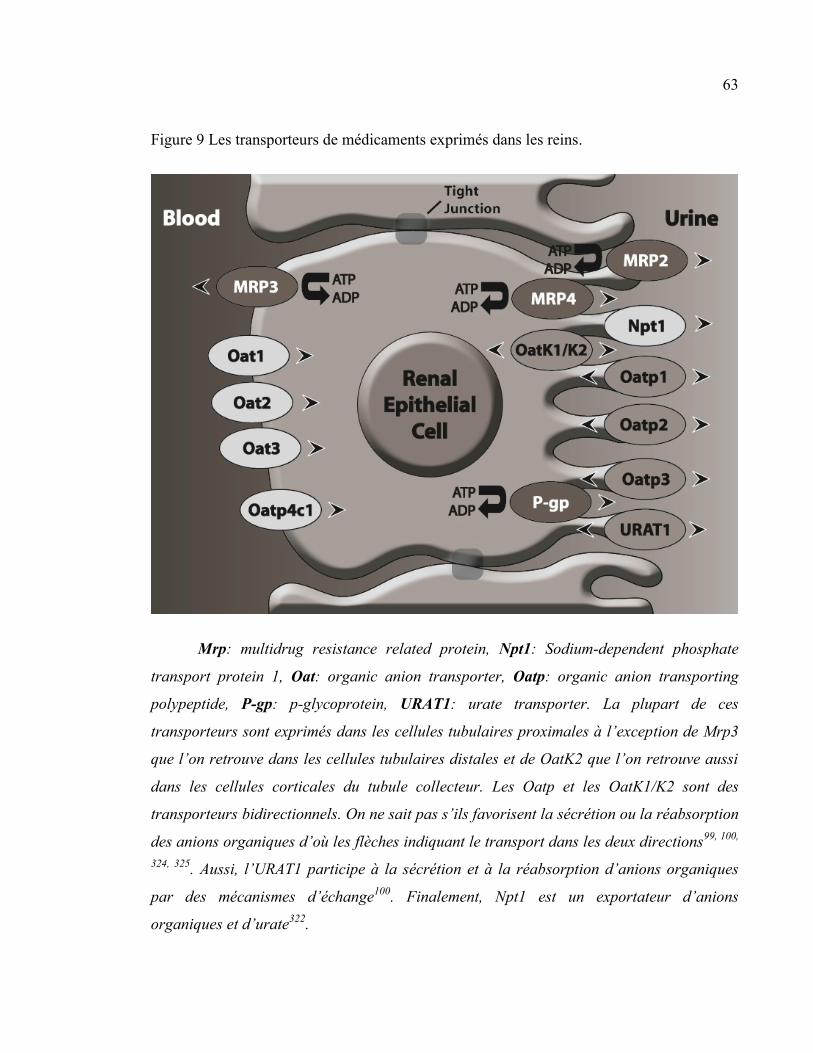
63
Figure 9 Les transporteurs de médicaments exprimés dans les reins.
Mrp: multidrug resistance related protein, Npt1: Sodium-dependent phosphate
transport protein 1, Oat: organic anion transporter, Oatp: organic anion transporting
polypeptide, P-gp: p-glycoprotein, URAT1: urate transporter. La plupart de ces
transporteurs sont exprimés dans les cellules tubulaires proximales à l’exception de Mrp3
que l’on retrouve dans les cellules tubulaires distales et de OatK2 que l’on retrouve aussi
dans les cellules corticales du tubule collecteur. Les Oatp et les OatK1/K2 sont des
transporteurs bidirectionnels. On ne sait pas s’ils favorisent la sécrétion ou la réabsorption
des anions organiques d’où les flèches indiquant le transport dans les deux directions99, 100,
324, 325. Aussi, l’URAT1 participe à la sécrétion et à la réabsorption d’anions organiques
par des mécanismes d’échange100
. Finalement, Npt1 est un exportateur d’anions
organiques et d’urate322
.
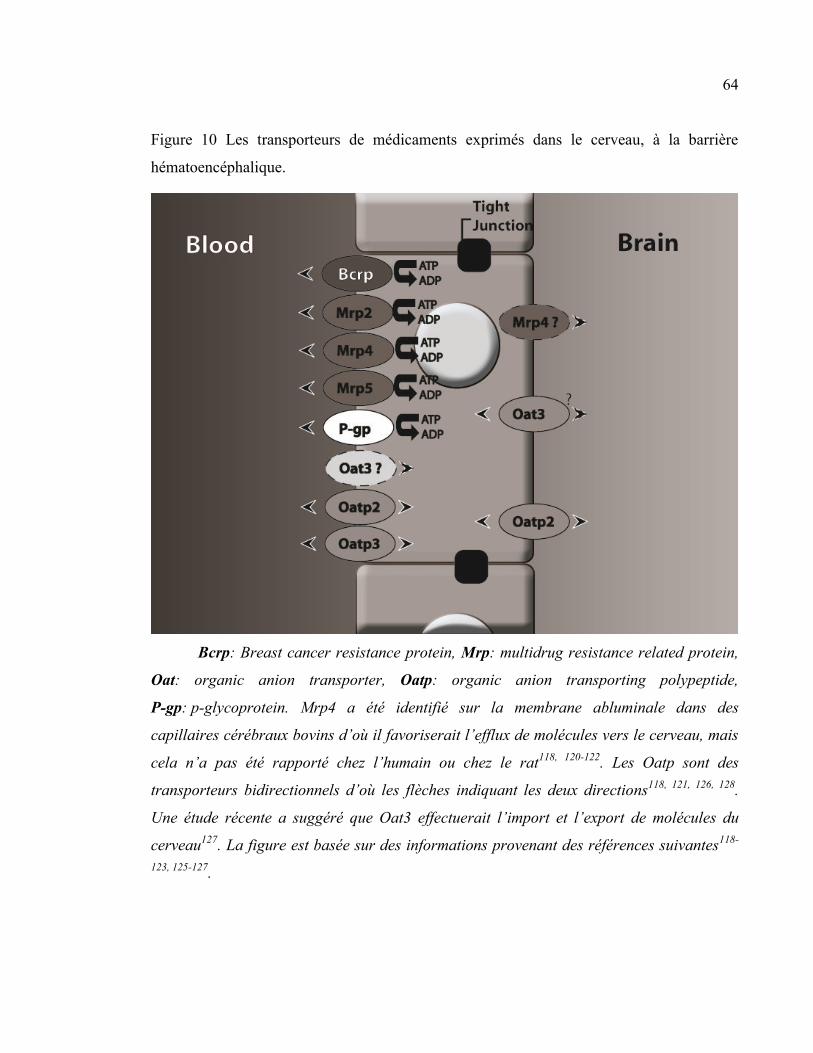
64
Figure 10 Les transporteurs de médicaments exprimés dans le cerveau, à la barrière
hématoencéphalique.
Bcrp: Breast cancer resistance protein, Mrp: multidrug resistance related protein,
Oat: organic anion transporter, Oatp: organic anion transporting polypeptide,
P-gp: p-glycoprotein. Mrp4 a été identifié sur la membrane abluminale dans des
capillaires cérébraux bovins d’où il favoriserait l’efflux de molécules vers le cerveau, mais
cela n’a pas été rapporté chez l’humain ou chez le rat118, 120-122
. Les Oatp sont des
transporteurs bidirectionnels d’où les flèches indiquant les deux directions118, 121, 126, 128
.
Une étude récente a suggéré que Oat3 effectuerait l’import et l’export de molécules du
cerveau127
. La figure est basée sur des informations provenant des références suivantes118-
123, 125-127.
65
4. HYPOTHESE
En résumé, la pharmacocinétique des médicaments est modifiée en IRC. En effet, il a
été très bien démontré à l’aide d’études cliniques et de modèles animaux que l’IRC affecte
non seulement l’élimination rénale des médicaments, mais aussi leur élimination
métabolique, particulièrement dans le foie et l’intestin. Ces phénomènes expliquent en
partie l’augmentation de l’incidence des effets indésirables des médicaments observés lors de
l’IRC.
Une autre étape importante dans la cinétique des médicaments est leur import et
leur export par les transporteurs d’influx et d’efflux exprimés dans l’épithélium de
plusieurs organes, dont l’intestin, le foie et le rein, ainsi que dans l’endothélium de la
barrière hématoencéphalique. Ces transporteurs jouent un rôle important dans la
biodisponibilité, l’élimination hépatique, l’élimination rénale et la distribution des
médicaments au cerveau en participant activement à l’extrusion des médicaments dans la
lumière intestinale, la bile, l’urine ou encore en bloquant leur entrée dans le cerveau.
Nous avons déjà démontré, à l’aide d’un modèle de rats néphrectomisés, que l’IRC
entraîne une diminution de l’expression protéique et de l’activité intestinale d’au moins
deux transporteurs d’efflux de médicaments (la P-gp et le Mrp2), pouvant entraîner une
augmentation de la biodisponibilité des médicaments dont l’absorption est limitée par un
transport rétrograde par ces deux transporteurs55
. L’expression protéique d’au moins deux
transporteurs d’influx (Oatp2 et Oatp3) n’était toutefois pas affectée par l’IRC55
. La
diminution de l’expression et de l’activité de la P-gp et de Mrp2 a été attribuée à un ou des
facteurs circulant s’accumulant dans le sérum des rats souffrant d’IRC. Il a été suggéré que
ces facteurs puissent être des cytokines pro-inflammatoires ou des toxines urémiques
présentes de façon excessive dans le sérum des animaux et des patients souffrant d’IRC et
reconnues comme pouvant affecter l’expression et l’activité des transporteurs de
médicaments55
.
66
Si un ou des facteurs circulant dans le sérum de rats souffrant d’IRC peuvent moduler
l’expression et l’activité des transporteurs de médicaments dans l’intestin, ces facteurs
peuvent tout aussi bien affecter l’expression et l’activité des transporteurs de médicaments
situés dans les autres organes. De plus, des observations cliniques ainsi que quelques études
dans des modèles animaux suggèrent que l’expression et l’activité des transporteurs de
médicaments hépatiques, rénaux et cérébraux pourraient être affectées par l’IRC.
Le but de ce travail de doctorat est d’étudier les effets de l’IRC sur la cinétique des
médicaments, particulièrement sur leur transport actif, afin de bien comprendre les
mécanismes conduisant à l’importante incidence de toxicité et d’effets indésirables observée
chez les sujets souffrant d’insuffisance rénale chronique. Mon hypothèse de travail est que
l’IRC affecte l’expression et l’activité des transporteurs de médicaments situés dans le foie,
les reins, et à la barrière hématoencéphalique modifiant l’élimination hépatique, la sécrétion
tubulaire active et l’entrée des médicaments dans le cerveau.
5. OBJECTIFS
Dans un premier temps, les impacts de l’IRC sur les transporteurs hépatiques de
médicaments ont été évalués dans un modèle de rats chez lesquels l’IRC a été induite par
néphrectomie 5/6. Les expressions protéique et génique de Mrp2, Oatp2 et P-gp ont été
mesurées dans des foies provenant d’animaux souffrant d’IRC ou témoins. De plus, l’activité
de la P-gp hépatique a été mesurée in vivo par la mesure de l’excrétion biliaire de la
rhodamine 123 chez ces animaux. Nous avons déterminé in vitro l’effet du sérum urémique
sur l’expression protéique des transporteurs dans des hépatocytes de rat en culture.
Dans un second temps, les impacts de l’IRC sur les transporteurs rénaux de
médicaments ont été évalués à l’aide du même modèle de rats néphrectomisés. Nous avons
mesuré les expressions protéique et génique de Mrp2, 3 et 4, Npt1, Oat1, 2 et 3, OatK1/K2,
Oatp1, 2, 3 et 4c1, P-gp et Urat1 dans le rein restant des animaux souffrant d’IRC
comparativement aux témoins. Nous avons aussi mesuré l’accumulation intrarénale de
médicaments radiomarqués, substrats des transporteurs de médicaments rénaux chez ces
67
mêmes animaux. De plus, nous avons déterminé in vitro l’effet du sérum urémique sur
l’expression protéique des transporteurs dans une lignée cellulaire de cellules tubulaires
proximales humaines (Human Kidney-2). Finalement, nous avons déterminé l’effet du sérum
de rat urémique sur le transport de la rhodamine 123, un substrat de la P-gp, dans cette même
lignée cellulaire.
Le troisième projet consistait à évaluer les impacts de l’IRC sur les transporteurs de
médicaments exprimés à la BHE dans notre modèle de rats IRC. Nous avons mesuré les
expressions protéique et génique de Bcrp, Mrp2, 4 et 5, Oat3, Oatp2 et 3, et P-gp dans le
cerveau de rats néphrectomisés et témoins. Nous avons aussi mesuré in vivo l’accumulation
intracérébrale de la benzylpénicilline, de la digoxine, de la doxorubicine et du vérapamil, des
substrats des transporteurs exprimés à la BHE, radiomarqués chez les animaux IRC
comparativement aux témoins. Finalement, nous avons déterminé in vitro l’effet du sérum
urémique sur l’expression protéique des transporteurs dans des astrocytes et des cellules
endothéliales de cerveau de rat en culture.
Finalement, le dernier projet a été une collaboration avec un groupe de recherche
américain. Il consistait à évaluer comment l’insuffisance rénale sévère affecte la clairance
non rénale des médicaments en étudiant leur biotransformation et leur transport intestinal et
hépatique chez des patients souffrant d’insuffisance rénale terminale. La pharmacocinétique
du midazolam, un substrat du CYP3A, et de la fexofénadine, un médicament majoritairement
transporté, a été évaluée chez les patients dialysés. Ces études cliniques ont été réalisées par
le groupe américain. Dans le cadre de cette étude, nous avons déterminé les effets du sérum
provenant des sujets de l’étude sur l’expression protéique des transporteurs de médicaments
Oatp et P-gp et du cytochrome P450 3a dans des entérocytes et des hépatocytes de rat en
culture.
J’ai personnellement été responsable du développement et des expérimentations des
trois projets impliquant les rats néphrectomisés. Les dosages biochimiques (urée, créatinine)
ont été réalisés par le service clinique de l’hôpital Maisonneuve-Rosemont. Mon rôle dans le
4e projet était un rôle de collaboration avec le groupe américain pour les études in vitro.
68
Méthodologie
1. LE MODÈLE DE RAT URÉMIQUE
Les trois premières études ont été réalisées dans un modèle rat néphrectomisé. Les
animaux étaient séparés en deux groupes : un groupe témoin, ayant subi une laparotomie
blanche, et un groupe de rats néphrectomisés (IRC) ayant subi une néphrectomie 5/6 en
deux étapes. La première étape consistait à une néphrectomie des deux tiers du rein gauche,
suivie, sept jours plus tard, d’une néphrectomie totale du rein droit. Les animaux du groupe
IRC avaient accès à la nourriture et l’eau à volonté. Les animaux du groupe témoin
recevaient la quantité de nourriture consommée par les animaux du groupe IRC la veille et
de l’eau à volonté. Quarante-et-un jours après la première néphrectomie, les rats étaient
placés en cage métabolique pour une collecte urinaire de 24 h afin de déterminer la
clairance de la créatinine. Les rats étaient sacrifiés 42 jours post-néphrectomie. Lors du
sacrifice par décapitation, le foie, les reins, le cerveau et le sérum des rats ont été prélevés.
Des animaux ont aussi été utilisés pour des études de transport in vivo.
2. MESURE DE L’EXPRESSION PROTÉIQUE DES TRANSPORTEURS DANS LES TISSUS
L’expression protéique des différents transporteurs de médicaments a été mesurée
par immunobuvardage de type western. L’expression des transporteurs hépatiques a été
mesurée dans des homogénats de foie de rats néphrectomisés ou témoins préparés dans du
NaCl 0.9 % contenant du flurorure de phénylméthanesulfonyle (PMSF). L’expression des
transporteurs rénaux et cérébraux a été mesurée dans une fraction membranaire totale de
rein ou de cerveau de rats néphrectomisés ou témoins. La fraction membranaire a été
obtenue par centrifugation différentielle326
. La concentration protéique des homogénats et
des fractions membranaires a été déterminée à l’aide de la méthode de Lowry327
.
69
3. IMMUNOBUVARDAGE DE TYPE WESTERN
Pour l’analyse par immunobuvardage de type western, 100 µg de protéines ont été
déposés sur un gel de 7.5 % de polyacrylamide contenant 0.1 % de sodium dodécylsulfate
puis transférés sur une membrane de nitrocellulose. Après le blocage dans une solution de
lait écrémé 5 %, les membranes ont été hybridées avec l’anticorps primaire, puis avec un
anticorps secondaire couplé à la peroxydase. Pour la liste des anticorps utilisés, consulter
les articles ci-dessous30, 328-330
. Les complexes immuns ont ensuite été révélés à l’aide du
substrat à base de luminol Lumilight Plus (Roche Diagnostics, Laval, Québec, Canada).
L’intensité de la réaction a été mesurée par l’analyse de la densitométrie des bandes
obtenues sur un appareil de détection Fuji (Stamford, CT) LAS-3000 LCD à l’aide du
programme d’analyse MultiGauge (Fuji). Dans le foie et le cerveau, la glycéraldéhyde-3-
phosphate déshydrogénase (Gapdh) a été utilisée comme protéine de contrôle. La villine-1
a été utilisée dans le rein. La moyenne de la densitométrie obtenue dans les tissus provenant
du groupe de rats témoins a été arbitrairement définie comme représentant 100 %
d’expression.
4. MESURE DE L’EXPRESSION GÉNIQUE DES TRANSPORTEURS DANS LES TISSUS
Au moment du sacrifice, le foie, les reins et le cerveau des animaux ont été rincés
dans de la saline glacée puis congelés dans l’azote liquide. Les échantillons ont été
conservés à -80 °C jusqu’à l’extraction de l’ARN. L’ARN total de foie de rat a été extrait à
l’aide du RNeasy mini-kit de Qiagen (Mississauga, ON, Canada). L’ARN total de reins et
de cerveau de rat a été extrait à l’aide du réactif TRIzol (Invitrogen, Burlington, ON,
Canada). Pour tous les tissus, 1 µg d’ARN total a été utilisé pour préparer l’ADNc par
transcription inverse. L’ARNm des différents transporteurs a été mesuré par réaction de
polymérase en chaîne quantitative en temps-réel (qPCR) à l’aide d’amorces spécifiques
pour les différents transporteurs. Pour le descriptif des amorces, consulter les articles
ci-dessous328-330
. Les produits de PCR ont été analysés à l’aide de la méthode du ΔΔCT331
en utilisant la gapdh comme gène standard dans le foie et le cerveau et la villin-1 dans le
rein.
70
5. MESURE, IN VIVO, DE L’ACTIVITÉ DES TRANSPORTEURS DE MÉDICAMENTS
5.1 EXCRÉTION DE RHODAMINE 123
Pour évaluer in vivo l’activité de la P-gp hépatique et rénale chez des rats témoins et
néphrectomisés, nous avons mesuré l’excrétion biliaire et urinaire de la rhodamine 123
chez le rat anesthésié en utilisant une adaptation de la méthode publiée par Yumoto332
.
Brièvement, nous avons infusé de la rhodamine 123 par la veine fémorale droite pendant 40
minutes. Pendant ce temps, nous avons récolté la bile et l’urine totales à des intervalles de
10 minutes ainsi que le sang des animaux pour le dosage de la rhodamine 123. Ensuite, un
bolus de cyclosporine a été administré et de la cyclosporine a été ajoutée à la perfusion,
puis la bile et l’urine totales ainsi que le sang ont été prélevés aux 10 minutes pendant 50
minutes pour le dosage de la rhodamine 123. À la fin, les animaux ont été sacrifiés et le foie
prélevé et congelé dans l’azote liquide. La concentration de rhodamine 123 dans les
liquides biologiques a été mesurée par chromatographie liquide de haute performance.
La clairance biliaire de la rhodamine a été déterminée à l’aide de l’équation Clb =
(Cb x Vb)/(Cp,ss x temps) où Cb est la concentration biliaire de la rhodamine, Vb est le
volume biliaire et Cp,ss est la concentration plasmatique de la rhodamine à l’état d’équilibre.
La clairance urinaire de la rhodamine a été déterminée à l’aide de l’équation Clu = (Cu x
Vu)/(Cp,ss x temps) où Cu est la concentration urinaire de la rhodamine et Vu est le volume
urinaire.
5.2 ACCUMULATION INTRARÉNALE ET INTRACÉRÉBRALE DE MÉDICAMENTS
RADIOMARQUÉS
L’accumulation intrarénale de médicaments radiomarqués a été utilisée pour
mesurer l’activité des transporteurs de médicaments rénaux. L’accumulation intracérébrale
de médicaments radiomarqués a été utilisée pour mesurer l’activité des transporteurs de
médicaments à la barrière hématoencéphalique. La méthode utilisée pour les deux études
est la même. Elles seront donc décrites conjointement.
71
Pour l’accumulation intrarénale, nous avons testé deux médicaments radiomarqués :
la [14
C]benzylpénicilline, connue pour être un substrat de Oat3 et des Mrp123, 152, 333
, et la
[3H]digoxine reconnue comme un substrat des Oatp et de la P-gp
135, 239, 242. Pour
l’accumulation intracérébrale, en plus de la [14
C]benzylpénicilline et de la [3H]digoxine,
nous avons mesuré l’accumulation de la [14
C]doxorubicine, un substrat de la P-gp334
, et le
[3H]vérapamil, un autre substrat de la P-gp
334. Les expériences avec les différents substrats
ont été réalisées chez des rats différents.
Brièvement, les médicaments radiomarqués ont été administrés par injection
intramusculaire (benzylpénicilline), intrapéritonéale (digoxine) ou intraveineuse
(doxorubicine, vérapamil) dans un ratio chaud :froid de 1 :1500 pour éviter que la quantité
en mg de médicament radiomarqué ne soit significative dans le calcul de la dose. Après une
période de latence de 30 minutes (doxorubicine), 60 minutes (vérapamil) ou 120 minutes
(benzylpénicilline et digoxine), les animaux ont été anesthésiés par inhalation d’isoflurane
et un volume sanguin maximal a été prélevé par ponction cardiaque dans des tubes
héparinés. Le rein gauche et le cerveau des animaux ont été prélevés, rincés dans de la
saline glacée, pesés, émincés et placés dans 2 mL de solution Solvable (PerkinElmer Life
and Analytical Sciences, Waltham, MA) à 56 °C pour au moins 14 heures. Le volume des
organes dissouts a été noté et la radioactivité comptée pour 1 mL d’organe dissout et 2 mL
de plasma. Les résultats sont exprimés par un ratio entre la radioactivité comptée (coups par
minute) pour 1 g de rein et 1 mL de plasma. La moyenne des sujets du groupe témoins a
arbitrairement été définie comme représentant 100 %.
6. EFFET DU SÉRUM DE RATS URÉMIQUES SUR L’EXPRESSION DES TRANSPORTEURS DE
MÉDICAMENTS
Les effets du sérum de rats urémiques sur l’expression des transporteurs de
médicaments in vitro ont été mesurés dans des cellules Human Kidney-2 (HK-2)329
, une
lignée cellulaire de tubule proximal rénal ainsi que dans des entérocytes30
, des
hépatocytes30, 330
, des astrocytes328
et des cellules endothéliales de cerveau de rat en culture
72
primaire328
. Pour les protocoles d’isolation et de culture cellulaire, consulter les articles
ci-dessous30, 328-330
.
Brièvement, les cellules ont été incubées pendant 48 heures avec 10 % de sérum
provenant d’animaux ou de patients urémiques ou témoins. Les cellules ont ensuite été
récoltées et homogénéisées dans de la saline contenant 0,1 mM de PMSF. La concentration
protéique des échantillons a été déterminée à l’aide du Micro BCA Protein Assay kit de
Thermo Fisher Scientific (Waltham, MA). L’expression protéique des transporteurs a été
mesurée dans 100 µg de protéines par immunobuvardage de type western tel que décrit
ci-dessus.
7. EFFET DU SÉRUM DE RATS URÉMIQUES SUR L’ACTIVITÉ DE LA P-GLYCOPROTÉINE
RÉNALE
Les effets du sérum de rats urémique sur l’activité de la P-gp ont été mesurés par le
transport transépithélial de la rhodamine à travers une monocouche de cellules HK-2 tel
que décrit dans des cellules Caco-225, 52, 332
. Les cellules ont été cultivées sur des transwells
de polyéthylene terephthalate (Becton Dickinson, Mississauga, ON, Canada) jusqu’à ce
qu’elles forment une monocouche polarisée. Quarante-huit heures avant l’étude de
transport, le milieu de culture a été changé pour du milieu contenant 10 % de sérum de rats
témoins ou urémiques. Une heure avant l’étude de transport, ce milieu était remplacé par le
milieu de transport contenant 10 % de sérum de rats témoins ou urémiques. Au début de
l’étude, la rhodamine 123 a été ajoutée au compartiment apical du transwell. Le transport
transépithélial de la rhodamine a été mesuré sur une période totale de 150 minutes à 37 °C.
Le milieu de transport a été prélevé dans le compartiment basolatéral toutes les 10 minutes.
Après 90 minutes, de la cyclosporine a été ajoutée du côté apical et basolatéral. La
concentration de rhodamine 123 dans le milieu de transport a été mesurée par
spectrofluorométrie.
Les résultats sont exprimés en perméabilité apparente (Papp) de la rhodamine 123
telle que calculée par l’équation Papp = (dCr/dt)/(AC0) où dCr/dt représente la vitesse à
73
laquelle la rhodamine apparaît dans le compartiment basolatéral, A l’aire de la monocouche
et C0 la concentration initiale de rhodamine du côté apical. La moyenne des Papp pour les
cellules incubées avec du sérum de rat témoins avant l’ajout de cyclosporine a été
arbitrairement définie comme représentant 100 %.

Présentation des manuscrits
Effects of chronic renal failure on liver drug transporters
Drug Metab Dispos, 2008. 36(1): p. 124-8.
Reprinted with permission from the American Society for Pharmacology and Experimental
Therapeutics. All rights reserved.
Copyright © 2008 by The American Society for Pharmacology and Experimental
Therapeutics
76
Effects of chronic renal failure on liver drug
transporters
Judith Naud M Sc, Josée Michaud M Sc, Francois A. Leblond Ph.D, Stéphane Lefrancois
PhD, Alain Bonnardeaux MD, PhD, and Vincent Pichette MD Ph.D
Service de néphrologie et Centre de recherche Guy-Bernier, Hôpital Maisonneuve-
Rosemont, Faculté de Médecine, Université de Montréal, Québec, Canada (J.N., J.M.,
F.A.L., S.L., A.B., V.P.)
Département de pharmacologie, Faculté de Médecine, Université de Montréal, Québec,
Canada (J.N., J.M., V.P.)
Hepatic drug transporters in renal failure
Correspondence should be addressed to: Vincent Pichette MD Ph.D.
Centre de recherche de l’hôpital Maisonneuve-
Rosemont
Number of text pages: 14
Number of tables: 2
Number of figures: 4
Number of references: 25
Number of words in Abstract: 230 words
Number of words in Introduction: 550 words
Number of word in Discussion: 1050 words
List of non-standard abbreviations: CMPF: 3-carboxy-4-methyl-5-propyl-2-furan-
propanoic acid, Clb: biliary clearance, Clu: urinary clearance, Cb: biliary concentration,
Cp,ss: concentration in the plasma at steady state, Cu: urinary concentration, CRF: chronic
renal failure, CTL: control, GFR: glomerular filtration rate, IL-1: interleukin-1, IL-6:
interleukin-6, MRP2: multi-drug-resistance-related-protein type 2, Oatp2: organic-anion-
transporting-polypeptide type 2, Oatp3: organic–anion-transporting-polypeptide type 3,
P450: cytochrome P450, PBS: Phosphate Buffered Saline, PCR: polymerase chain reaction,
Pgp: P-glycoprotein, PMSF: Phenylmethylsulfonylfluoride, PTH: parathyroid hormone,
qPCR: quantitative PCR, TNF-α: Tumor-necrosis-factor-α, Vb: biliary volume, Vu: urinary
volume
Key words : gene expression, organic anion transporter, ABC transporter, drug excretion,
liver
Copyright © 2008 by The American Society for Pharmacology and Experimental Therapeutics
78
1. ABSTRACT
Chronic renal failure (CRF) is associated with a decrease in liver drug metabolism,
particularly mediated by the cytochrome P450. CRF also impedes intestinal drug
transporters [mainly P-glycoprotein (P-gp) and multidrug resistance protein (Mrp)].
However, very few studies have evaluated the effects of CRF on liver drug transport. The
present study aimed to investigate the repercussions of CRF on liver drug transporters
involved in hepatic uptake [organic anion transporting polypeptide (Oatp) 2] and in drug
extrusion (P-gp and Mrp2). Two groups of rats were studied: control and CRF. Oatp2,
P-gp, and Mrp2 protein expressions and mRNA levels, as well as some of their metabolic
activity, were assessed. The effects of CRF serum on drug transporters were also evaluated
in cultured hepatocytes. Compared with control, creatinine clearance was reduced by 70%
(p < 0.01) in rats with CRF. Protein expression and mRNA levels of P-gp were increased
by 25 and 40% (p < 0.01), respectively, in liver from rats with CRF. Mrp2 protein
expression was identical in both groups, whereas its mRNA levels were increased by 35%
(p < 0.01) in CRF rats. Finally, Oatp2 protein expression was reduced by 35%, whereas its
mRNA levels remained unchanged. Similar results were obtained when hepatocytes were
incubated with uremic serum. In conclusion, CRF is associated with a decrease in liver
transporters involved in drug absorption and an increase in those involved in drug
extrusion. Uremic mediators appear to be responsible for these modifications.
Copyright © 2008 by The American Society for Pharmacology and Experimental Therapeutics
79
2. INTRODUCTION
Several studies have shown that the metabolic clearance of various substrates is
reduced in patients with chronic renal failure (CRF) 11, 43, 335
. The decrease in drug
biotransformation is mainly secondary to alterations in drug metabolism by the liver 335
.
Indeed, in rats with experimental renal failure, studies have shown that CRF induces a
marked decrease in liver cytochrome P450 (P450) activity secondary to reduced protein and
gene expression of selective P450 isoforms, namely, Cyp2c11, Cyp3a1, and Cyp3a2 75
.
This down-regulation is produced by uremic factors, namely, parathyroid hormone (PTH)
84.
Another major route for drug elimination is drug extrusion by transporters. These
membranous proteins are located in several epithelia, such as the kidney, the liver, and the
intestine. They are implicated not only in renal, biliary, or intestinal drug extrusion but also
in their uptake, especially in enterocytes and hepatocytes. Recently, we have shown that
CRF could impede several drug transporters in the intestine55
. Indeed, P-glycoprotein
(P-gp) (also known as mdr1a, abcb1 gene family) and multidrug resistance related protein
(Mrp) type 2 (also known as cMOAT, abcc2 gene family) are decreased significantly in the
intestine of CRF rats compared with control animals. Organic anion transporting
polypeptide (Oatp) type 3 (gene Slc21a7) was not modified by uremia. These findings
could explain, in part, why patients with CRF have an increase in bioavailability of some
drugs 55
.
Several drug transporters are present in the hepatocytes. Uptake transporters are
mainly located on the basolateral membrane of the hepatocytes and mediate drug uptake
from the blood circulation to the hepatocytes. Excretion transporters are mainly located on
Copyright © 2008 by The American Society for Pharmacology and Experimental Therapeutics
80
the apical membrane of the hepatocytes and mediate excretion of the drugs from the
hepatocytes to the biliary canaliculi. Most common uptake transporters include Oatp,
organic cation transporters, organic anion transporters, and sodium dependent hepatocyte
bile-salt uptake system, whereas most common excretion transporters include
hepatocellular bile-salt export pump, breast cancer resistance protein, Mrp, and P-gp 92-94
.
Very few studies have evaluated the repercussions of CRF on liver drug
transporters, and conflicting results have been published. Laouari et al. have reported that
in CRF rats Mrp2 was increased whereas P-gp was unchanged compared with control
animals 95
. However, the severity of renal failure was quite low. This could have
confounded the results because it is well established that there is a strong correlation
between the severity of CRF and the modulation of metabolizing enzymes (both in the liver
and intestine), as well as in drug transporters (in the intestine) 14, 55
. Furthermore, they did
not study the uptake transporters. On the other hand, Sun et al. have shown that some
uremic toxins present in the serum of CRF patients decrease the uptake of erythromycin in
hepatocytes, suggesting an inhibition of Oatp2 91
.
The objectives of this study were to determine the effects of CRF on hepatic drug
transporters. For this purpose, we measured in control and CRF rats 1) liver protein and
gene expression of P-gp (mdr1a, abcb1), Mrp2 (cMOAT, abcc2), and Oatp2 (gene
Slc21a5), and 2) in vivo activity of P-gp. Furthermore, we also evaluated the effect of
uremic serum on the drug transporters in cultured hepatocytes.
Copyright © 2008 by The American Society for Pharmacology and Experimental Therapeutics
81
3. MATERIALS AND METHODS
Experimental Model
Male Sprague-Dawley rats (Charles River Canada, Montreal, QC, Canada),
weighing 200 to 300 g were housed in the Research Center animal care facility and
maintained on Harlan Teklad rodent diet (Harlan Teklad Global Diets, Montreal, QC,
Canada) and water ad libitum. An acclimatization period of at least 3 days was allowed to
the animals before any experimental work was undertaken. All the experiments were
conducted according to the Canadian Council on Animal Care guidelines for care and use
of laboratory animals and under the supervision of our local animal care committee.
Experimental Protocol
Studies were performed in two groups of 35 animals each: control pair-fed and
CRF. Hepatic drug transporters’ protein expression and mRNA levels were measured in 28
rats/group. P-gp activity was measured in vivo using clearance of rhodamine 123, a P-gp
substrate, in 7 rats/group.
CRF was induced by two-stage five-sixth nephrectomy as previously described 75
.
Control pair-fed rats were fed the same amount as CRF rats ate on the previous day and
water ad libitum to control for the effect of CRF induced malnutrition. At day 41 after the
nephrectomy, the rats were housed in metabolic cages, and urine was collected for 24 h to
determine the clearance of creatinine. Rats were sacrificed by decapitation 42 days after
nephrectomy. Blood was collected for the measurement of serum creatinine and urea.
Preparation of Liver Homogenates
Rat liver was immediately excised following sacrifice, rinsed in ice-cold saline, and
flash-frozen in liquid nitrogen. Samples were stored at -80°C until homogenate preparation.
Copyright © 2008 by The American Society for Pharmacology and Experimental Therapeutics
82
Briefly, 200 mg of liver was homogenized in 1 ml of 0.9% NaCl, 0.1 mM
phenylmethylsulfonyl fluoride using a Potter-Elvehjem tissue grinder (Wheaton Science
Products, Millville, NJ). Samples were then sonicated on ice for 10 s and filtered across a
5-µm membrane (PALL, St. Laurent, QC, Canada), and aliquots were stored at -80°C up to
analysis.
Hepatocyte Isolation and Culture
The hepatocytes were isolated from male Sprague-Dawley rats weighing 200 to 250
g and cultured as previously described 80, 81
. Hepatocytes were incubated for 48 h in culture
medium containing 10% rat control or CRF serum. Hepatocytes were harvested by scraping
in phosphate-buffered saline (PBS) with 0.1 mM phenylmethylsulfonyl fluoride for protein
analysis and in RLT buffer (Qiagen, Mississauga, ON, Canada) for mRNA analysis.
Samples were stored at -80°C up to analysis.
In Vivo Excretion of Rhodamine
To evaluate the in vivo activity of P-gp in the liver of CRF and control rats, biliary
transport of rhodamine 123 was evaluated on anesthetized rats using an adaptation of the
protocol published by Yumoto et al. 332
. Briefly, the right femoral vein was catheterized
with polyethylene tubing, and a 1-ml bolus of saline (0.9% NaCl) was administered,
followed by perfusion at 2 ml/h for a 30-min stabilization period. Meanwhile, the left
femoral artery, the bile duct, and the urinary bladder were cannulated for blood, bile, and
urine collection. After the stabilization period, a bolus of 4.36 ml/kg rhodamine 123
(Sigma, Oakville, ON, Canada) was injected at a concentration of 100 µM in PBS,
followed by perfusion at 2 ml/h for a 50-min stabilization period, at the end of which
collection began. Total bile and urine were collected every 10 min for 40 min, and 200 µl
of blood was collected halfway through each collection period under constant rhodamine
123 perfusion. A 2.7-ml/kg bolus of cyclosporine A (4.16 mM), a P-gp inhibitor, was then
Copyright © 2008 by The American Society for Pharmacology and Experimental Therapeutics
83
administered, followed by perfusion (2 ml/h) of rhodamine 123 (100 µM) and cyclosporine
A (80 µM) in PBS for a 20-min stabilization period. Finally, bile, urine, and blood were
collected for 50 min under constant perfusion. At the end of the protocol, animals were
sacrificed, and the liver was excised, flash-frozen in liquid nitrogen, and kept at -80°C until
analysis.
Western Blot Analysis
Three major hepatic transporters were assessed by Western blot analysis following a
previously described protocol 50, 55
: P-gp, Mrp2, and Oatp2. Each blot was repeated three
times, and results were pooled to obtain reported values. Protein expression in control
animals was arbitrarily defined as 100%.
P-gp and Mrp2 were detected using monoclonal antibodies from ID Labs (London,
ON, Canada): C219 and M2 III-6, respectively. Oatp2 was detected using a rabbit anti-rat
Oatp2 antibody from US Biological (Swampscott, MA). Glyceraldehyde-3-phosphate
dehydrogenase (GAPDH), used as a loading control, was detected using rabbit
anti-GAPDH from Abcam (Cambridge, MA). In preliminary experiments, we have shown
that GAPDH expression is not modulated by CRF compared with controls (data not
shown).
mRNA Analysis
At the time of sacrifice, liver was rinsed in ice-cold saline and flash-frozen in liquid
nitrogen. Samples were kept at -80°C until RNA extraction. Total RNA was extracted from
frozen tissue by the RNeasy mini-kit (Qiagen). RNA concentrations were determined by
measuring absorbance at a wavelength of 260 nm. One microgram of total RNA was used
to prepare cDNA by reverse transcription using Omniscript RT kit from Qiagen and
random primer from Invitrogen (Burlington, ON, Canada). The mRNA encoding for P-gp
Copyright © 2008 by The American Society for Pharmacology and Experimental Therapeutics
84
(mdr1a), Mrp2, Oatp2, and GAPDH was measured by quantitative real-time polymerase
chain reaction (PCR) using Platinum SybrGreen PCR Supermix UDG from Invitrogen and
appropriate primers on an Icycler thermocycler (BioRad, Mississauga, ON, Canada) with
30-s incubation at 94°C, 30-s incubation at 60°C, and 30-s incubation at 72°C. Table VIII
shows the sequences of primers used for the quantification of mRNA for each transporter.
PCR products were analyzed using the ΔΔCT method 331
using GAPDH as standard gene.
Rhodamine 123 Extraction and High-Performance Liquid Chromatography Analysis
Rhodamine was isolated by solid-phase extraction using Sep-Pack Vac 1cc C18
Cartridges (Waters, Milford, MA). Briefly, columns were primed with 100% methanol,
washed with water, and acidified samples (20 µl of phosphoric acid/ml sample) were
loaded. Columns were then washed with 5% methanol, and the samples were eluted in
100% methanol. Samples were evaporated under nitrogen stream and resuspended to their
initial volume in mobile phase (acetic acid 1% and acetonitrile, 60:40, %v/v) for high
performance liquid chromatography (HPLC) analysis. HPLC was conducted as described
by Yumoto et al. 332
on a Beckman System Gold HPLC (Beckman Coulter, Mississauga,
ON, Canada) with a Jasco FP-920 fluorescence detector (Jasco, Tokyo, Japan) at 485-nm
excitation and 546-nm emission wavelengths on a Gemini 5-µm C18 110Å column
(Phenomenex, Torrance, CA). Sample concentration was obtained by interpolation on a
standard curve made with pure rhodamine 123 treated by the same procedure.
Rhodamine Excretion Analysis
Biliary clearance was determined using the equation Clb = (Cb x Vb)/(Cp,ss x time)
where Cb is the rhodamine concentration in the bile, Vb is the bile volume, and Cp,ss is the
rhodamine concentration in the plasma at steady state. Urinary clearance was determined
using the equation Clu = (Cu x Vu)/(Cp,ss x time) where Cu is the rhodamine concentration in
the urine and Vu is the urine volume.
Copyright © 2008 by The American Society for Pharmacology and Experimental Therapeutics
85
Other Assays
Blood and urine chemistries were determined with an Hitachi 717 autoanalyzer
(Roche Diagnostics, Basel, Switzerland).
Statistical Analysis
The results are expressed as mean ± S.E.M. Differences between groups were
assessed by using an unpaired Student’s t test or an analysis of variance test. Significant
analysis of variance was followed by a Scheffe post hoc comparison of groups. The
threshold of significance was p < 0.05.
Copyright © 2008 by The American Society for Pharmacology and Experimental Therapeutics
86
4. RESULTS
Biochemical Parameters and Body Weight in Control and CRF Rats
Table IX presents the biochemicals and body weight of the two groups of animals
studied. Compared with control pair-fed animals, CRF rats had higher levels of plasma
creatinine and lower values of creatinine clearance (reduced by 75%; p < 0.001).
Protein Expression of Hepatic Transporters in Control and CRF Rats
As shown on Fig. 11, P-gp was induced by 25% (p < 0.001) in CRF rats compared
with controls, whereas another excretion transporter, Mrp2, remained stable. On the other
hand, the import transporter Oatp2 was significantly reduced by 40%. GAPDH, used as a
loading control, was not affected by CRF (data not shown). We found a significant
correlation between P-gp and Oatp2 protein expression and creatinine clearance (r = 0.303,
p < 0.001 and r = 0.524, p < 0.001, respectively; data not shown).
mRNA Encoding Hepatic Transporters in Control and CRF Rats
Figure 12 presents the results of the analysis of mRNA coding for liver transporters.
There was a significant increase in mRNA for the excretion transporters P-gp and Mrp2 (50
and 40%, respectively; p < 0.05), but mRNA expression for the import transporter Oatp2
remained unchanged.
In Vivo Excretion of Rhodamine 123 in Control and CRF Rats
To determine the repercussion of P-gp increase on the excretion of drugs, we
evaluated the in vivo disposition of rhodamine 123 in control and CRF rats. As shown in
Fig. 13, the biliary clearance of rhodamine was significantly increased in CRF rats
compared with controls before the addition of the P-gp inhibitor cyclosporine A. However,
Copyright © 2008 by The American Society for Pharmacology and Experimental Therapeutics
87
inhibition of P-gp with cyclosporine caused a significant decrease in the clearance of
rhodamine 123 in both groups, bringing them to the same level. The urinary clearance of
rhodamine, on the other hand, was significantly decreased in CRF rats (almost 100%).
Protein and mRNA Expression of Transporters in Hepatocytes Incubated with Uremic
Serum for 48h
To determine whether a circulating factor present in the serum of rats with CRF was
responsible for the modulation of hepatic transporters, we incubated normal rat hepatocytes
with serum from control or CRF rats for 48 h (Fig. 14). Western blot analysis of the
hepatocytes showed a significant increase (34%, p < 0.01) in P-gp protein expression and a
significant decrease (25%, p < 0.05) in Oatp2 protein expression in the hepatocytes
incubated with serum from CRF rats. On the other hand, Mrp2 remained unchanged as
observed in vivo. No significant changes were observed in mRNA levels for any of the
transporters as opposed to what has been observed in vivo (data not shown).
Copyright © 2008 by The American Society for Pharmacology and Experimental Therapeutics
88
5. DISCUSSION
The effects of CRF on the nonrenal elimination of drugs have been studied for many
years. It has been well established that CRF causes a decrease in drug metabolism because
of a decrease in liver and intestinal P450 expression and activity 14, 23
. A decrease in
nonrenal drug elimination could also be attributed to a decrease in phase II elimination or in
the excretion by hepatic transporters. In this study, we evaluated the effects of CRF on the
hepatic expression of two excretion transporters (P-gp and Mrp2) and of one uptake
transporter (Oatp2), as well as its effects on P-gp activity.
Our results show that CRF causes a significant 25% increase in P-gp protein
expression probably because of the 50% increase in P-gp mRNA levels. On the other hand,
although we found a significant 40% increase in Mrp2 mRNA expression, its protein
expression was not affected by CRF. Finally, CRF causes a decrease in Oatp2 protein
expression, which is not associated with a decrease in mRNA levels. Similar results were
obtained when we incubated normal rat hepatocytes with serum from rats with CRF for 48
h. We also evaluated hepatic P-gp activity by measuring the biliary clearance of rhodamine
in anesthetized rats. We found a 60% significant increase in the excretion of rhodamine that
can be inhibited by cyclosporine A, a P-gp inhibitor, suggesting that the up-regulation of
P-gp protein expression is associated with an increase in activity.
Very few studies have evaluated the effect of CRF on liver drug transporter. A study
previously published by Laouari et al. showed a significant increase in liver Mrp2 protein
and mRNA expression 6 weeks after nephrectomy was performed on rats 95
. Our results
confirmed the increase in Mrp2 mRNA levels but not on the protein expression, which
could be explained by the specificity of antibodies used. On the other hand, Laouari et al. 95
also found no changes in P-gp protein and mRNA in the liver of nephrectomised rats,
whereas we found a significant increase. The explanation for these conflicting results is not
clear. It could be attributed to the degree of severity of the CRF. In their study,
Copyright © 2008 by The American Society for Pharmacology and Experimental Therapeutics
89
nephrectomized rats presented a 60% decrease in creatinine clearance, whereas our rats
have a 75% decrease in creatinine clearance. Indeed, we found a significant correlation
between the severity of the renal failure as measured by the creatinine clearance and the
up-regulation in P-gp, suggesting that, as CRF worsens, P-gp increases.
Our results also show that CRF affects the hepatic transporters in different ways.
We have shown a decrease in the expression of the uptake transporter Oatp2 and an
increase in the expression and activity of the excretion transporter P-gp. Those transporters
work together to eliminate substrates into the bile. Because uptake by Oatp transporters is
the first step in the elimination of many xenobiotics, making the compounds available to
the detoxification enzymes and the extrusion transporters, and can be a rate-limiting step 23,
62 the inhibition of Oatp2 we found in rats suffering from CRF can probably explain the
decrease in drug elimination by the liver, as suggested also by Sun et al. 23, 91
. The increase
in P-gp expression and activity could be an adaptive response to the large quantities of
organic anions circulating in CRF.
Our results also differ from those we previously published concerning intestinal
transporters in CRF rats 55
. We had found significant decreases in intestinal P-gp and Mrp2
protein expression associated with a decrease in their transport activity across the intestinal
membrane. We attributed the protein expression decrease to a post-translational mechanism
because we found no changes in their mRNA expression. Also, we had found no significant
change in Oatp2 and Oatp3 protein and mRNA levels in the intestine of rats with CRF 55
.
Thus, it appears that CRF affects the expression of drug transporters differently in
the main elimination organs, i.e., liver and intestine. However, in both organs, we have
shown that the changes in protein and/or mRNA levels for the transporters were caused by
a circulating factor present in the serum of rats with CRF. Indeed, we have shown that
incubating uremic serum with enterocytes or Caco-2 cells leads to a decrease in P-gp
Copyright © 2008 by The American Society for Pharmacology and Experimental Therapeutics
90
expression and function 55
. Similarly, in the present study, we showed that uremic serum
also modifies the expression of drug transporters in the hepatocytes (Fig. 14). The different
potential factors include proinflammatory cytokines, PTH, and uremic toxins, all of which
are highly increased in CRF. Interestingly, the proinflammatory cytokine tumor necrosis
factor-α is known to increase P-gp protein and mRNA expression and P-gp activity in
cultured rat hepatocytes in a time- and dose-dependent manner 336
. It is also known to
decrease rhodamine 123 transport in Caco-2 cells, a colon carcinoma cell line 337
, making it
a prime candidate to be responsible of the observed effects of CRF on drug transporters.
Sun et al. have also shown that the uremic toxin 3-carboxy-4-methyl-5-propyl-2-furan-
propanoic acid can directly inhibit erythromycin uptake via a decrease in Oatp2 protein
expression and activity 91
.
Despite pair-feeding of the rats, we still observed a slight difference (<10%) in body
weight between the CRF and control pair-fed rats. Very few studies have evaluated the
effects of malnutrition on hepatic transporters. Lee et al. showed that severe protein and
caloric malnutrition caused a decrease in protein expression and activity of liver P-gp 338
.
Furthermore, two studies showed that fasting can cause an increase in Oatp2 expression in
rat 339
and mouse 340
liver. However, because the magnitude of malnutrition of the rats
involved in this study is low and because the effects observed in extreme conditions (such
as severe malnutrition or fasting) are contrary to the effects of CRF observed in the present
study, we do not believe that the weight difference between our two groups could have
influenced our results.
In conclusion, this study shows that CRF is associated with important modifications
in the expression and activity of the different liver drug transporters. It appears that uremic
toxins or proinflammatory cytokines accumulated in CRF could be responsible for these
modifications, which seem to be affecting canalicular and basolateral transporters in a
different manner.
Copyright © 2008 by The American Society for Pharmacology and Experimental Therapeutics
91
6. REFERENCES
Altschul SF, Madden TL, Schaffer AA, Zhang J, Zhang Z, Miller W and Lipman DJ (1997)
Gapped BLAST and PSI-BLAST: a new generation of protein database search
programs. Nucleic Acids Res 25:3389-3402.
Belliard AM, Lacour B, Farinotti R and Leroy C (2004) Effect of tumor necrosis factor-
alpha and interferon-gamma on intestinal P-glycoprotein expression, activity, and
localization in Caco-2 cells. J Pharm Sci 93:1524-1536.
Chen C, Cheng X, Dieter MZ, Tanaka Y and Klaassen CD (2007) Activation of cAMP-
dependent signaling pathway induces mouse organic anion transporting polypeptide
2 expression. Mol Pharmacol 71:1159-1164.
Dietrich CG, Martin IV, Porn AC, Voigt S, Gartung C, Trautwein C and Geier A (2007)
Fasting induces basolateral uptake transporters of the SLC family in the liver via
HNF4alpha and PGC1alpha. Am J Physiol Gastrointest Liver Physiol 293:G585-
590.
Gao B, St Pierre MV, Stieger B and Meier PJ (2004) Differential expression of bile salt and
organic anion transporters in developing rat liver. J Hepatol 41:201-208.
Guevin C, Michaud J, Naud J, Leblond FA and Pichette V (2002) Down-regulation of
hepatic cytochrome P450 in chronic renal failure: role of uremic mediators. Br J
Pharmacol 137:1039-1046.
Hirsch-Ernst KI, Ziemann C, Foth H, Kozian D, Schmitz-Salue C and Kahl GF (1998)
Induction of mdr1b mRNA and P-glycoprotein expression by tumor necrosis factor
alpha in primary rat hepatocyte cultures. J Cell Physiol 176:506-515.
Kullak-Ublick GA, Stieger B and Meier PJ (2004) Enterohepatic bile salt transporters in
normal physiology and liver disease. Gastroenterology 126:322-342.
Laouari D, Yang R, Veau C, Blanke I and Friedlander G (2001) Two apical multidrug
transporters, P-gp and MRP2, are differently altered in chronic renal failure. Am J
Physiol Renal Physiol 280:F636-645.
Copyright © 2008 by The American Society for Pharmacology and Experimental Therapeutics
92
Leblond F, Guevin C, Demers C, Pellerin I, Gascon-Barre M and Pichette V (2001)
Downregulation of hepatic cytochrome P450 in chronic renal failure. J Am Soc
Nephrol 12:326-332.
Leblond FA, Petrucci M, Dube P, Bernier G, Bonnardeaux A and Pichette V (2002)
Downregulation of intestinal cytochrome p450 in chronic renal failure. J Am Soc
Nephrol 13:1579-1585.
Lee YM, Song IS, Kim SG, Lee MG, Chung SJ and Shim CK (2003) The suppressed
expression and functional activity of hepatic P-glycoprotein in rats with protein-
calorie malnutrition. J Pharm Sci 92:1323-1330.
Livak KJ and Schmittgen TD (2001) Analysis of relative gene expression data using real-
time quantitative PCR and the 2(-Delta Delta C(T)) Method. Methods 25:402-408.
Matzke GR and Frye RF (1997) Drug administration in patients with renal insufficiency.
Minimising renal and extrarenal toxicity. Drug Saf 16:205-231.
Meier PJ and Stieger B (2002) Bile salt transporters. Annu Rev Physiol 64:635-661.
Michaud J, Dubé P, Naud J, Leblond FA, Desbiens K, Bonnardeaux A and Pichette V
(2005) Effects of serum from patients with chronic renal failure on rat hepatic
cytochrome P450. Br J Pharmacol 144:1067-1077.
Michaud J, Naud J, Chouinard J, Desy F, Leblond FA, Desbiens K, Bonnardeaux A and
Pichette V (2006) Role of parathyroid hormone in the downregulation of liver
cytochrome P450 in chronic renal failure. J Am Soc Nephrol 17:3041-3048.
Naud J, Michaud J, Boisvert C, Desbiens K, Leblond FA, Mitchell A, Jones C,
Bonnardeaux A and Pichette V (2007) Down-regulation of intestinal drug
transporters in chronic renal failure in rats. J Pharmacol Exp Ther 320:978-985.
Pichette V and Leblond FA (2003) Drug metabolism in chronic renal failure. Curr Drug
Metab 4:91-103.
Sun H, Frassetto L and Benet LZ (2006) Effects of renal failure on drug transport and
metabolism. Pharmacol Ther 109:1-11.
Copyright © 2008 by The American Society for Pharmacology and Experimental Therapeutics
93
Sun H, Huang Y, Frassetto L and Benet LZ (2004) Effects of uremic toxins on hepatic
uptake and metabolism of erythromycin. Drug Metab Dispos 32:1239-1246.
Takikawa H (2002) Hepatobiliary transport of bile acids and organic anions. J
Hepatobiliary Pancreat Surg 9:443-447.
Talbert RL (1994) Drug dosing in renal insufficiency. J Clin Pharmacol 34:99-110.
Touchette MA and Slaughter RL (1991) The effect of renal failure on hepatic drug
clearance. DICP 25:1214-1224.
Yamazaki M, Akiyama S, Nishigaki R and Sugiyama Y (1996) Uptake is the rate-limiting
step in the overall hepatic elimination of pravastatin at steady-state in rats. Pharm
Res 13:1559-1564.
Yumoto R, Murakami T, Nakamoto Y, Hasegawa R, Nagai J and Takano M (1999)
Transport of rhodamine 123, a P-glycoprotein substrate, across rat intestine and
Caco-2 cell monolayers in the presence of cytochrome P-450 3A-related
compounds. J Pharmacol Exp Ther 289:149-155.
Copyright © 2008 by The American Society for Pharmacology and Experimental Therapeutics
94
7. FOOTNOTES
This work was financed by the Canadian Institute for Health Research (CIHR)
Reprints should be sent to: Vincent Pichette MD Ph.D.
Centre de recherche de l’hôpital Maisonneuve-Rosemont
5415 boul. de l’Assomption, Montréal, Québec, Canada
H1T 2M4
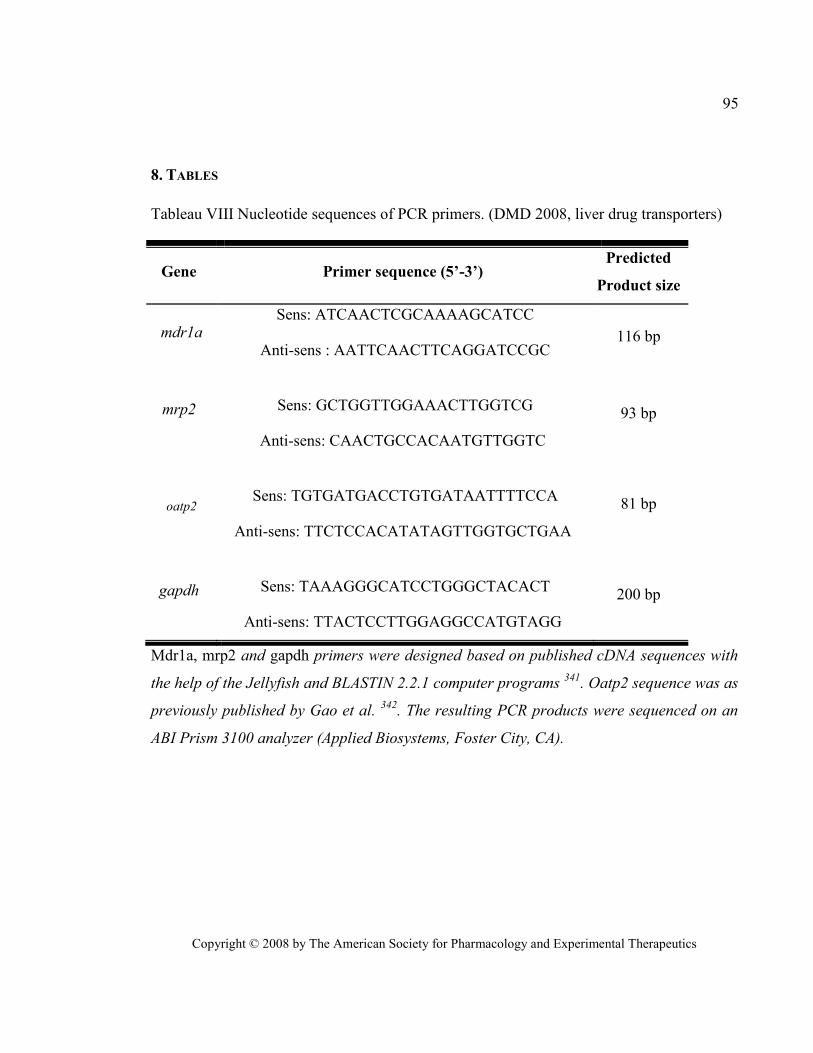
Copyright © 2008 by The American Society for Pharmacology and Experimental Therapeutics
95
8. TABLES
Tableau VIII Nucleotide sequences of PCR primers. (DMD 2008, liver drug transporters)
Gene Primer sequence (5’-3’) Predicted
Product size
mdr1a Sens: ATCAACTCGCAAAAGCATCC
Anti-sens : AATTCAACTTCAGGATCCGC 116 bp
mrp2
Sens: GCTGGTTGGAAACTTGGTCG
Anti-sens: CAACTGCCACAATGTTGGTC
93 bp
oatp2
Sens: TGTGATGACCTGTGATAATTTTCCA
Anti-sens: TTCTCCACATATAGTTGGTGCTGAA
81 bp
gapdh
Sens: TAAAGGGCATCCTGGGCTACACT
Anti-sens: TTACTCCTTGGAGGCCATGTAGG
200 bp
Mdr1a, mrp2 and gapdh primers were designed based on published cDNA sequences with
the help of the Jellyfish and BLASTIN 2.2.1 computer programs 341
. Oatp2 sequence was as
previously published by Gao et al. 342
. The resulting PCR products were sequenced on an
ABI Prism 3100 analyzer (Applied Biosystems, Foster City, CA).
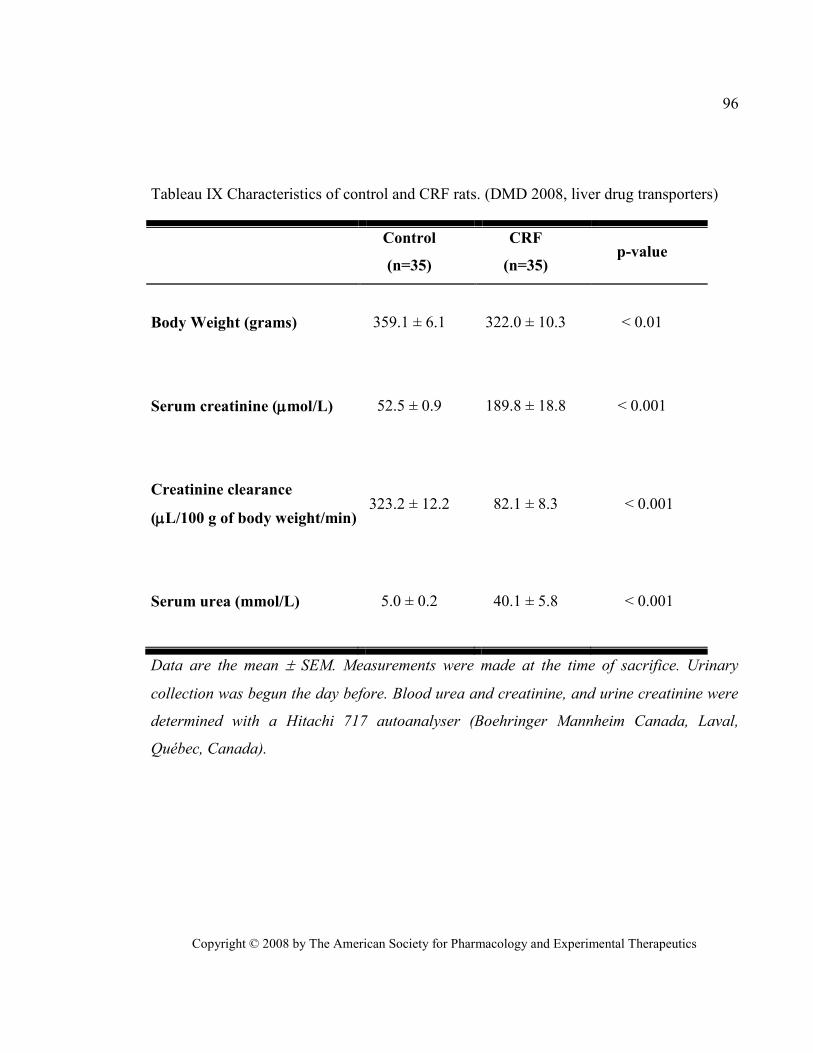
Copyright © 2008 by The American Society for Pharmacology and Experimental Therapeutics
96
Tableau IX Characteristics of control and CRF rats. (DMD 2008, liver drug transporters)
Control
(n=35)
CRF
(n=35) p-value
Body Weight (grams)
359.1 ± 6.1 322.0 ± 10.3 < 0.01
Serum creatinine (mol/L)
52.5 ± 0.9 189.8 ± 18.8
< 0.001
Creatinine clearance
(L/100 g of body weight/min)
323.2 ± 12.2 82.1 ± 8.3
< 0.001
Serum urea (mmol/L)
5.0 ± 0.2 40.1 ± 5.8
< 0.001
Data are the mean SEM. Measurements were made at the time of sacrifice. Urinary
collection was begun the day before. Blood urea and creatinine, and urine creatinine were
determined with a Hitachi 717 autoanalyser (Boehringer Mannheim Canada, Laval,
Québec, Canada).
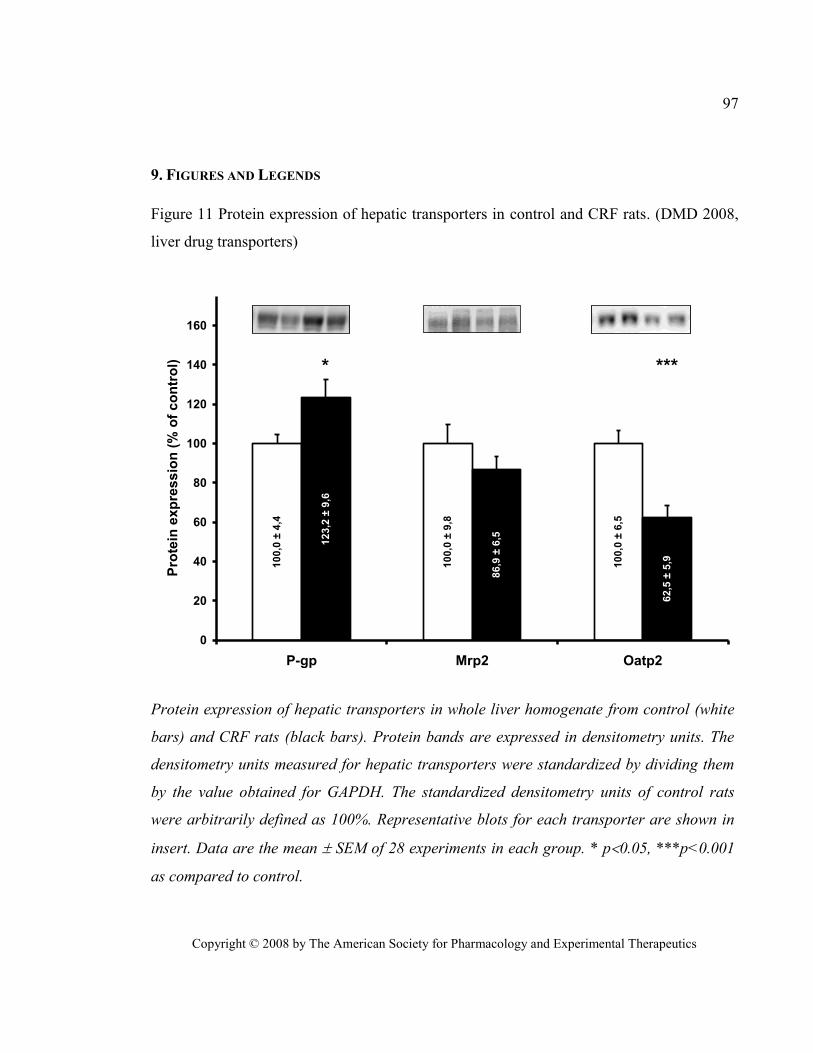
Copyright © 2008 by The American Society for Pharmacology and Experimental Therapeutics
97
9. FIGURES AND LEGENDS
Figure 11 Protein expression of hepatic transporters in control and CRF rats. (DMD 2008,
liver drug transporters)
10
0,0
± 6
,5
10
0,0
± 9
,8
10
0,0
± 4
,4
62
,5 ±
5,9
86
,9 ±
6,5
12
3,2
± 9
,6
0
20
40
60
80
100
120
140
160
P-gp Mrp2 Oatp2
Pro
tein
exp
ressio
n (
% o
f co
ntr
ol) * ***
Protein expression of hepatic transporters in whole liver homogenate from control (white
bars) and CRF rats (black bars). Protein bands are expressed in densitometry units. The
densitometry units measured for hepatic transporters were standardized by dividing them
by the value obtained for GAPDH. The standardized densitometry units of control rats
were arbitrarily defined as 100%. Representative blots for each transporter are shown in
insert. Data are the mean SEM of 28 experiments in each group. * p0.05, ***p<0.001
as compared to control.
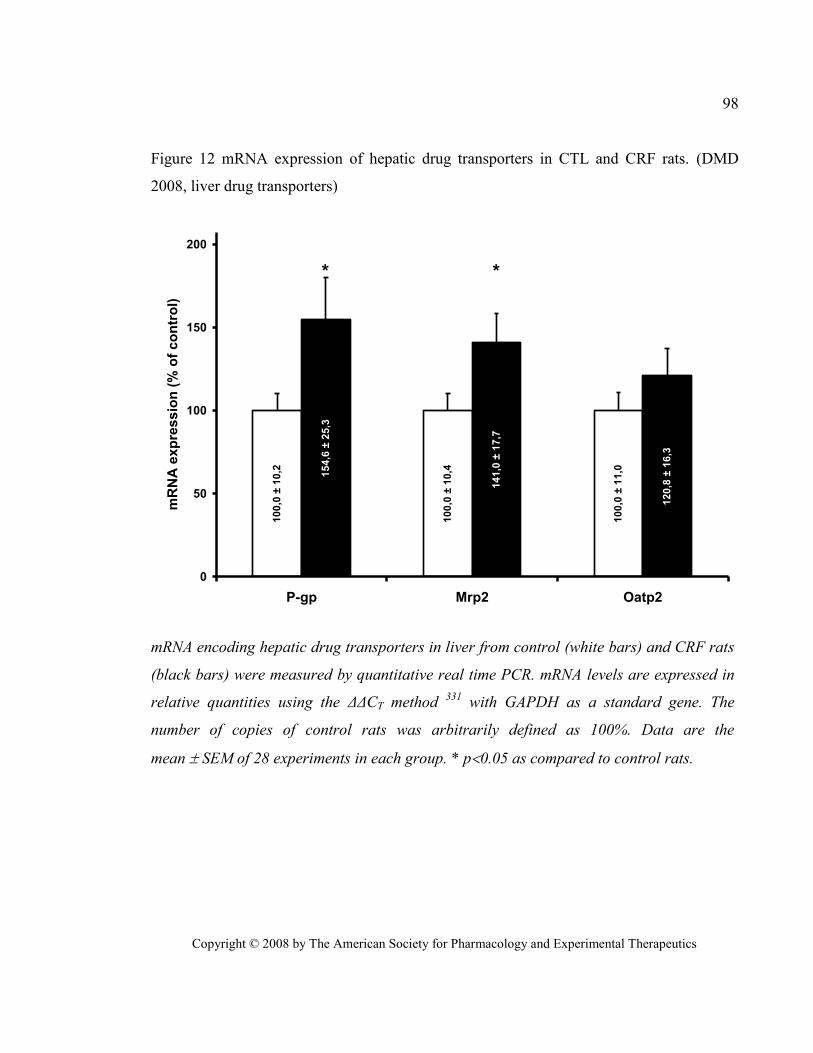
Copyright © 2008 by The American Society for Pharmacology and Experimental Therapeutics
98
Figure 12 mRNA expression of hepatic drug transporters in CTL and CRF rats. (DMD
2008, liver drug transporters)
10
0,0
± 1
1,0
10
0,0
± 1
0,4
10
0,0
± 1
0,2
12
0,8
± 1
6,3
14
1,0
± 1
7,7
15
4,6
± 2
5,3
0
50
100
150
200
P-gp Mrp2 Oatp2
mR
NA
exp
ress
ion
(%
of
co
ntr
ol)
* *
mRNA encoding hepatic drug transporters in liver from control (white bars) and CRF rats
(black bars) were measured by quantitative real time PCR. mRNA levels are expressed in
relative quantities using the ΔΔCT method 331
with GAPDH as a standard gene. The
number of copies of control rats was arbitrarily defined as 100%. Data are the
mean SEM of 28 experiments in each group. * p0.05 as compared to control rats.
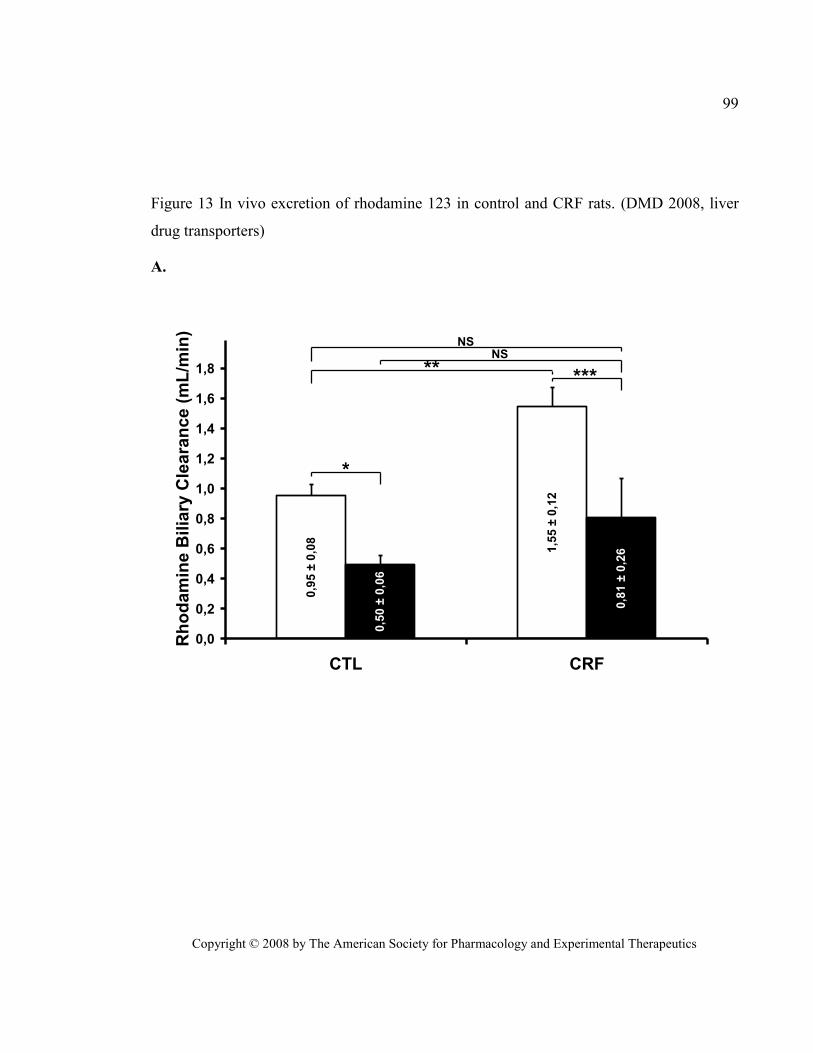
Copyright © 2008 by The American Society for Pharmacology and Experimental Therapeutics
99
Figure 13 In vivo excretion of rhodamine 123 in control and CRF rats. (DMD 2008, liver
drug transporters)
A.
1,5
5 ±
0,1
2
0,9
5 ±
0,0
8
0,8
1 ±
0,2
6
0,5
0 ±
0,0
6
0,0
0,2
0,4
0,6
0,8
1,0
1,2
1,4
1,6
1,8
CTL CRF
Rh
od
am
ine B
ilia
ry C
leara
nce
(m
L/m
in)
*
**NS
NS
***
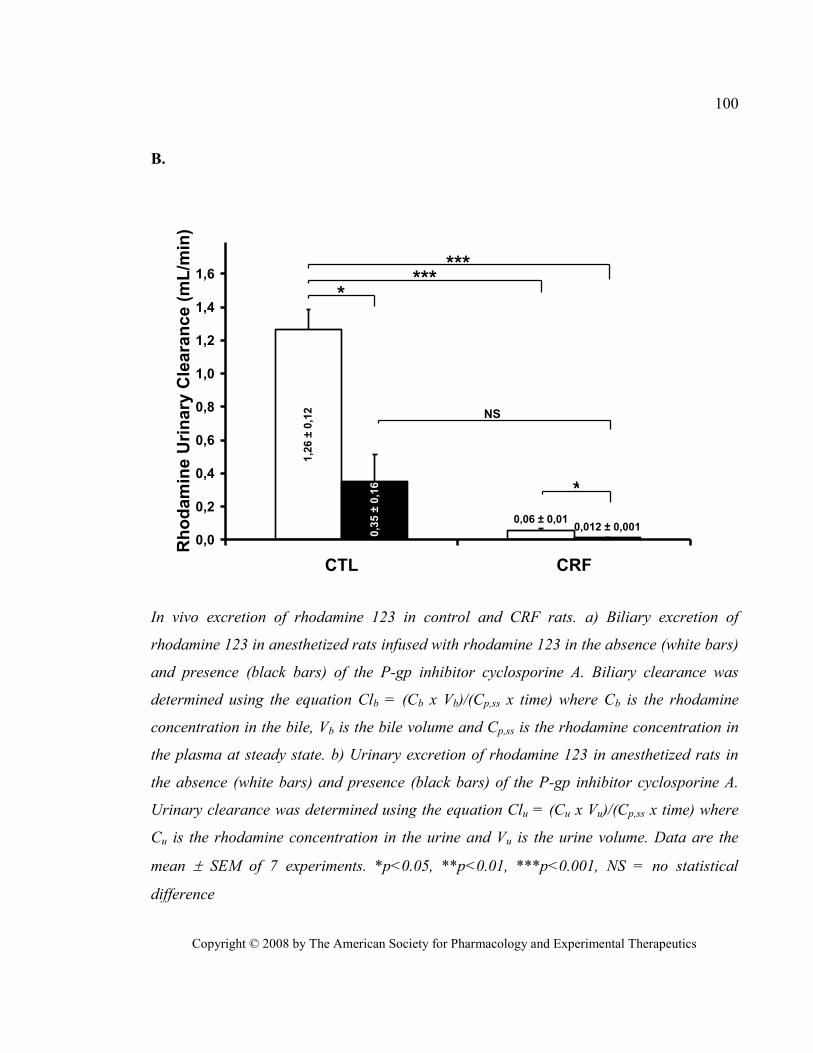
Copyright © 2008 by The American Society for Pharmacology and Experimental Therapeutics
100
B.
0,06 ± 0,01
1,2
6 ±
0,1
2
0,012 ± 0,001
0,3
5 ±
0,1
6
0,0
0,2
0,4
0,6
0,8
1,0
1,2
1,4
1,6
CTL CRF
Rh
od
am
ine U
rin
ary
Cle
ara
nce
(m
L/m
in)
***
NS
***
*
*
In vivo excretion of rhodamine 123 in control and CRF rats. a) Biliary excretion of
rhodamine 123 in anesthetized rats infused with rhodamine 123 in the absence (white bars)
and presence (black bars) of the P-gp inhibitor cyclosporine A. Biliary clearance was
determined using the equation Clb = (Cb x Vb)/(Cp,ss x time) where Cb is the rhodamine
concentration in the bile, Vb is the bile volume and Cp,ss is the rhodamine concentration in
the plasma at steady state. b) Urinary excretion of rhodamine 123 in anesthetized rats in
the absence (white bars) and presence (black bars) of the P-gp inhibitor cyclosporine A.
Urinary clearance was determined using the equation Clu = (Cu x Vu)/(Cp,ss x time) where
Cu is the rhodamine concentration in the urine and Vu is the urine volume. Data are the
mean SEM of 7 experiments. *p<0.05, **p<0.01, ***p<0.001, NS = no statistical
difference
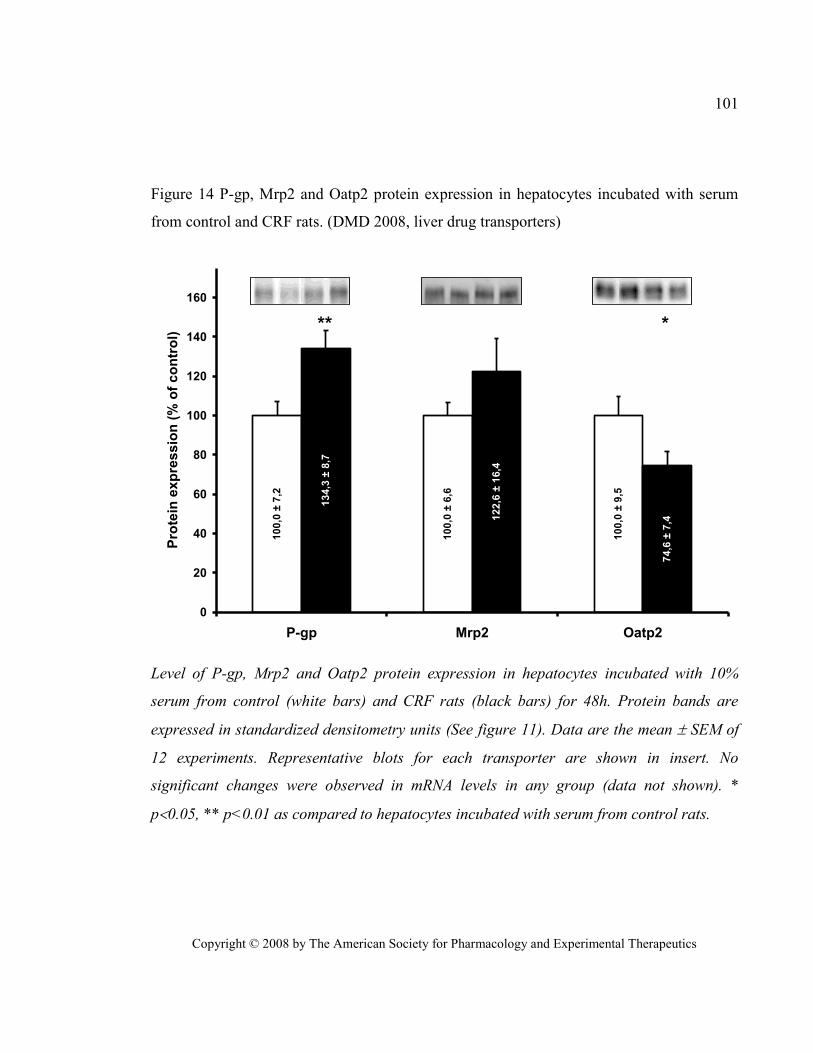
Copyright © 2008 by The American Society for Pharmacology and Experimental Therapeutics
101
Figure 14 P-gp, Mrp2 and Oatp2 protein expression in hepatocytes incubated with serum
from control and CRF rats. (DMD 2008, liver drug transporters)
10
0,0
± 9
,5
10
0,0
± 6
,6
10
0,0
± 7
,2
74
,6 ±
7,41
22
,6 ±
16
,4
13
4,3
± 8
,7
0
20
40
60
80
100
120
140
160
P-gp Mrp2 Oatp2
Pro
tein
exp
ressio
n (
% o
f co
ntr
ol)
** *
Level of P-gp, Mrp2 and Oatp2 protein expression in hepatocytes incubated with 10%
serum from control (white bars) and CRF rats (black bars) for 48h. Protein bands are
expressed in standardized densitometry units (See figure 11). Data are the mean SEM of
12 experiments. Representative blots for each transporter are shown in insert. No
significant changes were observed in mRNA levels in any group (data not shown). *
p0.05, ** p<0.01 as compared to hepatocytes incubated with serum from control rats.
Effects of chronic renal failure on kidney drug transporters and
cytochrome P450 in rats.
Drug Metab Dispos. 2011 Aug;39(8):1363-9
Reprinted with permission from the American Society for Pharmacology and Experimental
Therapeutics. All rights reserved.
Copyright © 2011 by The American Society for Pharmacology and Experimental
Therapeutics
Copyright © 2011 by The American Society for Pharmacology and Experimental Therapeutics
103
Effects of chronic renal failure on kidney drug
transporters and cytochrome P450 in rats
Judith Naud MSc, Josée Michaud MSc, Stéphanie Beauchemin MSc, Marie-Josée
Hébert MD, Michel Roger MD PhD, Stéphane Lefrancois PhD, Francois A. Leblond
PhD and Vincent Pichette MD PhD
Service de néphrologie et Centre de recherche de l’Hôpital Maisonneuve-Rosemont,
Faculté de Médecine, Université de Montréal, Québec, Canada (J.N., J.M., S.B., S.L.,
F.A.L., V.P.)
Département de pharmacologie, Faculté de Médecine, Université de Montréal, Québec,
Canada (J.N., J.M., V.P.)
Centre de recherche de l’Hôpital Notre-Dame du Centre Hospitalier de l’Université de
Montréal, Montréal, Québec, Canada (M-J.H, M.R.)
Département de Microbiologie et Immunologie, Faculté de Médecine, Université de
Montréal, Montréal, Québec, Canada (M.R.)
Copyright © 2011 by The American Society for Pharmacology and Experimental Therapeutics
104
Kidney drug transporters in renal failure
Correspondence should be addressed to: Vincent Pichette MD Ph.D.
Centre de recherche de l’hôpital Maisonneuve-
Rosemont
Number of text pages: 18
Number of tables: 2
Number of figures: 6
Number of references: 42
Number of words in Abstract: 230 words
Number of words in Introduction: 589 words
Number of word in Discussion: 1199 words
List of non-standard abbreviations: CMPF: 3-carboxy-4-methyl-5-propyl-2-furan-
propanoic acid, CRF: chronic renal failure, CTL: control, CYP: cytochrome P450, IS:
indoxyl sulfate, Mrp: multidrug resistance related protein, Npt1: Sodium-dependent
phosphate transport protein 1, Oat: organic anion transporter, Oatp: organic anion
transporting polypeptide, PAH: para-amino-hippuric acid, Papp: Apparent permeability,
PBS: Phosphate Buffered Saline, PCR: polymerase chain reaction, P-gp: P-glycoprotein,
PMSF: Phenylmethylsulfonylfluoride, Urat1: urate transporter 1.
Copyright © 2011 by The American Society for Pharmacology and Experimental Therapeutics
105
1. ABSTRACT
Chronic renal failure (CRF) leads to decreased drug renal clearance due to a
reduction in the glomerular filtration rate. However, little is known about how renal failure
affects renal metabolism and elimination of drugs. Because both depend on the activity of
uptake and efflux by renal transporters as well as enzymes in tubular cells, the purpose of
this study was to investigate the effects of CRF on the expression and activity of select
renal drug transporters and cytochrome P450. Two groups of rats were studied: control and
CRF (induced by 5/6 nephrectomy). Compared with control rats, we observed reductions in
the expression of both protein and mRNA of Cyp1a, sodium-dependent phosphate transport
protein 1, organic anion transporter (Oat)1, 2, and 3, OatK1/K2, organic anion-transporting
polypeptide (Oatp)1 and 4c1, P-glycoprotein, and urate transporter 1, whereas an induction
in the protein and mRNA expression of Mrp2, 3, and 4 and Oatp2 and 3 was observed.
Cyp3a expression remained unchanged. Similar results were obtained by incubating a
human proximal tubule cell line (human kidney-2) with sera from CRF rats, suggesting the
presence of uremic modulators. Finally, the renal elimination of [3H]digoxin and
[14
C]benzylpenicillin was decreased in CRF rats, compared with controls, as shown by a
4- and 9-fold accumulation, respectively, of these drugs in kidneys of rats in CRF. Our
results demonstrate that CRF affects the expression and activity of several kidney drug
transporters leading to the intrarenal accumulation of drugs and reduced renal clearance that
could, at least partially, explain the tubular toxicity of many drugs.
Copyright © 2011 by The American Society for Pharmacology and Experimental Therapeutics
106
2. INTRODUCTION
The kidneys play a major role in the elimination of endogenous and exogenous
compounds from the bloodstream by the following three processes: glomerular filtration,
tubular secretion, and tubular reabsorption. It has been known for decades that chronic
renal failure (CRF) reduces the renal clearance of filtrated drugs and endogenous
substances through a decrease in the glomerular filtration rate. However, little is known
about how renal failure affects renal secretion and reabsorption in the proximal tubule. Both
these processes are dependent on the activity of uptake and efflux renal transporters
expressed in tubular cells (Inui et al., 2000; Russel et al., 2002; Sekine et al., 2006; El-
Sheikh et al., 2008; Feng et al., 2010; Giacomini et al., 2010; Masereeuw and Russel, 2010;
Nagai and Takano, 2010).
Tubular transporters are members of two families: ATP-binding cassette
transporters and solute carriers. The former include multidrug-resistance related proteins
(Mrp) and P-glycoprotein (P-gp), which depend on ATP phosphorylation. They are efflux
transporters expressed either on the apical brush-border membrane where they excrete
drugs in the urine or on the basolateral membrane where they participate in the reabsorption
of compounds from the urine. On the other hand, solute carrier transporters include the
sodium-dependent phosphate transport protein 1 (Npt1), organic anion transporters (Oat),
organic anion transporting polypeptides (Oatp), and urate transporters (URAT) and are
mostly, but not exclusively, uptake transporters located on either the apical or basolateral
membrane where they participate in the uptake of compounds from the bloodstream or
from the urine into the tubular cell. The most important drug transporters are illustrated in
Fig. 15 (Hsiang et al., 1999; Russel et al., 2002; Masereeuw and Russel, 2010).
Recently, we have demonstrated that CRF can affect the expression of intestinal
P-gp and Mrp2 and hepatic P-gp and Oatp2 in rats, thus increasing the bioavailability and
decreasing the biliary elimination of various drugs (Naud et al., 2007; Naud et al., 2008).
Copyright © 2011 by The American Society for Pharmacology and Experimental Therapeutics
107
We have also demonstrated that CRF can decrease extrarenal elimination of drugs by
decreasing intestinal and hepatic drug metabolism by cytochrome P450 (P450) and phase II
drug metabolism (Leblond et al., 2000; Leblond et al., 2001; Leblond et al., 2002; Simard
et al., 2008). Finally, we have shown a nearly 100% decrease in the urinary clearance of
rhodamine 123, a P-gp substrate, in nephrectomized rats (Naud et al., 2007; Naud et al.,
2008). Thus, it is possible that CRF could affect drug transport and metabolism in the
diseased kidney.
To date, very few studies have been published concerning the effects of CRF on
renal drug transport. Ji et al. demonstrated a decrease in the protein expression of the
organic cation transporter 2 2 weeks after rats were submitted to 5/6 nephrectomy, whereas
Oat1 and Oat3 expression remained unchanged (Ji et al., 2002). In addition, Laouari et al.
showed an increase in both the protein and mRNA expression of Mrp2 6 weeks
post-5/6 nephrectomy, whereas P-gp expression remained stable (Laouari et al., 2001).
The objective of this study was to investigate the effects of CRF on the expression
and activity of the major renal drug transporters and cytochrome P450. For this purpose, we
have compared renal protein and mRNA expression in CRF and control rats of 1) Cyp1a,
Cyp3a, Npt1, Oat1, 2, and 3, Oatp1, 2, 3, and 4c1, Mrp2, 3, and 4, P-gp, and URAT1 and
2) the in vivo renal accumulation of [3H]digoxin and [
14C]benzylpenicillin. Furthermore, we
have studied the effects of uremic serum on the expression of drug transporters and
cytochromes P450 in a proximal tubule cell line as well as on the activity of P-gp in the
same cell line.
Copyright © 2011 by The American Society for Pharmacology and Experimental Therapeutics
108
3. MATERIALS AND METHODS
Experimental Model
Male Sprague-Dawley rats (Charles River, Portage, MI), weighing 176 to 225 g,
were housed in the Research Center animal care facility and maintained on Harlan Teklad
rodent diet (Harlan Teklad Global Diets, Montreal, QC, Canada) and water ad libitum.
Animals were allowed an acclimatization period of at least 7 days before the first
nephrectomy was performed. All the experiments were conducted according to the
Canadian Council on Animal Care guidelines for the care and use of laboratory animals and
under the supervision of our local animal care committee.
Experimental Protocol
Studies were performed in two groups of animals: control pair-fed and CRF. The
expression levels of protein and mRNA of kidney drug transporters were measured in 12
rats per group. Drug transporter activity was measured in vivo through the renal
accumulation of [3H]digoxin and [
14C]benzylpenicillin in at least six rats per group per
experiment.
Chronic renal failure was induced by two-stage 5/6 nephrectomy as described
previously (Leblond et al., 2001). Every animal had free access to water, but to limit the
effects of CRF-induced malnutrition, control pair-fed rats were fed the same amount of
chow that CRF rats ate on the previous day. We have previously demonstrated that the
calorie reduction in control animals induced by pair feeding did not influence the
expression of drug-metabolizing enzymes (Leblond et al., 2001) and drug transporters (our
unpublished data). At day 41 after nephrectomy, the rats were housed in metabolic cages,
and urine was collected for a 24-h period to determine the clearance of creatinine. Rats
were sacrificed by decapitation 42 days after nephrectomy for organ and blood collection,
Copyright © 2011 by The American Society for Pharmacology and Experimental Therapeutics
109
or underwent a radiolabeled drug accumulation study. After the animals were sacrificed, the
remnant kidney of CRF rats and the left kidney of CTL rats were immediately excised,
rinsed in ice-cold saline, and flash frozen in liquid nitrogen. Samples were stored at -80°C
until membrane preparation or mRNA extraction was performed. Blood was collected for
the measurement of serum creatinine and urea and for bioassays with proximal tubule cells.
Preparation of Crude Kidney Membranes
Rat kidney biopsies (200 mg) were homogenized in 1 ml of homogenizing buffer
(250 mM sucrose, 10 mM HEPES, and 10 mM Tris-HCl, pH 7.4) containing 0.1 mM
phenylmethylsulfonyl fluoride (PMSF) using a Potter-Elvehjem tissue grinder (Wheaton
Science Products, Millville, NJ). Differential centrifugation was used to obtain a crude
membrane fraction (Chow et al., 2010). In brief, the kidney homogenates were centrifuged
at 9000g for 10 min at 4°C. The supernatant was then spun at 33,000g for 60 min at 4°C,
and the resulting pellet was resuspended in phosphate-buffered saline containing 0.1 mM
PMSF. Samples were then sonicated on ice for 10 s to ensure homogeneity. Protein
concentration was determined using the method of Lowry et al .(Lowry et al., 1951), using
bovine serum albumin as a reference protein. Aliquots were stored at -80°C until use in
Western blot analysis.
Western Blot Analysis
Major renal drug transporters were assessed by Western blot analysis following a
previously described protocol (Leblond et al., 2002; Naud et al., 2007; Naud et al., 2008).
Protein expression in control animals was arbitrarily defined as 100%.
P-gp and Mrp2 were detected using monoclonal antibodies from ID Labs (London,
ON, Canada), C219 and M2 III-6, respectively. Npt1, Oat2, Oat3, OatK1/K2, Oatp2, and
Oatp3 were detected using antibodies from Alpha Diagnostic International (San Antonio,
Copyright © 2011 by The American Society for Pharmacology and Experimental Therapeutics
110
TX). Anti-Mrp3 was from Sigma-Aldrich (St. Louis, MO), anti-Mrp4 was from Novus
Biological (Littleton, CO), anti-Oat1 and anti-Urat1 were from Abbiotec (San Diego, CA),
anti-Oatp1 was from Millipore Corporation (Billerica, MA), and anti-Oatp4c1 was from
Santa Cruz Biotechnology (Santa Cruz, CA). Cyp1a and Cyp3a were detected using
primary antibodies from US Biological (Swampscott, MA) and Daiichi Pure Chemicals
(Tokyo, Japan), respectively. Villin-1, a protein specific to tubular brush-border cells
(Cartier et al., 1993), used as a loading control, was detected using rabbit anti-Villin-1 from
Cell Signaling Technology (Beverly, MA). The antibodies used recognized rat and human
proteins.
mRNA Analysis
Total RNA was extracted from frozen tissue using TRIzol reagent (Invitrogen,
Burlington, ON, Canada) according to the manufacturer’s protocol. RNA concentration was
determined by measuring absorbance at a wavelength of 260 nm. One microgram of total
RNA was used to prepare cDNA by reverse transcription using the SuperScript VILO
cDNA Synthesis kit from Invitrogen. The mRNA encoding for P-gp (mdr1a), Mrp2, Oatp2,
and villin-1 was measured by quantitative real-time PCR as described previously (Naud et
al., 2007; Naud et al., 2008). Other genes were measured using appropriate TaqMan gene
expression assays from Applied Biosystems (Carlsbad, CA). Table X shows the TaqMan
gene expression assays used for the quantification of mRNA for each transporter. PCR
products were analyzed using the ΔΔCT method (Livak and Schmittgen, 2001) using
villin-1 as a standard gene.
In Vivo Intrarenal Accumulation of Radiolabeled Drugs
The intrarenal accumulation of radiolabeled drugs was used to determine the
activity of the kidney drug transporters. Two different drugs were tested.
[14
C]Benzylpenicillin is an antibiotic and a known substrate for Oat3 and Mrps (Windass et
Copyright © 2011 by The American Society for Pharmacology and Experimental Therapeutics
111
al., 2007; Choi et al., 2009). [3H]Digoxin is a cardiac glycoside and a known substrate for
Oatp4c1 and P-gp (Mikkaichi et al., 2004; Yamaguchi et al., 2010). Digoxin (0.5 mg/kg)
was administered via intraperitoneal injection, and benzylpenicillin (5 mg/kg CTL, 1 mg/kg
CRF) was administered via intramuscular injection. Both were injected with an
approximate 1:1500 hot/cold ratio so the milligram amount of radioactive compound
wouldn’t factor into the final dosage calculation. To evaluate renal accumulation, similar
plasma concentrations of drugs need to be attained, and therefore CRF rats received a lower
dose of benzylpenicillin because of its reduced clearance and short-term accumulation in
CRF. For digoxin, there is no short-term accumulation in patients with CRF, thus patients
with CRF receive the same loading dose as patients with normal renal function with an
adjustment in their maintenance dose (Jelliffe, 1968; Jelliffe, 1969; Gault et al., 1980).
Because this study with rats requires a single loading dose, no digoxin dose adjustment was
necessary to obtain plasma concentrations similar to those observed in CTL rats. Rats were
anesthetized using isoflurane 2 h after injection, and a cardiac puncture was performed to
recover the maximal amount of blood in heparinized tubes to obtain plasma. Remnant left
kidneys were harvested, rinsed in ice-cold phosphate buffered saline, weighed, minced, and
placed in 2 ml of Solvable solution (PerkinElmer Life and Analytical Sciences, Waltham,
MA) at 56°C overnight. Dissolved kidney volumes were noted, and radioactivity was
counted on a Wallac 1409 beta counter (PerkinElmer Life and Analytical Sciences) in 1 ml
of dissolved kidney after addition of 4 ml of ScintiSafe Plus Scintillant (Fisher, Ottawa,
ON, Canada). Plasma radioactivity was counted in 2 ml of plasma with 4 ml of Scintillant.
The results were calculated as a ratio between the radioactivity count (counts per minute)
for 1 g of kidney and the radioactivity count for 1 ml of plasma. The mean for the CTL
groups was arbitrarily defined as 100%.
Effects of Uremic Serum on Kidney Drug Transporters
To determine whether uremic serum could affect the expression and function of
kidney drug transporters, two sets of experiments were conducted using
Copyright © 2011 by The American Society for Pharmacology and Experimental Therapeutics
112
human kidney-2 (HK-2) cells, a proximal tubule cell line. The first studied the effects of
uremic serum on drug transporters’ protein expression, whereas the second studied the
effects of uremic serum on P-gp activity.
Incubation of HK-2 Cells with Uremic Serum
HK-2 cells were purchased from American Type Culture Collection (Manassas,
VA) and seeded into 25-mm2 uncoated polystyrene flasks (Sarstedt, St. Leonard, QC,
Canada) in Dulbecco’s modified Eagle’s medium (Invitrogen) containing 10% fetal bovine
serum (PAA Laboratories, Inc., Etobicoke, ON, Canada). The cells were subcultured 4 days
later into two 75-mm2 uncoated polystyrene flasks and expended by 1:3 subcultures every 3
to 4 days. For an experiment, culture medium was replaced by Dulbecco’s modified
Eagle’s medium containing 10% CTL or CRF rat serum (one serum per flask). After 48 h
of culture, the cells were trypsinized, pelleted, and homogenized in phosphate-buffered
saline containing 0.1 mM PMSF. Protein concentrations were determined using the Micro
BCA Protein Assay kit from Thermo Fisher Scientific (Waltham, MA). One hundred
micrograms was loaded for Western blot analysis of each studied transporter, and
glyceraldehyde-3-phosphate dehydrogenase (GAPDH) was used as a loading control. It
was detected using rabbit anti-GAPDH from Abcam Inc. (Cambridge, MA).
Rhodamine 123 Transport on HK-2 Cells
The effects of uremic serum on P-gp function was evaluated in HK-2 cells using the
trans-epithelial transport of rhodamine 123 across HK-2 monolayers. Cells were
subcultured into 12-well, 0.4-µm pore size polyethylene terephthalate (PET)-Transwell
chambers (Becton Dickinson, Mississauga, ON, Canada) and allowed up to 7 days to reach
confluence and form a polarized monolayer. Forty-eight hours before the transport
experiment, culture medium was replaced by culture medium containing 10% CTL or CRF
Copyright © 2011 by The American Society for Pharmacology and Experimental Therapeutics
113
rat serum. The transport experiment was conducted as reported previously with Caco-2
cells (Naud et al., 2007).
Other Assays
Blood and urine chemistries were determined with an Architect C1600 clinical
analyzer (Abbott Laboratories, Saint-Laurent, QC, Canada).
Statistical Analysis
Results are expressed as mean ± S.D. Differences between groups were assessed
using an unpaired Student’s t test or an analysis of variance test. Significant analysis of
variance was followed by a Scheffe post hoc comparison of groups. The threshold of
significance was p < 0.05.
Copyright © 2011 by The American Society for Pharmacology and Experimental Therapeutics
114
4. RESULTS
Biochemical Parameters and Body Weight in Control and CRF Rats
Table XI presents the biochemical parameters and body weights of both groups of
rats. Compared with control animals, CRF rats had higher levels of serum creatinine and
urea and lower creatinine clearance (reduced by 80%, p < 0.001). There was no difference
in body weight between control and CRF rats.
Protein Expression of Kidney Drug Transporters and Cytochrome P450 in CRF Rats
Figure 16 presents the measured protein expression of select drug transporters and
cytochrome P450 from a crude kidney membrane preparation from control and CRF rats.
The level of expression of Mrp2, 3, and 4 and of Oatp2 and 3 were significantly increased
by more than 2-fold in CRF rat kidneys compared with control rat kidneys as shown by
Western blot. On the other hand, the expression of Cyp1a, Npt1, Oats, Oatp1, Oatp4c1,
P-gp, and Urat1 was significantly reduced from 50 to 85% in CRF rats compared with
controls. The only measured protein that remained stable was Cyp3a. We found significant
correlations (p < 0.05) between protein expression and creatinine clearance for
Cyp1a (r=0.787), Mrp2 (r=0.662), Mrp3 (r=-0.719), Mrp4 (r=-0.626), Npt1 (r=0.687),
Oat1 (r=0.716), Oat2 (r=0.720), Oat3 (r=0.723), OatK1/K2 (r=0.861), Oatp1 (r=0.717),
Oatp2 (r=-0.586), Oatp3 (r=-0.684), Oatp4c1 (r=0.757), P-gp (r=0.811), and
Urat1 (r=0.603).
mRNA Expression of Kidney Drug Transporters and Cytochrome P450 in CRF Rats
Figure 17 presents the results of the analysis of mRNA coding for kidney
transporters and cytochrome P450. There was a significant increase in the mRNA
expression of Mrp2, 3, and 4 (40, 92, and 72%, respectively) and of Oatp2 and 3 (125 and
180%, respectively) in CRF rats compared with controls. On the other hand, there were
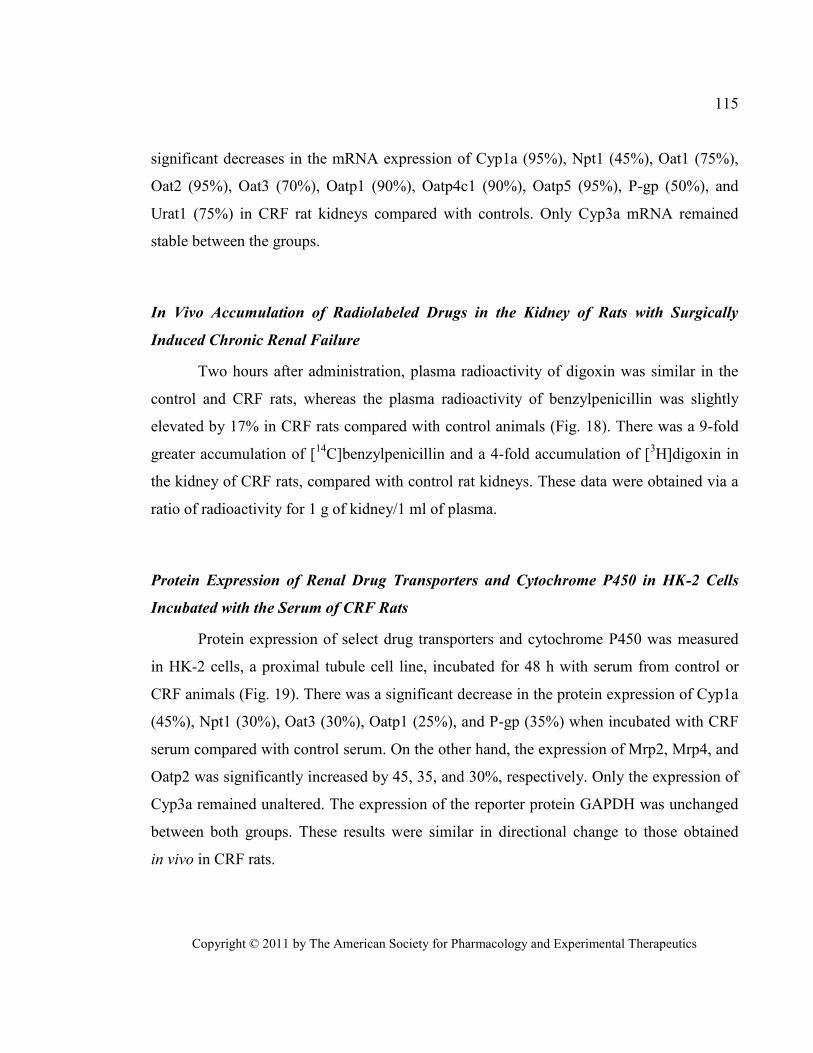
Copyright © 2011 by The American Society for Pharmacology and Experimental Therapeutics
115
significant decreases in the mRNA expression of Cyp1a (95%), Npt1 (45%), Oat1 (75%),
Oat2 (95%), Oat3 (70%), Oatp1 (90%), Oatp4c1 (90%), Oatp5 (95%), P-gp (50%), and
Urat1 (75%) in CRF rat kidneys compared with controls. Only Cyp3a mRNA remained
stable between the groups.
In Vivo Accumulation of Radiolabeled Drugs in the Kidney of Rats with Surgically
Induced Chronic Renal Failure
Two hours after administration, plasma radioactivity of digoxin was similar in the
control and CRF rats, whereas the plasma radioactivity of benzylpenicillin was slightly
elevated by 17% in CRF rats compared with control animals (Fig. 18). There was a 9-fold
greater accumulation of [14
C]benzylpenicillin and a 4-fold accumulation of [3H]digoxin in
the kidney of CRF rats, compared with control rat kidneys. These data were obtained via a
ratio of radioactivity for 1 g of kidney/1 ml of plasma.
Protein Expression of Renal Drug Transporters and Cytochrome P450 in HK-2 Cells
Incubated with the Serum of CRF Rats
Protein expression of select drug transporters and cytochrome P450 was measured
in HK-2 cells, a proximal tubule cell line, incubated for 48 h with serum from control or
CRF animals (Fig. 19). There was a significant decrease in the protein expression of Cyp1a
(45%), Npt1 (30%), Oat3 (30%), Oatp1 (25%), and P-gp (35%) when incubated with CRF
serum compared with control serum. On the other hand, the expression of Mrp2, Mrp4, and
Oatp2 was significantly increased by 45, 35, and 30%, respectively. Only the expression of
Cyp3a remained unaltered. The expression of the reporter protein GAPDH was unchanged
between both groups. These results were similar in directional change to those obtained
in vivo in CRF rats.
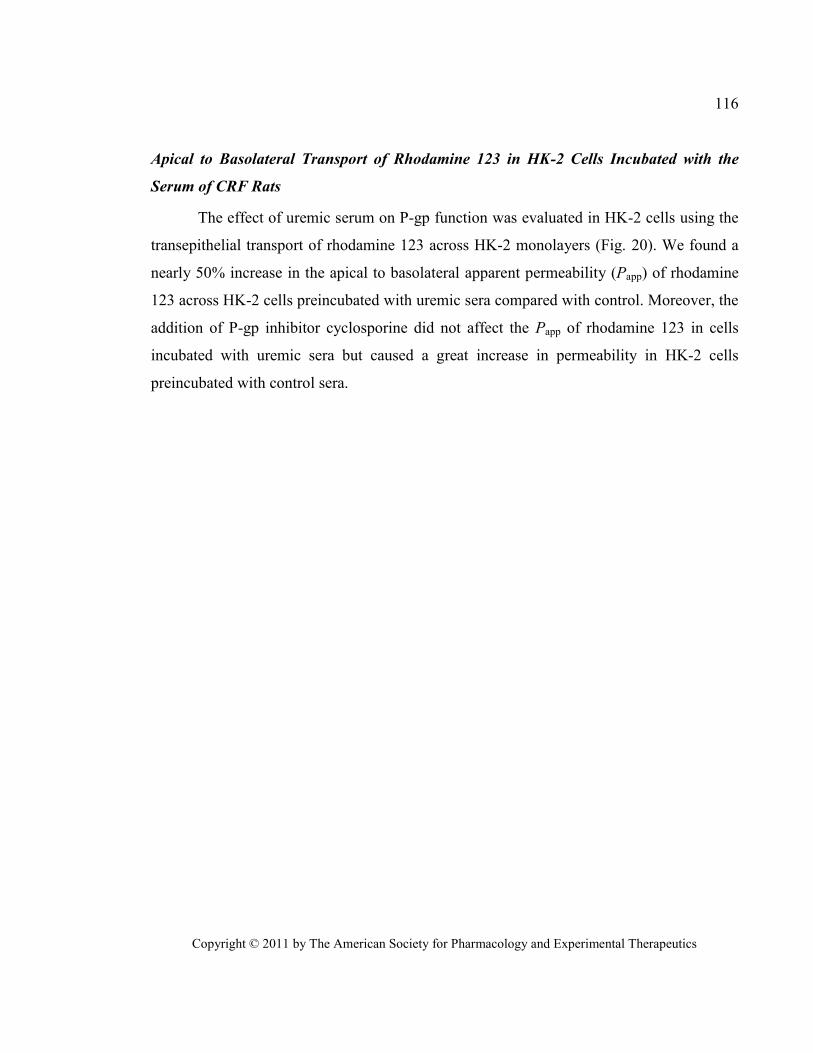
Copyright © 2011 by The American Society for Pharmacology and Experimental Therapeutics
116
Apical to Basolateral Transport of Rhodamine 123 in HK-2 Cells Incubated with the
Serum of CRF Rats
The effect of uremic serum on P-gp function was evaluated in HK-2 cells using the
transepithelial transport of rhodamine 123 across HK-2 monolayers (Fig. 20). We found a
nearly 50% increase in the apical to basolateral apparent permeability (Papp) of rhodamine
123 across HK-2 cells preincubated with uremic sera compared with control. Moreover, the
addition of P-gp inhibitor cyclosporine did not affect the Papp of rhodamine 123 in cells
incubated with uremic sera but caused a great increase in permeability in HK-2 cells
preincubated with control sera.
Copyright © 2011 by The American Society for Pharmacology and Experimental Therapeutics
117
5. DISCUSSION
The purpose of this study was to evaluate the effect of chronic renal failure on the
expression and activity of select drug transporters and cytochrome P450 in the rat kidney.
We have demonstrated that CRF affects drug transporters in different manners. The protein
and mRNA expression of many transporters were significantly reduced (Npt1, Oat1, Oat2,
Oat3, OatK1/K2, Oatp1, Oatp4c1, P-gp, and Urat1), whereas those of Mrp2, Mrp3, Mrp4,
Oatp2, and Oatp3 were significantly up-regulated. In addition, the protein and mRNA
expression of Cyp1a were significantly reduced, whereas those of Cyp3a remained
unchanged.
These results differ from those previously published by Ji et al., who had shown no
changes in the expression of Oat1 and Oat3 2 weeks after nephrectomy (Ji et al., 2002). We
hypothesize that 2 weeks was too short to fully develop the long-term effects of renal
failure. Our results also confirm and differ from those obtained by Laouari et al. (Laouari et
al., 2001), who had demonstrated an increase in the protein and mRNA expression of Mrp2
3 and 6 weeks after nephrectomy, but no change in the expressions of P-gp at 3 weeks, and
an increase in P-gp mRNA after 6 weeks. We confirmed the results obtained for Mrp2
expression, but we have demonstrated a 50% decrease in P-gp protein and mRNA
expressions 6 weeks after nephrectomy. The reasons for this discrepancy remain unclear.
We found significant correlations between the clearance of creatinine and the
protein expression of transporters and Cyp1a, indicating that changes in transporter
expression are directly related to the severity of renal failure. We also found significant
correlations between the protein and mRNA expression of transporters and Cyp1a (data not
shown), suggesting that changes in protein expression are the result of a decrease in mRNA
levels. In addition, we have demonstrated that the modifications in drug transporter
expression and activity occurred in response to one or many factors present in the sera from
uremic rats, as demonstrated by the changes in protein expression of transporters and P450
Copyright © 2011 by The American Society for Pharmacology and Experimental Therapeutics
118
enzymes in HK-2 cells, which are similar to those observed in vivo, although they are of
smaller magnitude, probably due to the shorter length of exposure to uremic toxins.
Several uremic toxins accumulate in renal failure. They are breakdown products of
metabolic pathways that are no longer being eliminated by the kidneys. Those that were
most studied in relation to drug transport are indoxyl sulfate, para-aminohippuric acid, and
3-carboxy-4-methyl-5-propyl-2-furan-propanoic acid. They are known substrates and
inhibitors of organic anion transporters including Oat1, Oat3, and Mrps (Leier et al., 2000;
Deguchi et al., 2002; Tsutsumi et al., 2002; Deguchi et al., 2004; Deguchi et al., 2005; Sun
et al., 2006; Enomoto and Niwa, 2007) and even play a role in the progression of renal
failure as demonstrated by the induction of renal damage by indoxyl sulfate (Niwa and Ise,
1994; Niwa et al., 1994; Niwa et al., 1997; Sun et al., 2006). The down-regulation of uptake
transporters Oat1, Oat2, and Oat3 and of bidirectional transporters OatK1/K2, Oatp1,
Oatp4c1, and Urat1 combined with the up-regulation of efflux transporters Mrp2, Mrp3,
and Mrp4 and of bidirectional transporters Oatp2 and Oatp3, all of which are anion
transporters, could thus be an adaptive and protective response against uremic toxin
accumulation and renal toxicity. Still, these changes do not seem to be sufficient to prevent
the accumulation of organic anions as demonstrated by the 9-fold accumulation of
[14
C]benzylpenicillin, a substrate of OATs and Mrps, in the kidneys of animals suffering
from CRF compared with controls and thus could probably be insufficient to prevent the
progression of renal failure by uremic toxin toxicity. Competitive inhibition of the
transporters by uremic toxins could explain this phenomenon.
Although most efflux transporter expression was increased in the current study,
P-gp expression and its in vitro activity were significantly reduced by chronic renal failure
and uremic sera. P-gp differs from most other studied transporters as it transports mostly
cationic or neutral substrates (Masereeuw et al., 2000). Thus, we have evaluated the in vivo
accumulation of the P-gp substrate [3H]digoxin. Digoxin is also a substrate of the uptake
Copyright © 2011 by The American Society for Pharmacology and Experimental Therapeutics
119
transporter Oatp4c1 (Mikkaichi et al., 2004). Although plasma concentrations of digoxin
were similar between the control and CRF animals, there was a significant 4-fold increase
in the intrarenal accumulation of digoxin in CRF kidneys. This indicates a reduced
secretion of digoxin most likely due to the reduced expression of its efflux transporter P-gp.
This result could be reproduced in vitro by the incubation of a HK-2 monolayer with sera
from uremic rats where we demonstrated a significant increase in the Papp of rhodamine 123
from the apical to the basolateral side of the monolayer. This argues in favor of a decrease
in the transport activity of P-gp, facilitating the migration of rhodamine 123 toward the
basolateral side. The addition of the P-gp inhibitor cyclosporine to both sides of the
monolayer caused an increase in the Papp of rhodamine in the CTL group, demonstrating
that rhodamine 123 transport is P-gp-dependent, but induces no significant change in the
CRF group, indicating a very weak P-gp activity even before the addition of cyclosporine.
This could explain the nearly 100% reduction in rhodamine 123 urinary clearance that we
reported previously (Naud et al., 2008) and strongly suggests that a factor present in uremic
serum has a modulatory effect on P-gp protein expression and activity, similar to what we
previously showed in the intestine and liver (Naud et al., 2007; Naud et al., 2008).
We also measured the protein and mRNA expression of Cyp1a and Cyp3a in the
kidneys of control and CRF rats. They are drug metabolizing enzymes with wide substrate
variability. CYP3A is implicated in the biotransformation of nearly 60% of drugs
metabolized by P450 enzymes in humans, such as acetaminophen, cyclosporine,
erythromycin, etc. (Guengerich, 2003), whereas Cyp1a is mostly implicated in the
biotransformation of environmental pollutants such as polycyclic aromatic hydrocarbons
and tobacco smoke or substances such as caffeine and tamoxifen (Guengerich, 2003). In the
kidney, Cyp1a and Cyp3a are expressed in the tubular cells, where they can activate or
deactivate their substrates before urinary secretion. We have demonstrated a significant
decrease in the expression of Cyp1a in CRF that could cause intrarenal toxicity of
Cyp1a-active substrates, if they were to accumulate in the kidney because of reduced drug
Copyright © 2011 by The American Society for Pharmacology and Experimental Therapeutics
120
transporters. On the other hand, Cyp3a expression seems unaffected by CRF that would
allow normal activation or deactivation of substrates within the renal tubular cells. Toxicity
could occur if activated metabolites were to remain trapped inside the tubular cells because
of reduced drug transport.
In conclusion, this study demonstrates that CRF significantly alters the expression
and activity of select renal drug transporters that could contribute to reduced renal
clearance as well as renal drug accumulation and nephrotoxicity. The modifications in drug
transporters induced by uremic serum were similar to that produced by CRF in our animal
model, suggesting that uremic toxins such as indoxyl sulfate, para-aminohippuric acid, and
3-carboxy-4-methyl-5-propyl-2-furanpropanoic acid, which are known to modulate drug
transporters (Leier et al., 2000; Deguchi et al., 2002; Tsutsumi et al., 2002; Deguchi et al.,
2004; Deguchi et al., 2005; Sun et al., 2006; Enomoto and Niwa, 2007), could be
responsible for the alterations in renal transporters in vivo.
Copyright © 2011 by The American Society for Pharmacology and Experimental Therapeutics
121
6. AUTHORSHIP CONTRIBUTIONS
Participated in research design: Naud, Hébert, Roger, Lefrancois, Pichette
Conducted experiments: Naud, Michaud, Beauchemin, Leblond
Performed data analysis: Naud, Leblond, Pichette
Wrote or contributed to the writing of the manuscript: Naud, Hébert, Roger,
Lefrancois, Leblond, Pichette
Copyright © 2011 by The American Society for Pharmacology and Experimental Therapeutics
122
7. REFERENCES
Cartier N, Lacave R, Vallet V, Hagege J, Hellio R, Robine S, Pringault E, Cluzeaud F,
Briand P, Kahn A and et al. (1993) Establishment of renal proximal tubule cell lines
by targeted oncogenesis in transgenic mice using the L-pyruvate kinase-SV40 (T)
antigen hybrid gene. J Cell Sci 104 ( Pt 3):695-704.
Choi MK, Kim H, Han YH, Song IS and Shim CK (2009) Involvement of Mrp2/MRP2 in
the species different excretion route of benzylpenicillin between rat and human.
Xenobiotica 39:171-181.
Chow EC, Sun H, Khan AA, Groothuis GM and Pang KS (2010) Effects of 1alpha,25-
dihydroxyvitamin D3 on transporters and enzymes of the rat intestine and kidney in
vivo. Biopharm Drug Dispos 31:91-108.
Deguchi T, Kouno Y, Terasaki T, Takadate A and Otagiri M (2005) Differential
contributions of rOat1 (Slc22a6) and rOat3 (Slc22a8) to the in vivo renal uptake of
uremic toxins in rats. Pharm Res 22:619-627.
Deguchi T, Kusuhara H, Takadate A, Endou H, Otagiri M and Sugiyama Y (2004)
Characterization of uremic toxin transport by organic anion transporters in the
kidney. Kidney Int 65:162-174.
Deguchi T, Ohtsuki S, Otagiri M, Takanaga H, Asaba H, Mori S and Terasaki T (2002)
Major role of organic anion transporter 3 in the transport of indoxyl sulfate in the
kidney. Kidney Int 61:1760-1768.
El-Sheikh AA, Masereeuw R and Russel FG (2008) Mechanisms of renal anionic drug
transport. Eur J Pharmacol 585:245-255.
Enomoto A and Niwa T (2007) Roles of organic anion transporters in the progression of
chronic renal failure. Ther Apher Dial 11:S27-31.
Feng B, LaPerle JL, Chang G and Varma MV (2010) Renal clearance in drug discovery
and development: molecular descriptors, drug transporters and disease state. Expert
Opin Drug Metab Toxicol 6:939-952.
Copyright © 2011 by The American Society for Pharmacology and Experimental Therapeutics
123
Gault MH, Churchill DN and Kalra J (1980) Loading dose of digoxin in renal failure. Br J
Clin Pharmacol 9:593-597.
Giacomini KM, Huang SM, Tweedie DJ, Benet LZ, Brouwer KL, Chu X, Dahlin A, Evers
R, Fischer V, Hillgren KM, Hoffmaster KA, Ishikawa T, Keppler D, Kim RB, Lee
CA, Niemi M, Polli JW, Sugiyama Y, Swaan PW, Ware JA, Wright SH, Yee SW,
Zamek-Gliszczynski MJ and Zhang L (2010) Membrane transporters in drug
development. Nat Rev Drug Discov 9:215-236.
Guengerich FP (2003) Cytochromes P450, drugs, and diseases. Mol Interv 3:194-204.
Hsiang B, Zhu Y, Wang Z, Wu Y, Sasseville V, Yang WP and Kirchgessner TG (1999) A
novel human hepatic organic anion transporting polypeptide (OATP2).
Identification of a liver-specific human organic anion transporting polypeptide and
identification of rat and human hydroxymethylglutaryl-CoA reductase inhibitor
transporters. J Biol Chem 274:37161-37168.
Iharada M, Miyaji T, Fujimoto T, Hiasa M, Anzai N, Omote H and Moriyama Y (2010)
Type 1 sodium-dependent phosphate transporter (SLC17A1 Protein) is a Cl(-)-
dependent urate exporter. J Biol Chem 285:26107-26113.
Inui KI, Masuda S and Saito H (2000) Cellular and molecular aspects of drug transport in
the kidney. Kidney Int 58:944-958.
Jelliffe RW (1968) An improved method of digoxin therapy. Ann Intern Med 69:703-717.
Jelliffe RW (1969) Administration of digoxin. Dis Chest 56:56-60.
Ji L, Masuda S, Saito H and Inui K (2002) Down-regulation of rat organic cation
transporter rOCT2 by 5/6 nephrectomy. Kidney Int 62:514-524.
Laouari D, Yang R, Veau C, Blanke I and Friedlander G (2001) Two apical multidrug
transporters, P-gp and MRP2, are differently altered in chronic renal failure. Am J
Physiol Renal Physiol 280:F636-645.
Leblond F, Guevin C, Demers C, Pellerin I, Gascon-Barre M and Pichette V (2001)
Downregulation of hepatic cytochrome P450 in chronic renal failure. J Am Soc
Nephrol 12:326-332.
Copyright © 2011 by The American Society for Pharmacology and Experimental Therapeutics
124
Leblond FA, Giroux L, Villeneuve JP and Pichette V (2000) Decreased in vivo metabolism
of drugs in chronic renal failure. Drug Metab Dispos 28:1317-1320.
Leblond FA, Petrucci M, Dube P, Bernier G, Bonnardeaux A and Pichette V (2002)
Downregulation of intestinal cytochrome p450 in chronic renal failure. J Am Soc
Nephrol 13:1579-1585.
Leier I, Hummel-Eisenbeiss J, Cui Y and Keppler D (2000) ATP-dependent para-
aminohippurate transport by apical multidrug resistance protein MRP2. Kidney Int
57:1636-1642.
Livak KJ and Schmittgen TD (2001) Analysis of relative gene expression data using real-
time quantitative PCR and the 2(-Delta Delta C(T)) Method. Methods 25:402-408.
Lowry OH, Rosebrough NJ, Farr AL and Randall RJ (1951) Protein measurement with the
folin phenol reagent. J Biol Chem 193:265-275.
Masereeuw R and Russel FG (2010) Therapeutic implications of renal anionic drug
transporters. Pharmacol Ther 126:200-216.
Masereeuw R, Terlouw SA, van Aubel RA, Russel FG and Miller DS (2000) Endothelin B
receptor-mediated regulation of ATP-driven drug secretion in renal proximal tubule.
Mol Pharmacol 57:59-67.
Masuda S, Saito H, Nonoguchi H, Tomita K and Inui K (1997) mRNA distribution and
membrane localization of the OAT-K1 organic anion transporter in rat renal tubules.
FEBS Lett 407:127-131.
Mikkaichi T, Suzuki T, Onogawa T, Tanemoto M, Mizutamari H, Okada M, Chaki T,
Masuda S, Tokui T, Eto N, Abe M, Satoh F, Unno M, Hishinuma T, Inui K, Ito S,
Goto J and Abe T (2004) Isolation and characterization of a digoxin transporter and
its rat homologue expressed in the kidney. Proc Natl Acad Sci U S A 101:3569-
3574.
Nagai J and Takano M (2010) Molecular-targeted approaches to reduce renal accumulation
of nephrotoxic drugs. Expert Opin Drug Metab Toxicol 6:1125-1138.
Copyright © 2011 by The American Society for Pharmacology and Experimental Therapeutics
125
Naud J, Michaud J, Boisvert C, Desbiens K, Leblond FA, Mitchell A, Jones C,
Bonnardeaux A and Pichette V (2007) Down-regulation of intestinal drug
transporters in chronic renal failure in rats. J Pharmacol Exp Ther 320:978-985.
Naud J, Michaud J, Leblond FA, Lefrancois S, Bonnardeaux A and Pichette V (2008)
Effects of chronic renal failure on liver drug transporters. Drug Metab Dispos
36:124-128.
Niwa T and Ise M (1994) Indoxyl sulfate, a circulating uremic toxin, stimulates the
progression of glomerular sclerosis. J Lab Clin Med 124:96-104.
Niwa T, Ise M and Miyazaki T (1994) Progression of glomerular sclerosis in experimental
uremic rats by administration of indole, a precursor of indoxyl sulfate. Am J
Nephrol 14:207-212.
Niwa T, Tsukushi S, Ise M, Miyazaki T, Tsubakihara Y, Owada A and Shiigai T (1997)
Indoxyl sulfate and progression of renal failure: effects of a low-protein diet and
oral sorbent on indoxyl sulfate production in uremic rats and undialyzed uremic
patients. Miner Electrolyte Metab 23:179-184.
Russel FG, Masereeuw R and van Aubel RA (2002) Molecular aspects of renal anionic
drug transport. Annu Rev Physiol 64:563-594.
Sekine T, Miyazaki H and Endou H (2006) Molecular physiology of renal organic anion
transporters. Am J Physiol Renal Physiol 290:F251-261.
Simard E, Naud J, Michaud J, Leblond FA, Bonnardeaux A, Guillemette C, Sim E and
Pichette V (2008) Downregulation of hepatic acetylation of drugs in chronic renal
failure. J Am Soc Nephrol 19:1352-1359.
Sun H, Frassetto L and Benet LZ (2006) Effects of renal failure on drug transport and
metabolism. Pharmacol Ther 109:1-11.
Tsutsumi Y, Deguchi T, Takano M, Takadate A, Lindup WE and Otagiri M (2002) Renal
disposition of a furan dicarboxylic acid and other uremic toxins in the rat. J
Pharmacol Exp Ther 303:880-887.
Copyright © 2011 by The American Society for Pharmacology and Experimental Therapeutics
126
Windass AS, Lowes S, Wang Y and Brown CD (2007) The contribution of organic anion
transporters OAT1 and OAT3 to the renal uptake of rosuvastatin. J Pharmacol Exp
Ther 322:1221-1227.
Yamaguchi H, Sugie M, Okada M, Mikkaichi T, Toyohara T, Abe T, Goto J, Hishinuma T,
Shimada M and Mano N (2010) Transport of estrone 3-sulfate mediated by organic
anion transporter OATP4C1: estrone 3-sulfate binds to the different recognition site
for digoxin in OATP4C1. Drug Metab Pharmacokinet 25:314-317.
Copyright © 2011 by The American Society for Pharmacology and Experimental Therapeutics
127
8. FOOTNOTES
This work was financed in part by the Canadian Institute for Health Research (CIHR), La
Fondation Hôpital Maisonneuve-Rosemont (La néphrologie et son Impact), Le consortium
de néphrologie de l’Université de Montreal and Astellas Pharma Canada Inc. The opinions
expressed in this paper are those of the authors. Astellas Pharma Inc. had no role in the
design of the study, data analysis and interpretation, and in the manuscript preparation.
V Pichette, MJ Hébert, S Lefrancois and M Roger are supported by career awards from
Fonds de la recherche en santé du Québec.
Reprint requests should be sent to: Vincent Pichette MD Ph.D.
Centre de recherche de l’hôpital Maisonneuve-Rosemont
5415 boul. de l’Assomption, Montréal, Québec, Canada
H1T 2M4
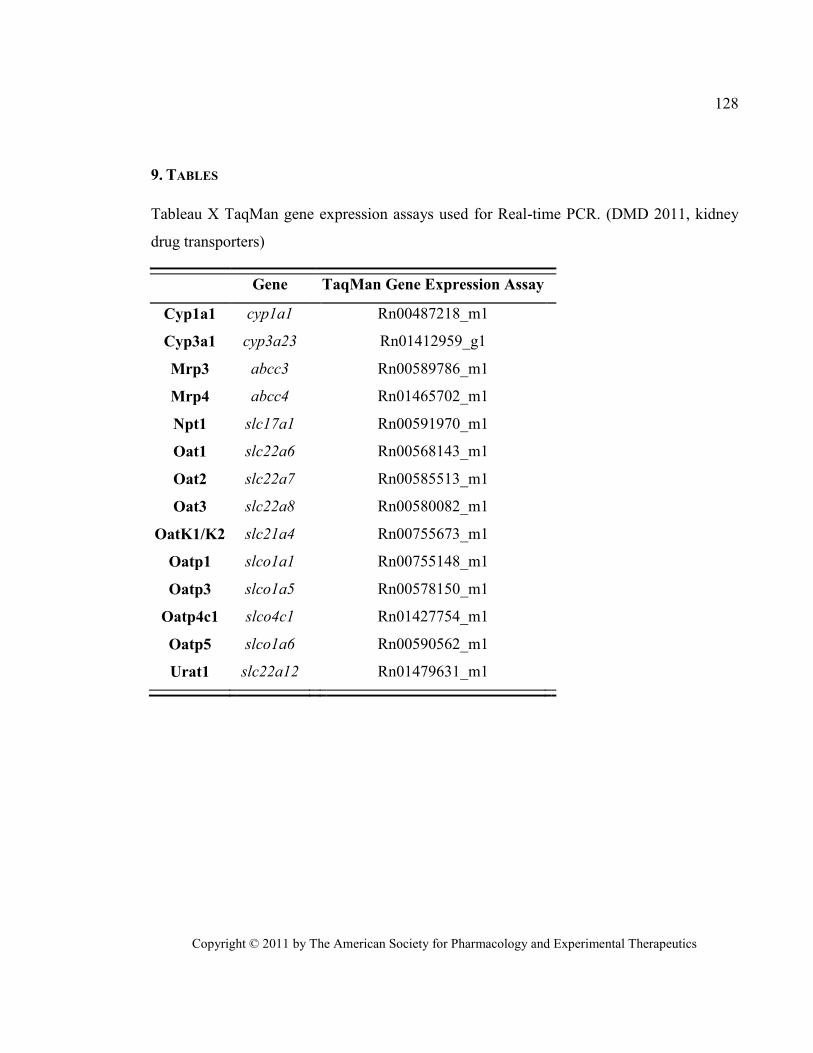
Copyright © 2011 by The American Society for Pharmacology and Experimental Therapeutics
128
9. TABLES
Tableau X TaqMan gene expression assays used for Real-time PCR. (DMD 2011, kidney
drug transporters)
Gene TaqMan Gene Expression Assay
Cyp1a1 cyp1a1 Rn00487218_m1
Cyp3a1 cyp3a23 Rn01412959_g1
Mrp3 abcc3 Rn00589786_m1
Mrp4 abcc4 Rn01465702_m1
Npt1 slc17a1 Rn00591970_m1
Oat1 slc22a6 Rn00568143_m1
Oat2 slc22a7 Rn00585513_m1
Oat3 slc22a8 Rn00580082_m1
OatK1/K2 slc21a4 Rn00755673_m1
Oatp1 slco1a1 Rn00755148_m1
Oatp3 slco1a5 Rn00578150_m1
Oatp4c1 slco4c1 Rn01427754_m1
Oatp5 slco1a6 Rn00590562_m1
Urat1 slc22a12 Rn01479631_m1
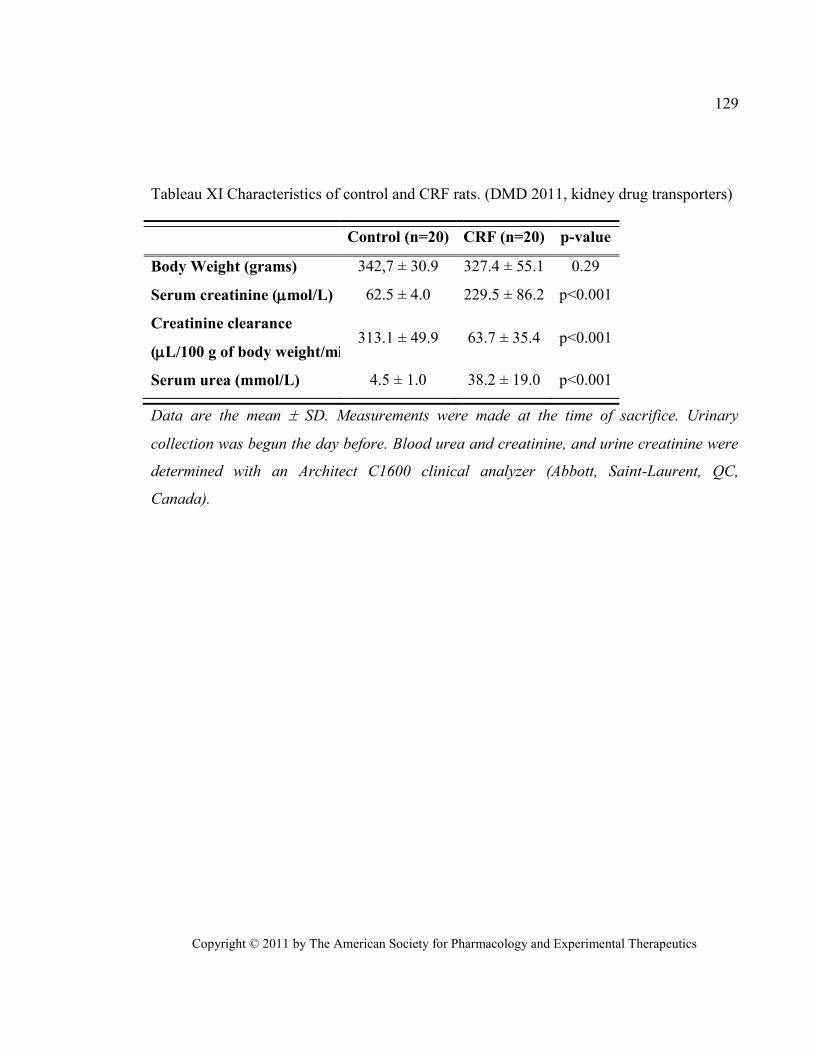
Copyright © 2011 by The American Society for Pharmacology and Experimental Therapeutics
129
Tableau XI Characteristics of control and CRF rats. (DMD 2011, kidney drug transporters)
Control (n=20) CRF (n=20) p-value
Body Weight (grams) 342,7 ± 30.9 327.4 ± 55.1 0.29
Serum creatinine (mol/L) 62.5 ± 4.0 229.5 ± 86.2 p<0.001
Creatinine clearance
(L/100 g of body weight/min) 313.1 ± 49.9 63.7 ± 35.4 p<0.001
Serum urea (mmol/L) 4.5 ± 1.0 38.2 ± 19.0 p<0.001
Data are the mean SD. Measurements were made at the time of sacrifice. Urinary
collection was begun the day before. Blood urea and creatinine, and urine creatinine were
determined with an Architect C1600 clinical analyzer (Abbott, Saint-Laurent, QC,
Canada).
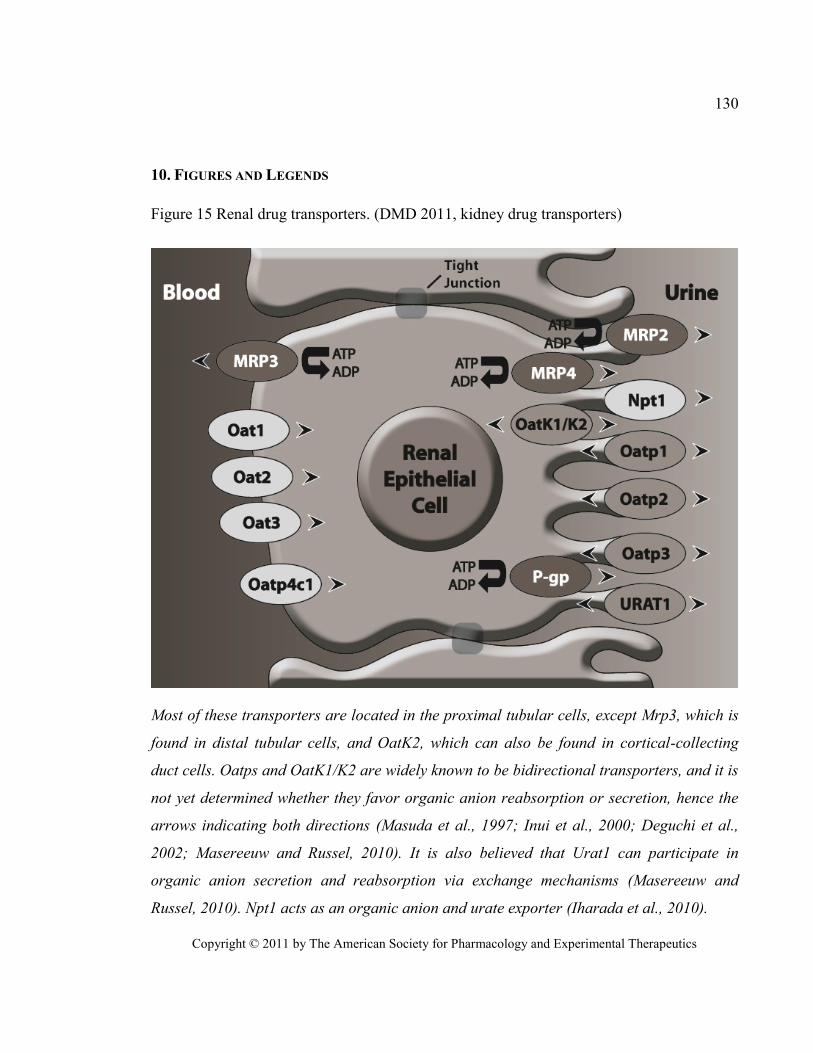
Copyright © 2011 by The American Society for Pharmacology and Experimental Therapeutics
130
10. FIGURES AND LEGENDS
Figure 15 Renal drug transporters. (DMD 2011, kidney drug transporters)
Most of these transporters are located in the proximal tubular cells, except Mrp3, which is
found in distal tubular cells, and OatK2, which can also be found in cortical-collecting
duct cells. Oatps and OatK1/K2 are widely known to be bidirectional transporters, and it is
not yet determined whether they favor organic anion reabsorption or secretion, hence the
arrows indicating both directions (Masuda et al., 1997; Inui et al., 2000; Deguchi et al.,
2002; Masereeuw and Russel, 2010). It is also believed that Urat1 can participate in
organic anion secretion and reabsorption via exchange mechanisms (Masereeuw and
Russel, 2010). Npt1 acts as an organic anion and urate exporter (Iharada et al., 2010).
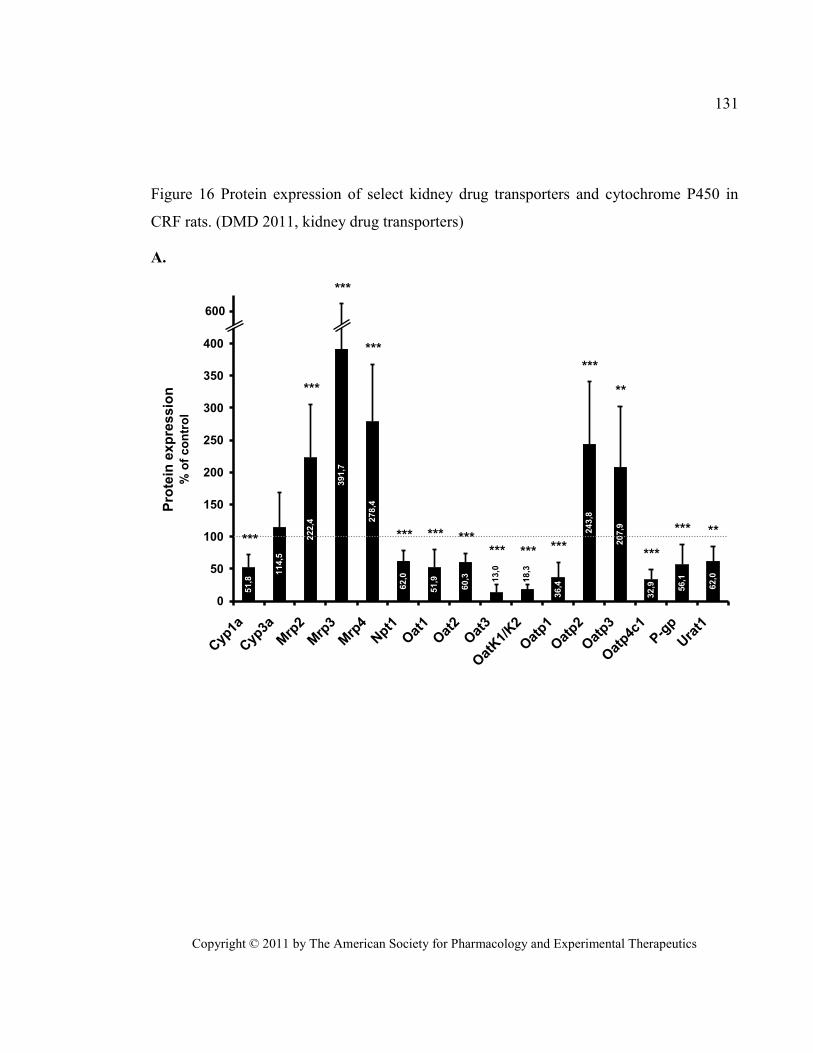
Copyright © 2011 by The American Society for Pharmacology and Experimental Therapeutics
131
Figure 16 Protein expression of select kidney drug transporters and cytochrome P450 in
CRF rats. (DMD 2011, kidney drug transporters)
A. 51,8
114,5
222,4
391,7
278,4
62,0
51,9
60,3
36,4
243,8
207,9
32,9 56,1
62,013,0
18,3
0
50
100
150
200
250
300
350
400
450
Cyp
1a
Cyp
3a
Mrp
2
Mrp
3
Mrp
4Npt1
Oat
1
Oat
2
Oat
3
Oat
K1/
K2
Oat
p1
Oat
p2
Oat
p3
Oat
p4c1
P-g
p
Ura
t1
Pro
tein
exp
ressio
n%
of
co
ntr
ol
600
***
***
***
***
*** *** ****** *** ***
***
***
*** **
**
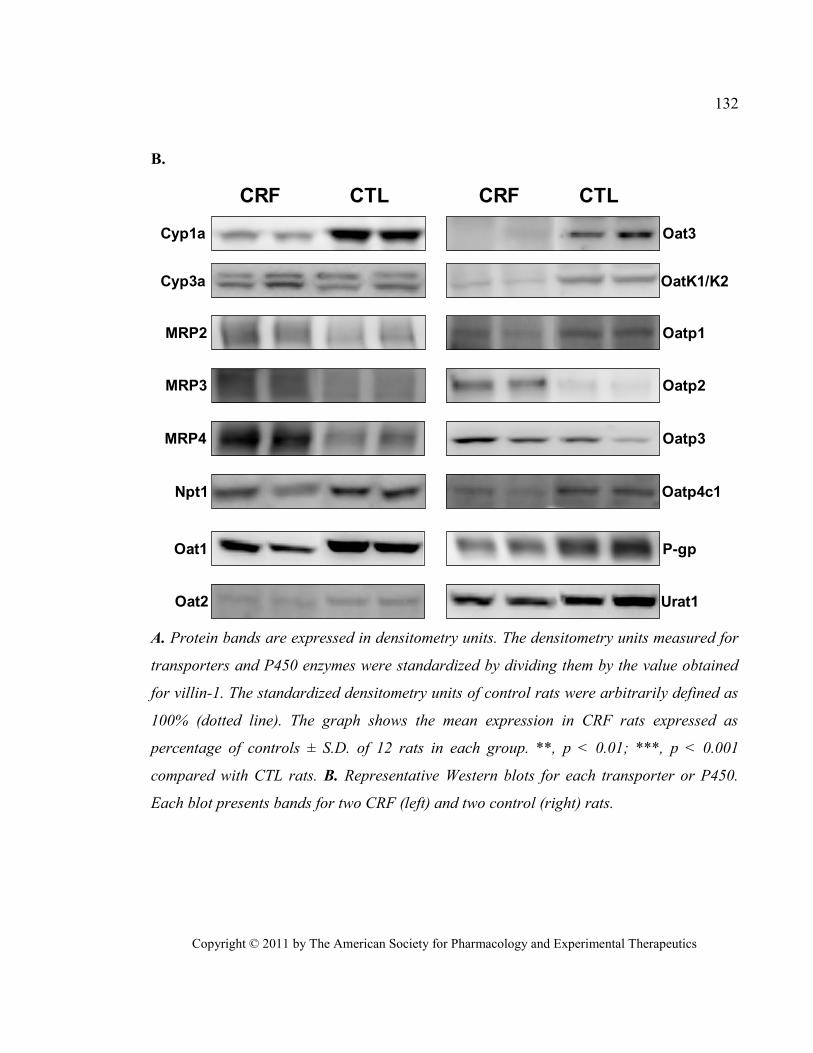
Copyright © 2011 by The American Society for Pharmacology and Experimental Therapeutics
132
B.
CRF CTL
Cyp1a
MRP2
Oat1
MRP3
MRP4
Oat2
Npt1
Cyp3a
CRF CTL
Oatp1
Oatp2
Oatp4c1
P-gp
Oat3
Urat1
OatK1/K2
Oatp3
A. Protein bands are expressed in densitometry units. The densitometry units measured for
transporters and P450 enzymes were standardized by dividing them by the value obtained
for villin-1. The standardized densitometry units of control rats were arbitrarily defined as
100% (dotted line). The graph shows the mean expression in CRF rats expressed as
percentage of controls ± S.D. of 12 rats in each group. **, p < 0.01; ***, p < 0.001
compared with CTL rats. B. Representative Western blots for each transporter or P450.
Each blot presents bands for two CRF (left) and two control (right) rats.
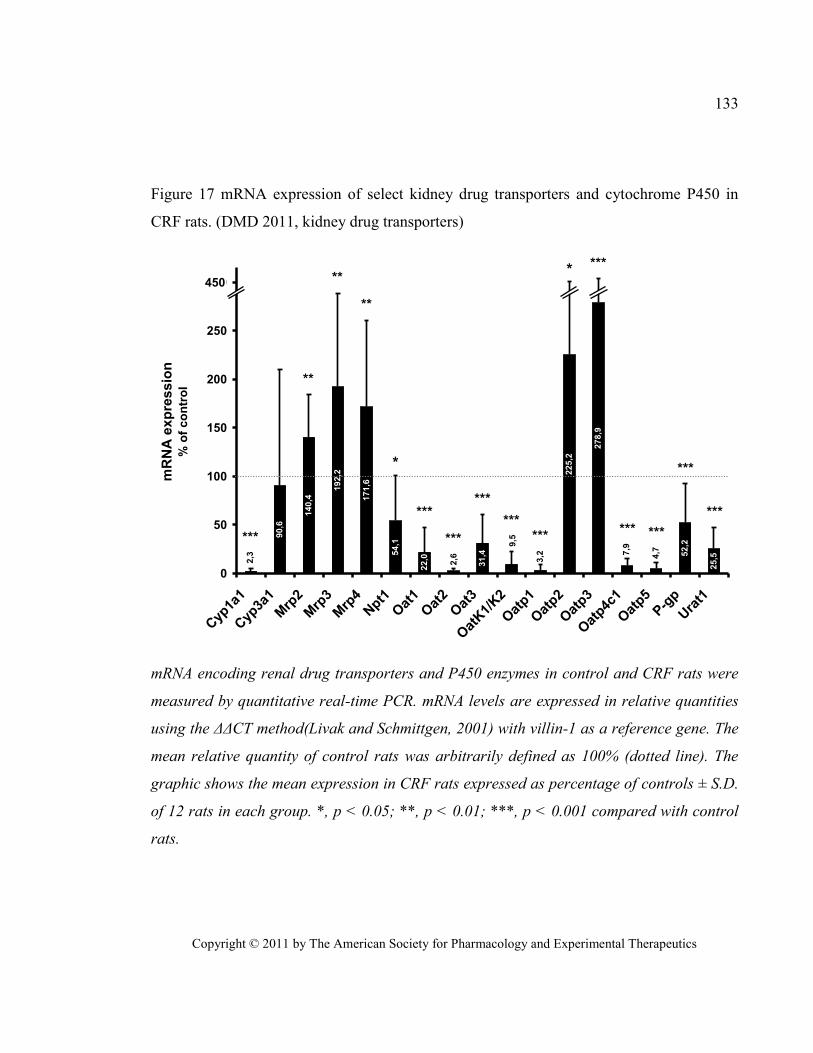
Copyright © 2011 by The American Society for Pharmacology and Experimental Therapeutics
133
Figure 17 mRNA expression of select kidney drug transporters and cytochrome P450 in
CRF rats. (DMD 2011, kidney drug transporters)
90,6
140,4
192,2
171,6
54,1
22,0
31,4
225,2
278,9
52,2
25,52,3
2,6
9,5
3,2 7
,9
4,7
0
50
100
150
200
250
300
Cyp
1a1
Cyp
3a1
Mrp
2
Mrp
3
Mrp
4Npt1
Oat
1
Oat
2
Oat
3
Oat
K1/
K2
Oat
p1
Oat
p2
Oat
p3
Oat
p4c1
Oat
p5
P-g
p
Ura
t1
mR
NA
exp
ress
ion
% o
f co
ntr
ol
450*
*
***
**
**
**
***
***
***
******
***
*** ***
***
***
mRNA encoding renal drug transporters and P450 enzymes in control and CRF rats were
measured by quantitative real-time PCR. mRNA levels are expressed in relative quantities
using the ΔΔCT method(Livak and Schmittgen, 2001) with villin-1 as a reference gene. The
mean relative quantity of control rats was arbitrarily defined as 100% (dotted line). The
graphic shows the mean expression in CRF rats expressed as percentage of controls ± S.D.
of 12 rats in each group. *, p < 0.05; **, p < 0.01; ***, p < 0.001 compared with control
rats.
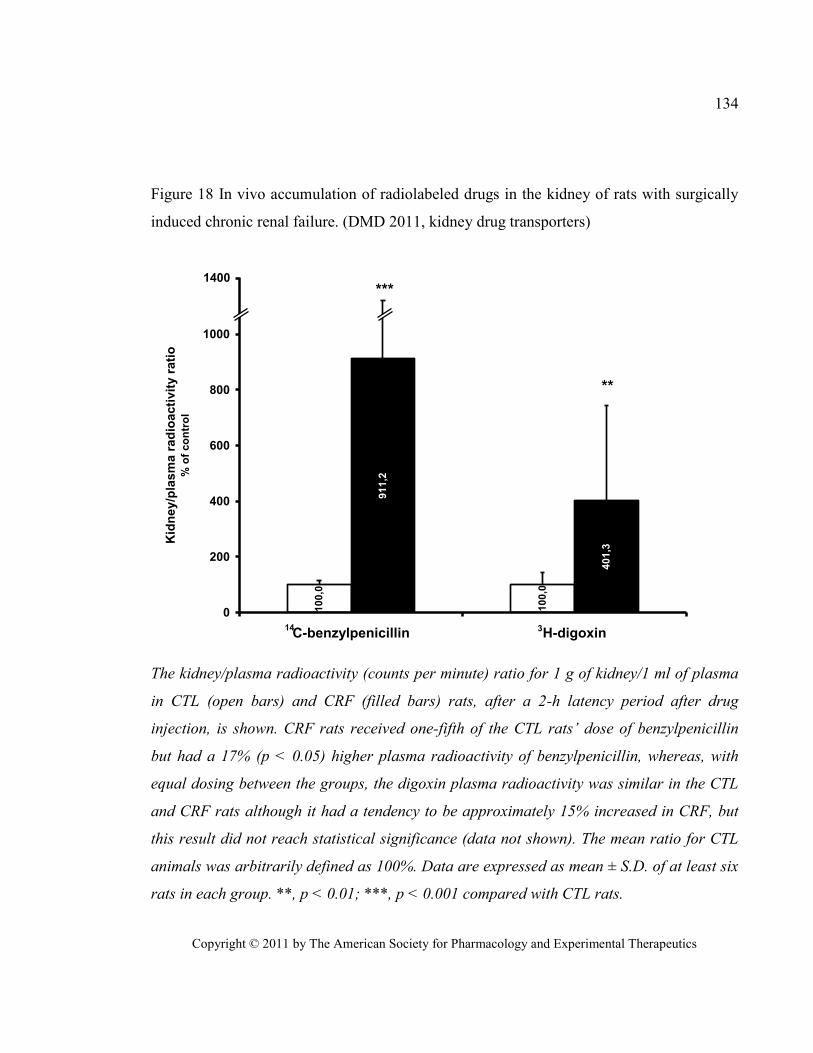
Copyright © 2011 by The American Society for Pharmacology and Experimental Therapeutics
134
Figure 18 In vivo accumulation of radiolabeled drugs in the kidney of rats with surgically
induced chronic renal failure. (DMD 2011, kidney drug transporters)
91
1,2
40
1,3
10
0,0
10
0,0
0
200
400
600
800
1000
1200
C-benzylpenicillin H-digoxin
Kid
ney/p
lasm
a r
ad
ioacti
vit
y r
ati
o%
of
co
ntr
ol
***
**
14 3
1400
The kidney/plasma radioactivity (counts per minute) ratio for 1 g of kidney/1 ml of plasma
in CTL (open bars) and CRF (filled bars) rats, after a 2-h latency period after drug
injection, is shown. CRF rats received one-fifth of the CTL rats’ dose of benzylpenicillin
but had a 17% (p < 0.05) higher plasma radioactivity of benzylpenicillin, whereas, with
equal dosing between the groups, the digoxin plasma radioactivity was similar in the CTL
and CRF rats although it had a tendency to be approximately 15% increased in CRF, but
this result did not reach statistical significance (data not shown). The mean ratio for CTL
animals was arbitrarily defined as 100%. Data are expressed as mean ± S.D. of at least six
rats in each group. **, p < 0.01; ***, p < 0.001 compared with CTL rats.
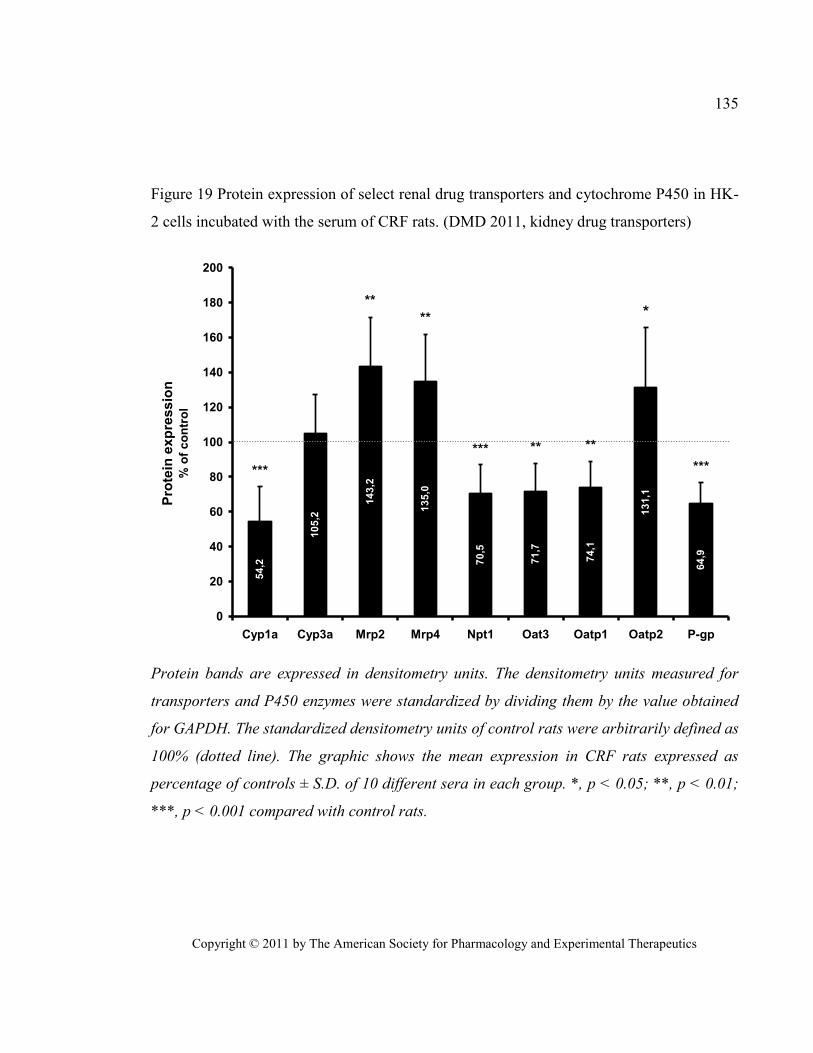
Copyright © 2011 by The American Society for Pharmacology and Experimental Therapeutics
135
Figure 19 Protein expression of select renal drug transporters and cytochrome P450 in HK-
2 cells incubated with the serum of CRF rats. (DMD 2011, kidney drug transporters)
54
,2
10
5,2
14
3,2
13
5,0
70
,5
71
,7
74
,1
13
1,1
64
,9
0
20
40
60
80
100
120
140
160
180
200
Cyp1a Cyp3a Mrp2 Mrp4 Npt1 Oat3 Oatp1 Oatp2 P-gp
Pro
tein
exp
ressio
n%
of
co
ntr
ol
***
**
** **
***
***
***
Protein bands are expressed in densitometry units. The densitometry units measured for
transporters and P450 enzymes were standardized by dividing them by the value obtained
for GAPDH. The standardized densitometry units of control rats were arbitrarily defined as
100% (dotted line). The graphic shows the mean expression in CRF rats expressed as
percentage of controls ± S.D. of 10 different sera in each group. *, p < 0.05; **, p < 0.01;
***, p < 0.001 compared with control rats.
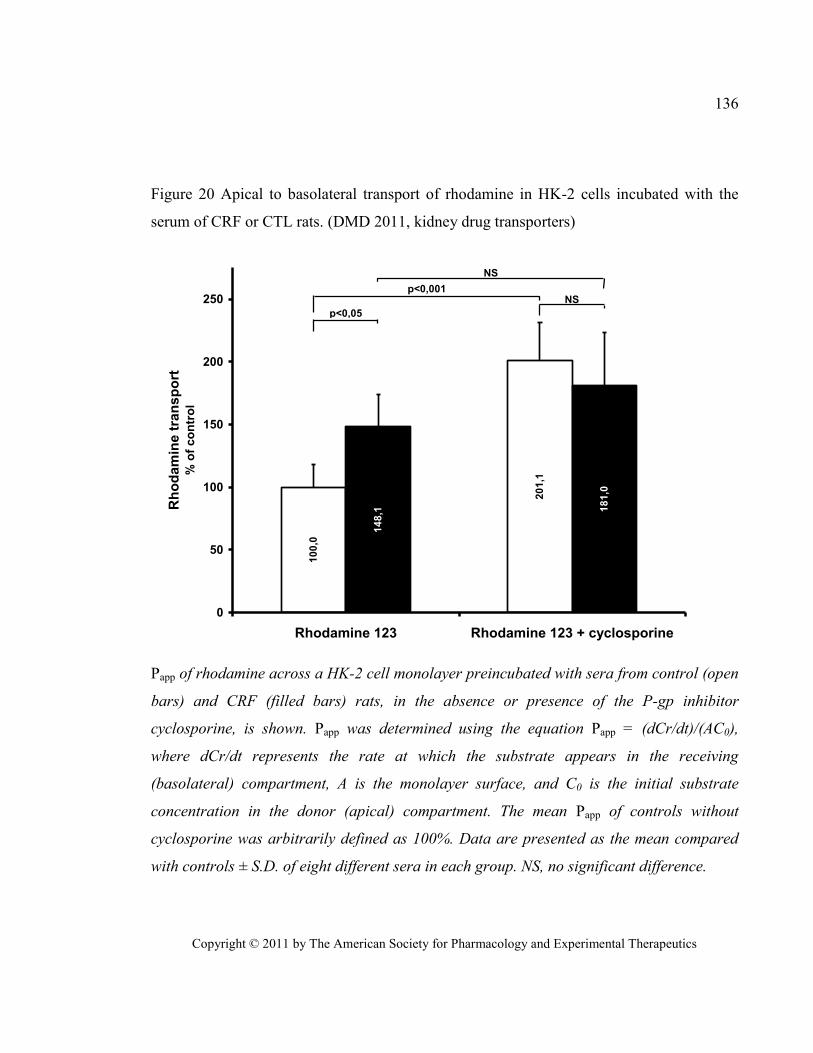
Copyright © 2011 by The American Society for Pharmacology and Experimental Therapeutics
136
Figure 20 Apical to basolateral transport of rhodamine in HK-2 cells incubated with the
serum of CRF or CTL rats. (DMD 2011, kidney drug transporters)
10
0,0
20
1,1
14
8,1 1
81
,00
50
100
150
200
250
Rhodamine 123 Rhodamine 123 + cyclosporine
Rh
od
am
ine t
ran
sp
ort
%
of
co
ntr
ol
p<0,05
p<0,001NS
NS
Papp of rhodamine across a HK-2 cell monolayer preincubated with sera from control (open
bars) and CRF (filled bars) rats, in the absence or presence of the P-gp inhibitor
cyclosporine, is shown. Papp was determined using the equation Papp = (dCr/dt)/(AC0),
where dCr/dt represents the rate at which the substrate appears in the receiving
(basolateral) compartment, A is the monolayer surface, and C0 is the initial substrate
concentration in the donor (apical) compartment. The mean Papp of controls without
cyclosporine was arbitrarily defined as 100%. Data are presented as the mean compared
with controls ± S.D. of eight different sera in each group. NS, no significant difference.
Effects of chronic renal failure on brain drug transporters in
rats
Drug Metab Dispos. 2012 Jan;40(1):39-46.
Reprinted with permission from the American Society for Pharmacology and Experimental
Therapeutics. All rights reserved.
Copyright © 2012 by The American Society for Pharmacology and Experimental
Therapeutics
Copyright © 2012 by The American Society for Pharmacology and Experimental Therapeutics
138
Effects of chronic renal failure on brain drug
transporters in rats
Judith Naud MSc, Louis-Philippe Laurin MD, Josée Michaud MSc, Stéphanie
Beauchemin MSc, Francois A. Leblond PhD and Vincent Pichette MD PhD
Service de néphrologie et Centre de recherche de l’Hôpital Maisonneuve-Rosemont,
Faculté de Médecine, Université de Montréal, Québec, Canada (J.N., L.P.L., J.M., S.B.,
F.A.L., V.P.)
Département de pharmacologie, Faculté de Médecine, Université de Montréal, Québec,
Canada (J.N., J.M., V.P.)
Copyright © 2012 by The American Society for Pharmacology and Experimental Therapeutics
139
Brain drug transporters in renal failure
Correspondence should be addressed to: Vincent Pichette MD Ph.D.
Centre de recherche de l’hôpital Maisonneuve-
Rosemont
Number of text pages: 18
Number of tables: 2
Number of figures: 6
Number of references: 54
Number of words in Abstract: 229 words
Number of words in Introduction: 727 words
Number of word in Discussion: 1146 words
List of non-standard abbreviations: Bcrp: breast cancer resistance protein, CRF: chronic
renal failure, CTL: control, GFR: glomerular filtration rate, Mrp: multidrug resistance
related protein, Oat: organic anion transporter, Oatp: organic anion transporting
polypeptide, PBS: Phosphate Buffered Saline, PCR: polymerase chain reaction, P-gp: P-
glycoprotein, PMSF: Phenylmethylsulfonylfluoride, PTH: parathyroid hormone, qPCR:
quantitative PCR
Copyright © 2012 by The American Society for Pharmacology and Experimental Therapeutics
140
1. ABSTRACT
Studies demonstrated that chronic renal failure (CRF) affects the expression and
activity of intestinal, hepatic and renal drug transporters. Such drug transporters are
expressed in brain cells and at the blood-brain-barrier (BBB) where they limit the entry and
distribution of drugs in the brain. Perturbations in brain drug transporters equilibrium by
CRF could lead to central drug toxicity. This study evaluates how CRF affects BBB drug
transporters using a 5/6 nephrectomised rat model. Protein and mRNA expression of influx
transporters (organic anion transporting polypeptide [Oatp], organic anion transporter
[Oat]), and efflux transporters (p-glycoprotein [P-gp], multidrug resistance related protein
[Mrp], breast cancer resistance protein [Bcrp]) was measured in CRF and control rat brain.
Intra-cerebral accumulation of radio-labelled benzylpenicillin, digoxin, doxorubicin and
verapamil was used to evaluate BBB drug permeability. Protein expression of the
transporters was evaluated in rat brain endothelial cells (RBEC) and astrocytes incubated
with control and CRF rat serum. We demonstrated significant decreases (30-50%) in
protein and mRNA levels of Bcrp, Mrp2-4, Oat3, Oatp2-3 and P-gp in CRF rat brain
biopsies as well as in astrocytes and RBEC incubated with CRF serum. These decreases did
not correlate with in vivo changes since BBB permeability of benzylpenicillin was
decreased by 30% in CRF rats while digoxin, doxorubicin and verapamil permeabilities
were unchanged. It thus appears that even with decreased drug transporters, BBB integrity
and function is conserved in CRF.
Copyright © 2012 by The American Society for Pharmacology and Experimental Therapeutics
141
2. INTRODUCTION
In recent years, many studies have demonstrated that chronic renal failure (CRF)
significantly affects the expression and activity of intestinal, hepatic and renal drug
transporters via uremic mediators, thus, altering the pharmacokinetics of many drugs (Huang
et al., 2000; Laouari et al., 2001; Sun et al., 2004; Sun et al., 2006; Naud et al., 2007; Naud et
al., 2008; Naud et al., 2011). Such drug transporters are also expressed in brain cells and at
the blood-brain-barrier (BBB) where they limit the entry and distribution of drugs in the brain
(see Figure 21) (Loscher and Potschka, 2005c; Loscher and Potschka, 2005b; Loscher and
Potschka, 2005a; Ohtsuki and Terasaki, 2007). Two major drug transporter families have
been identified: ATP-binding cassette (ABC) transporters and solute carriers (Slc). The most
important ABC transporters at the BBB are multidrug resistance related proteins (Mrp),
breast cancer resistance protein (Bcrp) and P-glycoprotein (P-gp). Bcrp, Mrp2-4-5 and P-gp
are expressed on the luminal side and they mediate the efflux of molecules from the brain
capillary cell into the blood (Kusuhara and Sugiyama, 2005; Loscher and Potschka, 2005c;
Deeken and Loscher, 2007; Oswald et al., 2007; Eyal et al., 2009). Mrp4 was also found on
the abluminal side of bovine brain capillaries where it is thought to mediate the efflux of
molecules from the capillary cell into the brain, but this was not reported in rat and human
brain (Kusuhara and Sugiyama, 2005; Loscher and Potschka, 2005c; Deeken and Loscher,
2007; Oswald et al., 2007). As for solute carriers, the most important found at the BBB are
the organic anion transporter 3 (Oat3) and the organic anion transporting proteins 2 and 3
(Oatp2-3). Oat3 is located on both membranes and mediates drug efflux from the brain into
the blood (Kikuchi et al., 2003; Mori et al., 2003; Mori et al., 2004; Loscher and Potschka,
2005c; Deeken and Loscher, 2007; Oswald et al., 2007). Furthermore, it was recently
hypothesized that Oat3 is also implicated in the influx of drugs from the blood to the brain
(Ose et al., 2009). Oatp2 is expressed at the luminal and abluminal membranes, while Oatp3
was found only at the luminal membrane of brain capillary cells, and they both mediate
bi-directional transport of drugs (Loscher and Potschka, 2005c; Deeken and Loscher, 2007;
Copyright © 2012 by The American Society for Pharmacology and Experimental Therapeutics
142
Ohtsuki and Terasaki, 2007; Ose et al., 2010). Perturbations in brain drug transporter
equilibrium caused by CRF could lead to central toxicity of drugs.
To this day, there are no studies reporting the effects of CRF on brain drug
transporters. However, indirect evidence suggests that CRF could be implicated in
modulating their expression. Indeed, neurotoxicity of cephalosporin and penicillin derivates
was reported in patients with altered renal function despite normal plasma concentrations
(Chatellier et al., 2002; Ferrara et al., 2003; Alpay et al., 2004). Drug transporters expressed
at the BBB normally prevent the entry of these drugs into the brain (Kikuchi et al., 2003). It
was demonstrated that beta-lactam antibiotics and cephalosporins are substrates of Oat3 and
Mrps in the kidney and the brain (Kikuchi et al., 2003; Ueo et al., 2005; Ci et al., 2007;
Nozaki et al., 2007). Interestingly, Oat3 is also known to extract at least three uremic toxins
from the brain : p-aminohippuric acid (PAH), indoxyl sulfate (IS) and 3-carboxyl-4-methyl-
5-propyl-2-furonapropionate (CMPF) (Ohtsuki et al., 2002; Kikuchi et al., 2003; Tahara et
al., 2005; Deguchi et al., 2006). Finally, it was demonstrated that central and systemic
inflammation, which are present in CRF (Oettinger et al., 1994; Sunder-Plassmann et al.,
1994; Ziesche et al., 1994; Akahoshi et al., 1995; Higuchi et al., 1997), can downregulate the
expression of P-gp at the BBB and in the liver, leading to drug accumulation in the brain and
plasma (Zhao et al., 2002; Goralski et al., 2003; Petrovic et al., 2007).
The objective of this study was to investigate the effects of CRF on the expression
and activity of the major drug transporters expressed at the BBB and in the brain. To address
this, we have measured 1) the protein and mRNA expressions of Oat3, Oatp2-3, Mrp2-4-5
and P-gp in brain tissue biopsies from CRF and control rats, 2) the protein expression of the
same transporters in rat astrocytes and rat brain endothelial cells (RBEC) incubated with sera
from control and CRF rats, and 3) the in vivo intra-cerebral accumulation of
14C-benzylpenicillin,
3H-digoxin,
14C-doxorubicin and
3H-verapamil four substrates of brain
drug transporters.
Copyright © 2012 by The American Society for Pharmacology and Experimental Therapeutics
143
3. MATERIALS AND METHODS
Experimental Model
Male Sprague-Dawley rats (Charles River, Portage, MI), weighing 176 to 225 g
were housed in the Research Center animal care facility and maintained on Harlan Teklad
rodent diet (Harlan Teklad Global Diets, Montreal, Canada) and water ad libitum. Animals
were allowed an acclimatization period of at least 7 days before the first nephrectomy was
performed. All the experiments were conducted according to the Canadian Council on
Animal Care guidelines for care and use of laboratory animals and under the supervision of
our local animal care committee.
Experimental Protocol
Studies were performed in two groups of animals: control pair-fed and CRF. Drug
transporter protein expression and mRNA levels were measured in at least 6 rats per group.
Drug transporter activity was measured in vivo through the cerebral accumulation of
14C-benzylpenicillin,
3H-digoxin,
14C-doxorubicin and
3H-verapamil in at least 3 rats per
group, per experiment.
Chronic renal failure was induced by two-stage 5/6 nephrectomy as previously
described (Leblond et al., 2001). Every animal had free access to water, but in order to limit
the effects of CRF-induced malnutrition, control pair-fed rats were fed the same amount of
chow that CRF rats ate on the previous day. We have previously demonstrated that the
caloric reduction in control animals induced by pair-feeding did not influence the expression
of drug transporters (unpublished data). At day 41 post-nephrectomy, the rats were housed in
metabolic cages and urine was collected for 24 hours to determine the clearance of creatinine.
Rats were sacrificed by decapitation 42 days after nephrectomy for organ and blood
collection, or underwent a radio-labeled drug accumulation study. Following sacrifice, the
Copyright © 2012 by The American Society for Pharmacology and Experimental Therapeutics
144
brain was immediately excised, rinsed in ice-cold saline then flash-frozen in liquid nitrogen.
Samples were stored at -80°C until membrane preparation or mRNA extraction. Blood was
collected for the measurement of serum creatinine and urea and for bioassays with cultured
rat brain endothelial cells (RBEC) and astrocytes.
Preparation of Crude Brain Membranes
Frozen rat brain biopsies (500 mg) were homogenized in 3 mL of homogenizing
buffer (250 mM sucrose,10 mM HEPES and 10 mM Tris-HCl, pH 7.4) containing
0.1 mM PMSF using a Potter-Elvehjem tissue grinder (Wheaton Science Products,
Millville, J). Differential centrifugation was used to obtain a crude membrane fraction (Chow
et al., 2010). Briefly, the brain homogenates were centrifuged at 9 000 g for 10 min at 4 °C.
The supernatant was then spun at 33 000 g for 60 min at 4°C and the resulting pellet was
resuspended in phosphate buffered saline containing 0.1 mM PMSF. Samples were then
sonicated on ice for 10 seconds to ensure homogeneity. Protein concentration was determined
using the method of Lowry et al. (Lowry et al., 1951), using bovine serum albumin as a
reference protein. Aliquots were stored at -80 °C up to Western blot analysis.
Western Blot Analysis
Major brain drug transporters were assessed by Western blot analysis following a
previously described protocol (Leblond et al., 2002; Naud et al., 2007; Naud et al., 2008;
Naud et al., 2011). Protein expression in control animals was arbitrarily defined as 100%.
P-gp and Mrp2 were detected using monoclonal antibodies from ID Labs (London,
Ontario, Canada): C219 and M2 III-6 respectively. Oat3, Oatp2 and Oatp3 were detected
using antibodies from Alpha Diagnostic International (San Antonio, TX). Anti-Bcrp was
from Abbiotec (San Diego, CA), Anti-Mrp4 was from Novus Biological (Littleton, CO)
and anti-Mrp5 from Abnova (Walnut, CA). Glyceraldehyde-3-phosphate dehydrogenase
Copyright © 2012 by The American Society for Pharmacology and Experimental Therapeutics
145
(GAPDH), used as a loading control, was detected using rabbit anti-GAPDH from Abcam
(Cambridge, MA).
mRNA Analysis
Total RNA was extracted from frozen tissue using Trizol reagent (Invitrogen,
Burlington, Ontario, Canada) according to the manufacturer’s protocol. RNA concentration
was determined by measuring absorbance at a wavelength of 260nm. One µg of total RNA
was used to prepare cDNA by reverse transcription using SuperScript® VILO™ cDNA
Synthesis Kit from Invitrogen. The mRNA encoding for P-gp (mdr1a), Mrp2 and Oatp2
was measured by quantitative Real-Time PCR (qPCR) as previously described (Naud et al.,
2007; Naud et al., 2008; Naud et al., 2011). Other genes were measured using appropriate
TaqMan gene expression assays from Applied Biosystems (Carlsbad, CA). Table XII
shows the TaqMan gene expression assays used for the quantification of mRNA for each
transporter. PCR products were analyzed using the ΔΔCT method (Livak and Schmittgen,
2001) using GAPDH as standard gene.
In Vivo Accumulation of Radio-labeled Drugs in Brain
The intra-cerebral accumulation of radio-labeled drugs was used to determine the
activity of the blood-brain-barrier drug transporters. Four different drugs were tested:
14C-enzylpenicillin, an antibiotic and a substrate for Oat3 and Mrps (Kikuchi et al., 2003;
Choi et al., 2009), 3H-digoxin a cardiac glycoside and a substrate for Oatps and P-gp
(Goralski et al., 2003), 14
C-doxorubicin, an anthracycline antibiotic used in cancer
chemotherapy and substrate of P-gp (Chan et al., 2004), and 3H-verapamil, a calcium
channel blocker and substrate of P-gp (Chan et al., 2004). Digoxin (0.5 mg/kg) was
administered via intra-peritoneal injection, benzylpenicillin (5 mg/kg CTL, 1 mg/kg CRF)
via intra-muscular injection, and doxorubicin (5mg/kg) (Hsieh et al., 2008) and verapamil
(0.1 mg/kg) (Hendrikse et al., 1998) were administered in the tail-vein. All were injected
Copyright © 2012 by The American Society for Pharmacology and Experimental Therapeutics
146
with an approximate 1:1500 hot/cold ratio so the mg amount of radioactive compound
wouldn’t factor into the final dosage calculation. To evaluate cerebral accumulation, similar
plasma concentrations of drugs need to be attained and therefore CRF rats received a lower
dose of benzylpenicillin because of its reduced clearance in CRF. Rats were anesthetized
using isoflurane 30 minutes (doxorubicin), 60 minutes (verapamil) or 2 hours
(benzylpenicillin and digoxin) post-injection and a cardiac puncture was performed to
recover the maximum volume of blood in heparinised tubes to obtain plasma. Brains were
harvested, rinsed in cold phosphate buffered saline, weighted, minced and placed in 2 mL
of Solvable solution (PerkinElmer, Waltham, MA) at 56°C overnight. Dissolved brain
volumes were noted and radioactivity was counted on a Wallac 1409 beta-counter (Perkin
Elmer) in 1 mL of dissolved brain tissue and 2 mL of plasma after addition of 4 mL
ScintiSafe Plus Scintillant (Fisher, Ottawa, Ontario, Canada). The results were calculated as
a ratio between the radioactivity count (CPM) for 1 g of brain tissue and the radioactivity
count for 1mL of plasma. The mean for the CTL groups was arbitrarily defined as 100%.
Effects of Uremic Serum on Brain Drug Transporters
In order to determine whether uremic serum could affect the expression and
function of blood-brain-barrier drug transporters, we incubated rat brain endothelial cells
(RBEC) and astrocytes with serum from nephrectomised rat and evaluated the drug
transporters’ protein expression.
Isolation and Culture of Rat Astrocytes
Rat astrocytes were isolated and cultured as previously described by Perriere et al.
(Booher and Sensenbrenner, 1972; Perriere et al., 2005). When cells reached confluency,
the standard culture medium was changed to culture medium containing 10% serum from
either control or nephrectomised rats (1 serum/flask). After 48 h of culture, the culture
medium was recovered under sterile conditions to be used for RBEC conditioning and cells
Copyright © 2012 by The American Society for Pharmacology and Experimental Therapeutics
147
were trypsinized, pelleted and homogenized in phosphate buffered saline containing 0.1
mM PMSF. Protein concentrations were determined using the Micro BCA Protein Assay
Kit from Thermo Fisher Scientific (Rockford, IL). 100 ug was loaded for Western Blot
analysis of each studied transporter.
Isolation and Culture of Rat Brain Endothelial Cells (RBEC)
Rat brain endothelial cells (RBEC) were isolated and puromycin-purified for 72 h as
previously published (Perriere et al., 2005). Culture medium was then changed, for a 24 h
period, to endothelial cell basal medium (ECBM) containing 20% bovine plasma-derived
serum (BPDS), 2 ng/mL basic fibroblast growth factor (bFGF), 500 ng/mL hydrocortisone
(HC) and 1% Penstrep (a mixture of 20 000 U/mg penicillin and streptomycin)(Perriere et
al., 2005). Four days after seeding, the culture medium was again changed to a 50/50 mix
of pre-described ECBM culture medium and culture medium recovered from astrocyte
cultures containing 10% foetal bovine serum to simulate co-culture with astrocytes. Finally,
the culture medium was changed 48h later to a new 50/50 mix of pre-described ECBM
containing 20% serum from CTL or nephrectomised rats and astrocyte pre-conditioned
medium with sera from CTL of CRF rats. 8-(4-chlorophenylthio)-cAMP (250 µmol/L) and
the cAMP phosphodiesterase-4-specific inhibitor RO 20 1724 (17.5 µmol/L) were added to
the final mix. After 48 h of culture, cells were trypsinized, pelleted and homogenized in
phosphate buffered saline containing 0.1 mM PMSF. Protein concentrations were
determined using the Micro BCA Protein Assay Kit from Thermo Fisher Scientific
(Rockford, IL). 100 ug were loaded for Western Blot analysis of each studied transporter.
Other Assays.
Blood and urine chemistries were determined with an Architect C1600 clinical analyzer
(Abbott, Saint-Laurent, QC, Canada).
Copyright © 2012 by The American Society for Pharmacology and Experimental Therapeutics
148
Statistical Analysis.
Results are expressed as mean SD. Differences between groups were assessed
using an unpaired Student’s t test or an ANOVA test. Significant ANOVA was followed by
a Scheffe post hoc comparison of groups. The threshold of significance was p0.05.
Copyright © 2012 by The American Society for Pharmacology and Experimental Therapeutics
149
4. RESULTS
Biochemical Parameters and Body Weight in Control and CRF Rats
Table XIII presents the biochemical parameters and body weights of both groups of
rats. Compared to control animals, CRF rats had higher levels of serum creatinine and urea
and lower creatinine clearance (reduced by 80%, p0.001). There was no difference in
body weight between control and CRF rats.
Protein Expression of Brain Drug Transporters in CRF Rats
Figure 22 presents the measured protein expression of various drug transporters in crude
brain membranes of control and CRF rats. The expression level of Bcrp, Mrp2, Mrp4, Oat3,
Oatp2, Oatp3 and P-gp were significantly decreased from 20 to 50% in CRF rat crude brain
membranes as shown by Western blot. The only measured protein that remained stable was
Mrp5. We found significant correlations between protein expression and the rat clearance
of creatinine for Bcrp (R=0.426, p<0.05), Mrp2 (R=0.798, p<0.001), Mrp4 (R=0.594,
p<0.005), Oat3 (R=0.557, p<0.05), Oatp2 (R=0.626, p<0.01), Oatp3 (R=0.566, p<0.005)
and P-gp (R=0.587, p<0.005).
mRNA Expression of Brain Drug Transporters in CRF Rats.
Figure 23 presents results from the analysis of mRNA coding for brain drug transporters.
There was significant decreases in the expression of Bcrp (35%), Mrp2 (40%), Mrp4
(30%), Oat3 (40%), Oatp2 (35%), Oatp3 (70%) and P-gp (35%) mRNA in CRF rats brain
compared to controls. Again, only Mrp5 mRNA remained stable between the groups.
Copyright © 2012 by The American Society for Pharmacology and Experimental Therapeutics
150
In Vivo Accumulation of Radiolabelled Drugs in the Brain of Rats With Surgically-
induced Chronic Renal Failure.
Two hours post-administration, digoxin plasma radioactivity was similar in control and
CRF rats, while the plasma radioactivity of benzylpenicillin was slightly elevated by 17%
in CRF rats compared to control animals. There was 33% less 14
C-benzylpenicillin in the
brain of CRF rats (Figure 24). On the other hand, no significant differences in 3H-digoxin,
14C-doxorubicin or
3H-verapamil brain accumulation were observed between CTL and CRF
rats. These data were obtained via a ratio of radioactivity for 1 g of brain tissue/1 mL of
plasma.
Protein Expression of Drug Transporters in Rat Brain Endothelial Cells (RBEC)
Incubated With Serum From CRF Rats.
Protein expression of drug transporters was measured in rat brain endothelial cells
incubated for 48 h with serum from control or CRF animals (Figure 5). There was a
significant decrease in the expression of Bcrp (40%), Mrp2 (25%), Mrp4 (45%), Oat3
(35%), Oatp2 (35%), Oatp3 (25%) and P-gp (30%) protein when incubated with CRF
serum compared to controls. On the other hand, the expression of Mrp5 was unaltered.
These results were similar to those obtained in vivo in CRF rats.
Protein Expression of Drug Transporters in Rat Astrocytes Incubated With Serum From
CRF Rats.
Protein expression of drug transporters was measured in rat astrocytes incubated for 48 h
with serum from control or CRF animals (Figure 6). Significant decreases in the expression
of Bcrp (25%), Mrp2 (25%), Mrp4 (30%), Oat3 (60%), Oatp2 (40%), Oatp3 (50%) and
P-gp (30%) protein were observed when incubated with CRF serum compared to controls.
The expression of Mrp5 remained unaltered. These results were similar to those obtained
in vivo in CRF rats.
Copyright © 2012 by The American Society for Pharmacology and Experimental Therapeutics
151
5. DISCUSSION
This study demonstrated a significant (20-50%) decrease in protein and mRNA
expression of Bcrp, Mrp2 and 4, Oat3, Oatp2 and 3, and P-gp in crude rat brain membranes
from CRF rats compared to CTL rats, while Mrp5 was unchanged. Similar reductions were
observed in RBEC and astrocytes incubated with serum from nephrectomised rat serum,
compared to control. Influx and efflux drug transporters expression at the BBB and in the
brain thus seem equally affected by CRF. As for BBB permeability, we observed a 30%
decrease in the BBB permeability to benzylpenicillin in nephrectomised rats and no change
in the BBB permeability to digoxin, doxorubicin and verapamil as measured by their
brain/plasma radioactivity ratio.
We found significant correlations between the clearance of creatinine and the
expression of all downregulated transporters at the protein level indicating that the changes
in transporters are related to the severity of the renal failure. Also, we have demonstrated
that the modifications in drug transporter expression occurred in response to one or many
factors present in the sera from uremic rats in at least two brain cell types, as demonstrated
by the changes in protein expression of transporters in astrocytes and RBEC, which are
similar to those observed in CRF rats’ brain biopsies.
To our knowledge, no group has studied the impact of renal failure on the expression
of brain drug transporters. However, many studies have reported a change in drug
transporters in various organs in CRF (Huang et al., 2000; Laouari et al., 2001; Sun et al.,
2004; Sun et al., 2006; Naud et al., 2007; Naud et al., 2008; Naud et al., 2011). In some of
these studies, uremic circulating factors seemed involved in the expression and activity
changes. While no specific factor has been identified, many potential factors include uremic
toxins such as CMPF, IS or PAH and proinflammatory cytokines which are known to be
elevated in CRF (Oettinger et al., 1994; Sunder-Plassmann et al., 1994; Ziesche et al., 1994;
Akahoshi et al., 1995; Higuchi et al., 1997). Indeed, uremic toxins have been shown to inhibit
Copyright © 2012 by The American Society for Pharmacology and Experimental Therapeutics
152
drug uptake by Oat1, Oat3 and Oatp2 in the rat liver, kidney and brain (Deguchi et al., 2004;
Sun et al., 2004; Deguchi et al., 2006; Sun et al., 2006). Also, proinflammatory cytokines
such as interleukin-1β (IL-1β), IL-6 and tumor necrosis factor α (TNFα) can modulate drug
transporters’ expression and activity in various organs including at the BBB (Petrovic et al.,
2007; Morgan et al., 2008). For example, in vitro studies have demonstrated that IL-1β and
IL-6 can decrease the expression of P-gp and Bcrp in brain capillaries endothelial cells and
that IL-6 can decrease P-gp expression in cultured rat astrocytes (Ronaldson and Bendayan,
2006; von Wedel-Parlow et al., 2009; Poller et al., 2010). Proinflammatory cytokines could
thus play a role in the BBB drug transporters’ expression downregulation observed in CRF.
Despite significant decreases of brain transporter expression in CRF rats, we did not
observe in vivo brain accumulation of 3 different substrates, namely digoxin, doxorubicin
and verapamil. Such discrepancy has also been observed in inflammation studies. Indeed,
previously published data demonstrated that systemic inflammation, as seen in CRF,
moderately downregulated (-24%) the protein expression of P-gp at the BBB 6h after the
induction of inflammation by endotoxin (Zhao et al., 2002). In that study, P-gp expression
returned to normal 24h post-inflammation (Zhao et al., 2002). They observed increased
plasma and brain concentrations of doxorubicin in mice 6h after the induction of
inflammation compared to control. However, endotoxin-induced systemic inflammation did
not significantly change the brain/plasma concentration ratio of doxorubicin (Zhao et al.,
2002). The authors thus conclude that endotoxin-induced systemic inflammation has no
effect on BBB integrity and doxorubicin transport across the blood–brain barrier in mice
(Zhao et al., 2002). Also, another study demonstrated that central nervous system
inflammation produces a 50% decrease in P-gp mRNA expression and an almost 100%
decrease in Oatp2 mRNA in the rat brain 6h post-induction (Goralski et al., 2003). This
group used 3H-digoxin as a probe for P-gp function in vivo and observed, 6 and 24h post
inflammation induction, an increase in brain and plasma 3H-radioactivity (Goralski et al.,
2003). However, the brain/plasma radioactivity ratio was unchanged (Goralski et al., 2003).
Copyright © 2012 by The American Society for Pharmacology and Experimental Therapeutics
153
Based on these results, and since CRF is a state of chronic inflammation, it could explain
why, like Zhao and Goralski, we observe decreased protein and mRNA expression of P-gp
and Oatp2 in the brain of nephrectomised rats but no intracerebral accumulation of digoxin,
doxorubicin or verapamil.
We also observed a 30% decrease in the BBB permeability to benzylpenicillin in
nephrectomised rats compared to controls as measured by the total brain/plasma
radioactivity ratio. In vitro, studies showed that benzylpenicillin is a substrate of Mrp2 and
Oat3, but no blood to brain transporter has been identified (Kikuchi et al., 2003; Choi et al.,
2009). As mentioned earlier, Oat3 is involved in the transport of uremic toxins from the
brain (Ohtsuki et al., 2002; Kikuchi et al., 2003; Tahara et al., 2005; Deguchi et al., 2006).
In fact, this transporter is typically thought to play a role in the efflux of drugs from the
brain. However, a recent study hypothesized that it is also involved in the uptake of
Ro 64-0802, a pharmacologically active form of oseltamivir, from the blood to the brain
(Ose et al., 2009). It could, thus, be responsible for the blood to brain uptake of substrates
like benzylpenicillin or uremic toxins as well as for their brain to blood transport. This
hypothesis is supported by a study performed in the 1960s that demonstrated that
probenecid, a well known Oat3 inhibitor, limits the entry of benzylpenicillin into rat brain
as shown by a decrease in brain/plasma concentration ratio of benzylpenicillin when
co-administered with probenecid (Fishman, 1966). The 30% decrease in the brain/blood
radioactivity ratio of benzylpenicillin observed in the brain of nephrectomised rats indicates
a more efficient efflux of the drug compared to its uptake. However, Mrp2 (efflux) and
Oat3 (influx and efflux) were equally reduced by 40% in the brain of nephrectomised rats
compared to controls. If the hypothesis of Oat3 involvement in the blood to brain influx of
benzylpenicillin and uremic toxins is correct, the greater functional reduction in
benzylpenicillin brain uptake could be attributed to competition with accumulating uremic
toxins such as CMPF, IS and PAH for blood to brain transport by Oat3 preventing
benzylpenicillin entry into the brain. However, it is also possible that Mrp2 plays a more
Copyright © 2012 by The American Society for Pharmacology and Experimental Therapeutics
154
important functional role in the BBB permeability of benzylpenicillin causing a greater
efflux of the drug compared to its influx.
In conclusion, even though we reported significant reductions in the expression of
influx and efflux brain drug transporters, it appears that the BBB integrity and permeability
to drugs is preserved in renal failure as shown by the unchanged intra-cerebral
accumulation of digoxin, doxorubicin and verapamil and by the reduced accumulation of
benzylpenicillin.
Copyright © 2012 by The American Society for Pharmacology and Experimental Therapeutics
155
6. AUTHORSHIP CONTRIBUTIONS
Participated in research design: Naud, Laurin, Pichette
Conducted experiments: Naud, Michaud, Beauchemin, Leblond, Laurin
Performed data analysis: Naud, Leblond, Pichette
Wrote or contributed to the writing of the manuscript: Naud, Leblond, Pichette
Copyright © 2012 by The American Society for Pharmacology and Experimental Therapeutics
156
7. REFERENCES
Akahoshi T, Kobayashi N, Hosaka S, Sekiyama N, Wada C and Kondo H (1995) In-vivo
induction of monocyte chemotactic and activating factor in patients with chronic
renal failure. Nephrol Dial Transplant 10:2244-2249.
Alpay H, Altun O and Biyikli NK (2004) Cefepime-induced non-convulsive status
epilepticus in a peritoneal dialysis patient. Pediatr Nephrol 19:445-447.
Booher J and Sensenbrenner M (1972) Growth and cultivation of dissociated neurons and
glial cells from embryonic chick, rat and human brain in flask cultures.
Neurobiology 2:97-105.
Chan LM, Lowes S and Hirst BH (2004) The ABCs of drug transport in intestine and liver:
efflux proteins limiting drug absorption and bioavailability. Eur J Pharm Sci 21:25-
51.
Chatellier D, Jourdain M, Mangalaboyi J, Ader F, Chopin C, Derambure P and Fourrier F
(2002) Cefepime-induced neurotoxicity: an underestimated complication of
antibiotherapy in patients with acute renal failure. Intensive Care Med 28:214-217.
Choi MK, Kim H, Han YH, Song IS and Shim CK (2009) Involvement of Mrp2/MRP2 in
the species different excretion route of benzylpenicillin between rat and human.
Xenobiotica 39:171-181.
Chow EC, Sun H, Khan AA, Groothuis GM and Pang KS (2010) Effects of 1alpha,25-
dihydroxyvitamin D3 on transporters and enzymes of the rat intestine and kidney in
vivo. Biopharm Drug Dispos 31:91-108.
Ci L, Kusuhara H, Adachi M, Schuetz JD, Takeuchi K and Sugiyama Y (2007)
Involvement of MRP4 (ABCC4) in the luminal efflux of ceftizoxime and cefazolin
in the kidney. Mol Pharmacol 71:1591-1597.
Deeken JF and Loscher W (2007) The blood-brain barrier and cancer: transporters,
treatment, and Trojan horses. Clin Cancer Res 13:1663-1674.
Copyright © 2012 by The American Society for Pharmacology and Experimental Therapeutics
157
Deguchi T, Isozaki K, Yousuke K, Terasaki T and Otagiri M (2006) Involvement of
organic anion transporters in the efflux of uremic toxins across the blood-brain
barrier. J Neurochem 96:1051-1059.
Deguchi T, Kusuhara H, Takadate A, Endou H, Otagiri M and Sugiyama Y (2004)
Characterization of uremic toxin transport by organic anion transporters in the
kidney. Kidney Int 65:162-174.
Eyal S, Hsiao P and Unadkat JD (2009) Drug interactions at the blood-brain barrier: fact or
fantasy? Pharmacol Ther 123:80-104.
Ferrara N, Abete P, Giordano M, Ferrara P, Carnovale V, Leosco D, Beneduce F,
Ciarambino T, Varricchio M and Rengo F (2003) Neurotoxicity induced by
Cefepime in a very old hemodialysis patient. Clin Nephrol 59:388-390.
Fishman RA (1966) Blood-brain and CSF barriers to penicillin and related organic acids.
Arch Neurol 15:113-124.
Goralski KB, Hartmann G, Piquette-Miller M and Renton KW (2003) Downregulation of
mdr1a expression in the brain and liver during CNS inflammation alters the in vivo
disposition of digoxin. Br J Pharmacol 139:35-48.
Hendrikse NH, Schinkel AH, de Vries EG, Fluks E, Van der Graaf WT, Willemsen AT,
Vaalburg W and Franssen EJ (1998) Complete in vivo reversal of P-glycoprotein
pump function in the blood-brain barrier visualized with positron emission
tomography. Br J Pharmacol 124:1413-1418.
Higuchi T, Yamamoto C, Kuno T, Mizuno M, Takahashi S and Kanmatsuse K (1997)
Increased production of interleukin-1beta and interleukin-1 receptor antagonist by
peripheral blood mononuclear cells in undialyzed chronic renal failure. Nephron
76:26-31.
Hsieh YJ, Chang CH, Huang SP, Lin CW, Wang MN, Wu YT, Chen YJ and Tsai TH
(2008) Effect of cyclosporin A on the brain regional distribution of doxorubicin in
rats. Int J Pharm 350:265-271.
Copyright © 2012 by The American Society for Pharmacology and Experimental Therapeutics
158
Huang ZH, Murakami T, Okochi A, Yumoto R, Nagai J and Takano M (2000) Expression
and function of P-glycoprotein in rats with glycerol-induced acute renal failure. Eur
J Pharmacol 406:453-460.
Kikuchi R, Kusuhara H, Sugiyama D and Sugiyama Y (2003) Contribution of organic
anion transporter 3 (Slc22a8) to the elimination of p-aminohippuric acid and
benzylpenicillin across the blood-brain barrier. J Pharmacol Exp Ther 306:51-58.
Kusuhara H and Sugiyama Y (2005) Active efflux across the blood-brain barrier: role of
the solute carrier family. NeuroRx 2:73-85.
Laouari D, Yang R, Veau C, Blanke I and Friedlander G (2001) Two apical multidrug
transporters, P-gp and MRP2, are differently altered in chronic renal failure. Am J
Physiol Renal Physiol 280:F636-645.
Leblond F, Guevin C, Demers C, Pellerin I, Gascon-Barre M and Pichette V (2001)
Downregulation of hepatic cytochrome P450 in chronic renal failure. J Am Soc
Nephrol 12:326-332.
Leblond FA, Petrucci M, Dube P, Bernier G, Bonnardeaux A and Pichette V (2002)
Downregulation of intestinal cytochrome p450 in chronic renal failure. J Am Soc
Nephrol 13:1579-1585.
Livak KJ and Schmittgen TD (2001) Analysis of relative gene expression data using real-
time quantitative PCR and the 2(-Delta Delta C(T)) Method. Methods 25:402-408.
Loscher W and Potschka H (2005a) Blood-brain barrier active efflux transporters: ATP-
binding cassette gene family. NeuroRx 2:86-98.
Loscher W and Potschka H (2005b) Drug resistance in brain diseases and the role of drug
efflux transporters. Nat Rev Neurosci 6:591-602.
Loscher W and Potschka H (2005c) Role of drug efflux transporters in the brain for drug
disposition and treatment of brain diseases. Prog Neurobiol 76:22-76.
Lowry OH, Rosebrough NJ, Farr AL and Randall RJ (1951) Protein measurement with the
folin phenol reagent. J Biol Chem 193:265-275.
Copyright © 2012 by The American Society for Pharmacology and Experimental Therapeutics
159
Morgan ET, Goralski KB, Piquette-Miller M, Renton KW, Robertson GR, Chaluvadi MR,
Charles KA, Clarke SJ, Kacevska M, Liddle C, Richardson TA, Sharma R and Sinal
CJ (2008) Regulation of drug-metabolizing enzymes and transporters in infection,
inflammation, and cancer. Drug Metab Dispos 36:205-216.
Mori S, Ohtsuki S, Takanaga H, Kikkawa T, Kang YS and Terasaki T (2004) Organic
anion transporter 3 is involved in the brain-to-blood efflux transport of thiopurine
nucleobase analogs. J Neurochem 90:931-941.
Mori S, Takanaga H, Ohtsuki S, Deguchi T, Kang YS, Hosoya K and Terasaki T (2003)
Rat organic anion transporter 3 (rOAT3) is responsible for brain-to-blood efflux of
homovanillic acid at the abluminal membrane of brain capillary endothelial cells. J
Cereb Blood Flow Metab 23:432-440.
Naud J, Michaud J, Beauchemin S, Hebert MJ, Roger M, Lefrancois S, Leblond FA and
Pichette V (2011) Effects of chronic renal failure on kidney drug transporters and
cytochrome p450 in rats. Drug Metab Dispos 39:1363-1369.
Naud J, Michaud J, Boisvert C, Desbiens K, Leblond FA, Mitchell A, Jones C,
Bonnardeaux A and Pichette V (2007) Down-regulation of intestinal drug
transporters in chronic renal failure in rats. J Pharmacol Exp Ther 320:978-985.
Naud J, Michaud J, Leblond FA, Lefrancois S, Bonnardeaux A and Pichette V (2008)
Effects of chronic renal failure on liver drug transporters. Drug Metab Dispos
36:124-128.
Nozaki Y, Kusuhara H, Kondo T, Hasegawa M, Shiroyanagi Y, Nakazawa H, Okano T and
Sugiyama Y (2007) Characterization of the uptake of organic anion transporter
(OAT) 1 and OAT3 substrates by human kidney slices. J Pharmacol Exp Ther
321:362-369.
Oettinger CW, Bland LA, Oliver JC, Arduino MJ, McAllister SK and Favero MS (1994)
The effect of uremia on tumor necrosis factor-alpha release after an in vitro whole-
blood endotoxin challenge. J Am Soc Nephrol 4:1890-1895.
Copyright © 2012 by The American Society for Pharmacology and Experimental Therapeutics
160
Ohtsuki S, Asaba H, Takanaga H, Deguchi T, Hosoya K, Otagiri M and Terasaki T (2002)
Role of blood-brain barrier organic anion transporter 3 (OAT3) in the efflux of
indoxyl sulfate, a uremic toxin: its involvement in neurotransmitter metabolite
clearance from the brain. J Neurochem 83:57-66.
Ohtsuki S and Terasaki T (2007) Contribution of carrier-mediated transport systems to the
blood-brain barrier as a supporting and protecting interface for the brain;
importance for CNS drug discovery and development. Pharm Res 24:1745-1758.
Ose A, Ito M, Kusuhara H, Yamatsugu K, Kanai M, Shibasaki M, Hosokawa M, Schuetz
JD and Sugiyama Y (2009) Limited brain distribution of [3R,4R,5S]-4-acetamido-
5-amino-3-(1-ethylpropoxy)-1-cyclohexene-1-carboxylate phosphate (Ro 64-0802),
a pharmacologically active form of oseltamivir, by active efflux across the blood-
brain barrier mediated by organic anion transporter 3 (Oat3/Slc22a8) and multidrug
resistance-associated protein 4 (Mrp4/Abcc4). Drug Metab Dispos 37:315-321.
Epub 2008 Nov 2024.
Ose A, Kusuhara H, Endo C, Tohyama K, Miyajima M, Kitamura S and Sugiyama Y
(2010) Functional characterization of mouse organic anion transporting peptide 1a4
in the uptake and efflux of drugs across the blood-brain barrier. Drug Metab Dispos
38:168-176.
Oswald S, Grube M, Siegmund W and Kroemer HK (2007) Transporter-mediated uptake
into cellular compartments. Xenobiotica 37:1171-1195.
Perriere N, Demeuse P, Garcia E, Regina A, Debray M, Andreux JP, Couvreur P,
Scherrmann JM, Temsamani J, Couraud PO, Deli MA and Roux F (2005)
Puromycin-based purification of rat brain capillary endothelial cell cultures. Effect
on the expression of blood-brain barrier-specific properties. J Neurochem 93:279-
289.
Petrovic V, Teng S and Piquette-Miller M (2007) Regulation of drug transporters during
infection and inflammation. Mol Interv 7:99-111.
Copyright © 2012 by The American Society for Pharmacology and Experimental Therapeutics
161
Poller B, Drewe J, Krahenbuhl S, Huwyler J and Gutmann H (2010) Regulation of BCRP
(ABCG2) and P-glycoprotein (ABCB1) by cytokines in a model of the human
blood-brain barrier. Cell Mol Neurobiol 30:63-70.
Ronaldson PT and Bendayan R (2006) HIV-1 viral envelope glycoprotein gp120 triggers
an inflammatory response in cultured rat astrocytes and regulates the functional
expression of P-glycoprotein. Mol Pharmacol 70:1087-1098.
Sun H, Frassetto L and Benet LZ (2006) Effects of renal failure on drug transport and
metabolism. Pharmacol Ther 109:1-11.
Sun H, Huang Y, Frassetto L and Benet LZ (2004) Effects of uremic toxins on hepatic
uptake and metabolism of erythromycin. Drug Metab Dispos 32:1239-1246.
Sunder-Plassmann G, Kapiotis S, Gasche C and Klaar U (1994) Functional characterization
of cytokine autoantibodies in chronic renal failure patients. Kidney Int 45:1484-
1488.
Tahara H, Shono M, Kusuhara H, Kinoshita H, Fuse E, Takadate A, Otagiri M and
Sugiyama Y (2005) Molecular cloning and functional analyses of OAT1 and OAT3
from cynomolgus monkey kidney. Pharm Res 22:647-660.
Ueo H, Motohashi H, Katsura T and Inui K (2005) Human organic anion transporter
hOAT3 is a potent transporter of cephalosporin antibiotics, in comparison with
hOAT1. Biochem Pharmacol 70:1104-1113.
von Wedel-Parlow M, Wolte P and Galla HJ (2009) Regulation of major efflux transporters
under inflammatory conditions at the blood-brain barrier in vitro. J Neurochem
111:111-118.
Zhao YL, Du J, Kanazawa H, Sugawara A, Takagi K, Kitaichi K, Tatsumi Y and Hasegawa
T (2002) Effect of endotoxin on doxorubicin transport across blood-brain barrier
and P-glycoprotein function in mice. Eur J Pharmacol 445:115-123.
Ziesche R, Roth M, Papakonstantinou E, Nauck M, Horl WH, Kashgarian M and Block LH
(1994) A granulocyte inhibitory protein overexpressed in chronic renal disease
Copyright © 2012 by The American Society for Pharmacology and Experimental Therapeutics
162
regulates expression of interleukin 6 and interleukin 8. Proc Natl Acad Sci U S A
91:301-305.
Copyright © 2012 by The American Society for Pharmacology and Experimental Therapeutics
163
8. FOOTNOTES
This work was financed La Fondation Hôpital Maisonneuve-Rosemont (La néphrologie et
son Impact). V Pichette is supported by a career award from FRSQ.
Reprint requests should be sent to: Vincent Pichette MD Ph.D.
Centre de recherche de l’hôpital Maisonneuve-Rosemont
5415 boul. de l’Assomption, Montréal, Québec, Canada
H1T 2M4
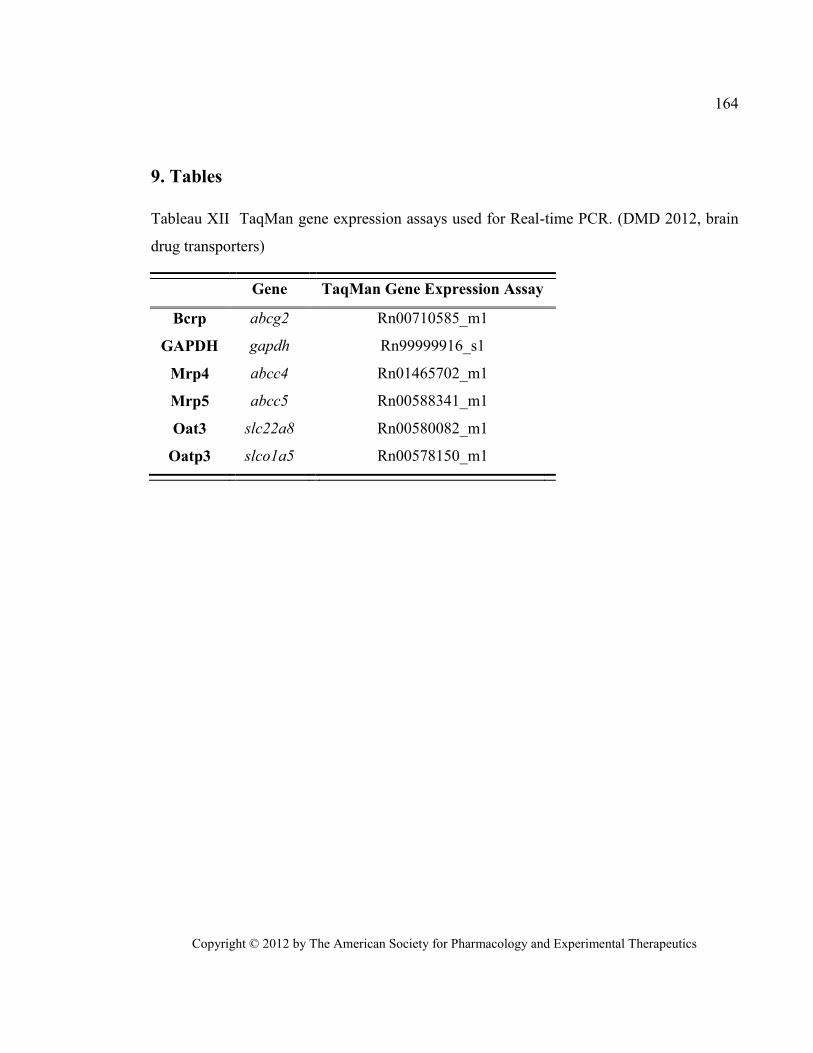
Copyright © 2012 by The American Society for Pharmacology and Experimental Therapeutics
164
9. Tables
Tableau XII TaqMan gene expression assays used for Real-time PCR. (DMD 2012, brain
drug transporters)
Gene TaqMan Gene Expression Assay
Bcrp abcg2 Rn00710585_m1
GAPDH gapdh Rn99999916_s1
Mrp4 abcc4 Rn01465702_m1
Mrp5 abcc5 Rn00588341_m1
Oat3 slc22a8 Rn00580082_m1
Oatp3 slco1a5 Rn00578150_m1
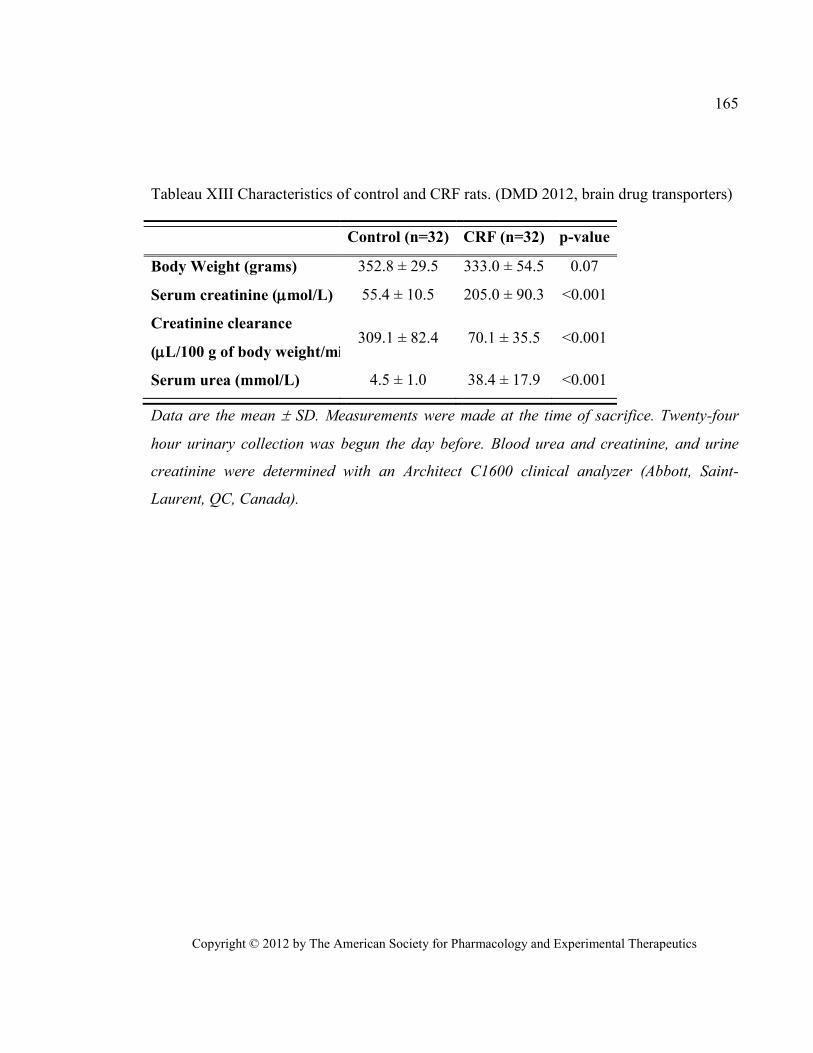
Copyright © 2012 by The American Society for Pharmacology and Experimental Therapeutics
165
Tableau XIII Characteristics of control and CRF rats. (DMD 2012, brain drug transporters)
Control (n=32) CRF (n=32) p-value
Body Weight (grams) 352.8 ± 29.5 333.0 ± 54.5 0.07
Serum creatinine (mol/L) 55.4 ± 10.5 205.0 ± 90.3 <0.001
Creatinine clearance
(L/100 g of body weight/min) 309.1 ± 82.4 70.1 ± 35.5 <0.001
Serum urea (mmol/L) 4.5 ± 1.0 38.4 ± 17.9 <0.001
Data are the mean SD. Measurements were made at the time of sacrifice. Twenty-four
hour urinary collection was begun the day before. Blood urea and creatinine, and urine
creatinine were determined with an Architect C1600 clinical analyzer (Abbott, Saint-
Laurent, QC, Canada).
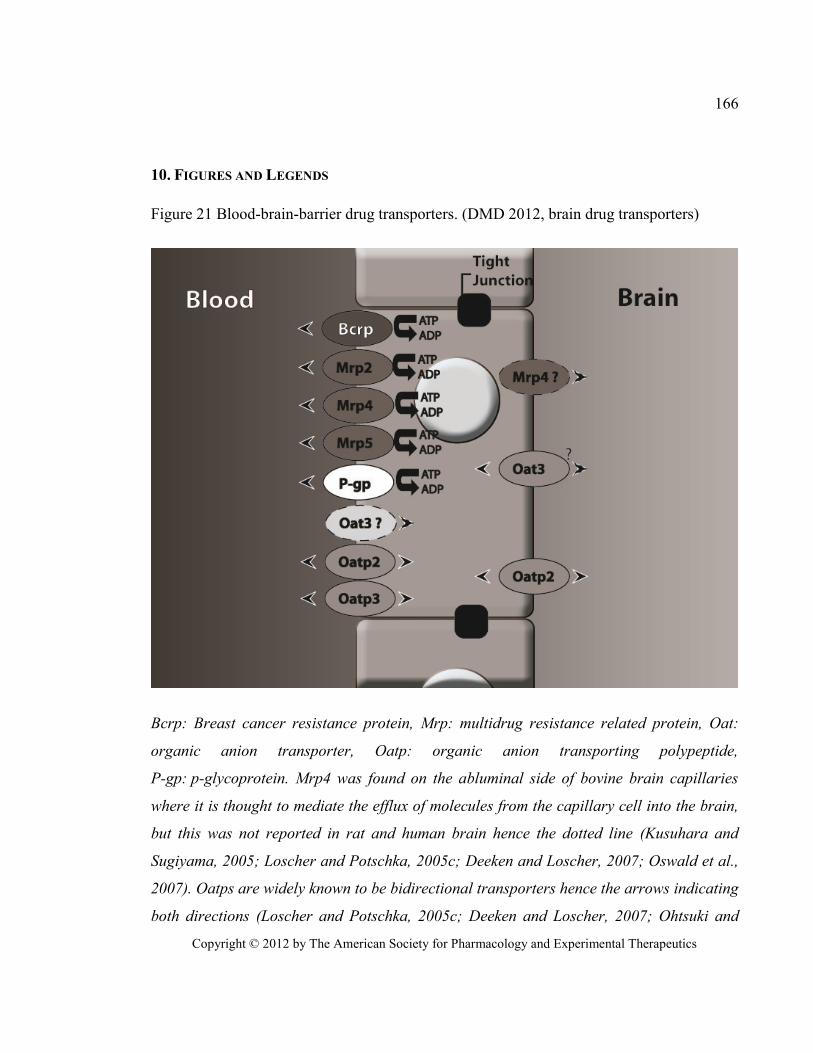
Copyright © 2012 by The American Society for Pharmacology and Experimental Therapeutics
166
10. FIGURES AND LEGENDS
Figure 21 Blood-brain-barrier drug transporters. (DMD 2012, brain drug transporters)
Bcrp: Breast cancer resistance protein, Mrp: multidrug resistance related protein, Oat:
organic anion transporter, Oatp: organic anion transporting polypeptide,
P-gp: p-glycoprotein. Mrp4 was found on the abluminal side of bovine brain capillaries
where it is thought to mediate the efflux of molecules from the capillary cell into the brain,
but this was not reported in rat and human brain hence the dotted line (Kusuhara and
Sugiyama, 2005; Loscher and Potschka, 2005c; Deeken and Loscher, 2007; Oswald et al.,
2007). Oatps are widely known to be bidirectional transporters hence the arrows indicating
both directions (Loscher and Potschka, 2005c; Deeken and Loscher, 2007; Ohtsuki and
Copyright © 2012 by The American Society for Pharmacology and Experimental Therapeutics
167
Terasaki, 2007; Ose et al., 2010). It was recently hypothesized that Oat3 mediates import
and export from the brain (Ose et al., 2009). Figure based on information from (Kikuchi et
al., 2003; Mori et al., 2003; Kusuhara and Sugiyama, 2005; Loscher and Potschka, 2005c;
Deeken and Loscher, 2007; Ohtsuki and Terasaki, 2007; Oswald et al., 2007; Eyal et al.,
2009; Ose et al., 2009).
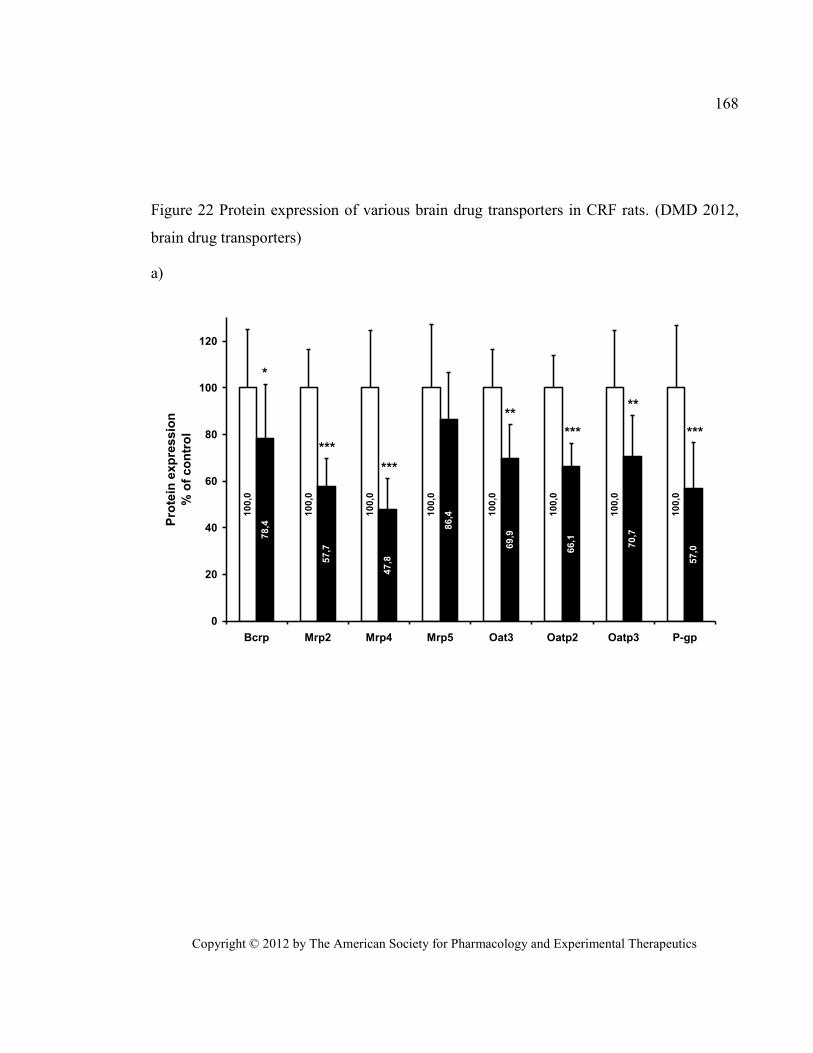
Copyright © 2012 by The American Society for Pharmacology and Experimental Therapeutics
168
Figure 22 Protein expression of various brain drug transporters in CRF rats. (DMD 2012,
brain drug transporters)
a)
10
0,0
10
0,0
10
0,0
10
0,0
10
0,0
10
0,0
10
0,0
10
0,0
78
,4
57
,7
47
,8
86
,4
69
,9
66
,1
70
,7
57
,0
0
20
40
60
80
100
120
Bcrp Mrp2 Mrp4 Mrp5 Oat3 Oatp2 Oatp3 P-gp
Pro
tein
ex
pre
ss
ion
% o
f c
on
tro
l
***
***
*** ***
****
*
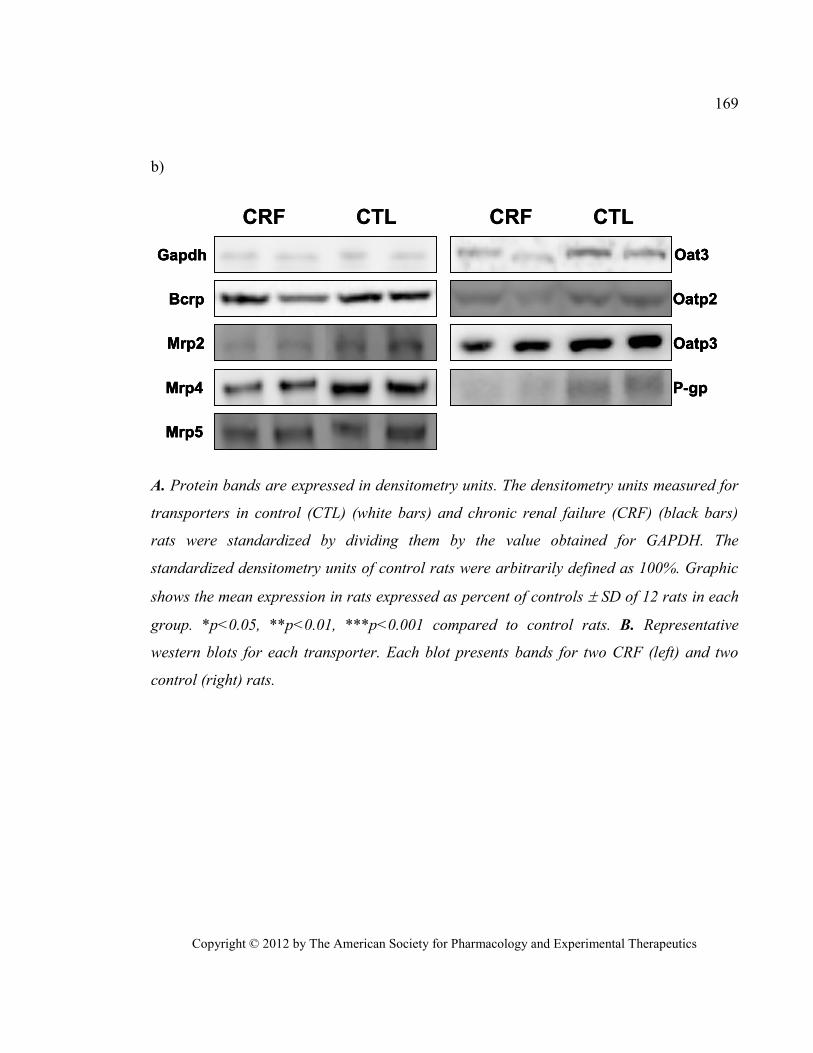
Copyright © 2012 by The American Society for Pharmacology and Experimental Therapeutics
169
b)
P-gp
Mrp2
Mrp4
Mrp5
Oat3
Oatp2
Oatp3
Gapdh
CRF CTL CRF CTL
Bcrp
P-gpP-gp
Mrp2Mrp2
Mrp4Mrp4
Mrp5Mrp5
Oat3Oat3
Oatp2Oatp2
Oatp3Oatp3
GapdhGapdh
CRF CTL CRF CTL
BcrpBcrp
A. Protein bands are expressed in densitometry units. The densitometry units measured for
transporters in control (CTL) (white bars) and chronic renal failure (CRF) (black bars)
rats were standardized by dividing them by the value obtained for GAPDH. The
standardized densitometry units of control rats were arbitrarily defined as 100%. Graphic
shows the mean expression in rats expressed as percent of controls SD of 12 rats in each
group. *p<0.05, **p<0.01, ***p<0.001 compared to control rats. B. Representative
western blots for each transporter. Each blot presents bands for two CRF (left) and two
control (right) rats.
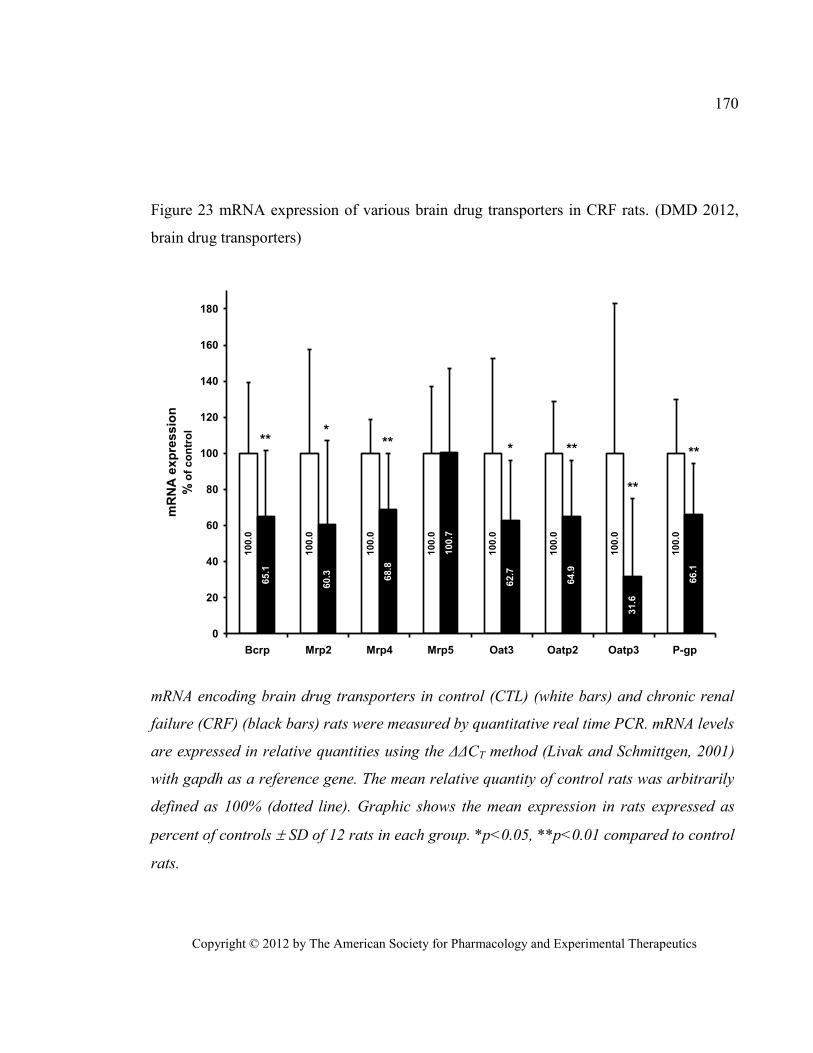
Copyright © 2012 by The American Society for Pharmacology and Experimental Therapeutics
170
Figure 23 mRNA expression of various brain drug transporters in CRF rats. (DMD 2012,
brain drug transporters) 100.0
100.0
100.0
100.0
100.0
100.0
100.0
100.0
65.1
60.3 68.8
100.7
62.7
64.9
31.6
66.1
0
20
40
60
80
100
120
140
160
180
Bcrp Mrp2 Mrp4 Mrp5 Oat3 Oatp2 Oatp3 P-gp
mR
NA
ex
pre
ss
ion
% o
f co
ntr
ol *
*
**
** ** ****
mRNA encoding brain drug transporters in control (CTL) (white bars) and chronic renal
failure (CRF) (black bars) rats were measured by quantitative real time PCR. mRNA levels
are expressed in relative quantities using the ΔΔCT method (Livak and Schmittgen, 2001)
with gapdh as a reference gene. The mean relative quantity of control rats was arbitrarily
defined as 100% (dotted line). Graphic shows the mean expression in rats expressed as
percent of controls SD of 12 rats in each group. *p<0.05, **p<0.01 compared to control
rats.
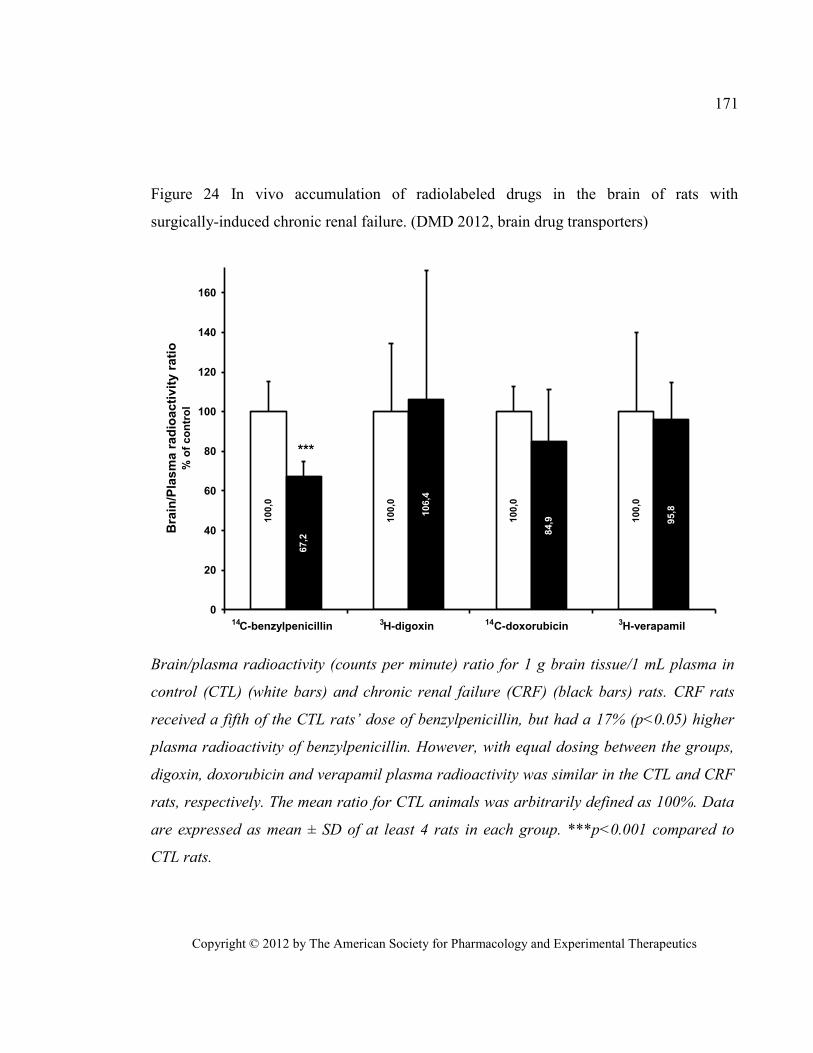
Copyright © 2012 by The American Society for Pharmacology and Experimental Therapeutics
171
Figure 24 In vivo accumulation of radiolabeled drugs in the brain of rats with
surgically-induced chronic renal failure. (DMD 2012, brain drug transporters)
100,0
100,0
100,0
100,0
67,2
106,4
84,9 9
5,8
0
20
40
60
80
100
120
140
160
C-benzylpenicillin H-digoxin C-doxorubicin H-verapamil
Bra
in/P
las
ma
ra
dio
ac
tiv
ity
ra
tio
% o
f co
ntr
ol
***
14 3 14 3
Brain/plasma radioactivity (counts per minute) ratio for 1 g brain tissue/1 mL plasma in
control (CTL) (white bars) and chronic renal failure (CRF) (black bars) rats. CRF rats
received a fifth of the CTL rats’ dose of benzylpenicillin, but had a 17% (p<0.05) higher
plasma radioactivity of benzylpenicillin. However, with equal dosing between the groups,
digoxin, doxorubicin and verapamil plasma radioactivity was similar in the CTL and CRF
rats, respectively. The mean ratio for CTL animals was arbitrarily defined as 100%. Data
are expressed as mean ± SD of at least 4 rats in each group. ***p<0.001 compared to
CTL rats.
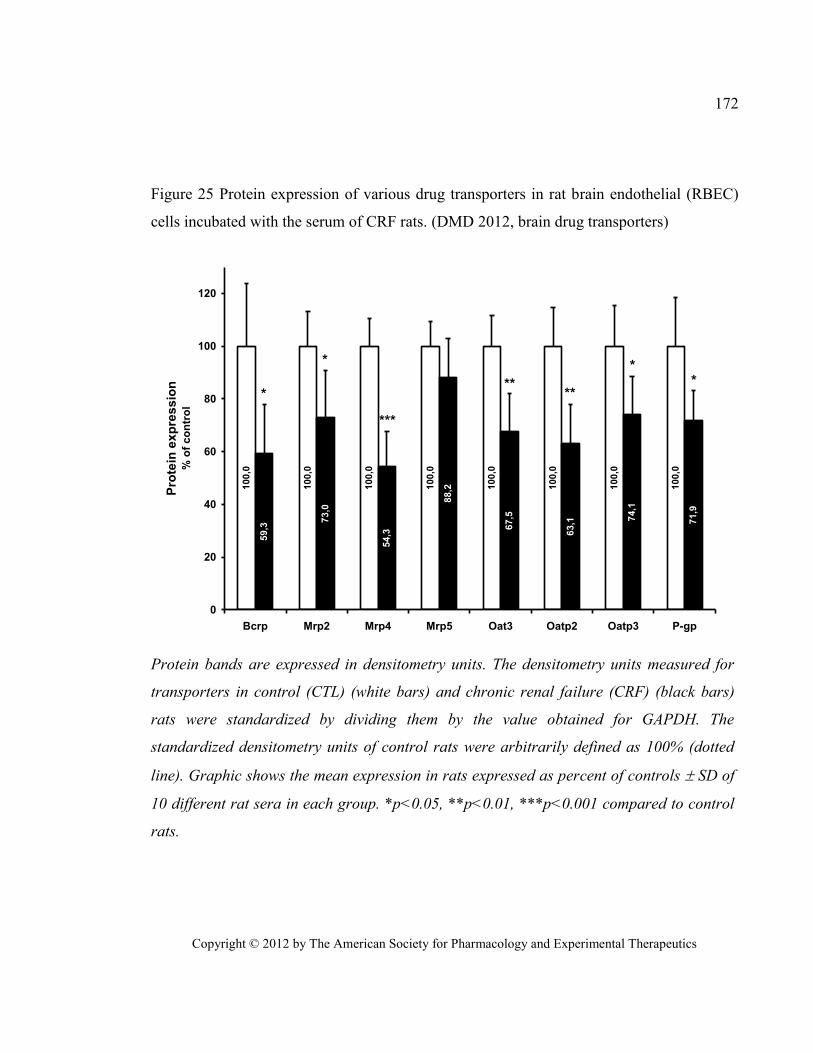
Copyright © 2012 by The American Society for Pharmacology and Experimental Therapeutics
172
Figure 25 Protein expression of various drug transporters in rat brain endothelial (RBEC)
cells incubated with the serum of CRF rats. (DMD 2012, brain drug transporters)
100,0
100,0
100,0
100,0
100,0
100,0
100,0
100,0
59,3
73,0
54,3
88,2
67,5
63,1 7
4,1
71,9
0
20
40
60
80
100
120
Bcrp Mrp2 Mrp4 Mrp5 Oat3 Oatp2 Oatp3 P-gp
Pro
tein
ex
pre
ss
ion
% o
f co
ntr
ol
***
* ****
***
Protein bands are expressed in densitometry units. The densitometry units measured for
transporters in control (CTL) (white bars) and chronic renal failure (CRF) (black bars)
rats were standardized by dividing them by the value obtained for GAPDH. The
standardized densitometry units of control rats were arbitrarily defined as 100% (dotted
line). Graphic shows the mean expression in rats expressed as percent of controls SD of
10 different rat sera in each group. *p<0.05, **p<0.01, ***p<0.001 compared to control
rats.
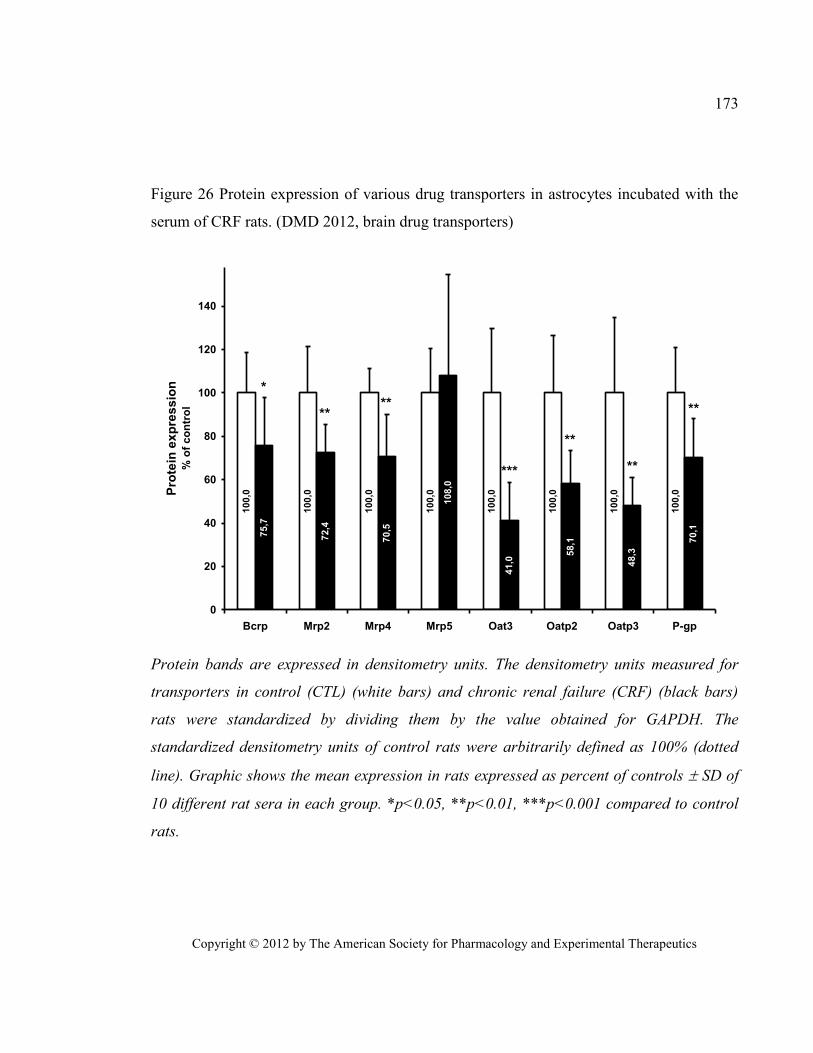
Copyright © 2012 by The American Society for Pharmacology and Experimental Therapeutics
173
Figure 26 Protein expression of various drug transporters in astrocytes incubated with the
serum of CRF rats. (DMD 2012, brain drug transporters)
100,0
100,0
100,0
100,0
100,0
100,0
100,0
100,0
75,7
72,4
70,5
108,0
41,0
58,1
48,3
70,1
0
20
40
60
80
100
120
140
Bcrp Mrp2 Mrp4 Mrp5 Oat3 Oatp2 Oatp3 P-gp
Pro
tein
ex
pre
ss
ion
% o
f co
ntr
ol
****
**
**
**
***
*
Protein bands are expressed in densitometry units. The densitometry units measured for
transporters in control (CTL) (white bars) and chronic renal failure (CRF) (black bars)
rats were standardized by dividing them by the value obtained for GAPDH. The
standardized densitometry units of control rats were arbitrarily defined as 100% (dotted
line). Graphic shows the mean expression in rats expressed as percent of controls SD of
10 different rat sera in each group. *p<0.05, **p<0.01, ***p<0.001 compared to control
rats.
Copyright © 2009 by The Journal of the American Society of Nephrology
ESRD impairs nonrenal clearance of fexofenadine but not
midazolam
J Am Soc Nephrol, 2009. 20(10): p. 2269-76.
Reprinted with permission from the American Society of Nephrology. All rights reserved.
Copyright © 2009 by The Journal of the American Society of Nephrology
Copyright © 2009 by The Journal of the American Society of Nephrology
175
Impaired Nonrenal Clearance of Fexofenadine but Not Midazolam in Patients
with End-Stage Renal Disease
Authors:
Thomas D. Nolin,* Reginald F. Frye,† Phuong Le,‡ Hooman Sadr,§ Judith Naud,‖
Francois A. Leblond, ‖ Vincent Pichette, ‖ and Jonathan Himmelfarb¶
Affiliations:
*Department of Pharmacy & Therapeutics, University of Pittsburgh School of
Pharmacy, Pittsburgh, PA, USA; †Department of Pharmacotherapy and Translational
Research, and Center for Pharmacogenomics, University of Florida College of Pharmacy,
Gainesville, FL, USA; ‡Center for Clinical and Translational Research, Maine Medical
Center Research Institute, Scarborough, ME, USA; §Tidewater Kidney Specialists,
Norfolk, VA, USA; ‖ Service de Néphrologie et Centre de Recherche, Hôpital
Maisonneuve-Rosemont, and Département de Pharmacologie, Université de Montréal,
Montréal, Québec, Canada; ¶Kidney Research Institute, and Division of Nephrology,
Department of Medicine, University of Washington, Seattle, WA, USA
Running Title: Impaired Nonrenal Clearance in ESRD
Word Counts: Abstract: 227 (250 limit) Text: 2536 (3000 limit)
*Corresponding Author: Thomas D. Nolin, Pharm.D., Ph.D.
University of Pittsburgh School of Pharmacy
Department of Pharmacy & Therapeutics
Copyright © 2009 by The Journal of the American Society of Nephrology
176
1. ABSTRACT
ESRD can affect the pharmacokinetic disposition of drugs subject to nonrenal
clearance. Cytochrome P450 (CYP) enzymes, including CYP3A, and multiple intestinal
and hepatic drug transporters are thought to mediate this process, but the extent to which
kidney disease alters the function of these proteins in humans is unknown. We used
midazolam and fexofenadine to assess CYP3A (intestinal and hepatic) and drug transport,
respectively, in patients with ESRD and healthy control subjects. We evaluated the effect of
uremia on CYP3A and transporter expression in vitro by incubating normal rat hepatocytes
and enterocytes with serum drawn from study participants. ESRD dramatically reduced
nonrenal transporter function, evidenced by a 63% decrease in clearance (P < 0.001) and a
2.8-fold increase in area under the plasma concentration–time curve for
fexofenadine (P < 0.002), compared with control subjects. We did not observe significant
differences in midazolam or 1`-hydroxymidazolam clearance or area under the curve after
oral administration, suggesting that CYP3A function is not changed by ESRD. Changes in
hepatocyte and enterocyte protein expression in the presence of uremic serum were
consistent with in vivo results. These findings demonstrate a mechanism for altered drug
disposition in kidney disease, which may partially account for the high rates of drug
toxicity in this population.
Copyright © 2009 by The Journal of the American Society of Nephrology
177
2. INTRODUCTION
The prevalence of chronic kidney disease (CKD) in the adult US population was
recently estimated to be >13%, and the number of patients with ESRD continues to rise
rapidly (Coresh et al., 2007). Patients with CKD and particularly ESRD require numerous
medications, are at high risk for drug accumulation and toxicity, and experience a high rate
of adverse drug events (Bates et al., 1999; Evans et al., 2005; Manley et al., 2005). Mild,
moderate, and advanced CKD (i.e., stages 2 through 5) have been shown to affect the
disposition of drugs subject to nonrenal clearance (CLNR) in both humans and animal
models (Nolin et al., 2008). As depicted in Figure 27, CLNR is mediated in large part by the
concerted actions of cytochrome P450 (CYP) metabolic enzymes such as CYP3A4 and
CYP3A5 (collectively CYP3A), multiple drug transporters including the cellular efflux
transporter P-glycoprotein (P-gp), and uptake transporters known as organic anion-
transporting polypeptides (OATPs) (Sun et al., 2006); however, the manner and extent to
which individual pathways of nonrenal clearance are affected in humans with CKD is
largely unknown.
Determination of which drug-metabolizing enzymes or transporters are affected in
humans with kidney disease is inherently complicated. There is a complex interplay
between enzymes and transporters in the liver, intestine, and other extrarenal organs,
making it difficult to interpret clinical pharmacokinetic data mechanistically. Published
studies to date have not simultaneously and separately evaluated the function of individual
pathways of drug metabolism and transport in multiple organs in patients with ESRD. We
hypothesized that uremia differentially affects the functional expression of drug
metabolizing enzymes and transporters, which may explain the seeming inconsistent effects
of uremia on the clinical pharmacokinetics of various intravenously and orally administered
CYP and transporter substrates (Nolin et al., 2008).
Copyright © 2009 by The Journal of the American Society of Nephrology
178
To elucidate the physiologic mechanism by which kidney disease affects the
nonrenal clearance of drugs in humans, we phenotypically evaluated hepatic and intestinal
CYP3A-mediated metabolism and drug transporter activity in patients with ESRD. We
investigated the clinical pharmacokinetics of midazolam, a pharmacologic probe of CYP3A
metabolism, and fexofenadine, a nonspecific probe of drug transport, in vivo, and we
assessed the effect of uremic serum on the expression of Cyp3a, Oatp, and P-gp in rat
hepatocyte and enterocyte cultures.
Copyright © 2009 by The Journal of the American Society of Nephrology
179
3. RESULTS
Study Participants
A total of 10 patients with ESRD (all white, six male) and 10 healthy control
subjects without kidney disease (all white, six male) participated in this study. The patients
with ESRD were 51.5 ± 15.6 yr of age; weighed 78.1 ± 20.0 kg; and had a body mass index
(BMI) of 27.1 ± 4.9 kg/m2, a Kt/V urea value of 1.8 ± 0.3, a blood urea nitrogen (BUN)
concentration of 47.8 ± 8.7 mg/dl, and a serum creatinine (SCR) concentration of 7.5 ± 1.6
mg/dl. Control subjects were 45.9 ± 13.2 yr of age; weighed 87.8 ± 33.0 kg; and had a BMI
of 26.4 ± 3.0 kg/m2, a BUN concentration of 14.4 ± 2.2 mg/dl, a SCR concentration of 0.9 ±
0.1 mg/dl, and an estimated GFR(Levey et al., 1999) of 83.9 ± 13.4 ml/min per 1.73 m2.
The ESRD and control groups were well matched, with no significant differences in
demographic variables except kidney function, BUN, and SCR.
Effect of ESRD on the Pharmacokinetics of Fexofenadine
Mean fexofenadine plasma concentration–time curves observed in patients with
ESRD and control subjects are depicted in Figure 28, and the corresponding
pharmacokinetic parameters are presented in Table XIV. The findings in control subjects
are comparable to the results of previous studies of healthy subjects (Lemma et al., 2006;
Robertson et al., 2008). Fexofenadine clearance after oral administration (CL/F), where F is
the bioavailability, was 63% slower, 102.8 ± 37.9 L/h in control subjects to 37.9 ± 19.5 L/h
(P < 0.001) in patients with ESRD, leading to a 2.8-fold higher fexofenadine area under the
plasma concentration–time curve from 0 to infinity (AUC0 to ∞) in patients with
ESRD (P < 0.001; Figure 28). A corresponding 35% longer fexofenadine half-life was also
observed (3.4 < 0.9 h in control subjects to 4.6 ± 1.3 h in patients with ESRD; P < 0.019);
maximum plasma concentration (Cmax) was 74% higher (P < 0.023), and the time Cmax
occurred (tmax) was not significantly different.
Copyright © 2009 by The Journal of the American Society of Nephrology
180
Effect of ESRD on the Pharmacokinetics of Midazolam and 1`-Hydroxymidazolam
No significant differences were observed in the midazolam and
1`-hydroxymidazolam pharmacokinetic parameters after oral administration in patients with
ESRD compared with healthy control subjects (Table XV), which resulted in nearly
superimposable plasma concentration–time curves in the two groups (Figure 29).
Midazolam CL/F values were 88.9 ± 24.6 and 96.9 ± 46.8 L/h in control subjects and
patients with ESRD, respectively (NS), similar to what has been reported previously in
healthy subjects (Thummel et al., 1996; Masica et al., 2004; Robertson et al., 2008).
Expression of Oatp, P-gp, and Cyp3a in Rat Hepatocytes and Enterocytes Incubated with
Serum from Patients with ESRD
There was a 29% decrease (P < 0.05) in Oatp1a4 and a 37% increase (P < 0.05) in
P-gp protein expression in normal hepatocytes incubated with uremic serum compared with
control serum, whereas Cyp3a2 protein expression was not affected (Figure 30A). Uremic
serum also significantly decreased P-gp (48%; P < 0.05) and Cyp3a2 (32%; P < 0.05)
protein expression in enterocytes compared with control serum and did not affect Oatp1a5
protein expression (Figure 30B).
Copyright © 2009 by The Journal of the American Society of Nephrology
181
4. DISCUSSION
We present a phenotypic assessment of hepatic and intestinal CYP3A and
transporter function in patients who had ESRD and were receiving conventional
hemodialysis and demonstrate that whereas fexofenadine clearance after oral administration
is significantly reduced, midazolam clearance after oral administration is not significantly
altered in patients with ESRD. These results suggest that nonrenal transporter function
(likely intestinal P-gp and/or hepatic OATP) is dramatically reduced, whereas intestinal and
hepatic CYP3A function is similar in patients with ESRD compared with healthy control
subjects. Changes in protein expression observed in hepatocytes and enterocytes incubated
with serum from study participants are consistent with these in vivo findings and suggest
that kidney disease differentially affects these clearance pathways in the liver and
gastrointestinal tract. These data establish a specific uremic phenotype at a molecular and
cellular level in vivo, which has proved difficult in patients with kidney disease (Meyer and
Hostetter, 2007).
The short-acting benzodiazepine midazolam was used as a selective phenotypic
probe of CYP3A (Lee et al., 2002) in this study, because it is metabolized predominantly to
1`-hydroxymidazolam by both CYP3A4 and CYP3A5 (Lin et al., 2002), and, unlike many
CYP3A substrates, it is neither a P-gp nor an OATP substrate (Kim et al., 1999). No
significant differences in the oral midazolam and 1`-hydroxymidazolam pharmacokinetic
parameters based on total drug concentrations (protein bound plus unbound) were observed
in patients with ESRD compared with healthy control subjects (Table XV). These findings
contrast with those of Vinik et al. (Vinik et al., 1983), who reported higher clearance of
intravenously administered midazolam (based on total drug concentrations) in hemodialysis
patients than in matched healthy control subjects; however, after correction for protein
binding changes, midazolam pharmacokinetic parameters were nearly identical in the two
groups (Vinik et al., 1983). Overall, these data suggest that neither hepatic nor intestinal
Copyright © 2009 by The Journal of the American Society of Nephrology
182
CYP3A function is substantially altered in patients who have ESRD and receive
conventional hemodialysis therapy.
Several studies using experimental models have suggested that kidney disease leads
to decreased activity of hepatic and intestinal CYP3A secondary to reduced gene and
protein expression (Leblond et al., 2001; Leblond et al., 2002), findings that differ from this
in vivo human study. These discrepancies may be due to the more sustained, severe degree
of uremia often observed in experimental models, in which, for example, plasma urea
nitrogen concentrations have been reported to range from >100 to >500 mg/dl (Guevin et
al., 2002; Michaud et al., 2005). These concentrations are considerably higher than are
observed in well-dialyzed patients, and our study participants had mean BUN
concentrations of 47.8 ± 8.7 mg/dl. It is also possible that dialysis depletes serum of uremic
toxins, which may directly affect CYP3A, thereby normalizing CYP3A function.
Previous phenotypic assessments of CLNR in patients with ESRD using the
14C-erythromycin breath test (ErBT) have been reported (Dowling et al., 2003), and we
recently demonstrated that hemodialysis acutely improves ErBT results, suggesting that
erythromycin clearance is increased after dialysis (Nolin et al., 2006). The ErBT is based
on the principle that radiolabeled 14
C-erythromycin undergoes N-demethylation by
CYP3A4, and the demethylated carbon (14
C) rapidly appears in breath as 14
CO2 (Watkins,
1994). According to the standard interpretation, a decrease in ErBT results (i.e., decreased
excretion of 14
CO2) translates into a reduction in CYP3A4 activity, and vice versa.
Although the ErBT is a widely used phenotypic trait measure long considered a specific
index of hepatic CYP3A4 activity, recent data indicated that erythromycin undergoes
OATP uptake and P-gp efflux in addition to CYP3A4 metabolism (Kurnik et al., 2006;
Frassetto et al., 2007). It is now recognized that considerable overlapping substrate
specificity and complex interplay exist between CYP3A and transporters (Lam et al.,
2006), such that alterations in transporters but not CYP3A, per se, may result in significant
changes in the clinical pharmacokinetics of many CYP3A substrates (Frassetto et al., 2007;
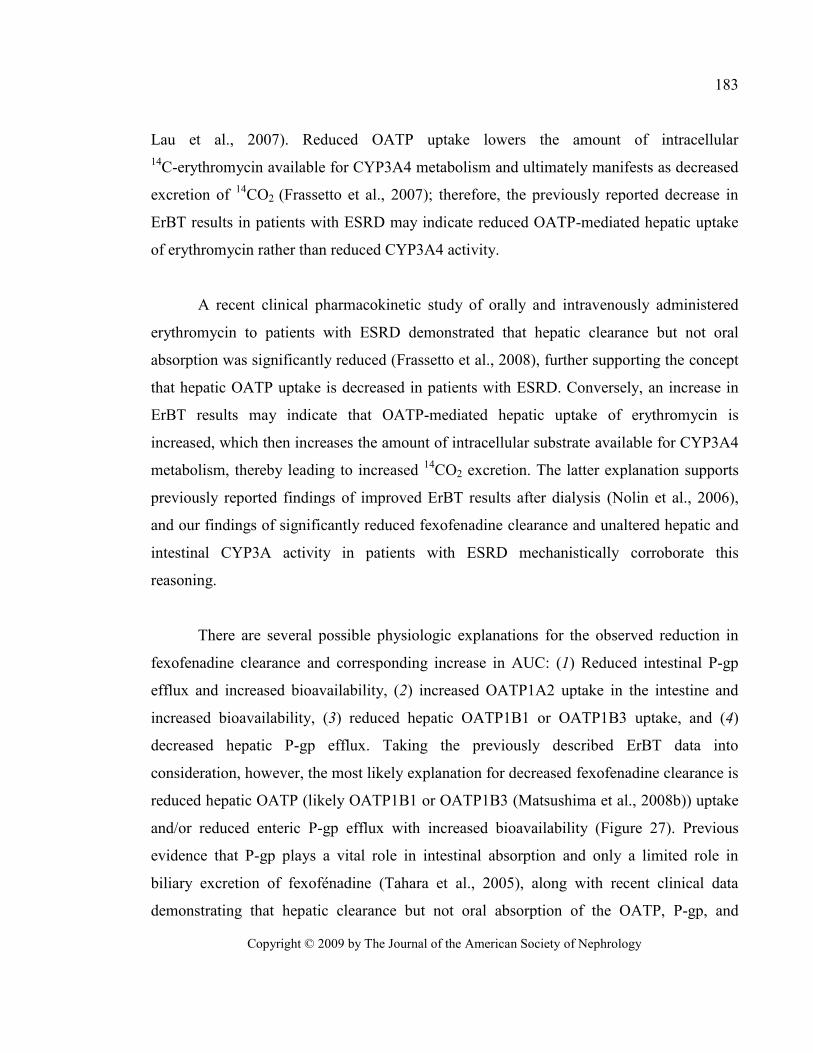
Copyright © 2009 by The Journal of the American Society of Nephrology
183
Lau et al., 2007). Reduced OATP uptake lowers the amount of intracellular
14C-erythromycin available for CYP3A4 metabolism and ultimately manifests as decreased
excretion of 14
CO2 (Frassetto et al., 2007); therefore, the previously reported decrease in
ErBT results in patients with ESRD may indicate reduced OATP-mediated hepatic uptake
of erythromycin rather than reduced CYP3A4 activity.
A recent clinical pharmacokinetic study of orally and intravenously administered
erythromycin to patients with ESRD demonstrated that hepatic clearance but not oral
absorption was significantly reduced (Frassetto et al., 2008), further supporting the concept
that hepatic OATP uptake is decreased in patients with ESRD. Conversely, an increase in
ErBT results may indicate that OATP-mediated hepatic uptake of erythromycin is
increased, which then increases the amount of intracellular substrate available for CYP3A4
metabolism, thereby leading to increased 14
CO2 excretion. The latter explanation supports
previously reported findings of improved ErBT results after dialysis (Nolin et al., 2006),
and our findings of significantly reduced fexofenadine clearance and unaltered hepatic and
intestinal CYP3A activity in patients with ESRD mechanistically corroborate this
reasoning.
There are several possible physiologic explanations for the observed reduction in
fexofenadine clearance and corresponding increase in AUC: (1) Reduced intestinal P-gp
efflux and increased bioavailability, (2) increased OATP1A2 uptake in the intestine and
increased bioavailability, (3) reduced hepatic OATP1B1 or OATP1B3 uptake, and (4)
decreased hepatic P-gp efflux. Taking the previously described ErBT data into
consideration, however, the most likely explanation for decreased fexofenadine clearance is
reduced hepatic OATP (likely OATP1B1 or OATP1B3 (Matsushima et al., 2008b)) uptake
and/or reduced enteric P-gp efflux with increased bioavailability (Figure 27). Previous
evidence that P-gp plays a vital role in intestinal absorption and only a limited role in
biliary excretion of fexofénadine (Tahara et al., 2005), along with recent clinical data
demonstrating that hepatic clearance but not oral absorption of the OATP, P-gp, and
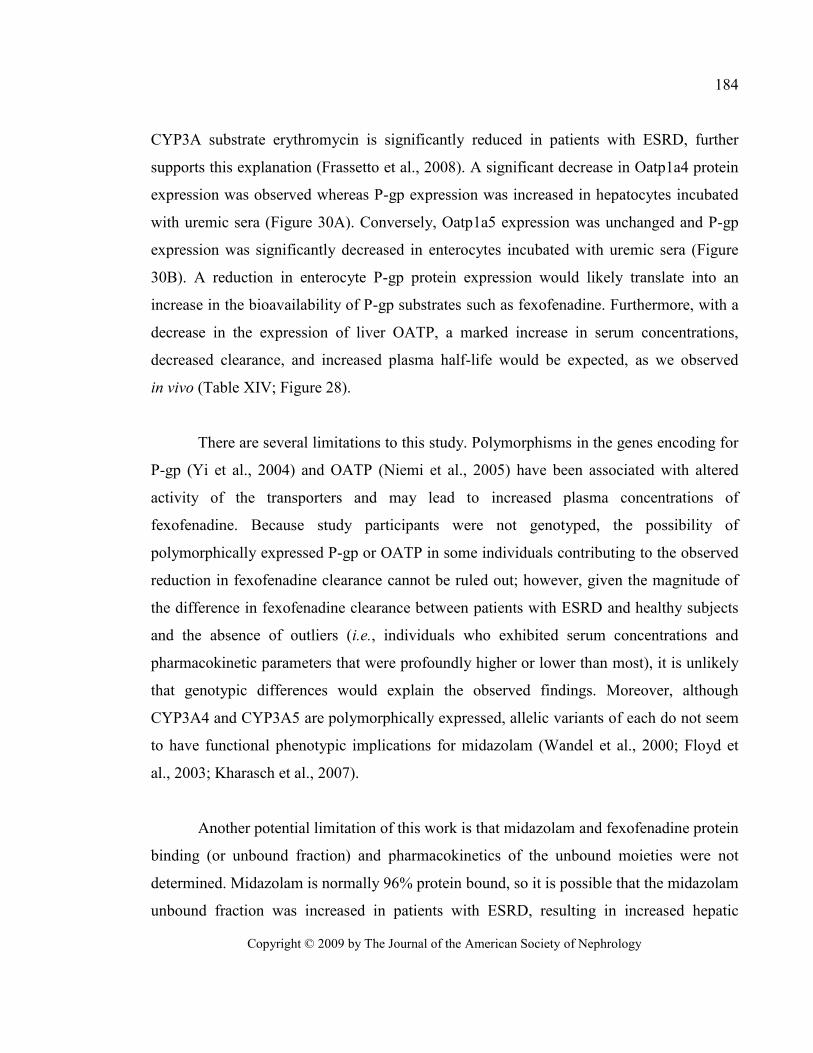
Copyright © 2009 by The Journal of the American Society of Nephrology
184
CYP3A substrate erythromycin is significantly reduced in patients with ESRD, further
supports this explanation (Frassetto et al., 2008). A significant decrease in Oatp1a4 protein
expression was observed whereas P-gp expression was increased in hepatocytes incubated
with uremic sera (Figure 30A). Conversely, Oatp1a5 expression was unchanged and P-gp
expression was significantly decreased in enterocytes incubated with uremic sera (Figure
30B). A reduction in enterocyte P-gp protein expression would likely translate into an
increase in the bioavailability of P-gp substrates such as fexofenadine. Furthermore, with a
decrease in the expression of liver OATP, a marked increase in serum concentrations,
decreased clearance, and increased plasma half-life would be expected, as we observed
in vivo (Table XIV; Figure 28).
There are several limitations to this study. Polymorphisms in the genes encoding for
P-gp (Yi et al., 2004) and OATP (Niemi et al., 2005) have been associated with altered
activity of the transporters and may lead to increased plasma concentrations of
fexofenadine. Because study participants were not genotyped, the possibility of
polymorphically expressed P-gp or OATP in some individuals contributing to the observed
reduction in fexofenadine clearance cannot be ruled out; however, given the magnitude of
the difference in fexofenadine clearance between patients with ESRD and healthy subjects
and the absence of outliers (i.e., individuals who exhibited serum concentrations and
pharmacokinetic parameters that were profoundly higher or lower than most), it is unlikely
that genotypic differences would explain the observed findings. Moreover, although
CYP3A4 and CYP3A5 are polymorphically expressed, allelic variants of each do not seem
to have functional phenotypic implications for midazolam (Wandel et al., 2000; Floyd et
al., 2003; Kharasch et al., 2007).
Another potential limitation of this work is that midazolam and fexofenadine protein
binding (or unbound fraction) and pharmacokinetics of the unbound moieties were not
determined. Midazolam is normally 96% protein bound, so it is possible that the midazolam
unbound fraction was increased in patients with ESRD, resulting in increased hepatic
Copyright © 2009 by The Journal of the American Society of Nephrology
185
clearance; however, in a previous study, unbound midazolam concentrations and
corresponding pharmacokinetic parameters were nearly identical in patients with ESRD and
healthy control subjects (Vinik et al., 1983). Because the majority of patients with ESRD
are functionally anuric, urine could not be collected for determination of
1`-hydroxymidazolam formation clearance to confirm in vivo findings of unaltered
midazolam systemic clearance.
Although this study was well powered to detect a difference in fexofenadine
clearance between patients with ESRD and control subjects, the power to detect a
difference in midazolam clearance (the primary surrogate of CYP3A activity) was
sufficient only to detect a comparatively large difference (50%); however, this magnitude
of difference in midazolam clearance is consistent with moderate inhibitors of CYP3A
activity (e.g., diltiazem, fluconazole) and is more likely to be clinically relevant than
differences of smaller magnitude. Thus, we cannot entirely exclude the possibility that a
true difference exists in midazolam clearance between well dialyzed patients with ESRD
and healthy control subjects; however, given that we observed nearly superimposable
plasma concentration–time curves in the two groups for midazolam and
1`-hydroxymidazolam (Figure 29), the magnitude of any true difference in midazolam
clearance is likely to be small.
Fexofenadine is a widely used probe drug for phenotypically assessing P-gp and
OATP in humans (Drescher et al., 2002; Glaeser et al., 2007); however, recent animal
studies suggested that it is also a substrate of multidrug resistance–associated proteins and
the bile salt export pump (Matsushima et al., 2008a; Tian et al., 2008a; Tian et al., 2008b).
Consequently, it is possible that alterations in multidrug resistance–associated protein or
bile salt export pump transport contributed to the reduction in fexofenadine clearance
observed in this study; however, our results clearly show that transporter function is altered
in patients with ESRD and that further study is warranted.
Copyright © 2009 by The Journal of the American Society of Nephrology
186
In conclusion, we present a phenotypic assessment of hepatic and intestinal CYP3A
and transporter function in patients who have ESRD and receive conventional hemodialysis
and demonstrate that transporter function (likely hepatic OATP and/or intestinal P-gp) is
significantly reduced whereas hepatic and intestinal CYP3A function is not affected in
patients with ESRD compared with healthy control subjects. These data establish a specific
in vivo phenotype of uremia at the molecular and cellular levels. Moreover, these results
provide important mechanistic insight for understanding the physiologic effects of uremia
on nonrenal drug metabolism and transport pathways that are critical determinants of drug
disposition, response, and outcome and have direct clinical implications because they may
ultimately lead to a better understanding of optimal drug choices and dosages to maximize
efficacy while minimizing toxicity.
Copyright © 2009 by The Journal of the American Society of Nephrology
187
5. CONCISE METHODS
Study Participants
After providing written informed consent, all participants underwent a screening evaluation
based on complete medical history, physical examination, medication history, and
laboratory testing. Eligibility criteria included age 18 to 70 year, normal hepatic function,
BMI ≤ 35 kg/m2, dialysis Kt/V ≥ 1.20, nonsmoking status, and a negative pregnancy test
for women of child-bearing potential. Kidney function in control subjects was estimated
according to the method of Levey et al. (Levey et al., 1999) (Modification of Diet in Renal
Disease [MDRD] prediction equation). Individuals who had known hepatic or
gastrointestinal disease; were taking drugs or dietary products that are known to inhibit or
induce CYP3A, P-gp, or OATP; or had a known sensitivity or previous adverse reaction to
midazolam or fexofenadine were excluded. Participants were instructed to abstain from
consuming any grapefruit products, alcoholic beverages, herbal supplements/teas, and
over-the-counter remedies for at least 72 h before and during the study day, and
caffeine-containing products were prohibited on the study day.
Study Design
This was an open-labeled, prospective, fixed-order, parallel-group study, which
adhered to the Declaration of Helsinki and was approved by the Maine Medical Center
institutional review board. Patients with ESRD were studied the day after regularly
scheduled hemodialysis. Each patient received 120 mg of fexofenadine (Teva
Pharmaceuticals, Sellersville, PA) orally at time 0, followed by a 2-mg oral dose of
midazolam (1 ml, 2 mg/ml oral syrup; Ranbaxy Pharmaceuticals, Jacksonville, FL) at time
+2 h. Participants fasted overnight before the study day until time +4 h, when they received
a small snack. Standardized meals were given at time +5 and +10 h. Venous blood samples
(3 ml) were collected through an indwelling catheter immediately before and serially after
administration of each probe drug for pharmacokinetic determination as follows: at baseline
Copyright © 2009 by The Journal of the American Society of Nephrology
188
and at 30, 60, 120, 180, 240, 300, 360, 480, and 720 min after oral fexofenadine
administration and immediately before and at 10, 20, 30, 45, 60, 90, 120, 180, and 240 min
after oral midazolam administration. Blood samples were drawn into prechilled EDTA
tubes, kept on ice, and centrifuged within 30 min of collection. Plasma was stored at -80°C
until analysis.
Analytical Assays
The total (protein bound plus unbound) plasma concentrations of midazolam,
1`-hydroxymidazolam, and fexofenadine were determined by liquid chromatography–
tandem mass spectrometry using positive electrospray ionization in the selected reaction
monitoring mode. The liquid chromatography–tandem mass spectrometry system consists
of a Surveyor HPLC autosampler, a Surveyor MS quaternary pump, and a TSQ Quantum
Discovery triple quadruple mass spectrometer (ThermoFinnigan, San Jose, CA).
Midazolam and 1`-Hydroxymidazolam
Briefly, plasma (250 µl) was combined with 2 N sodium hydroxide (100 µl) and
internal standards (30 µl) and vortex-mixed briefly before the addition of methyl tert-butyl
ether (1 ml). Tubes were capped, vortex-mixed, and centrifuged at 20,817 x g for 5 min.
The ether layer was transferred, evaporated under nitrogen, reconstituted with 150 µl of
methanol:water (1:1), and then injected into the system. The mobile phases used for the
analysis were 0.1% formic acid in deionized water (mobile phase A) and 0.1% formic acid
in methanol (mobile phase B), delivered in a gradient at a flow rate of 0.2 ml/min. The
analytical column was a Phenomenex Synergi Polar-RP, 75.0 x 2.0mm, 4-µ column.
TheMSacquisition parameters included a spray voltage of 4.0 kV and heated capillary
temperature at 300°C. Nitrogen was used as the sheath and auxiliary gas and set to 30 and
15 arbitrary units, respectively. The argon collision gas pressure was set to 1.5 mTorr, and
the collision energy was 47 eV for 1`-hydroxymidazolam, 37 eV for midazolam, 38 eV for
alprazolam (1`-hydroxymidazolam internal standard), and 42 eV for diazepam (midazolam
Copyright © 2009 by The Journal of the American Society of Nephrology
189
internal standard). The selected reaction monitoring scheme followed transitions of the
[M+H]+ precursor to selected product ions with the following values: m/z 326.123291.09
for midazolam, m/z 342.103167.90 for 1`-hydroxymidazolam, m/z 309.103281.00 for
alprazolam, and m/z 285.103193.08 for diazepam. The lower limit of quantification for
midazolam and 1`-hydroxymidazolam was 0.2 ng/ml using 0.25 ml of plasma. The
within-run and between-run precision (percentage coefficients of variation) was <7%.
Fexofenadine
Briefly, plasma (100 µl) was combined with acetonitrile (300 µl) containing internal
standard in a Captiva filter plate and vortex-mixed briefly before allowing the inverted
plate to stand at room temperature for 5 min. The filter plate was fitted with a collection
plate before the application of the vacuum; the filtrate was then injected into the system.
The mobile phase was 0.1% formic acid, 5 mM ammonium acetate in deionized water, and
methanol (35:65, vol/vol) delivered at a flow rate of 0.20 ml/min; the column used was a
Phenomenex Gemini, 150.0 x 2.0 mm, 5-µ analytical column. The MS acquisition
parameters included a spray voltage of 4.6 kV and heated capillary temperature of 375°C.
Nitrogen was used as the sheath and auxiliary gas and set to 35 and 10 arbitrary units,
respectively. The argon collision gas pressure was set to 1.5 mTorr, and the collision
energy was 41 eV for both fexofenadine and fexofenadine-D6 (internal standard). The
selected reaction monitoring scheme followed the transitions of m/z 502.33171.0 for
fexofenadine and 508.33177.0 for fexofenadine-D6. The limit of quantification for
fexofenadine was 0.1 ng/ml using 0.1 ml of plasma, and the within-run and between-run
precision was <5%.
Pharmacokinetic Analysis
Fexofenadine pharmacokinetic parameters were estimated from plasma
concentration data using standard noncompartmental methods (WinNonlin Professional
4.1; PharSight Corp., Mountain View, CA). The Cmax, the tmax, and the last plasma
Copyright © 2009 by The Journal of the American Society of Nephrology
190
concentration measured (i.e., the 12-h concentration in plasma [C12]) were obtained directly
from the individual plasma concentration–time profiles. The terminal elimination rate
constant (λz) was estimated by linear regression of the terminal phase of the logarithmic
plasma concentration–time curve. Terminal elimination half-life (t1⁄2) was calculated by
dividing 0.693 by λz. Area under the plasma concentration–time curve from 0 to
12 h (AUC0 to 12) was calculated with the log-linear trapezoidal rule. The AUC0 to ∞ was
calculated as AUC0 to 12 + C12/λz. The CL/F of fexofenadine was calculated as the oral
dosage/AUC0 to ∞. Midazolam and 1`-hydroxymidazolam pharmacokinetic parameters were
also calculated using noncompartmental methods. The AUC0 to 4 was calculated with the
log-linear trapezoidal rule. AUC0 to ∞, Cmax, tmax, λz, t1⁄2, and CL/F were calculated as
described already.
In Vitro Studies
For investigation of the effects of kidney disease on the expression of P-gp, Oatp,
and Cyp3a in liver and intestine, primary cultures of normal rat hepatocytes and enterocytes
were incubated with serum drawn from each patient as described previously (Michaud et
al., 2005; Naud et al., 2007). Hepatocytes were isolated from normal male Sprague-Dawley
rats (Charles River, Saint-Charles, Quebec, Canada) using the two-step liver perfusion
method with minor modification using collagenase type 4 (Worthington, Lakewood, NJ)
for digestion of hepatic tissue, then incubated for 48 h with 2 ml of William’s E medium
containing 10% serum obtained at baseline from patients with ESRD or control subjects
(Guevin et al., 2002; Michaud et al., 2005). Intestinal membrane proteins were prepared
from rat enterocytes as described previously (Naud et al., 2007) using two thirds of the
small intestine, then incubated for 48 h in culture medium containing 10% serum from
patients with ESRD or control subjects. All experiments were conducted according to the
Canadian Council on Animal Care guidelines for care and use of laboratory animals and
under the supervision of our local animal care committee.
Copyright © 2009 by The Journal of the American Society of Nephrology
191
Western Blot Analysis
Protein expression of intestinal and hepatic Cyp3a2 (Leblond et al., 2002), intestinal
P-gp and Oatp1a5, and hepatic P-gp and Oatp1a4 was assessed via Western blotting as
described previously (Naud et al., 2007; Naud et al., 2008). β-Actin and villin were used as
loading controls with hepatocytes and enterocytes, respectively. Immune reaction intensity
was determined by computer-assisted densitometry on a Fujifilm LAS-3000 camera system
coupled to Multi-Gauge software (Fujifilm Life Science USA, Stamford, CT). Every blot
was repeated three times, and results were pooled to obtain the final reported values.
Statistical Analysis
For the in vivo study, determination of the target sample size was based on the
reported between-subject coefficient of variation for fexofenadine CL/F of approximately
26% (Russell et al., 1998). The sample size of n=10 subjects per group was estimated a
priori to have 84% power (two-sided type I error of 0.05) to detect a 37% difference in
fexofenadine clearance. Moreover, on the basis of the reported between-subject coefficient
of variation for midazolam total clearance after oral administration of approximately 36%
(Wandel et al., 2000), a sample size of n=10 subjects per group was estimated a priori to
have 82% power (two-sided type I error of 0.05) to detect a 50% difference in midazolam
clearance. For avoiding the assumption of normally distributed data, group-wise (patients
with ESRD versus control subjects) comparisons of fexofenadine and midazolam
pharmacokinetic parameters were made by the Mann-Whitney U test. Power calculations
were carried out with G*Power 3.0.10 (Faul et al., 2007), and all other statistical
calculations were performed with Prism 4.02 (GraphPad Software, San Diego, CA). Data
are presented as means ± SD unless otherwise noted. For in vitro studies, differences
between groups were assessed by the unpaired two-sided t test or an ANOVA test.
Significant ANOVA was followed by a post hoc Scheffe analysis. P < 0.05 was considered
significant for all comparisons.
Copyright © 2009 by The Journal of the American Society of Nephrology
192
6. ACKNOWLEDGMENTS
This work was supported in part by grants from the Maine Medical Center Research
Institute (T.D.N.), the Satellite Healthcare Research Foundation (T.D.N.), the Canadian
Institute of Health Research (V.P.), and the Fonds de la Recherche en Santé du Québec
(V.P. and J.N.).
This study was presented in part at the annual meeting of the American Society for
Clinical Pharmacology and Therapeutics; April 2 through 5, 2008; Orlando, FL; and has
appeared in abstract form (Clin Pharmacol Ther 83[Suppl 1]: S58, 2008).
During this research, Dr. Nolin was a clinical pharmacologist, Dr. Sadr was a renal
fellow, and Dr. Himmelfarb was Director, Division of Nephrology and Transplantation,
Department of Medicine, Maine Medical Center (Portland, ME).
Copyright © 2009 by The Journal of the American Society of Nephrology
193
7. REFERENCES
Bates DW, Miller EB, Cullen DJ, Burdick L, Williams L, Laird N, Petersen LA, Small SD,
Sweitzer BJ, Vander Vliet M and Leape LL (1999) Patient risk factors for adverse
drug events in hospitalized patients. ADE Prevention Study Group. Arch Intern Med
159:2553-2560.
Coresh J, Selvin E, Stevens LA, Manzi J, Kusek JW, Eggers P, Van Lente F and Levey AS
(2007) Prevalence of chronic kidney disease in the United States. JAMA 298:2038-
2047.
Dowling TC, Briglia AE, Fink JC, Hanes DS, Light PD, Stackiewicz L, Karyekar CS,
Eddington ND, Weir MR and Henrich WL (2003) Characterization of hepatic
cytochrome p4503A activity in patients with end-stage renal disease. Clin
Pharmacol Ther 73:427-434.
Drescher S, Schaeffeler E, Hitzl M, Hofmann U, Schwab M, Brinkmann U, Eichelbaum M
and Fromm MF (2002) MDR1 gene polymorphisms and disposition of the P-
glycoprotein substrate fexofenadine. Br J Clin Pharmacol 53:526-534.
Evans RS, Lloyd JF, Stoddard GJ, Nebeker JR and Samore MH (2005) Risk factors for
adverse drug events: a 10-year analysis. Ann Pharmacother 39:1161-1168.
Faul F, Erdfelder E, Lang AG and Buchner A (2007) G*Power 3: a flexible statistical
power analysis program for the social, behavioral, and biomedical sciences. Behav
Res Methods 39:175-191.
Floyd MD, Gervasini G, Masica AL, Mayo G, George AL, Jr., Bhat K, Kim RB and
Wilkinson GR (2003) Genotype-phenotype associations for common CYP3A4 and
CYP3A5 variants in the basal and induced metabolism of midazolam in European-
and African-American men and women. Pharmacogenetics 13:595-606.
Frassetto LA, Poon S, Tsourounis C, Valera C and Benet LZ (2007) Effects of uptake and
efflux transporter inhibition on erythromycin breath test results. Clin Pharmacol
Ther 81:828-832.
Copyright © 2009 by The Journal of the American Society of Nephrology
194
Frassetto LA, Sun H, Huang Y and Benet LZ (2008) Uremic toxins decrease hepatic
clearance but not oral bioavailability of erythromycin in patients with end stage
renal disease [Abstract]. J Am Soc Nephrol 19:929A.
Glaeser H, Bailey DG, Dresser GK, Gregor JC, Schwarz UI, McGrath JS, Jolicoeur E, Lee
W, Leake BF, Tirona RG and Kim RB (2007) Intestinal drug transporter expression
and the impact of grapefruit juice in humans. Clin Pharmacol Ther 81:362-370.
Guevin C, Michaud J, Naud J, Leblond FA and Pichette V (2002) Down-regulation of
hepatic cytochrome P450 in chronic renal failure: role of uremic mediators. Br J
Pharmacol 137:1039-1046.
Kharasch ED, Walker A, Isoherranen N, Hoffer C, Sheffels P, Thummel K, Whittington D
and Ensign D (2007) Influence of CYP3A5 genotype on the pharmacokinetics and
pharmacodynamics of the cytochrome P4503A probes alfentanil and midazolam.
Clin Pharmacol Ther 82:410-426.
Kim RB, Wandel C, Leake B, Cvetkovic M, Fromm MF, Dempsey PJ, Roden MM, Belas
F, Chaudhary AK, Roden DM, Wood AJ and Wilkinson GR (1999)
Interrelationship between substrates and inhibitors of human CYP3A and P-
glycoprotein. Pharm Res 16:408-414.
Kurnik D, Wood AJ and Wilkinson GR (2006) The erythromycin breath test reflects P-
glycoprotein function independently of cytochrome P450 3A activity. Clin
Pharmacol Ther 80:228-234.
Lam JL, Okochi H, Huang Y and Benet LZ (2006) In vitro and in vivo correlation of
hepatic transporter effects on erythromycin metabolism: characterizing the
importance of transporter-enzyme interplay. Drug Metab Dispos 34:1336-1344.
Lau YY, Huang Y, Frassetto L and Benet LZ (2007) effect of OATP1B transporter
inhibition on the pharmacokinetics of atorvastatin in healthy volunteers. Clin
Pharmacol Ther 81:194-204.
Leblond F, Guevin C, Demers C, Pellerin I, Gascon-Barre M and Pichette V (2001)
Downregulation of hepatic cytochrome P450 in chronic renal failure. J Am Soc
Nephrol 12:326-332.
Copyright © 2009 by The Journal of the American Society of Nephrology
195
Leblond FA, Petrucci M, Dube P, Bernier G, Bonnardeaux A and Pichette V (2002)
Downregulation of intestinal cytochrome p450 in chronic renal failure. J Am Soc
Nephrol 13:1579-1585.
Lee JI, Chaves-Gnecco D, Amico JA, Kroboth PD, Wilson JW and Frye RF (2002)
Application of semisimultaneous midazolam administration for hepatic and
intestinal cytochrome P450 3A phenotyping. Clin Pharmacol Ther 72:718-728.
Lemma GL, Wang Z, Hamman MA, Zaheer NA, Gorski JC and Hall SD (2006) The effect
of short- and long-term administration of verapamil on the disposition of
cytochrome P450 3A and P-glycoprotein substrates. Clin Pharmacol Ther 79:218-
230.
Levey AS, Bosch JP, Lewis JB, Greene T, Rogers N and Roth D (1999) A more accurate
method to estimate glomerular filtration rate from serum creatinine: a new
prediction equation. Modification of Diet in Renal Disease Study Group. Ann Intern
Med 130:461-470.
Lin YS, Dowling AL, Quigley SD, Farin FM, Zhang J, Lamba J, Schuetz EG and Thummel
KE (2002) Co-regulation of CYP3A4 and CYP3A5 and contribution to hepatic and
intestinal midazolam metabolism. Mol Pharmacol 62:162-172.
Manley HJ, Cannella CA, Bailie GR and St Peter WL (2005) Medication-related problems
in ambulatory hemodialysis patients: a pooled analysis. Am J Kidney Dis 46:669-
680.
Masica AL, Mayo G and Wilkinson GR (2004) In vivo comparisons of constitutive
cytochrome P450 3A activity assessed by alprazolam, triazolam, and midazolam.
Clin Pharmacol Ther 76:341-349.
Matsushima S, Maeda K, Hayashi H, Debori Y, Schinkel AH, Schuetz JD, Kusuhara H and
Sugiyama Y (2008a) Involvement of multiple efflux transporters in hepatic
disposition of fexofenadine. Mol Pharmacol 73:1474-1483. Epub 2008 Feb 1471.
Matsushima S, Maeda K, Ishiguro N, Igarashi T and Sugiyama Y (2008b) Investigation of
the inhibitory effects of various drugs on the hepatic uptake of fexofenadine in
humans. Drug Metab Dispos 36:663-669.
Copyright © 2009 by The Journal of the American Society of Nephrology
196
Meyer TW and Hostetter TH (2007) Uremia. N Engl J Med 357:1316-1325.
Michaud J, Dubé P, Naud J, Leblond FA, Desbiens K, Bonnardeaux A and Pichette V
(2005) Effects of serum from patients with chronic renal failure on rat hepatic
cytochrome P450. Br J Pharmacol 144:1067-1077.
Naud J, Michaud J, Boisvert C, Desbiens K, Leblond FA, Mitchell A, Jones C,
Bonnardeaux A and Pichette V (2007) Down-regulation of intestinal drug
transporters in chronic renal failure in rats. J Pharmacol Exp Ther 320:978-985.
Naud J, Michaud J, Leblond FA, Lefrancois S, Bonnardeaux A and Pichette V (2008)
Effects of chronic renal failure on liver drug transporters. Drug Metab Dispos
36:124-128.
Niemi M, Kivisto KT, Hofmann U, Schwab M, Eichelbaum M and Fromm MF (2005)
Fexofenadine pharmacokinetics are associated with a polymorphism of the
SLCO1B1 gene (encoding OATP1B1). Br J Clin Pharmacol 59:602-604.
Nolin TD, Appiah K, Kendrick SA, Le P, McMonagle E and Himmelfarb J (2006)
Hemodialysis acutely improves hepatic CYP3A4 metabolic activity. J Am Soc
Nephrol 17:2363-2367.
Nolin TD, Naud J, Leblond FA and Pichette V (2008) Emerging evidence of the impact of
kidney disease on drug metabolism and transport. Clin Pharmacol Ther 83:898-
903.
Robertson SM, Davey RT, Voell J, Formentini E, Alfaro RM and Penzak SR (2008) Effect
of Ginkgo biloba extract on lopinavir, midazolam and fexofenadine
pharmacokinetics in healthy subjects. Curr Med Res Opin 24:591-599.
Russell T, Stoltz M and Weir S (1998) Pharmacokinetics, pharmacodynamics, and
tolerance of single- and multiple-dose fexofenadine hydrochloride in healthy male
volunteers. Clin Pharmacol Ther 64:612-621.
Sun H, Frassetto L and Benet LZ (2006) Effects of renal failure on drug transport and
metabolism. Pharmacol Ther 109:1-11.
Copyright © 2009 by The Journal of the American Society of Nephrology
197
Tahara H, Kusuhara H, Fuse E and Sugiyama Y (2005) P-glycoprotein plays a major role in
the efflux of fexofenadine in the small intestine and blood-brain barrier, but only a
limited role in its biliary excretion. Drug Metab Dispos 33:963-968.
Thummel KE, O'Shea D, Paine MF, Shen DD, Kunze KL, Perkins JD and Wilkinson GR
(1996) Oral first-pass elimination of midazolam involves both gastrointestinal and
hepatic CYP3A-mediated metabolism. Clin Pharmacol Ther 59:491-502.
Tian X, Swift B, Zamek-Gliszczynski MJ, Belinsky MG, Kruh GD and Brouwer KL
(2008a) Impact of basolateral multidrug resistance-associated protein (Mrp) 3 and
Mrp4 on the hepatobiliary disposition of fexofenadine in perfused mouse livers.
Drug Metab Dispos 36:911-915.
Tian X, Zamek-Gliszczynski MJ, Li J, Bridges AS, Nezasa K, Patel NJ, Raub TJ and
Brouwer KL (2008b) Multidrug resistance-associated protein 2 is primarily
responsible for the biliary excretion of fexofenadine in mice. Drug Metab Dispos
36:61-64.
Vinik HR, Reves JG, Greenblatt DJ, Abernethy DR and Smith LR (1983) The
pharmacokinetics of midazolam in chronic renal failure patients. Anesthesiology
59:390-394.
Wandel C, Witte JS, Hall JM, Stein CM, Wood AJ and Wilkinson GR (2000) CYP3A
activity in African American and European American men: population differences
and functional effect of the CYP3A4*1B5'-promoter region polymorphism. Clin
Pharmacol Ther 68:82-91.
Watkins PB (1994) Noninvasive tests of CYP3A enzymes. Pharmacogenetics 4:171-184.
Yi SY, Hong KS, Lim HS, Chung JY, Oh DS, Kim JR, Jung HR, Cho JY, Yu KS, Jang IJ
and Shin SG (2004) A variant 2677A allele of the MDR1 gene affects fexofenadine
disposition. Clin Pharmacol Ther 76:418-427.
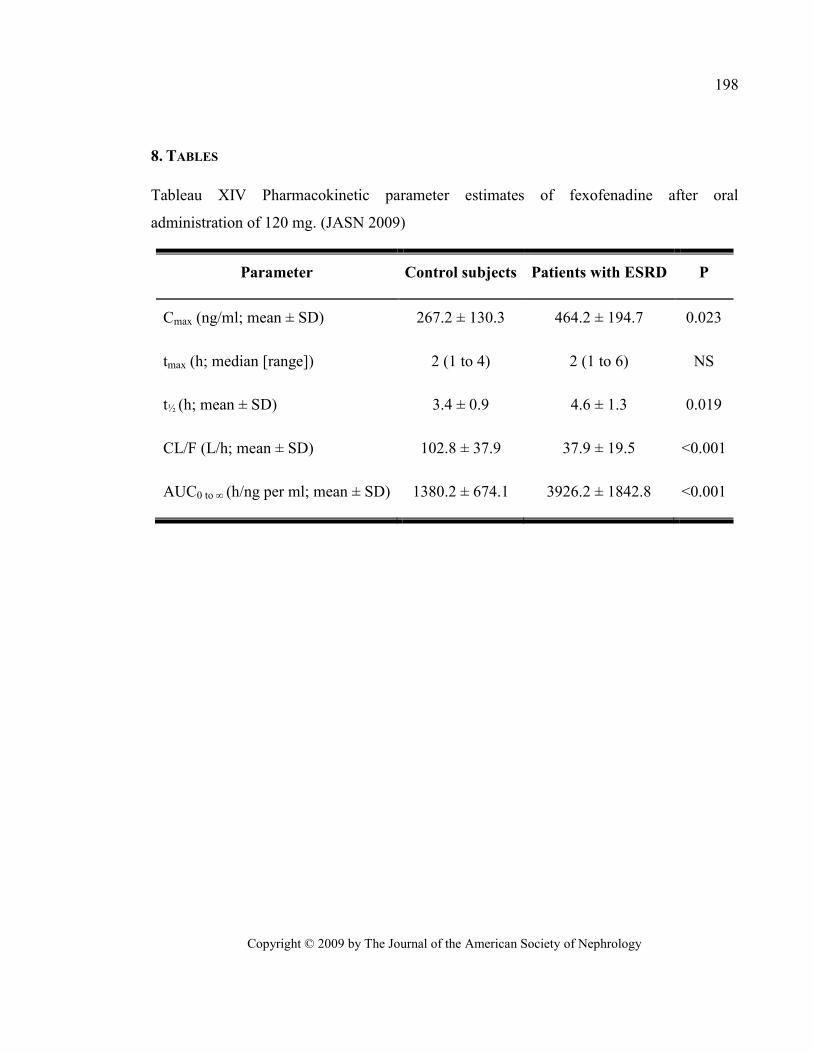
Copyright © 2009 by The Journal of the American Society of Nephrology
198
8. TABLES
Tableau XIV Pharmacokinetic parameter estimates of fexofenadine after oral
administration of 120 mg. (JASN 2009)
Parameter Control subjects Patients with ESRD P
Cmax (ng/ml; mean ± SD) 267.2 ± 130.3 464.2 ± 194.7 0.023
tmax (h; median [range]) 2 (1 to 4) 2 (1 to 6) NS
t½ (h; mean ± SD) 3.4 ± 0.9 4.6 ± 1.3 0.019
CL/F (L/h; mean ± SD) 102.8 ± 37.9 37.9 ± 19.5 <0.001
AUC0 to ∞ (h/ng per ml; mean ± SD) 1380.2 ± 674.1 3926.2 ± 1842.8 <0.001
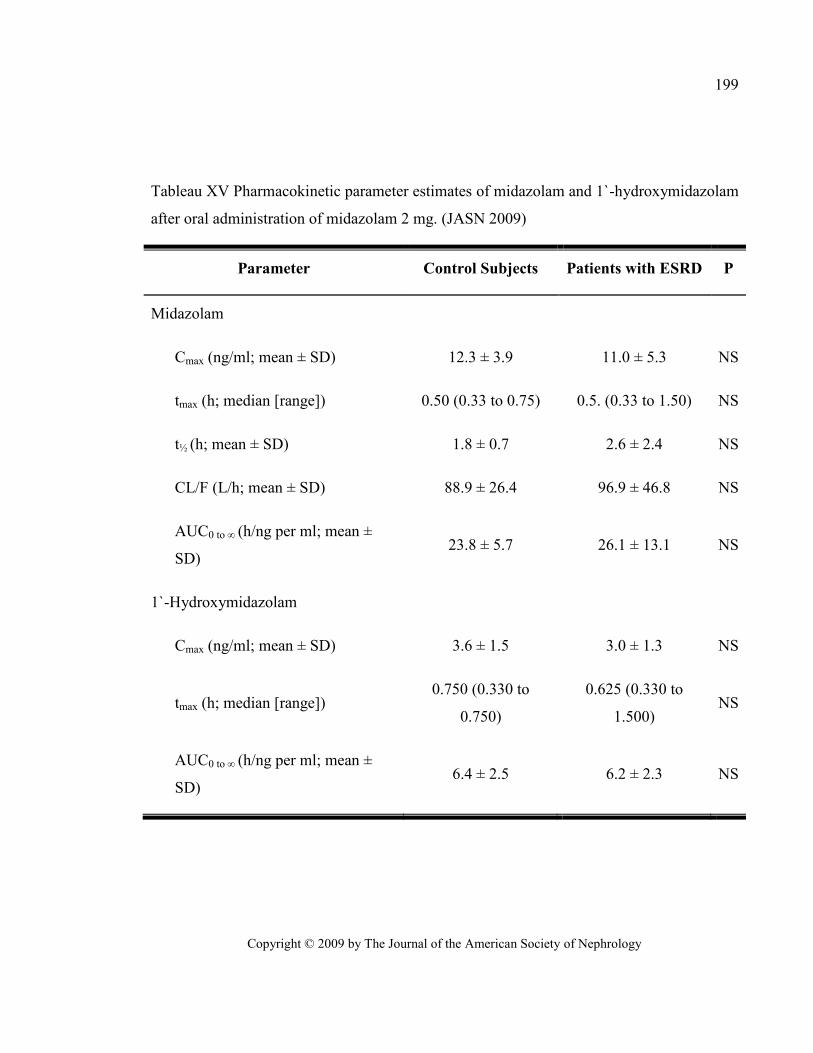
Copyright © 2009 by The Journal of the American Society of Nephrology
199
Tableau XV Pharmacokinetic parameter estimates of midazolam and 1`-hydroxymidazolam
after oral administration of midazolam 2 mg. (JASN 2009)
Parameter Control Subjects Patients with ESRD P
Midazolam
Cmax (ng/ml; mean ± SD) 12.3 ± 3.9 11.0 ± 5.3 NS
tmax (h; median [range]) 0.50 (0.33 to 0.75) 0.5. (0.33 to 1.50) NS
t½ (h; mean ± SD) 1.8 ± 0.7 2.6 ± 2.4 NS
CL/F (L/h; mean ± SD) 88.9 ± 26.4 96.9 ± 46.8 NS
AUC0 to ∞ (h/ng per ml; mean ±
SD) 23.8 ± 5.7 26.1 ± 13.1 NS
1`-Hydroxymidazolam
Cmax (ng/ml; mean ± SD) 3.6 ± 1.5 3.0 ± 1.3 NS
tmax (h; median [range]) 0.750 (0.330 to
0.750)
0.625 (0.330 to
1.500) NS
AUC0 to ∞ (h/ng per ml; mean ±
SD) 6.4 ± 2.5 6.2 ± 2.3 NS
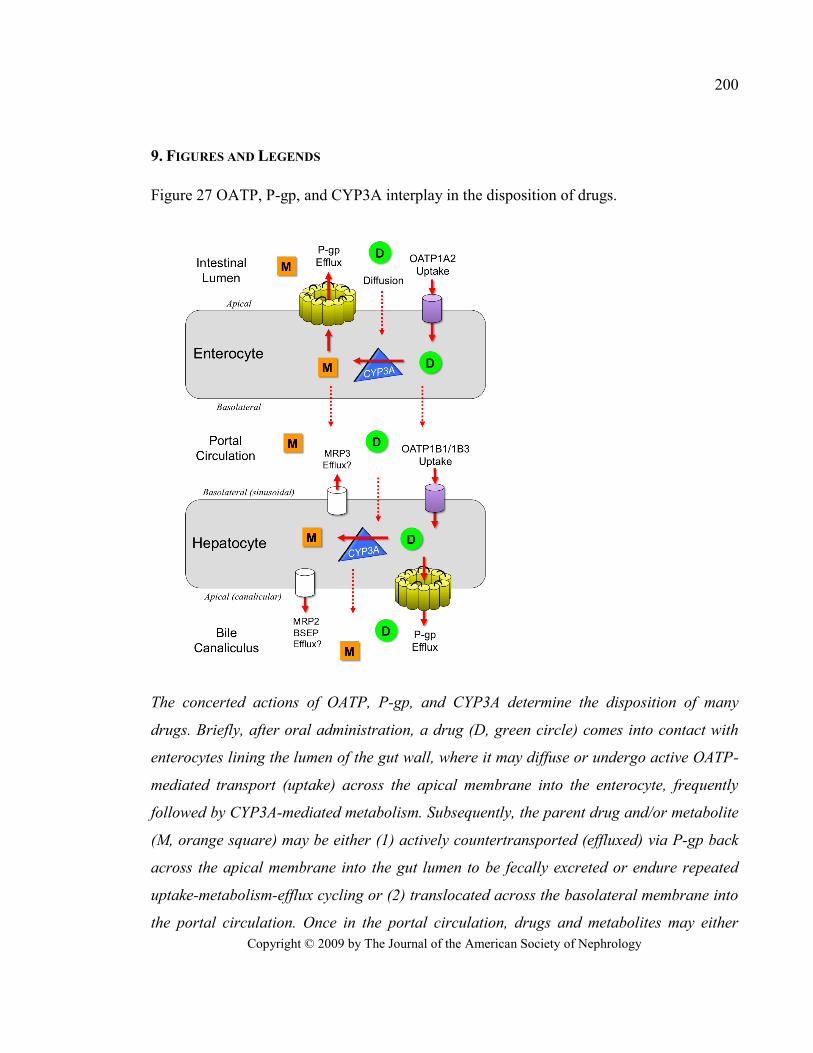
Copyright © 2009 by The Journal of the American Society of Nephrology
200
9. FIGURES AND LEGENDS
Figure 27 OATP, P-gp, and CYP3A interplay in the disposition of drugs.
The concerted actions of OATP, P-gp, and CYP3A determine the disposition of many
drugs. Briefly, after oral administration, a drug (D, green circle) comes into contact with
enterocytes lining the lumen of the gut wall, where it may diffuse or undergo active OATP-
mediated transport (uptake) across the apical membrane into the enterocyte, frequently
followed by CYP3A-mediated metabolism. Subsequently, the parent drug and/or metabolite
(M, orange square) may be either (1) actively countertransported (effluxed) via P-gp back
across the apical membrane into the gut lumen to be fecally excreted or endure repeated
uptake-metabolism-efflux cycling or (2) translocated across the basolateral membrane into
the portal circulation. Once in the portal circulation, drugs and metabolites may either
Copyright © 2009 by The Journal of the American Society of Nephrology
201
diffuse or undergo active OATP-mediated uptake across the basolateral (sinusoidal)
membrane of the hepatocyte, again followed by CYP3A-mediated metabolism, then
diffusion or P-gp–mediated efflux across the apical (canalicular) membrane into the bile
for excretion. Multidrug resistance–associated protein 2 (MRP2) and bile salt export pump
(BSEP) may also be involved in the biliary excretion and MRP3 in the basolateral efflux of
fexofenadine. Enterohepatic recirculation of drugs from the bile back into the gut is
possible.
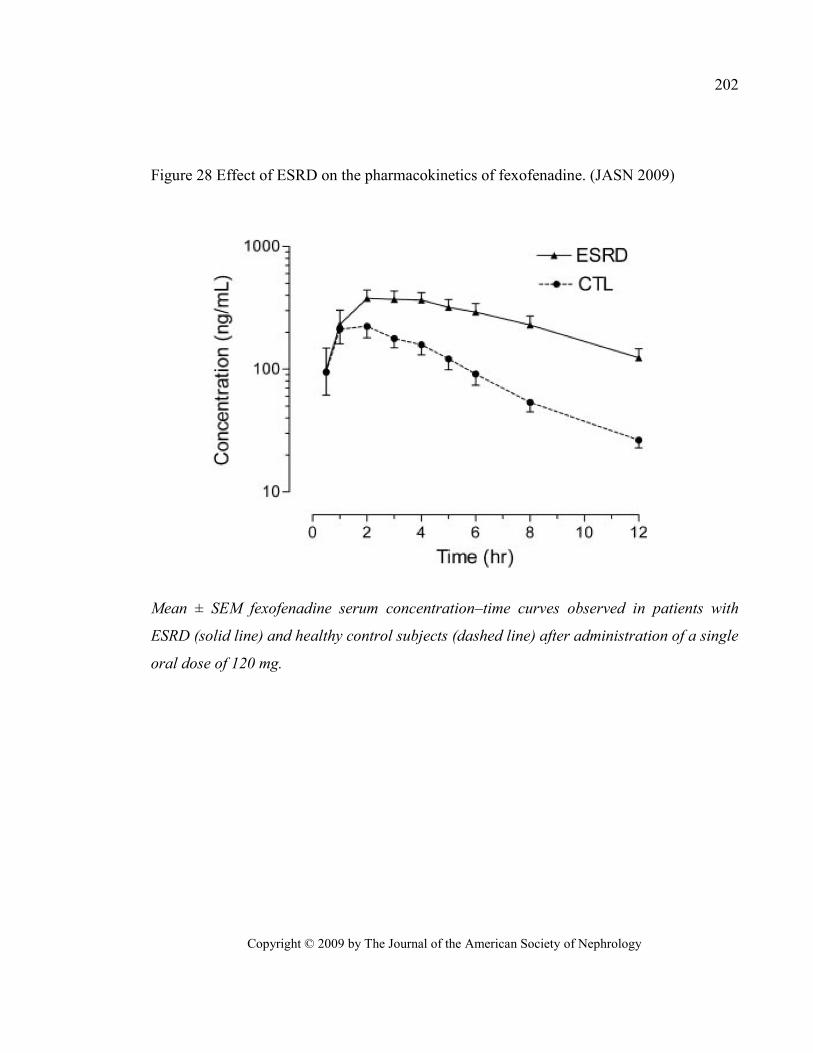
Copyright © 2009 by The Journal of the American Society of Nephrology
202
Figure 28 Effect of ESRD on the pharmacokinetics of fexofenadine. (JASN 2009)
Mean ± SEM fexofenadine serum concentration–time curves observed in patients with
ESRD (solid line) and healthy control subjects (dashed line) after administration of a single
oral dose of 120 mg.
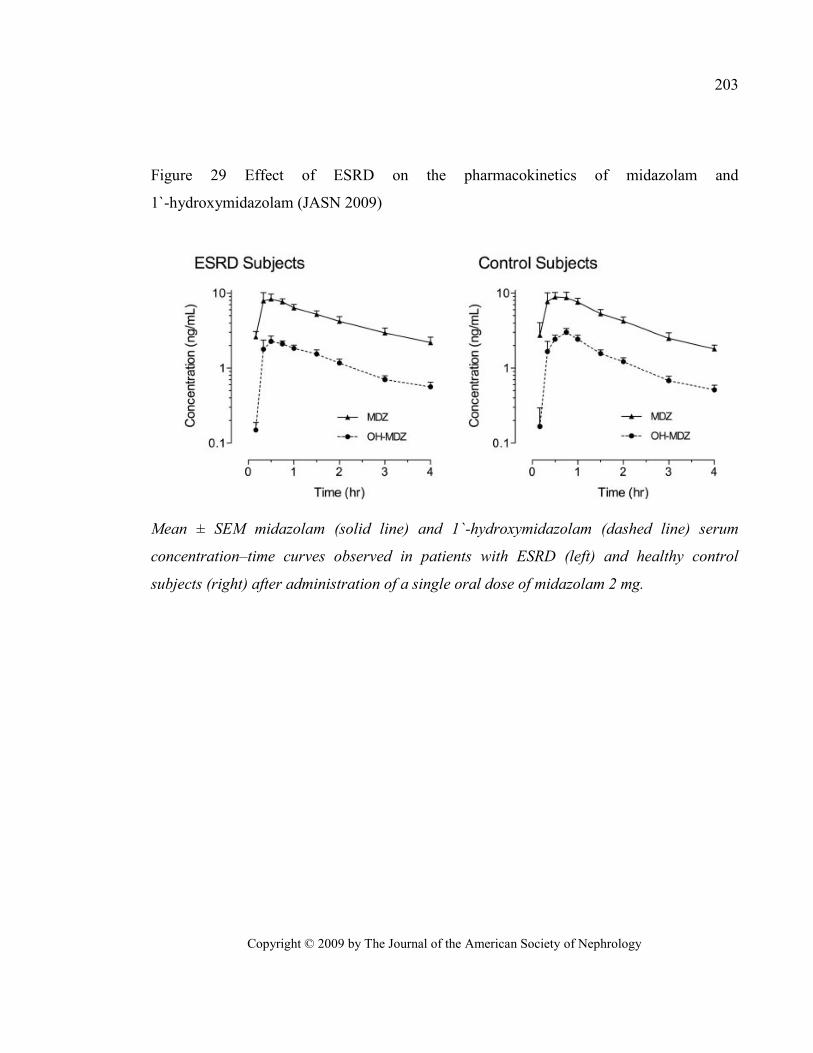
Copyright © 2009 by The Journal of the American Society of Nephrology
203
Figure 29 Effect of ESRD on the pharmacokinetics of midazolam and
1`-hydroxymidazolam (JASN 2009)
Mean ± SEM midazolam (solid line) and 1`-hydroxymidazolam (dashed line) serum
concentration–time curves observed in patients with ESRD (left) and healthy control
subjects (right) after administration of a single oral dose of midazolam 2 mg.
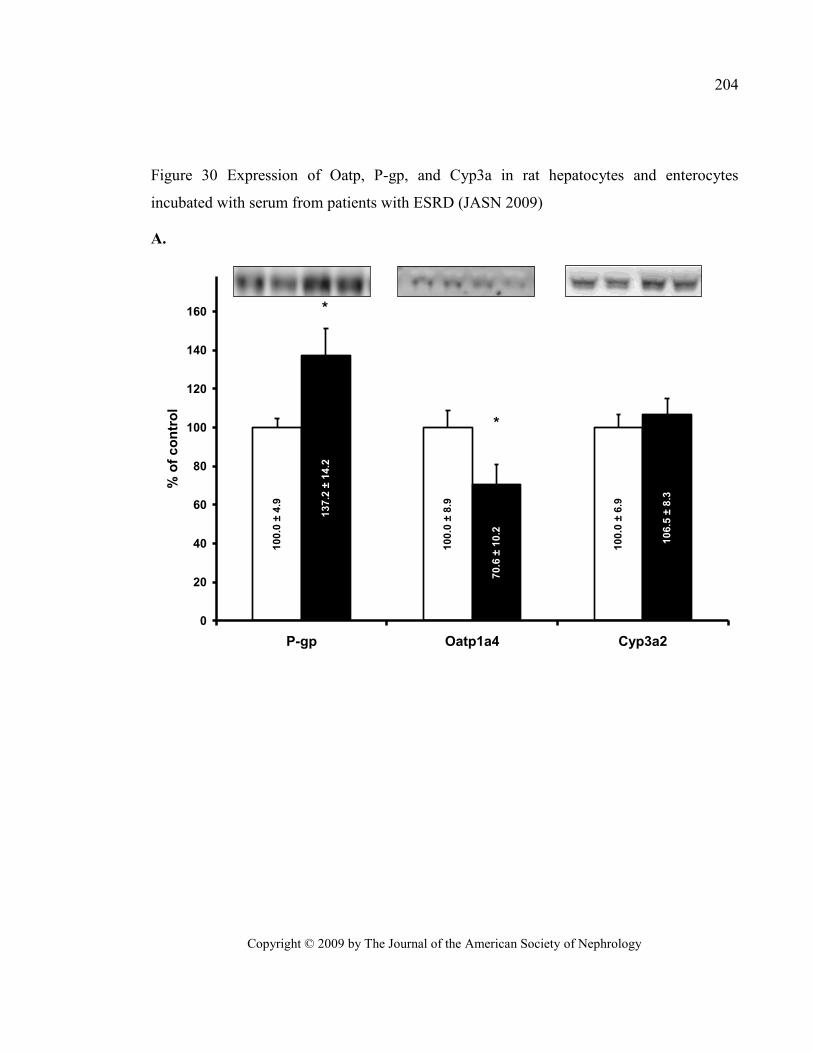
Copyright © 2009 by The Journal of the American Society of Nephrology
204
Figure 30 Expression of Oatp, P-gp, and Cyp3a in rat hepatocytes and enterocytes
incubated with serum from patients with ESRD (JASN 2009)
A.
10
0.0
± 6
.9
10
0.0
± 8
.9
10
0.0
± 4
.9
10
6.5
± 8
.3
70
.6 ±
10
.2
13
7.2
± 1
4.2
0
20
40
60
80
100
120
140
160
P-gp Oatp1a4 Cyp3a2
% o
f co
ntr
ol
*
*
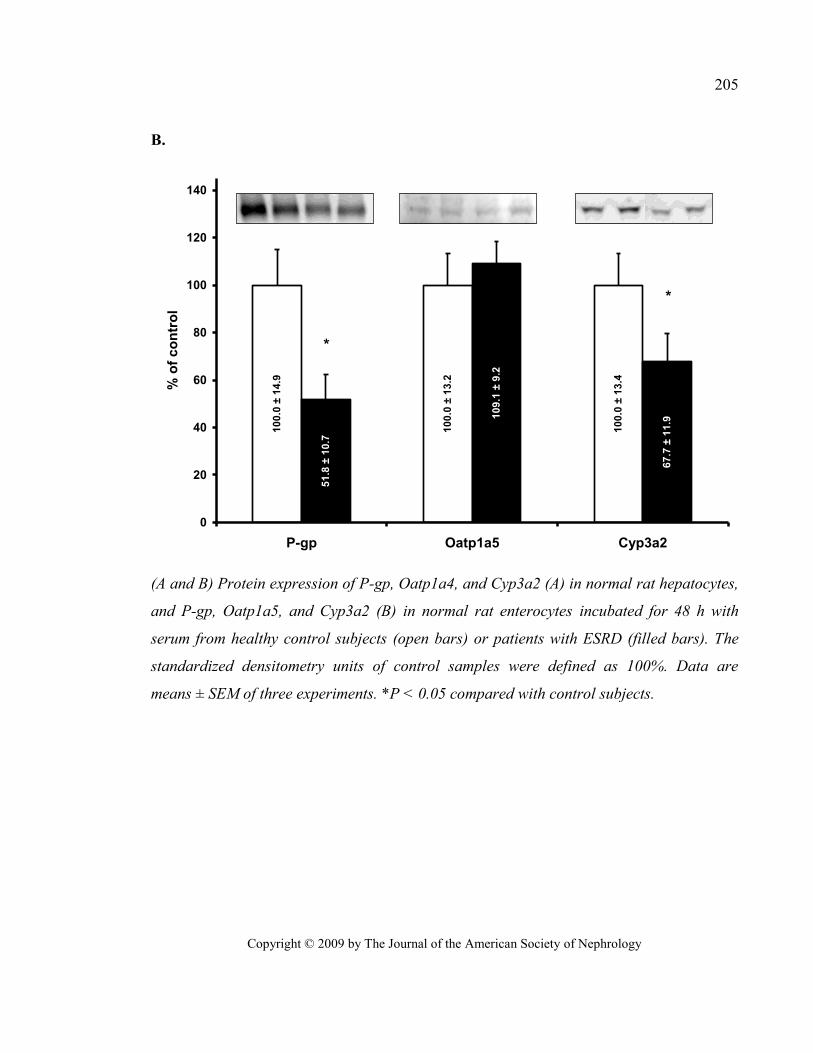
Copyright © 2009 by The Journal of the American Society of Nephrology
205
B.
10
0.0
± 1
4.9
10
0.0
± 1
3.2
10
0.0
± 1
3.4
51
.8 ±
10
.7
10
9.1
± 9
.2
67
.7 ±
11
.9
0
20
40
60
80
100
120
140
P-gp Oatp1a5 Cyp3a2
% o
f co
ntr
ol
*
*
(A and B) Protein expression of P-gp, Oatp1a4, and Cyp3a2 (A) in normal rat hepatocytes,
and P-gp, Oatp1a5, and Cyp3a2 (B) in normal rat enterocytes incubated for 48 h with
serum from healthy control subjects (open bars) or patients with ESRD (filled bars). The
standardized densitometry units of control samples were defined as 100%. Data are
means ± SEM of three experiments. *P < 0.05 compared with control subjects.
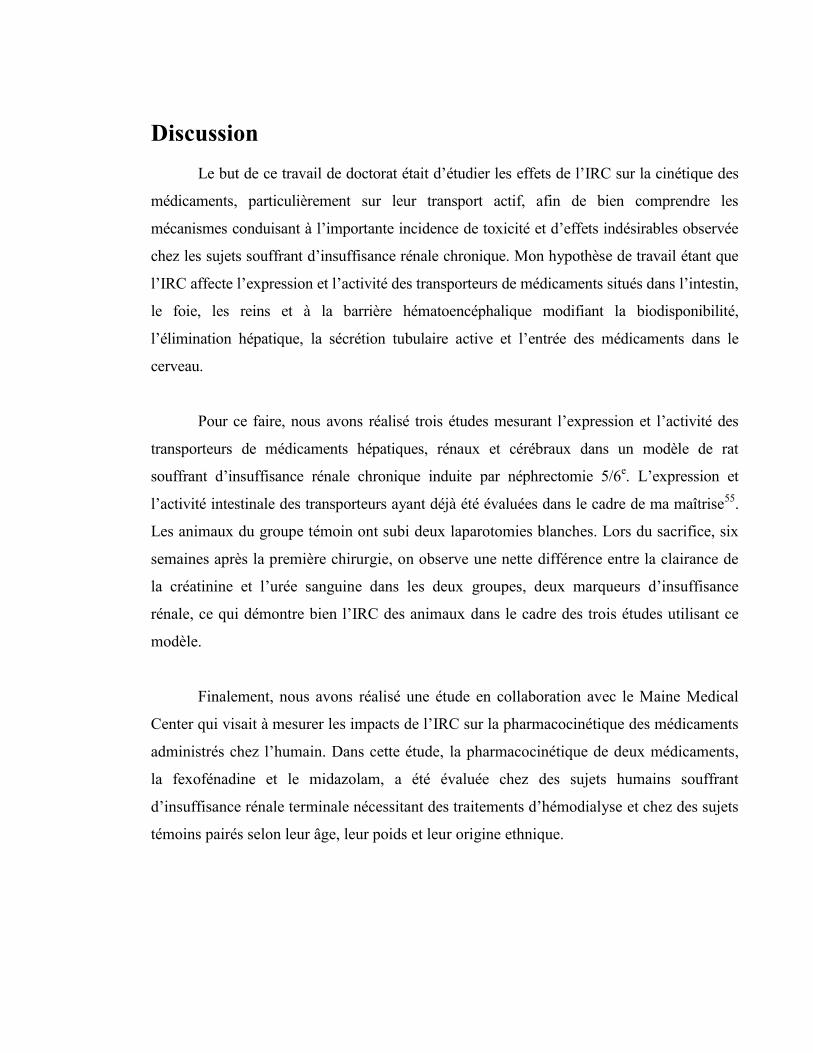
Discussion
Le but de ce travail de doctorat était d’étudier les effets de l’IRC sur la cinétique des
médicaments, particulièrement sur leur transport actif, afin de bien comprendre les
mécanismes conduisant à l’importante incidence de toxicité et d’effets indésirables observée
chez les sujets souffrant d’insuffisance rénale chronique. Mon hypothèse de travail étant que
l’IRC affecte l’expression et l’activité des transporteurs de médicaments situés dans l’intestin,
le foie, les reins et à la barrière hématoencéphalique modifiant la biodisponibilité,
l’élimination hépatique, la sécrétion tubulaire active et l’entrée des médicaments dans le
cerveau.
Pour ce faire, nous avons réalisé trois études mesurant l’expression et l’activité des
transporteurs de médicaments hépatiques, rénaux et cérébraux dans un modèle de rat
souffrant d’insuffisance rénale chronique induite par néphrectomie 5/6e. L’expression et
l’activité intestinale des transporteurs ayant déjà été évaluées dans le cadre de ma maîtrise55
.
Les animaux du groupe témoin ont subi deux laparotomies blanches. Lors du sacrifice, six
semaines après la première chirurgie, on observe une nette différence entre la clairance de
la créatinine et l’urée sanguine dans les deux groupes, deux marqueurs d’insuffisance
rénale, ce qui démontre bien l’IRC des animaux dans le cadre des trois études utilisant ce
modèle.
Finalement, nous avons réalisé une étude en collaboration avec le Maine Medical
Center qui visait à mesurer les impacts de l’IRC sur la pharmacocinétique des médicaments
administrés chez l’humain. Dans cette étude, la pharmacocinétique de deux médicaments,
la fexofénadine et le midazolam, a été évaluée chez des sujets humains souffrant
d’insuffisance rénale terminale nécessitant des traitements d’hémodialyse et chez des sujets
témoins pairés selon leur âge, leur poids et leur origine ethnique.
207
1. LES ETUDES CHEZ LE RAT
1.1 LES IMPACTS DE L’IRC SUR LE TRANSPORT DES MEDICAMENTS DANS LE FOIE DE
RATS
La première étude consistait à évaluer les impacts de l’IRC sur les transporteurs
hépatiques de médicaments chez des rats. Tout d’abord, nous avons mesuré l’expression
protéique et l’ARNm de Mrp2, Oatp2 et P-gp dans le foie d’animaux souffrant d’IRC ou
témoins. Ensuite, nous avons mesuré, in vivo, l’activité de la P-gp hépatique par la mesure de
l’excrétion biliaire de la rhodamine 123 chez ces animaux. Finalement, nous avons voulu
déterminer si les changements observés in vivo étaient attribuables à la présence d’un facteur
circulant s’accumulant dans le sérum des animaux néphrectomisés en mesurant l’expression
protéique des transporteurs dans des hépatocytes de rat en culture incubée avec du sérum de
rats souffrant d’IRC ou témoins.
Tout d’abord, dans le foie, nos résultats montrent que l’expression protéique de la
P-gp, mesurée dans des homogénats de foie par immunobuvardage de type Western, est
significativement augmentée, alors que celle de Mrp2 demeure inchangée et celle de Oatp2
est significativement diminuée chez les animaux néphrectomisés comparativement aux
animaux témoins. L’augmentation de l’expression protéique de la P-gp semble être due à une
augmentation de l’expression de son ARNm puisque celui-ci est induit. On observe aussi une
induction de l’ARNm de Mrp2 bien que son expression protéique ne soit pas modifiée.
Finalement, la diminution de l’expression protéique de Oatp2 ne semble pas associée à une
diminution de la transcription de son gène puisque les niveaux d’ARNm d’Oatp2 sont
identiques chez les animaux témoins et les animaux néphrectomisés.
Ces résultats diffèrent de ceux précédemment publiés par Laouari et al. qui avaient
observé, dans le foie de rats souffrant d’insuffisance rénale, une augmentation de l’expression
protéique et de l’ARNm de Mrp295
. En effet, nous avons obtenu une augmentation
208
comparable de l’ARNm de Mrp2 sans toutefois observer d’augmentation de son expression
protéique330
. Cette divergence pourrait être attribuée à une différence dans la spécificité de
l’anticorps anti-Mrp2 utilisé. Toutefois, Laouari et al. n’avaient pas observé de changement
significatif de l’expression protéique et de l’ARNm de la P-gp95
alors que nous observons
une augmentation significative. Cela pourrait être dû au degré de sévérité de l’IRC dans les
deux études, puisque nous avons précédemment montré une corrélation entre la clairance de
la créatinine et l’expression protéique de la P-gp55
. Les animaux néphrectomisés de l’étude
de Laouari et al. présentaient une diminution d’environ 60 % de la clairance de la créatinine
alors que nos animaux présentaient une diminution d’environ 75 % par rapport aux
animaux témoins. Le degré plus sévère de l’IRC chez nos animaux pourrait donc avoir
favorisé l’apparition de ces changements d’expression.
De plus, pour Oatp2 et Mrp2, l’expression de l’ARNm chez les sujets
néphrectomisés n’est pas corrélée avec l’expression de la protéine. En effet, on observe une
diminution de 40 % de l’expression protéique de Oatp2 alors que l’expression de son
ARNm n’est pas différente de celle des animaux témoins et, à l’inverse, on observe une
augmentation de 40 % de l’ARNm de Mrp2 sans augmentation de son expression
protéique. Ceci suggère que des modulations post-traductionnelles régissent l’expression
de Oatp2 et Mrp2 dans le foie des animaux néphrectomisés.
Ces modifications post-traductionnelles pourraient être de plusieurs ordres. Tout
d’abord, la maturation ou le repliement de la protéine pourraient être affectés. Ensuite, la
migration vers la membrane apicale (Mrp2) ou basolatérale (Oatp2), l’internalisation et la
dégradation de l’Oatp2 et de Mrp2 pourraient être modifiées en IRC.
À ce jour, aucune étude n’a démontré qu’une pathologie affecte le repliement ou la
maturation de Mrp2 à l’exception du Syndrome de Dubin-Johnson qui est dû à un mauvais
repliement de Mrp2343
. Ce problème de maturation est toutefois dû à une mutation dans le
gène de Mrp2343
, ce qui n’est évidemment pas le cas chez les rats IRC.
209
Une étude publiée en 2002 par Kikuchi et al., a démontré que la radixine est
essentielle à la migration de Mrp2 à la membrane apicale des cellules polarisées344
La
radixine fait partie de la famille des ezrine-radixine-moesine à qui l’on a attribué des rôles
dans la motilité cellulaire, l’adhésion cellulaire et la prolifération en général345-347
. Ces
auteurs ont démontré que, dans le foie de souris knock-out pour la radixine, il y a une forte
diminution de Mrp2 à la membrane apicale des villi des cellules canaliculaires, sans
toutefois qu’il y ait de diminution du Mrp2 total des hépatocytes. Aussi, une étude récente
a démontré qu’une perte de l’interaction protéine-protéine entre la radixine et Mrp2 était
impliquée dans l’internalisation rapide de Mrp2 de la membrane canaliculaire hépatique en
situation de stress oxydatif causé par l’endotoxine348
. Toutefois, l’internalisation de Mrp2
par perte d’interaction avec la radixine ne semble pas entraîner sa dégradation, mais bien
seulement sa séquestration intracellulaire, cette voie ne semble donc pas impliquée dans
l’absence d’augmentation de l’expression protéique de Mrp2 en présence d’un ARNm
augmenté en IRC. Il faudra donc continuer à chercher quels sont les mécanismes
post-traductionnels qui régulent l’expression protéique de Mrp2 et évaluer leur rôle en IRC.
Pour ce qui est de Oatp2, on connaît très peu de choses sur sa régulation
post-traductionnelle. Tout d’abord, on sait que quatre sites de glycosylation extracellulaires
sont conservés parmi les Oatp349
. Une étude a démontré à l’aide d’ovocytes de Xenopus
laevis surexprimant le gène de Oatp1 que la migration à la membrane et l’activité de Oatp1
dépendent de sa N-glycosylation sur les quatre sites conservés349
. En effet, lorsque les
ovocytes étaient traités avec de la tunicamycine, un inhibiteur de la glycosylation, l’activité
de Oatp1, mesurée par le transport de taurocholate, était pratiquement nulle. De plus, la
mutation des quatre sites de glycosylation entraînait une diminution du poids moléculaire
ainsi qu’une perte totale de fonction de la protéine. De plus, très peu des quadruples
mutants atteignaient la membrane basolatérale, alors que la majorité restaient enfermés
dans des compartiments intracellulaires. Toutefois, la localisation et la fonction des simples
mutants semblaient conservées. Seuls les doubles et triples mutants commençaient à
210
présenter des altérations fonctionnelles. La N-glycosylation sur les quatre sites conservés
des Oatp est donc essentielle à la localisation et la fonction de ces transporteurs d’au moins
Oatp1349
. De la même façon, une étude a démontré que la localisation à la membrane et la
fonction de OATP2B1 était sensible à sa glycosylation sur trois sites situés sur la boucle
extracellulaire IX-X350
. Toutefois, nous n’avons pas observé de changement de poids
moléculaire de Oatp2 dans le foie des animaux néphrectomisés. Il ne semble donc pas que
sa glycosylation soit modifiée en IRC.
On sait aussi que la phosphorylation des OATP par la protéine kinase C (PKC)
entraîne une régulation rapide de leur activité. En effet, la phosphorylation de l’Oatp1
hépatique par la PKC, et non par la PKA, inhibe l’activité de Oatp1 sans changer son
expression à la surface cellulaire351, 352
. Toutefois, le mécanisme par lequel la
phosphorylation de Oatp1 entraîne la perte de son activité reste à identifier352
. Aussi, la
phosphorylation par la PKC entraîne une régulation rapide de l’activité de OATP2B1. En
effet, la phosphorylation de OATP2B1 entraîne son internalisation rapide par un
mécanisme dépendant de la clathrine et sa dégradation lysosomale353
. Un tel mécanisme
pourrait expliquer la baisse de l’expression protéique et de l’activité de Oatp2 chez les
animaux néphrectomisés en présence d’une expression d’ARNm normale.
Le second objectif de cette étude était de déterminer si l’augmentation de l’expression
de la P-gp observée chez les animaux urémiques entraîne une augmentation de l’activité de la
protéine. Pour ce faire, nous avons mesuré le transport in vivo de la rhodamine 123 (Rho123),
un substrat spécifique à la P-gp354, 355
, chez des rats anesthésiés selon un protocole adapté de
Yumoto et al.332
dans lequel la Rho123 est injectée par voie intraveineuse et son élimination
biliaire et urinaire est mesurée par canulation directe de la voie biliaire et de la vessie, ce qui
permet de récupérer la totalité de ces liquides biologiques. Un échantillon de sérum est
prélevé à mi-chemin de chacune des périodes de collecte biliaire et urinaire afin de
déterminer la concentration sanguine de Rho123. L’ajout de cyclosporine A, un inhibiteur de
la P-gp, à la perfusion i.v. a permis d’évaluer la spécificité de l’essai pour le transporteur
211
P-gp. Les concentrations de Rho123 ont été mesurées dans chaque échantillon biologique par
chromatographie liquide de haute performance et la clairance biliaire (CLb) ainsi que la
clairance urinaire (CLu) de la rhodamine ont été calculées chez les animaux témoins et chez
les animaux souffrant d’IRC à l’aide de la formule CLb ou u = (Cb ou uVb ou u)/(Cp,sst) où Cb ou u
est la concentration biliaire (b) ou urinaire (u) de Rho123, Vb ou u est le volume excrété, Cp,ss est
la concentration plasmatique de Rho123 à l’état d’équilibre et t est le temps.
Nous avons ainsi observé une augmentation significative d’environ 60 % de la
clairance biliaire de la Rho123 chez les animaux néphrectomisés par rapport aux animaux
témoins (1,55 mL/min vs 0,95 mL/min). L’ajout de cyclosporine A à la solution de perfusion
entraînait une importante diminution du transport biliaire de la Rho123 dans les deux groupes
d’animaux. De plus, l’absence de différence significative dans le transport résiduel en
présence de l’inhibiteur laisse croire que seul le transport par la P-gp hépatique était affecté
par l’IRC. Ces résultats suggèrent que l’augmentation de l’expression protéique de la P-gp
dans le foie des animaux souffrant d’IRC est accompagnée d’une hausse de l’activité du
transporteur. D’un autre côté, la clairance urinaire de la Rho123 était fortement diminuée
(près de 100 %) chez les animaux néphrectomisés (0,06 mL/min contre 1,26 mL/min chez les
animaux témoins). Encore une fois, l’ajout de la cyclosporine A à la solution de perfusion
entraîne une réduction importante du transport, ramenant la clairance urinaire de la Rho123
dans les deux groupes à des niveaux semblables.
Bien que le devis expérimental de cette étude ne nous permette pas de démontrer une
diminution de l’activité de Oatp2 hépatique chez les rats souffrant d’IRC, des études récentes
semblent appuyer cette hypothèse. Une première étude a été menée par Sun et al. qui ont
étudié les impacts de ces toxines sur le transport de l’érythromycine dans des hépatocytes
en culture91
. La clairance hépatique de l’érythromycine est diminuée chez les patients en
IRC41
. Son élimination se fait surtout par transport actif de la molécule intacte par la voie
biliaire, et un peu par détoxification par le CYP335
. Pour son élimination biliaire,
l’érythromycine est importée dans les hépatocytes par l’Oatp2 et est rejetée dans la bile par
212
la P-gp91
. Sun et al. ont démontré que le 3-carboxy-4-methyl-5-propyl-2-furan-propanoic
acid (CMPF), une toxine urémique, peut directement inhiber le transport de
l’érythromycine par une diminution de l’activité de Oatp2. De plus, Tsujimoto et al. ont
évalué les effets du sérum urémique et de toxines urémiques sur l’importation hépatique de la
digoxine356
. Ils ont ainsi démontré que le sérum urémique inhibait l’import de la digoxine
dans des hépatocytes de rats de façon dose-dépendante356
. Ils ont aussi démontré que le
CMPF, l’acide hippurique, l’acide indole-3-acétique, l’indoxyl sulfate et le p-cresol
réduisaient de façon dose-dépendante l’importation de la digoxine dans des hépatocytes en
culture. En effet, le CMPF et le p-cresol la réduisaient d’environ 25 % dans des hépatocytes
de rats et humains à des concentrations présentes dans le sérum de patients urémiques356
. Ils
n’ont toutefois pas mesuré l’expression protéique de Oatp2 dans les hépatocytes356
.
Le troisième objectif de l’étude consistait à déterminer si les changements
d’expression des transporteurs observés in vivo sont attribuables à la présence d’un facteur
circulant s’accumulant dans le sérum des animaux néphrectomisés. Pour ce faire, des
hépatocytes de rats normaux ont été incubés pendant 48 h avec du sérum de rats souffrant
d’IRC ou de rats témoins. Les expressions protéique et génique de la P-gp, de MRP2 et de
Oatp2 ont ensuite été évaluées dans ces échantillons à l’aide d’immunobuvardage de type
Western et de PCR en temps réel. Les résultats obtenus semblent appuyer l’hypothèse d’un
facteur sérique puisque l’incubation d’hépatocytes de rats normaux avec le sérum de rats
néphrectomisés pendant une période de 48h permet de reproduire les changements
d’expression protéiques observés in vivo. L’expression de la P-gp est augmentée de 34 %,
celle de Oatp2 diminuée de 25 % alors que celle de MRP2 reste stable. Nous n’avons
toutefois pas observé de modulation de l’ARNm des différents transporteurs dans les
hépatocytes de rats incubés.
Les résultats obtenus dans le cadre de cette étude démontrent que l’IRC affecte le
transport des médicaments de plusieurs façons. En effet, l’expression du transporteur
d’importation Oatp2 est diminuée significativement alors que le transporteur d’extrusion
213
P-gp voit son expression et son activité augmentées par l’IRC. Ces augmentations de
l’expression et de l’activité de la P-gp pourraient être une réponse adaptative à la grande
quantité de déchets organiques accumulés dans le sang des rats néphrectomisés. Par contre,
comme mentionné précédemment, l’Oatp2 et la P-gp travaillent de concert pour assurer
l’élimination des médicaments. De plus, l’entrée des médicaments par Oatp2 peut être l’étape
limitante dans le métabolisme de plusieurs médicaments par le CYP450 hépatique ou encore
par les transporteurs d’exportation puisqu’il permet l’accès de ses substrats aux mécanismes
d’élimination subséquents23, 62
. La diminution d’expression d’Oatp2 observée dans le foie des
animaux souffrant d’IRC pourrait ainsi expliquer la diminution de l’élimination des
médicaments par le foie rapportée chez les patients dialysés.
1.2. LES IMPACTS DE L’IRC SUR LE TRANSPORT DES MEDICAMENTS DANS LE REIN DE
RATS
Les impacts de l’IRC sur les transporteurs rénaux de médicaments ont été évalués à
l’aide de notre modèle de rats néphrectomisés. Comme dans l’étude précédente, nous avons
tout d’abord mesuré l’expression protéique et l’ARNm de transporteurs de médicaments
rénaux dans le rein restant des animaux souffrant d’IRC comparativement aux témoins. Nous
avons ensuite évalué l’accumulation intrarénale de médicaments radiomarqués chez ces
mêmes animaux. De plus, nous avons déterminé in vitro l’effet du sérum urémique sur
l’expression protéique des transporteurs et sur l’activité de la P-gp dans une lignée cellulaire
de cellules tubulaires proximales humaines (Human Kidney-2).
Tout d’abord, dans le rein, nous avons mesuré l’expression protéique et l’ARNm de
nombreux transporteurs de médicaments. Nous avons ainsi observé des diminutions de
l’expression protéique des transporteurs Npt1, Oat1, Oat2, Oat3, OatK1/K2, Oatp1,
Oatp4c1, P-gp et Urat1 ainsi que du Cyp1a. À l’inverse, nous avons observé des
augmentations de l’expression protéique des transporteurs Mrp2, Mrp3, Mrp4, Oatp2 et
Oatp3. Seule l’expression du Cyp3a n’était pas influencée par l’IRC. Les changements de
214
l’expression protéique des différents transporteurs semblaient être le résultat de
modulations de leur ARNm puisque nous avons pu établir une corrélation entre les niveaux
d’ARNm et l’expression protéique des différents transporteurs et du Cyp1a.
Peu d’études ont tenté de mesurer les impacts de l’IRC sur l’expression des différents
transporteurs de médicaments rénaux. Nos résultats concordent toutefois en partie avec ceux
de Takeuchi et al. qui ont démontré une baisse de l’ARNm de OatK1 et OatK2 dans le rein
de rats quatre semaines post-néphrectomie 5/6e, mais aucun changement de l’expression de
Mrp2112
. En effet, nous avons aussi observé une baisse de l’expression de OatK1/K2 six
semaines post-néphrectomie, mais cette diminution était accompagnée d’une augmentation
de l’expression de Mrp2. Par contre, le groupe de Laouari et al. mentionné précédemment a,
comme nous, démontré une augmentation de l’expression protéique et de l’ARNm de Mrp2
dans le rein restant trois et six semaines après la néphrectomie comparativement à des rats
témoins95
. Ce groupe n’a toutefois pas observé d’altération de l’expression de la P-gp trois
semaines post-néphrectomie et a même mesuré une augmentation de son ARNm six
semaines post-néphrectomie95
alors que nous observons des diminutions de sa protéine et de
son ARNm d’environ 50 %. Nous ne sommes pas en mesure d’expliquer ces résultats
divergents. Finalement, deux groupes ont mesuré l’expression de Oat1 et Oat3 dans le rein de
rats néphrectomisés. Le premier groupe de Ji et al. n’a pas noté de modification deux
semaines post-néphrectomies bien qu’ils aient observé une diminution de la sécrétion de
para-aminohippurate (PAH), un de leurs substrats110
. Le second groupe de Deguchi et al. ont
observé des diminutions d’environ 50 % de l’expression protéique de Oat1 et Oat3 quatre
semaines post-néphrectomie qui corrélaient avec la capacité de transport d’acide hippurique
des animaux111
. De notre côté, nous avons mesuré des diminutions d’au moins 50 % de
l’expression protéique et de l’ARNm de ces deux transporteurs six semaines après la
néphrectomie ce qui est en accord avec les résultats présentés par Deguchi et al. Il est
possible que deux semaines soient insuffisantes pour développer les effets à long terme de
l’IRC et cela pourrait expliquer l’absence de différence d’expression de Oat1 et Oat3 entre les
215
animaux néphrectomisés et témoins deux semaines après la chirurgie tel que mesuré par Ji et
al.
Dans le rein, l’influx des anions organiques à la membrane basolatérale est plus
efficace que leur efflux dans l’urine pouvant ainsi entraîner une accumulation d’anions à
l’intérieur des cellules rénales et, potentiellement, des effets toxiques357
. L’accumulation
intrarénale des anions dépend donc de l’équilibre entre leur influx tubulaire, leur distribution
intracellulaire et leur efflux urinaire357
. De plus, comme mentionné précédemment, de
nombreuses toxines urémiques s’accumulent dans le sérum de patients souffrant d’IRC. Il
s’agit de composés exerçant une action biologique et s’accumulant dans le corps des sujets
souffrant d’IRC puisqu’ils ne sont plus éliminés dans l’urine en raison de la défaillance
rénale. Plusieurs de ces toxines ont déjà été abordées dans le cadre de cette thèse, les
principales étant le CMPF, le PAH et l’IS. Ces toxines sont des anions organiques et des
études ont montré qu’elles étaient normalement éliminées dans le rein par un mécanisme de
transport incluant les transporteurs Oat1 et Oat3 à la membrane basolatérale ainsi que par les
Mrp à la membrane apicale. Elles peuvent aussi agir comme inhibiteurs de l’activité de ces
mêmes transporteurs23, 324, 358-362
. L’accumulation de ces toxines chez les sujets souffrant
d’IRC pourrait donc entraîner une diminution de la clairance rénale des substrats des Oat et
des Mrp. D’autres études ont même suggéré que l’IS était impliqué dans la progression de
l’IRC puisqu’il a été démontré qu’il peut induire des dommages au tissu rénal23, 363-365
.
Dans le cadre de cette étude, nous avons observé des diminutions de l’expression des
transporteurs d’influx basolatéraux Oat1, Oat2, Oat3 et Oatp4c1, des transporteurs bilatéraux
apicaux OatK1/K, Oatp1 et Urat1 ainsi que du transporteur d’efflux apical Npt1. De plus,
nous avons observé des augmentations de l’expression des transporteurs d’efflux apicaux
Mrp2 et Mrp4 de même que du transporteur d’efflux basolatéral Mrp3. Ce sont tous des
transporteurs d’anions organiques. La diminution de l’expression des transporteurs d’influx et
l’augmentation de l’expression des transporteurs favorisant l’efflux des anions organiques
observées dans le cadre de cette étude pourraient ainsi être une réponse adaptative et
216
protectrice contre la toxicité rénale des anions organiques. C’est ce que nous avons tenté de
démontrer en mesurant l’accumulation intrarénale de la benzylpénicilline, un médicament
anionique substrat des Oat et des Mrp152, 333
pouvant aussi être transporté par l’Urat1 et le
Npt1313, 321
, dans le rein de rats néphrectomisés et témoins. Toutefois, nous avons observé une
accumulation 9 fois plus importante de benzylpénicilline dans le rein des animaux malades
comparativement aux animaux témoins. Il semble donc que, malgré la diminution de
l’expression des transporteurs d’influx rénaux et l’augmentation de l’expression des
transporteurs d’efflux rénaux, l’influx des anions organiques demeure plus efficace que leur
efflux. Les modifications ne sont donc pas suffisantes pour protéger le rein contre
l’accumulation de substrats anioniques et, potentiellement, contre la progression de l’IRC
causée par l’accumulation intrarénale de toxines urémiques. Une inhibition compétitive des
transporteurs d’efflux par les toxines urémiques accumulées dans les cellules rénales pourrait
expliquer ce phénomène.
Bien que l’expression de la plupart des transporteurs d’efflux mesurés dans le cadre
de cette étude ait été augmentée chez les rats souffrant d’IRC, l’expression de la P-gp y était
significativement réduite. Nous avions déjà démontré que l’élimination rénale de la
rhodamine 123 par la P-gp était presque anéantie chez des rats néphrectomisés démontrant
une importante diminution de son activité330
(voir article sur le foie). Nous étions maintenant
intéressés à savoir si la diminution de l’expression et de l’activité de la P-gp chez les rats
souffrant d’IRC pouvait aussi entraîner une accumulation intrarénale de ses substrats. Nous
avons donc évalué l’accumulation intrarénale de la digoxine, un substrat de Oatp4c1 et de la
P-gp239
. Nous avons ainsi observé une accumulation 4 fois plus importante de la digoxine
dans le rein des rats néphrectomisés comparativement aux animaux témoins. Ceci suggère
donc que les diminutions de l’expression et de l’activité de la P-gp chez les sujets souffrant
d’IRC pourraient favoriser l’accumulation intrarénale de médicaments transportés par la P-gp
et causer de la néphrotoxicité.
217
Dans le cadre de cette étude, nous avons aussi mesuré l’expression protéique et
l’ARNm des Cyp1a et Cyp3a dans le rein de rats témoins et insuffisants rénaux. Les Cyp1a et
Cyp3a sont des enzymes de biotransformation de phase I des médicaments ayant une
multitude de substrats. Chez l’humain, le CYP3A est impliqué dans la biotransformation de
près de 60 % des médicaments métabolisés par les cytochromes P450 comme la cyclosporine
et l’érythromycine alors que le CYP1A est surtout impliqué dans la biotransformation de
polluants environnementaux comme les hydrocarbones aromatiques polycycliques ou la
fumée de cigarette et de xénobiotiques comme la caféine et le tamoxifène34
. Dans le rein, les
Cyp1a et Cyp3a sont exprimés dans les cellules tubulaires où ils peuvent activer ou désactiver
leurs substrats avant leur élimination dans l’urine. Nous avons démontré une diminution de
l’expression du Cyp1a dans le rein des rats néphrectomisés comparativement aux témoins qui
pourrait entraîner la néphrotoxicité de composés actifs normalement désactivés par le Cyp1a
s’ils devaient s’accumuler dans le rein en raison de la diminution de l’activité des
transporteurs de médicaments rénaux. L’expression du Cyp3a ne semblait toutefois pas
influencée par l’IRC. On suppose donc que son activité serait normale et permettrait
l’activation ou la désactivation de ses substrats dans les cellules tubulaires. De la
néphrotoxicité pourrait toutefois apparaître si des métabolites actifs devaient s’accumuler à
l’intérieur des cellules tubulaires rénales. Nous ne pouvons toutefois que supposer des effets
de l’IRC sur l’activité des Cyp rénaux puisque nous ne l’avons pas mesurée. Il serait donc
intéressant de la mesurer à l’aide de microsomes de rein de rats témoins et néphrectomisés en
utilisant, par exemple l’érythromycine et l’éthoxyrésorufine comme substrats des Cyp3a et
Cyp1a, respectivement.
Nous avons finalement pu démontrer qu’un ou des facteurs urémiques présents dans
le sérum de rats souffrant d’IRC semblaient responsables des modifications de l’expression
des différents transporteurs de médicaments et du Cyp1a rénaux. En effet, nous avons
observé une corrélation significative entre leur expression protéique et la clairance de
créatinine des sujets, un marqueur de la sévérité de l’IRC, suggérant que les modifications
d’expressions observées en IRC sont directement liées à la sévérité de l’atteinte rénale. De
218
plus, nous avons pu reproduire les changements d’expression protéique observés in vivo en
incubant des cellules HK-2 avec du sérum de rats néphrectomisés pendant 48 h. Nous avons
aussi pu démontrer in vitro que la diminution de l’expression de la P-gp est accompagnée
d’une diminution de son activité telle que mesurée par le transport de la rhodamine 123 à
travers une monocouche de cellules HK-2 cultivées sur des transwells. En effet, nous avons
observé une augmentation significative de la perméabilité apparente de la rhodamine 123
traversant la monocouche cellulaire du côté apical vers le côté basolatéral, appuyant
l’hypothèse d’une diminution de l’activité facilitant la migration de la rhodamine vers le côté
basolatéral. De plus, l’ajout de cyclosporine, un inhibiteur de la P-gp, des deux côtés de la
monocouche a entraîné une augmentation de la perméabilité apparente de la rhodamine du
côté apical vers le côté basolatéral dans les cellules incubées avec du sérum de rats témoins,
alors qu’aucun changement significatif n’a été observé dans les cellules incubées avec du
sérum de rats urémiques. Ceci indique que ces dernières possédaient déjà un très faible
niveau d’activité de la P-gp avant même l’ajout de cyclosporine. Comme mentionné
précédemment, un très faible niveau d’activité de la P-gp avait déjà été démontré in vivo par
la presque totale diminution de l’élimination rénale de la rhodamine 123 chez des rats
souffrant d’IRC330
.
En conclusion, cette étude démontre que l’IRC altère significativement l’expression et
l’activité de nombreux transporteurs de médicaments rénaux et que ces altérations pourraient
causer une diminution de la clairance rénale ou une accumulation intrarénale de certains
médicaments et favoriser la néphrotoxicité. Ces modifications ont pu être reproduites dans un
modèle in vitro par l’incubation de cellules rénales avec du sérum de rats urémiques
suggérant qu’un ou des facteurs s’accumulant dans le sérum de sujets souffrant d’IRC en
étaient responsables in vivo.
219
1.3. LES IMPACTS DE L’IRC SUR LE TRANSPORT DES MEDICAMENTS DANS LE
CERVEAU DE RATS
Nous avons évalué les impacts de l’IRC sur les transporteurs de médicaments
exprimés à la BHE dans notre modèle de rats IRC. Comme précédemment, nous avons en
premier lieu mesuré l’expression protéique et l’ARNm de transporteurs de médicaments
exprimés dans le cerveau de rats néphrectomisés et témoins. Nous avons ensuite évalué la
fonction de la BHE en mesurant in vivo l’accumulation intracérébrale de la benzylpénicilline,
la digoxine, la doxorubicune et du vérapamil radiomarqués chez les animaux IRC
comparativement aux témoins. Finalement, nous avons déterminé in vitro l’effet du sérum
urémique sur l’expression protéique des transporteurs dans des astrocytes et des cellules
endothéliales de cerveau de rat en culture.
Nos résultats montrent des diminutions de 20 à 50 % de l’expression protéique et de
l’ARNm de la majorité des différents transporteurs mesurés, c’est-à-dire, Bcrp, Mrp2,
Mrp4, Oat3, Oatp2, Oatp3 et P-gp dans le cerveau de rats néphrectomisés comparativement
aux rats témoins. Seule l’expression de Mrp5 était inchangée. À notre connaissance, nous
sommes le premier groupe à étudier les impacts de l’IRC sur l’expression des transporteurs
de médicaments du cerveau.
Nous avons donc démontré que l’expression des transporteurs favorisant l’entrée
des médicaments au cerveau était réduite de même que celle des transporteurs favorisant
plutôt leur retour vers la circulation sanguine systémique. Il nous semblait important de
déterminer si les modifications de l’expression des transporteurs de médicaments mesurées
entraînaient un débalancement de l’équilibre entre l’influx et l’efflux à la BHE et, ainsi, une
accumulation intracérébrale de médicaments. Nous avons donc administré de la
benzylpénicilline, de la digoxine, de la doxorubicine et du vérapamil marqués dans la
circulation systémique et mesuré leur accumulation intracérébrale.
220
Malgré des réductions significatives de l’expression des transporteurs de
médicaments cérébraux chez les rats néphrectomisés, nous n’avons observé aucune
accumulation intracérébrale de trois des différents substrats mesurés, plus précisément la
digoxine, la doxorubicine et le vérapamil qui sont tous des substrats de la P-gp. La digoxine
est aussi un substrat des Oatp. Ce phénomène a déjà été observé dans des études traitant des
effets de l’inflammation sur le transport des médicaments à la BHE. En effet, des études ont
démontré que l’inflammation systémique, telle que retrouvée en IRC, diminuait
l’expression protéique de la P-gp de façon modérée (-24 %) à la BHE de souris 6 h après
l’induction de l’inflammation à l’aide d’endotoxine137
. Dans cette étude, la diminution de
l’expression de la P-gp était toutefois transitoire et les valeurs retournaient à la normale 24h
après l’induction de l’inflammation137
. Les auteurs ont aussi mesuré l’accumulation
intracérébrale de la doxorubicine chez ces animaux. Ils ont ainsi observé une augmentation
de ses concentrations plasmatiques et intracérébrales 6 h après l’induction de
l’inflammation, toutefois, le ratio cerveau/plasma de la doxorubicine était le même chez les
souris témoins et les souris inflammées137
. Les auteurs ont donc conclu que l’inflammation
induite par l’endotoxine n’avait aucun effet sur l’intégrité de la BHE et sur le transport de la
doxorubicine à travers cette membrane chez les souris137
. Une autre étude a démontré que
l’inflammation du système nerveux central entraînait une diminution de 50 % de l’ARNm
de la P-gp et une diminution presque totale de l’ARNm de l’Oatp2 dans le cerveau de rat
6 h après son induction135
. Ce groupe a utilisé la digoxine comme marqueur in vivo de
l’activité de la P-gp et ils ont observé une augmentation de ses concentrations plasmatiques
et cérébrales 6 et 24h après l’induction de l’inflammation135
. Toutefois, encore une fois, le
ratio cerveau/plasma était le même entre les rats inflammés et témoins135
. En nous appuyant
sur ces résultats, et puisque l’IRC est un état chronique d’inflammation, il est tout à fait
probable que, comme Zhao et Goralski, nous observions des diminutions de l’expression
protéique et de l’ARNm de la P-gp et des Oatp dans le cerveau de rats néphrectomisés sans
toutefois observer d’accumulation intracérébrale de la digoxine, de la doxorubicine ou du
vérapamil.
221
Nous avons toutefois observé une diminution de 30 % de la perméabilité de la
benzylpénicilline à travers la BHE des rats néphrectomisés tel que démontré par son ratio
cerveau/plasma. Des études in vitro ont montré que la benzylpénicilline est un substrat de
Mrp2 et Oat3, mais son transporteur du sang vers le cerveau n’a jamais été identifié123, 152
.
Plusieurs études ont montré que Oat3 est impliqué dans l’extraction des toxines urémiques
du cerveau123, 274, 276, 277
. En effet, Oat3 est surtout considéré comme un transporteur
favorisant l’extraction des médicaments du cerveau. Toutefois, une étude récente suggère
qu’il serait aussi impliqué dans le transport du Ro 64-0802, une forme active de
l’oseltamivir, vers le cerveau127
. Il pourrait donc être impliqué dans le transport de substrats
tels la benzylpénicilline et les toxines urémiques vers le cerveau en plus de leur extraction.
Cette hypothèse est soutenue par une étude publiée à la fin des années 1960 montrant que le
probénécid, un inhibiteur connu de l’Oat3, limite l’entrée de la benzylpénicilline dans le
cerveau de rats tel que mesuré par le ratio cerveau/plasma de la benzylpénicilline quand elle
est coadministrée avec du probénécid366
. La diminution de l’accumulation de
benzylpénicilline observée dans le cerveau des rats néphrectomisés indique que son efflux
du cerveau est plus efficace que son entrée. Toutefois, l’expression de Mrp2, impliquée
dans l’efflux de la benzylpénicilline, et de Oat3, impliqué dans l’efflux et potentiellement
l’influx de la benzylpénicilline, est diminuée de façon similaire dans le cerveau des rats
néphrectomisés. Si Oat3 est bel et bien un transporteur capable de favoriser l’entrée de
substrats tels que la benzylpénicilline et les toxines urémiques au cerveau, l’entrée de la
benzylpénicilline au cerveau pourrait être réduite en IRC en raison d’une compétition entre
celle-ci et les toxines urémiques telles que le CMPF, l’IS et le PAH qui peuvent inhiber
Oat3274
. Il est toutefois tout aussi probable que les mécanismes d’efflux de la
benzylpénicilline à la BHE par Mrp2 et Oat3 soient fonctionnellement plus importants que
ses mécanismes d’influx empêchant son accumulation intracérébrale.
D’autres facteurs pourraient affecter la perméabilité de la barrière
hématoencéphalique. En effet, une étude a démontré chez des rats que l’insuffisance rénale
aiguë pouvait entraîner une augmentation de la perméabilité de la BHE pour l’inuline et le
222
sucrose367
. De plus, des études ont démontré que le LPS appliqué de façon topique chez le
rat et le TNF-α administré par voie intraveineuse augmentaient la perméabilité de la BHE
pour le FITC-dextran-10K368, 369
. Une augmentation de la perméabilité de la BHE pour la
sodium-fluorescéine en présence de TNF-α a aussi été démontrée chez la souris370
. Ces
résultats ont été corroborés dans des modèles BHE in vitro. En effet, le TNF-α, l’IL-6,
l’IL-1β et le LPS entraînent une diminution de la résistance électrique transendothéliale de
cellules endothéliales de cerveau en culture primaire371, 372
. Toutefois, une étude a démontré
que, bien que l’inflammation systémique puisse augmenter la perméabilité de la BHE pour
le colorant Evans Blue chez le rat, il y avait aussi une diminution de la perméabilité de la
BHE pour l’aténolol, la morphine et l’oxycodone, des molécules ayant respectivement une
faible, moyenne et grande perméabilité cérébrale373
. Les auteurs concluent que, bien que la
présence d’inflammation puisse affecter la pénétration de certains composés dans le
cerveau, il est peu probable qu’elle mène à une défaillance non sélective de la BHE373
. Il est
donc possible que, même en présence d’une augmentation de la perméabilité de la BHE
pour l’inuline et le sucrose en IRC367
, la BHE continue d’offrir une barrière sélective aux
médicaments. Dans le même ordre d’idée, il est bien connu que l’IRC entraîne un état
d’hypertension chronique. Des études récentes ont démontré que l’hypertension pouvait
entraîner une augmentation de la perméabilité de la BHE pour le colorant Evans Blue374, 375
.
Il se pourrait donc que l’hypertension observée chez les rats IRC modifie la perméabilité de
la BHE. Toutefois, nous ne semblons pas observer de défaillance non sélective de la BHE
dans notre modèle tel que mesuré par l’accumulation intracérébrale de la benzylpénicilline,
de la digoxine, du vérapamil et de la doxorubicine.
Tous les substrats utilisés dans le cadre de cette étude ont été administrés par voie
systémique, soit intramusculaire, intrapéritonéale ou intraveineuse. Il aurait pu être
intéressant de mesurer l’indice d’efflux cérébral (brain efflux index) des différents substrats.
Cette méthode consiste à injecter un substrat directement dans le cerveau d’un animal et à
mesurer le pourcentage de la dose donnée toujours présente dans le cerveau à un temps
donné après l’injection123
. Nous aurions ainsi pu démontrer sans interférence avec l’influx
223
des substrats au cerveau, les impacts de l’IRC sur l’extraction des substrats du cerveau vers
le sang.
Finalement, nous avons incubé deux types de cellules cérébrales, des astrocytes et
des cellules endothéliales de cerveau de rat, avec du sérum provenant de rats souffrant
d’IRC ou témoins dans le but de déterminer si le sérum d’animaux urémiques pouvait
reproduire les changements de l’expression protéique des transporteurs de médicaments
cérébraux observés in vivo. Nous avions, au préalable, démontré une corrélation
significative entre l’expression protéique des transporteurs et la clairance de la créatinine
des animaux indiquant un lien direct entre la sévérité de l’atteinte rénale et l’expression
protéique des transporteurs à la BHE. Ceci suggère l’implication de facteurs s’accumulant
dans le sérum urémique pouvant moduler l’expression des transporteurs de médicaments à
la BHE. L’incubation de RBEC et d’astrocytes de rats avec le sérum urémique a pu
confirmer cette hypothèse puisque nous avons ainsi observé des modulations de
l’expression des transporteurs de médicaments cérébraux semblables à celles observées
in vivo.
En conclusion, il semble que même si l’IRC entraîne des diminutions significatives
de l’expression protéique de différents transporteurs d’efflux et d’influx cérébraux,
l’intégrité et la perméabilité de la BHE au passage de médicaments sont conservées tels que
démontré par l’absence d’accumulation intracérébrale de digoxine, doxorubicine, vérapamil
et benzylpénicilline.
1.4. QUELS FACTEURS URÉMIQUES?
Dans chacune des études réalisées chez le rat, le premier objectif était de mesurer
les expressions protéique et génique des transporteurs dans le tissu cible. Nous avons ainsi
démontré que l’IRC modifie l’expression des transporteurs de médicaments différemment
selon les organes où ils sont exprimés. De plus, nous avons démontré que les modifications
224
de l’expression protéique des transporteurs de médicaments mesurés dans le foie, le rein et
le cerveau étaient influencées par la sévérité de l’IRC chez les animaux testés. En effet,
nous avons obtenu des corrélations significatives entre l’expression protéique des
transporteurs et la clairance de créatinine, un marqueur de la fonction rénale, des animaux.
De plus, les modifications de l’expression des transporteurs semblent se produire en
réponse à des facteurs urémiques présents dans le sang des rats souffrant d’IRC tel que
démontré par l’incubation d’hépatocytes de rats, de cellules rénales humaines HK-2, ainsi
que d’astrocytes et de cellules endothéliales de cerveau de rat (RBEC) avec du sérum
provenant de rats néphrectomisés ou témoins. Parmi les facteurs potentiels, on retrouve les
toxines urémiques, telles que l’hormone parathyroïdienne (PTH), le PAH, le CMPF, l’IS, et
les cytokines pro-inflammatoires qui sont fortement augmentées en IRC.
Les toxines urémiques sont des composés exerçant une activité biologique,
s’accumulant chez les sujets souffrant d’IRC, qui sont normalement éliminés dans les
urines chez les sujets sains. À ce jour, on en a dénombré pas moins de 115376
. Ces toxines
sont de poids moléculaires variés, le European Uremic Toxin Work Group en a identifié 68
de moins de 500 Da, 12 excédant 12 000 Da et 10 ayant un poids moléculaire entre 500 et
12 000 Da377
. Certaines de ces toxines, par exemple, le 3-carboxy-4-methyl-5-propyl-2-
furan-propanoic acid (CMPF), l’indoxyl sulfate (IS) et l’acide hippurique (AH), sont
reconnues, non seulement pour inhiber la liaison des médicaments à l’albumine378, 379
, mais
aussi pour leur capacité à inhiber l’activité de différents transporteurs de médicaments
hépatiques, rénaux et à la barrière hématoencéphalique (voir sections précédentes). Les
différentes études n’ont toutefois pas mesuré si ces toxines pouvaient moduler l’expression
protéique des différents transporteurs.
Une autre toxine urémique peu abordée dans le cadre de ce travail, l’hormone
parathyroïdienne (PTH), est fortement augmentée chez les sujets souffrant d’IRC qui
développent une hyperparathyroïdie secondaire due à des hautes concentrations sériques de
phosphate combinées à de faibles concentrations sériques de 1,25(OH)vitamine D3 et de
225
calcium380
. Nous avons déjà démontré que la PTH pouvait diminuer l’expression protéique
du Cyp3a hépatique chez le rat de façon dose-dépendante84
. De plus, nous avons déjà
démontré une corrélation entre les niveaux de PTH mesurés dans le sérum de patients
souffrant d’IRC et l’inhibition du Cyp3a dans des hépatocytes de rat exposés à ce sérum81
.
Une ablation des glandes parathyroïdes avant l’induction de l’IRC peut même prévenir la
diminution du Cyp3a hépatique normalement observée chez les rats néphrectomisés84
.
Finalement, l’expression du Cyp3a est régulée par des voies de signalisation impliquant des
récepteurs nucléaires pouvant aussi réguler l’expression des Mrp et de la P-gp tels que le
pregnane-X-receptor (PXR), le constitutive-androstane-receptor (CAR) et le vitamin-D-
receptor (VDR)381-383
. Bien que les voies de signalisations impliquées dans la régulation du
Cyp3a hépatique par la PTH n’aient pas encore été identifiées, il est possible que la PTH
puisse aussi réguler l’expression des transporteurs de médicaments de la même façon que
celle du Cyp3a. Toutefois, l’IRC, tout comme une concentration élevée de PTH, a pour
effet de diminuer l’expression du Cyp3a hépatique alors que l’expression protéique de la
P-gp est augmentée dans le foie IRC et celle de Mrp2 reste inchangée. Les voies de
signalisations impliquées devraient donc avoir un effet inverse sur l’expression des Cyp et
des transporteurs de médicaments hépatiques. De plus, des études non publiées dans
lesquelles nous avons mesuré l’expression protéique des transporteurs de médicaments dans
l’intestin et le foie d’animaux ayant subi une parathyroïdectomie avant l’induction de l’IRC
démontrent que la parathyroïdectomie ne prévient pas les changements de l’expression des
transporteurs de médicaments hépatiques que nous avons observés. Il est donc peu probable
que la PTH joue un rôle important dans la régulation de l’expression des transporteurs de
médicaments en IRC.
Toutefois, une étude dans une lignée cellulaire de rein d’opossum a démontré que la
PTH pouvait réduire le transport du PAH du côté basolatéral vers le côté apical de façon
dose- et temps-dépendante par un mécanisme dépendant de l’activation de la PKC384
. Le
PAH est un anion organique principalement transporté par Oat1 et Oat3. Des études ont
plus tard démontré que la PKC entraînait l’internalisation de l’OAT1 et une réduction de
226
son activité385
. De plus, une étude récente a démontré que la PTH pouvait inhiber l’import
du losartan dans des hépatocytes de rats386
. Finalement, une expérience faite dans notre
laboratoire dont les résultats n’ont jamais été publiés démontre que la parathyroïdectomie
restaure l’activité de la P-gp intestinale chez les animaux néphrectomisés tel que mesuré
par la technique de l’intestin inversé « Everted Gut ». Les mécanismes impliqués n’ont
toutefois pas été étudiés. Il semble donc que bien que la PTH ne puisse pas moduler
l’expression des transporteurs de médicaments, elle pourrait en inhiber l’activité.
Un autre type de toxines urémiques accumulées chez les sujets souffrant d’IRC sont
les cytokines pro-inflammatoires, plus particulièrement les interleukines -1β, -6 et le tumor
necrosis factor (TNF)-α, causant un état inflammatoire chronique88, 377
. Non seulement les
cytokines sont accumulées en raison d’une élimination rénale déficiente, mais
l’accumulation de diverses toxines urémiques crée des dommages tissulaires activant les
monocytes et les macrophages causant ainsi la relâche de cytokines pro-inflammatoires376,
387. Plusieurs études ont démontré que l’inflammation induite par l’endotoxine (LPS)
possède un effet régulateur sur l’expression et l’activité des transporteurs de médicaments.
Tout d’abord, l’inflammation induite par l’endotoxine entraîne une diminution de
l’expression de l’ARNm mdr1a de la P-gp dans, entre autres, le foie, l’intestin, les reins et
le cerveau de rats135, 388-390
. Une diminution de l’activité de la P-gp hépatique en
inflammation a aussi été démontrée par une diminution de l’efflux de la rhodamine 123 par
des hépatocytes de rats inflammés comparativement à des hépatocytes de rats témoins390
.
De plus, des diminutions de l’ARNm des Mrp2, Oatp1 et Oatp2 hépatiques 6 heures après
l’induction de l’inflammation ont été observées chez le rat135, 391, 392
. L’ARNm hépatique de
mdr1b est toutefois induit par l’inflammation induite par l’endotoxine chez le rat, mais
réduit chez la souris135, 393, 394
. Il semble donc qu’il y ait une différence interespèce dans la
modulation de la P-gp hépatique par l’inflammation.
227
D’autres études ont tenté d’identifier les impacts de chaque cytokine sur les
transporteurs de médicaments. Il a ainsi été démontré in vitro que le TNF-α peut augmenter
de façon temps- et dose-dépendante l’ARNm (mdr1a et mdr1b), l’expression protéique et
l’activité de la P-gp dans des hépatocytes de rats incubés336
. Aussi, le TNF-α peut réduire
l’ARNm de la P-gp intestinale dans des cellules Caco-2 ainsi que son activité telle que
mesurée par le transport vectoriel de la rhodamine 123337
. Finalement, l’incubation de
cellules endothéliales de cerveau de porc avec du TNF-α entraîne une augmentation de
l’expression protéique de la P-gp après 6 h, suivie d’une diminution de son expression
après 24 et 48 h395
. Aussi, des études in vivo réalisées chez la souris indiquent que
l’injection de TNF-α entraîne une induction de l’ARNm hépatique de mdr1b, mais pas de
mdr1a393
, ainsi qu’une réduction de l’expression hépatique de Mrp2 et Oatp2396
. De plus, le
rôle du TNF-α dans la modulation de l’expression protéique de la P-gp hépatique en
réponse à l’inflammation induite par l’endotoxine a été mesuré chez des souris déficientes
en TNF-α, mais les auteurs n’ont pas mesuré son ARNm397
. Les auteurs n’ont pas observé
de modulation de l’expression protéique de la P-gp chez les souris déficientes en TNF-α,
alors que les souris sauvages présentaient une diminution de son expression protéique397
.
Comme la souris et le rat, tel que démontré in vitro, ne semblent pas répondre de la même
façon au stimulus inflammatoire en ce qui a trait à l’expression de la P-gp hépatique et
qu’aucune étude n’a tenté de démontrer les effets de l’injection de TNF-α sur l’expression
des transporteurs de médicaments chez le rat, les études in vivo réalisées chez la souris ne
sont pas nécessairement représentatives des effets engendrés par le TNF-α chez le rat.
D’autres cytokines pro-inflammatoires surexprimées en IRC sont l’IL-6 et l’IL-1β.
Deux études in vivo réalisées chez la souris ont démontré que l’injection d’IL-1β entraîne
des diminutions de l’ARNm de mdr1a, Mrp2 et Oatp2, sans changement de l’expression de
mdr1b, alors que l’injection d’IL-6 entraîne des diminutions de l’ARNm de mdr1b, Mrp2 et
Oatp2, sans modification de mdr1a393, 396
. L’incubation d’une lignée cellulaire
d’hépatocytes de souris (Hepa 1-6) avec les mêmes cytokines a pu reproduire in vitro les
diminutions de l’expression de Mrp2 observées in vivo396
. De plus, l’absence de modulation
228
de Mrp2 hépatique chez des souris déficientes en IL-6 semble confirmer l’importance de
cette cytokine dans la modulation de Mrp2 par l’inflammation396, 398
. Il a aussi été démontré
in vitro que l’IL-1β et l’IL-6 peuvent réduire l’expression de la P-gp et de Bcrp dans des
cellules endothéliales de capillaires cérébraux et que l’IL-6 peut réduire l’expression de la
P-gp dans des astrocytes de rat en culture395, 399, 400
. Encore une fois, aucune étude n’a tenté
de démontrer les effets de l’injection d’IL-1β ou d’IL-6 sur l’expression des transporteurs
de médicaments chez le rat. On ne peut donc que supposer que le rat et la souris répondent
de la même façon.
Les études démontrent donc clairement que l’inflammation et les cytokines
pro-inflammatoires peuvent moduler l’expression et l’activité des transporteurs de
médicaments. Toutefois, la plupart des études ont été réalisées chez des souris et se
concentraient sur quelques transporteurs hépatiques des médicaments (P-gp, Mrp2 et
Oatp2). De plus, les effets de l’inflammation et des cytokines sur l’expression et l’activité
des Mrp4 et Mrp5 ainsi que des Oat n’ont, à notre connaissance, pas été étudiés à ce jour.
Tout de même, quelques études in vitro ont démontré les effets des toxines
urémiques sur les cellules du cerveau et dans des hépatocytes de rats nous permettant de
spéculer sur l’implication des différentes cytokines dans la modulation des transporteurs de
médicaments par l’IRC. En effet, nos résultats démontrent une augmentation de
l’expression et de l’activité de la P-gp dans le foie des rats néphrectomisés alors qu’elle est
diminuée dans les reins, à la barrière hématoencéphalique et dans l’intestin55
. Bien que les
trois cytokines pro-inflammatoires présentées ici favorisent une réduction de l’expression
de la P-gp dans des cellules cérébrales395, 399, 400
, seul le TNF-α peut induire l’expression de
la P-gp dans des cellules hépatiques336
. Il est donc possible que le TNF-α soit une molécule
importante dans la régulation de l’expression de la P-gp en IRC, particulièrement dans le
foie. De plus, IL-1β et IL-6 pourraient aussi être impliquées dans la régulation des
transporteurs de médicaments dans le cerveau tel que montré dans les études in vitro395, 399,
400. À notre connaissance, aucune étude n’a tenté de déterminer le rôle des cytokines
229
pro-inflammatoires dans la régulation de l’expression des transporteurs de médicaments
rénaux.
La modulation de l’expression et de l’activité des transporteurs est complexe pouvant
répondre à toute une variété de stimuli par de multiples voies de signalisation. De plus, l’IRC
est une pathologie complexe affectant virtuellement tous les organes en raison de
l’accumulation d’au moins 115 toxines urémiques ayant des actions biologiques diverses376
.
Il est donc très peu probable qu’une seule molécule soit responsable des modulations de
l’expression et de l’activité des transporteurs de médicaments observées en IRC.
2. IMPACTS DE L’IRC SUR LA PHARMACOCINÉTIQUE DES MÉDICAMENTS CHEZ L’HUMAIN
Les résultats des études précédentes démontrent clairement que l’IRC affecte le
transport des médicaments dans plusieurs organes. En plus des études présentées dans le
cadre de cette thèse, nous avons déjà démontré que l’IRC pouvait aussi modifier l’expression
et l’activité des transporteurs de médicaments intestinaux chez des rats néphrectomisés55
. De
plus, tel que démontré en introduction, il a aussi été démontré que l’IRC affecte la
biotransformation intestinale et hépatique des médicaments par le cytochrome P450 dans
notre modèle de rats néphrectomisés. Une étude chez l’humain portant sur la
pharmacocinétique de l’érythromycine chez des sujets souffrant d’IRC terminale semblent le
confirmer63
, mais des études récentes ont suggéré que la biotransformation de
l’érythromycine par les CYP n’était pas modifiée en IRC et que c’était plutôt son influx dans
les hépatocytes qui était diminué, compromettant l’accès de l’érythromycine aux CYP
hépatiques91, 401
.
Le but de la dernière étude, réalisée en collaboration avec un groupe de recherche
américain, consistait donc à évaluer, chez l’humain, comment l’insuffisance rénale sévère
affecte la clairance non rénale des médicaments en étudiant la biotransformation et le
transport intestinal et hépatique des médicaments chez des patients souffrant d’insuffisance
230
rénale terminale. La pharmacocinétique du midazolam et de la fexofénadine a été évaluée
chez les patients dialysés. Nous avons déterminé les effets du sérum provenant des sujets de
l’étude sur l’expression protéique des transporteurs de médicaments Oatp et P-gp et du
cytochrome P450 3a dans des entérocytes et des hépatocytes de rats en culture.
La fexofénadine est un antihistaminique presque exclusivement éliminé par sécrétion
biliaire. En effet, seulement 10 % de la dose administrée est éliminée dans l’urine et moins de
5 % est métabolisé par le foie402, 403
. La fexofénadine est un substrat pour les transporteurs
Oatp et P-gp404
et a une faible biodisponibilité associée à un transport rétrograde par la P-gp
intestinale403
. Ceci fait d’elle une molécule de choix pour évaluer in vivo les effets de l’IRC
sur le transport des médicaments chez l’humain. Le midazolam est une benzodiazépine
principalement métabolisée en 1`-hydroxymidazolam par les CYP3A4 et CYP3A5 et n’est
pas transporté par la P-gp ou les Oatp ce qui en fait un candidat idéal pour l’étude de la
fonction du CYP3A hépatique chez l’humain182, 405, 406
.
La pharmacocinétique de la fexofénadine et du midazolam a été mesurée chez 10
patients ainsi que 10 personnes en santé appariées pour la taille, le poids et l’âge après une
seule administration par voie orale. Tous les sujets devaient éviter la consommation de
produits pouvant influencer l’expression et l’activité des transporteurs de médicaments (jus
de fruit, alcool, produits naturels, etc.). Une dose orale de chaque médicament a été
administrée chez chacun des patients, puis des prises de sang étaient effectuées à des temps
prédéterminés jusqu’à un maximum de 12 h post-administration. Les concentrations
plasmatiques ont ensuite été mesurées dans chaque échantillon à l’aide de chromatographie
liquide et spectrométrie de masse. Finalement, les paramètres pharmacocinétiques suivants
ont été déterminés chez chaque individu : concentration plasmatique maximale (Cmax), temps
nécessaire pour atteindre Cmax (tmax) et concentration plasmatique 12 heures post-dose (C12).
Les autres paramètres évalués étaient la constante d’élimination (z), le temps de demi-vie
(t½), la surface sous la courbe de l’intervalle 0-12 heures (SSC0-12) de même que la clairance
pour une dose orale (CLo). À l’exception du tmax, tous les paramètres ont été transformés
231
logarithmiquement pour assurer leur distribution normale, puis groupés pour pouvoir
comparer les résultats entre les patients dialysés et le groupe témoin.
Ces travaux ont été effectués en collaboration avec Thomas D. Nolin un chercheur
associé au Maine Medical Center. Les résultats obtenus sont les suivants. Ils ont observé
une augmentation de 240 % de la SSC0-12 de la fexofénadine chez les patients par rapport
aux témoins (1 245,5 ± 618,8 h∙ng/mL chez les sujets témoins versus 3 035,4 ± 1 393,8
h∙ng/mL chez les patients dialysés, p=0,003). De plus, la CLo de la fexofénadine semblait
significativement diminuée de 102,8 ± 37,9 L/h, chez les témoins à 37,9 ± 19,5 L/h (p<0,001)
chez les patients. Finalement, la demie-vie de la fexofénadine était augmentée à 4,6 ± 1,3 h
dans ce groupe par rapport aux témoins (3,4 ± 0,9 h), ce qui correspond à une hausse
d’environ 35 % (p = 0,019). À l’inverse, la pharmacocinétique du midazolam et du
1`-hydroxymidazolam n’était pas modifiée chez les sujets dialysés comparativement aux
sujets témoins selon les paramètres tenant compte de la concentration plasmatique totale du
midazolam et non de sa fraction libre. Ceci suggère que la fonction du CYP3A hépatique et
intestinal n’est pas affectée chez des sujets souffrant d’IRC terminale sous-dialyse.
Pourtant il a été démontré chez le rat que l’IRC entraînait des diminutions de
plusieurs Cyp hépatiques et intestinaux et, particulièrement, du Cyp3a50, 75
. Un niveau
d’urémie plus élevé et constant chez les animaux néphrectomisés pouvant atteindre des
concentrations plasmatiques d’urée allant jusqu’à <100 et même <500 mg/dL80, 81
comparativement aux sujets dialysés de l’étude qui présentent une concentration
plasmatique moyenne d’urée de 47.8 ± 8.7 mg/dL pourrait expliquer cette différence. La
dialyse permet aussi d’épurer le sang de plusieurs toxines urémiques capables de moduler
le CYP3A s’accumulant en IRC, les patients dialysés pourraient ainsi avoir une meilleure
expression et activité du CYP3A que les rats néphrectomisés non dialysés.
Deux études récentes menées par le même groupe que celle-ci tendent à confirmer
cette hypothèse. En effet, Nolin et al. ont repris l’expérience de Dowling et al.63
mesurant
232
la clairance non rénale de l’érythromycine par test d’exhalation chez des sujets souffrant
d’IRC, mais ils l’ont mesurée avant puis après une séance d’hémodialyse407
. Ils ont
démontré une augmentation de 27 % de l’activité du CYP3A4 chez les patients après la
séance de dialyse, tel que mesuré par l’exhalation de 14
CO2, suggérant une augmentation de
la clairance non rénale de l’érythromycine après la dialyse407
. Toutefois, l’étude ne
comprenait pas de groupe témoin. On ne peut donc pas comparer l’exhalation du 14
CO2
chez les sujets après la dialyse à celle de sujets sains407
. Le test d’exhalation de
l’érythromycine est basé sur le principe que la N-déméthylation par le CYP3A de
l’érythromycine marquée au 14
C libère le carbone marqué qui est ensuite exhalé sous forme
de 14
CO2408
. Il a longtemps été considéré qu’une diminution de la quantité de CO2
radiomarqué exhalé signifiait une diminution de l’activité du CYP3A hépatique. Toutefois,
comme mentionné précédemment, des études démontrent que, en plus d’être
biotransformée par le CYP3A, l’érythromycine est sujette au transport par l’OATP et la
P-gp409, 410
et qu’une diminution de l’influx de l’érythromycine dans les cellules par
l’OATP pourrait aussi se traduire par une diminution de l’exhalation de 14
CO2409
.
La diminution de la biotransformation de l’érythromycine chez les sujets souffrant
d’IRC terminale avant la dialyse est-elle donc due à une diminution de l’activité du
CYP3A4 ou à une diminution de l’influx hépatique de l’érythromycine par l’OATP?
Lequel de ces paramètres est restauré par la dialyse augmentant la biotransformation de
l’érythromycine? Une étude a démontré que l’incubation de microsomes de foie de rats
normaux avec du sérum provenant de rats souffrant d’insuffisance rénale pouvait diminuer
de 50 % le métabolisme du losartan par le Cyp3a microsomial90
. De la même façon, une
étude a démontré que des microsomes de foie humain normaux présentent une diminution
de 80 % de la biotransformation du midazolam lorsqu’ils sont en présence de plasma
provenant de patients souffrant d’IRC411
. Ceci démontre que, indépendamment de
l’expression protéique du Cyp3a, le sérum ou le plasma de sujets urémiques peut diminuer
son activité. De plus, une autre étude in vitro a démontré que le sérum prélevé sur des
patients après la séance de dialyse n’avait plus d’effet modulateur sur l’expression des
233
Cyp1a, Cyp2c et Cyp3a exprimés dans des hépatocytes de rats normaux incubés avec ce
sérum et améliorait significativement l’activité du Cyp3a hépatique tel que mesuré dans des
microsomes d’hépatocytes de rats77
. Il est donc possible que les bienfaits de la dialyse sur
l’expression et l’activité du CYP3A4 aient permis d’augmenter de 27 % la
biotransformation de l’érythromycine dans l’étude de Nolin et al. publiée en 2006407
. Il est
aussi possible que la dialyse ait augmenté l’expression et l’activité du CYP3A4 chez les
sujets dialysés de cette étude pour les ramener à des valeurs équivalentes à celles observées
chez les sujets sains, entraînant une biotransformation équivalente du midazolam chez les
sujets sains et les sujets dialysés de cette étude. Toutefois, nous ne pouvons exclure qu’une
diminution, puis une restauration de l’activité de l’OATP soient en cause dans les études
sur l’érythromycine.
La fexofénadine est un substrat des OATP1B1 et OATP1B3 hépatiques ainsi que de
l’OATP1A2 intestinal et de la P-gp412
. On observe une augmentation de sa SSC0-12 chez les
patients dialysés, ce qui démontre qu’il semble bien y avoir un effet de l’IRC sur le
transport de la fexofénadine. Il est toutefois difficile de distinguer si cet effet se situe dans
l’intestin, le foie ou les deux. En effet, une augmentation de la SSC0-12 est généralement
attribuable à une augmentation de la biodisponibilité d’un substrat, une diminution de sa
clairance, ou aux deux phénomènes combinés. La biodisponibilité de la fexofénadine
pourrait, dans ce cas-ci, être due à un efflux réduit par la P-gp intestinale ou à une
augmentation de son influx intestinal par l’OATP1A2. Une diminution de la clairance
hépatique de la fexofénadine pourrait être causée par une diminution de son influx
hépatique par OATP1B1 et OATP1B3 ou par une réduction de son efflux biliaire par la
P-gp.
La fexofénadine n’ayant jamais été administrée par voie intraveineuse, on ne
connaît pas sa biodisponibilité exacte413
, de même qu’il est impossible de la déterminer à
l’aide des données recueillies dans cette étude. Toutefois, il a été démontré que la P-gp
intestinale joue un rôle essentiel dans l’absorption de la fexofénadine414
. De plus, nous
234
avons précédemment démontré que l’IRC entraînait une diminution de l’expression et de
l’activité de la P-gp intestinale chez le rat55
. Aussi, nous avons démontré que le plasma des
patients de l’étude pouvait diminuer l’expression de la P-gp dans des entérocytes de rats
comparativement au plasma des sujets témoins. Une telle diminution dans l’intestin humain
pourrait faire diminuer le transport rétrograde de la fexofénadine chez les patients et en
augmenter le pourcentage de la dose absorbée, par le fait même, la SSC0-12 serait
augmentée proportionnellement. Aucune modification de l’expression de l’Oatp3 intestinal
n’a été observée chez le rat55
et dans les entérocytes de rats incubés avec le plasma des
sujets à l’étude, suggérant un influx normal de la fexofénadine.
De plus, une diminution importante de la clairance de la fexofénadine a été
observée. Il s’agit toutefois de CLo mesurée selon l’équation CLo = (dose / SSC0-). Le
calcul de clairance dépend donc de la dose administrée par voie orale et non de la quantité
réelle de médicament à avoir atteint la circulation systémique. Ainsi, les modifications de la
biodisponibilité du médicament qui pourraient survenir chez les patients souffrant d’IRC ne
sont pas prises en compte dans cette équation. On ne peut donc déterminer avec certitude
l’ampleur de la diminution de la CLo de la fexofénadine secondaire à une diminution de
transport vers la bile, puisqu’on ne peut affirmer que l’augmentation de la SSC0-12 n’est pas
en partie due à une augmentation de la biodisponibilité du médicament suite à la diminution
de P-gp intestinale. L’augmentation de la demi-vie permet toutefois de supposer que la
clairance biliaire est bien diminuée par l’IRC. En effet, la demi-vie dépend de la constante
d’élimination qui n’est pas modifiée par la biodisponibilité d’un composé. Le volume de
distribution (Vd) du médicament peut aussi influencer la demi-vie. Toutefois, la
fexofénadine est un composé basique, moyennement lié à l’1-glycoprotéine, avec un très
grand Vd, il est donc peu probable que l’IRC affecte son Vd. L’augmentation de la demi-vie
est donc probablement due à une diminution de la CLo de la fexofénadine.
Comme mentionné précédemment, la fexofénadine est principalement éliminée par
sécrétion biliaire. Elle est un substrat des OATP1B1 et OATP1B3 et de la Pgp hépatiques.
235
Toutefois, il a été démontré que la P-gp hépatique jouait un rôle très limité dans son
excrétion biliaire414
. De plus, l’expression et l’activité de la Pgp hépatique sont induites
chez les rats souffrant d’IRC330
et son expression protéique est induite dans des hépatocytes
de rats incubés avec le plasma des sujets à l’étude. Le transport par la P-gp ne semble donc
pas responsable de la diminution de la clairance de la fexofénadine chez les sujets dialysés.
Chez les rats néphrectomisés, de même que dans les hépatocytes incubés avec le plasma
des sujets à l’étude, on observe une diminution de l’expression de l’Oatp2 hépatique. Il est
donc probable qu’une diminution de l’influx de la fexofénadine par les OATP hépatiques
entraîne la diminution de la clairance de la fexofénadine observée in vivo ainsi que
l’augmentation de sa demi-vie et de sa SSC0-12 chez les sujets dialysés.
Une étude récente visait à évaluer la pharmacocinétique de l’érythromycine après
une dose unique donnée par voie orale ou par voie intraveineuse chez des patients souffrant
d’IRC terminale415
. Les chercheurs ont observé des augmentations de 158 % et 68 % de la
SSC de l’érythromycine chez les patients comparativement aux témoins après
l’administration par voie orale et intraveineuse, respectivement. Bien qu’on puisse croire
que l’augmentation de la SSC de l’érythromycine après l’administration par voie orale soit
attribuable à une diminution de l’activité de la P-gp intestinale, les chercheurs l’ont
entièrement attribuée à une diminution de la clairance hépatique puisqu’ils n’ont pas
observé de différence dans la biodisponibilité intestinale de l’érythromycine entre les deux
groupes. Les chercheurs ont aussi démontré que le métabolisme par le CYP450 représente
moins de 15 % de la clairance de l’érythromycine. Ils en concluent donc qu’une diminution
de son import dans les hépatocytes par OATP est probablement aussi impliquée dans
l’augmentation de la SSC de l’érythromycine chez les sujets souffrant d’IRC terminale415
.
Il existe plusieurs limitations à cette étude. Tout d’abord, des polymorphismes des
gènes codant pour la P-gp416
et les OATP417
ont été associés à des altérations de l’activité
de ces transporteurs pouvant mener à une augmentation de la concentration plasmatique de
la fexofénadine. Puisque les sujets de l’étude n’ont pas été génotypés, il est possible qu’une
236
expression polymorphique de la P-gp ou des OATP chez certains sujets contribue à la
diminution de la clairance de la fexofénadine observée dans cette étude. Toutefois, devant
l’ampleur de la différence observée et l’absence de sujets présentant des données extrêmes
à l’intérieur des groupes, il est peu probable que des différences génotypiques soient
responsables des résultats obtenus. De plus, même s’il existe des polymorphismes des
CYP3A4 et CYP3A5 les variants ne semblent pas entraîner de modifications phénotypiques
de l’activité des enzymes pour la biotransformation du midazolam418-420
. Dans cette étude,
les patients prenant des substances connues pour être des modulateurs de l’expression et de
l’activité des enzymes de biotransformation ou des transporteurs de médicaments étaient
exclus. Il n’en demeure pas moins que les patients souffrant d’insuffisance rénale terminale
sont polymédicamentés et nous ne pouvons exclure qu’une interaction médicamenteuse
imprévue ait pu modifier la pharmacocinétique de la fexofénadine. Nous ne pouvons non
plus exclure que la présence des médicaments dans le sérum des patients ait affecté
l’expression des transporteurs de médicaments dans les cellules en culture.
En conclusion, cette étude rapporte les répercussions de l’IRC sur les paramètres
pharmacocinétiques d’une molécule biotransformée par le CYP3A et de deux molécules
sujettes au transport par les OATP et la P-gp chez des patients traités par hémodialyse. Elle
démontre que l’activité du CYP3A ne semble pas différente de celle de témoins en santé,
mais que le transport des médicaments par la P-gp intestinale et les OATP hépatiques
pourrait être altéré. En dressant le phénotype des sujets souffrant d’IRC traités en dialyse,
cette étude permet de mieux comprendre les mécanismes affectant le métabolisme et le
transport non rénal des médicaments chez ces patients. Les données recueillies dans cette
étude permettront ultimement d’aider les praticiens à identifier les options de traitement et
de dosage entraînant un effet maximum avec un minimum de toxicité.
Conclusion
Il est bien démontré que les patients souffrant d’IRC présentent une forte incidence
d’effets indésirables qui entraînent des coûts de traitement très élevés. Il a déjà été
démontré que des diminutions de l’élimination rénale, associée au taux de filtration
glomérulaire, et de l’élimination métabolique des médicaments peuvent être responsables
de l’augmentation des concentrations sanguines observées chez les sujets souffrant d’IRC.
De plus, des altérations dans l’expression et l’activité des transporteurs de médicaments
intestinaux pouvant entraîner une augmentation de la biodisponibilité des médicaments ont
été démontrées chez le rat. Dans le cadre de cette thèse, nous avons démontré, dans un
modèle de rat, des altérations de l’expression et de l’activité des transporteurs de
médicaments hépatiques, rénaux et cérébraux qui pourraient affecter l’élimination
hépatique et rénale ainsi que la distribution des médicaments au cerveau. La figure 31
résume les impacts de l’insuffisance rénale chronique sur la pharmacocinétique des
médicaments tels que nous les comprenons à ce jour.
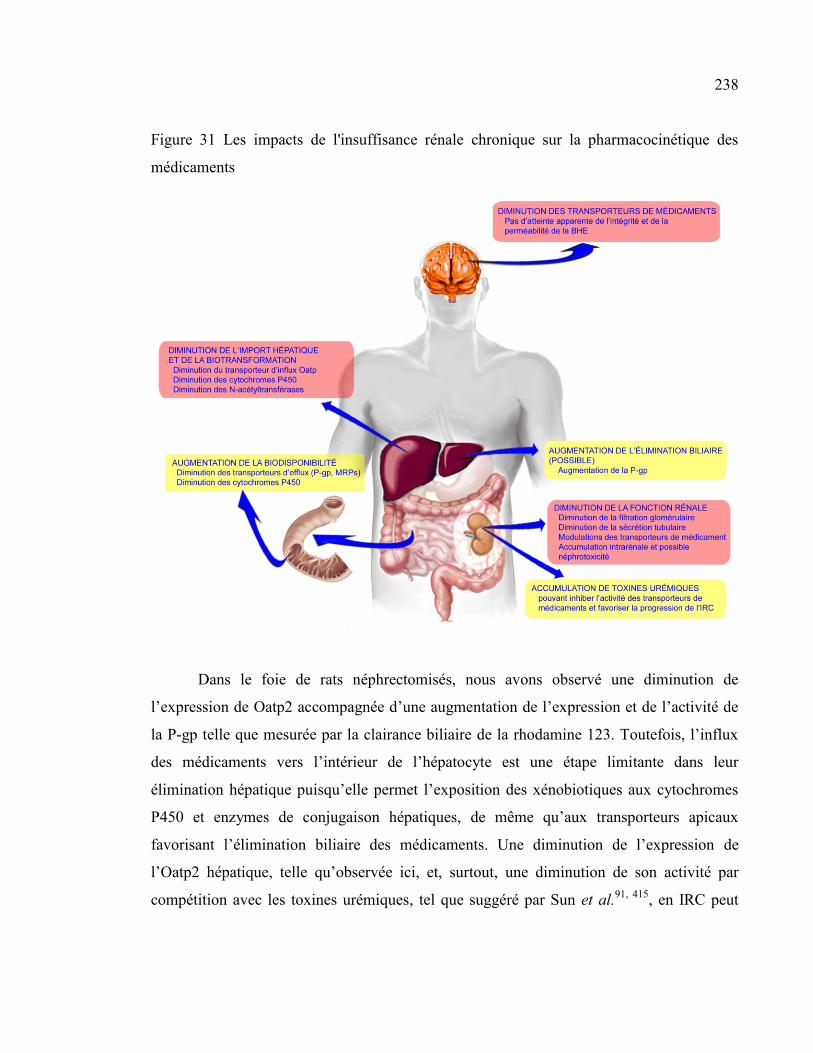
238
Figure 31 Les impacts de l'insuffisance rénale chronique sur la pharmacocinétique des
médicaments
Dans le foie de rats néphrectomisés, nous avons observé une diminution de
l’expression de Oatp2 accompagnée d’une augmentation de l’expression et de l’activité de
la P-gp telle que mesurée par la clairance biliaire de la rhodamine 123. Toutefois, l’influx
des médicaments vers l’intérieur de l’hépatocyte est une étape limitante dans leur
élimination hépatique puisqu’elle permet l’exposition des xénobiotiques aux cytochromes
P450 et enzymes de conjugaison hépatiques, de même qu’aux transporteurs apicaux
favorisant l’élimination biliaire des médicaments. Une diminution de l’expression de
l’Oatp2 hépatique, telle qu’observée ici, et, surtout, une diminution de son activité par
compétition avec les toxines urémiques, tel que suggéré par Sun et al.91, 415
, en IRC peut
239
ainsi réduire la clairance métabolique hépatique et la clairance biliaire des médicaments
ayant pour conséquence une augmentation des concentrations plasmatiques et,
potentiellement, la toxicité.
Nous avons également évalué les impacts de l’IRC sur les transporteurs de
médicaments rénaux. Nous avons tout d’abord démontré une diminution de la clairance
urinaire de la rhodamine 123, suggérant une altération de l’activité de la P-glycoprotéine
rénale. De plus, nous avons démontré que malgré une diminution de l’expression de
nombreux transporteurs d’influx rénaux (Oat1, Oat2, Oat3, OatK1/K2, Oatp1, Oatp4c1) et
l’augmentation de l’expression d’au moins deux transporteurs d’efflux (Mrp2, Mrp4), les
composés s’accumulent à l’intérieur des cellules épithéliales rénales entraînant ainsi une
diminution de la clairance rénale et pouvant favoriser l’apparition de néphrotoxicité. De
plus, il a été montré que des toxines urémiques, particulièrement l’indoxyl sulfate,
s’accumulant chez les sujets souffrant d’IRC pouvaient favoriser la progression de l’IRC
lorsqu’elles s’accumulent dans les cellules rénales. Les altérations du transport rénal des
médicaments en IRC pourraient donc former un cercle vicieux favorisant la progression de
l’IRC, puisque, de plus, nous avons montré une corrélation entre la sévérité de l’IRC et
l’importance des altérations de l’expression des transporteurs de médicaments.
Finalement, nous avons démontré que malgré une diminution de l’expression
protéique des transporteurs de médicaments exprimés à la barrière hématoencéphalique,
son intégrité et sa perméabilité ne sont pas affectées puisque nous n’observons pas
d’accumulation intracérébrale de médicaments chez les animaux néphrectomisés.
Les mécanismes exacts entraînant les modulations de l’expression et de l’activité
des transporteurs de médicaments en IRC demeurent inconnus. Nos résultats suggèrent
toutefois qu’un ou des facteurs présents dans le sérum des rats IRC en soient responsables.
En effet, l’incubation d’hépatocytes, de cellules rénales, d’astrocytes ou de cellules
endothéliales de cerveau de rat avec du sérum de rat urémique entraîne des altérations de
240
l’expression des transporteurs similaires à celles observées in vivo. De plus, l’incubation
d’une monocouche de cellules HK-2 avec ce sérum entraîne une diminution du transport de
la rhodamine 123, un substrat spécifique de la P-gp.
La dernière étude visait à établir si les modulations de l’expression et de l’activité
des cytochromes P450 et des transporteurs de médicaments intestinaux et hépatiques
observées chez le rat étaient aussi observées chez des sujets humains souffrant d’IRC. Les
résultats de l’étude pharmacocinétique du midazolam et de la fexofénadine suggèrent que le
transport intestinal par la P-gp et hépatique par les OATP puissent être affectés en IRC
augmentant les concentrations plasmatiques et diminuant la clairance de la fexofénadine,
alors que l’activité du cytochrome P450 3A ne semble pas différente entre des sujets
témoins et des sujets souffrant d’IRC dialysés.
Il reste maintenant à déterminer quels facteurs urémiques sont responsables des
modulations de l’expression et de l’activité des transporteurs de médicaments chez les
sujets souffrant d’IRC. Les études déjà publiées sur l’impact de différentes toxines
urémiques telles que la PTH, le CMPF, l’IS et le AH sur l’activité des transporteurs de
médicaments dans plusieurs organes en font des molécules de choix comme responsables
de ces modulations. De plus, les cytokines pro-inflammatoires fortement exprimées en IRC
sont aussi reconnues pour leur capacité à réguler l’expression et l’activité des transporteurs
de médicaments dans différents tissus. Toutefois, il existe de nombreuses toxines
urémiques (à ce jour, 115 ont été identifiées) possédant toutes une activité biologique. Il
sera un travail ardu de déterminer lesquelles, seules ou en combinaison, sont capables de
moduler l’expression et l’activité des transporteurs de médicaments.
Ces travaux sont importants puisqu’ils mettent à jour une nouvelle problématique
chez les sujets souffrant d’IRC. Nous devons maintenant identifier les facteurs et les
mécanismes impliqués afin d’ultimement développer des stratégies pour prévenir
l’apparition de toxicité et la progression de la maladie chez les patients et entre temps, aider
241
les praticiens à identifier les options de traitement et de dosage entraînant un effet
maximum avec un minimum de toxicité.
Bibliographie
1. A. S. Levey. Clinical practice. Nondiabetic kidney disease. N Engl J Med
2002;347(19):1505-11.
2. A. S. Levey, A. C. Schoolwerth, N. R. Burrows, et al. Comprehensive public health
strategies for preventing the development, progression, and complications of CKD:
report of an expert panel convened by the Centers for Disease Control and
Prevention. Am J Kidney Dis 2009;53(3):522-35.
3. Rapport annuel du Registre canadien des insuffisances et des transplantations
d’organes; Traitement du stade terminal de l’insuffisance organique au Canada, de
2000 à 2009, Ottawa (Ontario), 1,
4. J. Coresh, E. Selvin, L. A. Stevens, et al. Prevalence of chronic kidney disease in the
United States. JAMA 2007;298(17):2038-47.
5. D. E. Weiner. Public health consequences of chronic kidney disease. Clin Pharmacol
Ther 2009;86(5):566-9.
6. K/DOQI clinical practice guidelines for chronic kidney disease: evaluation,
classification, and stratification. Am J Kidney Dis 2002;39(2 Suppl 1):S1-266.
7. S. Campoy and R. Elwell. Pharmacology & CKD: how chronic kidney disease and its
complications alter drug response. Am J Nurs 2005;105(9):60-71; quiz 72.
8. T. D. Nolin, J. Naud, F. A. Leblond and V. Pichette. Emerging evidence of the impact
of kidney disease on drug metabolism and transport. Clin Pharmacol Ther
2008;83(6):898-903.
243
9. D. W. Bates, E. B. Miller, D. J. Cullen, et al. Patient risk factors for adverse drug
events in hospitalized patients. ADE Prevention Study Group. Arch Intern Med
1999;159(21):2553-60.
10. G. E. Matzke and R. F. Frey, Drug dosing in patients with impaired renal function,
New York, 750-763
11. G. R. Matzke and R. F. Frye. Drug administration in patients with renal insufficiency.
Minimising renal and extrarenal toxicity. Drug Saf 1997;16(3):205-31.
12. R. Zaidenstein, S. Eyal, S. Efrati, et al. Adverse drug events in hospitalized patients
treated with cardiovascular drugs and anticoagulants. Pharmacoepidemiol Drug Saf
2002;11(3):235-8.
13. T. G. Cantu, E. F. Ellerbeck, S. W. Yun, S. D. Castine and D. M. Kornhauser. Drug
prescribing for patients with changing renal function. Am J Hosp Pharm
1992;49(12):2944-8.
14. V. Pichette and F. A. Leblond. Drug metabolism in chronic renal failure. Curr Drug
Metab 2003;4(2):91-103.
15. A. W. Dreisbach. The influence of chronic renal failure on drug metabolism and
transport. Clin Pharmacol Ther 2009;86(5):553-6.
16. A. W. Dreisbach and J. J. Lertora. The effect of chronic renal failure on hepatic drug
metabolism and drug disposition. Semin Dial 2003;16(1):45-50.
17. A. W. Dreisbach and J. J. Lertora. The effect of chronic renal failure on drug
metabolism and transport. Expert Opin Drug Metab Toxicol 2008;4(8):1065-74.
18. A. C. Elston, M. K. Bayliss and G. R. Park. Effect of renal failure on drug
metabolism by the liver. Br J Anaesth 1993;71(2):282-90.
244
19. J. D. Momper, R. Venkataramanan and T. D. Nolin. Nonrenal drug clearance in
CKD: Searching for the path less traveled. Adv Chronic Kidney Dis 2010;17(5):384-
91.
20. T. D. Nolin. Altered nonrenal drug clearance in ESRD. Curr Opin Nephrol Hypertens
2008;17(6):555-9.
21. T. D. Nolin, R. F. Frye and G. R. Matzke. Hepatic drug metabolism and transport in
patients with kidney disease. Am J Kidney Dis 2003;42(5):906-25.
22. V. Pichette and F. Leblond. Metabolism of drugs in chronic renal failure. Recent Res
Devel Drug Metabol Disposition 2002;1:43-56.
23. H. Sun, L. Frassetto and L. Z. Benet. Effects of renal failure on drug transport and
metabolism. Pharmacol Ther 2006;109(1-2):1-11.
24. J. Naud, T. D. Nolin, F. A. Leblond and V. Pichette. Current understanding of drug
disposition in kidney disease. J Clin Pharmacol 2012;52(1 Suppl):10S-22S.
25. L. Barthe, J. Woodley and G. Houin. Gastrointestinal absorption of drugs: methods
and studies. Fundam Clin Pharmacol 1999;13(2):154-68.
26. L. Z. Benet and C. L. Cummins. The drug efflux-metabolism alliance: biochemical
aspects. Adv Drug Deliv Rev 2001;50(Suppl 1):S3-S11.
27. S. D. Hall, K. E. Thummel, P. B. Watkins, et al. Molecular and physical mechanisms
of first-pass extraction. Drug Metab Dispos 1999;27(2):161-6.
28. D. R. Krishna and U. Klotz. Extrahepatic metabolism of drugs in humans. Clin
Pharmacokinet 1994;26(2):144-60.
29. V. J. Wacher, L. Salphati and L. Z. Benet. Active secretion and enterocytic drug
metabolism barriers to drug absorption. Adv Drug Deliv Rev 2001;46(1-3):89-102.
245
30. T. D. Nolin, R. F. Frye, P. Le, et al. ESRD impairs nonrenal clearance of
fexofenadine but not midazolam. J Am Soc Nephrol 2009;20(10):2269-76.
31. L. S. Kaminsky and M. J. Fasco. Small intestinal cytochromes P450. Crit Rev Toxicol
1991;21(6):407-22.
32. F. P. Guengerich, Human cytochrome P450 enzymes, New York, 473-536
33. A. Galetin, M. Gertz and J. B. Houston. Contribution of intestinal cytochrome p450-
mediated metabolism to drug-drug inhibition and induction interactions. Drug Metab
Pharmacokinet 2010;25(1):28-47.
34. F. P. Guengerich. Cytochromes P450, drugs, and diseases. Mol Interv 2003;3(4):194-
204.
35. R. J. Fontana, K. S. Lown, M. F. Paine, et al. Effects of a chargrilled meat diet on
expression of CYP3A, CYP1A, and P-glycoprotein levels in healthy volunteers.
Gastroenterology 1999;117(1):89-98.
36. W. M. McDonnell, J. M. Scheiman and P. G. Traber. Induction of cytochrome
P450IA genes (CYP1A) by omeprazole in the human alimentary tract.
Gastroenterology 1992;103(5):1509-16.
37. L. Balant, A. Gorgia, A. Marmy and J. M. Tschopp. [Clearance concept applied to
pharmacokinetics: 2. Experience with tolamolol (beta-blocking agent) in renal
insufficiency (author's transl)]. Nephrologie 1980;1(4):177-82.
38. J. N. Barnes, A. J. Williams, M. J. Tomson, P. A. Toseland and F. J. Goodwin.
Dihydrocodeine in renal failure: further evidence for an important role of the kidney
in the handling of opioid drugs. Br Med J (Clin Res Ed) 1985;290(6470):740-2.
246
39. G. Bianchetti, G. Graziani, D. Brancaccio, et al. Pharmacokinetics and effects of
propranolol in terminal uraemic patients and in patients undergoing regular dialysis
treatment. Clin Pharmacokinet 1976;1(5):373-84.
40. T. P. Gibson, K. M. Giacomini and W. A. Briggs. Propoxyphene and
norpropoxyphene plasm a concentrations in the anephric patients. Clin Pharmacol
Ther 1980;27:665-770.
41. A. Kanfer, G. Stamatakis, J. C. Torlotin, et al. Changes in erythromycin
pharmacokinetics induced by renal failure. Clin Nephrol 1987;27(3):147-50.
42. H. Okabe, Y. Hashimoto and K. I. Inui. Pharmacokinetics and bioavailability of
tacrolimus in rats with experimental renal dysfunction. J Pharm Pharmacol
2000;52(12):1467-72.
43. R. L. Talbert. Drug dosing in renal insufficiency. J Clin Pharmacol 1994;34(2):99-
110.
44. L. Z. Benet, T. Izumi, Y. Zhang, J. A. Silverman and V. J. Wacher. Intestinal MDR
transport proteins and P-450 enzymes as barriers to oral drug delivery. J Control
Release 1999;62(1-2):25-31.
45. P. Du Souich, H. Maurice and L. Heroux. Contribution of the small intestine to the
first-pass uptake and systemic clearance of propranolol in rabbits. Drug Metab
Dispos 1995;23(2):279-84.
46. Y. W. Lam, S. Banerji, C. Hatfield and R. L. Talbert. Principles of drug
administration in renal insufficiency. Clin Pharmacokinet 1997;32(1):30-57.
47. S. Gabardi and S. Abramson. Drug dosing in chronic kidney disease. Med Clin North
Am 2005;89(3):649-87.
247
48. R. Gugler and H. Allgayer. Effects of antacids on the clinical pharmacokinetics of
drugs. An update. Clin Pharmacokinet 1990;18(3):210-9.
49. W. L. St Peter, K. A. Redic-Kill and C. E. Halstenson. Clinical pharmacokinetics of
antibiotics in patients with impaired renal function. Clin Pharmacokinet
1992;22(3):169-210.
50. F. A. Leblond, M. Petrucci, P. Dube, et al. Downregulation of intestinal cytochrome
p450 in chronic renal failure. J Am Soc Nephrol 2002;13(6):1579-85.
51. H. Okabe, I. Yano, Y. Hashimoto, H. Saito and K. Inui. Evaluation of increased
bioavailability of tacrolimus in rats with experimental renal dysfunction. J Pharm
Pharmacol 2002;54(1):65-70.
52. Z. H. Huang, T. Murakami, A. Okochi, et al. Expression and function of P-
glycoprotein in rats with glycerol-induced acute renal failure. Eur J Pharmacol
2000;406(3):453-60.
53. T. Murakami, R. Yumoto, J. Nagai and M. Takano. Factors affecting the expression
and function of P-glycoprotein in rats: drug treatments and diseased states. Pharmazie
2002;57(2):102-7.
54. C. Veau, C. Leroy, H. Banide, et al. Effect of chronic renal failure on the expression
and function of rat intestinal P-glycoprotein in drug excretion. Nephrol Dial
Transplant 2001;16(8):1607-14.
55. J. Naud, J. Michaud, C. Boisvert, et al. Down-regulation of intestinal drug
transporters in chronic renal failure in rats. J Pharmacol Exp Ther 2007;320(3):978-
85.
56. R. Vanholder, R. De Smet and S. Ringoir. Factors influencing drug protein binding in
patients with end stage renal failure. Eur J Clin Pharmacol 1993;44(Suppl 1):S17-21.

248
57. S. K. Swan and W. M. Bennett. Drug dosing guidelines in patients with renal failure.
West J Med 1992;156(6):633-8.
58. S. Erill, P. du Souich and H. Courteau. Carbamylation of proteins and sulfacetamide
free fraction in serum in experimentally-induced high blood urea states. Res Commun
Chem Pathol Pharmacol 1985;50(1):45-56.
59. R. Vanholder, N. Van Landschoot, R. De Smet, A. Schoots and S. Ringoir. Drug
protein binding in chronic renal failure: evaluation of nine drugs. Kidney Int
1988;33(5):996-1004.
60. S. V. Vormfelde, W. Muck, S. M. Freudenthaler, et al. Pharmacokinetics of
cerivastatin in renal impairment are predicted by low serum albumin concentration
rather than by low creatinine clearance. J Clin Pharmacol 1999;39(2):147-54.
61. Y. Shitara, T. Itoh, H. Sato, A. P. Li and Y. Sugiyama. Inhibition of transporter-
mediated hepatic uptake as a mechanism for drug-drug interaction between
cerivastatin and cyclosporin A. J Pharmacol Exp Ther 2003;304(2):610-6.
62. M. Yamazaki, S. Akiyama, R. Nishigaki and Y. Sugiyama. Uptake is the rate-limiting
step in the overall hepatic elimination of pravastatin at steady-state in rats. Pharm Res
1996;13(10):1559-64.
63. T. C. Dowling, A. E. Briglia, J. C. Fink, et al. Characterization of hepatic cytochrome
p4503A activity in patients with end-stage renal disease. Clin Pharmacol Ther
2003;73(5):427-34.
64. P. B. Watkins, S. A. Murray, L. G. Winkelman, et al. Erythromycin breath test as an
assay of glucocorticoid-inducible liver cytochromes P-450. Studies in rats and
patients. J Clin Invest 1989;83(2):688-97.
249
65. P. Nicolas, M. Tod, C. Padoin and O. Petitjean. Clinical pharmacokinetics of
diacerein. Clin Pharmacokinet 1998;35(5):347-59.
66. P. Debord, K. Louchahi, M. Tod, et al. Influence of renal function on the
pharmacokinetics of diacerein after a single oral dose. Eur J Drug Metab
Pharmacokinet 1994;19(1):13-9.
67. R. Osborne, S. Joel, K. Grebenik, D. Trew and M. Slevin. The pharmacokinetics of
morphine and morphine glucuronides in kidney failure. Clin Pharmacol Ther
1993;54(2):158-67.
68. E. Singlas, J. C. Pioger, A. M. Taburet, J. N. Colin and J. P. Fillastre. Zidovudine
disposition in patients with severe renal impairment: influence of hemodialysis. Clin
Pharmacol Ther 1989;46(2):190-7.
69. P. du Souich and S. Erill. Metabolism of procainamide in patients with chronic heart
failure, chronic respiratory failure and chronic renal failure. Eur J Clin Pharmacol
1978;14(1):21-7.
70. T. P. Gibson, A. J. Atkinson, Jr., E. Matusik, L. D. Nelson and W. A. Briggs.
Kinetics of procainamide and N-acetylprocainamide in renal failure. Kidney Int
1977;12(6):422-9.
71. E. Karlsson. Clinical pharmacokinetics of procainamide. Clin Pharmacokinet
1978;3(2):97-107.
72. Y. G. Kim, J. G. Shin, S. G. Shin, et al. Decreased acetylation of isoniazid in chronic
renal failure. Clin Pharmacol Ther 1993;54(6):612-20.
73. S. N. de Wildt, G. L. Kearns, J. S. Leeder and J. N. van den Anker. Cytochrome P450
3A: ontogeny and drug disposition. Clin Pharmacokinet 1999;37(6):485-505.
250
74. K. Venkatakrishnan, L. L. Von Moltke and D. J. Greenblatt. Human drug metabolism
and the cytochromes P450: application and relevance of in vitro models. J Clin
Pharmacol 2001;41(11):1149-79.
75. F. Leblond, C. Guevin, C. Demers, et al. Downregulation of hepatic cytochrome
P450 in chronic renal failure. J Am Soc Nephrol 2001;12(2):326-32.
76. F. A. Leblond, L. Giroux, J. P. Villeneuve and V. Pichette. Decreased in vivo
metabolism of drugs in chronic renal failure. Drug Metab Dispos 2000;28(11):1317-
20.
77. J. Michaud, T. D. Nolin, J. Naud, et al. Effect of hemodialysis on hepatic cytochrome
P450 functional expression. J Pharmacol Sci 2008;108(2):157-63.
78. H. Okabe, M. Hasunuma and Y. Hashimoto. The hepatic and intestinal metabolic
activities of P450 in rats with surgery- and drug-induced renal dysfunction. Pharm
Res 2003;20(10):1591-4.
79. N. Uchida, N. Kurata, K. Shimada, et al. Changes of hepatic microsomal oxidative
drug metabolizing enzymes in chronic renal failure (CRF) rats by partial
nephrectomy. Jpn J Pharmacol 1995;68(4):431-9.
80. C. Guevin, J. Michaud, J. Naud, F. A. Leblond and V. Pichette. Down-regulation of
hepatic cytochrome P450 in chronic renal failure: role of uremic mediators. Br J
Pharmacol 2002;137(7):1039-46.
81. J. Michaud, P. Dubé, J. Naud, et al. Effects of serum from patients with chronic renal
failure on rat hepatic cytochrome P450. Br J Pharmacol 2005;144(8):1067-77.
82. C. Yu, J. K. Ritter, R. J. Krieg, et al. Effect of chronic renal insufficiency on hepatic
and renal udp-glucuronyltransferases in rats. Drug Metab Dispos 2006;34(4):621-7.
251
83. E. Simard, J. Naud, J. Michaud, et al. Downregulation of hepatic acetylation of drugs
in chronic renal failure. J Am Soc Nephrol 2008;19(7):1352-9.
84. J. Michaud, J. Naud, J. Chouinard, et al. Role of parathyroid hormone in the
downregulation of liver cytochrome P450 in chronic renal failure. J Am Soc Nephrol
2006;17(11):3041-8.
85. B. R. Bistrian. Role of the systemic inflammatory response syndrome in the
development of protein-calorie malnutrition in ESRD. Am J Kidney Dis 1998;32(6
Suppl 4):S113-7.
86. P. Stenvinkel. Inflammation in end-stage renal disease: the hidden enemy.
Nephrology (Carlton) 2006;11(1):36-41.
87. P. Stenvinkel, O. Heimburger, F. Paultre, et al. Strong association between
malnutrition, inflammation, and atherosclerosis in chronic renal failure. Kidney Int
1999;55(5):1899-911.
88. P. Stenvinkel, M. Ketteler, R. J. Johnson, et al. IL-10, IL-6, and TNF-alpha: central
factors in the altered cytokine network of uremia--the good, the bad, and the ugly.
Kidney Int 2005;67(4):1216-33.
89. Z. Abdel-Razzak, P. Loyer, A. Fautrel, et al. Cytokines down-regulate expression of
major cytochrome P-450 enzymes in adult human hepatocytes in primary culture.
Mol Pharmacol 1993;44(4):707-15.
90. T. Yoshitani, H. Yagi, N. Inotsume and M. Yasuhara. Effect of experimental renal
failure on the pharmacokinetics of losartan in rats. Biol Pharm Bull 2002;25(8):1077-
83.
91. H. Sun, Y. Huang, L. Frassetto and L. Z. Benet. Effects of uremic toxins on hepatic
uptake and metabolism of erythromycin. Drug Metab Dispos 2004;32(11):1239-46.
252
92. P. J. Meier and B. Stieger. Bile salt transporters. Annu Rev Physiol 2002;64:635-61.
93. H. Takikawa. Hepatobiliary transport of bile acids and organic anions. J
Hepatobiliary Pancreat Surg 2002;9(4):443-7.
94. G. A. Kullak-Ublick, B. Stieger and P. J. Meier. Enterohepatic bile salt transporters in
normal physiology and liver disease. Gastroenterology 2004;126(1):322-42.
95. D. Laouari, R. Yang, C. Veau, I. Blanke and G. Friedlander. Two apical multidrug
transporters, P-gp and MRP2, are differently altered in chronic renal failure. Am J
Physiol Renal Physiol 2001;280(4):F636-45.
96. A. A. El-Sheikh, R. Masereeuw and F. G. Russel. Mechanisms of renal anionic drug
transport. Eur J Pharmacol 2008;585(2-3):245-55.
97. B. Feng, J. L. LaPerle, G. Chang and M. V. Varma. Renal clearance in drug
discovery and development: molecular descriptors, drug transporters and disease
state. Expert Opin Drug Metab Toxicol 2010;6(8):939-52.
98. K. M. Giacomini, S. M. Huang, D. J. Tweedie, et al. Membrane transporters in drug
development. Nat Rev Drug Discov 2010;9(3):215-36.
99. K. I. Inui, S. Masuda and H. Saito. Cellular and molecular aspects of drug transport in
the kidney. Kidney Int 2000;58(3):944-58.
100. R. Masereeuw and F. G. Russel. Therapeutic implications of renal anionic drug
transporters. Pharmacol Ther 2010;126(2):200-16.
101. J. Nagai and M. Takano. Molecular-targeted approaches to reduce renal accumulation
of nephrotoxic drugs. Expert Opin Drug Metab Toxicol 2010;6(9):1125-38.
102. F. G. Russel, R. Masereeuw and R. A. van Aubel. Molecular aspects of renal anionic
drug transport. Annu Rev Physiol 2002;64:563-94.
253
103. T. Sekine, H. Miyazaki and H. Endou. Molecular physiology of renal organic anion
transporters. Am J Physiol Renal Physiol 2006;290(2):F251-61.
104. B. Hsiang, Y. Zhu, Z. Wang, et al. A novel human hepatic organic anion transporting
polypeptide (OATP2). Identification of a liver-specific human organic anion
transporting polypeptide and identification of rat and human hydroxymethylglutaryl-
CoA reductase inhibitor transporters. J Biol Chem 1999;274(52):37161-8.
105. Y. Zhang, L. Zhang, S. Abraham, et al. Assessment of the impact of renal impairment
on systemic exposure of new molecular entities: evaluation of recent new drug
applications. Clin Pharmacol Ther 2009;85(3):305-11.
106. C. B. Landersdorfer, C. M. Kirkpatrick, M. Kinzig, et al. Competitive inhibition of
renal tubular secretion of gemifloxacin by probenecid. Antimicrob Agents Chemother
2009;53(9):3902-7.
107. C. Yanxiao, X. Ruijuan, Y. Jin, et al. Organic anion and cation transporters are
possibly involved in renal excretion of entecavir in rats. Life Sci 2011;89(1-2):1-6.
108. T. Nakatani-Freshwater and D. R. Taft. Renal excretion of emtricitabine I: effects of
organic anion, organic cation, and nucleoside transport inhibitors on emtricitabine
excretion. J Pharm Sci 2008;97(12):5401-10.
109. Y. Sakurai, H. Motohashi, H. Ueo, et al. Expression levels of renal organic anion
transporters (OATs) and their correlation with anionic drug excretion in patients with
renal diseases. Pharm Res 2004;21(1):61-7.
110. L. Ji, S. Masuda, H. Saito and K. Inui. Down-regulation of rat organic cation
transporter rOCT2 by 5/6 nephrectomy. Kidney Int 2002;62(2):514-24.
254
111. T. Deguchi, M. Takemoto, N. Uehara, et al. Renal clearance of endogenous hippurate
correlates with expression levels of renal organic anion transporters in uremic rats. J
Pharmacol Exp Ther 2005;314(2):932-8.
112. A. Takeuchi, S. Masuda, H. Saito, T. Doi and K. Inui. Role of kidney-specific
organic anion transporters in the urinary excretion of methotrexate. Kidney Int
2001;60(3):1058-68.
113. N. J. Abbott. Astrocyte-endothelial interactions and blood-brain barrier permeability.
J Anat 2002;200(6):629-38.
114. N. J. Abbott, L. Ronnback and E. Hansson. Astrocyte-endothelial interactions at the
blood-brain barrier. Nat Rev Neurosci 2006;7(1):41-53.
115. R. C. Janzer and M. C. Raff. Astrocytes induce blood-brain barrier properties in
endothelial cells. Nature 1987;325(6101):253-7.
116. W. Neuhaus and C. R. Noe, Transport at the blood-brain barrier, Weinheim,
Germany, 263-298
117. P. T. Ronaldson, K. Babakhanian and R. Bendayan, Drug transport in the brain,
Hoboken, NJ, 411-462
118. J. F. Deeken and W. Loscher. The blood-brain barrier and cancer: transporters,
treatment, and Trojan horses. Clin Cancer Res 2007;13(6):1663-74.
119. S. Eyal, P. Hsiao and J. D. Unadkat. Drug interactions at the blood-brain barrier: fact
or fantasy? Pharmacol Ther 2009;123(1):80-104.
120. H. Kusuhara and Y. Sugiyama. Active efflux across the blood-brain barrier: role of
the solute carrier family. NeuroRx 2005;2(1):73-85.
255
121. W. Loscher and H. Potschka. Role of drug efflux transporters in the brain for drug
disposition and treatment of brain diseases. Prog Neurobiol 2005;76(1):22-76.
122. S. Oswald, M. Grube, W. Siegmund and H. K. Kroemer. Transporter-mediated
uptake into cellular compartments. Xenobiotica 2007;37(10-11):1171-95.
123. R. Kikuchi, H. Kusuhara, D. Sugiyama and Y. Sugiyama. Contribution of organic
anion transporter 3 (Slc22a8) to the elimination of p-aminohippuric acid and
benzylpenicillin across the blood-brain barrier. J Pharmacol Exp Ther
2003;306(1):51-8.
124. S. Mori, S. Ohtsuki, H. Takanaga, et al. Organic anion transporter 3 is involved in the
brain-to-blood efflux transport of thiopurine nucleobase analogs. J Neurochem
2004;90(4):931-41.
125. S. Mori, H. Takanaga, S. Ohtsuki, et al. Rat organic anion transporter 3 (rOAT3) is
responsible for brain-to-blood efflux of homovanillic acid at the abluminal membrane
of brain capillary endothelial cells. J Cereb Blood Flow Metab 2003;23(4):432-40.
126. S. Ohtsuki and T. Terasaki. Contribution of carrier-mediated transport systems to the
blood-brain barrier as a supporting and protecting interface for the brain; importance
for CNS drug discovery and development. Pharm Res 2007;24(9):1745-58.
127. A. Ose, M. Ito, H. Kusuhara, et al. Limited brain distribution of [3R,4R,5S]-4-
acetamido-5-amino-3-(1-ethylpropoxy)-1-cyclohexene-1-carboxylate phosphate (Ro
64-0802), a pharmacologically active form of oseltamivir, by active efflux across the
blood-brain barrier mediated by organic anion transporter 3 (Oat3/Slc22a8) and
multidrug resistance-associated protein 4 (Mrp4/Abcc4). Drug Metab Dispos
2009;37(2):315-21.
256
128. A. Ose, H. Kusuhara, C. Endo, et al. Functional characterization of mouse organic
anion transporting peptide 1a4 in the uptake and efflux of drugs across the blood-
brain barrier. Drug Metab Dispos 2010;38(1):168-76.
129. H. Alpay, O. Altun and N. K. Biyikli. Cefepime-induced non-convulsive status
epilepticus in a peritoneal dialysis patient. Pediatr Nephrol 2004;19(4):445-7.
130. D. Chatellier, M. Jourdain, J. Mangalaboyi, et al. Cefepime-induced neurotoxicity: an
underestimated complication of antibiotherapy in patients with acute renal failure.
Intensive Care Med 2002;28(2):214-7.
131. N. Ferrara, P. Abete, M. Giordano, et al. Neurotoxicity induced by Cefepime in a
very old hemodialysis patient. Clin Nephrol 2003;59(5):388-90.
132. L. Ci, H. Kusuhara, M. Adachi, et al. Involvement of MRP4 (ABCC4) in the luminal
efflux of ceftizoxime and cefazolin in the kidney. Mol Pharmacol 2007;71(6):1591-7.
133. Y. Nozaki, H. Kusuhara, T. Kondo, et al. Characterization of the uptake of organic
anion transporter (OAT) 1 and OAT3 substrates by human kidney slices. J
Pharmacol Exp Ther 2007;321(1):362-9.
134. H. Ueo, H. Motohashi, T. Katsura and K. Inui. Human organic anion transporter
hOAT3 is a potent transporter of cephalosporin antibiotics, in comparison with
hOAT1. Biochem Pharmacol 2005;70(7):1104-13.
135. K. B. Goralski, G. Hartmann, M. Piquette-Miller and K. W. Renton. Downregulation
of mdr1a expression in the brain and liver during CNS inflammation alters the in vivo
disposition of digoxin. Br J Pharmacol 2003;139(1):35-48.
136. V. Petrovic, S. Teng and M. Piquette-Miller. Regulation of drug transporters during
infection and inflammation. Mol Interv 2007;7(2):99-111.
257
137. Y. L. Zhao, J. Du, H. Kanazawa, et al. Effect of endotoxin on doxorubicin transport
across blood-brain barrier and P-glycoprotein function in mice. Eur J Pharmacol
2002;445(1-2):115-23.
138. T. Akahoshi, N. Kobayashi, S. Hosaka, et al. In-vivo induction of monocyte
chemotactic and activating factor in patients with chronic renal failure. Nephrol Dial
Transplant 1995;10(12):2244-9.
139. T. Higuchi, C. Yamamoto, T. Kuno, et al. Increased production of interleukin-1beta
and interleukin-1 receptor antagonist by peripheral blood mononuclear cells in
undialyzed chronic renal failure. Nephron 1997;76(1):26-31.
140. C. W. Oettinger, L. A. Bland, J. C. Oliver, et al. The effect of uremia on tumor
necrosis factor-alpha release after an in vitro whole-blood endotoxin challenge. J Am
Soc Nephrol 1994;4(11):1890-5.
141. G. Sunder-Plassmann, S. Kapiotis, C. Gasche and U. Klaar. Functional
characterization of cytokine autoantibodies in chronic renal failure patients. Kidney
Int 1994;45(5):1484-8.
142. R. Ziesche, M. Roth, E. Papakonstantinou, et al. A granulocyte inhibitory protein
overexpressed in chronic renal disease regulates expression of interleukin 6 and
interleukin 8. Proc Natl Acad Sci U S A 1994;91(1):301-5.
143. L. A. Stanley, B. C. Horsburgh, J. Ross, N. Scheer and C. R. Wolf. Drug transporters:
gatekeepers controlling access of xenobiotics to the cellular interior. Drug Metab Rev
2009;41(1):27-65.
144. C. F. Higgins. Multiple molecular mechanisms for multidrug resistance transporters.
Nature 2007;446(7137):749-57.
258
145. U. Hoffmann and H. K. Kroemer. The ABC transporters MDR1 and MRP2: multiple
functions in disposition of xenobiotics and drug resistance. Drug Metab Rev
2004;36(3-4):669-701.
146. A. H. Schinkel and J. W. Jonker. Mammalian drug efflux transporters of the ATP
binding cassette (ABC) family: an overview. Adv Drug Deliv Rev 2003;55(1):3-29.
147. T. Lin, O. Islam and K. Heese. ABC transporters, neural stem cells and neurogenesis-
-a different perspective. Cell Res 2006;16(11):857-71.
148. M. Dean, A. Rzhetsky and R. Allikmets. The human ATP-binding cassette (ABC)
transporter superfamily. Genome Res 2001;11(7):1156-66.
149. H. Lage. ABC-transporters: implications on drug resistance from microorganisms to
human cancers. Int J Antimicrob Agents 2003;22(3):188-99.
150. P. M. Jones and A. M. George. The ABC transporter structure and mechanism:
perspectives on recent research. Cell Mol Life Sci 2004;61(6):682-99.
151. P. M. Jones, M. L. O'Mara and A. M. George. ABC transporters: a riddle wrapped in
a mystery inside an enigma. Trends Biochem Sci 2009;34(10):520-31.
152. M. K. Choi, H. Kim, Y. H. Han, I. S. Song and C. K. Shim. Involvement of
Mrp2/MRP2 in the species different excretion route of benzylpenicillin between rat
and human. Xenobiotica 2009;39(2):171-81.
153. Y. Cui, J. Konig, J. K. Buchholz, et al. Drug resistance and ATP-dependent conjugate
transport mediated by the apical multidrug resistance protein, MRP2, permanently
expressed in human and canine cells. Mol Pharmacol 1999;55(5):929-37.
154. C. J. Endres, P. Hsiao, F. S. Chung and J. D. Unadkat. The role of transporters in
drug interactions. Eur J Pharm Sci 2006;27(5):501-17.
259
155. K. Jemnitz, K. Heredi-Szabo, J. Janossy, et al. ABCC2/Abcc2: a multispecific
transporter with dominant excretory functions. Drug Metab Rev 2010;42(3):402-36.
156. D. Keppler. Multidrug resistance proteins (MRPs, ABCCs): importance for
pathophysiology and drug therapy. Handb Exp Pharmacol 2011;201(201):299-323.
157. U. Roy, G. Chakravarty, K. Honer Zu Bentrup and D. Mondal. Montelukast is a
potent and durable inhibitor of multidrug resistance protein 2-mediated efflux of taxol
and saquinavir. Biol Pharm Bull 2009;32(12):2002-9.
158. S. Shen and W. Zhang. ABC transporters and drug efflux at the blood-brain barrier.
Rev Neurosci 2010;21(1):29-53.
159. A. T. Nies, M. Rius and D. Keppler, Multidrug resistance proteins of the ABCC
subfamilly, Hoboken, NJ, 263-318
160. J. Wijnholds, G. L. Scheffer, M. van der Valk, et al. Multidrug resistance protein 1
protects the oropharyngeal mucosal layer and the testicular tubules against drug-
induced damage. J Exp Med 1998;188(5):797-808.
161. K. C. Peng, F. Cluzeaud, M. Bens, et al. Tissue and cell distribution of the multidrug
resistance-associated protein (MRP) in mouse intestine and kidney. J Histochem
Cytochem 1999;47(6):757-68.
162. R. G. Deeley, C. Westlake and S. P. Cole. Transmembrane transport of endo- and
xenobiotics by mammalian ATP-binding cassette multidrug resistance proteins.
Physiol Rev 2006;86(3):849-99.
163. T. Litman, T. E. Druley, W. D. Stein and S. E. Bates. From MDR to MXR: new
understanding of multidrug resistance systems, their properties and clinical
significance. Cell Mol Life Sci 2001;58(7):931-59.
260
164. R. L. Juliano and V. Ling. A surface glycoprotein modulating drug permeability in
Chinese hamster ovary cell mutants. Biochim Biophys Acta 1976;455(1):152-62.
165. C. J. Chen, J. E. Chin, K. Ueda, et al. Internal duplication and homology with
bacterial transport proteins in the mdr1 (P-glycoprotein) gene from multidrug-
resistant human cells. Cell 1986;47(3):381-9.
166. P. Gros, M. Raymond, J. Bell and D. Housman. Cloning and characterization of a
second member of the mouse mdr gene family. Mol Cell Biol 1988;8(7):2770-8.
167. S. I. Hsu, L. Lothstein and S. B. Horwitz. Differential overexpression of three mdr
gene family members in multidrug-resistant J774.2 mouse cells. Evidence that
distinct P-glycoprotein precursors are encoded by unique mdr genes. J Biol Chem
1989;264(20):12053-62.
168. W. Loscher and H. Potschka. Blood-brain barrier active efflux transporters: ATP-
binding cassette gene family. NeuroRx 2005;2(1):86-98.
169. A. M. van der Bliek, P. M. Kooiman, C. Schneider and P. Borst. Sequence of mdr3
cDNA encoding a human P-glycoprotein. Gene 1988;71(2):401-11.
170. A. H. Schinkel. The physiological function of drug-transporting P-glycoproteins.
Semin Cancer Biol 1997;8(3):161-70.
171. Y. Shitara, H. Sato and Y. Sugiyama. Evaluation of drug-drug interaction in the
hepatobiliary and renal transport of drugs. Annu Rev Pharmacol Toxicol
2005;45:689-723.
172. W. T. Bellamy. P-glycoproteins and multidrug resistance. Annu Rev Pharmacol
Toxicol 1996;36:161-83.
173. M. M. Gottesman and I. Pastan. Biochemistry of multidrug resistance mediated by
the multidrug transporter. Annu Rev Biochem 1993;62:385-427.
261
174. M. M. Gottesman, I. Pastan and S. V. Ambudkar. P-glycoprotein and multidrug
resistance. Curr Opin Genet Dev 1996;6(5):610-7.
175. H. Kusuhara, H. Suzuki and Y. Sugiyama. The role of P-glycoprotein and canalicular
multispecific organic anion transporter in the hepatobiliary excretion of drugs. J
Pharm Sci 1998;87(9):1025-40.
176. A. H. Schinkel. P-Glycoprotein, a gatekeeper in the blood-brain barrier. Adv Drug
Deliv Rev 1999;36(2-3):179-194.
177. F. Thiebaut, T. Tsuruo, H. Hamada, et al. Cellular localization of the multidrug-
resistance gene product P-glycoprotein in normal human tissues. Proc Natl Acad Sci
U S A 1987;84(21):7735-8.
178. A. H. Schinkel, C. A. Mol, E. Wagenaar, et al. Multidrug resistance and the role of P-
glycoprotein knockout mice. Eur J Cancer 1995;31A(7-8):1295-8.
179. R. Callaghan and J. R. Riordan. Synthetic and natural opiates interact with P-
glycoprotein in multidrug-resistant cells. J Biol Chem 1993;268(21):16059-64.
180. K. Ueda, N. Okamura, M. Hirai, et al. Human P-glycoprotein transports cortisol,
aldosterone, and dexamethasone, but not progesterone. J Biol Chem
1992;267(34):24248-52.
181. A. H. Schinkel, J. J. Smit, O. van Tellingen, et al. Disruption of the mouse mdr1a P-
glycoprotein gene leads to a deficiency in the blood-brain barrier and to increased
sensitivity to drugs. Cell 1994;77(4):491-502.
182. R. B. Kim, C. Wandel, B. Leake, et al. Interrelationship between substrates and
inhibitors of human CYP3A and P-glycoprotein. Pharm Res 1999;16(3):408-14.
183. C. Wandel, R. B. Kim, S. Kajiji, et al. P-glycoprotein and cytochrome P-450 3A
inhibition: dissociation of inhibitory potencies. Cancer Res 1999;59(16):3944-8.
262
184. H. Glaeser. Importance of P-glycoprotein for drug-drug interactions. Handb Exp
Pharmacol 2011;201(201):285-97.
185. E. B. Leahey, Jr., J. A. Reiffel, R. E. Drusin, et al. Interaction between quinidine and
digoxin. JAMA 1978;240(6):533-4.
186. C. Woodland, S. Ito and G. Koren. A model for the prediction of digoxin-drug
interactions at the renal tubular cell level. Ther Drug Monit 1998;20(2):134-8.
187. S. Ito, C. Woodland, P. A. Harper and G. Koren. The mechanism of the verapamil-
digoxin interaction in renal tubular cells (LLC-PK1). Life Sci 1993;53(24):PL399-
403.
188. Y. Tanigawara, N. Okamura, M. Hirai, et al. Transport of digoxin by human P-
glycoprotein expressed in a porcine kidney epithelial cell line (LLC-PK1). J
Pharmacol Exp Ther 1992;263(2):840-5.
189. A. H. Schinkel, E. Wagenaar, C. A. Mol and L. van Deemter. P-glycoprotein in the
blood-brain barrier of mice influences the brain penetration and pharmacological
activity of many drugs. J Clin Invest 1996;97(11):2517-24.
190. A. J. Sadeque, C. Wandel, H. He, S. Shah and A. J. Wood. Increased drug delivery to
the brain by P-glycoprotein inhibition. Clin Pharmacol Ther 2000;68(3):231-7.
191. F. Ruschitzka, P. J. Meier, M. Turina, T. F. Luscher and G. Noll. Acute heart
transplant rejection due to Saint John's wort. Lancet 2000;355(9203):548-9.
192. S. P. Cole, G. Bhardwaj, J. H. Gerlach, et al. Overexpression of a transporter gene in
a multidrug-resistant human lung cancer cell line. Science 1992;258(5088):1650-4.
193. G. D. Kruh and M. G. Belinsky. The MRP family of drug efflux pumps. Oncogene
2003;22(47):7537-52.
263
194. G. D. Kruh, M. G. Belinsky, J. M. Gallo and K. Lee. Physiological and
pharmacological functions of Mrp2, Mrp3 and Mrp4 as determined from recent
studies on gene-disrupted mice. Cancer Metastasis Rev 2007;26(1):5-14.
195. D. Lautier, Y. Canitrot, R. G. Deeley and S. P. Cole. Multidrug resistance mediated
by the multidrug resistance protein (MRP) gene. Biochem Pharmacol
1996;52(7):967-77.
196. J. M. Maher, X. Cheng, A. L. Slitt, M. Z. Dieter and C. D. Klaassen. Induction of the
multidrug resistance-associated protein family of transporters by chemical activators
of receptor-mediated pathways in mouse liver. Drug Metab Dispos 2005;33(7):956-
62.
197. P. Borst, C. de Wolf and K. van de Wetering. Multidrug resistance-associated
proteins 3, 4, and 5. Pflugers Arch 2007;453(5):661-73.
198. J. E. Manautou, D. R. de Waart, C. Kunne, et al. Altered disposition of
acetaminophen in mice with a disruption of the Mrp3 gene. Hepatology
2005;42(5):1091-8.
199. F. G. Russel, J. B. Koenderink and R. Masereeuw. Multidrug resistance protein 4
(MRP4/ABCC4): a versatile efflux transporter for drugs and signalling molecules.
Trends Pharmacol Sci 2008;29(4):200-7.
200. J. Wijnholds, C. A. Mol, L. van Deemter, et al. Multidrug-resistance protein 5 is a
multispecific organic anion transporter able to transport nucleotide analogs. Proc Natl
Acad Sci U S A 2000;97(13):7476-81.
201. S. K. Konig, M. Herzog, D. Theile, et al. Impact of drug transporters on cellular
resistance towards saquinavir and darunavir. J Antimicrob Chemother
2010;65(11):2319-28.
264
202. A. Nannelli, F. Rossignolo, R. Tolando, et al. Expression and distribution of CYP3A
genes, CYP2B22, and MDR1, MRP1, MRP2, LRP efflux transporters in brain of
control and rifampicin-treated pigs. Mol Cell Biochem 2010;337(1-2):133-43.
203. M. Nishimura, A. Koeda, H. Morikawa, et al. Comparison of inducibility of
multidrug resistance (MDR)1, multidrug resistance-associated protein (MRP)1, and
MRP2 mRNAs by prototypical microsomal enzyme inducers in primary cultures of
human and cynomolgus monkey hepatocytes. Biol Pharm Bull 2008;31(11):2068-72.
204. M. Nishimura, A. Koeda, E. Suzuki, et al. Regulation of mRNA expression of
MDR1, MRP1, MRP2 and MRP3 by prototypical microsomal enzyme inducers in
primary cultures of human and rat hepatocytes. Drug Metab Pharmacokinet
2006;21(4):297-307.
205. A. T. Nies and D. Keppler. The apical conjugate efflux pump ABCC2 (MRP2).
Pflugers Arch 2007;453(5):643-59.
206. D. S. Miller, S. N. Nobmann, H. Gutmann, et al. Xenobiotic transport across isolated
brain microvessels studied by confocal microscopy. Mol Pharmacol
2000;58(6):1357-67.
207. E. A. van Vliet, S. Redeker, E. Aronica, P. M. Edelbroek and J. A. Gorter. Expression
of multidrug transporters MRP1, MRP2, and BCRP shortly after status epilepticus,
during the latent period, and in chronic epileptic rats. Epilepsia 2005;46(10):1569-80.
208. M. Horikawa, Y. Kato, C. A. Tyson and Y. Sugiyama. The potential for an
interaction between MRP2 (ABCC2) and various therapeutic agents: probenecid as a
candidate inhibitor of the biliary excretion of irinotecan metabolites. Drug Metab
Pharmacokinet 2002;17(1):23-33.
265
209. A. T. Nies, H. Koepsell, K. Damme and M. Schwab. Organic cation transporters
(OCTs, MATEs), in vitro and in vivo evidence for the importance in drug therapy.
Handb Exp Pharmacol 2011;201(201):105-67.
210. M. Rius, J. Hummel-Eisenbeiss, A. F. Hofmann and D. Keppler. Substrate specificity
of human ABCC4 (MRP4)-mediated cotransport of bile acids and reduced
glutathione. Am J Physiol Gastrointest Liver Physiol 2006;290(4):G640-9.
211. A. L. Slitt, N. J. Cherrington, J. M. Maher and C. D. Klaassen. Induction of multidrug
resistance protein 3 in rat liver is associated with altered vectorial excretion of
acetaminophen metabolites. Drug Metab Dispos 2003;31(9):1176-86.
212. R. A. van Aubel, P. H. Smeets, J. G. Peters, R. J. Bindels and F. G. Russel. The
MRP4/ABCC4 gene encodes a novel apical organic anion transporter in human
kidney proximal tubules: putative efflux pump for urinary cAMP and cGMP. J Am
Soc Nephrol 2002;13(3):595-603.
213. P. H. Smeets, R. A. van Aubel, A. C. Wouterse, J. J. van den Heuvel and F. G.
Russel. Contribution of multidrug resistance protein 2 (MRP2/ABCC2) to the renal
excretion of p-aminohippurate (PAH) and identification of MRP4 (ABCC4) as a
novel PAH transporter. J Am Soc Nephrol 2004;15(11):2828-35.
214. M. Leggas, M. Adachi, G. L. Scheffer, et al. Mrp4 confers resistance to topotecan
and protects the brain from chemotherapy. Mol Cell Biol 2004;24(17):7612-21.
215. G. Jedlitschky, B. Burchell and D. Keppler. The multidrug resistance protein 5
functions as an ATP-dependent export pump for cyclic nucleotides. J Biol Chem
2000;275(39):30069-74.
216. M. Hu, K. K. To, V. W. Mak and B. Tomlinson. The ABCG2 transporter and its
relations with the pharmacokinetics, drug interaction and lipid-lowering effects of
statins. Expert Opin Drug Metab Toxicol 2011;7(1):49-62.
266
217. R. W. Robey, O. Polgar, J. Deeken, K. K. W. To and S. E. Bates, Breast cancer
resistance protein, Hoboken, NJ, 319-358
218. K. W. Scotto. Transcriptional regulation of ABC drug transporters. Oncogene
2003;22(47):7496-511.
219. O. Polgar, R. W. Robey and S. E. Bates. ABCG2: structure, function and role in drug
response. Expert Opin Drug Metab Toxicol 2008;4(1):1-15.
220. P. A. Fetsch, A. Abati, T. Litman, et al. Localization of the ABCG2 mitoxantrone
resistance-associated protein in normal tissues. Cancer Lett 2006;235(1):84-92.
221. J. W. Jonker, J. W. Smit, R. F. Brinkhuis, et al. Role of breast cancer resistance
protein in the bioavailability and fetal penetration of topotecan. J Natl Cancer Inst
2000;92(20):1651-6.
222. A. E. van Herwaarden, J. W. Jonker, E. Wagenaar, et al. The breast cancer resistance
protein (Bcrp1/Abcg2) restricts exposure to the dietary carcinogen 2-amino-1-methyl-
6-phenylimidazo[4,5-b]pyridine. Cancer Res 2003;63(19):6447-52.
223. S. Cisternino, C. Mercier, F. Bourasset, F. Roux and J. M. Scherrmann. Expression,
up-regulation, and transport activity of the multidrug-resistance protein Abcg2 at the
mouse blood-brain barrier. Cancer Res 2004;64(9):3296-301.
224. P. Breedveld, D. Pluim, G. Cipriani, et al. The effect of Bcrp1 (Abcg2) on the in vivo
pharmacokinetics and brain penetration of imatinib mesylate (Gleevec): implications
for the use of breast cancer resistance protein and P-glycoprotein inhibitors to enable
the brain penetration of imatinib in patients. Cancer Res 2005;65(7):2577-82.
225. Y. J. Lee, H. Kusuhara, J. W. Jonker, A. H. Schinkel and Y. Sugiyama. Investigation
of efflux transport of dehydroepiandrosterone sulfate and mitoxantrone at the mouse
267
blood-brain barrier: a minor role of breast cancer resistance protein. J Pharmacol Exp
Ther 2005;312(1):44-52.
226. J. Konig. Uptake transporters of the human OATP family: molecular characteristics,
substrates, their role in drug-drug interactions, and functional consequences of
polymorphisms. Handb Exp Pharmacol 2011;201(201):1-28.
227. M. A. Hediger, M. F. Romero, J. B. Peng, et al. The ABCs of solute carriers:
physiological, pathological and therapeutic implications of human membrane
transport proteinsIntroduction. Pflugers Arch 2004;447(5):465-8.
228. E. Jacquemin, B. Hagenbuch, B. Stieger, A. W. Wolkoff and P. J. Meier. Expression
cloning of a rat liver Na(+)-independent organic anion transporter. Proc Natl Acad
Sci U S A 1994;91(1):133-7.
229. J. R. Kunta and P. J. Sinko. Intestinal drug transporters: in vivo function and clinical
importance. Curr Drug Metab 2004;5(1):109-24.
230. R. G. Tirona and R. B. Kim, Organic anion-transporting polypeptides, Hoboken, NJ,
75-104
231. M. Yarim and M. Koksal, Organic anion transporting polypeptides (Oatps/OATPs),
Weinheim, Germany, 81-112
232. S. Leuthold, B. Hagenbuch, N. Mohebbi, et al. Mechanisms of pH-gradient driven
transport mediated by organic anion polypeptide transporters. Am J Physiol Cell
Physiol 2009;296(3):C570-82.
233. T. Toyohara, T. Suzuki, R. Morimoto, et al. SLCO4C1 transporter eliminates uremic
toxins and attenuates hypertension and renal inflammation. J Am Soc Nephrol
2009;20(12):2546-55.
268
234. H. Fukuda, R. Ohashi, N. Ohashi, H. Yabuuchi and I. Tamai. Estimation of
transporters involved in the hepatobiliary transport of TA-0201CA using sandwich-
cultured rat hepatocytes from normal and multidrug resistance-associated protein 2-
deficient rats. Drug Metab Dispos 2010;38(9):1505-13.
235. M. G. Ismair, C. Stanca, H. R. Ha, et al. Interactions of glycyrrhizin with organic
anion transporting polypeptides of rat and human liver. Hepatol Res 2003;26(4):343-
347.
236. T. Lan, A. Rao, J. Haywood, et al. Interaction of macrolide antibiotics with
intestinally expressed human and rat organic anion-transporting polypeptides. Drug
Metab Dispos 2009;37(12):2375-82.
237. S. Masuda, H. Saito and K. I. Inui. Interactions of nonsteroidal anti-inflammatory
drugs with rat renal organic anion transporter, OAT-K1. J Pharmacol Exp Ther
1997;283(3):1039-42.
238. S. Masuda, K. Ibaramoto, A. Takeuchi, et al. Cloning and functional characterization
of a new multispecific organic anion transporter, OAT-K2, in rat kidney. Mol
Pharmacol 1999;55(4):743-52.
239. T. Mikkaichi, T. Suzuki, T. Onogawa, et al. Isolation and characterization of a
digoxin transporter and its rat homologue expressed in the kidney. Proc Natl Acad Sci
U S A 2004;101(10):3569-74.
240. M. Niemi. Role of OATP transporters in the disposition of drugs. Pharmacogenomics
2007;8(7):787-802.
241. T. Tanino, A. Nawa, M. Nakao, et al. Organic anion transporting polypeptide 2-
mediated uptake of paclitaxel and 2'-ethylcarbonate-linked paclitaxel in freshly
isolated rat hepatocytes. J Pharm Pharmacol 2009;61(8):1029-35.
269
242. H. Yamaguchi, M. Sugie, M. Okada, et al. Transport of estrone 3-sulfate mediated by
organic anion transporter OATP4C1: estrone 3-sulfate binds to the different
recognition site for digoxin in OATP4C1. Drug Metab Pharmacokinet
2010;25(3):314-7.
243. A. Kalliokoski and M. Niemi. Impact of OATP transporters on pharmacokinetics. Br
J Pharmacol 2009;158(3):693-705.
244. G. K. Dresser, D. G. Bailey, B. F. Leake, et al. Fruit juices inhibit organic anion
transporting polypeptide-mediated drug uptake to decrease the oral availability of
fexofenadine. Clin Pharmacol Ther 2002;71(1):11-20.
245. G. K. Dresser, R. B. Kim and D. G. Bailey. Effect of grapefruit juice volume on the
reduction of fexofenadine bioavailability: possible role of organic anion transporting
polypeptides. Clin Pharmacol Ther 2005;77(3):170-7.
246. H. Yamazaki, S. Hiroki, T. Urano, K. Inoue and T. Shimada. Effects of
roxithromycin, erythromycin and troleandomycin on their N-demethylation by rat and
human cytochrome P450 enzymes. Xenobiotica 1996;26(11):1143-53.
247. S. G. Simonson, A. Raza, P. D. Martin, et al. Rosuvastatin pharmacokinetics in heart
transplant recipients administered an antirejection regimen including cyclosporine.
Clin Pharmacol Ther 2004;76(2):167-77.
248. T. A. Jacobson. Comparative pharmacokinetic interaction profiles of pravastatin,
simvastatin, and atorvastatin when coadministered with cytochrome P450 inhibitors.
Am J Cardiol 2004;94(9):1140-6.
249. A. Seithel, S. Eberl, K. Singer, et al. The influence of macrolide antibiotics on the
uptake of organic anions and drugs mediated by OATP1B1 and OATP1B3. Drug
Metab Dispos 2007;35(5):779-86.
270
250. W. Lee, H. Glaeser, L. H. Smith, et al. Polymorphisms in human organic anion-
transporting polypeptide 1A2 (OATP1A2): implications for altered drug disposition
and central nervous system drug entry. J Biol Chem 2005;280(10):9610-7.
251. N. Anzai and H. Endou, Drug transport in the kidney, Hoboken, NJ, 463-493
252. H. Sun, H. Dai, N. Shaik and W. F. Elmquist. Drug efflux transporters in the CNS.
Adv Drug Deliv Rev 2003;55(1):83-105.
253. B. Gao, B. Hagenbuch, G. A. Kullak-Ublick, et al. Organic anion-transporting
polypeptides mediate transport of opioid peptides across blood-brain barrier. J
Pharmacol Exp Ther 2000;294(1):73-9.
254. B. L. Urquhart and R. B. Kim. Blood-brain barrier transporters and response to CNS-
active drugs. Eur J Clin Pharmacol 2009;65(11):1063-70.
255. M. Cvetkovic, B. Leake, M. F. Fromm, G. R. Wilkinson and R. B. Kim. OATP and
P-glycoprotein transporters mediate the cellular uptake and excretion of fexofenadine.
Drug Metab Dispos 1999;27(8):866-71.
256. B. Noe, B. Hagenbuch, B. Stieger and P. J. Meier. Isolation of a multispecific organic
anion and cardiac glycoside transporter from rat brain. Proc Natl Acad Sci U S A
1997;94(19):10346-50.
257. H. Asaba, K. Hosoya, H. Takanaga, et al. Blood-brain barrier is involved in the efflux
transport of a neuroactive steroid, dehydroepiandrosterone sulfate, via organic anion
transporting polypeptide 2. J Neurochem 2000;75(5):1907-16.
258. D. Sugiyama, H. Kusuhara, Y. Shitara, et al. Characterization of the efflux transport
of 17beta-estradiol-D-17beta-glucuronide from the brain across the blood-brain
barrier. J Pharmacol Exp Ther 2001;298(1):316-22.
271
259. R. Kikuchi, H. Kusuhara, T. Abe, H. Endou and Y. Sugiyama. Involvement of
multiple transporters in the efflux of 3-hydroxy-3-methylglutaryl-CoA reductase
inhibitors across the blood-brain barrier. J Pharmacol Exp Ther 2004;311(3):1147-
53.
260. C. Dagenais, J. Ducharme and G. M. Pollack. Uptake and efflux of the peptidic delta-
opioid receptor agonist. Neurosci Lett 2001;301(3):155-8.
261. F. Bourasset, S. Cisternino, J. Temsamani and J. M. Scherrmann. Evidence for an
active transport of morphine-6-beta-d-glucuronide but not P-glycoprotein-mediated at
the blood-brain barrier. J Neurochem 2003;86(6):1564-7.
262. H. Koepsell and H. Endou. The SLC22 drug transporter family. Pflugers Arch
2004;447(5):666-76.
263. J. A. Jacobsson, T. Haitina, J. Lindblom and R. Fredriksson. Identification of six
putative human transporters with structural similarity to the drug transporter SLC22
family. Genomics 2007;90(5):595-609.
264. S. A. Eraly, K. T. Bush, R. V. Sampogna, V. Bhatnagar and S. K. Nigam. The
molecular pharmacology of organic anion transporters: from DNA to FDA? Mol
Pharmacol 2004;65(3):479-87.
265. M. Nagle, D. M. Truong, V. Bhatnagar, et al., Organic anion transporters, Hoboken,
NJ, 51-73
266. J. Kindla, M. F. Fromm and J. Konig. In vitro evidence for the role of OATP and
OCT uptake transporters in drug-drug interactions. Expert Opin Drug Metab Toxicol
2009;5(5):489-500.
267. D. H. Sweet. Organic anion transporter (Slc22a) family members as mediators of
toxicity. Toxicol Appl Pharmacol 2005;204(3):198-215.
272
268. T. J. Urban and K. M. Giacomini, Organic cation transporters, Hoboken, NJ, 11-33
269. I. A. Qureshi, I. Elimrani, E. Seidman and G. Mitchell, Organic cation/carnitine
transporters, Hoboken, NJ, 35-50
270. T. Sekine, N. Watanabe, M. Hosoyamada, Y. Kanai and H. Endou. Expression
cloning and characterization of a novel multispecific organic anion transporter. J Biol
Chem 1997;272(30):18526-9.
271. D. H. Sweet, L. M. Chan, R. Walden, et al. Organic anion transporter 3 (Slc22a8) is a
dicarboxylate exchanger indirectly coupled to the Na+ gradient. Am J Physiol Renal
Physiol 2003;284(4):F763-9.
272. D. H. Sweet, N. A. Wolff and J. B. Pritchard. Expression cloning and characterization
of ROAT1. The basolateral organic anion transporter in rat kidney. J Biol Chem
1997;272(48):30088-95.
273. G. Burckhardt and B. C. Burckhardt. In vitro and in vivo evidence of the importance
of organic anion transporters (OATs) in drug therapy. Handb Exp Pharmacol
2011;201(201):29-104.
274. T. Deguchi, K. Isozaki, K. Yousuke, T. Terasaki and M. Otagiri. Involvement of
organic anion transporters in the efflux of uremic toxins across the blood-brain
barrier. J Neurochem 2006;96(4):1051-9.
275. Y. Kobayashi, N. Ohshiro, R. Sakai, et al. Transport mechanism and substrate
specificity of human organic anion transporter 2 (hOat2 [SLC22A7]). J Pharm
Pharmacol 2005;57(5):573-8.
276. S. Ohtsuki, H. Asaba, H. Takanaga, et al. Role of blood-brain barrier organic anion
transporter 3 (OAT3) in the efflux of indoxyl sulfate, a uremic toxin: its involvement
273
in neurotransmitter metabolite clearance from the brain. J Neurochem 2002;83(1):57-
66.
277. H. Tahara, M. Shono, H. Kusuhara, et al. Molecular cloning and functional analyses
of OAT1 and OAT3 from cynomolgus monkey kidney. Pharm Res 2005;22(4):647-
60.
278. Y. Uwai, H. Ida, Y. Tsuji, T. Katsura and K. Inui. Renal transport of adefovir,
cidofovir, and tenofovir by SLC22A family members (hOAT1, hOAT3, and hOCT2).
Pharm Res 2007;24(4):811-5.
279. C. E. Lopez-Nieto, G. You, K. T. Bush, et al. Molecular cloning and characterization
of NKT, a gene product related to the organic cation transporter family that is almost
exclusively expressed in the kidney. J Biol Chem 1997;272(10):6471-8.
280. M. Hosoyamada, T. Sekine, Y. Kanai and H. Endou. Molecular cloning and
functional expression of a multispecific organic anion transporter from human
kidney. Am J Physiol 1999;276(1 Pt 2):F122-8.
281. G. Reid, N. A. Wolff, F. M. Dautzenberg and G. Burckhardt. Cloning of a human
renal p-aminohippurate transporter, hROAT1. Kidney Blood Press Res 1998;21(2-
4):233-7.
282. S. A. Eraly, V. Vallon, D. A. Vaughn, et al. Decreased renal organic anion secretion
and plasma accumulation of endogenous organic anions in OAT1 knock-out mice. J
Biol Chem 2006;281(8):5072-83.
283. A. N. Rizwan and G. Burckhardt. Organic anion transporters of the SLC22 family:
biopharmaceutical, physiological, and pathological roles. Pharm Res 2007;24(3):450-
70.
274
284. G. R. Brown. Cephalosporin-probenecid drug interactions. Clin Pharmacokinet
1993;24(4):289-300.
285. K. C. Cundy, B. G. Petty, J. Flaherty, et al. Clinical pharmacokinetics of cidofovir in
human immunodeficiency virus-infected patients. Antimicrob Agents Chemother
1995;39(6):1247-52.
286. K. C. Cundy, Z. H. Li and W. A. Lee. Effect of probenecid on the distribution,
metabolism, and excretion of cidofovir in rabbits. Drug Metab Dispos
1996;24(3):315-21.
287. M. L. Doan, G. B. Mallory, S. L. Kaplan, et al. Treatment of adenovirus pneumonia
with cidofovir in pediatric lung transplant recipients. J Heart Lung Transplant
2007;26(9):883-9.
288. S. A. Lacy, M. J. Hitchcock, W. A. Lee, P. Tellier and K. C. Cundy. Effect of oral
probenecid coadministration on the chronic toxicity and pharmacokinetics of
intravenous cidofovir in cynomolgus monkeys. Toxicol Sci 1998;44(2):97-106.
289. J. P. Lalezari, W. L. Drew, E. Glutzer, et al. (S)-1-[3-hydroxy-2-
(phosphonylmethoxy)propyl]cytosine (cidofovir): results of a phase I/II study of a
novel antiviral nucleotide analogue. J Infect Dis 1995;171(4):788-96.
290. G. D. Simonson, A. C. Vincent, K. J. Roberg, Y. Huang and V. Iwanij. Molecular
cloning and characterization of a novel liver-specific transport protein. J Cell Sci
1994;107 ( Pt 4)(Pt 4):1065-72.
291. T. Sekine, S. H. Cha, M. Tsuda, et al. Identification of multispecific organic anion
transporter 2 expressed predominantly in the liver. FEBS Lett 1998;429(2):179-82.
275
292. W. Sun, R. R. Wu, P. D. van Poelje and M. D. Erion. Isolation of a family of organic
anion transporters from human liver and kidney. Biochem Biophys Res Commun
2001;283(2):417-22.
293. A. Enomoto, M. Takeda, M. Shimoda, et al. Interaction of human organic anion
transporters 2 and 4 with organic anion transport inhibitors. J Pharmacol Exp Ther
2002;301(3):797-802.
294. R. Kojima, T. Sekine, M. Kawachi, et al. Immunolocalization of multispecific
organic anion transporters, OAT1, OAT2, and OAT3, in rat kidney. J Am Soc
Nephrol 2002;13(4):848-57.
295. M. Ljubojevic, D. Balen, D. Breljak, et al. Renal expression of organic anion
transporter OAT2 in rats and mice is regulated by sex hormones. Am J Physiol Renal
Physiol 2007;292(1):F361-72.
296. K. P. Brady, H. Dushkin, D. Fornzler, et al. A novel putative transporter maps to the
osteosclerosis (oc) mutation and is not expressed in the oc mutant mouse. Genomics
1999;56(3):254-61.
297. S. H. Cha, T. Sekine, J. I. Fukushima, et al. Identification and characterization of
human organic anion transporter 3 expressing predominantly in the kidney. Mol
Pharmacol 2001;59(5):1277-86.
298. H. Kusuhara, T. Sekine, N. Utsunomiya-Tate, et al. Molecular cloning and
characterization of a new multispecific organic anion transporter from rat brain. J
Biol Chem 1999;274(19):13675-80.
299. J. E. Race, S. M. Grassl, W. J. Williams and E. J. Holtzman. Molecular cloning and
characterization of two novel human renal organic anion transporters (hOAT1 and
hOAT3). Biochem Biophys Res Commun 1999;255(2):508-14.
276
300. D. H. Sweet, D. S. Miller, J. B. Pritchard, et al. Impaired organic anion transport in
kidney and choroid plexus of organic anion transporter 3 (Oat3 (Slc22a8)) knockout
mice. J Biol Chem 2002;277(30):26934-43.
301. V. Vallon, T. Rieg, S. Y. Ahn, et al. Overlapping in vitro and in vivo specificities of
the organic anion transporters OAT1 and OAT3 for loop and thiazide diuretics. Am J
Physiol Renal Physiol 2008;294(4):F867-73.
302. A. L. Vanwert, R. M. Bailey and D. H. Sweet. Organic anion transporter 3
(Oat3/Slc22a8) knockout mice exhibit altered clearance and distribution of penicillin
G. Am J Physiol Renal Physiol 2007;293(4):F1332-41.
303. A. L. VanWert and D. H. Sweet. Impaired clearance of methotrexate in organic anion
transporter 3 (Slc22a8) knockout mice: a gender specific impact of reduced folates.
Pharm Res 2008;25(2):453-62.
304. A. L. Vanwert, C. Srimaroeng and D. H. Sweet. Organic anion transporter 3
(oat3/slc22a8) interacts with carboxyfluoroquinolones, and deletion increases
systemic exposure to ciprofloxacin. Mol Pharmacol 2008;74(1):122-31.
305. K. H. Beyer, H. F. Russo, E. K. Tillson, et al. 'Benemid,' p-(di-n-propylsulfamyl)-
benzoic acid; its renal affinity and its elimination. Am J Physiol 1951;166(3):625-40.
306. D. Overbosch, C. Van Gulpen, J. Hermans and H. Mattie. The effect of probenecid on
the renal tubular excretion of benzylpenicillin. Br J Clin Pharmacol 1988;25(1):51-8.
307. G. W. Aherne, E. Piall, V. Marks, G. Mould and W. F. White. Prolongation and
enhancement of serum methotrexate concentrations by probenecid. Br Med J
1978;1(6120):1097-9.
308. M. L. Frenia and K. S. Long. Methotrexate and nonsteroidal antiinflammatory drug
interactions. Ann Pharmacother 1992;26(2):234-7.
277
309. A. Thyss, G. Milano, J. Kubar, M. Namer and M. Schneider. Clinical and
pharmacokinetic evidence of a life-threatening interaction between methotrexate and
ketoprofen. Lancet 1986;1(8475):256-8.
310. A. Enomoto and H. Endou. Roles of organic anion transporters (OATs) and a urate
transporter (URAT1) in the pathophysiology of human disease. Clin Exp Nephrol
2005;9(3):195-205.
311. K. Mori, Y. Ogawa, K. Ebihara, et al. Kidney-specific expression of a novel mouse
organic cation transporter-like protein. FEBS Lett 1997;417(3):371-4.
312. A. Enomoto, H. Kimura, A. Chairoungdua, et al. Molecular identification of a renal
urate anion exchanger that regulates blood urate levels. Nature 2002;417(6887):447-
52.
313. M. Hosoyamada, K. Ichida, A. Enomoto, T. Hosoya and H. Endou. Function and
localization of urate transporter 1 in mouse kidney. J Am Soc Nephrol
2004;15(2):261-8.
314. K. Ichida. What lies behind serum urate concentration? Insights from genetic and
genomic studies. Genome Med 2009;1(12):118.
315. T. Iwanaga, M. Sato, T. Maeda, T. Ogihara and I. Tamai. Concentration-dependent
mode of interaction of angiotensin II receptor blockers with uric acid transporter. J
Pharmacol Exp Ther 2007;320(1):211-7.
316. J. Biber, M. Custer, A. Werner, B. Kaissling and H. Murer. Localization of NaPi-1, a
Na/Pi cotransporter, in rabbit kidney proximal tubules. II. Localization by
immunohistochemistry. Pflugers Arch 1993;424(3-4):210-5.
278
317. A. Werner, M. L. Moore, N. Mantei, et al. Cloning and expression of cDNA for a
Na/Pi cotransport system of kidney cortex. Proc Natl Acad Sci U S A
1991;88(21):9608-12.
318. S. S. Chong, K. Kristjansson, H. Y. Zoghbi and M. R. Hughes. Molecular cloning of
the cDNA encoding a human renal sodium phosphate transport protein and its
assignment to chromosome 6p21.3-p23. Genomics 1993;18(2):355-9.
319. K. Miyamoto, S. Tatsumi, T. Sonoda, et al. Cloning and functional expression of a
Na(+)-dependent phosphate co-transporter from human kidney: cDNA cloning and
functional expression. Biochem J 1995;305 ( Pt 1)(Pt 1):81-5.
320. A. E. Busch, A. Schuster, S. Waldegger, et al. Expression of a renal type I
sodium/phosphate transporter (NaPi-1) induces a conductance in Xenopus oocytes
permeable for organic and inorganic anions. Proc Natl Acad Sci U S A
1996;93(11):5347-51.
321. H. Uchino, I. Tamai, K. Yamashita, et al. p-aminohippuric acid transport at renal
apical membrane mediated by human inorganic phosphate transporter NPT1.
Biochem Biophys Res Commun 2000;270(1):254-9.
322. M. Iharada, T. Miyaji, T. Fujimoto, et al. Type 1 sodium-dependent phosphate
transporter (SLC17A1 Protein) is a Cl(-)-dependent urate exporter. J Biol Chem
2010;285(34):26107-13.
323. H. Yabuuchi, I. Tamai, K. Morita, et al. Hepatic sinusoidal membrane transport of
anionic drugs mediated by anion transporter Npt1. J Pharmacol Exp Ther
1998;286(3):1391-6.
324. T. Deguchi, S. Ohtsuki, M. Otagiri, et al. Major role of organic anion transporter 3 in
the transport of indoxyl sulfate in the kidney. Kidney Int 2002;61(5):1760-8.
279
325. S. Masuda, H. Saito, H. Nonoguchi, K. Tomita and K. Inui. mRNA distribution and
membrane localization of the OAT-K1 organic anion transporter in rat renal tubules.
FEBS Lett 1997;407(2):127-31.
326. E. C. Chow, H. Sun, A. A. Khan, G. M. Groothuis and K. S. Pang. Effects of
1alpha,25-dihydroxyvitamin D3 on transporters and enzymes of the rat intestine and
kidney in vivo. Biopharm Drug Dispos 2010;31(1):91-108.
327. O. H. Lowry, N. J. Rosebrough, A. L. Farr and R. J. Randall. Protein measurement
with the folin phenol reagent. J Biol Chem 1951;193:265-275.
328. J. Naud, L. P. Laurin, J. Michaud, et al. Effects of chronic renal failure on brain drug
transporters in rats. Drug Metab Dispos 2012;40(1):39-46.
329. J. Naud, J. Michaud, S. Beauchemin, et al. Effects of chronic renal failure on kidney
drug transporters and cytochrome p450 in rats. Drug Metab Dispos 2011;39(8):1363-
9.
330. J. Naud, J. Michaud, F. A. Leblond, et al. Effects of chronic renal failure on liver
drug transporters. Drug Metab Dispos 2008;36(1):124-8.
331. K. J. Livak and T. D. Schmittgen. Analysis of relative gene expression data using
real-time quantitative PCR and the 2(-Delta Delta C(T)) Method. Methods
2001;25(4):402-8.
332. R. Yumoto, T. Murakami, Y. Nakamoto, et al. Transport of rhodamine 123, a P-
glycoprotein substrate, across rat intestine and Caco-2 cell monolayers in the
presence of cytochrome P-450 3A-related compounds. J Pharmacol Exp Ther
1999;289(1):149-55.
280
333. A. S. Windass, S. Lowes, Y. Wang and C. D. Brown. The contribution of organic
anion transporters OAT1 and OAT3 to the renal uptake of rosuvastatin. J Pharmacol
Exp Ther 2007;322(3):1221-7.
334. L. M. Chan, S. Lowes and B. H. Hirst. The ABCs of drug transport in intestine and
liver: efflux proteins limiting drug absorption and bioavailability. Eur J Pharm Sci
2004;21(1):25-51.
335. M. A. Touchette and R. L. Slaughter. The effect of renal failure on hepatic drug
clearance. DICP 1991;25(11):1214-24.
336. K. I. Hirsch-Ernst, C. Ziemann, H. Foth, et al. Induction of mdr1b mRNA and P-
glycoprotein expression by tumor necrosis factor alpha in primary rat hepatocyte
cultures. J Cell Physiol 1998;176(3):506-15.
337. A. M. Belliard, B. Lacour, R. Farinotti and C. Leroy. Effect of tumor necrosis factor-
alpha and interferon-gamma on intestinal P-glycoprotein expression, activity, and
localization in Caco-2 cells. J Pharm Sci 2004;93(6):1524-36.
338. Y. M. Lee, I. S. Song, S. G. Kim, et al. The suppressed expression and functional
activity of hepatic P-glycoprotein in rats with protein-calorie malnutrition. J Pharm
Sci 2003;92(7):1323-30.
339. C. G. Dietrich, I. V. Martin, A. C. Porn, et al. Fasting induces basolateral uptake
transporters of the SLC family in the liver via HNF4alpha and PGC1alpha. Am J
Physiol Gastrointest Liver Physiol 2007;293(3):G585-90.
340. C. Chen, X. Cheng, M. Z. Dieter, Y. Tanaka and C. D. Klaassen. Activation of
cAMP-dependent signaling pathway induces mouse organic anion transporting
polypeptide 2 expression. Mol Pharmacol 2007;71(4):1159-64.
281
341. S. F. Altschul, T. L. Madden, A. A. Schaffer, et al. Gapped BLAST and PSI-BLAST:
a new generation of protein database search programs. Nucleic Acids Res
1997;25(17):3389-402.
342. B. Gao, M. V. St Pierre, B. Stieger and P. J. Meier. Differential expression of bile salt
and organic anion transporters in developing rat liver. J Hepatol 2004;41(2):201-8.
343. V. Keitel, J. Kartenbeck, A. T. Nies, et al. Impaired protein maturation of the
conjugate export pump multidrug resistance protein 2 as a consequence of a deletion
mutation in Dubin-Johnson syndrome. Hepatology 2000;32(6):1317-28.
344. S. Kikuchi, M. Hata, K. Fukumoto, et al. Radixin deficiency causes conjugated
hyperbilirubinemia with loss of Mrp2 from bile canalicular membranes. Nat Genet
2002;31(3):320-5.
345. A. Bretscher, D. Chambers, R. Nguyen and D. Reczek. ERM-Merlin and EBP50
protein families in plasma membrane organization and function. Annu Rev Cell Dev
Biol 2000;16:113-43.
346. P. Mangeat, C. Roy and M. Martin. ERM proteins in cell adhesion and membrane
dynamics. Trends Cell Biol 1999;9(5):187-92.
347. S. Tsukita and S. Yonemura. Cortical actin organization: lessons from ERM
(ezrin/radixin/moesin) proteins. J Biol Chem 1999;274(49):34507-10.
348. J. Saeki, S. Sekine and T. Horie. LPS-induced dissociation of multidrug resistance-
associated protein 2 (Mrp2) and radixin is associated with Mrp2 selective
internalization in rats. Biochem Pharmacol 2011;81(1):178-84.
349. T. K. Lee, A. S. Koh, Z. Cui, R. H. Pierce and N. Ballatori. N-glycosylation controls
functional activity of Oatp1, an organic anion transporter. Am J Physiol Gastrointest
Liver Physiol 2003;285(2):G371-81.
282
350. E. Hanggi, A. F. Grundschober, S. Leuthold, P. J. Meier and M. V. St-Pierre.
Functional analysis of the extracellular cysteine residues in the human organic anion
transporting polypeptide, OATP2B1. Mol Pharmacol 2006;70(3):806-17.
351. G. L. Guo and C. D. Klaassen. Protein kinase C suppresses rat organic anion
transporting polypeptide 1- and 2-mediated uptake. J Pharmacol Exp Ther
2001;299(2):551-7.
352. Y. Xiao, E. Nieves, R. H. Angeletti, G. A. Orr and A. W. Wolkoff. Rat organic anion
transporting protein 1A1 (Oatp1a1): purification and phosphopeptide assignment.
Biochemistry 2006;45(10):3357-69.
353. K. Kock, A. Koenen, B. Giese, et al. Rapid modulation of the organic anion
transporting polypeptide 2B1 (OATP2B1, SLCO2B1) function by protein kinase C-
mediated internalization. J Biol Chem 2010;285(15):11336-47.
354. P. P. Annaert, R. Z. Turncliff, C. L. Booth, D. R. Thakker and K. L. Brouwer. P-
glycoprotein-mediated in vitro biliary excretion in sandwich-cultured rat hepatocytes.
Drug Metab Dispos 2001;29(10):1277-83.
355. M. Kunihara, J. Nagai, T. Murakami and M. Takano. Renal excretion of rhodamine
123, a P-glycoprotein substrate, in rats with glycerol-induced acute renal failure. J
Pharm Pharmacol 1998;50(10):1161-5.
356. M. Tsujimoto, Y. Kinoshita, S. Hirata, et al. Effects of uremic serum and uremic
toxins on hepatic uptake of digoxin. Ther Drug Monit 2008;30(5):576-82.
357. S. A. Terlouw, R. Masereeuw and F. G. Russel. Modulatory effects of hormones,
drugs, and toxic events on renal organic anion transport. Biochem Pharmacol
2003;65(9):1393-405.
283
358. T. Deguchi, Y. Kouno, T. Terasaki, A. Takadate and M. Otagiri. Differential
contributions of rOat1 (Slc22a6) and rOat3 (Slc22a8) to the in vivo renal uptake of
uremic toxins in rats. Pharm Res 2005;22(4):619-27.
359. T. Deguchi, H. Kusuhara, A. Takadate, et al. Characterization of uremic toxin
transport by organic anion transporters in the kidney. Kidney Int 2004;65(1):162-74.
360. A. Enomoto and T. Niwa. Roles of organic anion transporters in the progression of
chronic renal failure. Ther Apher Dial 2007;11(Suppl 1):S27-31.
361. I. Leier, J. Hummel-Eisenbeiss, Y. Cui and D. Keppler. ATP-dependent para-
aminohippurate transport by apical multidrug resistance protein MRP2. Kidney Int
2000;57(4):1636-42.
362. Y. Tsutsumi, T. Deguchi, M. Takano, et al. Renal disposition of a furan dicarboxylic
acid and other uremic toxins in the rat. J Pharmacol Exp Ther 2002;303(2):880-7.
363. T. Niwa and M. Ise. Indoxyl sulfate, a circulating uremic toxin, stimulates the
progression of glomerular sclerosis. J Lab Clin Med 1994;124(1):96-104.
364. T. Niwa, M. Ise and T. Miyazaki. Progression of glomerular sclerosis in experimental
uremic rats by administration of indole, a precursor of indoxyl sulfate. Am J Nephrol
1994;14(3):207-12.
365. T. Niwa, S. Tsukushi, M. Ise, et al. Indoxyl sulfate and progression of renal failure:
effects of a low-protein diet and oral sorbent on indoxyl sulfate production in uremic
rats and undialyzed uremic patients. Miner Electrolyte Metab 1997;23(3-6):179-84.
366. R. A. Fishman. Blood-brain and CSF barriers to penicillin and related organic acids.
Arch Neurol 1966;15(2):113-24.
367. R. A. Fishman and N. H. Raskin. Experimental uremic encephalopathy. Permeability
and electrolyte metabolism of brain and other tissues. Arch Neurol 1967;17(1):10-21.
284
368. W. G. Mayhan. Effect of lipopolysaccharide on the permeability and reactivity of the
cerebral microcirculation: role of inducible nitric oxide synthase. Brain Res
1998;792(2):353-7.
369. W. G. Mayhan. Cellular mechanisms by which tumor necrosis factor-alpha produces
disruption of the blood-brain barrier. Brain Res 2002;927(2):144-52.
370. T. Nishioku, S. Dohgu, F. Takata, et al. Detachment of brain pericytes from the basal
lamina is involved in disruption of the blood-brain barrier caused by
lipopolysaccharide-induced sepsis in mice. Cell Mol Neurobiol 2009;29(3):309-16.
371. H. E. de Vries, M. C. Blom-Roosemalen, A. G. de Boer, et al. Effect of endotoxin on
permeability of bovine cerebral endothelial cell layers in vitro. J Pharmacol Exp Ther
1996;277(3):1418-23.
372. H. E. de Vries, M. C. Blom-Roosemalen, M. van Oosten, et al. The influence of
cytokines on the integrity of the blood-brain barrier in vitro. J Neuroimmunol
1996;64(1):37-43.
373. P. Lu, C. Gonzales, Y. Chen, et al. CNS penetration of small molecules following
local inflammation, widespread systemic inflammation or direct injury to the nervous
system. Life Sci 2009;85(11-12):450-6.
374. M. T. Mohammadi, S. M. Shid Moosavi and G. A. Dehghani. Contribution of nitric
oxide synthase (NOS) activity in blood-brain barrier disruption and edema after acute
ischemia/reperfusion in aortic coarctation-induced hypertensive rats. Iran Biomed J
2011;15(1-2):22-30.
375. A. M. Youssef, A. Hamidian Jahromi, C. G. Vijay, D. N. Granger and J. S.
Alexander. Intra-abdominal hypertension causes reversible blood-brain barrier
disruption. J Trauma Acute Care Surg 2012;72(1):183-8.
285
376. R. Vanholder, U. Baurmeister, P. Brunet, et al. A bench to bedside view of uremic
toxins. J Am Soc Nephrol 2008;19(5):863-70.
377. R. Vanholder, R. De Smet, G. Glorieux, et al. Review on uremic toxins:
classification, concentration, and interindividual variability. Kidney Int
2003;63(5):1934-43.
378. V. V. Sarnatskaya, W. E. Lindup, T. Niwa, et al. Effect of protein-bound uraemic
toxins on the thermodynamic characteristics of human albumin. Biochem Pharmacol
2002;63(7):1287-96.
379. N. Takamura, T. Maruyama and M. Otagiri. Effects of uremic toxins and fatty acids
on serum protein binding of furosemide: possible mechanism of the binding defect in
uremia. Clin Chem 1997;43(12):2274-80.
380. R. Levi and J. Silver. Pathogenesis of parathyroid dysfunction in end-stage kidney
disease. Pediatr Nephrol 2005;20(3):342-5.
381. X. Decleves, A. Jacob, S. Yousif, et al. Interplay of Drug Metabolizing CYP450
Enzymes and ABC Transporters in the Blood-Brain Barrier. Curr Drug Metab 2011.
382. J. Fan, S. Liu, Y. Du, et al. Up-regulation of transporters and enzymes by the vitamin
D receptor ligands, 1alpha,25-dihydroxyvitamin D3 and vitamin D analogs, in the
Caco-2 cell monolayer. J Pharmacol Exp Ther 2009;330(2):389-402.
383. B. L. Urquhart, R. G. Tirona and R. B. Kim. Nuclear receptors and the regulation of
drug-metabolizing enzymes and drug transporters: implications for interindividual
variability in response to drugs. J Clin Pharmacol 2007;47(5):566-78.
384. J. Nagai, I. Yano, Y. Hashimoto, M. Takano and K. Inui. Inhibition of PAH transport
by parathyroid hormone in OK cells: involvement of protein kinase C pathway. Am J
Physiol 1997;273(5 Pt 2):F674-9.
286
385. N. A. Wolff, K. Thies, N. Kuhnke, et al. Protein kinase C activation downregulates
human organic anion transporter 1-mediated transport through carrier internalization.
J Am Soc Nephrol 2003;14(8):1959-68.
386. M. Reyes and L. Z. Benet. Effects of uremic toxins on transport and metabolism of
different biopharmaceutics drug disposition classification system xenobiotics. J
Pharm Sci 2011;26(10):22640.
387. J. J. Carrero, M. I. Yilmaz, B. Lindholm and P. Stenvinkel. Cytokine dysregulation in
chronic kidney disease: how can we treat it? Blood Purif 2008;26(3):291-9.
388. H. Ando, Y. Nishio, K. Ito, et al. Effect of endotoxin on P-glycoprotein-mediated
biliary and renal excretion of rhodamine-123 in rats. Antimicrob Agents Chemother
2001;45(12):3462-7.
389. J. Kalitsky-Szirtes, A. Shayeganpour, D. R. Brocks and M. Piquette-Miller.
Suppression of drug-metabolizing enzymes and efflux transporters in the intestine of
endotoxin-treated rats. Drug Metab Dispos 2004;32(1):20-7.
390. M. Piquette-Miller, A. Pak, H. Kim, R. Anari and A. Shahzamani. Decreased
expression and activity of P-glycoprotein in rat liver during acute inflammation.
Pharm Res 1998;15(5):706-11.
391. N. J. Cherrington, A. L. Slitt, N. Li and C. D. Klaassen. Lipopolysaccharide-mediated
regulation of hepatic transporter mRNA levels in rats. Drug Metab Dispos
2004;32(7):734-41.
392. W. Tang, C. Yi, J. Kalitsky and M. Piquette-Miller. Endotoxin downregulates hepatic
expression of P-glycoprotein and MRP2 in 2-acetylaminofluorene-treated rats. Mol
Cell Biol Res Commun 2000;4(2):90-7.
287
393. G. Hartmann, H. Kim and M. Piquette-Miller. Regulation of the hepatic multidrug
resistance gene expression by endotoxin and inflammatory cytokines in mice. Int
Immunopharmacol 2001;1(2):189-99.
394. J. H. Wang, D. A. Scollard, S. Teng, R. M. Reilly and M. Piquette-Miller. Detection
of P-glycoprotein activity in endotoxemic rats by 99mTc-sestamibi imaging. J Nucl
Med 2005;46(9):1537-45.
395. M. von Wedel-Parlow, P. Wolte and H. J. Galla. Regulation of major efflux
transporters under inflammatory conditions at the blood-brain barrier in vitro. J
Neurochem 2009;111(1):111-8.
396. G. Hartmann, A. K. Cheung and M. Piquette-Miller. Inflammatory cytokines, but not
bile acids, regulate expression of murine hepatic anion transporters in endotoxemia. J
Pharmacol Exp Ther 2002;303(1):273-81.
397. M. Miyoshi, M. Nadai, A. Nitta, et al. Role of tumor necrosis factor-alpha in down-
regulation of hepatic cytochrome P450 and P-glycoprotein by endotoxin. Eur J
Pharmacol 2005;507(1-3):229-37.
398. E. Siewert, C. G. Dietrich, F. Lammert, et al. Interleukin-6 regulates hepatic
transporters during acute-phase response. Biochem Biophys Res Commun
2004;322(1):232-8.
399. B. Poller, J. Drewe, S. Krahenbuhl, J. Huwyler and H. Gutmann. Regulation of BCRP
(ABCG2) and P-glycoprotein (ABCB1) by cytokines in a model of the human blood-
brain barrier. Cell Mol Neurobiol 2010;30(1):63-70.
400. P. T. Ronaldson and R. Bendayan. HIV-1 viral envelope glycoprotein gp120 triggers
an inflammatory response in cultured rat astrocytes and regulates the functional
expression of P-glycoprotein. Mol Pharmacol 2006;70(3):1087-98.
288
401. L. A. Frassetto, H. Sun, Y. Huang and L. Z. Benet. Uremic toxins decrease hepatic
clearance but not oral bioavailability of erythromycin in patients with end stage renal
disease [Abstract]. J Am Soc Nephrol 2008;19:929A.
402. D. K. Robbins, M. A. Castles, D. J. Pack, V. O. Bhargava and S. J. Weir. Dose
proportionality and comparison of single and multiple dose pharmacokinetics of
fexofenadine (MDL 16455) and its enantiomers in healthy male volunteers.
Biopharm Drug Dispos 1998;19(7):455-63.
403. Allegra (fexofenadine hydrochloride). Physicians Desk Reference 2003.
404. H. Glaeser, D. G. Bailey, G. K. Dresser, et al. Intestinal drug transporter expression
and the impact of grapefruit juice in humans. Clin Pharmacol Ther 2007;81(3):362-
70.
405. J. I. Lee, D. Chaves-Gnecco, J. A. Amico, et al. Application of semisimultaneous
midazolam administration for hepatic and intestinal cytochrome P450 3A
phenotyping. Clin Pharmacol Ther 2002;72(6):718-28.
406. Y. S. Lin, A. L. Dowling, S. D. Quigley, et al. Co-regulation of CYP3A4 and
CYP3A5 and contribution to hepatic and intestinal midazolam metabolism. Mol
Pharmacol 2002;62(1):162-72.
407. T. D. Nolin, K. Appiah, S. A. Kendrick, et al. Hemodialysis acutely improves hepatic
CYP3A4 metabolic activity. J Am Soc Nephrol 2006;17(9):2363-7.
408. P. B. Watkins. Noninvasive tests of CYP3A enzymes. Pharmacogenetics
1994;4(4):171-84.
409. L. A. Frassetto, S. Poon, C. Tsourounis, C. Valera and L. Z. Benet. Effects of uptake
and efflux transporter inhibition on erythromycin breath test results. Clin Pharmacol
Ther 2007;81(6):828-32.
289
410. D. Kurnik, A. J. Wood and G. R. Wilkinson. The erythromycin breath test reflects P-
glycoprotein function independently of cytochrome P450 3A activity. Clin
Pharmacol Ther 2006;80(3):228-34.
411. A. M. Taburet, I. Vincent, L. Perello, et al. Impairment of drug biotransformation in
renal disease an in vitro model. American Society for Clinical Pharmacology and
Therapeutics 1996;59(2):136.
412. S. Matsushima, K. Maeda, N. Ishiguro, T. Igarashi and Y. Sugiyama. Investigation of
the inhibitory effects of various drugs on the hepatic uptake of fexofenadine in
humans. Drug Metab Dispos 2008;36(4):663-9.
413. C. Tannergren, N. Petri, L. Knutson, et al. Multiple transport mechanisms involved in
the intestinal absorption and first-pass extraction of fexofenadine. Clin Pharmacol
Ther 2003;74(5):423-36.
414. H. Tahara, H. Kusuhara, E. Fuse and Y. Sugiyama. P-glycoprotein plays a major role
in the efflux of fexofenadine in the small intestine and blood-brain barrier, but only a
limited role in its biliary excretion. Drug Metab Dispos 2005;33(7):963-8.
415. H. Sun, L. A. Frassetto, Y. Huang and L. Z. Benet. Hepatic clearance, but not gut
availability, of erythromycin is altered in patients with end-stage renal disease. Clin
Pharmacol Ther 2010;87(4):465-72.
416. S. Y. Yi, K. S. Hong, H. S. Lim, et al. A variant 2677A allele of the MDR1 gene
affects fexofenadine disposition. Clin Pharmacol Ther 2004;76(5):418-27.
417. M. Niemi, K. T. Kivisto, U. Hofmann, et al. Fexofenadine pharmacokinetics are
associated with a polymorphism of the SLCO1B1 gene (encoding OATP1B1). Br J
Clin Pharmacol 2005;59(5):602-4.
290
418. M. D. Floyd, G. Gervasini, A. L. Masica, et al. Genotype-phenotype associations for
common CYP3A4 and CYP3A5 variants in the basal and induced metabolism of
midazolam in European- and African-American men and women. Pharmacogenetics
2003;13(10):595-606.
419. E. D. Kharasch, A. Walker, N. Isoherranen, et al. Influence of CYP3A5 genotype on
the pharmacokinetics and pharmacodynamics of the cytochrome P4503A probes
alfentanil and midazolam. Clin Pharmacol Ther 2007;82(4):410-26.
420. C. Wandel, J. S. Witte, J. M. Hall, et al. CYP3A activity in African American and
European American men: population differences and functional effect of the
CYP3A4*1B5'-promoter region polymorphism. Clin Pharmacol Ther 2000;68(1):82-
91.