Distribution Pattern of Trees in a Hydrological Gradient
11
American Journal of Plant Sciences, 2013, 4, 663-673 http://dx.doi.org/10.4236/ajps.2013.43A085 Published Online March 2013 (http://www.scirp.org/journal/ajps) Distribution Pattern of Trees in a Hydrological Gradient below the Paraná-Paraguay River Confluence Sylvina Lorena Casco 1,2 , Juan José Neiff 1 1 Centro de Ecología Aplicada del Litoral, Consejo Nacional de Investigaciones Científicas y Técnicas, Universidad Nacional del Nordeste, Corrientes, Argentina; 2 Facultad de Ciencias Exactas y Naturales y Agrimensura, Universidad Nacional del Nordeste, Cor- rientes, Argentina. Email: [email protected] Received January 6 th , 2013; revised February 10 th , 2013; accepted February 26 th , 2013 ABSTRACT Riparian and riverine aquatic plant species have evolved within the context of flowing water habitats for which the flooding and droughts are the forcing factors that shape the community features, either through a positive or negative effect on the ecosystem’s function, according to the timing, frequency and magnitude of such events. In the Paraná floodplain landscape, topographic position is a crude indicator of the position along the complex gradient, but it also includes information about flood/drought periods and trees’ resilience to extreme hydrological phases. We present the occurrence of major tree species in riparian forests of the Paraná River on islands of different topographies in a section of the Paraná River downstream from the confluence with the Paraguay River. Our results suggest that each tree species had a preferred position in the topographic gradient, sites where the observed counts were more frequent. This trees species were more frequent between 2 and 8 m in the topographic position and were affected by 5 and 202 hydrosedi- mentologic pulses between 1949 and 1999. We suggest that knowledge of the distribution curves of the vegetation spe- cies present can help draw possible future scenarios of the river landscape. Future engineering works to alter the hydro- logical dynamics of Paraná should pay more attention to the distribution of riparian forests because they are indicators of changes at the landscape level and they are the support for the wildlife of the river. Keywords: Riverine Forests; River Pulse; Paraná Floodplain; Ecohydrology; Fluvial Landscape 1. Introduction The main driving force conditioning the structure and function of riparian forests in rivers is the water regime [1,2]. At the local scale, hydrologic and geomorphic processes play major roles in shaping the riparian envi- ronment [3-5], influencing the vegetation, soils and eco- systems dynamics [6-8]. Riparian and riverine aquatic plant species have evolved within the context of a flowing water habitat [9] for which flooding and droughts are forcing factors in shaping the community features, through either a positive or negative effect on the ecosystem’s function, according to the frequency, magnitude, amplitude, and timing of such events [10-16]. The selective pressures of particular flow regimes on the riverine biota, including the vegetation, have resulted in a range of morphological, life history and phenological adaptations [17]. Riparian and floodplain environments are known to support disturbance-adapted species as- semblages [17,18], frequently leading to defined vegeta- tion zonation in which the species’ lower distributional limits are determined by the specific tolerance to flood- ing [19-22] and droughts [10,16]. Knowledge of the spatial distribution of each species in the topographic gradient can indirectly assess the sen- sitivity of the trees to the hydrological conditions of both temperate and tropical rivers [8,23-25], but this is most evident in rivers with wide floodplains [2,26,27]. The tolerance to flooding varies among forests [28]; thus, minor variations in the frequency and duration of flood- ing and in the texture of soils determine the changes in their distribution along topographic gradients. In the Paraná floodplain landscape, topographic posi- tion is a crude indicator of the position along the com- plex gradient, but it also includes information about flood/drought periods and the resilience of trees to ex- treme hydrological phases [16]. The objectives of this study were as follows: 1) to analyse the distribution patterns of the major tree species in the riparian forests of the Lower Paraná River along a geomorphic gradient, and 2) to determine the influence of the pulses (frequency, flooding days, and dry soil period) for each topographic position to identify the boundaries Copyright © 2013 SciRes. AJPS
Transcript of Distribution Pattern of Trees in a Hydrological Gradient
American Journal of Plant Sciences, 2013, 4, 663-673 http://dx.doi.org/10.4236/ajps.2013.43A085 Published Online March 2013 (http://www.scirp.org/journal/ajps)
Distribution Pattern of Trees in a Hydrological Gradient below the Paraná-Paraguay River Confluence
Sylvina Lorena Casco1,2, Juan José Neiff1
1Centro de Ecología Aplicada del Litoral, Consejo Nacional de Investigaciones Científicas y Técnicas, Universidad Nacional del Nordeste, Corrientes, Argentina; 2Facultad de Ciencias Exactas y Naturales y Agrimensura, Universidad Nacional del Nordeste, Cor-rientes, Argentina. Email: [email protected] Received January 6th, 2013; revised February 10th, 2013; accepted February 26th, 2013
ABSTRACT
Riparian and riverine aquatic plant species have evolved within the context of flowing water habitats for which the flooding and droughts are the forcing factors that shape the community features, either through a positive or negative effect on the ecosystem’s function, according to the timing, frequency and magnitude of such events. In the Paraná floodplain landscape, topographic position is a crude indicator of the position along the complex gradient, but it also includes information about flood/drought periods and trees’ resilience to extreme hydrological phases. We present the occurrence of major tree species in riparian forests of the Paraná River on islands of different topographies in a section of the Paraná River downstream from the confluence with the Paraguay River. Our results suggest that each tree species had a preferred position in the topographic gradient, sites where the observed counts were more frequent. This trees species were more frequent between 2 and 8 m in the topographic position and were affected by 5 and 202 hydrosedi- mentologic pulses between 1949 and 1999. We suggest that knowledge of the distribution curves of the vegetation spe- cies present can help draw possible future scenarios of the river landscape. Future engineering works to alter the hydro- logical dynamics of Paraná should pay more attention to the distribution of riparian forests because they are indicators of changes at the landscape level and they are the support for the wildlife of the river. Keywords: Riverine Forests; River Pulse; Paraná Floodplain; Ecohydrology; Fluvial Landscape
1. Introduction
The main driving force conditioning the structure and function of riparian forests in rivers is the water regime [1,2]. At the local scale, hydrologic and geomorphic processes play major roles in shaping the riparian envi- ronment [3-5], influencing the vegetation, soils and eco- systems dynamics [6-8].
Riparian and riverine aquatic plant species have evolved within the context of a flowing water habitat [9] for which flooding and droughts are forcing factors in shaping the community features, through either a positive or negative effect on the ecosystem’s function, according to the frequency, magnitude, amplitude, and timing of such events [10-16].
The selective pressures of particular flow regimes on the riverine biota, including the vegetation, have resulted in a range of morphological, life history and phenological adaptations [17]. Riparian and floodplain environments are known to support disturbance-adapted species as- semblages [17,18], frequently leading to defined vegeta- tion zonation in which the species’ lower distributional
limits are determined by the specific tolerance to flood- ing [19-22] and droughts [10,16].
Knowledge of the spatial distribution of each species in the topographic gradient can indirectly assess the sen- sitivity of the trees to the hydrological conditions of both temperate and tropical rivers [8,23-25], but this is most evident in rivers with wide floodplains [2,26,27]. The tolerance to flooding varies among forests [28]; thus, minor variations in the frequency and duration of flood- ing and in the texture of soils determine the changes in their distribution along topographic gradients.
In the Paraná floodplain landscape, topographic posi- tion is a crude indicator of the position along the com- plex gradient, but it also includes information about flood/drought periods and the resilience of trees to ex- treme hydrological phases [16].
The objectives of this study were as follows: 1) to analyse the distribution patterns of the major tree species in the riparian forests of the Lower Paraná River along a geomorphic gradient, and 2) to determine the influence of the pulses (frequency, flooding days, and dry soil period) for each topographic position to identify the boundaries
Copyright © 2013 SciRes. AJPS
Distribution Pattern of Trees in a Hydrological Gradient below the Paraná-Paraguay River Confluence 664
of certain trees species in the riverine landscape. Our results could allow inferences a) to draw a broad
distribution model for the major tree species in the Lower Paraná River using data from every site and with differ- ent topographic positions and b) to identify and highlight the ecological risks for riverine ecosystems as a cones- quence of hydrological disturbances from nearby civil works (e.g., dams, channelisation, bridges).
2. Methods
2.1. Study Area
This study was performed below the confluence of the Paraná and Paraguay Rivers, in the Río de la Plata Basin that covers 3.1 × 10⁶ km2. Both rivers cross from north to south in the central region of South America, forming a river axis of 3400 km from the Pantanal of Mato Grosso to the Río de la Plata, in a belt of 18˚ south latitude.
The riparian forests studied are situated in the Lower Paraná River floodplain from the Humedales Chaco Ramsar site, Argentina (Figure 1), below its confluence with the Paraguay River (27˚17'40"S; 58˚36'42"W), to Empedrado, Corrientes (28˚02'29"S; 58˚52'21"W).
In this stretch, the Paraná River has a braided design, with more islands near the west bank because the high load of sediments from the Andes mountains reach the Paraná through its tributaries, the Bermejo and Paraguay Rivers (Figure 1).
The Upper Paraná waters deposit ten times less sedi- ment along the east bank than the west bank of the course reach. Therefore, in our study area, a stretch of 60 km below the Paraná-Paraguay confluence, the river is very different along either banks, as it is for other large rivers [29,30].
The geomorphology, soils, water quality, sediment, regional vegetation and other features of the river are described in previous publications [31-34]. In the present study, we focus on the hydrological features due to other environmental factors and depending on the hydrological fluctuations [2,30,35-37].
2.2. Hydrology
The Paraná River has a very irregular regime [10], with normal and extraordinary floods (above 6 and 8 m using the Corrientes gauge, respectively). At Corrientes (Ar- gentina) in 1983, the mean discharge was 16,000 m3·s−1, with a maximum of 60,000 m3·s−1 [38].
The extreme floods are attributed to ENSO (El Niño Southern Oscillation) events [39,40] and there were four extraordinary floods during the last century: June 1905, July 1983, June 1992 and May 1998. The second, with an absolute maximum value of 9.03 m, was a centenary flood that resulted in mortality of 40% of the riparian
forests [41].
2.3. Study Species
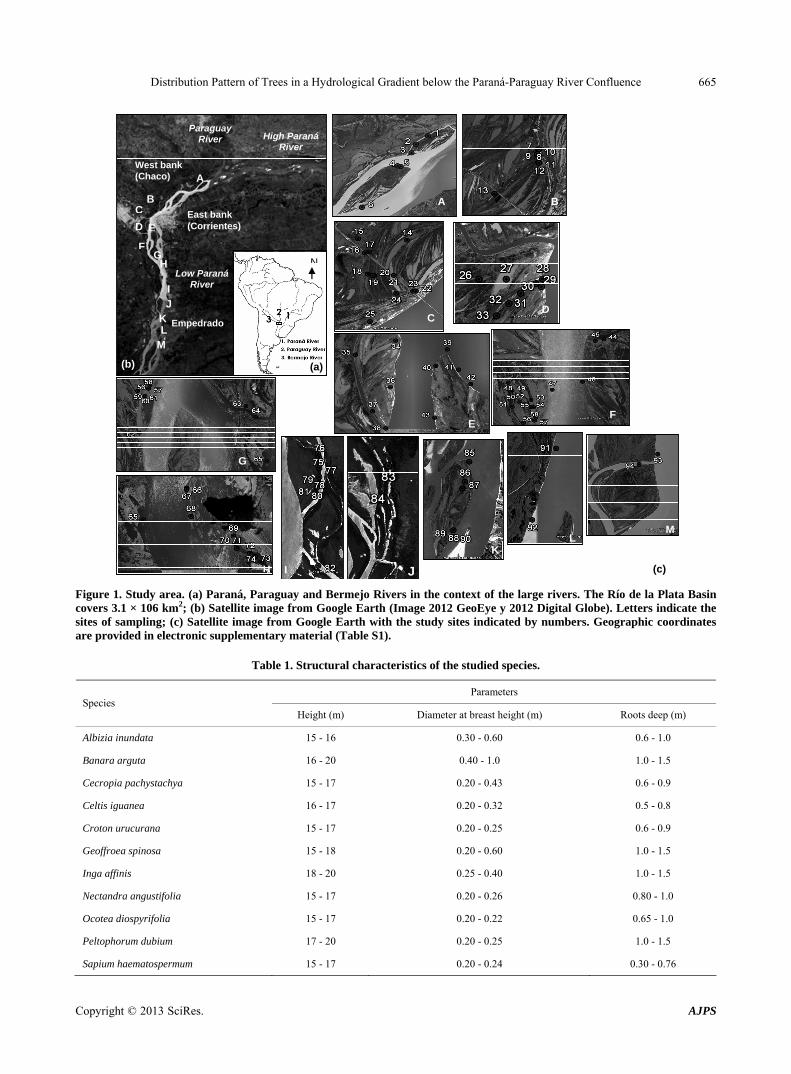
Of the thirty species of trees growing in the study area, we selected the most common in this stretch of the river. Albizia inundata (Mart.) Barneby & J. W. Grimes, Ba- nara arguta Briq., Cecropia pachystachya Trécul, Celtis iguanea (Jacq.) Sarg., Croton urucurana Baill., Geof- froea spinosa Jacq., Inga affinis DC., Nectandra angus- tifolia (Schrad.) Nees & Mart. ex Nees, Ocotea diospyri- folia (Meisn.) Mez, Peltophorum dubium (Spreng.) Taub. and Sapium haematospermum Müll. Arg. grows in the floodplain at more than 1000 km downstream, and some are found to the Delta in typical gallery forests. The ma- ture trees of these species measure up to 15 - 20 m in height and have spherical crowns, diameters at breast height of 20 to 100 cm, and roots that extend up to 1.5 m deep (Table 1). There are commonly two or three layers with trees of the different ages [2].
2.4. Sampling
Between September 1998 and November 1999, we reg- istered the occurrence of canopy trees, defined as stems > 10 cm DBH (diameter at breast height), in 94 sites lo- cated along a 60 km segment of the Lower Paraná River between Corrientes and Empedrado (Figure 1). The sites were chosen on the basis of the presence of mixed forests on both banks of the river and islands in the main chan- nel.
Because of the irregularities between one site and an- other in the floodplain, the topographic position of each location, rather than the distance from the river, was used as an indicator of connectivity with the river course at each point. The hydrologic connectivity was determined according to the Pringle concept [42-44] and connectivity begins when the water table of the river course in the gauge nearest to site exceeds the topographic level cor- responding to that point [13]. Afterward, the topographic position value was corrected using the zero level at the Corrientes gauge, which is 42.39 meters above sea level (m a.s.l.).
To compare the soil texture of the banks, we selected three characteristic profiles in the west and left bank and on the island of the main channel of the Paraná River, according to [35,45].
2.5. Data Analysis
The occurrence of canopy trees of the selected species at each topographic position was grouped at 10 cm intervals. Function R [46] was used to estimate the densities of the random variable topographic position (m) for each spe- ies at each of the course/banks. The occurrence of each c
Copyright © 2013 SciRes. AJPS
Distribution Pattern of Trees in a Hydrological Gradient below the Paraná-Paraguay River Confluence
Copyright © 2013 SciRes. AJPS
665
a
Paraguay River High Paraná
River
East bank (Corrientes)
West bank (Chaco)
Low Paraná River
D
H I J
KL
M
E
A B
C
G
F
(a)
N
Empedrado K
A
B C
D E
FG
H
I
J
L M
(b)
(c)
Figure 1. Study area. (a) Paraná, Paraguay and Bermejo Rivers in the context of the large rivers. The Río de la Plata Basin covers 3.1 × 10⁶ km2; (b) Satellite image from Google Earth (Image 2012 GeoEye y 2012 Digital Globe). Letters indicate the sites of sampling; (c) Satellite image from Google Earth with the study sites indicated by numbers. Geographic coordinates are provided in electronic supplementary material (Table S1).
Table 1. Structural characteristics of the studied species.
Parameters Species
Height (m) Diameter at breast height (m) Roots deep (m)
Albizia inundata 15 - 16 0.30 - 0.60 0.6 - 1.0
Banara arguta 16 - 20 0.40 - 1.0 1.0 - 1.5
Cecropia pachystachya 15 - 17 0.20 - 0.43 0.6 - 0.9
Celtis iguanea 16 - 17 0.20 - 0.32 0.5 - 0.8
Croton urucurana 15 - 17 0.20 - 0.25 0.6 - 0.9
Geoffroea spinosa 15 - 18 0.20 - 0.60 1.0 - 1.5
Inga affinis 18 - 20 0.25 - 0.40 1.0 - 1.5
Nectandra angustifolia 15 - 17 0.20 - 0.26 0.80 - 1.0
Ocotea diospyrifolia 15 - 17 0.20 - 0.22 0.65 - 1.0
Peltophorum dubium 17 - 20 0.20 - 0.25 1.0 - 1.5
Sapium haematospermum 15 - 17 0.20 - 0.24 0.30 - 0.76
Distribution Pattern of Trees in a Hydrological Gradient below the Paraná-Paraguay River Confluence 666
species along the topographic gradient of each site was integrated to obtain the 25th and 75th percentiles.
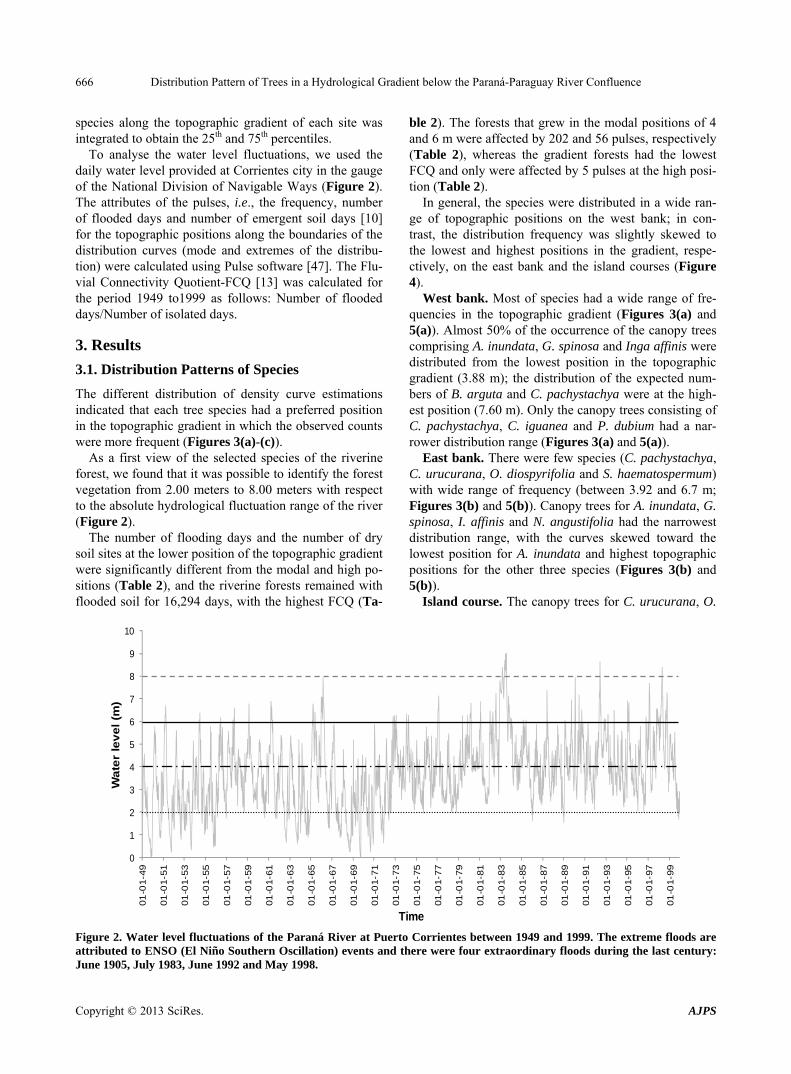
To analyse the water level fluctuations, we used the daily water level provided at Corrientes city in the gauge of the National Division of Navigable Ways (Figure 2). The attributes of the pulses, i.e., the frequency, number of flooded days and number of emergent soil days [10] for the topographic positions along the boundaries of the distribution curves (mode and extremes of the distribu- tion) were calculated using Pulse software [47]. The Flu- vial Connectivity Quotient-FCQ [13] was calculated for the period 1949 to1999 as follows: Number of flooded days/Number of isolated days.
3. Results
3.1. Distribution Patterns of Species
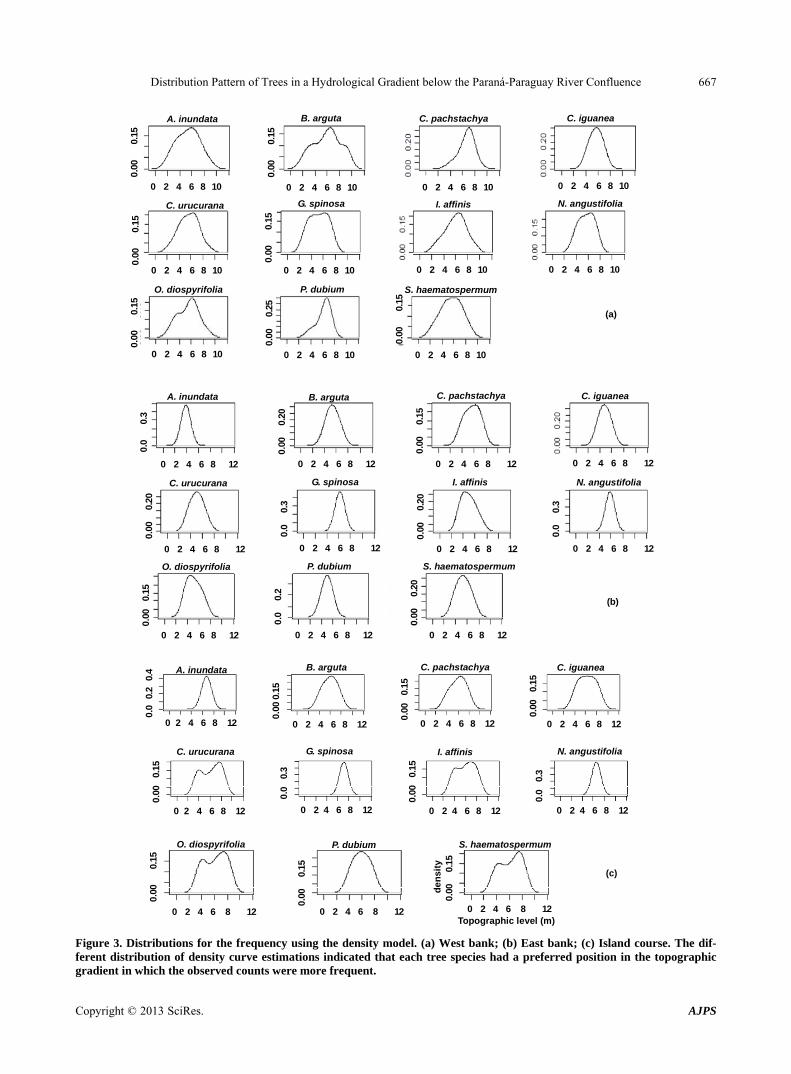
The different distribution of density curve estimations indicated that each tree species had a preferred position in the topographic gradient in which the observed counts were more frequent (Figures 3(a)-(c)).
As a first view of the selected species of the riverine forest, we found that it was possible to identify the forest vegetation from 2.00 meters to 8.00 meters with respect to the absolute hydrological fluctuation range of the river (Figure 2).
The number of flooding days and the number of dry soil sites at the lower position of the topographic gradient were significantly different from the modal and high po- sitions (Table 2), and the riverine forests remained with flooded soil for 16,294 days, with the highest FCQ (Ta-
ble 2). The forests that grew in the modal positions of 4 and 6 m were affected by 202 and 56 pulses, respectively (Table 2), whereas the gradient forests had the lowest FCQ and only were affected by 5 pulses at the high posi- tion (Table 2).
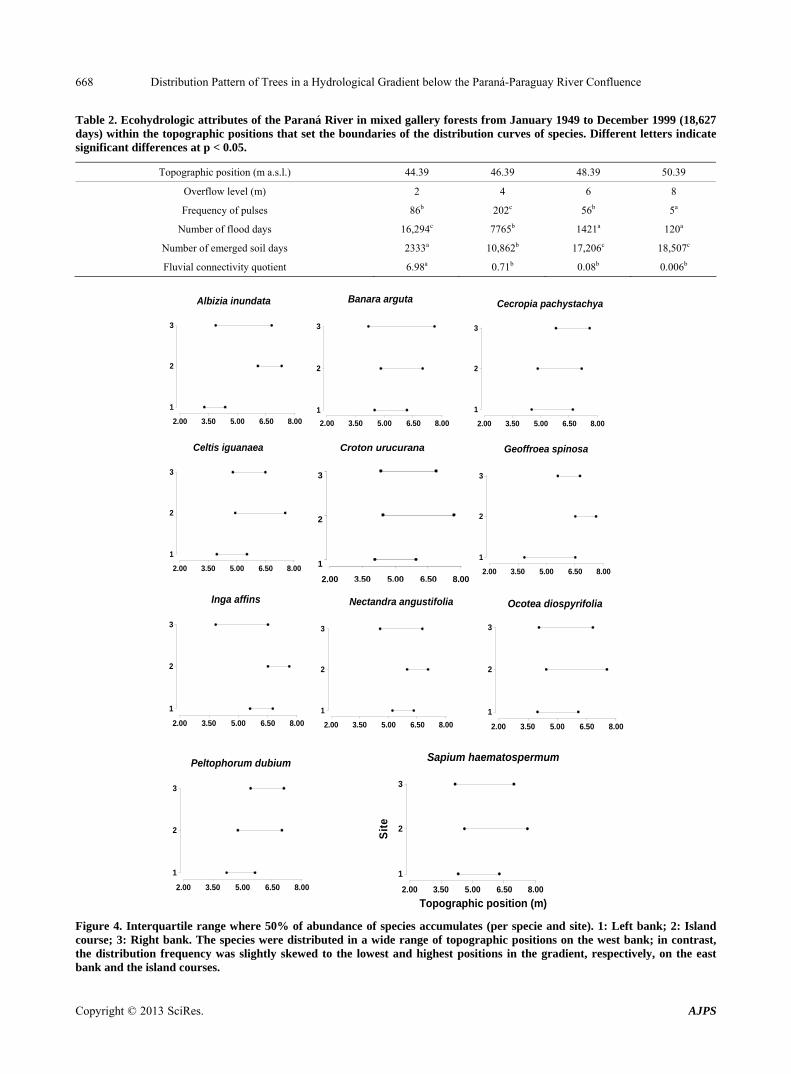
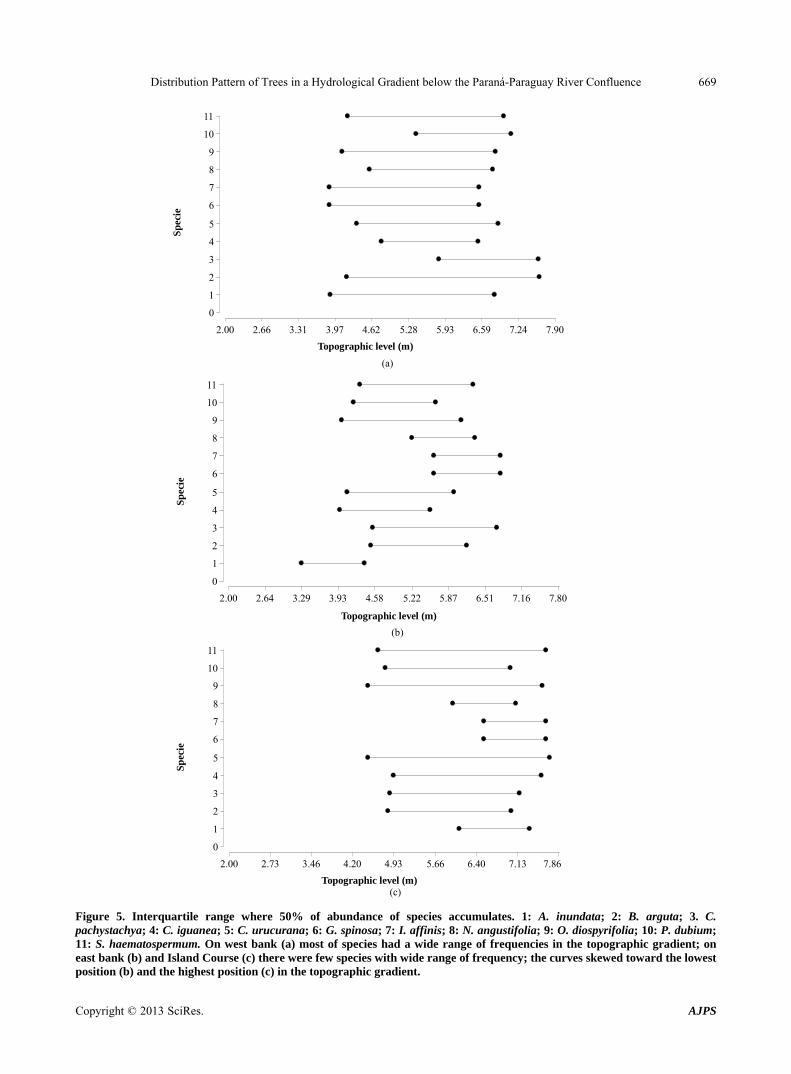
In general, the species were distributed in a wide ran- ge of topographic positions on the west bank; in con- trast, the distribution frequency was slightly skewed to the lowest and highest positions in the gradient, respe- ctively, on the east bank and the island courses (Figure 4).
West bank. Most of species had a wide range of fre- quencies in the topographic gradient (Figures 3(a) and 5(a)). Almost 50% of the occurrence of the canopy trees comprising A. inundata, G. spinosa and Inga affinis were distributed from the lowest position in the topographic gradient (3.88 m); the distribution of the expected num- bers of B. arguta and C. pachystachya were at the high- est position (7.60 m). Only the canopy trees consisting of C. pachystachya, C. iguanea and P. dubium had a nar- rower distribution range (Figures 3(a) and 5(a)).
East bank. There were few species (C. pachystachya, C. urucurana, O. diospyrifolia and S. haematospermum) with wide range of frequency (between 3.92 and 6.7 m; Figures 3(b) and 5(b)). Canopy trees for A. inundata, G. spinosa, I. affinis and N. angustifolia had the narrowest distribution range, with the curves skewed toward the lowest position for A. inundata and highest topographic positions for the other three species (Figures 3(b) and 5(b)).
Island course. The canopy trees for C. urucurana, O.
0
1
2
3
4
5
6
7
8
9
10
01
-01-4
9
01
-01-5
1
01
-01-5
3
01
-01-5
5
01
-01-5
7
01
-01-5
9
01
-01-6
1
01
-01-6
3
01
-01-6
5
01
-01-6
7
01
-01-6
9
01
-01-7
1
01
-01-7
3
01
-01-7
5
01
-01-7
7
01
-01-7
9
01
-01-8
1
01
-01-8
3
01
-01-8
5
01
-01-8
7
01
-01-8
9
01
-01-9
1
01
-01-9
3
01
-01-9
5
01
-01-9
7
01
-01-9
9
Wa
ter
lev
el
(m)
Time
Figure 2. Water level fluctuations of the Paraná River at Puerto Corrientes between 1949 and 1999. The extreme floods are attributed to ENSO (El Niño Southern Oscillation) events and there were four extraordinary floods during the last century: June 1905, July 1983, June 1992 and May 1998.
Copyright © 2013 SciRes. AJPS
Distribution Pattern of Trees in a Hydrological Gradient below the Paraná-Paraguay River Confluence 667
(a)
A. inundata B. arguta C. pachstachya C. iguanea
C. urucurana G. spinosa I. affinis N. angustifolia
O. diospyrifolia P. dubium S. haematospermum
A. inundata B. arguta C. pachstachya C. iguanea
C. urucurana G. spinosa I. affinis N. angustifolia
O. diospyrifolia P. dubium S. haematospermum
(b)
Topographic level (m)
de
nsi
ty
O. diospyrifolia P. dubium S. haematospermum
(c)
N. angustifolia C. urucurana G. spinosa I. affinis
A. inundata B. arguta C. pachstachya C. iguanea
0 2 4 6 8 10 0 2 4 6 8 10 0 2 4 6 8 10 0 2 4 6 8 10
0 2 4 6 8 10 0 2 4 6 8 100 2 4 6 8 100 2 4 6 8 10
0 2 4 6 8 10 0 2 4 6 8 10 0 2 4 6 8 10
0 2 4 6 8 12 0 2 4 6 8 12 0 2 4 6 8 12 0 2 4 6 8 12
0 2 4 6 8 12 0 2 4 6 8 12 0 2 4 6 8 12 0 2 4 6 8 12
0 2 4 6 8 120 2 4 6 8 120 2 4 6 8 12
0 2 4 6 8 12 0 2 4 6 8 12 0 2 4 6 8 12 0 2 4 6 8 12
0 2 4 6 8 12 0 2 4 6 8 120 2 4 6 8 120 2 4 6 8 12
0 2 4 6 8 12 0 2 4 6 8 12 0 2 4 6 8 12
0.00
0.15
0.00
0.15
0.
00
0.
15
0.00
0.15
0.
00
0.
15
0.00
0
.25
0.00
0.15
0.00
0
.15
0.00
0
.20
0.0
0
.3
0.0
0.
3
0.0
0.
3
0.00
0
.20
0.00
0
.20
0.00
0
.20
0.00
0.
15
0.00
0.1
5
0.00
0.
15
0.00
0.
15
0.00
0.
15
0.00
0.
15
0.00
0.15
0.00
0
.15
0.00
0
.15
0.0
0.
2
0.0
0.2
0.
4
0.0
0.3
0.0
0.3
Figure 3. Distributions for the frequency using the density model. (a) West bank; (b) East bank; (c) Island course. The dif- ferent distribution of density curve estimations indicated that each tree species had a preferred position in the topographic gradient in which the observed counts were more frequent.
Copyright © 2013 SciRes. AJPS
Distribution Pattern of Trees in a Hydrological Gradient below the Paraná-Paraguay River Confluence 668
Table 2. Ecohydrologic attributes of the Paraná River in mixed gallery forests from January 1949 to December 1999 (18,627 days) within the topographic positions that set the boundaries of the distribution curves of species. Different letters indicate significant differences at p < 0.05.
Topographic position (m a.s.l.) 44.39 46.39 48.39 50.39
Overflow level (m) 2 4 6 8
Frequency of pulses 86b 202c 56b 5a
Number of flood days 16,294c 7765b 1421a 120a
Number of emerged soil days 2333a 10,862b 17,206c 18,507c
Fluvial connectivity quotient 6.98a 0.71b 0.08b 0.006b
2.00 3.50 5.00 6.50 8.00
1
2
3
Albizia inundata
2.00 3.50 5.00 6.50 8.00
1
2
3
Banara arguta
2.00 3.50 5.00 6.50 8.00
1
2
3
Cecropia pachystachya
2.00 3.50 5.00 6.50 8.00
1
2
3
Celtis iguanaea
2.00 3.50 5.00 6.50 8.00
1
2
3
Geoffroea spinosa
2.00 3.50 5.00 6.50 8.00
1
2
3
Inga affins
2.00 3.50 5.00 6.50 8.00
1
2
3
Nectandra angustifolia
2.00 3.50 5.00 6.50 8.00
1
2
3
Ocotea diospyrifolia
2.00 3.50 5.00 6.50 8.00
1
2
3
Peltophorum dubium
2.00 3.50 5.00 6.50 8.00
Topographic position (m)
1
2
3
Sit
e
Sapium haematospermum
2.00 3.50 5.00 6.50 8.00
1
2
3
Croton urucurana
Figure 4. Interquartile range where 50% of abundance of species accumulates (per specie and site). 1: Left bank; 2: Island course; 3: Right bank. The species were distributed in a wide range of topographic positions on the west bank; in contrast, the distribution frequency was slightly skewed to the lowest and highest positions in the gradient, respectively, on the east bank and the island courses.
Copyright © 2013 SciRes. AJPS
Distribution Pattern of Trees in a Hydrological Gradient below the Paraná-Paraguay River Confluence 669
(c)
2.00 2.73 3.46 4.20 4.93 5.66 6.40 7.13 7.86
Topographic level (m)
0
1
2
3
4
5
6
7
8
9
10
11
Sp
ecie
(b)
2.00 2.64 3.29 3.93 4.58 5.22 5.87 6.51 7.16 7.80
Topographic level (m)
0
1
2
3
4
5
6
7
8
9
10
11
Sp
ecie
(a)
2.00 2.66 3.31 3.97 4.62 5.28 5.93 6.59 7.24 7.90
Topographic level (m)
0
1
2
3
4
5
6
7
8
9
10
11
Spe
cie
Figure 5. Interquartile range where 50% of abundance of species accumulates. 1: A. inundata; 2: B. arguta; 3. C. pachystachya; 4: C. iguanea; 5: C. urucurana; 6: G. spinosa; 7: I. affinis; 8: N. angustifolia; 9: O. diospyrifolia; 10: P. dubium; 11: S. haematospermum. On west bank (a) most of species had a wide range of frequencies in the topographic gradient; on east bank (b) and Island Course (c) there were few species with wide range of frequency; the curves skewed toward the lowest
osition (b) and the highest position (c) in the topographic gradient. p
Copyright © 2013 SciRes. AJPS
Distribution Pattern of Trees in a Hydrological Gradient below the Paraná-Paraguay River Confluence
Copyright © 2013 SciRes. AJPS
670
diospyrifolia and S. haematospermum had the widest range of distribution in the gradient (between 4.5 and 7.8 m); A. inundata, G. spinosa, I. affinis and N. angustifolia had the narrowest distribution range, with the curves skewed to highest topographic position in the gradient (Figures 3(c) and 5(c)).
3.2. Soil Texture
The alluvial soils of the studied area were formed by small amounts of pedologic material that was transported and accumulated in successive floods by the horizontal water flux.
Each profile on both banks of the Paraná River was constituted by materials of different granulometry (Table 3). The sediments from the Paraguay and Bermejo Rivers were predominant on the west bank islands, whereas muddy clay and fine-sand soils from the Upper Paraná River predominated along the east bank islands.
On the west bank, the soils are dominated by silts and clays, with a minor proportion of fine sand in the first 50 cm (Table 3). On the east bank and in the island courses, the soils are dominated by fine sand in the upper hori- zons and by fine sediments in the deepest (Table 3).
4. Discussion
Our results suggest that, in the actual flow conditions (runoff + suspended load), the forests of the left bank of the Paraná River are between 3 to 7 meters of the fluc- tuation range of the river, whereas the island courses and right bank are between and 4.50 and 8 and 3.50 and 8 meters, respectively.
At the study sites, the growth of the riverine forests are affected by 5 and 202 pulses remaining between 2333 and 18,507 days with emerged soil and 120 and 16,694 days with flooding soil, representing a wide range of sites for plant growth [7].
These small differences in the range of distribution frequencies are related to the type of sediments that form the soil on each bank of the river, as indicated [16] in a study of pioneer forests of the Paraná River in this area. The studied species usually have normal distribution curves, as indicated by the frequencies reported by [48] in a study prior to the disturbances that have occurred since the dam was built on the Upper Paraná.
As some authors have stated [49,50] the modes of the
species distributions along a connectivity gradient are not an indication of the physiological optima defined by the maximum growth rate, but are centres of maximum population success, as expressed by their maximum fre- quencies, in interaction with other populations. These distribution curves represent a hypothetical model of adjustment between the vegetation distribution and a gradient of hydrological variability.
To recognise that there are relationships between the hydrological regime of pulses (frequency, intensity, du- ration, and timing) and the distribution of species in- volves recognising that changes may occur in the land- scape pattern due to climate change.
Based on the hydrologic response to a warming of 4˚C or 5˚C in the La Plata Basin in the present century [40] proposed a simple balance in which an additional evapo- transpiration of 100 mm occurred for each degree warm- ing of the surface temperature. In this hypothetical sce- nario, the lowering of the river discharge in the Plata Basin would be approximately one quarter (two thirds) of the present value [40].
In a more recent study, [16] documented the differ- ences in the distribution of two pioneer species compared with the results reported by [51] 20 years earlier. Another study by [52] on the Missouri River showed that forests are sensitive to hydrological changes and can modify their distribution and diversity.
Within this context, we suggest that knowledge of the distribution curves of the vegetation species present can help draw possible future scenarios of river landscapes.
We think that the higher sensitivity of these forests is given by the two quartiles of the distribution of the fre- quency (corresponding to both extremes of the river fluctuation).
In the same sense, future engineering works that alter the hydrological dynamics of Paraná should consider the distribution of the riparian forests because they are indi- cators of changes at landscape level and they are the sup- port for the wildlife of the river. We propose that the quar- tiles of the distribution of the tree populations be taken as conditions of higher environmental risk in future studies to assess the environmental impacts of engineering projects.
5. Acknowledgements
We are very grateful to Julio Di Rienzo and the InfoStat Table 3. Mean proportion of fine sand and fine sediments in the forests of study area. Different letters indicate significant differences at p < 0.05.
West bank East bank Island course
Depth (cm) 0 - 20 20 - 50 50 - 110 0 - 20 20 - 50 50 - 110 110 - 130 0 - 20 20 - 50 50 - 110
Fine sand (%) 37.5a
± 21.59 44.63a
± 10.41 51.70a
± 17.43 67.60b ± 10.26
67.98b ± 36.19
73.93b ± 7.54
26.07b ± 7.54
85.54b ± 3.66
59.61b ± 24.93
39.00b ± 16.98
Fine sediments-silt and clay (%)
62.5a ± 21.6
55.37a ± 10.41
48.29a ± 17.43
32.41b ± 10.26
32.02b
± 36.1952.60b ± 12.43
47.4b ± 12.43
14.47b ± 3.60
40.39b ± 24.93
61b ± 16.98
Distribution Pattern of Trees in a Hydrological Gradient below the Paraná-Paraguay River Confluence 671
team for their advice concerning the statistical analysis. We thank the anonymous reviewers who provide useful comments on the manuscript. This study was supported by grants PIP 11220100100486; PIP 11420100100215- Consejo Nacional de Investigaciones Científicas y Técnicas (CONICET); PICT 2077-2008 and Secretaría General de Ciencia y Técnica R003 (Universidad Na- cional del Nordeste).
REFERENCES [1] W. J. Junk and M. T. Piedade, “Biomass and Primary-
Production of Herbaceous Plant Communities in the Amazon Floodplain,” Hydrobiologia, Vol. 263, No. 3, 1993, pp. 155-162. doi:10.1007/BF00006266
[2] J. J. Neiff, “Bosques Fluviales de la Cuenca del Paraná,” In: M. F. Arturi, J. L. Frangi and J F. Goya, Eds., Ecología y Manejo de los Bosques de Argentina, EDULP, La Plata, 2005, pp. 1-26.
[3] S. V. Gregory, F. J. Swanson, W. A. McKee and K. W. Cummins, “An Ecosystem Perspective of Riparian Zones,” BioScience, Vol. 41, No. 8, 1991, pp. 540-550. doi:10.2307/1311607
[4] R. J. Naiman, R. E. Bilby and R. A. Bisson, “Riparian Ecology and Management in the Pacific Coastal Rain Forest,” BioScience, Vol. 50, No. 11, 2000, pp. 996-1011. doi:10.1641/0006-3568(2000)050[0996:REAMIT]2.0.CO;2
[5] D. A. Sarr and D. E. Hibbs, “Woody Riparian Plant Dis- tributions in Western Oregon, USA: Comparing Land- scape and Local Scale Factors,” Plant Ecology, Vol. 190, No. 2, 2007, pp. 291-311. doi:10.1007/s11258-006-9208-2
[6] B. L. Bedford, “The Need to Define Hydrologic Equi- valence at the Landscape Scale for Freshwater Wetland Mitigation,” Ecology Applications, Vol. 6, No. 1, 1996, pp. 57-68. doi:10.2307/2269552
[7] E. Tabacchi, D. L. Correll, R. Hauer, G. Pinay, A. M. Planty Tabacchi and R. C. Wissmar, “Development, Maintenance and Role of Riparian Vegetation in the Ri- ver Landscape,” Freshwater Biology, Vol. 40, No. 3, 1998, pp. 497-516. doi:10.1046/j.1365-2427.1998.00381.x
[8] W. J. Mitsch and J. G. Gosselink, “Wetlands,” Van Nos- trand Reinhold, New York, 2000.
[9] D. M. Merrit, M. L. Scott, N. L. Poff, G. T. Auble and D. A. Lytle, “Theory, Methods and Tools for Determining Environmental Flows for Riparian Vegetation: Riparian Vegetation-Flow Response Guilds,” Freshwater Biology, Vol. 55, No. 1, 2010, pp. 206-225. doi:10.1111/j.1365-2427.2009.02206.x
[10] J. J. Neiff, “Ideas Para la Interpretación Ecológica del Paraná,” Interciencia, Vol. 15, No. 6, 1990, pp. 424-441.
[11] J. J. Neiff “Large Rivers of South America: Toward the New Approach,” Verhandlungen des Internationalen Ver- ein Limnologie, Vol. 26, No. 1, 1996, pp. 167-181.
[12] J. J. Neiff, “El Régimen de Pulsos en Ríos y Grandes Humedales de Sudamérica,” In: A. I. Malvárez, Ed., Tópi-
cos Sobre Humedales Subtropicales y Templados de Su- damérica, Universidad de Buenos Aires, Buenos Aires, 1999, pp. 97-146.
[13] J. J. Neiff and A. Poi de Neiff, “Connectivity Processes as a Basis for Management of Aquatic Plants,” In: S. M. Thomaz and L. M. Bini, Eds., “Ecologia e Manejo de Macrófitas Aquáticas”. Editora da Universidade Estadual de Maringá, Maringá, 2003, pp. 127-144.
[14] S. L. Casco, “Poblaciones Vegetales Centrales y Su Va- riabilidad Espacio-Temporal en una Sección del Bajo Paraná Influenciada por el réGimen de Pulsos,” Tesis Doctoral, Universidad Nacional del Nordeste, Corrientes, 2003.
[15] A. Poi de Neiff, J. J. Neiff and S. L. Casco, “Leaf Litter Decomposition in Three Wetland Types of the Paraná River Floodplain,” Wetlands, Vol. 26, No. 2, 2006, pp. 558-566. doi:10.1672/0277-5212(2006)26[558:LLDITW]2.0.CO;2
[16] S. L. Casco, J. J. Neiff and A. Poi de Neiff, “Ecological Responses of Two Pioneer Species to a Hydrological Connectivity Gradient in Riparian Forests of the Lower Paraná River,” Plant Ecology, Vol. 209, No. 1, 2010, pp. 167-177. doi:10.1007/s11258-010-9734-9
[17] D. A. Lytle and N. L. Poff, “Adaptation to Natural Flow Regimes,” Trends in Ecology and Evolution, Vol. 19, No. 2, 2004, pp. 94-100. doi:10.1016/j.tree.2003.10.002
[18] N. L. Poff, B. D. Richter, A. H. Arthington, et al., “The Ecological Limits of Hydrologic Alteration (ELOHA): A New Framework for Developing Regional Environmental Flow Standards,” Freshwater Biology, Vol. 55, No. 1, 2010, pp. 147-170. doi:10.1111/j.1365-2427.2009.02204.x
[19] J. Silvertown, et al., “Hydrologically-Defined Niches Re- veal a Basis for Species-Richness in Plant Communities,” Nature, Vol. 400, No. 6739, 1999, pp. 61-63. doi:10.1038/21877
[20] P. A. Keddy, “Wetland Ecology: Principles and Conser- vation,” Cambridge University Press, London, 2000.
[21] W. H. J. M. van Eck, H. M. van de Steeg, C. W. P. M. Blom and H. de Kroon, “Is Tolerance to Summer Flood- ing Correlated with Distribution Patterns in River Flood- plains? A Comparative Study of 20 Terrestrial Grassland Species,” Oikos, Vol. 107, No. 2, 2004, pp. 393-405. doi:10.1111/j.0030-1299.2004.13083.x
[22] K. Stokes, “Exotic Invasive Black Willow (Salix nigra) in Australia: Influence of Hydrological Regimes on Popu- lation Dynamics,” Plant Ecology, Vol. 197, No. 1, 2008, pp. 91-105. doi:10.1007/s11258-007-9363-0
[23] M. M. Brinson and J. T. A. Verhoeven “Riparian Fo- rests,” In: M. L. Hunt Jr., Ed., Maintaining Biodiversity in Forest Ecosystems, Cambridge University Press, New York, 1999, pp. 265-299. doi:10.1017/CBO9780511613029.010
[24] K. F. Walker, F. Sheldonand and J. T. Puckridge, “A Perspective on Dryland River Ecosystems,” Regulated Rivers, Vol. 11, No. 1, 1995, pp. 85-104. doi:10.1002/rrr.3450110108
[25] J. C. Budke, J. A. Jarenkow and A. T. Oliveira-Filho, “Re-
Copyright © 2013 SciRes. AJPS

Distribution Pattern of Trees in a Hydrological Gradient below the Paraná-Paraguay River Confluence 672
lationships between Tree Component Structure, Topog- raphy and Soils of a Riverside Forest, Rio Botucaraí, Southern Brazil,” Plant Ecology, Vol. 189, No. 2, 2007, pp. 187-200. doi:10.1007/s11258-006-9174-8
[26] G. Colonnello, “La Vegetación Acuática del Delta del Río Orinoco (Venezuela) Composición Florística y Aspectos Ecológicos,” Memoria de la Sociedad de Ciencias Naturales La Salle, 1995.
[27] M. Worbes, “The Forest Ecosystem of the Floodplain,” In: W. J. Junk, Ed., The Central Amazon Floodplain, Sprin- ger-Verlag, Heidelberg, 1997, pp. 223-265. doi:10.1007/978-3-662-03416-3_11
[28] T. T. Kozlowski, “Physiological-Ecological Impacts of Flooding on Riparian Forest Ecosystems,” Wetlands, Vol. 22, No. 3, 2002, pp. 550-561. doi:10.1672/0277-5212(2002)022[0550:PEIOFO]2.0.CO;2
[29] G. H. S. Smith, P. J. Ashworth, J. L. Best, I. A. Lunt, O. Orfeo and D. R. Parsons, “The Sedimentology and Allu- vial Architecture of a Large Braid Bar, Río Paraná, Ar-gentina,” Journal of Sedimentary Research, Vol. 79, No. 8, 2009, pp. 629-642. doi:10.2110/jsr.2009.066
[30] O. Orfeo and J. Stevaux, “Hydraulic and Morphologic Characteristics of Middle and Upper Reaches of the Paraná River (Argentina and Brazil),” Geomorphology, Vol. 44, No. 3/4, 2002, pp. 309-322. doi:10.1016/S0169-555X(01)00180-5
[31] A. A. Bonetto, “Calidad de las Aguas del Río Paraná. Introducción a su Estudio ecolóGico. Corrientes, Argen- tina, Instituto Nacional de Construcciones Portuarias y Vías Navegables,” Instituto Nacional de Ciencias y Técnica Hídrica (INCYTH), 1976.
[32] A. A. Bonetto and O. Orfeo, “Caracteres Sedimen- tológicos de la Carga en Suspensión del Río Paraná Entre Confluencia y Esquina (Prov. de Corrientes), Revista de la Asociación Argentina de Minería,” Petrología y Sedi- mentología, Vol. 15, No. 3-4, 1984, pp. 51-61.
[33] E. Drago and M. Amsler, “Suspended Sediment at a Cross Section of the Middle Paraná River: Concentration, Granulometry and Influence of the Main Tributaries,” In- ternational Association of Hydrological Sciences, Vol. 174, 1998, pp. 381-396.
[34] J. J. Neiff, “Las Grandes Unidades de Vegetación y Am- biente Insular del río Paraná en el Tramo Candelaria-Itá Ibaté,” Revista de Ciencias Naturales del Litoral, Vol. 17, No. 1, 1986, pp. 7-30.
[35] S. L. Casco, I. Basterra de Chiozzi and J. J. Neiff, “La Vegetación Como Indicador de la Geomorfología Flu- vial,” Revista Brasilera de Geomorfología Fluvial, Vol. 6, No. 1, 2005, pp. 123-136.
[36] J. J. Neiff, S. L. Casco and O. Orfeo, “Método Para la Medición de la Conectividad Entre Procesos Hidrológicos y Geomorfológicos en ríos Entrelazados,” Revista Bra- silera de Geomorfología Fluvial, Vol. 6, No. 1, 2005, pp. 75-83.
[37] S. L. Casco and J. J. Neiff, “Cómo se Distribuyen Las raÍces en Los Bosques Inundables de Salix humboldtiana y Tessaria integrifolia del Bajo Paraná?” Interciencia, Vol. 31, No. 8, 2006, pp. 605-610.
[38] J. J. Neiff, E. M. Mendiondo and C. A. Depettris, “ENSO Floods on River Ecosystems: Catastrophes or Myths?” In: F. Toensmann and M. Koch. Eds., River Flood Defens, Herkules Verlag, Kassel, 2000, pp. F141-F152.
[39] M. N. Núñez and W. M. Vargas,” El Niño 1997-1998: Un Factor Económico y Social,” Boletín Informativo Techint 295, Buenos Aires, 1998, pp. 9-36.
[40] I. Camilloni, R. Saurral, R. Mezher and V. Barros, “Cli- mate Scenarios for the 21st Century: Influence on the Discharges of the Plata Basin,” Proceedings IV Interna- tional Workshop on Regional Approaches to Reservoirs Development and Management in La Plata Basin, Buenos Aires, 12-13 September 2006, pp. 83-91.
[41] J. J. Neiff, H. J. Reboratti, C. M. Gorleri and M. Basualdo, “Impacto de Las Crecientes Extraordinarias Sobre Los Bosques Fluviales del Bajo Paraguay,” Boletín Comisión Especial Río Bermejo, Vol. 4, 1985, pp. 13-30.
[42] C. M. Pringle, “Hydrologic Connectivity and the Mana- gement of Biological Reserves: A Global Perspective,” Ecology Applications, Vol. 11, No. 4, 2001, pp. 981-998. doi:10.1890/1051-0761(2001)011[0981:HCATMO]2.0.CO;2
[43] C. M. Pringle, “The Need for a More Predictive Under- standing of Hydrologic Connectivity?” Aquatic Conser- vation Marine and Freshwater Ecosystems, Vol. 13, No. 6, 2003, pp. 467-471. doi:10.1002/aqc.603
[44] C. M. Pringle, “What Is Hydrologic Connectivity and Why Is It Ecologically Important?” Hydrological Process, Vol. 17, No. 13, 2003, pp. 2685-2689. doi:10.1002/hyp.5145
[45] O. Orfeo, “Sedimentología del río Paraná en el Área de Confluencia con el río Paraguay,” Tesis Doctoral, Univer- sidad Nacional de La Plata, Buenos Aires, 1995.
[46] R Development Core Team, “R: A Language and En- vironment for Statistical Computing. R Foundation for Statistical Computing,” Vienna, 2012. http://www.R-project.org/
[47] J. J. Neiff and M. Neiff, “Pulso. Software Diseñado Para Estudiar Fenómenos Recurrentes en el Tiempo,” 2004. www.neiff.com.ar
[48] J. J. Neiff and H. J. Reboratti, “Estructura y Dinámica de Bosques de Tessaria Integrifolia. II: Análisis del Creci- miento y Productividad,” Boletín de la Sociedad Argen- tina de Botánica, Vol. 26, No. 1-2, 1989, pp. 39-43
[49] R. H. Whittaker, “Ordination of Plant Communities,” Dr. W. Junk bv Publishers, The Hague, 1978
[50] P. Stiling, “Ecology: Theories and Applications,” Prentice Hall, New Jersey, 1999.
[51] H. J. Reboratti and J. J. Neiff, “Distribución de los Ali- sales de Tessaria integrifolia (Compositae) en los Gran- des ríos de la Cuenca del Plata,” Boletín de la Sociedad Argentina de Botánica, Vol. 21, No. 1-2, 1987, pp. 25-42.
[52] W. C. Johnson, “Riparian Vegetation Diversity along Re- gulated Rivers: Contribution of Novel and Relict Habi- tats,” Freshwater Biology, Vol. 47, No. 4, 2002, pp. 749- 759. doi:10.1046/j.1365-2427.2002.00910.x
Copyright © 2013 SciRes. AJPS
Distribution Pattern of Trees in a Hydrological Gradient below the Paraná-Paraguay River Confluence 673
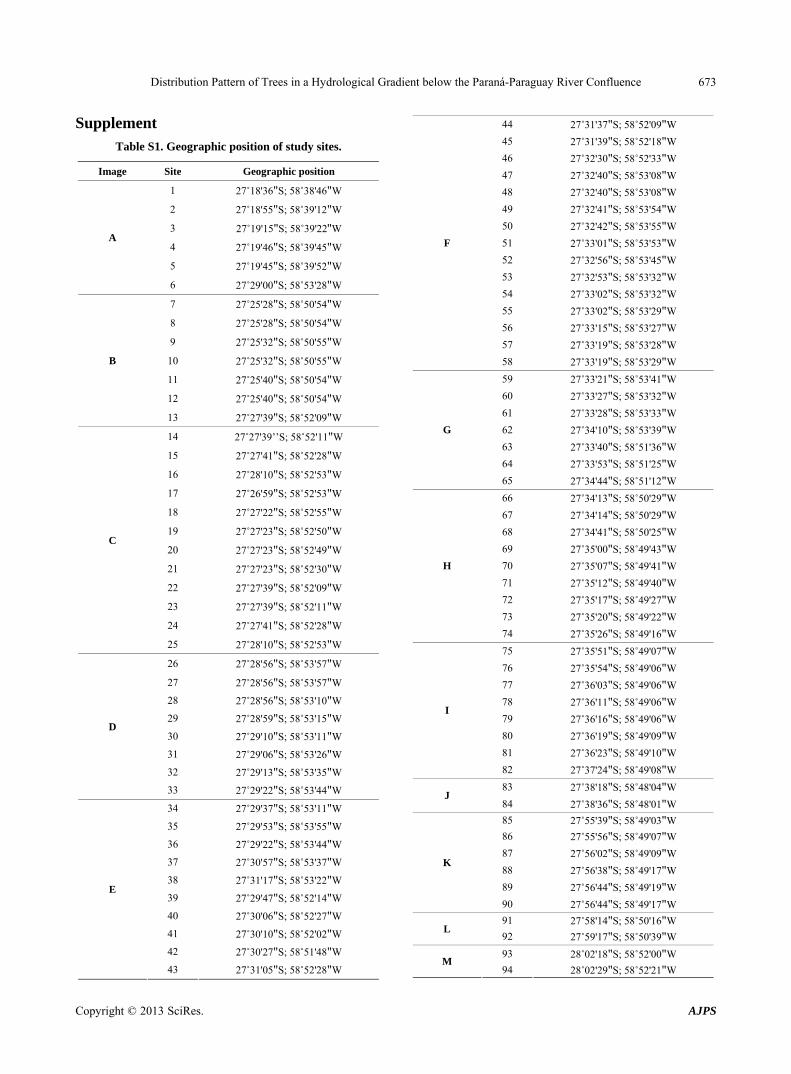
Supplement
Table S1. Geographic position of study sites.
Image Site Geographic position
1 27˚18'36"S; 58˚38'46"W
2 27˚18'55"S; 58˚39'12"W
3 27˚19'15"S; 58˚39'22''W
4 27˚19'46"S; 58˚39'45"W
5 27˚19'45"S; 58˚39'52"W
A
6 27˚29'00"S; 58˚53'28"W
7 27˚25'28"S; 58˚50'54"W
8 27˚25'28"S; 58˚50'54"W
9 27˚25'32"S; 58˚50'55"W
10 27˚25'32"S; 58˚50'55"W
11 27˚25'40"S; 58˚50'54"W
12 27˚25'40"S; 58˚50'54"W
B
13 27˚27'39"S; 58˚52'09"W
14 27˚27'39’’S; 58˚52'11"W
15 27˚27'41"S; 58˚52'28"W
16 27˚28'10"S; 58˚52'53"W
17 27˚26'59"S; 58˚52'53"W
18 27˚27'22"S; 58˚52'55"W
19 27˚27'23"S; 58˚52'50"W
20 27˚27'23"S; 58˚52'49"W
21 27˚27'23"S; 58˚52'30"W
22 27˚27'39"S; 58˚52'09"W
23 27˚27'39"S; 58˚52'11"W
24 27˚27'41"S; 58˚52'28"W
C
25 27˚28'10"S; 58˚52'53"W
26 27˚28'56"S; 58˚53'57"W
27 27˚28'56"S; 58˚53'57"W
28 27˚28'56"S; 58˚53'10"W
29 27˚28'59"S; 58˚53'15"W
30 27˚29'10"S; 58˚53'11"W
31 27˚29'06"S; 58˚53'26"W
32 27˚29'13"S; 58˚53'35"W
D
33 27˚29'22"S; 58˚53'44"W
34 27˚29'37"S; 58˚53'11"W
35 27˚29'53"S; 58˚53'55"W
36 27˚29'22"S; 58˚53'44"W
37 27˚30'57"S; 58˚53'37"W
38 27˚31'17"S; 58˚53'22"W
39 27˚29'47"S; 58˚52'14"W
40 27˚30'06"S; 58˚52'27"W
41 27˚30'10"S; 58˚52'02"W
42 27˚30'27"S; 58˚51'48"W
E
43 27˚31'05"S; 58˚52'28"W
44 27˚31'37"S; 58˚52'09"W
45 27˚31'39"S; 58˚52'18"W
46 27˚32'30"S; 58˚52'33"W
47 27˚32'40"S; 58˚53'08"W
48 27˚32'40"S; 58˚53'08"W
49 27˚32'41"S; 58˚53'54"W
50 27˚32'42"S; 58˚53'55"W
51 27˚33'01"S; 58˚53'53"W
52 27˚32'56"S; 58˚53'45"W
53 27˚32'53"S; 58˚53'32"W
54 27˚33'02"S; 58˚53'32"W
55 27˚33'02"S; 58˚53'29"W
56 27˚33'15"S; 58˚53'27"W
57 27˚33'19"S; 58˚53'28"W
F
58 27˚33'19"S; 58˚53'29"W
59 27˚33'21"S; 58˚53'41"W
60 27˚33'27"S; 58˚53'32"W
61 27˚33'28"S; 58˚53'33"W
62 27˚34'10"S; 58˚53'39"W
63 27˚33'40"S; 58˚51'36"W
64 27˚33'53"S; 58˚51'25"W
G
65 27˚34'44"S; 58˚51'12"W
66 27˚34'13"S; 58˚50'29"W
67 27˚34'14"S; 58˚50'29"W
68 27˚34'41"S; 58˚50'25"W
69 27˚35'00"S; 58˚49'43"W
70 27˚35'07"S; 58˚49'41"W
71 27˚35'12"S; 58˚49'40"W
72 27˚35'17"S; 58˚49'27"W
73 27˚35'20"S; 58˚49'22"W
H
74 27˚35'26"S; 58˚49'16"W
75 27˚35'51"S; 58˚49'07"W
76 27˚35'54"S; 58˚49'06"W
77 27˚36'03"S; 58˚49'06"W
78 27˚36'11"S; 58˚49'06"W
79 27˚36'16"S; 58˚49'06"W
80 27˚36'19"S; 58˚49'09"W
81 27˚36'23"S; 58˚49'10"W
I
82 27˚37'24"S; 58˚49'08"W
83 27˚38'18"S; 58˚48'04"W J
84 27˚38'36"S; 58˚48'01"W
85 27˚55'39"S; 58˚49'03"W
86 27˚55'56"S; 58˚49'07"W
87 27˚56'02"S; 58˚49'09"W
88 27˚56'38"S; 58˚49'17"W
89 27˚56'44"S; 58˚49'19"W
K
90 27˚56'44"S; 58˚49'17"W
91 27˚58'14"S; 58˚50'16"W L
92 27˚59'17"S; 58˚50'39"W
93 28˚02'18"S; 58˚52'00"W M
94 28˚02'29"S; 58˚52'21"W
Copyright © 2013 SciRes. AJPS