Denser Growing Fiber Connections Induce 3-hinge Gyral Folding
12
Cerebral Cortex, 2017; 1–12 doi: 10.1093/cercor/bhx227 Original Article ORIGINAL ARTICLE Denser Growing Fiber Connections Induce 3-hinge Gyral Folding Fangfei Ge 1,2 , Xiao Li 1 , Mir Jalil Razavi 3 , Hanbo Chen 2 , Tuo Zhang 1,4 , Shu Zhang 2 , Lei Guo 1 , Xiaoping Hu 5 , Xianqiao Wang 3 and Tianming Liu 2 1 School of Automation, Northwestern Polytechnical University, Xi’an, China, 2 Cortical Architecture Imaging and Discovery Lab, Department of Computer Science and Bioimaging Research Center, The University of Georgia, Athens, GA, USA, 3 College of Engineering, The University of Georgia, Athens, GA, USA, 4 Brain Decoding Research Center, Northwestern Polytechnical University, Xi’an, China and 5 Department of Bioengineering, UC Riverside, Riverside, CA, USA Address correspondence to Tianming Liu. Email: [email protected] (T.L.) and Xianqiao Wang. Email: [email protected] (X.W.) Fangfei Ge, Xiao Li, and Mir Jalil Razavi first authors Abstract Recent studies have shown that quantitative description of gyral shape patterns offers a novel window to examine the relationship between brain structure and function. Along this research line, this paper examines a unique and interesting type of cortical gyral region where 3 different gyral crests meet, termed 3-hinge gyral region. We extracted 3-hinge gyral regions in macaque/chimpanzee/human brains, quantified and compared the relevant DTI-derived fiber densities in 3-hinge and 2-hinge gyral regions. Our observations consistently showed that DTI-derived fiber densities in 3-hinge regions are much higher than those in 2-hinge regions. Therefore, we hypothesize that besides the cortical expansion, denser fiber connections can induce the formation of 3-hinge gyri. To examine the biomechanical basis of this hypothesis, we constructed a series of 3-dimensional finite element soft tissue models based on continuum growth theory to investigate fundamental biomechanical mechanisms of consistent 3-hinge gyri formation. Our computational simulation results consistently showed that during gyrification gyral regions with higher concentrations of growing axonal fibers tend to form 3-hinge gyri. Our integrative approach combining neuroimaging data analysis and computational modeling appears effective in probing a plausible theory of 3-hinge gyri formation and providing new insights into structural and functional cortical architectures and their relationship. Key words: cortical folding, DTI, fiber density, primate brains Introduction Convoluted cortical folding is a prominent feature of the pri- mate brains (Chen et al. 2012; Li et al. 2016). Convolution may arise at multiple stages, primary, secondary, and tertiary which occurs over a period of several months (Sun and Hevner 2014; Budday et al. 2015c). Primary folding is notably preserved among individuals (Lohmann et al. 2008) while secondary and tertiary foldings vary cross individuals and evolve after primary folding is completed (Gilles et al. 1983), which it is believed that differential growth of the cortex is a possible stimulus for secondary and tertiary folding (Richman et al. 1975; Tallinen et al. 2016). Neuroscientific studies have demonstrated that neural structures of concave sulci and convex gyri emerge from a complex cortical folding process in brain development (Rakic 1988). It has been shown that cortical fold patterns seem to be closely correlated with neurodevelopment (Dubois et al. 2008; © The Author 2017. Published by Oxford University Press. All rights reserved. For Permissions, please e-mail: [email protected] Downloaded from https://academic.oup.com/cercor/advance-article-abstract/doi/10.1093/cercor/bhx227/4097585 by University of Georgia user on 12 December 2017
Transcript of Denser Growing Fiber Connections Induce 3-hinge Gyral Folding
Cerebral Cortex, 2017; 1–12
doi: 10.1093/cercor/bhx227Original Article
O R I G I NA L ART I C L E
Denser Growing Fiber Connections Induce 3-hingeGyral FoldingFangfei Ge1,2, Xiao Li1, Mir Jalil Razavi3, Hanbo Chen2, Tuo Zhang1,4,Shu Zhang2, Lei Guo1, Xiaoping Hu5, Xianqiao Wang3 and Tianming Liu2
1School of Automation, Northwestern Polytechnical University, Xi’an, China, 2Cortical Architecture Imagingand Discovery Lab, Department of Computer Science and Bioimaging Research Center, The University ofGeorgia, Athens, GA, USA, 3College of Engineering, The University of Georgia, Athens, GA, USA, 4BrainDecoding Research Center, Northwestern Polytechnical University, Xi’an, China and 5Department ofBioengineering, UC Riverside, Riverside, CA, USA
Address correspondence to Tianming Liu. Email: [email protected] (T.L.) and Xianqiao Wang. Email: [email protected] (X.W.)
Fangfei Ge, Xiao Li, and Mir Jalil Razavi first authors
AbstractRecent studies have shown that quantitative description of gyral shape patterns offers a novel window to examine therelationship between brain structure and function. Along this research line, this paper examines a unique and interestingtype of cortical gyral region where 3 different gyral crests meet, termed 3-hinge gyral region. We extracted 3-hinge gyralregions in macaque/chimpanzee/human brains, quantified and compared the relevant DTI-derived fiber densities in 3-hingeand 2-hinge gyral regions. Our observations consistently showed that DTI-derived fiber densities in 3-hinge regions aremuch higher than those in 2-hinge regions. Therefore, we hypothesize that besides the cortical expansion, denser fiberconnections can induce the formation of 3-hinge gyri. To examine the biomechanical basis of this hypothesis, weconstructed a series of 3-dimensional finite element soft tissue models based on continuum growth theory to investigatefundamental biomechanical mechanisms of consistent 3-hinge gyri formation. Our computational simulation resultsconsistently showed that during gyrification gyral regions with higher concentrations of growing axonal fibers tend to form3-hinge gyri. Our integrative approach combining neuroimaging data analysis and computational modeling appearseffective in probing a plausible theory of 3-hinge gyri formation and providing new insights into structural and functionalcortical architectures and their relationship.
Key words: cortical folding, DTI, fiber density, primate brains
IntroductionConvoluted cortical folding is a prominent feature of the pri-mate brains (Chen et al. 2012; Li et al. 2016). Convolution mayarise at multiple stages, primary, secondary, and tertiary whichoccurs over a period of several months (Sun and Hevner 2014;Budday et al. 2015c). Primary folding is notably preservedamong individuals (Lohmann et al. 2008) while secondary andtertiary foldings vary cross individuals and evolve after primary
folding is completed (Gilles et al. 1983), which it is believedthat differential growth of the cortex is a possible stimulus forsecondary and tertiary folding (Richman et al. 1975; Tallinenet al. 2016). Neuroscientific studies have demonstrated thatneural structures of concave sulci and convex gyri emergefrom a complex cortical folding process in brain development(Rakic 1988). It has been shown that cortical fold patterns seem tobe closely correlated with neurodevelopment (Dubois et al. 2008;
© The Author 2017. Published by Oxford University Press. All rights reserved. For Permissions, please e-mail: [email protected]
Downloaded from https://academic.oup.com/cercor/advance-article-abstract/doi/10.1093/cercor/bhx227/4097585by University of Georgia useron 12 December 2017
Giedd and Rapoport 2010; Li et al. 2014, 2015), cytoarchitecture(Zilles et al. 1997; Fischl et al. 2008), and cognitive functioning(Thompson et al. 2004; Nordahl et al. 2007; Bullmore and Sporns2009; Honey et al. 2010). Therefore, a quantitative description ofcomplex cortical folding patterns is of fundamental importanceto understand the underlying structural (Van Essen 1997; Toroand Burnod 2005; Nie et al. 2012; Bayly et al. 2014) and functional(Schoenemann 2006; Honey et al. 2009; Liu 2011; Deng et al. 2014)mechanisms of the brain. Essentially, the folding pattern ofhuman cerebral cortex is a multi-scale concept, and therefore theresearch scope of quantitative description of cortical folding canvary from a very small neighborhood on the cortex to the entirecortical surface (Li et al. 2010). In previous studies, descriptorsproposed for modeling and analyzing cortical folding patterns canbe classified into 2 major categories (Li et al. 2010). The first onewas based on the descriptor of curvature and its derivations(Cachia et al. 2001, 2003; Neal et al. 2007). The other one was aglobal descriptor, the studies of which usually use tools like gyrifi-cation index (Zilles et al. 1988; Hardan et al. 2004), spherical wave-lets (Yu et al. 2007; Yeo et al. 2008), and intrinsic curvature (Ronanet al. 2014) to quantity the convolution level of the whole corticalsurface or a preselected regions of interests (ROIs). In general,both categories of cortical folding descriptors unveiled interestingproperties of cerebral cortex and helped understand the regularityand variability of the complex cerebral cortex.
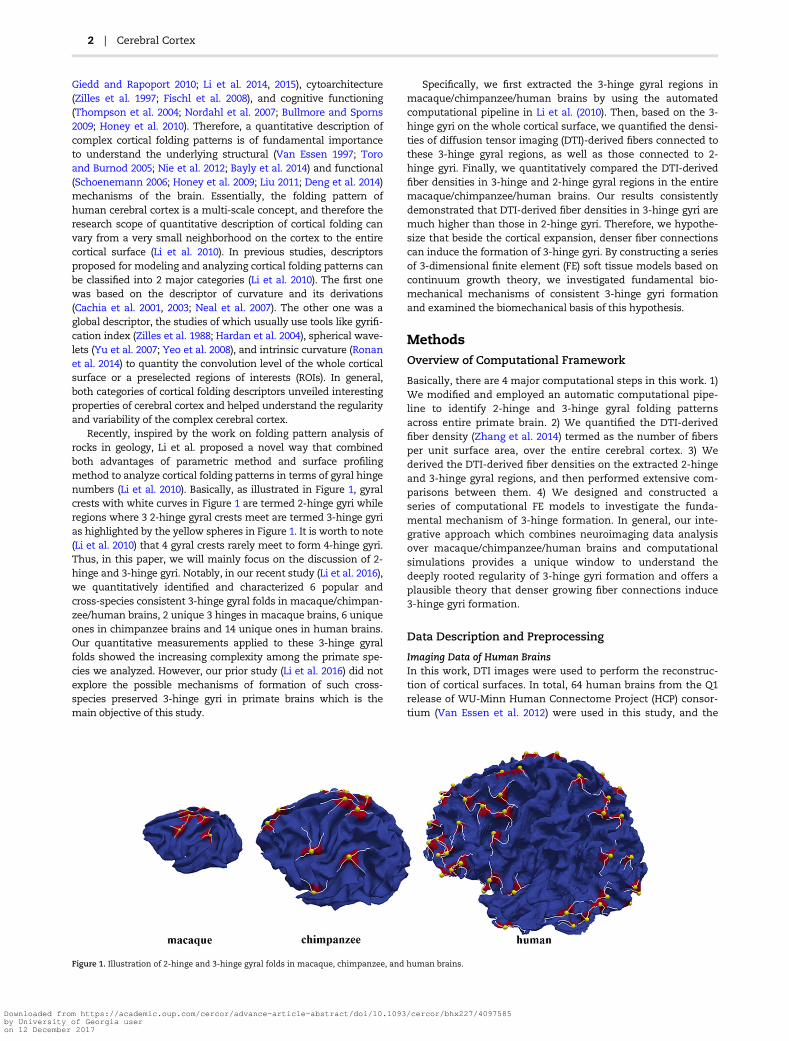
Recently, inspired by the work on folding pattern analysis ofrocks in geology, Li et al. proposed a novel way that combinedboth advantages of parametric method and surface profilingmethod to analyze cortical folding patterns in terms of gyral hingenumbers (Li et al. 2010). Basically, as illustrated in Figure 1, gyralcrests with white curves in Figure 1 are termed 2-hinge gyri whileregions where 3 2-hinge gyral crests meet are termed 3-hinge gyrias highlighted by the yellow spheres in Figure 1. It is worth to note(Li et al. 2010) that 4 gyral crests rarely meet to form 4-hinge gyri.Thus, in this paper, we will mainly focus on the discussion of 2-hinge and 3-hinge gyri. Notably, in our recent study (Li et al. 2016),we quantitatively identified and characterized 6 popular andcross-species consistent 3-hinge gyral folds in macaque/chimpan-zee/human brains, 2 unique 3 hinges in macaque brains, 6 uniqueones in chimpanzee brains and 14 unique ones in human brains.Our quantitative measurements applied to these 3-hinge gyralfolds showed the increasing complexity among the primate spe-cies we analyzed. However, our prior study (Li et al. 2016) did notexplore the possible mechanisms of formation of such cross-species preserved 3-hinge gyri in primate brains which is themain objective of this study.
Specifically, we first extracted the 3-hinge gyral regions inmacaque/chimpanzee/human brains by using the automatedcomputational pipeline in Li et al. (2010). Then, based on the 3-hinge gyri on the whole cortical surface, we quantified the densi-ties of diffusion tensor imaging (DTI)-derived fibers connected tothese 3-hinge gyral regions, as well as those connected to 2-hinge gyri. Finally, we quantitatively compared the DTI-derivedfiber densities in 3-hinge and 2-hinge gyral regions in the entiremacaque/chimpanzee/human brains. Our results consistentlydemonstrated that DTI-derived fiber densities in 3-hinge gyri aremuch higher than those in 2-hinge gyri. Therefore, we hypothe-size that beside the cortical expansion, denser fiber connectionscan induce the formation of 3-hinge gyri. By constructing a seriesof 3-dimensional finite element (FE) soft tissue models based oncontinuum growth theory, we investigated fundamental bio-mechanical mechanisms of consistent 3-hinge gyri formationand examined the biomechanical basis of this hypothesis.
MethodsOverview of Computational Framework
Basically, there are 4 major computational steps in this work. 1)We modified and employed an automatic computational pipe-line to identify 2-hinge and 3-hinge gyral folding patternsacross entire primate brain. 2) We quantified the DTI-derivedfiber density (Zhang et al. 2014) termed as the number of fibersper unit surface area, over the entire cerebral cortex. 3) Wederived the DTI-derived fiber densities on the extracted 2-hingeand 3-hinge gyral regions, and then performed extensive com-parisons between them. 4) We designed and constructed aseries of computational FE models to investigate the funda-mental mechanism of 3-hinge formation. In general, our inte-grative approach which combines neuroimaging data analysisover macaque/chimpanzee/human brains and computationalsimulations provides a unique window to understand thedeeply rooted regularity of 3-hinge gyri formation and offers aplausible theory that denser growing fiber connections induce3-hinge gyri formation.
Data Description and Preprocessing
Imaging Data of Human BrainsIn this work, DTI images were used to perform the reconstruc-tion of cortical surfaces. In total, 64 human brains from the Q1release of WU-Minn Human Connectome Project (HCP) consor-tium (Van Essen et al. 2012) were used in this study, and the
Figure 1. Illustration of 2-hinge and 3-hinge gyral folds in macaque, chimpanzee, and human brains.
2 | Cerebral Cortex
Downloaded from https://academic.oup.com/cercor/advance-article-abstract/doi/10.1093/cercor/bhx227/4097585by University of Georgia useron 12 December 2017
age range of these subjects is 22–35 years. For T1-weighted struc-tural MRI, the scan protocol used a TR = 2400ms, TE = 2.14ms,flip angle=8°, image matrix = 260 × 311 × 260, and resolution = 0.7 ×0.7 × 0.7mm3. DTI data collected with spin-echo EPI sequence wasacquired using the following parameters: TR = 5520ms, TE =89.5ms, flip angle=78°, FOV = 210 × 180, matrix = 168 × 144, resolu-tion=1.25 × 1.25 × 1.25mm3, and echo spacing = 0.78ms.Particularly, a full DTI session includes 6 runs, representing3 different gradient tables, with each table acquired once withright-to-left and left-to-right phase encoding polarities, respec-tively. Each gradient table includes approximately 90 diffusionweighting directions plus 6 b = 0 acquisitions interspersedthroughout each run. Diffusion weighted data consisted of 3 shellsof b = 1000, 2000, and 3000 s/mm2 interspersed with an approxi-mately equal number of acquisitions on each shell within eachrun. White matter cortical surface reconstructed using DTI datawas based on FA maps via the methods in Liu et al. (2008) afterperforming skull removal, motion correction, eddy current correc-tion and tissue segmentation based on FSL (Jenkinson et al. 2012).
Imaging Data of ChimpanzeesAll the 16 chimpanzee subjects (all females, 29.4 ± 12.8 years)used here were members of a colony in the Yerkes NationalPrimate Research Center (YNPRC) at Emory University inAtlanta, GA. All imaging studies were approved by the IACUC ofEmory University. Prior to scanning, the subjects were immobi-lized with ketamine injections (2–6mg/kg, i.m.) and were sub-sequently anesthetized with an intravenous propofol drip(10mg/kg/h) according to standard veterinary procedures usedat YNPRC. The subjects remained sedated for the duration ofthe scans as well as the time needed for transportationbetween their home cage and the scanner location. After com-pleting scans, chimpanzees were temporarily housed in a sin-gle cage for 6–12 h to allow effects of anesthesia to wear offbefore being returned to their home cage and cage mates. Theveterinary staff and research staff assessed the general well-being (i.e., activity, food intake) of the chimpanzees twice dailyafter the scan for possible distress associated with estheticaccesses.
The anatomical MRI scans were performed on a Siemens 3TTrio scanner with a standard birdcage coil. Foam cushions andelastic straps were used to minimize head motion. T1-weightedMRI images were acquired with a 3D magnetization-preparedrapid gradient echo (MPRAGE) sequence for all participants. Forsubjects scanned using the MS-EPI (multi-shot double spin-echo echo planar imaging) sequence, the scan protocol, opti-mized at 3T used a TR = 2400ms, TE = 4.13ms, flip angle = 8°,image matrix = 256 × 256 × 192, and resolution = 1.0 × 1.0 ×0.8mm3, with 2 averages. For subjects scanned using SS-EPI(single-shot double spin-echo echo planar imaging), the scanprotocol is similar, despite that the resolution = 0.8 × 0.8 ×0.8mm3 isotropic. In this study, MRI images from 16 femalechimpanzees are used. The preprocessing steps were similar tothose used in human data processing and the brains of chim-panzees are scaled to the same size as human brain.
Imaging Data of MacaquesAll the 20 macaque subjects (all females, 14 ± 6.7 years) weremembers of a colony at YNPRC. All MRI scans were approvedby IACUC of Emory University. Prior to scanning, the subjectswere immobilized with ketamine injections (2–6mg/kg, i.m.)and were subsequently anesthetized with an intravenous pro-pofol drip (10mg/kg/h) following standard veterinary
procedures used at YNPRC. The macaques remained sedatedfor the duration of the scans as well as the time needed fortransportation between their home cage and the scanner loca-tion. After completing scans, macaques were temporarilyhoused in a single cage for 6–12 h to allow the effects of anes-thesia to wear off before being returned to their home cage andcage mates. The veterinary staff and research staff observedthe general well-being (i.e., activity, food intake) of the maca-ques twice daily after the scan for possible distress associatedwith anesthetic accesses.
The anatomical MRI scans were performed on a Siemens 3TTrio scanner with a standard knee oil. To minimize head motion,foam cushions and elastic straps were used during the scan.Particularly, a specially designed holding device was used to sta-bilize macaque’s head during scanning with 2 plastic screwsanchoring in the macaque’s ear canals tightly. The high resolu-tion T1-weighted MRI images were acquired with a 3D MPRAGEsequence. The scan protocol used a TR = 2500ms, TE = 3.49ms,flip angle = 8°, image matrix = 256 × 256 × 192, and resolution =0.5 × 0.5 × 0.5mm3, with 3 averages. In this study, MRI imagesfrom 20 subjects were used. The preprocessing steps were simi-lar to those used in human data processing and the brains ofmacaques are scaled to the same size as human brain.
Automatic Pipeline for 2-hinge and 3-hinge GyriExtraction
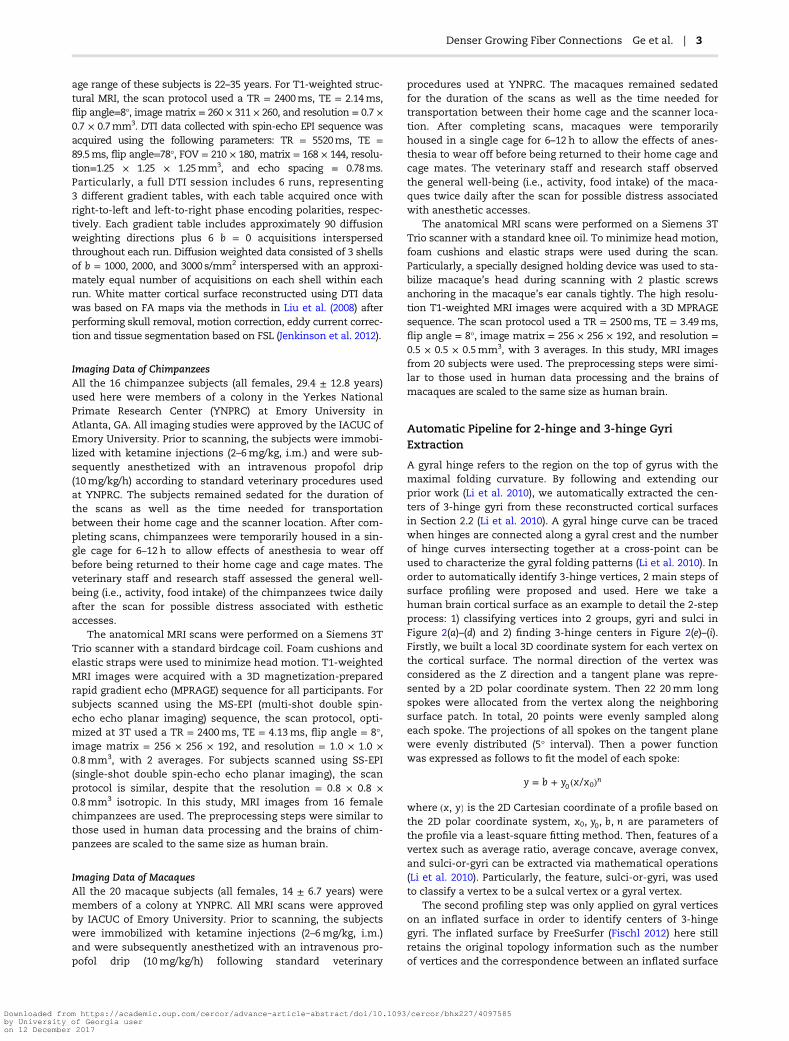
A gyral hinge refers to the region on the top of gyrus with themaximal folding curvature. By following and extending ourprior work (Li et al. 2010), we automatically extracted the cen-ters of 3-hinge gyri from these reconstructed cortical surfacesin Section 2.2 (Li et al. 2010). A gyral hinge curve can be tracedwhen hinges are connected along a gyral crest and the numberof hinge curves intersecting together at a cross-point can beused to characterize the gyral folding patterns (Li et al. 2010). Inorder to automatically identify 3-hinge vertices, 2 main steps ofsurface profiling were proposed and used. Here we take ahuman brain cortical surface as an example to detail the 2-stepprocess: 1) classifying vertices into 2 groups, gyri and sulci inFigure 2(a)–(d) and 2) finding 3-hinge centers in Figure 2(e)–(i).Firstly, we built a local 3D coordinate system for each vertex onthe cortical surface. The normal direction of the vertex wasconsidered as the Z direction and a tangent plane was repre-sented by a 2D polar coordinate system. Then 22 20mm longspokes were allocated from the vertex along the neighboringsurface patch. In total, 20 points were evenly sampled alongeach spoke. The projections of all spokes on the tangent planewere evenly distributed (5° interval). Then a power functionwas expressed as follows to fit the model of each spoke:
= + ( )y b y x x/ n0 0
where ( )x y, is the 2D Cartesian coordinate of a profile based onthe 2D polar coordinate system, x y b n, , ,0 0 are parameters ofthe profile via a least-square fitting method. Then, features of avertex such as average ratio, average concave, average convex,and sulci-or-gyri can be extracted via mathematical operations(Li et al. 2010). Particularly, the feature, sulci-or-gyri, was usedto classify a vertex to be a sulcal vertex or a gyral vertex.
The second profiling step was only applied on gyral verticeson an inflated surface in order to identify centers of 3-hingegyri. The inflated surface by FreeSurfer (Fischl 2012) here stillretains the original topology information such as the numberof vertices and the correspondence between an inflated surface
Denser Growing Fiber Connections Ge et al. | 3
Downloaded from https://academic.oup.com/cercor/advance-article-abstract/doi/10.1093/cercor/bhx227/4097585by University of Georgia useron 12 December 2017
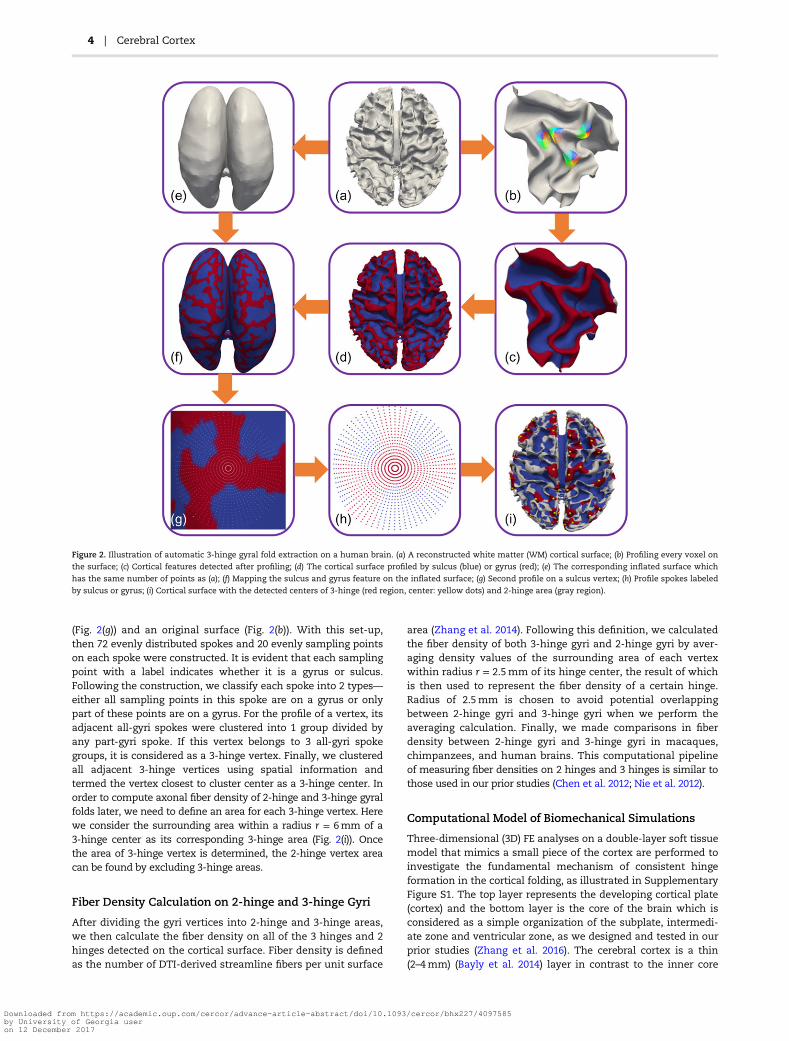
(Fig. 2(g)) and an original surface (Fig. 2(b)). With this set-up,then 72 evenly distributed spokes and 20 evenly sampling pointson each spoke were constructed. It is evident that each samplingpoint with a label indicates whether it is a gyrus or sulcus.Following the construction, we classify each spoke into 2 types—either all sampling points in this spoke are on a gyrus or onlypart of these points are on a gyrus. For the profile of a vertex, itsadjacent all-gyri spokes were clustered into 1 group divided byany part-gyri spoke. If this vertex belongs to 3 all-gyri spokegroups, it is considered as a 3-hinge vertex. Finally, we clusteredall adjacent 3-hinge vertices using spatial information andtermed the vertex closest to cluster center as a 3-hinge center. Inorder to compute axonal fiber density of 2-hinge and 3-hinge gyralfolds later, we need to define an area for each 3-hinge vertex. Herewe consider the surrounding area within a radius r = 6mm of a3-hinge center as its corresponding 3-hinge area (Fig. 2(i)). Oncethe area of 3-hinge vertex is determined, the 2-hinge vertex areacan be found by excluding 3-hinge areas.
Fiber Density Calculation on 2-hinge and 3-hinge Gyri
After dividing the gyri vertices into 2-hinge and 3-hinge areas,we then calculate the fiber density on all of the 3 hinges and 2hinges detected on the cortical surface. Fiber density is definedas the number of DTI-derived streamline fibers per unit surface
area (Zhang et al. 2014). Following this definition, we calculatedthe fiber density of both 3-hinge gyri and 2-hinge gyri by aver-aging density values of the surrounding area of each vertexwithin radius r = 2.5mm of its hinge center, the result of whichis then used to represent the fiber density of a certain hinge.Radius of 2.5mm is chosen to avoid potential overlappingbetween 2-hinge gyri and 3-hinge gyri when we perform theaveraging calculation. Finally, we made comparisons in fiberdensity between 2-hinge gyri and 3-hinge gyri in macaques,chimpanzees, and human brains. This computational pipelineof measuring fiber densities on 2 hinges and 3 hinges is similar tothose used in our prior studies (Chen et al. 2012; Nie et al. 2012).
Computational Model of Biomechanical Simulations
Three-dimensional (3D) FE analyses on a double-layer soft tissuemodel that mimics a small piece of the cortex are performed toinvestigate the fundamental mechanism of consistent hingeformation in the cortical folding, as illustrated in SupplementaryFigure S1. The top layer represents the developing cortical plate(cortex) and the bottom layer is the core of the brain which isconsidered as a simple organization of the subplate, intermedi-ate zone and ventricular zone, as we designed and tested in ourprior studies (Zhang et al. 2016). The cerebral cortex is a thin(2–4mm) (Bayly et al. 2014) layer in contrast to the inner core
Figure 2. Illustration of automatic 3-hinge gyral fold extraction on a human brain. (a) A reconstructed white matter (WM) cortical surface; (b) Profiling every voxel on
the surface; (c) Cortical features detected after profiling; (d) The cortical surface profiled by sulcus (blue) or gyrus (red); (e) The corresponding inflated surface which
has the same number of points as (a); (f) Mapping the sulcus and gyrus feature on the inflated surface; (g) Second profile on a sulcus vertex; (h) Profile spokes labeled
by sulcus or gyrus; (i) Cortical surface with the detected centers of 3-hinge (red region, center: yellow dots) and 2-hinge area (gray region).
4 | Cerebral Cortex
Downloaded from https://academic.oup.com/cercor/advance-article-abstract/doi/10.1093/cercor/bhx227/4097585by University of Georgia useron 12 December 2017
which has a thickness around 50mm (Tallinen et al. 2014). Thedimension of the plate is selected to be large enough (300 × 300 ×50mm3) in comparison with the wavelength of cortical folds. InSupplementary Figure S1(a), the green area in the middle of thefree surface of the cortex layer in the model is an indicator thatshows there is a bundle of axonal fibers beneath it. The materialproperties of the green area are set the same as the cortex, and themain purpose of the green area is to help trace the location of axo-nal fibers after cortical convolution. Supplementary Figure S1(b)shows the cross-section of the cortex model. The part with blue inthe model represents the bundle of axonal fibers which areacross the entire core. In this model, we utilize that differentialgrowth in the cortex as the basic driving mechanism for corticalfolding, similar to previous simulation studies (Bayly et al. 2013;Razavi , Zhang, Liu, et al. 2015; Zhang et al. 2017).
Growth in this soft tissue model is simulated via thermalexpansion (Cao et al. 2012; Razavi and Wang 2015; Razavi et al.2016). For understanding the detail of analogy between volu-metric growth model and thermal stress model please checkreference (Cao et al. 2012). The growth rate of bundle of fibers isconsidered to be variable to conduct different scenarios, so thatwe can explore how growth rates of axonal fibers can regulatethe formation of consistent gyri and hinge patterns for thegreen area in our model. Material properties of the cortex andcore are set as the same in the model since recent study hasshown that there is no significant difference in material prop-erty between gray and white matter of the brain (Budday et al.2015a). Our previous studies have shown that morphologicalpatterns of the cortex model after growth are independent ofthe absolute value of elastic modulus of the cortex and core ofthe cortex, but they depend on the ratio of their moduli (Razavi, Zhang, Li, et al. 2015; Zhang et al. 2016). The axonal stiffnessdepends critically on the degree of myelination may changesubstantially during development (Holland et al. 2015). Fromother hand, our results showed that stiffness of fibers do nothave considerable effect on the gyrification and only theirgrowth ratio show impact. Therefore, in our model, the stiff-ness of axonal fibers is assumed to be the same as the cortexand core have, and it is set as a constant. All FE simulations arecarried out by the popular package of ABAQUS.
ResultsBased on the methods described above, we calculated the fiberdensities on 2 hinges and 3 hinges in macaque/chimpanzee/human brains. Comparisons were performed across these 3 pri-mate species. Examples of the cortical surfaces color-coded byfiber density values are shown in Supplement Figure S2. Wecan see that the axonal fibers are much less dense in macaqueand chimpanzee brains than that in human brain. Also, thefiber density on gyri is much denser than that on sulci, which isconsistent with our previous findings in Chen et al. (2012) andNie et al. (2012). The quantitative measurements of axonal fiberdensity in Sections 3.1–3.3 are based on the same computa-tional pipeline.
Fiber Density of 2-hinge Gyri and 3-hinge Gyriin Human Brains
With the approaches described in Section 2.3, 3-hinge gyri wereidentified on cortical surfaces reconstructed using DTI datafrom 64 HCP subjects. Among these human brains, the averagenumber of 3 hinges is around 137. Based on the approach inSection 2.4, we obtained the average fiber densities of 3-hinge
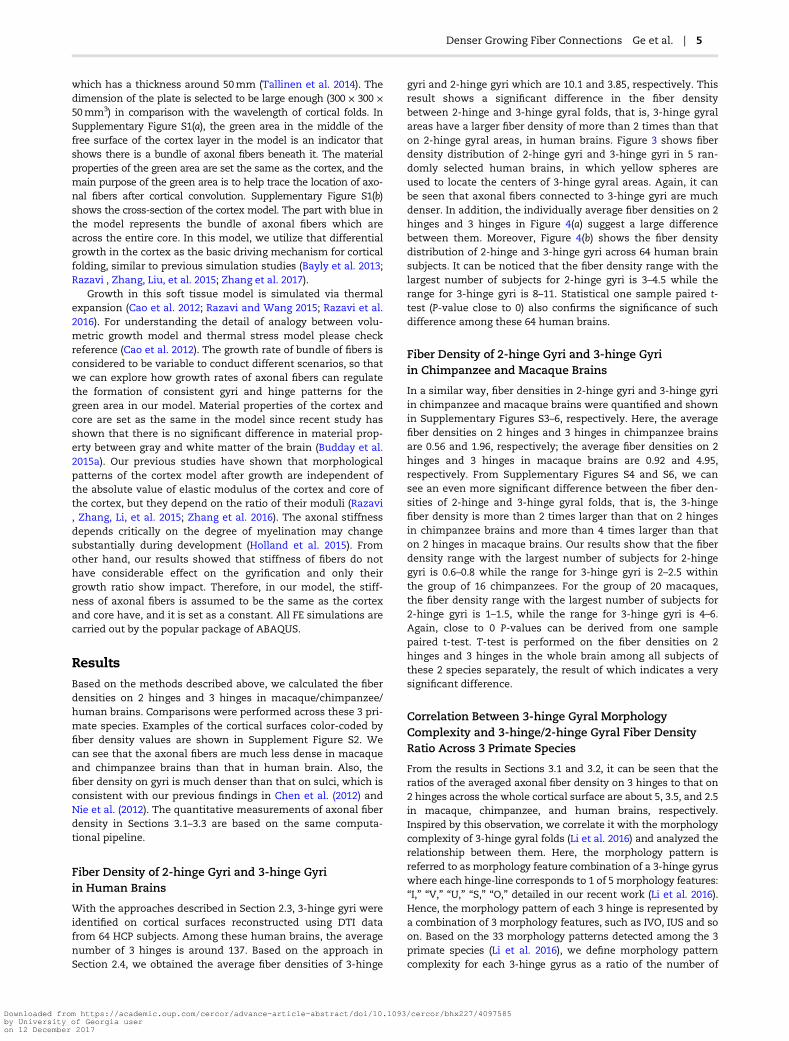
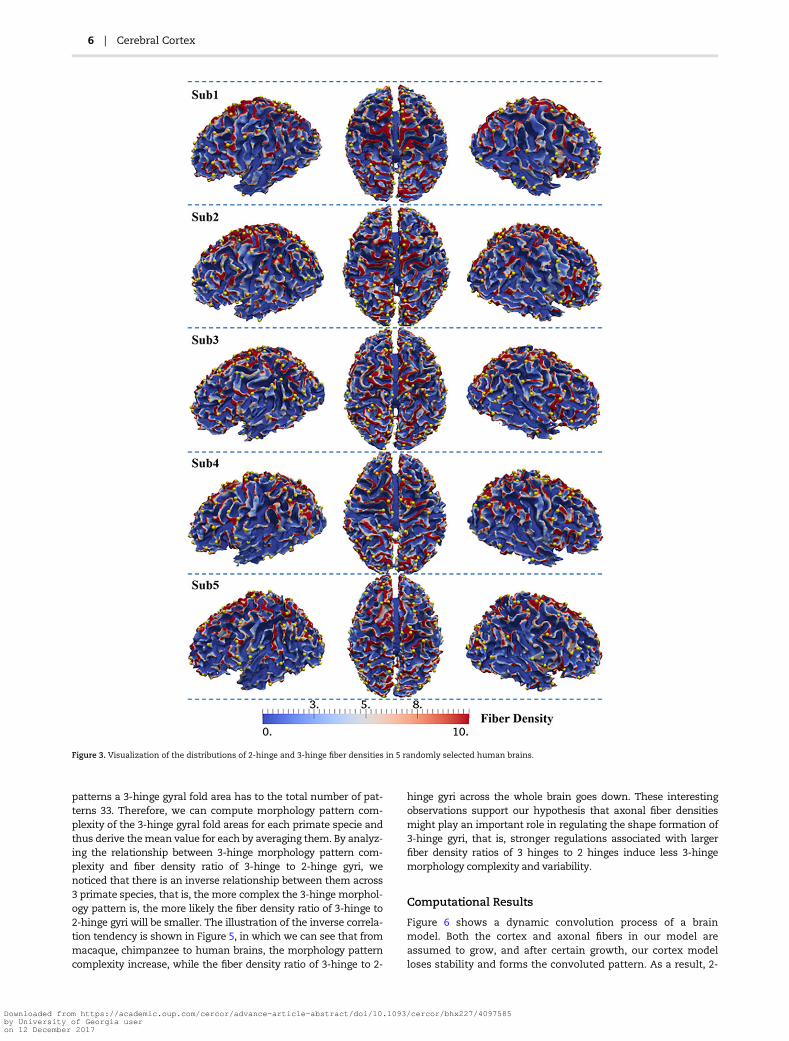
gyri and 2-hinge gyri which are 10.1 and 3.85, respectively. Thisresult shows a significant difference in the fiber densitybetween 2-hinge and 3-hinge gyral folds, that is, 3-hinge gyralareas have a larger fiber density of more than 2 times than thaton 2-hinge gyral areas, in human brains. Figure 3 shows fiberdensity distribution of 2-hinge gyri and 3-hinge gyri in 5 ran-domly selected human brains, in which yellow spheres areused to locate the centers of 3-hinge gyral areas. Again, it canbe seen that axonal fibers connected to 3-hinge gyri are muchdenser. In addition, the individually average fiber densities on 2hinges and 3 hinges in Figure 4(a) suggest a large differencebetween them. Moreover, Figure 4(b) shows the fiber densitydistribution of 2-hinge and 3-hinge gyri across 64 human brainsubjects. It can be noticed that the fiber density range with thelargest number of subjects for 2-hinge gyri is 3–4.5 while therange for 3-hinge gyri is 8–11. Statistical one sample paired t-test (P-value close to 0) also confirms the significance of suchdifference among these 64 human brains.
Fiber Density of 2-hinge Gyri and 3-hinge Gyriin Chimpanzee and Macaque Brains
In a similar way, fiber densities in 2-hinge gyri and 3-hinge gyriin chimpanzee and macaque brains were quantified and shownin Supplementary Figures S3–6, respectively. Here, the averagefiber densities on 2 hinges and 3 hinges in chimpanzee brainsare 0.56 and 1.96, respectively; the average fiber densities on 2hinges and 3 hinges in macaque brains are 0.92 and 4.95,respectively. From Supplementary Figures S4 and S6, we cansee an even more significant difference between the fiber den-sities of 2-hinge and 3-hinge gyral folds, that is, the 3-hingefiber density is more than 2 times larger than that on 2 hingesin chimpanzee brains and more than 4 times larger than thaton 2 hinges in macaque brains. Our results show that the fiberdensity range with the largest number of subjects for 2-hingegyri is 0.6–0.8 while the range for 3-hinge gyri is 2–2.5 withinthe group of 16 chimpanzees. For the group of 20 macaques,the fiber density range with the largest number of subjects for2-hinge gyri is 1–1.5, while the range for 3-hinge gyri is 4–6.Again, close to 0 P-values can be derived from one samplepaired t-test. T-test is performed on the fiber densities on 2hinges and 3 hinges in the whole brain among all subjects ofthese 2 species separately, the result of which indicates a verysignificant difference.
Correlation Between 3-hinge Gyral MorphologyComplexity and 3-hinge/2-hinge Gyral Fiber DensityRatio Across 3 Primate Species
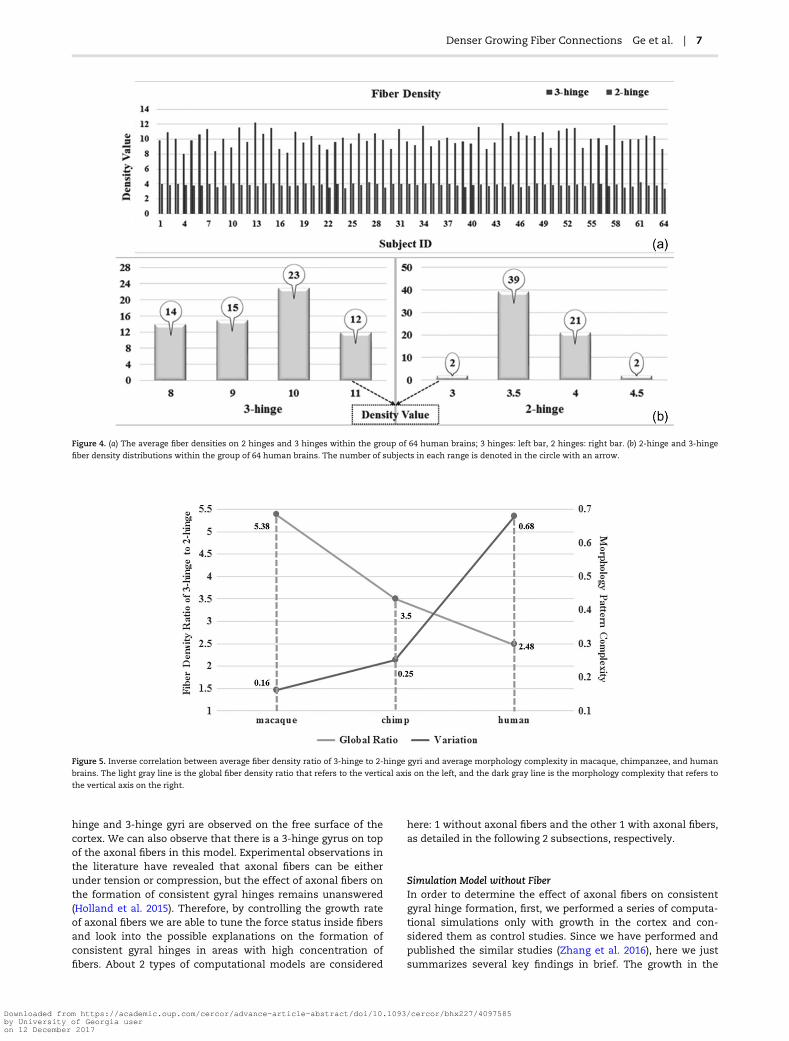
From the results in Sections 3.1 and 3.2, it can be seen that theratios of the averaged axonal fiber density on 3 hinges to that on2 hinges across the whole cortical surface are about 5, 3.5, and 2.5in macaque, chimpanzee, and human brains, respectively.Inspired by this observation, we correlate it with the morphologycomplexity of 3-hinge gyral folds (Li et al. 2016) and analyzed therelationship between them. Here, the morphology pattern isreferred to as morphology feature combination of a 3-hinge gyruswhere each hinge-line corresponds to 1 of 5 morphology features:“I,” “V,” “U,” “S,” “O,” detailed in our recent work (Li et al. 2016).Hence, the morphology pattern of each 3 hinge is represented bya combination of 3 morphology features, such as IVO, IUS and soon. Based on the 33 morphology patterns detected among the 3primate species (Li et al. 2016), we define morphology patterncomplexity for each 3-hinge gyrus as a ratio of the number of
Denser Growing Fiber Connections Ge et al. | 5
Downloaded from https://academic.oup.com/cercor/advance-article-abstract/doi/10.1093/cercor/bhx227/4097585by University of Georgia useron 12 December 2017
patterns a 3-hinge gyral fold area has to the total number of pat-terns 33. Therefore, we can compute morphology pattern com-plexity of the 3-hinge gyral fold areas for each primate specie andthus derive themean value for each by averaging them. By analyz-ing the relationship between 3-hinge morphology pattern com-plexity and fiber density ratio of 3-hinge to 2-hinge gyri, wenoticed that there is an inverse relationship between them across3 primate species, that is, the more complex the 3-hinge morphol-ogy pattern is, the more likely the fiber density ratio of 3-hinge to2-hinge gyri will be smaller. The illustration of the inverse correla-tion tendency is shown in Figure 5, in which we can see that frommacaque, chimpanzee to human brains, the morphology patterncomplexity increase, while the fiber density ratio of 3-hinge to 2-
hinge gyri across the whole brain goes down. These interestingobservations support our hypothesis that axonal fiber densitiesmight play an important role in regulating the shape formation of3-hinge gyri, that is, stronger regulations associated with largerfiber density ratios of 3 hinges to 2 hinges induce less 3-hingemorphology complexity and variability.
Computational Results
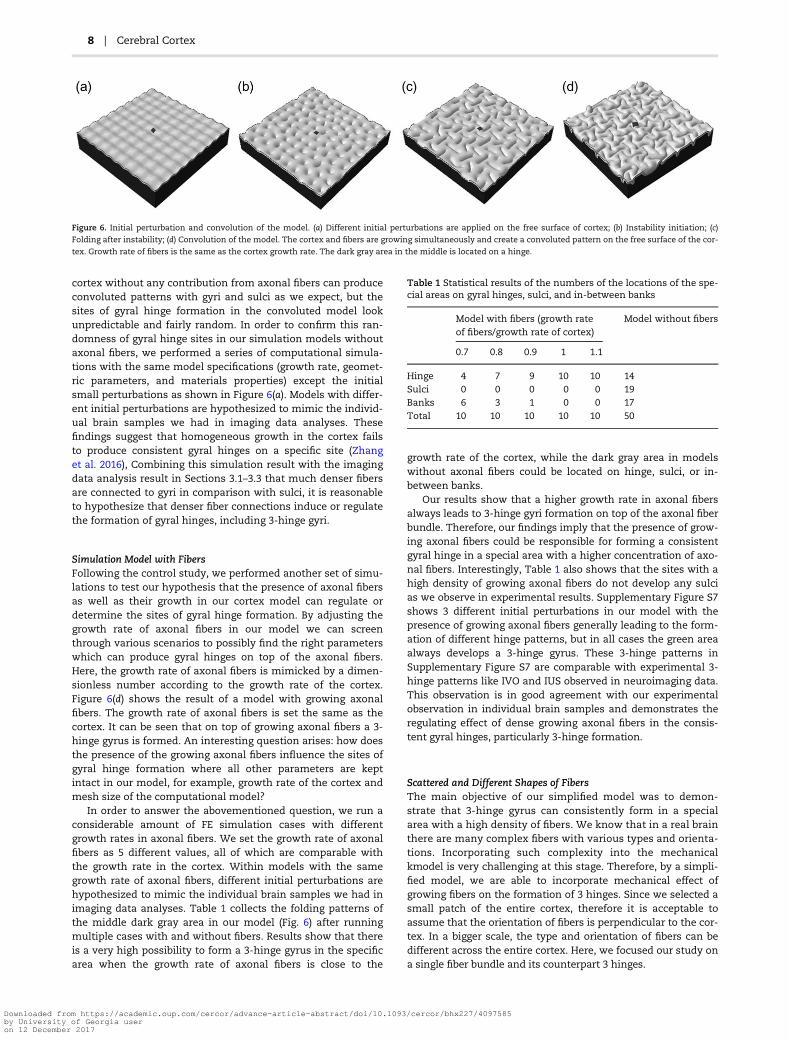
Figure 6 shows a dynamic convolution process of a brainmodel. Both the cortex and axonal fibers in our model areassumed to grow, and after certain growth, our cortex modelloses stability and forms the convoluted pattern. As a result, 2-
Figure 3. Visualization of the distributions of 2-hinge and 3-hinge fiber densities in 5 randomly selected human brains.
6 | Cerebral Cortex
Downloaded from https://academic.oup.com/cercor/advance-article-abstract/doi/10.1093/cercor/bhx227/4097585by University of Georgia useron 12 December 2017
hinge and 3-hinge gyri are observed on the free surface of thecortex. We can also observe that there is a 3-hinge gyrus on topof the axonal fibers in this model. Experimental observations inthe literature have revealed that axonal fibers can be eitherunder tension or compression, but the effect of axonal fibers onthe formation of consistent gyral hinges remains unanswered(Holland et al. 2015). Therefore, by controlling the growth rateof axonal fibers we are able to tune the force status inside fibersand look into the possible explanations on the formation ofconsistent gyral hinges in areas with high concentration offibers. About 2 types of computational models are considered
here: 1 without axonal fibers and the other 1 with axonal fibers,as detailed in the following 2 subsections, respectively.
Simulation Model without FiberIn order to determine the effect of axonal fibers on consistentgyral hinge formation, first, we performed a series of computa-tional simulations only with growth in the cortex and con-sidered them as control studies. Since we have performed andpublished the similar studies (Zhang et al. 2016), here we justsummarizes several key findings in brief. The growth in the
Figure 4. (a) The average fiber densities on 2 hinges and 3 hinges within the group of 64 human brains; 3 hinges: left bar, 2 hinges: right bar. (b) 2-hinge and 3-hinge
fiber density distributions within the group of 64 human brains. The number of subjects in each range is denoted in the circle with an arrow.
Figure 5. Inverse correlation between average fiber density ratio of 3-hinge to 2-hinge gyri and average morphology complexity in macaque, chimpanzee, and human
brains. The light gray line is the global fiber density ratio that refers to the vertical axis on the left, and the dark gray line is the morphology complexity that refers to
the vertical axis on the right.
Denser Growing Fiber Connections Ge et al. | 7
Downloaded from https://academic.oup.com/cercor/advance-article-abstract/doi/10.1093/cercor/bhx227/4097585by University of Georgia useron 12 December 2017
cortex without any contribution from axonal fibers can produceconvoluted patterns with gyri and sulci as we expect, but thesites of gyral hinge formation in the convoluted model lookunpredictable and fairly random. In order to confirm this ran-domness of gyral hinge sites in our simulation models withoutaxonal fibers, we performed a series of computational simula-tions with the same model specifications (growth rate, geomet-ric parameters, and materials properties) except the initialsmall perturbations as shown in Figure 6(a). Models with differ-ent initial perturbations are hypothesized to mimic the individ-ual brain samples we had in imaging data analyses. Thesefindings suggest that homogeneous growth in the cortex failsto produce consistent gyral hinges on a specific site (Zhanget al. 2016), Combining this simulation result with the imagingdata analysis result in Sections 3.1–3.3 that much denser fibersare connected to gyri in comparison with sulci, it is reasonableto hypothesize that denser fiber connections induce or regulatethe formation of gyral hinges, including 3-hinge gyri.
Simulation Model with FibersFollowing the control study, we performed another set of simu-lations to test our hypothesis that the presence of axonal fibersas well as their growth in our cortex model can regulate ordetermine the sites of gyral hinge formation. By adjusting thegrowth rate of axonal fibers in our model we can screenthrough various scenarios to possibly find the right parameterswhich can produce gyral hinges on top of the axonal fibers.Here, the growth rate of axonal fibers is mimicked by a dimen-sionless number according to the growth rate of the cortex.Figure 6(d) shows the result of a model with growing axonalfibers. The growth rate of axonal fibers is set the same as thecortex. It can be seen that on top of growing axonal fibers a 3-hinge gyrus is formed. An interesting question arises: how doesthe presence of the growing axonal fibers influence the sites ofgyral hinge formation where all other parameters are keptintact in our model, for example, growth rate of the cortex andmesh size of the computational model?
In order to answer the abovementioned question, we run aconsiderable amount of FE simulation cases with differentgrowth rates in axonal fibers. We set the growth rate of axonalfibers as 5 different values, all of which are comparable withthe growth rate in the cortex. Within models with the samegrowth rate of axonal fibers, different initial perturbations arehypothesized to mimic the individual brain samples we had inimaging data analyses. Table 1 collects the folding patterns ofthe middle dark gray area in our model (Fig. 6) after runningmultiple cases with and without fibers. Results show that thereis a very high possibility to form a 3-hinge gyrus in the specificarea when the growth rate of axonal fibers is close to the
growth rate of the cortex, while the dark gray area in modelswithout axonal fibers could be located on hinge, sulci, or in-between banks.
Our results show that a higher growth rate in axonal fibersalways leads to 3-hinge gyri formation on top of the axonal fiberbundle. Therefore, our findings imply that the presence of grow-ing axonal fibers could be responsible for forming a consistentgyral hinge in a special area with a higher concentration of axo-nal fibers. Interestingly, Table 1 also shows that the sites with ahigh density of growing axonal fibers do not develop any sulcias we observe in experimental results. Supplementary Figure S7shows 3 different initial perturbations in our model with thepresence of growing axonal fibers generally leading to the form-ation of different hinge patterns, but in all cases the green areaalways develops a 3-hinge gyrus. These 3-hinge patterns inSupplementary Figure S7 are comparable with experimental 3-hinge patterns like IVO and IUS observed in neuroimaging data.This observation is in good agreement with our experimentalobservation in individual brain samples and demonstrates theregulating effect of dense growing axonal fibers in the consis-tent gyral hinges, particularly 3-hinge formation.
Scattered and Different Shapes of FibersThe main objective of our simplified model was to demon-strate that 3-hinge gyrus can consistently form in a specialarea with a high density of fibers. We know that in a real brainthere are many complex fibers with various types and orienta-tions. Incorporating such complexity into the mechanicalkmodel is very challenging at this stage. Therefore, by a simpli-fied model, we are able to incorporate mechanical effect ofgrowing fibers on the formation of 3 hinges. Since we selected asmall patch of the entire cortex, therefore it is acceptable toassume that the orientation of fibers is perpendicular to the cor-tex. In a bigger scale, the type and orientation of fibers can bedifferent across the entire cortex. Here, we focused our study ona single fiber bundle and its counterpart 3 hinges.
Figure 6. Initial perturbation and convolution of the model. (a) Different initial perturbations are applied on the free surface of cortex; (b) Instability initiation; (c)
Folding after instability; (d) Convolution of the model. The cortex and fibers are growing simultaneously and create a convoluted pattern on the free surface of the cor-
tex. Growth rate of fibers is the same as the cortex growth rate. The dark gray area in the middle is located on a hinge.
Table 1 Statistical results of the numbers of the locations of the spe-cial areas on gyral hinges, sulci, and in-between banks
Model with fibers (growth rateof fibers/growth rate of cortex)
Model without fibers
0.7 0.8 0.9 1 1.1
Hinge 4 7 9 10 10 14Sulci 0 0 0 0 0 19Banks 6 3 1 0 0 17Total 10 10 10 10 10 50
8 | Cerebral Cortex
Downloaded from https://academic.oup.com/cercor/advance-article-abstract/doi/10.1093/cercor/bhx227/4097585by University of Georgia useron 12 December 2017
In the next step, we increased the number of fiber bundlesand placed them randomly in our model. Simulation results,again, confirmed our hypothesis that 3 hinges were alwaysformed at sites where the growing fiber bundles were embed-ded underneath. Supplementary Figure S8 shows the evolutionsteps of a FE model with 10 scattered growing fiber bundles.
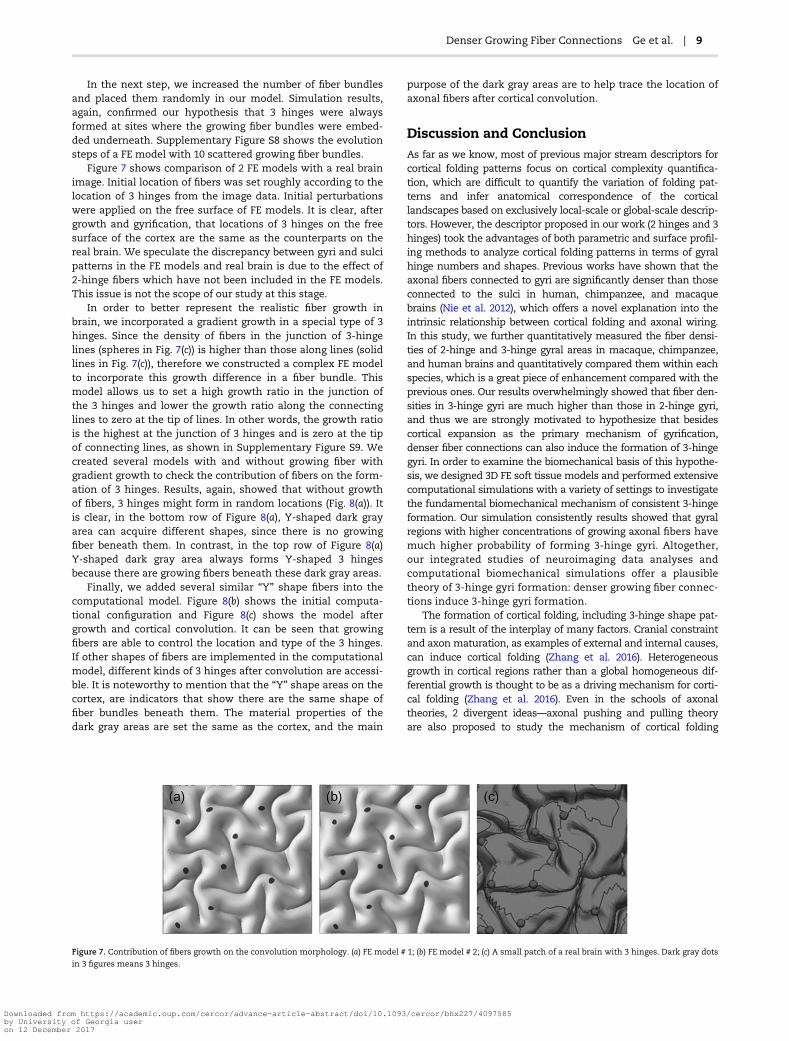
Figure 7 shows comparison of 2 FE models with a real brainimage. Initial location of fibers was set roughly according to thelocation of 3 hinges from the image data. Initial perturbationswere applied on the free surface of FE models. It is clear, aftergrowth and gyrification, that locations of 3 hinges on the freesurface of the cortex are the same as the counterparts on thereal brain. We speculate the discrepancy between gyri and sulcipatterns in the FE models and real brain is due to the effect of2-hinge fibers which have not been included in the FE models.This issue is not the scope of our study at this stage.
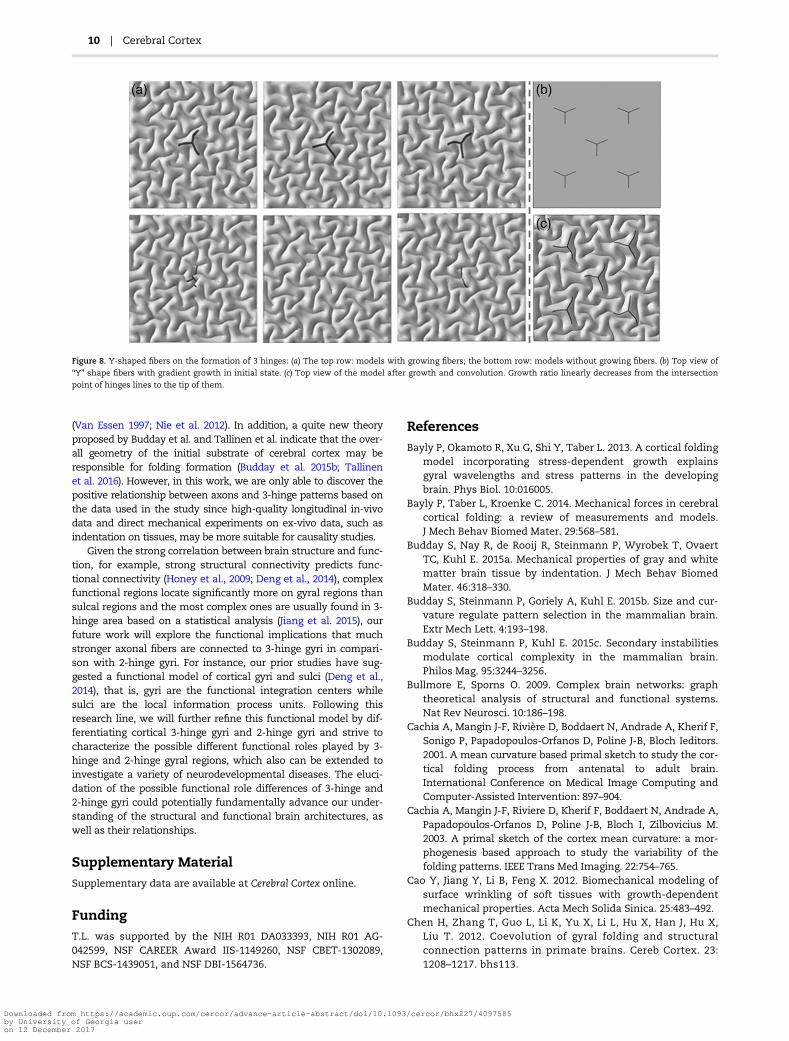
In order to better represent the realistic fiber growth inbrain, we incorporated a gradient growth in a special type of 3hinges. Since the density of fibers in the junction of 3-hingelines (spheres in Fig. 7(c)) is higher than those along lines (solidlines in Fig. 7(c)), therefore we constructed a complex FE modelto incorporate this growth difference in a fiber bundle. Thismodel allows us to set a high growth ratio in the junction ofthe 3 hinges and lower the growth ratio along the connectinglines to zero at the tip of lines. In other words, the growth ratiois the highest at the junction of 3 hinges and is zero at the tipof connecting lines, as shown in Supplementary Figure S9. Wecreated several models with and without growing fiber withgradient growth to check the contribution of fibers on the form-ation of 3 hinges. Results, again, showed that without growthof fibers, 3 hinges might form in random locations (Fig. 8(a)). Itis clear, in the bottom row of Figure 8(a), Y-shaped dark grayarea can acquire different shapes, since there is no growingfiber beneath them. In contrast, in the top row of Figure 8(a)Y-shaped dark gray area always forms Y-shaped 3 hingesbecause there are growing fibers beneath these dark gray areas.
Finally, we added several similar “Y” shape fibers into thecomputational model. Figure 8(b) shows the initial computa-tional configuration and Figure 8(c) shows the model aftergrowth and cortical convolution. It can be seen that growingfibers are able to control the location and type of the 3 hinges.If other shapes of fibers are implemented in the computationalmodel, different kinds of 3 hinges after convolution are accessi-ble. It is noteworthy to mention that the “Y” shape areas on thecortex, are indicators that show there are the same shape offiber bundles beneath them. The material properties of thedark gray areas are set the same as the cortex, and the main
purpose of the dark gray areas are to help trace the location ofaxonal fibers after cortical convolution.
Discussion and ConclusionAs far as we know, most of previous major stream descriptors forcortical folding patterns focus on cortical complexity quantifica-tion, which are difficult to quantify the variation of folding pat-terns and infer anatomical correspondence of the corticallandscapes based on exclusively local-scale or global-scale descrip-tors. However, the descriptor proposed in our work (2 hinges and 3hinges) took the advantages of both parametric and surface profil-ing methods to analyze cortical folding patterns in terms of gyralhinge numbers and shapes. Previous works have shown that theaxonal fibers connected to gyri are significantly denser than thoseconnected to the sulci in human, chimpanzee, and macaquebrains (Nie et al. 2012), which offers a novel explanation into theintrinsic relationship between cortical folding and axonal wiring.In this study, we further quantitatively measured the fiber densi-ties of 2-hinge and 3-hinge gyral areas in macaque, chimpanzee,and human brains and quantitatively compared them within eachspecies, which is a great piece of enhancement compared with theprevious ones. Our results overwhelmingly showed that fiber den-sities in 3-hinge gyri are much higher than those in 2-hinge gyri,and thus we are strongly motivated to hypothesize that besidescortical expansion as the primary mechanism of gyrification,denser fiber connections can also induce the formation of 3-hingegyri. In order to examine the biomechanical basis of this hypothe-sis, we designed 3D FE soft tissue models and performed extensivecomputational simulations with a variety of settings to investigatethe fundamental biomechanical mechanism of consistent 3-hingeformation. Our simulation consistently results showed that gyralregions with higher concentrations of growing axonal fibers havemuch higher probability of forming 3-hinge gyri. Altogether,our integrated studies of neuroimaging data analyses andcomputational biomechanical simulations offer a plausibletheory of 3-hinge gyri formation: denser growing fiber connec-tions induce 3-hinge gyri formation.
The formation of cortical folding, including 3-hinge shape pat-tern is a result of the interplay of many factors. Cranial constraintand axon maturation, as examples of external and internal causes,can induce cortical folding (Zhang et al. 2016). Heterogeneousgrowth in cortical regions rather than a global homogeneous dif-ferential growth is thought to be as a driving mechanism for corti-cal folding (Zhang et al. 2016). Even in the schools of axonaltheories, 2 divergent ideas—axonal pushing and pulling theoryare also proposed to study the mechanism of cortical folding
Figure 7. Contribution of fibers growth on the convolution morphology. (a) FE model # 1; (b) FE model # 2; (c) A small patch of a real brain with 3 hinges. Dark gray dots
in 3 figures means 3 hinges.
Denser Growing Fiber Connections Ge et al. | 9
Downloaded from https://academic.oup.com/cercor/advance-article-abstract/doi/10.1093/cercor/bhx227/4097585by University of Georgia useron 12 December 2017
(Van Essen 1997; Nie et al. 2012). In addition, a quite new theoryproposed by Budday et al. and Tallinen et al. indicate that the over-all geometry of the initial substrate of cerebral cortex may beresponsible for folding formation (Budday et al. 2015b; Tallinenet al. 2016). However, in this work, we are only able to discover thepositive relationship between axons and 3-hinge patterns based onthe data used in the study since high-quality longitudinal in-vivodata and direct mechanical experiments on ex-vivo data, such asindentation on tissues, may be more suitable for causality studies.
Given the strong correlation between brain structure and func-tion, for example, strong structural connectivity predicts func-tional connectivity (Honey et al., 2009; Deng et al., 2014), complexfunctional regions locate significantly more on gyral regions thansulcal regions and the most complex ones are usually found in 3-hinge area based on a statistical analysis (Jiang et al. 2015), ourfuture work will explore the functional implications that muchstronger axonal fibers are connected to 3-hinge gyri in compari-son with 2-hinge gyri. For instance, our prior studies have sug-gested a functional model of cortical gyri and sulci (Deng et al.,2014), that is, gyri are the functional integration centers whilesulci are the local information process units. Following thisresearch line, we will further refine this functional model by dif-ferentiating cortical 3-hinge gyri and 2-hinge gyri and strive tocharacterize the possible different functional roles played by 3-hinge and 2-hinge gyral regions, which also can be extended toinvestigate a variety of neurodevelopmental diseases. The eluci-dation of the possible functional role differences of 3-hinge and2-hinge gyri could potentially fundamentally advance our under-standing of the structural and functional brain architectures, aswell as their relationships.
Supplementary MaterialSupplementary data are available at Cerebral Cortex online.
FundingT.L. was supported by the NIH R01 DA033393, NIH R01 AG-042599, NSF CAREER Award IIS-1149260, NSF CBET-1302089,NSF BCS-1439051, and NSF DBI-1564736.
ReferencesBayly P, Okamoto R, Xu G, Shi Y, Taber L. 2013. A cortical folding
model incorporating stress-dependent growth explainsgyral wavelengths and stress patterns in the developingbrain. Phys Biol. 10:016005.
Bayly P, Taber L, Kroenke C. 2014. Mechanical forces in cerebralcortical folding: a review of measurements and models.J Mech Behav Biomed Mater. 29:568–581.
Budday S, Nay R, de Rooij R, Steinmann P, Wyrobek T, OvaertTC, Kuhl E. 2015a. Mechanical properties of gray and whitematter brain tissue by indentation. J Mech Behav BiomedMater. 46:318–330.
Budday S, Steinmann P, Goriely A, Kuhl E. 2015b. Size and cur-vature regulate pattern selection in the mammalian brain.Extr Mech Lett. 4:193–198.
Budday S, Steinmann P, Kuhl E. 2015c. Secondary instabilitiesmodulate cortical complexity in the mammalian brain.Philos Mag. 95:3244–3256.
Bullmore E, Sporns O. 2009. Complex brain networks: graphtheoretical analysis of structural and functional systems.Nat Rev Neurosci. 10:186–198.
Cachia A, Mangin J-F, Rivière D, Boddaert N, Andrade A, Kherif F,Sonigo P, Papadopoulos-Orfanos D, Poline J-B, Bloch Ieditors.2001. A mean curvature based primal sketch to study the cor-tical folding process from antenatal to adult brain.International Conference on Medical Image Computing andComputer-Assisted Intervention: 897–904.
Cachia A, Mangin J-F, Riviere D, Kherif F, Boddaert N, Andrade A,Papadopoulos-Orfanos D, Poline J-B, Bloch I, Zilbovicius M.2003. A primal sketch of the cortex mean curvature: a mor-phogenesis based approach to study the variability of thefolding patterns. IEEE Trans Med Imaging. 22:754–765.
Cao Y, Jiang Y, Li B, Feng X. 2012. Biomechanical modeling ofsurface wrinkling of soft tissues with growth-dependentmechanical properties. Acta Mech Solida Sinica. 25:483–492.
Chen H, Zhang T, Guo L, Li K, Yu X, Li L, Hu X, Han J, Hu X,Liu T. 2012. Coevolution of gyral folding and structuralconnection patterns in primate brains. Cereb Cortex. 23:1208–1217. bhs113.
Figure 8. Y-shaped fibers on the formation of 3 hinges: (a) The top row: models with growing fibers; the bottom row: models without growing fibers. (b) Top view of
“Y” shape fibers with gradient growth in initial state. (c) Top view of the model after growth and convolution. Growth ratio linearly decreases from the intersection
point of hinges lines to the tip of them.
10 | Cerebral Cortex
Downloaded from https://academic.oup.com/cercor/advance-article-abstract/doi/10.1093/cercor/bhx227/4097585by University of Georgia useron 12 December 2017
Deng F, Jiang X, Zhu D, Zhang T, Li K, Guo L, Liu T. 2014. A func-tional model of cortical gyri and sulci. Brain Struct Funct.219:1473–1491.
Dubois J, Benders M, Borradori-Tolsa C, Cachia A, Lazeyras F,Ha-Vinh Leuchter R, Sizonenko SV, Warfield SK, Mangin JF,Hüppi PS. 2008. Primary cortical folding in the human new-born: an early marker of later functional development.Brain. 131:2028–2041.
Fischl B. 2012. FreeSurfer. Neuroimage. 62:774–781.Fischl B, Rajendran N, Busa E, Augustinack J, Hinds O, Yeo BT,
Mohlberg H, Amunts K, Zilles K. 2008. Cortical folding patternsand predicting cytoarchitecture. Cereb Cortex. 18:1973–1980.
Giedd JN, Rapoport JL. 2010. Structural MRI of pediatric braindevelopment: what have we learned and where are wegoing? Neuron. 67:728–734.
Gilles FH, Leviton A, Dooling E. 1983. The developinghuman brain: growth and epidemiologic neuropathol-ogy. Boston: John Wright Inc.
Hardan AY, Jou RJ, Keshavan MS, Varma R, Minshew NJ. 2004.Increased frontal cortical folding in autism: a preliminaryMRI study. Psychiatry Res. 131:263–268.
Holland MA, Miller KE, Kuhl E. 2015. Emerging brain morpholo-gies from axonal elongation. Ann Biomed Eng. 43:1640–1653.
Honey C, Sporns O, Cammoun L, Gigandet X, Thiran J-P, Meuli R,Hagmann P. 2009. Predicting human resting-state functionalconnectivity from structural connectivity. Proc Natl Acad Sci.106:2035–2040.
Honey CJ, Thivierge J-P, Sporns O. 2010. Can structure predictfunction in the human brain? Neuroimage. 52:766–776.
Jenkinson M, Beckmann CF, Behrens TE, Woolrich MW, SmithSM. 2012. Fsl. Neuroimage. 62:782–790.
Jiang X, Li X, Lv J, Zhang T, Zhang S, Guo L, Liu T. 2015. Sparserepresentation of HCP grayordinate data reveals novel func-tional architecture of cerebral cortex. Hum Brain Mapp. 36:5301–5319.
Li G, Liu T, Ni D, Lin W, Gilmore JH, Shen D. 2015.Spatiotemporal patterns of cortical fiber density in develop-ing infants, and their relationship with cortical thickness.Hum Brain Mapp. 36:5183–5195.
Li G, Wang L, Shi F, Lyall AE, Lin W, Gilmore JH, Shen D. 2014.Mapping longitudinal development of local cortical gyrificationin infants from birth to 2 years of age. J Neurosci. 34:4228–4238.
Li K, Guo L, Li G, Nie J, Faraco C, Cui G, Zhao Q, Miller LS, Liu T.2010. Gyral folding pattern analysis via surface profiling.NeuroImage. 52:1202–1214.
Li X, Chen H, Zhang T, Yu X, Jiang X, Li K, Li L, Razavi MJ, Wang X,Hu X. 2016. Commonly preserved and species-specific gyralfolding patterns across primate brains. Brain Struct Funct. 222(5):2127–2141.
Liu T. 2011. A few thoughts on brain ROIs. Brain Imaging Behav.5:189–202.
Liu T, Nie J, Tarokh A, Guo L, Wong ST. 2008. Reconstruction ofcentral cortical surface from brain MRI images: method andapplication. NeuroImage. 40:991–1002.
Lohmann G, Von Cramon DY, Colchester AC. 2008. Deep sulcallandmarks provide an organizing framework for human cor-tical folding. Cereb Cortex. 18:1415–1420.
Neal J, Takahashi M, Silva M, Tiao G, Walsh CA, Sheen VL. 2007.Insights into the gyrification of developing ferret brain bymagnetic resonance imaging. J Anat. 210:66–77.
Nie J, Guo L, Li K, Wang Y, Chen G, Li L, Chen H, Deng F, Jiang X,Zhang T. 2012. Axonal fiber terminations concentrate ongyri. Cereb Cortex. 22:2831–2839.
Nordahl CW, Dierker D, Mostafavi I, Schumann CM, Rivera SM,Amaral DG, Van Essen DC. 2007. Cortical folding abnormali-ties in autism revealed by surface-based morphometry.J Neurosci. 27:11725–11735.
Rakic P. 1988. Specification of cerebral cortical areas. Science.241:170–176.
Razavi MJ, Pidaparti R, Wang X. 2016. Surface and interfacialcreases in a bilayer tubular soft tissue. Phys Rev E. 94:022405.
Razavi MJ, Wang X. 2015. Morphological patterns of a growingbiological tube in a confined environment with contactingboundary. RSC Adv. 5:7440–7449.
Razavi MJ, Zhang T, Li X, Liu T, Wang X. 2015. Role of mechani-cal factors in cortical folding development. Phys Rev E. 92:032701.
Razavi MJ, Zhang T, Liu T, Wang X. 2015. Cortical folding pat-tern and its consistency induced by biological growth. SciRep. 5:14477.
Richman DP, Stewart RM, Hutchinson JW, Caviness VS Jr. 1975.Mechanical model of brain convolutional development.Science. 189(4196):18–21.
Ronan L, Voets N, Rua C, Alexander-Bloch A, Hough M, Mackay C,Crow TJ, James A, Giedd JN, Fletcher PC. 2014. Differential tan-gential expansion as a mechanism for cortical gyrification.Cereb Cortex. 24:2219–2228.
Schoenemann PT. 2006. Evolution of the size and functionalareas of the human brain. Annu Rev Anthropol. 35:379–406.
Sun T, Hevner RF. 2014. Growth and folding of the mammaliancerebral cortex: from molecules to malformations. Nat RevNeurosci. 15:217–232.
Tallinen T, Chung JY, Biggins JS, Mahadevan L. 2014.Gyrification from constrained cortical expansion. Proc NatlAcad Sci. 111:12667–12672.
Tallinen T, Chung JY, Rousseau F, Girard N, Lefèvre J,Mahadevan L. 2016. On the growth and form of cortical con-volutions. Nat Phys. 12(6):588–593.
Thompson PM, Hayashi KM, Sowell ER, Gogtay N, Giedd JN,Rapoport JL, de Zubicaray GI, Janke AL, Rose SE, Semple J.2004. Mapping cortical change in Alzheimer’s disease, braindevelopment, and schizophrenia. Neuroimage. 23:S2–S18.
Toro R, Burnod Y. 2005. A morphogenetic model for the devel-opment of cortical convolutions. Cereb Cortex. 15:1900–1913.
Van Essen DC. 1997. A tension-based theory of morphogenesisand compact wiring in the central nervous system. Nature.385(6614):313–318.
Van Essen DC, Ugurbil K, Auerbach E, Barch D, Behrens T,Bucholz R, Chang A, Chen L, Corbetta M, Curtiss SW. 2012.The Human Connectome Project: a data acquisition per-spective. Neuroimage. 62:2222–2231.
Yeo BT, Yu P, Grant PE, Fischl B, Golland Peditors. 2008. Shapeanalysis with overcomplete spherical wavelets. InternationalConference on Medical Image Computing and Computer-Assisted Intervention: 468–476.
Yu P, Yeo BTT, Grant PE, Fischl B, Golland Peditors. 2007.Cortical folding development study based on over-completespherical wavelets. IEEE 11th International Conference onComputer Vision: 1–8.
Zhang T, Chen H, Guo L, Li K, Li L, Zhang S, Shen D, Hu X, Liu T.2014. Characterization of U-shape streamline fibers: meth-ods and applications. Med Image Anal. 18:795–807.
Zhang T, Razavi MJ, Chen H, Li Y, Li X, Li L, Guo L, Hu X, Liu T,Wang X. 2017. Mechanisms of circumferential gyral convo-lution in primate brains. J Comput Neurosci. 42:217–229.
Denser Growing Fiber Connections Ge et al. | 11
Downloaded from https://academic.oup.com/cercor/advance-article-abstract/doi/10.1093/cercor/bhx227/4097585by University of Georgia useron 12 December 2017

Zhang T, Razavi MJ, Li X, Chen H, Liu T, Wang X. 2016.Mechanism of consistent gyrus formation: an experimentaland computational study. Sci Rep. 6:37272.
Zilles K, Armstrong E, Schleicher A, Kretschmann H-J. 1988. Thehuman pattern of gyrification in the cerebral cortex. AnatEmbryol (Berl). 179:173–179.
Zilles K, Schleicher A, Langemann C, Amunts K, Morosan P,Palomero-Gallagher N, Schormann T, Mohlberg H, Bürgel U,Steinmetz H, et al. 1997. Quantitative analysis of sulci in thehuman cerebral cortex: development, regional heterogene-ity, gender difference, asymmetry, intersubject variabilityand cortical architecture. Hum Brain Mapp. 5:218–222.
12 | Cerebral Cortex
Downloaded from https://academic.oup.com/cercor/advance-article-abstract/doi/10.1093/cercor/bhx227/4097585by University of Georgia useron 12 December 2017