DE SANTIAGO BIPV
18
Ecole Doctorale des Sciences Physiques et de l’Ingénieur Master Mécanique et Ingénieries, voie Recherche Université Bordeaux 1 Rapport d’étude bibliographique, Session 2013-2014 Etude des aspects de modélisation thermique de systèmes de vitrages de pye BIPV DE SANTIAGO Daniel Tuteur : BATSALE Jean-Christophe Laboratoire : I2M – Département TREFLE
-
Upload
daniel-de-santiago-casado -
Category
Documents
-
view
54 -
download
0
Transcript of DE SANTIAGO BIPV
Ecole Doctorale
des Sciences
Physiques et de
l’Ingénieur
Master Mécanique
et Ingénieries,
voie Recherche
Université Bordeaux 1
Rapport d’étude bibliographique,
Session 2013-2014
Etude des aspects de modélisation thermique de systèmes de
vitrages de pye BIPV
DE SANTIAGO Daniel
Tuteur : BATSALE Jean-Christophe
Laboratoire : I2M – Département TREFLE
DE SANTIAGO Daniel Travail bibliographique 2013/2014
2
Abstract
In the present paper a global study of the PV technology will be done, focusing on
BIPV systems. A review of the short history of this technology will be shown, as well as the
possible future that we can already imagine by thinking about the Smart Grid concept and its
relationship with the distributed generation. Before knowing the functioning of these systems,
we will look at the different materials that are being used nowadays and we will also take a
look at the materials which will certainly become more and more used in the following years.
Afterwards, we will see some alternatives which can be done in order to increase
performance. This rise can be achieved by controlling the heat transfer or the mass flow inside
the PV systems. In the last section, we will observe the different ways of establishing a model.
Firstly, the electrical analogy will be realised to simplify the thermal system. Secondly, the
practical quadrupole method will be explained. To finish, a comparison between four different
roofs and an analysis of the BIPV technology in urban areas will be developed to show the
results that these types of models can offer.
Table of contents
1. Introduction ............................................................................................................................ 2
2. Photovoltaic materials ............................................................................................................ 4
2.1 Amorphous silicon ........................................................................................................... 4
2.2 Organic photovoltaic ........................................................................................................ 4
3. Heat transfer in PV ................................................................................................................. 5
3.1 Model of heat transfer in PV ............................................................................................ 6
3.2 Results .............................................................................................................................. 7
3.3 Conclusion ........................................................................................................................ 8
4. Establishment of a model ....................................................................................................... 8
4.1 Electrical analogy ............................................................................................................ 8
4.2 Quadrupole method .......................................................................................................... 9
4.3 Analysis of different roofs .............................................................................................. 11
4.4 BIPV in urban areas ....................................................................................................... 13
5. Conclusion ............................................................................................................................ 17
6. Bibliography ......................................................................................................................... 18
1. Introduction
(1) After finishing the first BIPV installation in 1991 the demand for modules
constructed for building-integration grew rapidly. The first production line for photovoltaic
modules specialized for BIPV with a capacity of 5000m2 per year was finished in 1993 by
Pilkington in Germany. Since then the production increases significantly to a capacity around
50 000 m2 per year at the end of 1999. (2) In 2011, a fruit and vegetable distribution centre in
the south of France is now the site of the world’s largest BIPV system (8,8MW array, which
spans 11 building of 68 000 m2 warehouse roofing). Plans are already in place to expand the
record-breaking system to include an additional 250 000 m2
of tiling by 2015, potentially
tripling capacity in process.
DE SANTIAGO Daniel Travail bibliographique 2013/2014
3
(3) A really interesting aspect of BIPV is the fact that we can save energy by focusing
on insulation techniques. Residential building are skin dominated in reference to thermal
performance. Thus the building fabric becomes obvious element to improve energetically.
The residential building energy share by end-use in Australia is comprised of: 38% space
heating, 30% electrical, 27% water heating, 4% cooling. Much of this is lost in the older
building stock because of poor building techniques and lack of insulation. These numbers
show the importance of adressing heating and cooling in buildings along with electrical
production, and provide a clear impetus for looking at cutting-edge solutions. Residential
building also have other advantages in relation to the implementation of BIPV and combined
PV/thermal systems (PV/T). These systems can make a significant percentage contribution to
overall home energy loads, and there are already good BIPV residential products installed and
on the market. PV’s are also the main avenues of distributed generation (DG) in the
residential market.
(4) The distributed generation is related to the concept of Smart Grid, a concept which
is becoming more and more used in our days. A definition of Smart Grid could be the
following one:
“Smart Grid generally refers to a class of technology people are using to bring utility
electricity delivery systems into the 21st century, using computer-based remote control and
automation. These systems are made possible by two-way communication technology and
computer processing that has been used for decades in other industries. They are beginning to
be used on electricity networks, from the power plants and wind farms all the way to the
consumers of electricity in homes and businesses. They offer many benefits to utilites and
consumers, mostly seen in big improvements in energy efficiency on the electricity grid and
in the energy users’ homes and offices”.
The Smart Grid allows the integration of renewable technologies. The source of
electricity today is largely composed of traditional fossil fuels, based for instance on the US
Energy Information Association. Renewable energy provides less than 15% of energy today.
However, this value is expected to grow and the integration of renewable sources into the
energy network at levels higher than 20% does require more advanced management solutions,
according to the European Wind Energy Association (EWEA).
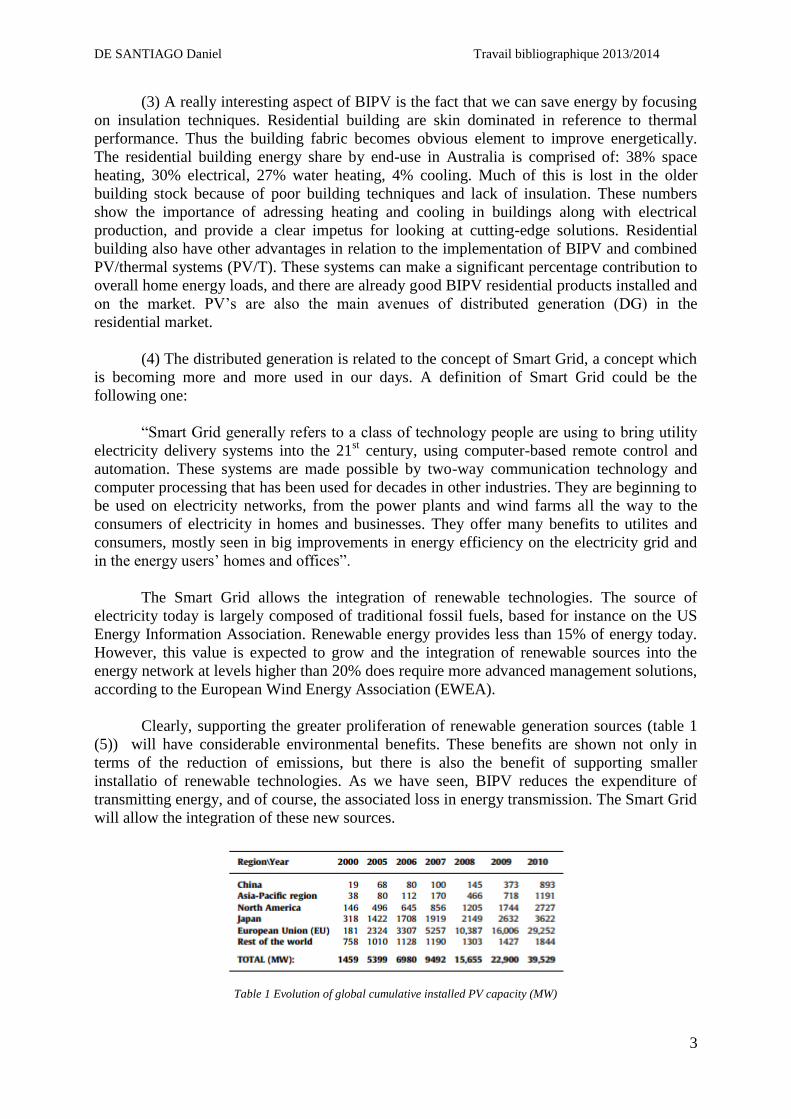
Clearly, supporting the greater proliferation of renewable generation sources (table 1
(5)) will have considerable environmental benefits. These benefits are shown not only in
terms of the reduction of emissions, but there is also the benefit of supporting smaller
installatio of renewable technologies. As we have seen, BIPV reduces the expenditure of
transmitting energy, and of course, the associated loss in energy transmission. The Smart Grid
will allow the integration of these new sources.
Table 1 Evolution of global cumulative installed PV capacity (MW)
DE SANTIAGO Daniel Travail bibliographique 2013/2014
4
2. Photovoltaic materials
(5) Along the development of the photovoltaic systems, many light absorbing
materials have been used, leading to a number of PV technologies which can be classified in
chronological order as first (crystalline silicon PV), second (thin film or amorphous silicon),
and third generation (other PV). Crystalline silicon accounts for about 80% of the market
today, with thin film technologies being on the rise and other PV technologies just emerging.
In this paper we will talk about the second and third generation due to the fact they are the
most innovative ones.
2.1 Amorphous silicon
(6) At the beginning, a-Si was mainly used for consumer applications, but afterwards
it was applied to large-area building-integrated electricity generation.
Thin-film silicon technologies, applied to glass substrates, differ from other PV
technologies by several attractive features, namely:
Silicon as base material; this implies non-toxic and abundant material supply, free
from heavy metals like cadmium or relative rare materials like indium.
Low process temperatures around 200°C; this facilities the use of low-cost soda-lime
float-glass substrates, and leads to moderate energy consumption, as well as short
energy payback times.
Very large-area deposition processes by plasma-enhanced chemical vapor deposition
(PECVD); this method is also used for the deposition of thin-film silicon in the flat-
planed-display technology, where coating areas up to 5m2 can be realized.
Stacked cell structures, thereby allowing for higher voltage/lower current devices, and
for the incorporation of different band gaps for extended spectral response, as
currently realized with the combination of amorphous and microcrystalline silicon in
so-called micromorph structures.
The lowest temperature coefficient of power output among all photovoltaic
technologies.
Monolithic series connection of cells to modules, and hence variability of output
voltages.
Suitability for providing semitransparent module designs.
Substantial cost reduction potential.
2.2 Organic photovoltaic
(5) The OPV solar cells are believed to have many attractive characteristics which are
beneficial for commercialization. Recurrent advantages are the potential to be flexible, low
cost, semi-transparent, and easily integrateable into different devices. However, large are roll-
to-roll (R2R) manufactured OPV modules are currently not competitive with grid-connected
silicon PV modules. Indeed, to the best of our knowledge, no module efficiency of 4.69% has
been reached with an area in the square meter range. The highest efficiency that was
independently confirmed for an OPV submodule of 10 series connected cells is 4.2±0.2% for
an area of 294.5 cm2, while the record cell efficiency is 10.0±0.3% for an area of 1.021 cm
2.
Efficiency is lost both by upscaling and interconnecting cells. Furthermore, no polymer based
OPV modules have suggested lifetimes – based on results of unstandardized ageing tests –
greater than 3-4 years.
DE SANTIAGO Daniel Travail bibliographique 2013/2014
5
Nowadays, doubt exists regarding the application(s) that OPV should target. Taking a
look back in time might help answering the question, as both the first and the second
generation were further developed in the consumer electronics market. Opportunities still
exist in this segment, as it has not yet fully established itself. This may be due to a shifted
focus alongside solar cells development. In particular, PV technology developers strive to
penetrate the segment with most economic potential, which currently is the grid-connected
market. However, the pathway, exploited in getting there so far, has required the help of a set
of smaller niche markets of increasing size, which, through attaining low-cost. An example of
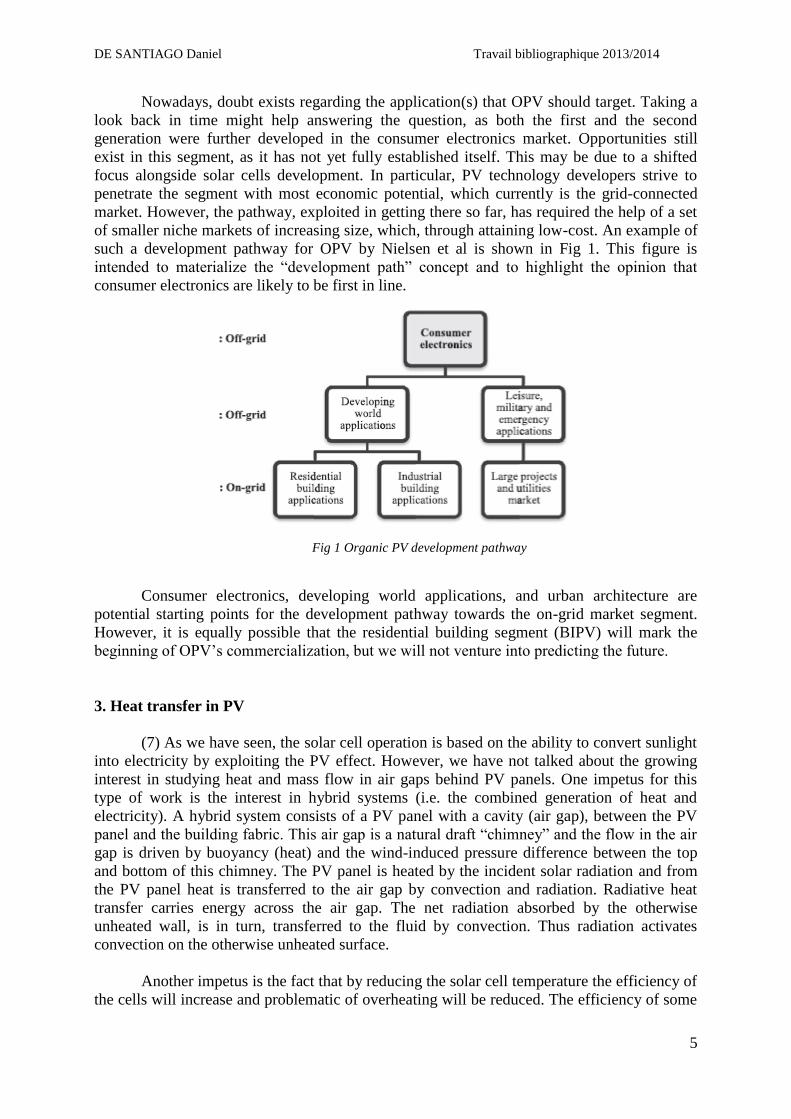
such a development pathway for OPV by Nielsen et al is shown in Fig 1. This figure is
intended to materialize the “development path” concept and to highlight the opinion that
consumer electronics are likely to be first in line.
Fig 1 Organic PV development pathway
Consumer electronics, developing world applications, and urban architecture are
potential starting points for the development pathway towards the on-grid market segment.
However, it is equally possible that the residential building segment (BIPV) will mark the
beginning of OPV’s commercialization, but we will not venture into predicting the future.
3. Heat transfer in PV
(7) As we have seen, the solar cell operation is based on the ability to convert sunlight
into electricity by exploiting the PV effect. However, we have not talked about the growing
interest in studying heat and mass flow in air gaps behind PV panels. One impetus for this
type of work is the interest in hybrid systems (i.e. the combined generation of heat and
electricity). A hybrid system consists of a PV panel with a cavity (air gap), between the PV
panel and the building fabric. This air gap is a natural draft “chimney” and the flow in the air
gap is driven by buoyancy (heat) and the wind-induced pressure difference between the top
and bottom of this chimney. The PV panel is heated by the incident solar radiation and from
the PV panel heat is transferred to the air gap by convection and radiation. Radiative heat
transfer carries energy across the air gap. The net radiation absorbed by the otherwise
unheated wall, is in turn, transferred to the fluid by convection. Thus radiation activates
convection on the otherwise unheated surface.
Another impetus is the fact that by reducing the solar cell temperature the efficiency of
the cells will increase and problematic of overheating will be reduced. The efficiency of some
DE SANTIAGO Daniel Travail bibliographique 2013/2014
6
types of solar cells is very much dependent on the operating temperature of the cell. For
example, for crystalline silicon solar modules a reduction by 20°C will give an increase in
efficiency between 0.6 and 1%.
3.1 Model of heat transfer in PV
In studies of air flow and heat transfer between solar cells and the air gap in hybrid
systems one can to some extent mimic the properties of solar panels by inserting a heating foil
in an insulated channel. By choosing a thick insulation, one can ensure that most of the heat
generated by the heating foil is transferred to the air in the channel. This approach enables a
systematic study of the relation between input heat and various flow and heat transfer
properties. A vertical channel with an air gap with dimensions, w=1.54 m, d=0.23 m and
H=6.5 m is built in Sweden. The channel is insulated with 0.29 m mineral wool. To minimize
end effects the width of the heating foil is larger than the width of the air gap. The heating foil
is 460 mm wide and 0.5 mm thick.
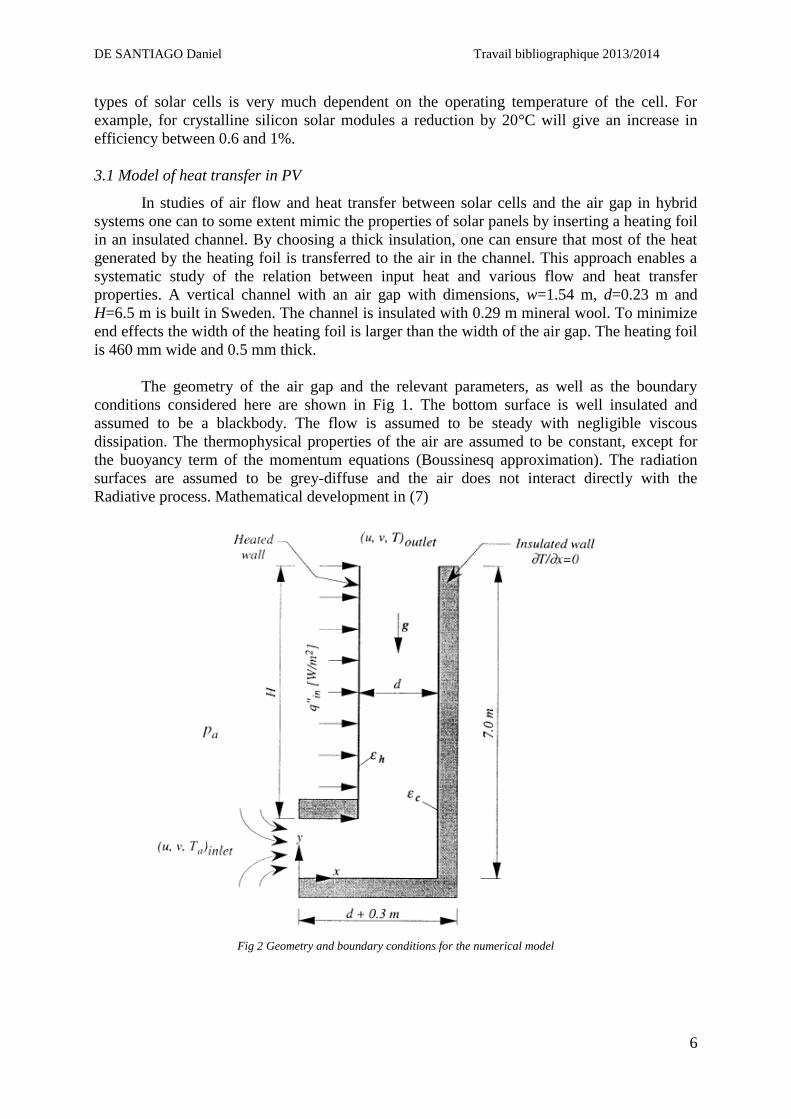
The geometry of the air gap and the relevant parameters, as well as the boundary
conditions considered here are shown in Fig 1. The bottom surface is well insulated and
assumed to be a blackbody. The flow is assumed to be steady with negligible viscous
dissipation. The thermophysical properties of the air are assumed to be constant, except for
the buoyancy term of the momentum equations (Boussinesq approximation). The radiation
surfaces are assumed to be grey-diffuse and the air does not interact directly with the
Radiative process. Mathematical development in (7)
Fig 2 Geometry and boundary conditions for the numerical model
DE SANTIAGO Daniel Travail bibliographique 2013/2014
7
3.2 Results
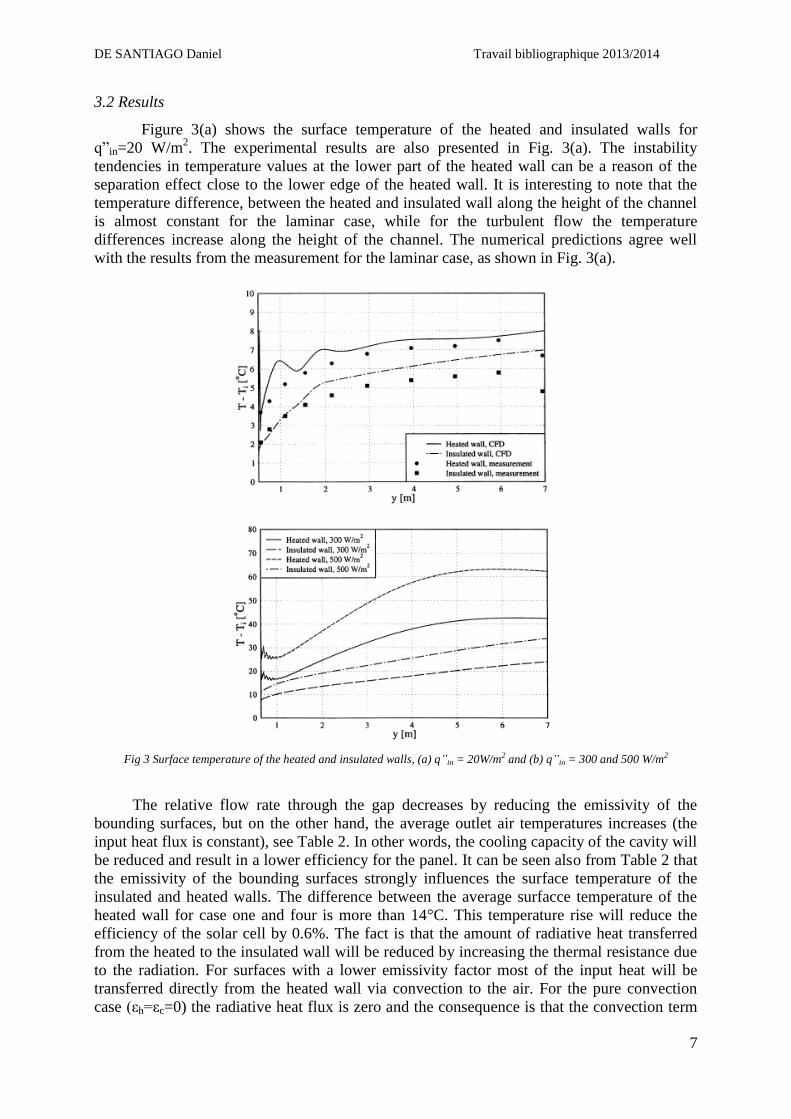
Figure 3(a) shows the surface temperature of the heated and insulated walls for
q”in=20 W/m2. The experimental results are also presented in Fig. 3(a). The instability
tendencies in temperature values at the lower part of the heated wall can be a reason of the
separation effect close to the lower edge of the heated wall. It is interesting to note that the
temperature difference, between the heated and insulated wall along the height of the channel
is almost constant for the laminar case, while for the turbulent flow the temperature
differences increase along the height of the channel. The numerical predictions agree well
with the results from the measurement for the laminar case, as shown in Fig. 3(a).
Fig 3 Surface temperature of the heated and insulated walls, (a) q”in = 20W/m2 and (b) q”in = 300 and 500 W/m2
The relative flow rate through the gap decreases by reducing the emissivity of the
bounding surfaces, but on the other hand, the average outlet air temperatures increases (the
input heat flux is constant), see Table 2. In other words, the cooling capacity of the cavity will
be reduced and result in a lower efficiency for the panel. It can be seen also from Table 2 that
the emissivity of the bounding surfaces strongly influences the surface temperature of the
insulated and heated walls. The difference between the average surfacce temperature of the
heated wall for case one and four is more than 14°C. This temperature rise will reduce the
efficiency of the solar cell by 0.6%. The fact is that the amount of radiative heat transferred
from the heated to the insulated wall will be reduced by increasing the thermal resistance due
to the radiation. For surfaces with a lower emissivity factor most of the input heat will be
transferred directly from the heated wall via convection to the air. For the pure convection
case (εh=εc=0) the radiative heat flux is zero and the consequence is that the convection term
DE SANTIAGO Daniel Travail bibliographique 2013/2014
8
for the insulated wall can be neglected, the surface temperature of the insulated wall is close
to the air temperature adjacent to the wall and the surface temperature of the heated wall will
rise to the highest possible temperature.
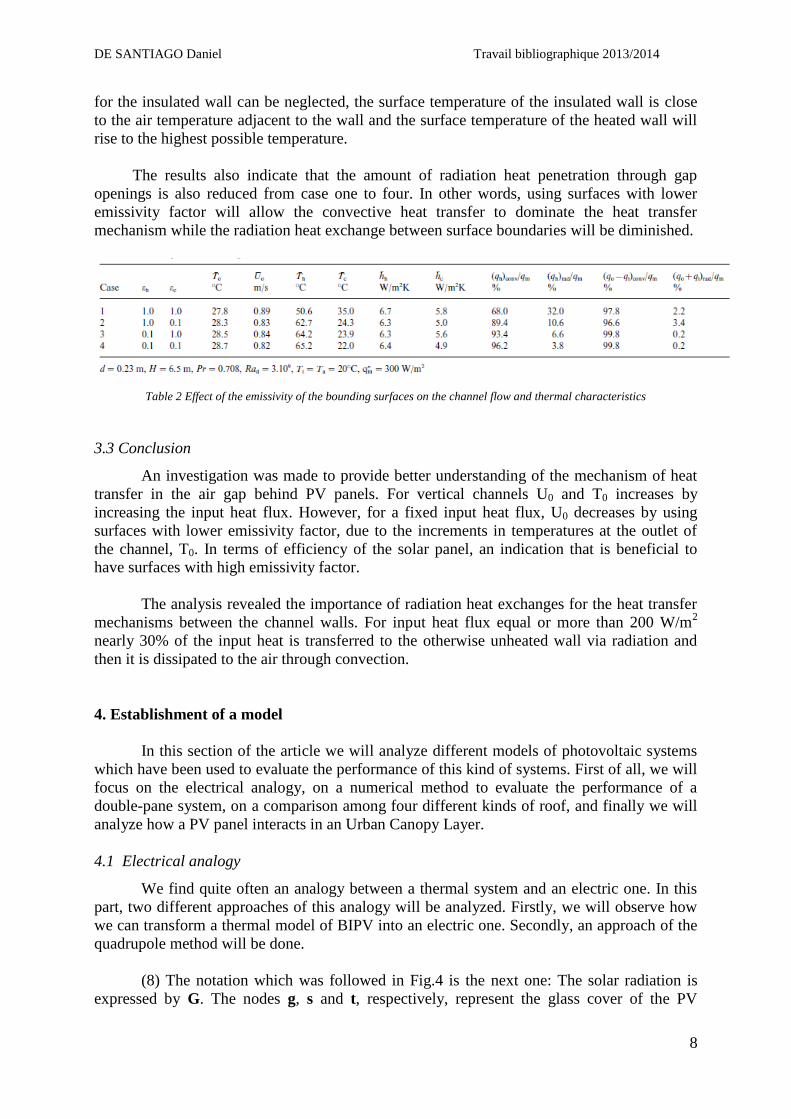
The results also indicate that the amount of radiation heat penetration through gap
openings is also reduced from case one to four. In other words, using surfaces with lower
emissivity factor will allow the convective heat transfer to dominate the heat transfer
mechanism while the radiation heat exchange between surface boundaries will be diminished.
Table 2 Effect of the emissivity of the bounding surfaces on the channel flow and thermal characteristics
3.3 Conclusion
An investigation was made to provide better understanding of the mechanism of heat
transfer in the air gap behind PV panels. For vertical channels U0 and T0 increases by
increasing the input heat flux. However, for a fixed input heat flux, U0 decreases by using
surfaces with lower emissivity factor, due to the increments in temperatures at the outlet of
the channel, T0. In terms of efficiency of the solar panel, an indication that is beneficial to
have surfaces with high emissivity factor.
The analysis revealed the importance of radiation heat exchanges for the heat transfer
mechanisms between the channel walls. For input heat flux equal or more than 200 W/m2
nearly 30% of the input heat is transferred to the otherwise unheated wall via radiation and
then it is dissipated to the air through convection.
4. Establishment of a model
In this section of the article we will analyze different models of photovoltaic systems
which have been used to evaluate the performance of this kind of systems. First of all, we will
focus on the electrical analogy, on a numerical method to evaluate the performance of a
double-pane system, on a comparison among four different kinds of roof, and finally we will
analyze how a PV panel interacts in an Urban Canopy Layer.
4.1 Electrical analogy
We find quite often an analogy between a thermal system and an electric one. In this
part, two different approaches of this analogy will be analyzed. Firstly, we will observe how
we can transform a thermal model of BIPV into an electric one. Secondly, an approach of the
quadrupole method will be done.
(8) The notation which was followed in Fig.4 is the next one: The solar radiation is
expressed by G. The nodes g, s and t, respectively, represent the glass cover of the PV

DE SANTIAGO Daniel Travail bibliographique 2013/2014
9
module, the PV cell, and the PV back sheet. The node f is for the air in the gap and the node d
is for the roof: Tc and Ti are the exterior and interior surface temperatures of the roof. It is
also interesting to know that the different kinds of heat transfer are represented as c for
convection, d for conduction and r for radiation and this is the first subscript which appears
after the R (which stands for resistance). To finish, sky and gr are the subscripts which mean
the interaction with the sky and the ground respectively.
Fig. 4 illustrates the energy flow through the PV roof system with a ventilation gap
based on the R-C circuit representation. This is an easy way to conceive the whole thermal
system. Just one look is needed to understand the manner the heat is transferred along the
system.
Fig 4 Energy flow of BIPV with ventilated air-gap
4.2 Quadrupole method
(9) In this part, we will observe now how we can use the quadrupole method. The
quadrupole method is a unified exact explicit method of representation of linear systems. It
can apply to a large number of classes of linear systems.
In its simpler more basic version in heat conduction, it is based on 2x2 matrices that
relate some transform of both temperature and flux on one surface of the considered medium
DE SANTIAGO Daniel Travail bibliographique 2013/2014
10
to the same quantities on another surface. We use the term “transform” here in a very wide
meaning: it can be a Laplace transform in a transient one-dimensional case, a Fourier space
cosine. Besides, a change of boundary conditions does not require rewriting the whole
problem starting from scratch: the quadrupole relationship does not depend on the boundary
conditions on the surfaces defined by the transformed directions.
If we observe the electrical analogy in Fig 4, we can think about simplifying
assumptions, in order to manage to write the equations which govern the heating transfer.
Sky, air and ground are at the same temperature = Text = T1
Glass will be named 2, PV will be 3, the air gap 4 and 5 will be for the roof.
These subscripts are chosen to simplify the writing.
We assume that each layer is at a uniform temperature, so there is no diffusion
in the plane.
In the air “layer”, this is highly questionable. The air temperature is very difficult to
know and it can change quite fast from one point to another.
In a solid layer, a priori this assumption is not a problem, due to the fact that the
external heating is always with a frequency about 1/24 h (much slower than the characteristic
time of the heating transfer). However, the conductive phenomena are not taken into account.
This will be a problem while analyzing a solid layer in which one part is under the influence
of the solar radiation and another one is at shade.
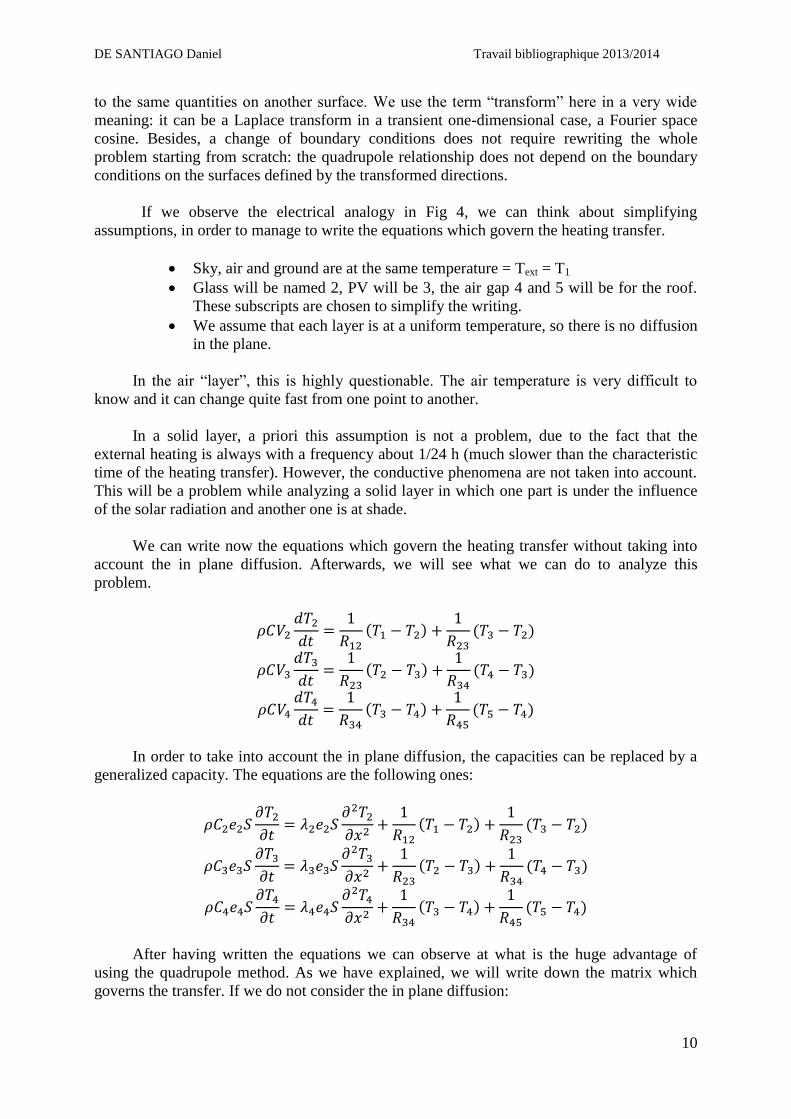
We can write now the equations which govern the heating transfer without taking into
account the in plane diffusion. Afterwards, we will see what we can do to analyze this
problem.
( )
( )
( )
( )
( )
( )
In order to take into account the in plane diffusion, the capacities can be replaced by a
generalized capacity. The equations are the following ones:
( )
( )
( )
( )
( )
( )
After having written the equations we can observe at what is the huge advantage of
using the quadrupole method. As we have explained, we will write down the matrix which
governs the transfer. If we do not consider the in plane diffusion:
DE SANTIAGO Daniel Travail bibliographique 2013/2014
11
( ( )
( )) [
] [
] [
] ( ( )
( ))
If consider now the in plane diffusion, the equations are the following ones:
( ( )
( )) [
] [
] [
] ( ( )
( ))
We can realize that the problem is much easier while using the quadrupole method.
The only thing we have to do is calculate the matrix 2x2 which governs the whole heating
transfer.
4.3 Analysis of different roofs
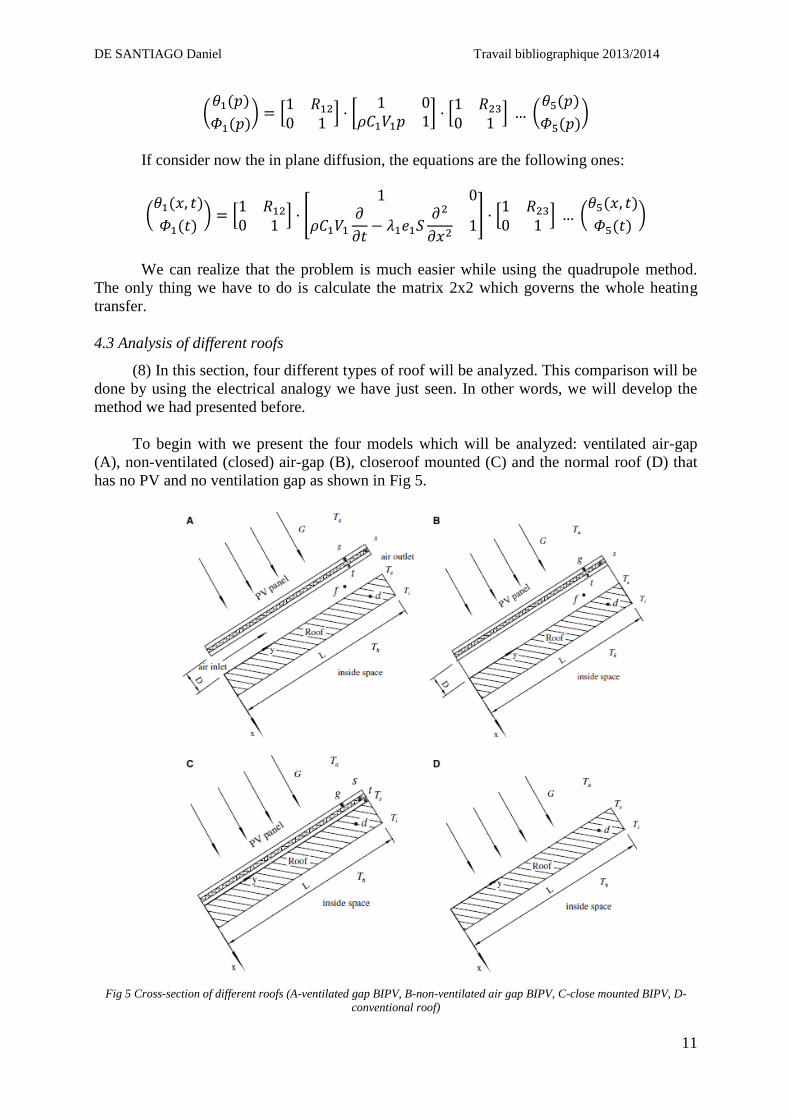
(8) In this section, four different types of roof will be analyzed. This comparison will be
done by using the electrical analogy we have just seen. In other words, we will develop the
method we had presented before.
To begin with we present the four models which will be analyzed: ventilated air-gap
(A), non-ventilated (closed) air-gap (B), closeroof mounted (C) and the normal roof (D) that
has no PV and no ventilation gap as shown in Fig 5.
Fig 5 Cross-section of different roofs (A-ventilated gap BIPV, B-non-ventilated air gap BIPV, C-close mounted BIPV, D-
conventional roof)
DE SANTIAGO Daniel Travail bibliographique 2013/2014
12
An exhaustive analysis of how we have to proceed to get the results is impossible to be
done. Because of that, in the present article we will resume how it was done and for more
information a search in (8) can be done.
Firstly, the energy flow is designed as we have seen in figure 4. Afterwards, the
equations which govern the heat transfer are written and all constants are defined. Moreover,
the article gives a reference to the calculation methods of Imp and Vmp which are used to
calculate the maximum power output from the PV module.
To finish, we define how we proceed for getting the solution. For complex boundary-
conditions and arbitrary initial temperature-distribution, the analytical solution became very
involved and numerical methods are much more convenient. Computation for a given period
begins with assumed initial conditions at midnight that all temperatures are equal to ambient
temperature. T0 obtain the periodic steady-state solution, the calculation in all cases continues
for 10 days, eliminating any error associated with initial transients.
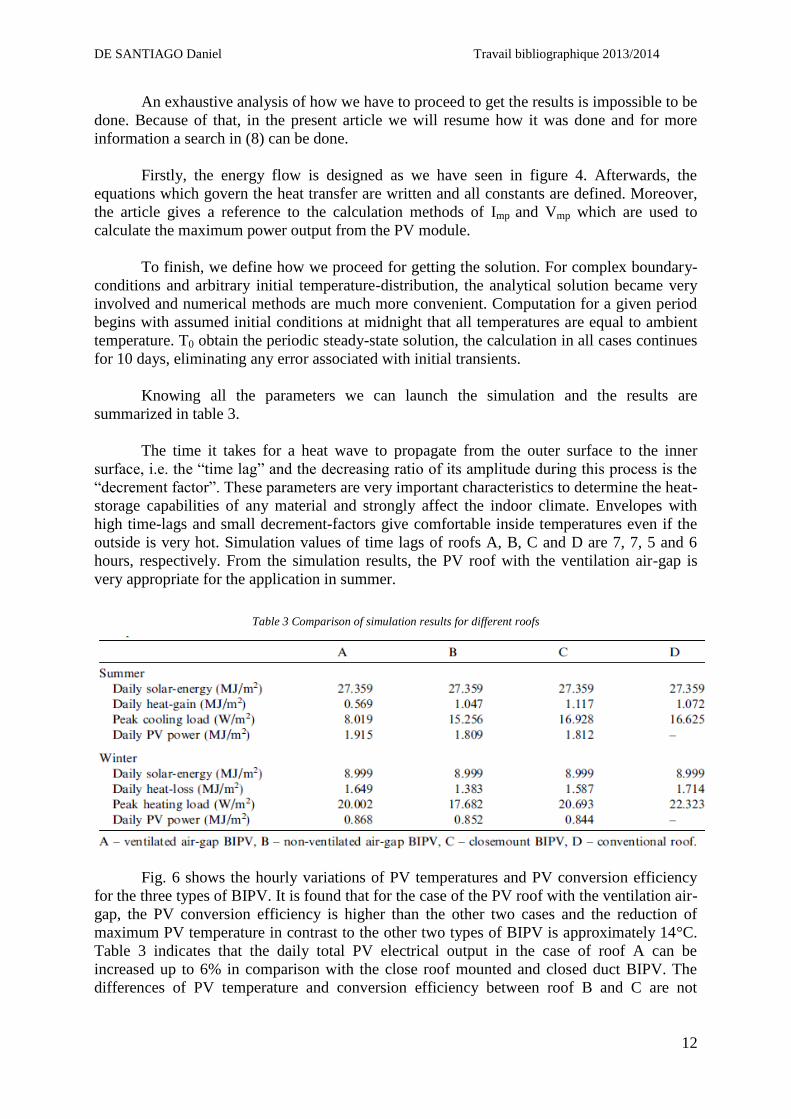
Knowing all the parameters we can launch the simulation and the results are
summarized in table 3.
The time it takes for a heat wave to propagate from the outer surface to the inner
surface, i.e. the “time lag” and the decreasing ratio of its amplitude during this process is the
“decrement factor”. These parameters are very important characteristics to determine the heat-
storage capabilities of any material and strongly affect the indoor climate. Envelopes with
high time-lags and small decrement-factors give comfortable inside temperatures even if the
outside is very hot. Simulation values of time lags of roofs A, B, C and D are 7, 7, 5 and 6
hours, respectively. From the simulation results, the PV roof with the ventilation air-gap is
very appropriate for the application in summer.
Table 3 Comparison of simulation results for different roofs
Fig. 6 shows the hourly variations of PV temperatures and PV conversion efficiency
for the three types of BIPV. It is found that for the case of the PV roof with the ventilation air-
gap, the PV conversion efficiency is higher than the other two cases and the reduction of
maximum PV temperature in contrast to the other two types of BIPV is approximately 14°C.
Table 3 indicates that the daily total PV electrical output in the case of roof A can be
increased up to 6% in comparison with the close roof mounted and closed duct BIPV. The
differences of PV temperature and conversion efficiency between roof B and C are not
DE SANTIAGO Daniel Travail bibliographique 2013/2014
13
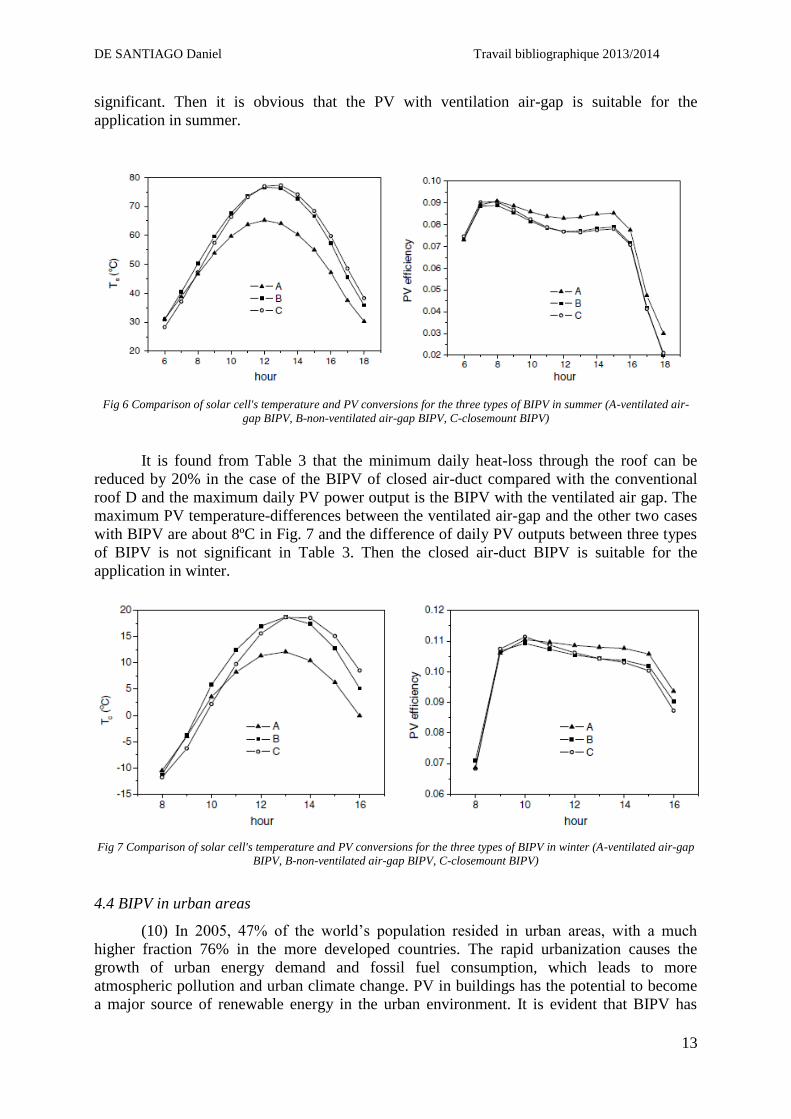
significant. Then it is obvious that the PV with ventilation air-gap is suitable for the
application in summer.
Fig 6 Comparison of solar cell's temperature and PV conversions for the three types of BIPV in summer (A-ventilated air-
gap BIPV, B-non-ventilated air-gap BIPV, C-closemount BIPV)
It is found from Table 3 that the minimum daily heat-loss through the roof can be
reduced by 20% in the case of the BIPV of closed air-duct compared with the conventional
roof D and the maximum daily PV power output is the BIPV with the ventilated air gap. The
maximum PV temperature-differences between the ventilated air-gap and the other two cases
with BIPV are about 8ºC in Fig. 7 and the difference of daily PV outputs between three types
of BIPV is not significant in Table 3. Then the closed air-duct BIPV is suitable for the
application in winter.
Fig 7 Comparison of solar cell's temperature and PV conversions for the three types of BIPV in winter (A-ventilated air-gap
BIPV, B-non-ventilated air-gap BIPV, C-closemount BIPV)
4.4 BIPV in urban areas
(10) In 2005, 47% of the world’s population resided in urban areas, with a much
higher fraction 76% in the more developed countries. The rapid urbanization causes the
growth of urban energy demand and fossil fuel consumption, which leads to more
atmospheric pollution and urban climate change. PV in buildings has the potential to become
a major source of renewable energy in the urban environment. It is evident that BIPV has
DE SANTIAGO Daniel Travail bibliographique 2013/2014
14
influence on the heat transfer of building envelope and changes radiation energy balance by
adding or replacing conventional building elements in urban areas. Therefore, it is very
important to further study the influence of urban scale PV on the urban microclimate.
The climates of urban areas can be broadly classified into the urban canopy layer
(UCL) and the urban boundary layer (UBL). The UBL, above roof level, is the part of the
planetary boundary layer whose characteristics are affected by the presence of the urban
surface below and a local to mesoscale phenomenon controlled by process operating at larger
spatial and temporal scales. In the UCL (roughly from ground to roof level), processes of air
flow and energy exchange are controlled by microscale, site-specific characteristics and
processes. The model we will analyze was developed to assess the effect of PV roof and PV
façade on the microclimate of UCL.
PTEBU model consists of four sub-models: PV thermal model, PV electrical
performance model, building energy consumption model, and urban canyon energy budget
model. Bothe the first and the second sub-model have already been exposed in the previous
section. The interesting part of the PTEBU model is the difference we have to make by
thinking of an urban microclimate, in other words the third and the fourth sub-model.
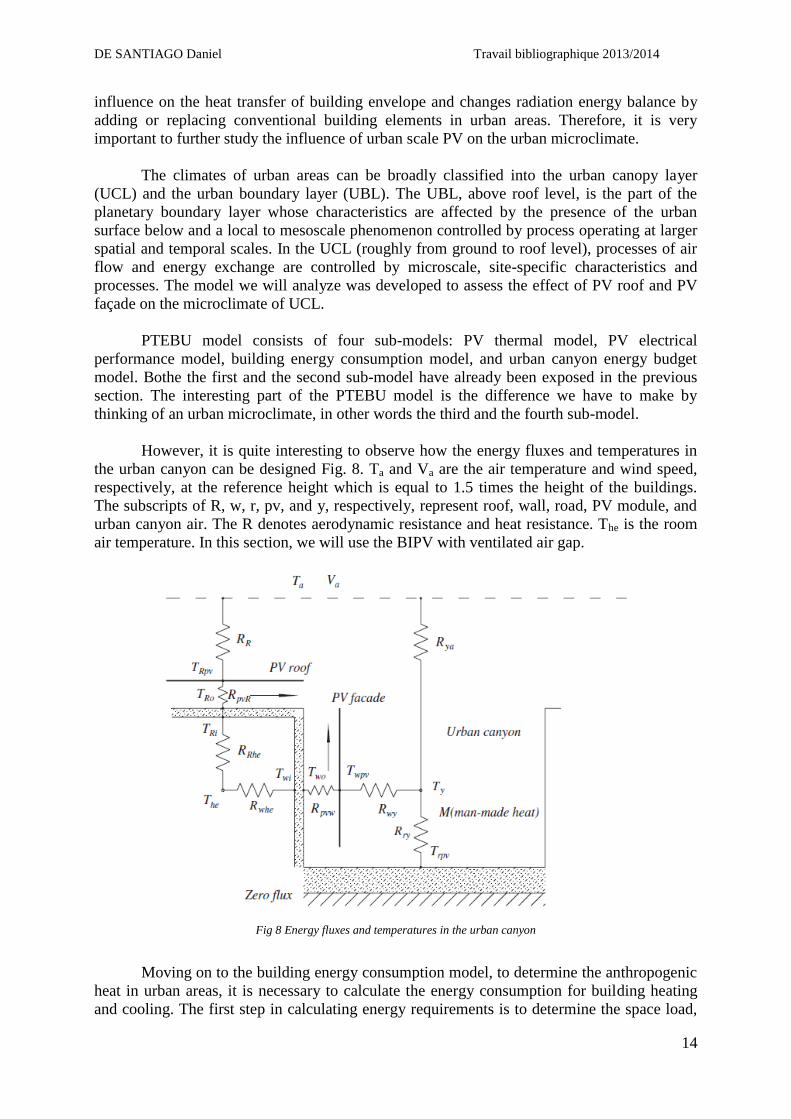
However, it is quite interesting to observe how the energy fluxes and temperatures in
the urban canyon can be designed Fig. 8. Ta and Va are the air temperature and wind speed,
respectively, at the reference height which is equal to 1.5 times the height of the buildings.
The subscripts of R, w, r, pv, and y, respectively, represent roof, wall, road, PV module, and
urban canyon air. The R denotes aerodynamic resistance and heat resistance. The is the room
air temperature. In this section, we will use the BIPV with ventilated air gap.
Fig 8 Energy fluxes and temperatures in the urban canyon
Moving on to the building energy consumption model, to determine the anthropogenic
heat in urban areas, it is necessary to calculate the energy consumption for building heating
and cooling. The first step in calculating energy requirements is to determine the space load,
DE SANTIAGO Daniel Travail bibliographique 2013/2014
15
which is the amount of energy that must be added to or extracted from a space to maintain
thermal comfort. The primary system model uses these loads to predict hourly rates of
electricity, gas and other energy inputs. It considers equipment efficiencies and part-load
characteristics.
The radiant time series method (RTSM) is a new method for performing cooling load
calculation, derived from the heat balance method. The RTS method is well suited for use in a
spreadsheet. The computational procedure is explained in (10). From now on, the term of
anthropogenic heat can be calculated which was the purpose of this sub-model.
The last sub-model to analyze is the urban canyon energy budget one. This model of
urban surface energy balance is classified into four basic approaches: (a) slab model; (b)
volumetric averaging models; (c) single layer models; (d) multi-layer model. The town energy
balance (TEB) developed by Masson is one of the urban single layer models that allow most
of the physical effects associated with the urban energy balance to be reproduced, including
longwave and shortwave radiative trapping, the momentum flux, the turbulent sensible and
latent heat fluxes, heat storage uptake and release, and water and snow interception.
TEB model is coupled to the three previous models that we already know to evaluate
the influence of PV module. Some modifications are made in order to better couple this model
with other sub-models. An explanation of this model is made in (10).
To finish with the study of the urban microclimate, it would be interesting to know the
different results which were obtained by launching the simulation. Therefore, we will talk
about the effect of the different efficiencies of PV on the UCL microclimate. That is a clear
relation that the article provides in order to see how the PV system can interact with the UCL
microclimate.
The PV conversion efficiencies used in the article were varied, from 0.05 to 0.5. The
efficiency of 0.05 is easily reached, while 0.5 is very difficult based on the present PV
technology.
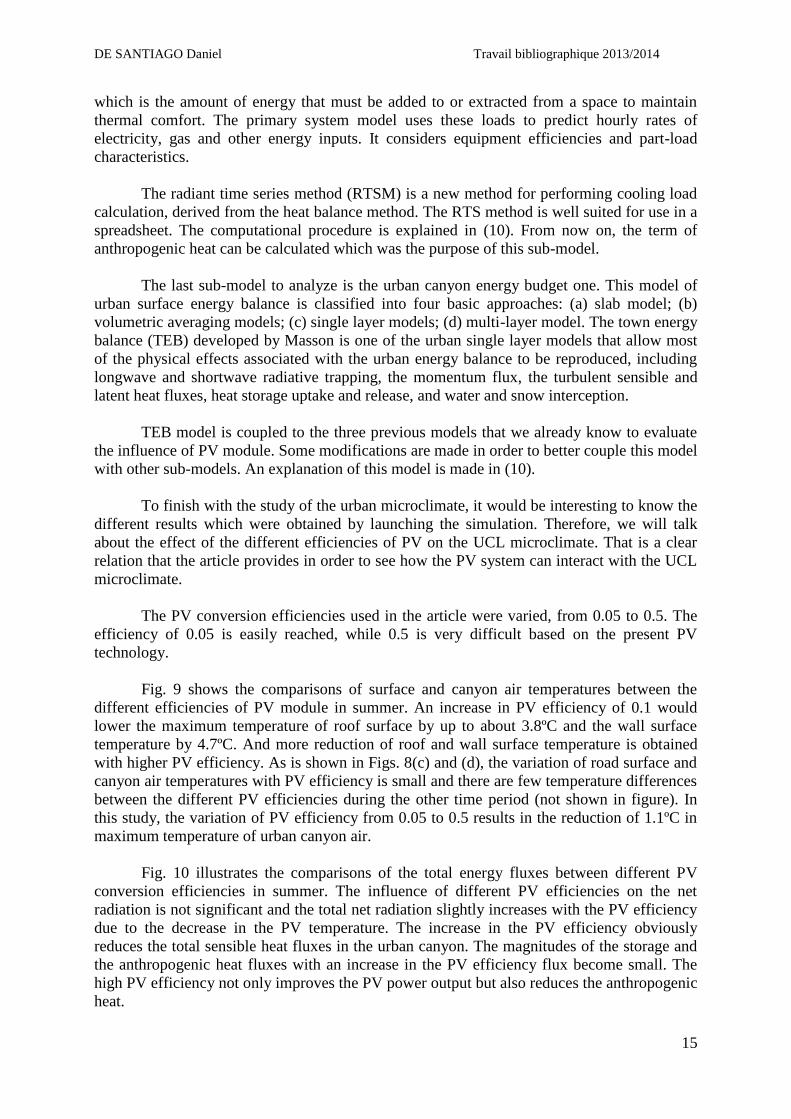
Fig. 9 shows the comparisons of surface and canyon air temperatures between the
different efficiencies of PV module in summer. An increase in PV efficiency of 0.1 would
lower the maximum temperature of roof surface by up to about 3.8ºC and the wall surface
temperature by 4.7ºC. And more reduction of roof and wall surface temperature is obtained
with higher PV efficiency. As is shown in Figs. 8(c) and (d), the variation of road surface and
canyon air temperatures with PV efficiency is small and there are few temperature differences
between the different PV efficiencies during the other time period (not shown in figure). In
this study, the variation of PV efficiency from 0.05 to 0.5 results in the reduction of 1.1ºC in
maximum temperature of urban canyon air.
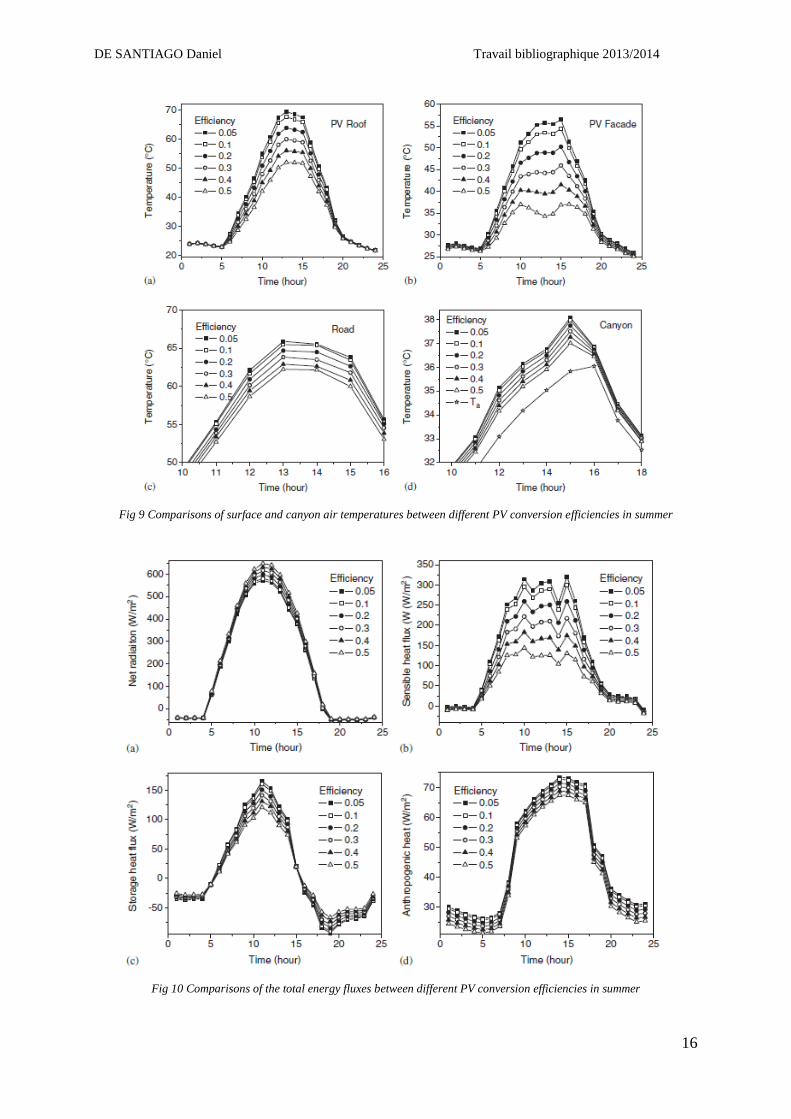
Fig. 10 illustrates the comparisons of the total energy fluxes between different PV
conversion efficiencies in summer. The influence of different PV efficiencies on the net
radiation is not significant and the total net radiation slightly increases with the PV efficiency
due to the decrease in the PV temperature. The increase in the PV efficiency obviously
reduces the total sensible heat fluxes in the urban canyon. The magnitudes of the storage and
the anthropogenic heat fluxes with an increase in the PV efficiency flux become small. The
high PV efficiency not only improves the PV power output but also reduces the anthropogenic
heat.
DE SANTIAGO Daniel Travail bibliographique 2013/2014
16
Fig 9 Comparisons of surface and canyon air temperatures between different PV conversion efficiencies in summer
Fig 10 Comparisons of the total energy fluxes between different PV conversion efficiencies in summer
DE SANTIAGO Daniel Travail bibliographique 2013/2014
17
5. Conclusion
An analysis of the current situation of the PV technology has been done along the
present paper, focusing on the utilization in buildings.
Firstly, we looked backwards to observe how the development of this technology had
been done. The first BIPV installation appeared in 1991 and nowadays the BIPV seems to be
a powerful source of energy for the future. Above all, thanks to the concept of Smart Grid, a
new concept which is becoming more and more important. It will allow connecting all
possible source of electric energy. That will mean that every single person will be able to
produce electric energy. That is the also new concept of distributed generation.
Afterwards, we looked into the different materials which are being used to conceive
the PV installations. Crystalline and amorphous silicon seem to be the most used options
nowadays. However, a new alternative has appeared, that is the organic photovoltaic. Perhaps,
it is still too soon to think of this option as the one which must be used in BIPV systems, but
this is a new path that we will be able to follow in not so many years.
Despite the fact that the main function of the PV cell is to transform sunlight into
electric energy, there is a growing interest in knowing how the mass flow and heat behaves
inside the PV cells. For this reason, a Swedish paper was chosen to observe how we could
analyze these parameters. After explaining the method we could use to analyze these
variables, we managed to write a couple of ideas that can allow us to minimize some
undesirable parameters in order to maximize performance. For instance, we learned that we
can improve performance by putting surfaces with higher emissivity factor.
In the last section, a study of several options of establishing a model was made. It is
quite common to convert a thermal system into an electric one in order to simplify problems,
because of this; we started this section by showing how we could do this conversion.
Afterwards, the method of the quadrupoles was treated; this is a method which can make us
save plenty of time by relating the entrance and the exit of a thermal system with just one
matrix.
To finish, we analyzed two Chinese ways of proceeding to calculate the different
parameters which play a role in this type of systems. On the one hand, thanks to the first one
we could compare four different possibilities of integrating a PV system in the roof. On the
other hand, as people tend to live more and more in urban areas, an analysis of how we can
proceed with this kind of problems was made.
DE SANTIAGO Daniel Travail bibliographique 2013/2014
18
6. Bibliography
1. Building-integrated PV modules. Benemann, J; Chehab, O and Schaar-Gabriel, E.
2001. Elsevier Ed. Pg: 345-354.
2. Saint Charles Solaire completes world''s largest BIPV system in Perpignan, France
Whitmore, C. 2011. PV-tech.org. Website: www.pv-tech.org/news/
3. Modelling of a photovoltaic heat recovery system and its role in a design decision support
tool for building professionals. D. Brazilian, M and Prasad, D. 2002. Elsevier Ed. Pg: 57-68
4. Applied Cyber Security and the Smart Grid. 2013. @CyberGridBook. Elsevier Ed.
Pg 1-15.
5. The future of organic photovoltaic solar cells as a direct power source for consumer
electronics. Lizin, S; Van Passel, S; De Schepper, E and Vranken, L. 2012, Elsevier Ed.
Pg: 1-10
6. PV for buildings. Re-focus. 2004. Elsevier Ed. Pg: 22-27
7. Flow and heat transfer in the air gap behind photovoltaic panels. Moshfegh, B and
Sandberg, M. 1998. Elsevier Ed. Pg: 287-301
8. Influence of a building's integrated-photovoltaiccs on heating and cooling loads. Wang, Y;
Tian, W; Ren, J; Zhu, L and Wang, Q. 2005. Elsevier Ed. Pg: 989-1003.
9. Maillet, D; André, S; Batsale, J.C; Degiovanni, A and Moyne, C. Thermal
Quadrupoles. 2000. Wiley Ed.
10. Effect of building integrated photovoltaics on microclimate of urban canopy layer. Tian,
W; Wang, Y; Xie, Y; Wu, D; Zhu, L and Ren, J. 2006. Elsevier Ed. Pg: 1891-1901.
11. Numerical evaluation of the mixed convective heat transfer in a double-pane winddow
integrated with see-through a-Si PV cells with low-e coatings. Han, J; Lu, L and Yang, H.
2010. Elsevier Ed. Pg: 3431-3437.