D6.1 EPLABEL WP6 final report.v2 - European Commission...sum of the net floor areas of all rooms...
51
E E P P L L a a b b e e l l WP6 Overcoming delivery barriers technical report Final version Document prepared by BBRI. Contribution from all EPLabel partners
Transcript of D6.1 EPLABEL WP6 final report.v2 - European Commission...sum of the net floor areas of all rooms...
EEPPLLaabbeell
WWPP66 OOvveerrccoommiinngg ddeelliivveerryy bbaarrrriieerrss
tteecchhnniiccaall rreeppoorrtt
FFiinnaall vveerrssiioonn
DDooccuummeenntt pprreeppaarreedd bbyy BBBBRRII..
CCoonnttrriibbuuttiioonn ffrroomm aallll EEPPLLaabbeell ppaarrttnneerrss
2/51 EPLABEL
ACKNOWLEDGMENTS
This document has been written in the framework of the SAVE EPLabel project.
This project is co-funded by the European Commission – DG TREN.
The Belgian participation to this project is supported by the Flemish Region, the Walloon Region, the Brussels-Capital Region and the Federal Public Service Economy, SME’s, Self-employed and Energy.
The sole responsibility of the content of this report lies with the authors. The European Commission and the Belgian authorities are not responsible for any use that may be made of the information contained therein.

WP6: Overcoming delivery barriers 3/51
TABLE OF CONTENTS
ACKNOWLEDGMENTS .................................................................................................................................... 2
TABLE OF CONTENTS...................................................................................................................................... 3
1 MAKING AREAS COLLECTION EASIER............................................................................................ 5 1.1 Definitions at EU level................................................................................................................................. 6 1.2 Definitions at national levels....................................................................................................................... 6
1.2.1 Definitions in Belgium.................................................................................................................... 6 1.2.2 Definitions in Denmark.................................................................................................................. 6 1.2.3 Definitions in Estonia ..................................................................................................................... 6 1.2.4 Definitions in France ...................................................................................................................... 6 1.2.5 Definitions in Germany.................................................................................................................. 6 1.2.6 Definitions in Greece ...................................................................................................................... 6 1.2.7 Definitions in Ireland ..................................................................................................................... 6 1.2.8 Definitions in Malta........................................................................................................................ 6 1.2.9 Definitions in The Netherlands...................................................................................................... 6 1.2.10 Definitions in Slovenia.................................................................................................................... 6 1.2.11 Definitions in Sweden ..................................................................................................................... 6 1.2.12 Definitions in UK ............................................................................................................................ 6 1.2.13 Comparison of terminologies......................................................................................................... 6
1.3 Technically, which area is the most adapted as indicator? ...................................................................... 6 1.4 Other indicators........................................................................................................................................... 6 1.5 Conclusions .................................................................................................................................................. 6 1.6 The EPLabel approach ............................................................................................................................... 6
2 MAKE NORMALISATION EASIER....................................................................................................... 6 2.1 Introduction ................................................................................................................................................. 6
2.1.1 Heating Degree-days (HDD) .......................................................................................................... 6 2.1.2 Cooling degree-days. ...................................................................................................................... 6 2.1.3 Energy signature method............................................................................................................... 6 2.1.4 Climate Severity Index (CSI)......................................................................................................... 6
2.2 Definition of degree-days at EU level......................................................................................................... 6 2.3 Definitions of degree-days at national levels ............................................................................................. 6
2.3.1 Definition in Belgium ..................................................................................................................... 6 2.3.2 Definition in France........................................................................................................................ 6 2.3.3 Definition in Finland ...................................................................................................................... 6 2.3.4 Definitions in Greece ...................................................................................................................... 6 2.3.5 Definitions in Ireland ..................................................................................................................... 6 2.3.6 Definitions in Norway..................................................................................................................... 6 2.3.7 Definitions in Germany.................................................................................................................. 6 2.3.8 Definition in Sweden....................................................................................................................... 6 2.3.9 Definitions in The Netherlands...................................................................................................... 6
4/51 EPLABEL
2.3.10 Definitions in UK ............................................................................................................................ 6 2.4 Share of heating in total energy use ........................................................................................................... 6 2.5 Conclusions .................................................................................................................................................. 6 2.6 The EPLabel approach ............................................................................................................................... 6
3 MAKING DATA COLLECTION EASIER.............................................................................................. 6 3.1 Need for submetering .................................................................................................................................. 6 3.2 State of the art with sub-metering.............................................................................................................. 6 3.3 Gas ................................................................................................................................................................ 6
3.3.1 Distribution networks .................................................................................................................... 6 3.3.2 Meters .............................................................................................................................................. 6 3.3.3 Installing meters ............................................................................................................................. 6 3.3.4 Costs................................................................................................................................................. 6
3.4 Oil metering ................................................................................................................................................. 6 3.5 Heat metering .............................................................................................................................................. 6 3.6 Electricity metering ..................................................................................................................................... 6
4 LANDLORD/TENANT ISSUE .................................................................................................................. 6 4.1 Problem description .................................................................................................................................... 6 4.2 Possible solutions ......................................................................................................................................... 6
4.2.1 Option 1: Certifying energy use in the building as a whole. ....................................................... 6 4.2.2 Option 2: Certifying energy use by landlords and tenants separately....................................... 6 4.2.3 Option 3: Certifying the tenanted spaces, including the appropriate landlord’s energy. ........ 6
4.3 Landlord's statement and services ............................................................................................................. 6 4.4 Conclusions .................................................................................................................................................. 6
5 ANNEX 1: OTHER DEFINITIONS OF AREA ....................................................................................... 6 5.1 Definitions of useful floor area of dwellings .............................................................................................. 6 5.2 Definitions from IFMA ............................................................................................................................... 6
6 REFERENCES ............................................................................................................................................ 6

WP6: Overcoming delivery barriers 5/51
1 INTRODUCTION
This report gives a summary of some of the aspects that have been analysed within WP6 and integrated into the EPLabel methodology and therefore into the EPLabel tools.
The report focus on the following point: • definition of area, • weather and climate correction, • submetering, • landlor/tenant issue.
Another report, about certificate layout, has also been produced by WP6.
Inevitably, EPLabel has not been able to finalise every technical detail of an Operational Rating system - but that was not EPLabel's role. EPLabel has shown how to proceed and which factors need to be defined/quantified in a detailed methodology, and has provided a demonstration system using the best values the Partners could find.

6/51 EPLABEL
2 MAKING AREAS COLLECTION EASIER
In order to compare the performances of various buildings, the energy rating is usually divided by a value that is supposed to represent the building with accuracy. This is very often the floor area, but it could be the building volume, the heat loss area, the number of beds in hospitals, the number of bedrooms in hotels, the number of pupils in schools…
In this chapter, we will focus on the definition that should be used in case the floor area is selected as representative value for the building.
2.1 DEFINITIONS AT EU LEVEL
The EPBD is using the term "useful floor area" (art. 4.3, art. 5, art. 6, art. 7.3, art. 11).
However, this term is not defined in the directive.
Article 7 - Energy performance certificate
3. Member States shall take measures to ensure that for buildings with a total useful floor area over 1000 m² occupied by public authorities and by institutions providing public services to a large number of persons and therefore frequently visited by these persons an energy certificate, not older than 10 years, is placed in a prominent place clearly visible to the public. (…)
prEN 152171 defines the terms "conditioned area", "internal dimension", "overall internal dimension" and "external dimension" (§ 3.15, § 3.17, § 3.18, § 3.19) as:
Conditioned area: floor area of heated or cooled spaces excluding non-habitable cellars, including the floor area on all storeys if more than one.
NOTE 1 The standard permits the use of internal, overall internal or external dimensions. This leads to different areas for the same building.
NOTE 2 This area can be taken as the useful area mentioned in the EPBD Articles 5, 6 and 7 unless this is otherwise defined in National Regulations.
Internal dimension: length measured from wall to wall and floor to ceiling inside each room of a building
Overall internal dimension: length measured on the interior of a building, ignoring internal partitions
External dimension: length measured on the exterior of a building
1 prEN 15217 - Energy performance of buildings - Methods for expressing energy performance and for energy certification of buildings (March 2005)
WP6: Overcoming delivery barriers 7/51
2.2 DEFINITIONS AT NATIONAL LEVELS
2.2.1 Definitions in Belgium
The Flemish Region of Belgium will use Operational Rating for the certification of public buildings. The intention of the two other Regions is not yet known (situation in June, 2006). .
In Belgium, the standard NBN B 06-002 describes the definitions and calculations of areas in Buildings. However, it is not evident that these definitions are used by building managers! The BOMA Standard Method for Measuring Floor Area in Office Buildings is known to be applied by real estate companies.
Gross external floor area (* – surface brute de plancher – bruto-vloeroppervlakte): measured to the exterior of walls, excluding stand-alone columns and similar elements with an area ≤ 0.5 m², openings with an area > 4 m², external emergency staircases…
Construction area (* – surface de construction – constructie-oppervlakte): surface of walls, columns, shafts,… including recesses ≤ 0.5 m².
Net floor area (* – surface nette de plancher – netto-vloeroppervlakte): difference between gross external floor area and construction area.
Useful area (surface utile): net floor area, less the area for the installations and the area for circulation.
Occupation area (** – zone d'occupation – verblijfsgebied): in the K2000 study, the occupation area was conventionally defined as the sum of the net floor area of the rooms having the following functions: auditorium, conference room, class room, library, office, kitchen, copying room, restaurant, meeting room, museum, prison, first aid post, dark room, showroom, fitness,… This is not an exhaustive; it only includes types of rooms that were present in the analysed buildings.
Treated area (** – surface conditionnée – geconditioneerde vloeroppervlakte): in the K2000 study, two definitions were used. Firstly, the treated area was conventionally defined as the sum of the net floor areas of all rooms with exception of the garages. Secondly, correction factors were applied to the net floor areas, depending on the function of the rooms (for instance: storage space 0.5, rest rooms 0.8…) and the height of the rooms.
* NBN B 06-002:1983 Areas and volumes of buildings – Definitions and calculation.
** Those two definitions were used in the K2000 study, but are not common in Belgium.
Remarks:
• The Flemish study "Kantoor 2000" has analysed various aspects of 87 office buildings (public as private). The different areas were analysed in ± 55 buildings, as shown in Figure 1. This figure gives the ratio between the different areas and the gross external floor area. From the figure, it appears that the dispersion is very important (even without taking into account the error on the measurements themselves).

8/51 EPLABEL
0% 10% 20% 30% 40% 50% 60% 70% 80% 90% 100%
(offi
ces)
(who
lebu
ildin
g)(o
ffice
s)(o
ffice
s)(o
ffice
s)
Gro
ssex
tern
alflo
or a
rea
Net
floo
rar
eaTr
eate
dflo
or a
rea
Occ
upat
ion
zone
Net
floo
rar
ea
Figure 1: Ratio of different areas compared to gross external floor areas based on data from the K2000 study - analysis in ± 55 office buildings
the block indicates the median value, the line the minimum and maximum values "(offices)" means the part of the building that has an office function (excluding e.g. shops)
• In the Region of Brussels-Capital, there is a tax applicable to non residential building, based on their gross external floor area (the definition of the surface on which the tax is applicable does not refer to the Belgian standard, but is comparable to gross external floor area). This area could be used to calculate the energy indicator, as it is supposed to be verified to some extend by the tax administration. However, many public buildings does not necessary calculate the gross external area according to that definition, as the tax is not applicable to schools/universities, churches, hospitals and similar, cultural activities, sports, homes, kindergarten and parliaments and similar.
• The Federal authorities have set up a sustainable development plan for its different administrations. This plan included to report the energy consumptions of buildings; the reference surface definition was the gross external floor area (of the zone occupied by a Federal authority).
• The Flemish Region intends to use a new definition of area, for the specific purpose of the energy certification. This area is currently named useful floor area (bruikbare vloeroppervlakte), as in EPBD, but should preferably be named building gross external floor area.
The useful floor area is defined as the sum of all gross external floor area of all floors inside the protected volume of the building.
The gross external floor area must be calculated according to NBN B 06-002. The protected volume, as defined in NBN B 62-301, is the volume of all rooms and spaces of the building that are thermally protected against heat losses to outdoor, to the ground and to adjacent spaces not included in the protected volume. It includes all rooms and spaces that are directly or indirectly heated.
WP6: Overcoming delivery barriers 9/51
Consequently, the offices, sports en cultural spaces, classrooms, halls, toilets en technical rooms which are on the same level of previously mentioned spaces, … are typically included in the protected volume.
The standard let some interpretation for cellars en basements, attics, parking en levels consisting to a large extend of HVAC or technical installations,… of existing buildings. Therefore, the following specifications are introduced.
• If 70% or more of a building level is directly heated (heating or cooling devices are present in the rooms), then the entire level is considered as being part of the protected volume.
• If 30% or less of a building level is directly heated, then the entire level is considered as not being part of the protected volume.
• If between 30% and 70% of a building level is directly heated, then only the (gross external) floor area of the directly heated part of the building level is added to the building useful floor area.
• If according to these specifications an area can not be counted in the building useful floor area, but if it can be shown and motivated that, in conformity with NBN B 06-301, this area can nevertheless be considered as being part of the protected volume, then the area can be included in the building useful floor area.
• It must be noticed that the energy certificate of new residential buildings, of new non-residential buildings and of public buildings will all have an energy performance index expressed in kWh/m², but the reference surface will be different in each case. For residential buildings, it will be the gross external protected volume divided by 2.9. For non-residential buildings, it will be the sum of the internal area of each space (defined in order to determine the ventilation requirements) inside the protected volume. For public buildings, it will be defined as gross external floor area (see hereabove).
2.2.2 Definitions in Denmark
Denmark does not intend to use Operational Rating for the certification of public buildings, (and does not make a distinction between public and private buildings) (situation in June, 2006).
The following definitions apply in Denmark.
Gross floor area: measured to the exterior of walls including area in use in attic, but excluding cellar. Adjoining rooms (e.g. shed, outhouse, ventilation room, balcony, terrace, etc.) are not included.
Heated floor area: area measured to the exterior of walls including heated attic, ½ of (unheated) cellar and access areas e.g. stairs and lifts. The total area of heated cellars is included.
10/51 EPLABEL
2.2.3 Definitions in Estonia
Estonia intends to use Operational Rating for the certification of all buildings types (situation in June, 2006).
Regarding the use of energy indicators kWh/m2 and kWh/m3, the preliminary decision is that kWh/m2 will be used for residential buildings and kWh/m3 will be used for public and industrial buildings.
2.2.4 Definitions in Finland
Finland considers using Operational Rating for the certification of public buildings (situation in May 2006).
The surface area taken into account is defined as the gross floor area.
2.2.5 Definitions in France
France will use Operational Rating for the certification of all building types (situation in June,
2006).
Building managers in France use 4 different definitions for surface:
Gross external floor area (Surface hors œuvre brute, SHOB)2: measured to the exterior of walls, including the balconies, terraces, roof-terraces, mezzanines, excluding stairway and lift cavities.
Net Internal Area (Surface hors œuvre net, SHON): SHOB less attic or parts of attic lower than 1.8 m, cellar lower than 1.8 m, cellar without openings to outside, garages, balconies and terraces.
Useful surface (Surface utile): SHON less structural elements and technical premises.
Heated surface (Surface chauffée)
Habitable surface (surface habitable)
Surface Assurance: it is an administrative value that the insurance company use to insure a building
Remark:
• Building energy managers have sometime good reference surface but usually they are not updated (new construction or additional premises have not be included in the initial plan)
• SHOB and SHON are defined in the Urbanism Code, Article R 112-2.
2 http://www.libel.fr/doc/SHON-SHOB/shob.html, http://www.libel.fr/doc/SHON-SHOB/shon.html

WP6: Overcoming delivery barriers 11/51
Residential Non residential, including public
New SHON SHON
Existing Habitable surface Useful surface
Table 1: Surface definition used for the
2.2.6 Definitions in Germany
Germany intends to use Operational Rating for the certification of "simple" buildings (situation in January, 2006).
The following definitions apply in Germany.
Gross Floor Area (GFA – BGF in German): this area includes external walls and all not heated areas like car parking, cellars ect.
Net Floor Area (NFA – NGF in German): this area is the GFA, less the "construction area".
Construction area (KGF in German): area of internal and external walls, including chimneys, etc
"Use" area (NF in German): NGF minus corridors and functional areas (technical area)
Main use area (HNF in German): NF minus kitchens, toilets etc.

12/51 EPLABEL
Figure 2: Definition of areas, according to German standard DIN 227

WP6: Overcoming delivery barriers 13/51
14/51 EPLABEL
2.2.7 Definitions in Greece
Greece intends to use Operational Rating for the certification of public buildings (situation in January, 2006).
The following definitions apply in Greece.
The floor area in m2 including the surface of external walls, as well as storage, circulation, stairs, lifts, toilets and other common use areas and non heated areas, but excluding atria. Normally referred to as floor area, total floor area or gross floor area.
The net floor area is the same metric as above normally excluding external but including internal walls.
2.2.8 Definitions in Ireland
Ireland considers using Operational Rating for the certification of public buildings (situation in January, 2006).
The definition that apply in Ireland are the same than those in U.K. (see § 2.2.13 for definitions)
In the Irish Building Regulations – Part L, dimensions are described as follows:
‘Linear measurements for the calculation of wall, roof and floor areas and building volumes should be taken between the finished internal faces of the appropriate external building elements and, in the case of roofs, in the plane of the insulation’.
This would correspond to Gross Internal Area (GIA), and would be the most commonly used term for all the building types.
There are not actual benchmarks or standards in Ireland referring to other floor areas. However, the predominant parameter used by landlords, letting agents, tenants etc, for commercial properties is Net Internal Area (NIA), also known as Net Lettable Area (NLA), so that would be an appropriate term to consider in future benchmarks for public administration buildings.
The concept of Treated Floor Area (TFA), although well understood by engineers and energy consultants, is little known or used in the property world.
The definition of Gross External Area (GAE) is not commonly used.
Extract of draft guidance on the Dwellings Energy Assessment Procedure (DEAP) for energy rating of residential buildings is given below.
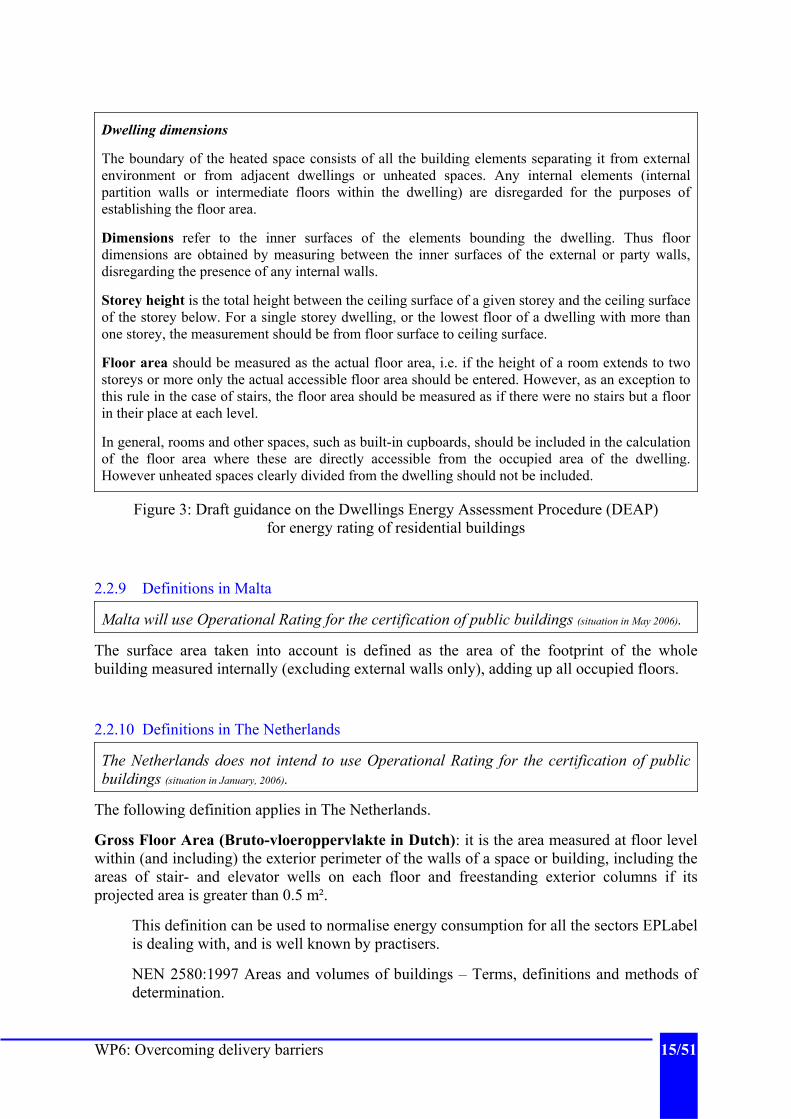
WP6: Overcoming delivery barriers 15/51
Dwelling dimensions
The boundary of the heated space consists of all the building elements separating it from external environment or from adjacent dwellings or unheated spaces. Any internal elements (internal partition walls or intermediate floors within the dwelling) are disregarded for the purposes of establishing the floor area.
Dimensions refer to the inner surfaces of the elements bounding the dwelling. Thus floor dimensions are obtained by measuring between the inner surfaces of the external or party walls, disregarding the presence of any internal walls.
Storey height is the total height between the ceiling surface of a given storey and the ceiling surface of the storey below. For a single storey dwelling, or the lowest floor of a dwelling with more than one storey, the measurement should be from floor surface to ceiling surface.
Floor area should be measured as the actual floor area, i.e. if the height of a room extends to two storeys or more only the actual accessible floor area should be entered. However, as an exception to this rule in the case of stairs, the floor area should be measured as if there were no stairs but a floor in their place at each level.
In general, rooms and other spaces, such as built-in cupboards, should be included in the calculation of the floor area where these are directly accessible from the occupied area of the dwelling. However unheated spaces clearly divided from the dwelling should not be included.
Figure 3: Draft guidance on the Dwellings Energy Assessment Procedure (DEAP) for energy rating of residential buildings
2.2.9 Definitions in Malta
Malta will use Operational Rating for the certification of public buildings (situation in May 2006).
The surface area taken into account is defined as the area of the footprint of the whole building measured internally (excluding external walls only), adding up all occupied floors.
2.2.10 Definitions in The Netherlands
The Netherlands does not intend to use Operational Rating for the certification of public buildings (situation in January, 2006).
The following definition applies in The Netherlands.
Gross Floor Area (Bruto-vloeroppervlakte in Dutch): it is the area measured at floor level within (and including) the exterior perimeter of the walls of a space or building, including the areas of stair- and elevator wells on each floor and freestanding exterior columns if its projected area is greater than 0.5 m².
This definition can be used to normalise energy consumption for all the sectors EPLabel is dealing with, and is well known by practisers.
NEN 2580:1997 Areas and volumes of buildings – Terms, definitions and methods of determination.

16/51 EPLABEL
2.2.11 Definitions in Slovenia
Slovenia considers using Operational Rating for the certification of public buildings (situation
in May 2006).
In Slovenia, requirements will be expressed in kWh/m³ for all types of buildings (residential and non-residential), where the volume is the net heated volume of the building, according to standard ISO 9836, paragraph 5.2.5.
Energy efficiency will also be expressed in kWh/m², but only as an indicator and not as a requirement. The surface area taken into account is defined the net heated floor area, as defined in ISO 9836, paragraph 5.1.5.
2.2.12 Definitions in Sweden
Sweden considers using Operational Rating for the certification of public buildings (situation in
May 2006).
The surface area taken into account is defined as the floor area heated to more than 10°C.
2.2.13 Definitions in UK
England and Wales will use Operational Rating for the certification of public buildings. (law
published 29 March 2007). Scotland does not intend to use Operational Rating for the certification of public buildings. The intention of the other Region (Northern Ireland) is not yet known.
The following definitions apply in UK3.
Gross Internal Area (GIA): the area of a building measured to the internal face of the perimeter wall at each floor level. It includes areas occupied by internal walls and partitions, columns, piers and other internal projections, internal balconies, stairwells, toilets, lift lobbies, fire corridors, atria measured at base level only, and covered plant rooms. It excludes the perimeter wall thickness and external projections, external balconies and external fire escapes.
Gross External Area (GEA): the area of a building measured to the external face of the perimeter wall at each floor level. This definition is however not commonly used in UK.
Gross floor area (GFA) is usually a synonym for GIA.
Net Internal Area (NIA), also known as Net Lettable Area (NLA): the usable area within a building measured to the internal face of the perimeter walls at each floor level. It includes kitchens and cleaners cupboards. (Atria and entrance halls should be measured separately.) It excludes toilets, stairwells, plant rooms, fire corridors, and internal structural walls, columns, internal projections and vertical ducts.
Net Usable Area: it is the NLA less primary circulation routes (the main routes people use to walk around the building, including fire escape routes).
3 Note: the definitions of GIA and NIA are summaries prepared by the British Council for Offices from the RICS Code of Measuring Practice, Fourth Edition, RICS Books, ISBN 0 85406 610 1

WP6: Overcoming delivery barriers 17/51
Treated Floor Area (TFA): it is the GIA less plant rooms and other areas (e.g. stores, covered car parking, loading bays and roof spaces) not directly heated or air-conditioned.
GIA is used by designers and hence many clients. NLA is used by landlords and hence tenants who usually pay for NLA. It is also the area used to value commercial property for taxes like rates. However, as in the Brussels Capital Region, many public buildings are not subject to such taxes and hence their area is not measured for this purpose. TFA is only used for energy benchmarking purposes, which means it is not a commonly known figure.
The definitions used in available benchmarking for the different sectors are: - Schools: GIA and TFA - Universities: GFA as defined in ENCON 54 (=GIA) - Public administration : NIA and TFA - Hotels: GIA - Sport facilities: GIA - Hospitals: cubic metres of heated volume (m³) !
2.2.14 Comparison of terminologies
The following terms are to some extend similar in different countries:
• Gross External Area GEA (UK) ≈ Gross external floor area/surface brute de plancher/bruto-vloeroppervlakte (BE) ≈ Gross floor area (DK) ≈ Gross external floor area/Surface hors œuvre brute/SHOB (FR) ≈ Gross floor area GFA/BGF (GE) ≈ Gross floor area/bruto-vloeroppervlakte (NL) [Stairwells are NOT included in the French SHOB, but are included in the British GEA.] [Garages are NOT included in the German BGF, but are included in the British GEA.]
• Gross Internal Area GIA/Gross Floor Area GFA (UK) ≈ Net floor area/surface nette de plancher/netto-vloeroppervlakte (BE) ≈ Net floor are NFA/NGF (GE)
• Net Usable Area (UK) ≈ Useful area/surface utile (BE) ≈ "Use" area/NF (GE)
• Net Internal Area NIA/Net Lettable Area NLA (UK) ≈ Useful surface/surface utile (FR)
• Treated Floor Area (UK) ≈ Treated Area (BE) ≈ Heated surface/surface chauffée (FR) [Heated surface (DK) includes external walls]

18/51 EPLABEL
2.3 TECHNICALLY, WHICH AREA IS THE MOST ADAPTED AS INDICATOR?
The surface that was the most adapted to be used to calculate the energy indicator should have the following characteristics.
- It should be linked as much as possible with the energy consumed; for instance, it should be preferable not to include large (unconditioned) parkings in the surface, as there not much energy consumed in that area,
- It should be easy to calculate; there should be no room for interpretation of the definition for specific rooms or space of the buildings,
- It should be already known by building manager and energy expert,
- If an EU harmonisation is wished, it should be comparable to definitions used in other MS.
Table 2 shows these characteristics for five surface definitions.
GEA GIA NUA NIA TFA
Linked with consumption -- -- +
Easy to calculate ++ +
Already known? Depends on national situation
Harmonised? + + - - --
Table 2: Characteristics of five different surface definitions
The gross external floor area GEA is probably the easiest area to calculate, as there is no (or little) discussion possible on the definition. It must be noticed that even the definition of the GEA differs from country to country (as e.g. stairwells, balconies, even car parks). But this area may include large part of building that does not use energy very intensively, as for instance parking or storage rooms, and is therefore not well linked to the building energy consumption. GEA will be used in BE and NL.
The gross internal floor area GIA (or gross floor area GFA) is very similar to the GEA. Using GIA would influence the energy index, but should not strongly change comparison of a particular building with the benchmark. As GIA still includes car parks, the link with the energy consumption is not much better than in case of GEA.
The treated floor area TFA is better linked to the energy consumption, but is much more to change within the time life of a building. A harmonised definition at EU level is not to be expected.
Net Usable Area NUA and Net Internal Area NIA are in-between situations.
WP6: Overcoming delivery barriers 19/51
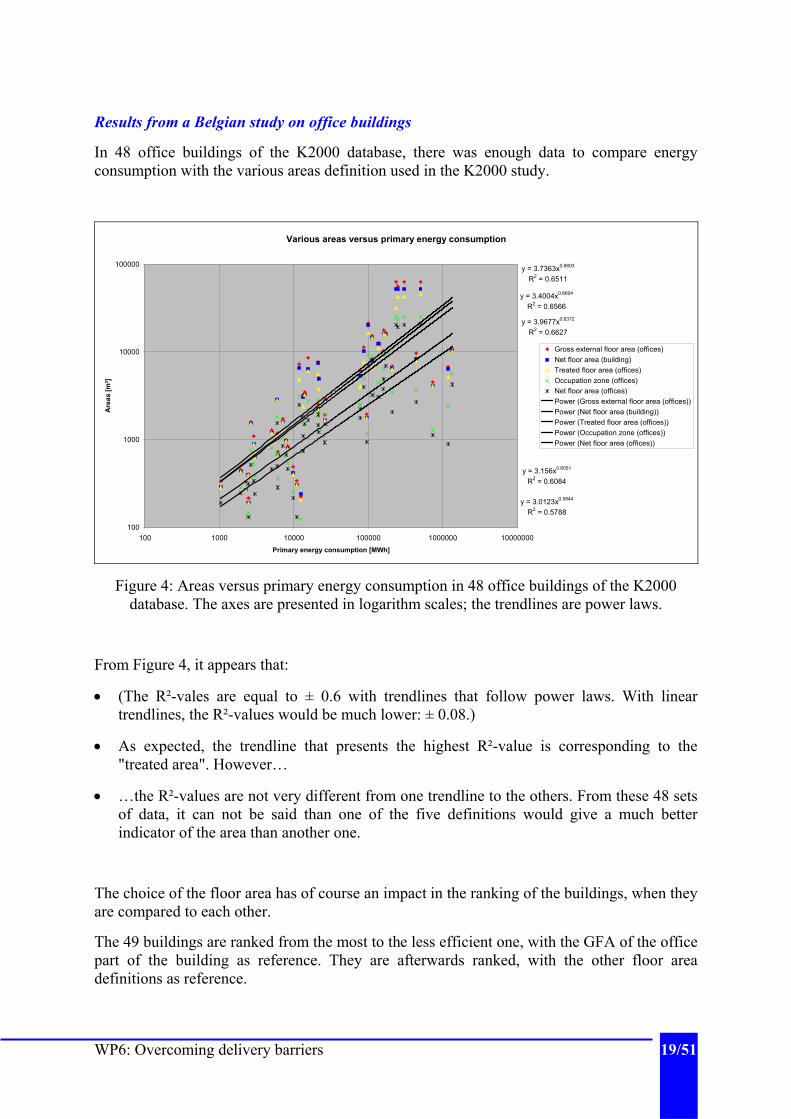
Results from a Belgian study on office buildings
In 48 office buildings of the K2000 database, there was enough data to compare energy consumption with the various areas definition used in the K2000 study.
Various areas versus primary energy consumption
y = 3.7363x0.6603
R2 = 0.6511
y = 3.4004x0.6604
R2 = 0.6566
y = 3.9677x0.6372
R2 = 0.6627
y = 3.156x0.6051
R2 = 0.6084
y = 3.0123x0.5844
R2 = 0.5788
100
1000
10000
100000
100 1000 10000 100000 1000000 10000000Primary energy consumption [MWh]
Are
as [m
²]
Gross external floor area (offices)Net floor area (building)Treated floor area (offices)Occupation zone (offices)Net floor area (offices)Power (Gross external floor area (offices))Power (Net floor area (building))Power (Treated floor area (offices))Power (Occupation zone (offices))Power (Net floor area (offices))
Figure 4: Areas versus primary energy consumption in 48 office buildings of the K2000 database. The axes are presented in logarithm scales; the trendlines are power laws.
From Figure 4, it appears that:
• (The R²-vales are equal to ± 0.6 with trendlines that follow power laws. With linear trendlines, the R²-values would be much lower: ± 0.08.)
• As expected, the trendline that presents the highest R²-value is corresponding to the "treated area". However…
• …the R²-values are not very different from one trendline to the others. From these 48 sets of data, it can not be said than one of the five definitions would give a much better indicator of the area than another one.
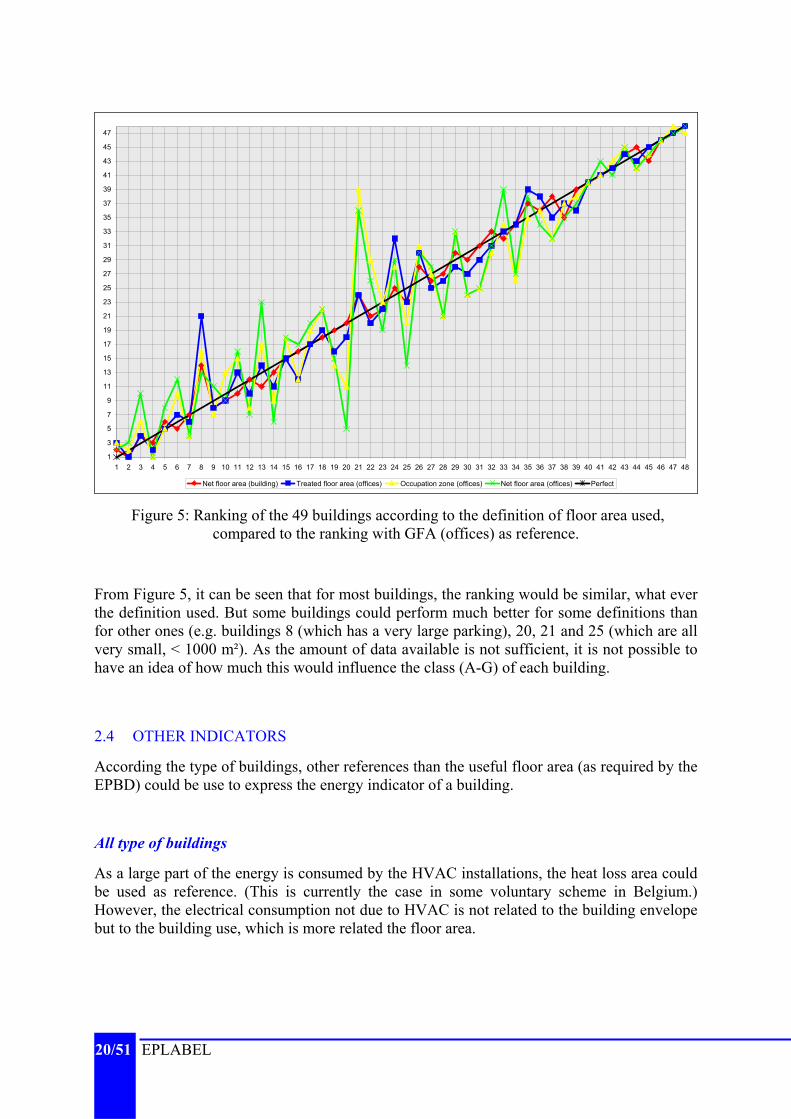
The choice of the floor area has of course an impact in the ranking of the buildings, when they are compared to each other.
The 49 buildings are ranked from the most to the less efficient one, with the GFA of the office part of the building as reference. They are afterwards ranked, with the other floor area definitions as reference.
20/51 EPLABEL
1
3
5
7
9
11
13
15
17
19
21
23
25
27
29
31
33
35
37
39
41
43
45
47
1 2 3 4 5 6 7 8 9 10 11 12 13 14 15 16 17 18 19 20 21 22 23 24 25 26 27 28 29 30 31 32 33 34 35 36 37 38 39 40 41 42 43 44 45 46 47 48
Net floor area (building) Treated floor area (offices) Occupation zone (offices) Net floor area (offices) Perfect
Figure 5: Ranking of the 49 buildings according to the definition of floor area used, compared to the ranking with GFA (offices) as reference.
From Figure 5, it can be seen that for most buildings, the ranking would be similar, what ever the definition used. But some buildings could perform much better for some definitions than for other ones (e.g. buildings 8 (which has a very large parking), 20, 21 and 25 (which are all very small, < 1000 m²). As the amount of data available is not sufficient, it is not possible to have an idea of how much this would influence the class (A-G) of each building.
2.4 OTHER INDICATORS
According the type of buildings, other references than the useful floor area (as required by the EPBD) could be use to express the energy indicator of a building.
All type of buildings
As a large part of the energy is consumed by the HVAC installations, the heat loss area could be used as reference. (This is currently the case in some voluntary scheme in Belgium.) However, the electrical consumption not due to HVAC is not related to the building envelope but to the building use, which is more related the floor area.
WP6: Overcoming delivery barriers 21/51
Office buildings/administration buildings
The number of (equivalent full time) employees could be used for office buildings. As this number can vary during the year, an average value for the period considered should be used.
For some public buildings, as e.g. town halls, a number of employees has less signification as large part of the buildings are dedicated to the public (e.g. desks, reception rooms, theatres…).
Hospitals and similar
Hospitals are often characterised by their number of beds. This number is less and less representative of the energy consumption, as the duration of the stay in the hospitals is reduced for a larger number of medical acts. Consequently, more medical acts are carried out with fewer beds.
Schools, universities
Schools and universities can be characterised by their number of pupils and students. However, the energy consumption in schools is mainly used to maintain a comfortable indoor comfort, independently of the number of pupils. This is for a large part also the case for universities, excepted for laboratories.
Swimming pools
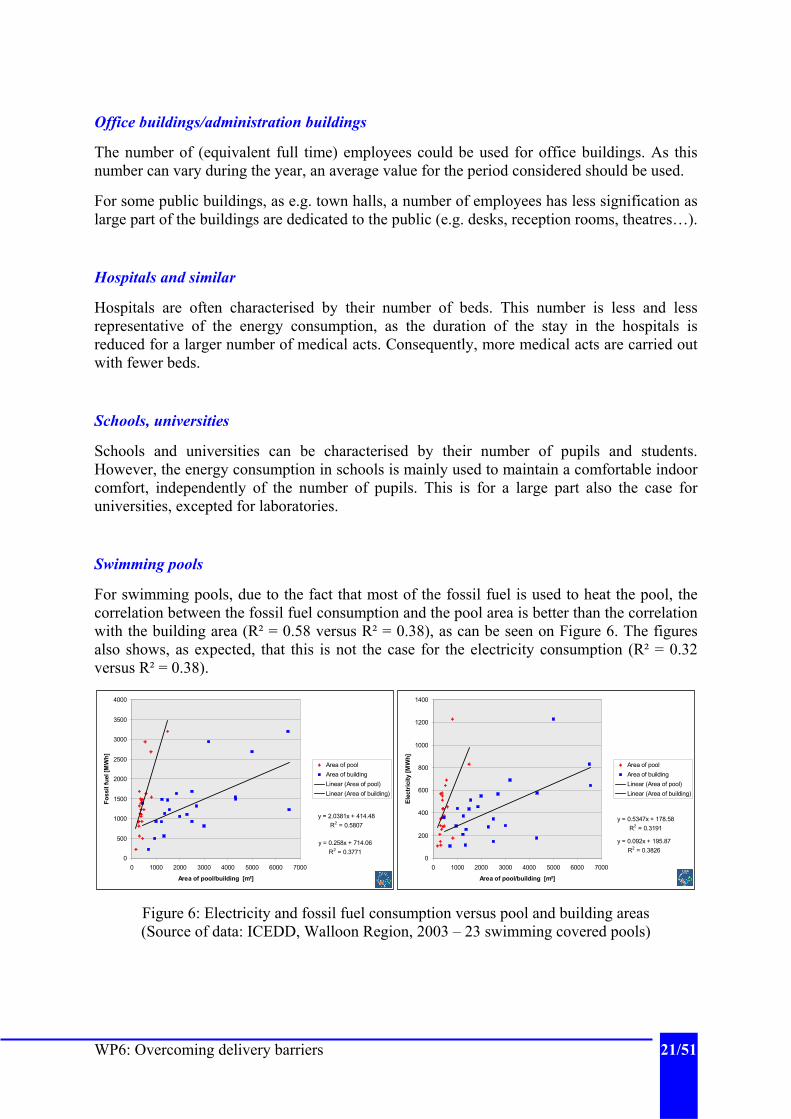
For swimming pools, due to the fact that most of the fossil fuel is used to heat the pool, the correlation between the fossil fuel consumption and the pool area is better than the correlation with the building area (R² = 0.58 versus R² = 0.38), as can be seen on Figure 6. The figures also shows, as expected, that this is not the case for the electricity consumption (R² = 0.32 versus R² = 0.38).
y = 2.0381x + 414.48R2 = 0.5807
y = 0.258x + 714.06R2 = 0.3771
0
500
1000
1500
2000
2500
3000
3500
4000
0 1000 2000 3000 4000 5000 6000 7000
Area of pool/building [m²]
Foss
il fu
el [M
Wh]
Area of poolArea of buildingLinear (Area of pool)Linear (Area of building)
y = 0.5347x + 178.58R2 = 0.3191
y = 0.092x + 195.87R2 = 0.3826
0
200
400
600
800
1000
1200
1400
0 1000 2000 3000 4000 5000 6000 7000
Area of pool/building [m²]
Elec
tric
ity [M
Wh]
Area of poolArea of buildingLinear (Area of pool)Linear (Area of building)
Figure 6: Electricity and fossil fuel consumption versus pool and building areas (Source of data: ICEDD, Walloon Region, 2003 – 23 swimming covered pools)

22/51 EPLABEL
2.5 CONCLUSIONS
1. First of all, it can be seen that there is not much standardisation on the definitions of areas across EU. Even areas that have a similar name can cover different areas of a building. This might be a source of confusion when comparing buildings from one country to the other. It also complicates the setting up of the benchmarks (as it makes more difficult to use data from one country to fill missing data in another country).
However, this should not be a major issue, because the building certification process is national. Furthermore, comparing the energy consumption of buildings located in countries that have very different climatic conditions does not make much sense, as the construction schemes are country-(and therefore climate-)dependant.
2. As data have shown that the energy consumption is not very well linked to any area definition, the choice of the reference can be made on basis of other considerations.
3. Once the choice of the reference is made, building manager or energy experts should have to calculate it according to that definition. As available data have shown that the ratio from one surface to the other one (e.g. GIA/GEA) may vary considerably from one building to the other, it seems not acceptable in a mandatory scheme to use default values to move from one surface type to the other, excepted if these default values are chosen on a very conservative way.
However, this is a political choice. Do the MS think that making compulsory to measured the building area once according to a precise definition is acceptable by the "market" or not? It must be considered that calculating a surface once in the life time of the building (as long as there is no change) is much less time consuming than … going to a full asset rating.
Another difficulty is that most of the available studies and data are from office buildings, which have received most of the attention up to now. It is difficult to extrapolate these ratios from office buildings to other type of buildings.
4. Even perfectly defined in a national standard, there is no certainty that the surface is well measured or calculated by the building owner. This is potentially a very large source of error in an operational rating scheme.
Collecting the actual area of a building is necessary in order to have a relevant operational rating, but this task might be more difficult that it could appear. One of the reasons is that up to date detailed plans may not be available for existing buildings. Another reason is that, as there is no control by the authorities on this, the building manager will not spent a lot of time to calculate it.
For those reasons, we believe that the area chosen as reference should have the following characteristics:
• It should be easy to calculate, and should not required interpretation of a complex definition.
• If available, it should be an area that is already available for other purpose (as e.g. building permit or tax purposes).
• It should be an area that the building manager is already used to calculated, if any.
WP6: Overcoming delivery barriers 23/51
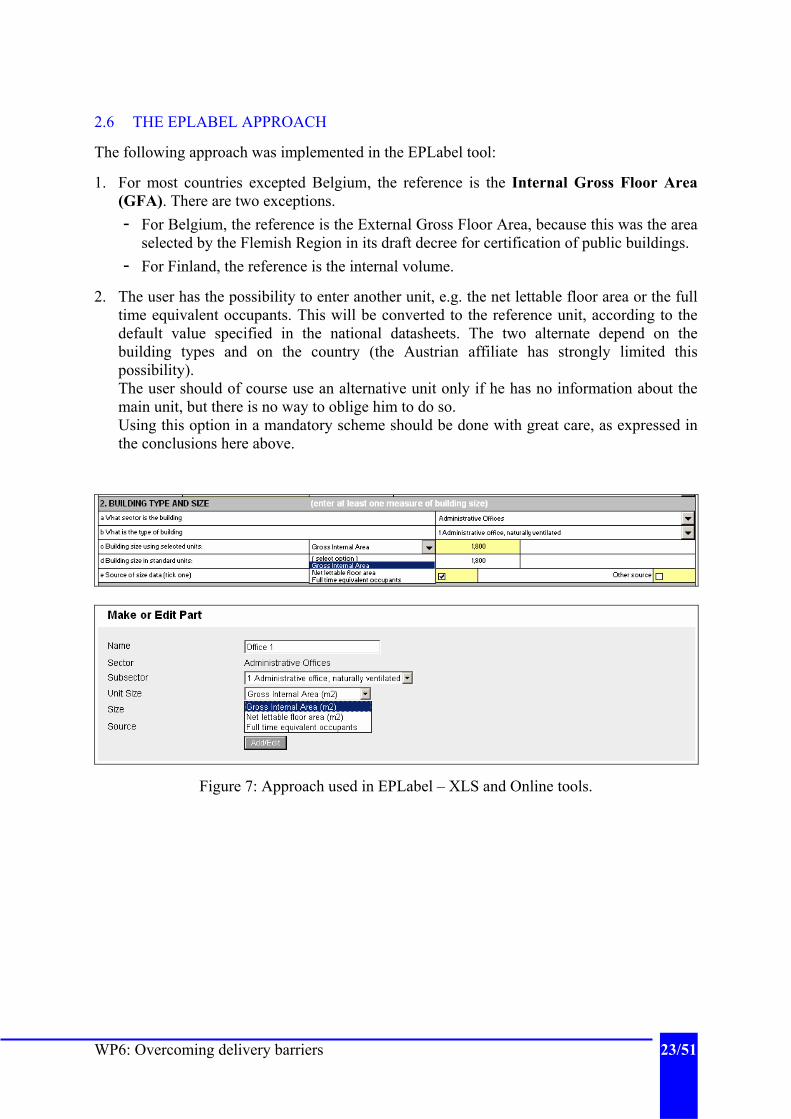
2.6 THE EPLABEL APPROACH
The following approach was implemented in the EPLabel tool:
1. For most countries excepted Belgium, the reference is the Internal Gross Floor Area (GFA). There are two exceptions. - For Belgium, the reference is the External Gross Floor Area, because this was the area
selected by the Flemish Region in its draft decree for certification of public buildings. - For Finland, the reference is the internal volume.
2. The user has the possibility to enter another unit, e.g. the net lettable floor area or the full time equivalent occupants. This will be converted to the reference unit, according to the default value specified in the national datasheets. The two alternate depend on the building types and on the country (the Austrian affiliate has strongly limited this possibility). The user should of course use an alternative unit only if he has no information about the main unit, but there is no way to oblige him to do so. Using this option in a mandatory scheme should be done with great care, as expressed in the conclusions here above.
Figure 7: Approach used in EPLabel – XLS and Online tools.

24/51 EPLABEL
3 MAKE NORMALISATION EASIER
3.1 INTRODUCTION
In order to compare the energy consumption of a building in a specific location and during a specific period with other buildings, the energy consumption (or at least the part of energy consumption due to heating and cooling) should be normalised for the climatic conditions that prevailed during this period.
Some of the methods to normalise heating/cooling energy consumption are: • Degree-Days (DD), • Energy signature method, • Climate Severity Index (CSI), • …
Normalisation for cooling is much less widely applied.
3.1.1 Heating Degree-days (HDD) Heating degree is probably the oldest method to normalise energy consumption, as it has been originally developed in 1927 by the American Gas Association. There are therefore well known by building practisers. The energy use for e.g. cooking and hot water can be interpolated by plotting the energy consumption against the HDD on a monthly basis. Many publications are available across Europe to explain how degree-days are working, including e.g.:
• UK: Carbon Trust, Good Practice Guide GPG 310, Degree-days for energy management – a practical introduction, 2nd edition, 2006.
• Belgium (Walloon Region): Institut Wallon, La comptabilité énergétique - Pourquoi? Comment?, 2004
Therefore, the principles of degree-days will not be repeated here. Differences from country to country will be reported below.
3.1.2 Cooling degree-days.
Cooling degree-days can be calculated on a similar way than heating degree-days. However, as the air conditioning demand depends as much on solar gain and external humidity as temperature, cooling degree-days will not be a reliable index of energy demand, and are therefore not widely applied.
WP6: Overcoming delivery barriers 25/51
3.1.3 Energy signature method
The energy signature method consists in plotting the monthly energy consumption against the monthly average outdoor temperature. This allows to identify the monthly average outdoor temperature at which the heating is turned on/off and the energy that is not used for heating.
The method is described in one of the informative annex of prEN 15203.
3.1.4 Climate Severity Index (CSI)
This concept is described in [4]. The basic idea is to say that, for a certain building, the climatic conditions n°2 are x times more severe than the climatic conditions n°1 if the energy consumption of this building under the climatic conditions n°2 would be x times higher than the climatic conditions n°1. Two CSI have to be calculated: one for heating, one for cooling.
The CSI is determined by the following procedure: 1. A set of reference climatic conditions is chosen (e.g. a TRY in the capital city), 2. A set of typical buildings is selected. 3. The heating/cooling energy consumptions of those buildings are calculated by building
simulations. 4. To evaluate the CSI of a particular set of climatic conditions, the heating/cooling energy
consumptions of those very same buildings are also calculated by building simulations. 5. The CSI is obtained by dividing the heating/cooling energy consumption for this set of
climatic conditions by the energy consumption of the reference climatic conditions.
3.2 DEFINITION OF DEGREE-DAYS AT EU LEVEL The concept of degree-days is defined in prEN ISO 15927-6, where it is named accumulated temperature differences.
)(DD outperiod
b θ−θ= ∑ if θout < θth
where: • θout is the daily average outdoor temperature. It can be the average of continuous
measurements during the day, or it can be approximated as the average between the daily minimum and maximum outdoor temperatures (if both are below θth).
• θb is the base temperature, which is the temperature that the heating plant is assumed to provide; the difference between the base temperature θb and the desired indoor temperature θin is due to internal and external gains.
• θth is the threshold temperature, which is the outdoor temperature at which the heating plan is turned on/off, and therefore above which accumulated temperature differences are not counted.

26/51 EPLABEL
Figure 8: how DD are calculated? θb and θth varies from country to country ; in many countries, θth equals θb. In some countries, θth vary during the year. To compare the climatic conditions across Europe, EUROSTAT uses heating degree-days 15/18, see Table 3.
Table 3: Degree-days 15/18 across EU-25 (Source: Eurostat,
Statistical aspects of the energy economy in 2004 - Issue number
5/2006) One of the major limitations of the use of HDD to characterise the heating energy consumption of a building is only based on outdoor temperature. Solar gains are only indirectly considered, by the difference between θb and θin. For this reason, it is often said that HDD are more applicable to Northern than to more sunny Southern countries. This limitation can be to some extend removed if the outdoor temperature θout is substituted by the indoor temperature without heating θno heating. This temperature is however building-dependant. Therefore, this method is difficult to use for normalisation in the frame of operational rating, as it requires a full description of the building envelope.
3.3 DEFINITIONS OF DEGREE-DAYS AT NATIONAL LEVELS
3.3.1 Definition in Belgium
In Belgium, heating degree-days 15/15 are usually used. For hospitals and elderly people homes, it is recommended to use other degree-days, as e.g. 15/18 or 18/20.
Heating degree-days are usually given for the heating season only (and not for the full year). The heating season is usually considered to start the first day for which the average outdoor temperature is below 15°C and the maximum temperature is lower than 18°C (in September of October) and to finish when the average outdoor temperature stays higher than 15°C (in May of June). There are however other definitions.
To compare two buildings at different locations, they are usually both normalised to the climate in Brussels, with 2084 HDD during the heating season.

WP6: Overcoming delivery barriers 27/51
Degree-days 15/15 of the last year can be found on http://energie.wallonie.be/. The National Institute of Meteorology (http://www.kmi.be/) can sent them by email each month, but it costs 50 €/year.
Equivalent degree-days 16.5/16.5 are also used in Belgium, to calculate the gas bill of residential buildings (heated by gas) with only one consumption statement a year. More information is given on http://www.gasinfo.be/.
Cooling degree-days are not applied in Belgium.
3.3.2 Definition in France
In France, heating degree-days 18/18 are usually used.
The ESCO ("exploitant" in French) use Degree-Days (DJU) for the projected estimation of energy bill when they have a contract for providing energy to their costumers.
There is a special service in "Minitel: 3617 DJU" and with Internet http://climatheque.meteo.fr/ (not free, you need to subscribe the service)
At this moment, there is no method for normalisation for cooling but we will have a method for the next French regulation.
3.3.3 Definition in Finland
The Finish heating degree-days are called S17. The base (indoor) temperature is 17°C. The threshold temperature depends on the season. The threshold temperatures are:
Spring 10°C Winter 17°C Autumn 12°C
The spring and autumn threshold temperatures come from the assumption that these are the temperature limits were building heating is put on or off daily according whether the outdoor temperature is either over or below the temperatures mentioned.
To compare two buildings from different parts of Finland, they are usually both normalised to Jyvaskyla (normalised degree-day 4945).
The so called normal year is the average from the data between years 1971-2000. Finland is divided into 15 zones which have their calculated normal heating degree-day value. There are hundreds of correction factors if one likes to calculate more accurately. A brochure showing those normal degree-days and correction factors, and including the formulas and examples on how to use those degree-days is given at: http://www.motiva.fi/fi/julkaisut/kiinteisto-japalveluala/rakennuksenkulutusseuranta/lammitystarvelukuesite.html > Lataa tästä.
The Finnish Meteorological Institute represents the Finnish authority responsible of producing monthly heating degree-days values. But those monthly values are available only by purchase: http://www.fmi.fi/en/index.html.
There is no method of normalising cooling.

28/51 EPLABEL
3.3.4 Definitions in Greece
The Technical Instruction 2425/86 of the Technical Chamber of Greece defines HDD and CDD for 28 cities for the base temperatures 10°C, 15°C, 18°C and 25°C. A widely used reference value is the city of Athens (Helliniko) HDD 980 for base temperature 18, CDD 245 for base temperature 25. Official meteorological data are provided by the Hellenic National Meteorological Service (http://www.hnms.gr/).
However, the DD methodology is not considered the most appropriate one to use in Greece, especially for cooling, whereas solar radiation is extremely important during the cooling period. For this reason, the Climatic Severity Index (CSI) has been developed, as well for cooling as for heating, with base value 1 for Athens. The University of Athens has calculated the CSI for offices in different cities.
3.3.5 Definitions in Ireland
Ireland is composed of only one climatic zone. Degree-days are not used generally in Ireland. Normalised degree-days 15/15 are 1790 DD, Normalised degree-days 15/15 are 2420 DD.
3.3.6 Definitions in Norway
In Norway, heating degree-days 17/17 are usually used.
The Norwegian climates can be generalized into 7 main types of climate. When normalizing energy use data, the percentage of the building's energy consumption is temperature-dependent needs to be known. This data is tabulated in Norway for a large number of building types. All this data is available at the following websites:
DD-normals are published in the following report: http://met.no/english/r_and_d_activities/publications/2002/klima-02-23.pdf
Conversion between years, for many different building types, can be done with the following website: http://www.enova.no/?pageid=3435.
3.3.7 Definitions in Germany
Two types of degree-days are used in Germany:
1. VDI guideline 2067 defines Gradtagszahl, which are heating degree-days 15/20.
2. VDI guideline 3807 defines Heizgradtage, which are heating degree-days 15/15,
There is a possibility to get the degree-days for certain weather stations from the German meteorological service (DWD: http://www.dwd.de) (DWD does not provide historical degree-days data).
Also with data form DWD for individual days, it is possible to calculate the degree-days (Heizgradtage) by yourself. DWD provides the temperature and other weather data for individual days and certain stations back to 1990.
WP6: Overcoming delivery barriers 29/51
A third way to get the data would be to use a calculation sheet provided from the German "Institut for housing and environment" (http://www.iwu.de). They update it once a year, so you will not get real actual data. With the sheet you can calculate both, degree-days and "Heizgradtage".
Degree-days may be used for cooling and make the normalisation according to the method for degree-days for heating. But usually, there is no normalisation done for cooling.
3.3.8 Definition in Sweden
The Swedish heating degree-days definition is really old. The base (indoor) temperature is 17°C. The threshold temperature depends on the month. The threshold temperatures are:
January-March 17°C April 12°C May-July 10°C August 11°C September 12°C October 13°C November-December 17°C
Heating degree-days for about 300 locations in 10 regions can be bought from the Swedish Meteorological and Hydrological Institute (SMHI). Of this 300 locations only about one third are based on measurements on the spot, they others are calculated from the measured ones. These degree-days are quite expensive, monthly values for 1-7 regions 12,000 SEK/year (€ 1,300/year) or 8-10 regions 61,400 SEK/year (€ 6,700/year). Because of this , Swedish degree-days cannot be find in the HVAC journal as in most other countries!
Statistics Sweden uses 4 zones, based on the old Building Code´s requirements of building shell insulation. These zones are based on 14 representative weather stations, with long time series, all over the country. From 2003 the normal degree-days are based on the 30 year period 1970-2000, before that on 20 year period 1961-1979. See Table 4.
Zone III and IV includes about 80% of the Swedish population and zone II 10-15% of the population. The large Zone I is more or less empty of people compared the whole country's population.

30/51 EPLABEL
Description 1970-2000 1961-1979
Zone I Northern and inner (western) parts of northern of Sweden 4964 5498
Zone II Middle and eastern (Baltic coast) parts of northern Sweden 4274 4519
Zone III Middle Sweden 3610 3825
Zone IV The west and south coasts including the two islands in the Baltic Sea 3232 3307
Whole Sweden - 3716 3970
Table 4: Normalised degree-days in Sweden (Source: Sweden Statistics)
As can be seen from the heating degree-days, there is really no need for a weather correction of cooling in Sweden. Some of the larger building owners in Stockholm, who has a lot of district cooling have attempted simple cooling degree-days correction, but this just makes things worse as cooling depends very much on the building services systems layouts and how the building is managed. So there is no official cooling correction method.
3.3.9 Definitions in The Netherlands
In The Netherlands, heating degree-days 15.5/18 are usually used.
Several websites are available to download heating degree-days, for instance: http://www.graaddag.nl/ http://www.kwa.nl/index_gd.htm
3.3.10 Definitions in UK
The UK has been using 2462 heating degree-days 15.5/15.5 as a (geographically) national average for many years, and it is embedded in many of our building energy benchmarks. More recent weather has been much warmer so the figure should now be lower. Furthermore, as the population is concentrated in the warmer South it should be lower still on a population weighted basis.
The health sector usually used degree-days 18.5/18.5.
Degree-days for regions are available free on the web, monthly in arrears. See http://www.thecarbontrust.co.uk/.
More local degree-days you can get from Vilnis Vesma at a relatively small charge: http://www.vesma.com/.
Normalisation for cooling, eg cooling degree-days, is very rarely used for building energy analysis – and are not available on the free web site. However, they are certainly available at a cost.
WP6: Overcoming delivery barriers 31/51
3.4 SHARE OF HEATING IN TOTAL ENERGY USE
Gas and oil are usually not only used for heating, but also for hot water production and, in case of gas, for cooking. Electricity is widely used in the building. Therefore, applying the degree-days method in order to normalise the heating energy consumption requires to evaluate the share of energy used for heating in the total energy used.
In a voluntary scheme, the share of heating energy could be estimated with the use of standard values. For instance, surveys could have indicated that, in average, 80% of the gas consumption is used for heating.
In a compulsory scheme, the use of default value should be avoided, as it can favours a lot of buildings. Therefore, an alternative method could be proposed.
The easiest situation is for a building running during whole the year, in a climate with months without heating needs. In this case the energy use for other purposes than heating can be estimated as the energy use outside the heating season. This is only a rough estimation as it assumes that the energy use for other purposes than heating is constant during the year. In case of electrical heating, this estimation can be poor, as the electrical heating consumption for lighting is also climate dependant (at least if it is well regulated).
If the climate requires heating (almost) all the year, or if the energy consumption in summer is lower or null due to vacations (e.g. schools not used in summer), the base energy consumption can be determined by interpolation.
Several energy management softwares exist, with their own methodologies.
All these aspects should be covered by a new CEN standard. Indeed, prEN 15603 is very vague on the question.
3.5 CONCLUSIONS
Normalisation for heating is widely applied. There are several methods to do it, but the most established is the heating degree-days method. This method is more suitable for Northern countries, with lower solar gains, than for Southern countries. Almost each country has it owns definition of heating degree-days (base and threshold temperature, HDD for the heating season or for the full year).
Normalisation for cooling is currently not widely applied. The increasing number of air-conditioning units installed across Europe make necessary to have a robust method to normalise cooling energy use as well.
As required by the Directive 2006/32/EC on energy-end use efficiency and energy services, the energy suppliers should provide on their bill some information on how to understand the energy consumption of a building. This situation could be generalised. The normalisation, in both length of billing period and degree-days, could be more or less automated by the energy supplier.
32/51 EPLABEL
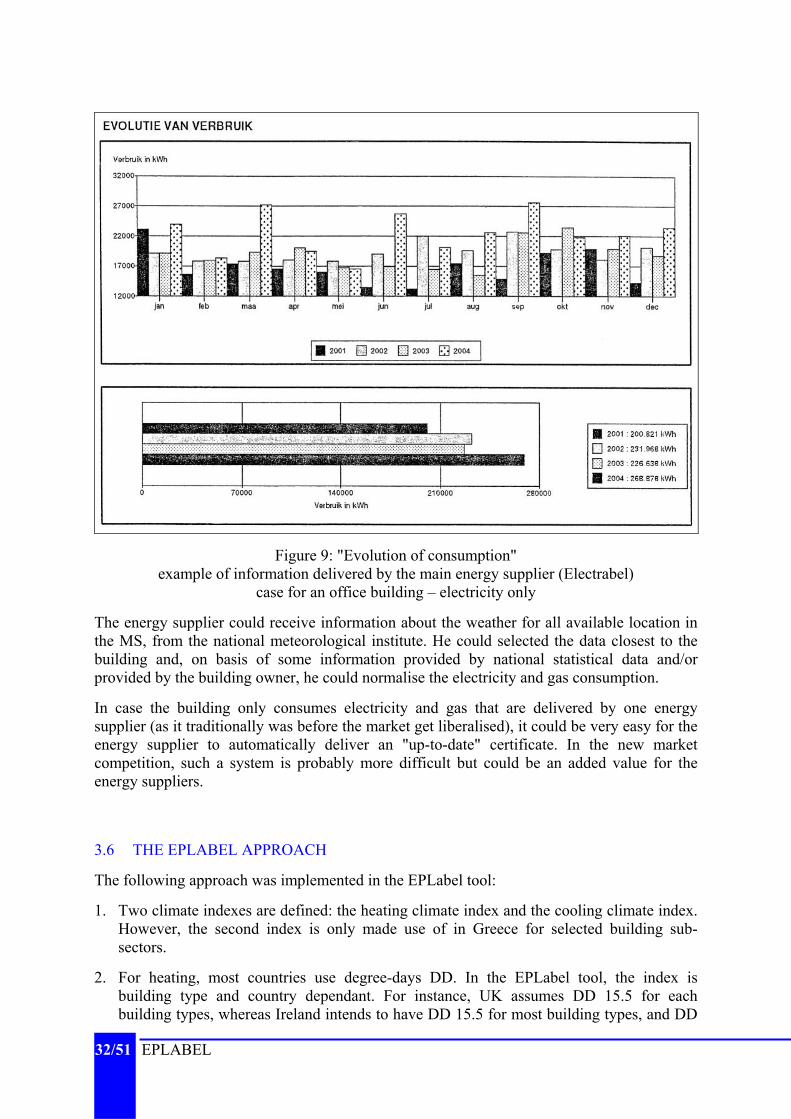
Figure 9: "Evolution of consumption" example of information delivered by the main energy supplier (Electrabel)
case for an office building – electricity only
The energy supplier could receive information about the weather for all available location in the MS, from the national meteorological institute. He could selected the data closest to the building and, on basis of some information provided by national statistical data and/or provided by the building owner, he could normalise the electricity and gas consumption.
In case the building only consumes electricity and gas that are delivered by one energy supplier (as it traditionally was before the market get liberalised), it could be very easy for the energy supplier to automatically deliver an "up-to-date" certificate. In the new market competition, such a system is probably more difficult but could be an added value for the energy suppliers.
3.6 THE EPLABEL APPROACH
The following approach was implemented in the EPLabel tool:
1. Two climate indexes are defined: the heating climate index and the cooling climate index. However, the second index is only made use of in Greece for selected building sub-sectors.
2. For heating, most countries use degree-days DD. In the EPLabel tool, the index is building type and country dependant. For instance, UK assumes DD 15.5 for each building types, whereas Ireland intends to have DD 15.5 for most building types, and DD

WP6: Overcoming delivery barriers 33/51
18 for hospitals. For heating, Germany and neighbouring countries that use German benchmarks use a normalised degree day index (average value = 1.0). For cooling, Greece uses the Climate Severity Index (CSI).
3. The part of the fossil consumption related to the heating climate index is building type and country dependant. For instance, UK assumes 75% for all building types, whereas Germany assumes e.g. 95% for hotels, 90% for administrative offices and 50% for hospitals.
4. The part of the electricity consumption related to the heating climate index is taken as zero in all countries. The main reason is that the part that is climate-dependant is much more building-dependant than in case of fossil fuel4. Consequently, the electrical energy consumption of buildings with electrical heating has to be normalised outside the EPLabel tool. Moreover, the user has to answer "yes" to the question "i Is there on-site CHP or fuel substitution?"; the EPLabel tool will not calculate the thermal and electrical energy efficiency grades.
5. In Greece, the part of the electricity consumption related to the cooling climate index depends on the building type: 14% for administrative offices with A/C (and obviously 0% for administrative offices without A/C), 1% for hospitals, 17% for clinics, 15% for hotels (excepted small hotels without A/C) and 0% for sports and public schools due to a lack of use of A/C.
6. Two corrections can be done: a climate correction and a weather correction. This is illustrated with the figure below.
BENCHMARKBENCHMARK DD reference climate: 2462Elec: 81 kWh/m²Fossil: 143 kWh/m²
DD climatic zone 6 reference: 2290Elec: 81 kWh/m²Fossil: 143*(0.75*2290/2462+0.25)
= 136 kWh/m²
DD climatic zone 6 reference: 2290Elec: 75 kWh/m²Fossil: 138 kWh/m²
DD actual zone 6 reference: 2123Elec: 75 kWh/m²Fossil: 138*(0.75*2290/2123+0.25)
= 146 kWh/m²
Year 200XHistorical dataused as
reference climate
CLIMATE CORRECTION
WEATHER CORRECTION
4 Note that in Belgium, the EPA for dwellings procedure has come to a similar conclusion. This procedure takes the actual energy use into account, excepted in case of electrical heating.
34/51 EPLABEL
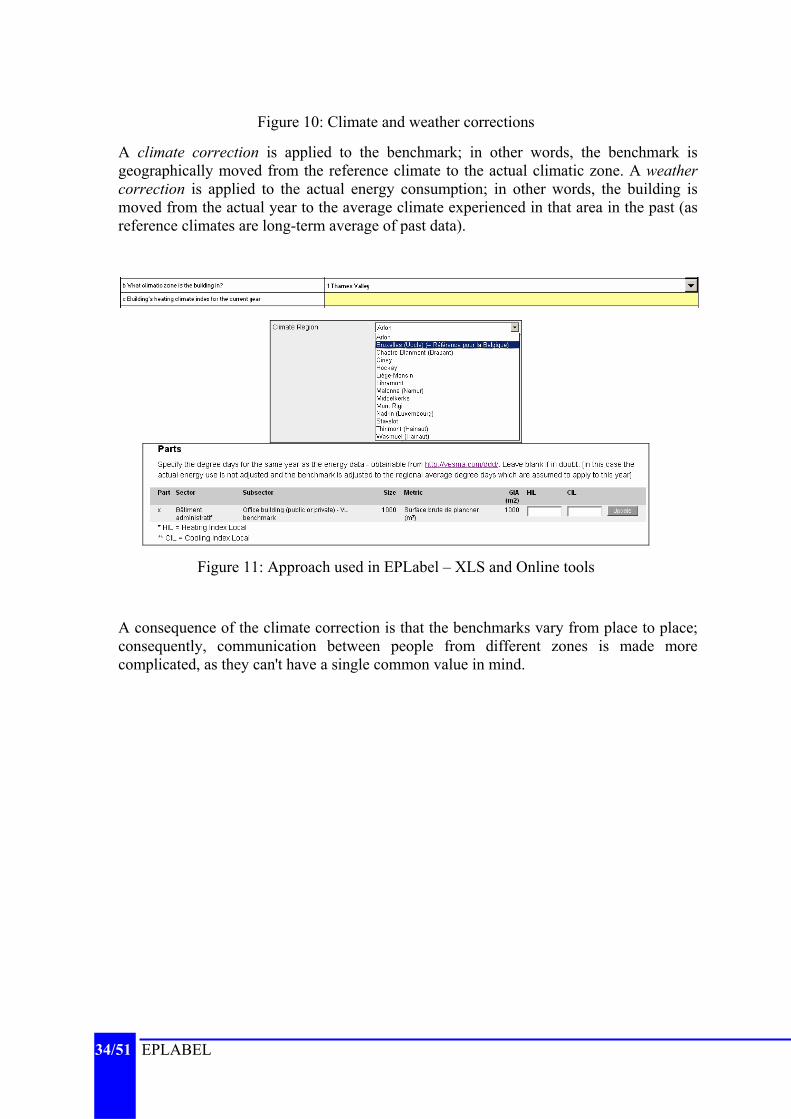
Figure 10: Climate and weather corrections
A climate correction is applied to the benchmark; in other words, the benchmark is geographically moved from the reference climate to the actual climatic zone. A weather correction is applied to the actual energy consumption; in other words, the building is moved from the actual year to the average climate experienced in that area in the past (as reference climates are long-term average of past data).
Figure 11: Approach used in EPLabel – XLS and Online tools
A consequence of the climate correction is that the benchmarks vary from place to place; consequently, communication between people from different zones is made more complicated, as they can't have a single common value in mind.

WP6: Overcoming delivery barriers 35/51
4 MAKING DATA COLLECTION EASIER
4.1 NEED FOR SUBMETERING
To illustrate various situations where submetering could be necessary, we will consider as example the gas consumption for heating.
The easiest situation is of course the where there is only one building, with its own heating plant. In that case, the gas consumption of the building can directly be read from the meters.
A common situation is a "site" where there are n buildings, with their own heating plants. This might be the case in hospitals, universities…
Of course, the energy consumption could be distributed among the building on a simplified way, on basis of their areas, volumes of heat loss areas. This method would be inaccurate, as the consumption depends on much more parameters, including the building insulation level, building use, efficiency of the boilers. Starting to analyse all those parameters for each building would be… making an asset rating.
The first option would be to add (n-1) gas submeters (the consumption of one of the building can be calculated by subtracting the consumption of the others to the overall consumption). This has the advantage that the gas consumption for hot water and cooking is also included in the new submeters. The disadvantages are related to the difficulties to add gas submeters to an existing network, including the price.
Another option would be to add heat meters on the heating networks. The main advantage is that these meters are much easier to install, and less expensive. However, neither cooking and hot water, nor the performances of the heating plants are measured (hot water meters could be installed too, if necessary). The performance of the heating plants must therefore be estimated by other means.
Alternatively, there might be only one heating plant for several buildings.

36/51 EPLABEL
In that case, only heat meters can be installed. This implies the same disadvantages that those described in the previous case.
The situation may occur where not all the building is considered as public, but only a part of it, but where the HVAC is common. Therefore, the gas consumption has to be separated for both parts. We may expect that a system is already in place, for billing. Otherwise, meters will probably have to be installed too.
4.2 STATE OF THE ART WITH SUB-METERING
WP2 has clearly identified that this issue was a problem.
In the framework of EPLabel, an inquiry was launched in two types of Belgian buildings: hospitals and sport centres. One of the questions was dedicated about the sub-metering. In case the hospitals/sport centres includes several buildings, where are the meter located ?
In the hospitals with more than one building (from 2 to 54…), there is, in most of the cases, only one electricity meter and only one gas meter for the whole site. For oil, the question was not related to the meter only, but also to the location of tanks, as the consumption can be evaluated from a combination of bills and measurements of the tank level. It appears that the situation is less dramatic for oil.
29 28
6
116
5
7
8
6
05
10
1520
25
30354045
50
Electricity Gas Oil
All buildings
SomebuildingsOnly 1 meter
Figure 12: Location of meters (or, in case of oil tank, location of oil meters or oil tanks)
WP6: Overcoming delivery barriers 37/51
4.3 GAS
This paragraph has been written thanks to the collaboration of M. Bart Thomas - Belgian Royal Association of Gas suppliers (http://www.gasinfo.be/) and of M. Dirk Vandenbohede Dirk – Actaris (http://www.actaris.com).
Note: The text below is based on the Belgian situation, but it is expected that it could be generalised to other MS. Especially, the type of meter is probably similar in each country, as their accuracy is fixed by standard edited by the International Organization of Legal Metrology (http://www.oiml.org/). However, some national prescriptions might be applicable too.
The gas meter to add in a building will depend on the type of distribution network that deserves that building.
4.3.1 Distribution networks
The distribution network in BE includes:
1. Pipelines for transport (operated by FLUXYS), at "high pressure", generally between 65 and 80 bar.
2. Pipelines for distribution (and sometimes for transport) at "average pressure C" ("Moyenne Pression MP-C", in French), from 5 to 15 bar. This distribution network is mainly dedicated to very big consumers, as industries.
3. Distribution at "average pressure B", from 500 mbar to 5 bar. New networks in areas were customers are expected to be not very close to each other are usually at the pressure of 5 bar. Large public buildings will be connected to that network.
4. (Distribution at "average pressure A", from 100 to 200 mbar, but this network is not very common.)
5. Distribution at "low pressure" ("Basse Pression BP", in French), at 100 mbar. New networks in the city centres, as well as recent networks at the suburbs are at this pressure. Large public buildings might be connected to that network.
6. Distribution at "low pressure" at 20 or 25 mbar, according to the type of gas (high or low calorific gas). In the city centres, the old networks are generally at this pressure5. Small public buildings might be connected to that network.
In NL and UK, the distribution networks are usually at a pressure of 100 mbar or 5 bar. In DK, FR, GE the distribution is usually at a pressure of 4 or 5 bar.
5 In 2004, the lengths of the high/average/low pressure networks in BE were respectively 3.729 / 12.122 / 44.237 km.

38/51 EPLABEL
4.3.2 Meters
Three main types of gas meters are available6:
1. Displacement diaphragm meter, usually for flow lower then 100 m³/h,
2. Rotary piston meter (or rotary meters), usually for flow between 40 and 250 m³/h,
Figure 13: Operating principle of rotary meters (source: www.instromet.com)
3. Turbine meter, usually for flow higher than 160 m³/h.
4. Static meters.
The first two types are volumetric meters, whereas the third type is a flow meter (it calculates the delivered volume on basis of the measured velocity of the gas delivered).
Figure 14: Displacement diaphragm, rotary piston and turbine meters (source: www.actaris.com7)
The first three types of meters are "stamped8" or officially approved (this means that the accuracy of each unit is verified, in order to be suitable for billing and for fiscal use), but it
6 In French: 1) compteurs à soufflets 2) compteurs à pistons rotatifs 3) compteurs à turbine 7 Actaris - 142 rue de Stalle - 1180 Bruxelles - Phone: +32 2 333 18 11 - Fax: +32 2 376 60 74 8 In French: estampillés

WP6: Overcoming delivery barriers 39/51
might be possible to have non officially approved meters, less expensive, for submetering. It is also possible to connect a Low Frequency transmitter, to read data with an energy auditing program.
The meter is described by a class G, to which correspond the maximum airflow that can pass through the meter. The value G must be multiplied by 1.6 in order to have the maximum airflow allowed. For instance, the maximum airflow for a G4 meter is 6 m³/h, and the maximum airflow for a G650 meter is 1000 m³/h.
4.3.3 Installing meters
Installing gas meters is not as easy as installing electricity meters. Electricity can easily be turned off during the works. In case of gas, even when the flow is stopped, there is still gas in the duct were the meter has to be installed. This gas has to be removed by special techniques. The duct must also be cleaned after the works have been carried out.
In case of "low pressure" network, the installation is technically easier because the meters can be installed alone. No other security valves (for instance) are required. However, the meter can introduce a new pressure drop that could be damageable for the good working of the installations.
In case of "average pressure" networks, the installation might be more difficult. Pressure drop (in the building network) is not an issue anymore, because it can be compensated by the gas distribution network.
Displacement diaphragm meter are quite big; that's why they have to be used for limited airflow only.
Rotary meter are sensitive to mechanical stresses induced in the duct. These stresses will distort the body and would block the rotor if the distortion became sufficiently large. Variations in temperature over the body can also introduce deformations that would have the same result. They are also very sensitive to dusts, and require some maintenance (adding lubricant). Oppositively to the two other types, if a rotary meter blocks, the flow is stopped.
Turbine meter require the flow to be stabilised before and after the meter, as turbulence would influence the measurement. Therefore, straight ducts are necessary before (L = 3 Ø) and after (L = 1 Ø) the meter. They require some maintenance (adding lubricant). Turbine meter are not well suited if the gas flow varies a lot, as this can induce dynamic errors of measurement.
If several rotary or turbine meters are installed in parallel closely to each other (which might be the case for submetering in several building of a same site), non-return valves might be necessary before the meters. Otherwise, a meter in a duct where there is no gas demand might turn due to the turbulence caused by the other meters.
The meter should not be placed at the lowest point of the network, in order to avoid that inside condensation flows down into it.
What ever the pressure distribution and the type of meter, another difficulty is that the gas distribution has to be interrupted during the placement of the meter.

40/51 EPLABEL
4.3.4 Costs
The costs of installing a meter are: 1) Cost of the meter itself, 2) Cost of the accessories, as filters, 3) Labour costs.
Type of meter Max. flow Price
Diaphragm meter G6 9.6 m³/h 160 €9
Diaphragm meter G25 40 m³/h 750 €
Rotary meter G65 104 m³/h 1200 €
Rotary meter G100 160 m³/h 1700 €
Rotary meter G250 400 m³/h 2200 €
Turbine meter G250 400 m³/h 1800 €
Turbine meter G400 640 m³/h 2200 €
Table 5: Example of typical cost of some meters, excluding placement and VAT (Source: Actaris)
Not "stamped" meters are cheaper; a turbine meter G65 would cost 1000 € and a turbine meter G250 would costs 1100 €.
Type of meter Max. flow Price
G16 25 m³/h 1593 €
G25 40 m³/h 1638 €
G40 65 m³/h 5711 €
G65 100 m³/h 5840 €
G100 160 m³/h 8491 / 13179 €
G160 250 m³/h 9422 / 16159 €
G250 400 m³/h 21785 €
G400 650 m³/h 28112 €
G650 1000 m³/h 31590
Table 6: Example of cost of some meters, including placement, including accessories, excluding VAT (source: Belgian supplier IVEG10)
9 The placement of a new meter type G6 on an existing network costs about 350 €, excl. VAT. Source: supplier IVEG. 10 http://www.iveg.be/iveg/tarieven/pdf/2006/Iveg_Aansluitingstarieven_aardgas_2006.pdf
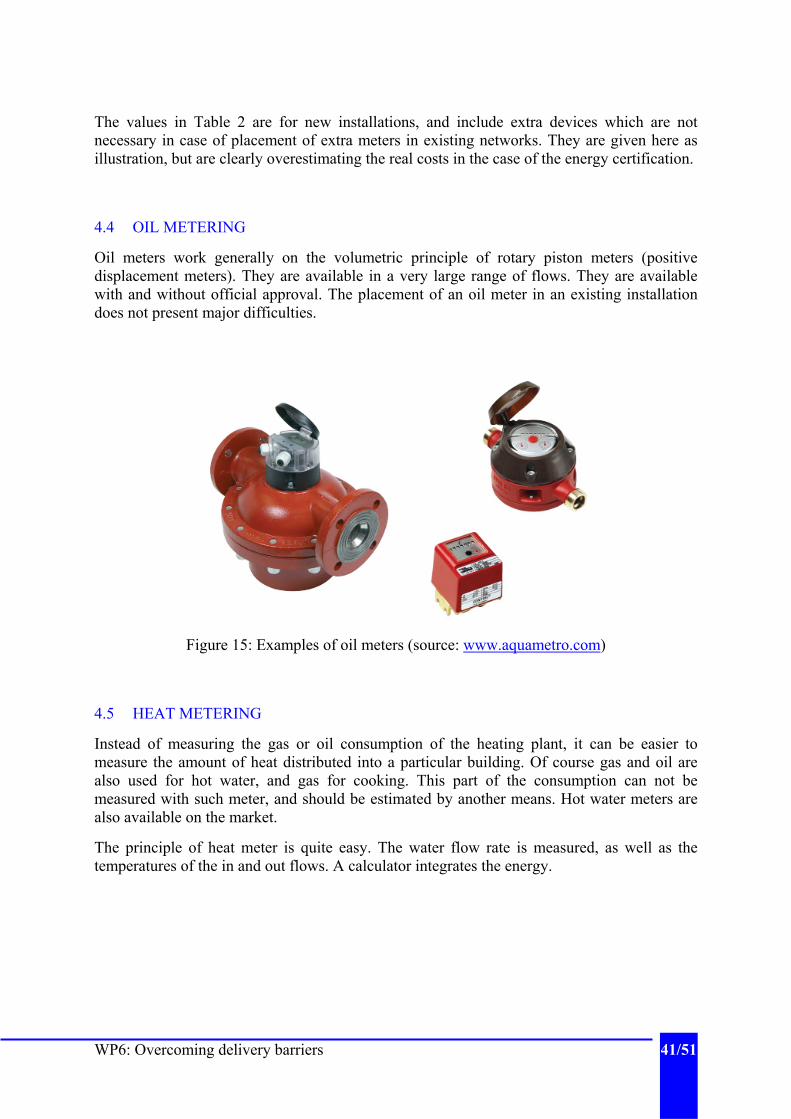
WP6: Overcoming delivery barriers 41/51
The values in Table 2 are for new installations, and include extra devices which are not necessary in case of placement of extra meters in existing networks. They are given here as illustration, but are clearly overestimating the real costs in the case of the energy certification.
4.4 OIL METERING
Oil meters work generally on the volumetric principle of rotary piston meters (positive displacement meters). They are available in a very large range of flows. They are available with and without official approval. The placement of an oil meter in an existing installation does not present major difficulties.
Figure 15: Examples of oil meters (source: www.aquametro.com)
4.5 HEAT METERING
Instead of measuring the gas or oil consumption of the heating plant, it can be easier to measure the amount of heat distributed into a particular building. Of course gas and oil are also used for hot water, and gas for cooking. This part of the consumption can not be measured with such meter, and should be estimated by another means. Hot water meters are also available on the market.
The principle of heat meter is quite easy. The water flow rate is measured, as well as the temperatures of the in and out flows. A calculator integrates the energy.

42/51 EPLABEL
Use Max. flow Price
Residential 1.5 – 2.5 m³/h 265 – 315 €
Tertiary 3.5 – 10 m³/h 580 – 720 €
Tertiary 15 – 60 m³/h 935 – 1138 €
Table 7: Example of typical cost of some heat meters, excluding placement and VAT. (Source: Actaris)
The main advantage of such meter is that they are easy to install. The placement can also be done in summer time, when the heating plant is normally turned off. Optionally, they can also measure the cooling energy delivered to the building.
The main disadvantage is that it does not provide information on the performance of the heating plant.
4.6 ELECTRICITY METERING
Electricity is very easily metered. Installing an electricity meter does not cause much problem, excepted that the electricity must be cut off for a while.
However, several problems often arise with electricity metering with the consequence that some of the objectives for it are not fully met:
• A lack of clear and accurate information as to where exactly sub-meters sit on the electrical distribution network; this can manifest itself in poor reconciliation, between the main meter and sub-meters or bottom-up calculations
• Poor documentation of the current transformer factors for the sub-meters
• Sub-meters which are not automatically read require manual reading which is rarely sustained.
• Where sub-meters are automatically read by a BMS, there is often no strategy for processing the meter readings into a digestible energy report.
• Difficulties accounting for renewable sources of energy, energy exports and centralised plant.
Even where an extensive range of existing sub-meters is available, there is no guarantee that this will enable easy and reliable energy certificates to be produced eg for individual buildings on a campus, unless the metering installation has been designed with this purpose in mind and it overcomes the above potential problems.
WP6: Overcoming delivery barriers 43/51
5 LANDLORD/TENANT ISSUE
The main contributor of this chapter is Bill Bordass, subcontractor to EPLabel’s UK partner.
5.1 PROBLEM DESCRIPTION
The split of responsibilities between landlords, tenants and managers in rented buildings has in the past been a major barrier to realising opportunities for energy savings at all points in their life cycles. An effective Operational Rating procedure could help to remove some of these constraints, while a poor one could make the process expensive and inefficient.
In some rented buildings, all energy is supplied and paid for by the landlord and is included in the service charge. In whole buildings rented to a single occupier or head tenant, the occupier pays for all the energy. However, in most multi-tenanted buildings, there is a major division in responsibilities between the landlord or managing agent (who provides the common services and looks after the common parts) and the tenants (who look after their demises and often fit them out to their own standards). In terms of energy use:
- The landlord pays for “landlord’s services” and divides up the costs between the tenants. In the larger buildings, landlords’ services often include central heating and air-conditioning, hot water, cold water treatment and pumping where relevant, lifts and escalators, lighting and other services in “common parts” - i.e. reception, circulation and service areas outside the tenanted areas, together with external lighting, car park services etc.. In small and simple buildings it may just be the lift (if any), the lights on the stairs and outside, and perhaps the heating.
- Tenants pay directly for services within their demises, typically electricity for lights, equipment and catering, and occasionally hot and chilled water. Supplies to these are not always separately metered or submetered: they may be apportioned, e.g. according to floor area and perhaps hours of operation.
- Tenants may also pay for fuel to services added in their fitout, e.g. extra air-conditioning for meeting rooms, dealing rooms and machine rooms; and gas and hot water for catering kitchens. In calculating the relevant service charge, extra chilled water the tenant takes from the landlord’s system (e.g. for cooling a machine room) may be estimated, metered or ignored.
Landlord/tenant splits can be complex, even for the main services. For example, in air-conditioned offices, central chillers and primary air tend to be landlord’s services, while tenants pay for the electricity used by local air-handling plant and fan coils within their demises. Tenants often add their own equipment (e.g. server room cooling), but this is not always independent. For example, the landlord occasionally provides a common chilled water or heat dump circuit for tenant systems, which may or may not be sub-metered and may or may not respond efficiently to the levels and periods of tenant demand. Sometimes tenants’ systems also make use of landlord’s services that had been intended for space cooling, for example rejecting heat from their machine room cooling into an air-conditioning return air duct or using landlord’s chilled water: this can be very inefficient, requiring the landlord’s plant to run 24/7 to accommodate relatively small loads.

44/51 EPLABEL
One of the major problem for Operational Ratings is that landlord's do not necessarily have all the information. The landlord will often not know how much electricity and gas the tenants buy for use within their demises. Many tenants receive these supplies on direct utility feeds. Even where tenants are submetered from the landlord’s main supply, tenants may be free (and even encouraged) to buy their utilities from other suppliers. In UK11, consultants working with the property company Land Securities attempted to get energy and related information from their tenants, and had a success rate of only 22%.
5.2 POSSIBLE SOLUTIONS
5.2.1 Option 1: Certifying energy use in the building as a whole.
This makes sense for buildings with a single or head tenant on a fully repairing and insuring (FRI) lease. Here the tenant gets the building for the period of the lease and uses it much like an owner-occupier: the landlord has very little to do with it unless requested. It also makes sense in serviced workspaces, where the space is often divided up between very many tenants and managed by (or on behalf of) the landlord, who operates the building more like a hotel and pays all the energy bills.
In multi-tenanted buildings, this option might reduce the incentives for tenants to sort the energy efficiency of their own space out, as the certificate results will also depend on the behaviour of other tenants they are not responsible for.
5.2.2 Option 2: Certifying energy use by landlords and tenants separately
In principle, it is attractive to have separate certificates for Landlord’s and Tenant’s components, as in the Australian ABGR non-domestic building energy rating system (see www.abgr.com.au). This would map onto commercial drivers and management structures (e.g. are the landlord’s services energy-efficient in both design and management; and are the tenant demises fitted-out and managed in an efficient way?) and onto utility billing arrangements.
In practice, however, it may be difficult to calculate appropriate benchmarks for these components separately, owing to the situation outlined on the previous page, e.g. with different splits between services, and not all supplies metered. It is easier to add the two up - as in Options 1 and 3 - so then these technical details do not matter.
Moreover, this might not be compliant with the EPBD, which requires buildings to be certified, or with CEN standards. Therefore, a summation of the two certificates might be necessary anyway.
11 FaberMaunsell for the Carbon Trust, Confidential internal reports for the Land Securities stocktake project. Phase 1 (January 2004) and Phase 2 (March 2005), unpublished.
WP6: Overcoming delivery barriers 45/51
5.2.3 Option 3: Certifying the tenanted spaces, including the appropriate landlord’s energy.
The third option would be to combine energy use paid by tenants and landlords. The addition could be made in two main ways:
- Option 3a: all tenant information can be collected by the landlord. This would be complicated and could cause legal difficulties. It would also reduce incentives on tenants to improve. Much energy use and waste is due to tenant investment and behaviour - almost all of it in the retail sector.
- Option 3b: the landlord tells tenants how much energy has been used on their behalf. This might already be the case if the landlord has to prove his landlord’s services charge. Tenants can then put this together with their own consumption to get the full picture. This looks promising.
Landlords and tenants both like Options 2 and/or 3 as they map onto their commercial drivers and the results can also go straight into their corporate responsibility and environmental reports.
5.3 LANDLORD'S STATEMENT AND SERVICES
In case of option 3, a Landlord’s Statement would state the landlord’s total annual energy consumption by each energy carrier (including renewable energy supplies), the associated CO2 emissions and/or any other required weighted energy indicators, and the amounts attributable to the particular tenant for:
- Services in common areas (e.g. reception and main circulation).
- Services (e.g. HVAC) supplied by the landlord to the specific tenant. Energy is often apportioned in relation to floor area, but the greater visibility created by the Statement would be likely to lead to tenant pressures for more precise measurement or estimation.
- Utilities supplied by the landlord directly to tenant demises might be shown on the Landlord’s Statement, or on separate utility statements, if this is required under the Energy Services Directive or by national regulations.
To implement the options discussed above, it is not essential for energy use by landlord’s services to be certified separately. However, an investigation of some kind will be needed to ensure that landlord’s services are efficient and that energy-saving recommendations can be made. A voluntary system of reporting and grading landlord’s services is already of interest to some landlords for various reasons, e.g. demonstrating good practice, motivating portfolio managers and letting agents, attracting tenants, improving discussions with existing tenants on ways to improve performance, and in rent reviews.

46/51 EPLABEL
5.4 CONCLUSIONS
Remark: the landlord/tenant issue is expected to be most important for public administration offices sector, but not limited to this sector. There might be for instance small clinics located on the first floors of a building that also contains private offices and/or apartments; every configuration is possible.
1. The option envisaged could be different for public buildings than for commercial buildings. Indeed, the main goal of EPBD article 7.3 requirements is to raise awareness about energy consumption into the public. Therefore, "public authority buildings and buildings frequently visited by the public should set an example by taking environmental and energy considerations into account and therefore should be subject to energy certification on a regular basis." For the public, the certificate should probably be kept as easy as possible. For instance, if an administration consumes a lot of energy, it does not really matters the public if this caused by poor landlord's services or by poor tenant's management; in both case, energy is paid by public money. Therefore, for public buildings, option 2 might be less relevant.
2. Option 1 would be difficult to implement, as a certificate would be required for parts of a building which is not public, not sold or not rented. This is neither in line with the current version of the EPBD, nor (probably) with the national regulations. Even if such a certificate were to be produced, since it would be for the average performance of all the occupiers of the building, it would not have a direct relationship with the activities of the public sector organisation that was obliged to display the certificates.
3. For multi-tenanted buildings, Option 3 therefore seems to be the only available option.
4. Experience in UK has shown that its is difficult for the landlord to get hold of the energy consumption its tenants obtain and pay for directly. Whatever option 3a or option 3b is chosen, it might be necessary to specify in the national legislation that the tenants are legally obliged to give their own statements to the landlord (if option 3a is selected), or that landlord is legally obliged to give his statement to the tenants (if option 3b is selected).
5. The comparison of parts of buildings with the currently available benchmarks could introduces biases, as it is expected that the buildings behind the benchmarks data are whole buildings (for e.g. a public part of a building on the ground floor only, the energy loss could be different due to the fact that there is no roof).
Remark: during the project, it was unclear if a building that was partly public, partly not, would have to be certified partly, as a whole or not at all. When the question was analysed (in 2005), most EPLabelS partners said their country has not yet decided (BE, FI, UK). SW and GR reported that buildings would be certified as a whole

WP6: Overcoming delivery barriers 47/51
6 OVERALL CONCLUSION
Given that most MS had not and most still have not decided how to produce certificates for Public Buildings, that those MS intending to use Operational Ratings mostly have not announced a final detailed methodology, and that the CEN Standard for Measured Energy Ratings also does not cover the issues in WP6, EPlabel set out to produce a generic platform which demonstrates a harmonised methodology allowing national variants.
WP6 has documented these variants and enabled them to be accommodated in the EPLabel approach. In principle it is hoped that the approach will be sufficiently flexible to enable it to be easily modified to comply with national methodologies as and when these are finalised. Meanwhile EPLabel has been able to demonstrate an approach which every MS can relate to and take advantage of.
48/51 EPLABEL
7 ANNEX 1: OTHER DEFINITIONS OF AREA
7.1 DEFINITIONS OF USEFUL FLOOR AREA OF DWELLINGS
The following definitions of useful floor area of dwellings show the diversity of definitions used in the EU. They are taken from Housing Statistics in the European Union 2002 (University of Liege, 2002).
Belgium
The useful area includes all the rooms in the building, excluding cellars, storehouses as well as spaces reserved for industrial, commercial or agricultural purposes.
Germany
The main contributor of this chapter is Bill Bordass, subcontractor to EPLabel’s UK partner.
Spain
The useful floor space is defined as the area between the exterior walls of the dwelling, including balconies. It therefore comprises not only the living space, but also the area of the corridors, entrance hall, bathrooms and other parts that are strictly no living space.
Ireland
Floor area is defined as the floor space of dwellings measured inside the outer walls, excluding cellars, non-habitable attics and in multi-dwelling houses, common spaces.
Italia
The useful floor space is defined as the floor space of dwellings measured inside the outer walls, excluding passage thresholds and door and window splays.
Greece
The useful floor area is defined as the whole floor area of dwellings, including the surface of the outer walls.
The Netherlands
The useful floor area (measured internally) of a dwelling is the sum of the gross floor areas of the storeys of that dwelling at floor level, excluding: a) spaces which are used for professional
WP6: Overcoming delivery barriers 49/51
or business activities; b) spaces which were destined for dwelling purposes and for which a permit was granted for professional or business activities; c) the relative share of (floor area) of common spaces which can be attributed to the spaces meant under a. and b.; d) crawl space on the bottom side of the building; e) common spaces to the extent that these are not common spaces belonging to spaces of non-independent dwellings; f) garage(s) accessible or not accessible via the interior spaces of the dwelling; g) covered or not covered exterior spaces such as balconies, loggias and roof terraces; h) spaces with a clear height of less than 1.5 metre; i) storage spaces which are or are not accessible via interior spaces of the dwelling and to the extent they are not cupboards with a floor area of 1.5 m2 or less; j) ground base area of the walls which surround the dwelling.
Austria
The useful floor space is defined as the floor space of all rooms and kitchen(s). If buildings with only one dwelling are concerned, the useful floor space also measures the (entrance)hall and the stairways. Balconies and terraces as well as cellars and lofts are excluded, except when they are used for residential purposes. Rooms used for both residential and commercial purposes are included.
Portugal
The useful floor space is the floor space of dwellings measured inside the outer walls, excluding entrance halls, corridors, bathrooms and toilet rooms, cellars and other similar areas.
Finland
The floor space of a dwelling is located inside the walls enclosing the dwelling. It includes the space for ancillary facilities such as cloakrooms, bathrooms, hobby-rooms, fireplace rooms, indwelling saunas, wash and dressing rooms, and rooms used as offices, provided that they are used by the employees. The floor space of a dwelling excludes garages, cellars, saunas located in unfurnished basements, unheated storage spaces, balconies, porches, verandas, outer vestibules and non habitable attic-spaces.
Sweden
The useful floor space of a dwelling is defined as; the space in floors limited by insides of walls, which enclose each flat.
Luxembourg
Définition du recensement : La surface à indiquer est celle mesurée à l’intérieur des murs extérieurs, y compris cuisine, bain, toilettes, hall, mais à l’exclusion des caves et greniers (sauf si ces derniers ont été aménagés à des fins d’habitation).
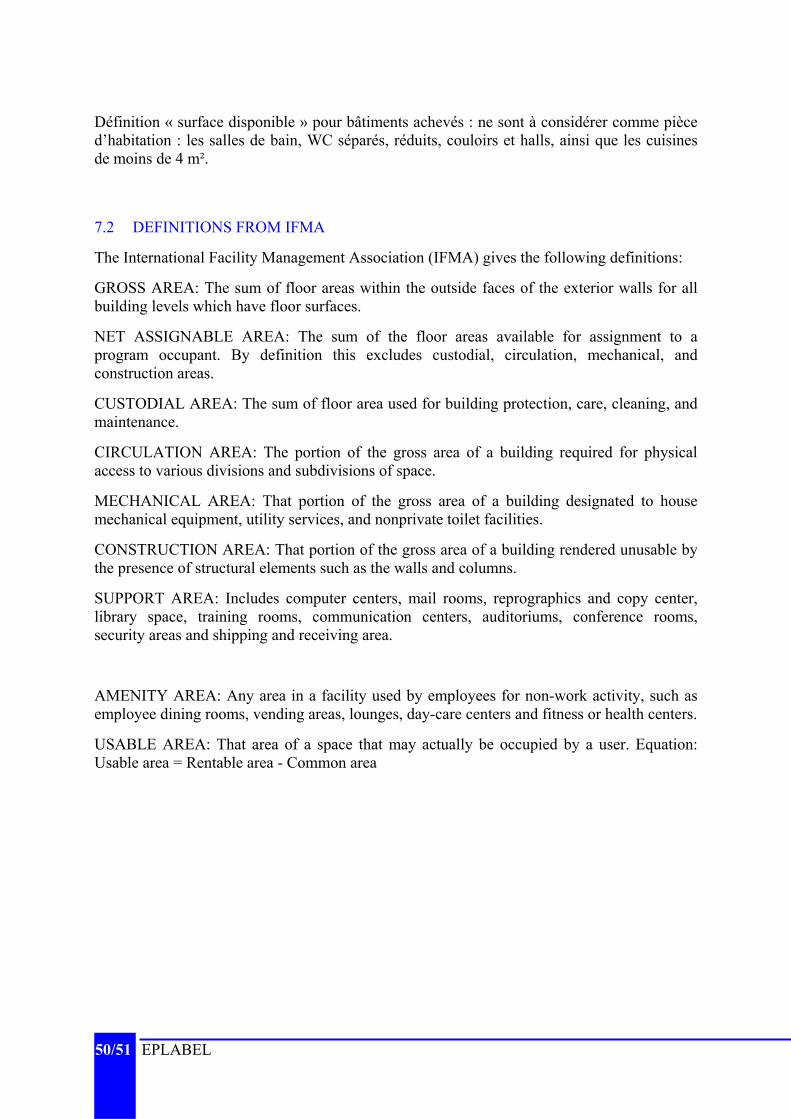
50/51 EPLABEL
Définition « surface disponible » pour bâtiments achevés : ne sont à considérer comme pièce d’habitation : les salles de bain, WC séparés, réduits, couloirs et halls, ainsi que les cuisines de moins de 4 m².
7.2 DEFINITIONS FROM IFMA
The International Facility Management Association (IFMA) gives the following definitions:
GROSS AREA: The sum of floor areas within the outside faces of the exterior walls for all building levels which have floor surfaces.
NET ASSIGNABLE AREA: The sum of the floor areas available for assignment to a program occupant. By definition this excludes custodial, circulation, mechanical, and construction areas.
CUSTODIAL AREA: The sum of floor area used for building protection, care, cleaning, and maintenance.
CIRCULATION AREA: The portion of the gross area of a building required for physical access to various divisions and subdivisions of space.
MECHANICAL AREA: That portion of the gross area of a building designated to house mechanical equipment, utility services, and nonprivate toilet facilities.
CONSTRUCTION AREA: That portion of the gross area of a building rendered unusable by the presence of structural elements such as the walls and columns.
SUPPORT AREA: Includes computer centers, mail rooms, reprographics and copy center, library space, training rooms, communication centers, auditoriums, conference rooms, security areas and shipping and receiving area.
AMENITY AREA: Any area in a facility used by employees for non-work activity, such as employee dining rooms, vending areas, lounges, day-care centers and fitness or health centers.
USABLE AREA: That area of a space that may actually be occupied by a user. Equation: Usable area = Rentable area - Common area

WP6: Overcoming delivery barriers 51/51
8 REFERENCES
[1] CEN, prEN 15203 – Energy performance of buildings - Assessment of energy use and definition of ratings, March 2005.
[2] CEN, prEN 15217 – Energy performance of buildings - Methods for expressing energy performance and for energy certification of buildings, March 2005.
[3] CEN, prEN ISO 15927-6: Accumulated temperature differences for assessing energy use in space heating, 2004.
[4] Santamouris M. (editor), Energy Performance of residential buildings – A practical guide for energy rating and efficiency, James & James/Earthscan, 2005.
A series of European standards (and draft standards), EN ISO 15927, Hygrothermal performance of buildings – Calculation and presentation of climatic data, specify methods for analysing meteorological data for use in the evaluation of the energy and moisture performance of buildings. • EN ISO 15927-1: Monthly and annual means of single meteorological elements • EN ISO 15927-2: Data for design cooling loads and risk of overheating • EN ISO 15927-3: Calculation of a driving rain index for vertical surfaces from hourly
wind and rain data • EN ISO 15927-4: Data for assessing the annual energy for heating and cooling • EN ISO 15927-5: Winter external design air temperatures and related wind data • EN ISO 15927-6: Accumulated temperature differences for assessing energy use in space
heating

![Extension of 2D FEniCS implementation of Cosserat non ... · The objective of the internship is the extension of the existing 2D FEniCS implementation of Cosserat elasticity [9] to](https://static.fdocuments.fr/doc/165x107/604d6997ec52f606395b1501/extension-of-2d-fenics-implementation-of-cosserat-non-the-objective-of-the-internship.jpg)