CORRELATION BETWEEN CELL CYCLE AND CALCIUM … · Alexandra Kulangara for her explanation on...
135
THÈSE N O 2829 (2003) ÉCOLE POLYTECHNIQUE FÉDÉRALE DE LAUSANNE PRÉSENTÉE À LA FACULTÉ SCIENCES DE BASE Institut de sciences des procédés chimiques et biologiques SECTION DE CHIMIE ET GÉNIE CHIMIQUE POUR L'OBTENTION DU GRADE DE DOCTEUR ÈS SCIENCES PAR diplôme en biochimie, Université de Genève de nationalité suisse et originaire de Saint-Oyens (VD) acceptée sur proposition du jury: Prof. F. Wurm, directeur de thèse Dr H. Amstutz, rapporteur Dr I. W. Marison, rapporteur Dr C. Vallan, rapporteur Lausanne, EPFL 2003 CORRELATION BETWEEN CELL CYCLE AND CALCIUM PHOSPHATE TRANSIENT TRANSFECTION OF CHO CELLS Frédéric GROSJEAN
Transcript of CORRELATION BETWEEN CELL CYCLE AND CALCIUM … · Alexandra Kulangara for her explanation on...

THÈSE NO 2829 (2003)
ÉCOLE POLYTECHNIQUE FÉDÉRALE DE LAUSANNE
PRÉSENTÉE À LA FACULTÉ SCIENCES DE BASE
Institut de sciences des procédés chimiques et biologiques
SECTION DE CHIMIE ET GÉNIE CHIMIQUE
POUR L'OBTENTION DU GRADE DE DOCTEUR ÈS SCIENCES
PAR
diplôme en biochimie, Université de Genèvede nationalité suisse et originaire de Saint-Oyens (VD)
acceptée sur proposition du jury:
Prof. F. Wurm, directeur de thèseDr H. Amstutz, rapporteur
Dr I. W. Marison, rapporteurDr C. Vallan, rapporteur
Lausanne, EPFL2003
CORRELATION BETWEEN CELL CYCLE AND CALCIUM PHOSPHATE TRANSIENT TRANSFECTION OF CHO CELLS
Frédéric GROSJEAN

- 2 -

In memory of Dr. Pascal Batard
- 3 -

- 4 -
Acknowledgements
This work was done in the Laboratory of Cellular Biotechnology (LBTC) at the Swiss Federal
Institute of Technology in Lausanne from January 2000 to May 2003, with financial supports
from ZLB Bioplasma AG in Bern.
I would like to thank the following persons for their precious help and without whom this
work would probably not have been possible:
Professor Florian Maria Wurm for accepting me as a PhD student in his group, for letting me
follow really interesting seminars abroad during these three years, for constructive discussions
about the analysis of my data.
Professor Claude Friedly, Dr. Hanspeter Amstutz, Dr. Ian Marison and Dr. Claudio Vallan for
evaluating this work and for being part of my thesis jury.
Dr. Pascal Batard, without him nothing would have been possible, for all the time we spent
together behind the flow cytometer, for all the explanations about flow cytometry and how to
align the machine and analyze samples. For the long evenings spent realigning the optic with
me when the laser was changed, for the samples he ran on his Vantage for me while our flow
cytometer was broken, for being such a nice and interesting person. Rest in peace, Pascal!
ZLB Bioplasma AG in Bern for their financial support of my work.
Dr. Sylviane Picasso and Dr. Raymond Jacquet for being such a nice office colleagues, for all
the time they spent proofreading this thesis, for their precious ideas and help in our
“brainstorming” sessions and protocol developments.
Dr. Martin Jordan for our long and constructive discussions, for his ideas, for letting me work
with his prototypes of mini-PCV tubes and for the time spent proofreading this thesis.
Dr. David Hacker for his more than precious help with English grammar and vocabulary! For
his excellent musical tastes and for being such a nice person.
- 5 -
Dr. Maria De Jesus, for teaching me the basic of cell culture and calcium phosphate
transfection.
Mr. Alain Wiedmer for his constant bonne humeur, for preparing all the cell culture media,
for taking care of the availability of clean glassware in the lab.
Sylvia Fabris and Monika Loperiol for their administrative support.
Alexandra Kulangara for her explanation on bacteria transformation and plasmid extraction.
Natalie Müller for being my StarBuck fellow and such a nice colleague.
Dr. Jason Wright for the fun we had in Spain, and for being himself.
Martin Bertschinger and Elisabeth Derow for our “Simpson’s Nights”, I hope we will have
more of those.
Dr. Lisa Hunt, Maja Vukicevic, Jeanette Lindell, Keyvan Iglesias, Hicham El Abridi,
Frédéric Van Thilborg, Madiha Derouazi, Sting Chabanel, Luisa Schneider, Patricia Tromba,
Milena Bava, Ilda Tabuas Baieta Muller, Michaela Bouregois, Dr. Philippe Girard, Dr. Lucia
Baldi and whoever I may have forgotten in our lab, for their help, their constructive remarks
during our group meetings, their smile and their everyday good mood.
Dr. Arnaud Desponds, Dr. Roberto Giovannini, Kevin O'Mahony, Matteo Costioli, Stephane
Canarelli, Dr. Igor Fisch, Manuel Bueno, Dr. David Calabrese, Yves Dusserre, Dr. Pierre-
Alain Girod, and all the other members of the CBUE for our coffee sessions, our discussions
during the big group meetings and for being really nice and helpful.
Dr. Horst Pick for his help with co-focal microscopy.
Mr. Franco Villa from Carl Zeiss AG for his help with microscopy.
All the members of the Swiss-DVD forum for all the fun we have, the home cinema sessions
and our meetings.
- 6 -
Cyril Van Der Haegen, Erik Bussink, Olivier Boudry, Paul Rebmann and Christopher
Bonnard for being such good friends. We definitely have to see each other more often.
My parents for their precious help and for always being here when I need them.
My sister, her husband and my brand new niece for their joie de vivre.
Solange Cuenin for her love, for sharing my ups and downs, for taking care of so many things while I was writing this thesis and cheering me up when things did not go the way they should have. I love you!
- 7 -

- 8 -

Résumé
La transfection par la méthode du calcium phosphate est une méthode largement utilisée pour
produire des protéines recombinantes dans des cellules mammifères. Cependant, les
mécanismes impliqués dans le transfert de l’ADN plasmidique dans le noyau des cellules
transfectées sont encore mal compris et cela résulte en une grande variabilité de l’efficacité de
transfection. Le rôle du cycle cellulaire dans la transfection par la méthode du calcium
phosphate a donc été étudié en utilisant des cellules dérivées d’une lignée d’ovaire de hamster
(CHO) comme modèle.
Des cultures de cellules adhérentes ont été synchronisées à la frontière entre les phases G1 et
S grâce à l’utilisation de la mimosine. Une fois la drogue de synchronisation retirée, les
cellules ont été transfectées à différents moments suivant la réinitiation du cycle cellulaire
avec des plasmides exprimant soit la protéine fluorescente verte (EGFP) soit une protéine
fluorescente rouge (DsRedExpress). L’expression de ces protéines fluorescentes a été suivie
par fluorométrie ou par imagerie en temps réel et le cycle cellulaire a été analysé par
cytométrie en flux.
Il a été montré que le cycle cellulaire a des implications majeures au moins à deux niveaux.
La corrélation entre le pourcentage de cellules en phase S au moment de l’addition du
complexe de transfection et l’expression de gène rapporteur résultante a démontré que le
transfert efficace d’ADN exogène dans les cellules mammifères était dépendant du cycle
cellulaire. Un protocole de transfection plus rapide, développé pendant ce travail, a montré
que le moment optimal pour ajouter le complexe de transfection était dépendant du système
de transfection utilisé. D'autres investigations ont démontré que la mitose jouait un rôle clé,
sans doute dû à la rupture de la membrane nucléaire, pour fournir un accès aux molécules
d’ADN plasmidique dans l’environnement nucléaire.
Le choc glycérol réalisé à la fin de la transfection a montré qu’il jouait aussi un rôle important
pour le transfert efficace de gène rapporteur dans les noyaux. Ce choc osmotique important
résulte en une diminution du volume cellulaire d’environ 55%. Comme il n’y a pas de perte
de plasmide intracellulaire pendant ce choc, cela résulte en une augmentation significative de
leur concentration intracellulaire. Le choc glycérol doit être effectué pendant que les cellules
progressent à travers la mitose, probablement car la désagrégation de la membrane nucléaire
- 9 -

et l’augmentation de la concentration intracellulaire en plasmides facilitent l’accès à
l’environnement nucléaire.
La synergie entre le choc glycérol et les cellules progressant à travers la mitose était une
nécessité pour un transfert efficace de gènes rapporteurs dans les noyaux. De très faibles
niveaux d’expression de gènes rapporteurs ont été obtenus lorsque l’un ou l’autre de ces
événements était omis ou s’ils ne se produisaient pas au même moment.
Comme il a été montré que l’ADN plasmidique permettait une expression de gène rapporteur
efficace même après un délai de 45 minutes suivant leur internalisation par les cellules, il a été
possible de les transférer dans des sous-populations cellulaires additionnelles, lorsque celles-
ci passaient à travers la mitose, à l’aide de chocs glycérols supplémentaires. Ces chocs répétés
ont résulté en une augmentation de cellules positives parmi les populations transfectées.
En conclusion, les résultats obtenus pendant ce travail ont permis de définir un modèle
expliquant l’importance du cycle cellulaire dans la transfection par la méthode du calcium
phosphate, mettant en évidence la mitose et le choc glycérol comme des événements clé pour
le transfert de molécules d’ADN plasmidique dans les noyaux.
- 10 -
Abstract
Calcium phosphate transfection is a widely used method to produce recombinant proteins in
mammalian cells. However, the mechanisms involved in plasmid DNA transfer to the nucleus
of the transfected cells remain poorly understood and result in great variation of transfection
efficiency. The role of the cell cycle in transfection by the calcium phosphate method was
studied using Chinese Hamster Ovary (CHO) cells as a model system.
Adherent cell cultures were synchronized at the G1/S boundary using mimosine. At various
time points after the removal of the drug the cells were transfected with reporter plasmids that
expressed either the enhanced green fluorescent protein (EGFP) or a red fluorescent protein
(DsRedExpress). Fluorescent protein expression was monitored by fluorometry and live
imaging. Cell cycle was monitored by flow cytometry.
It was shown that the cell cycle had major implications on at least two levels. The correlation
between the percentage of cells in S phase at the time of transfection complex addition and
the resulting reporter gene expression demonstrated that efficient transfer of exogenous DNA
in mammalian cells was dependent on the cell cycle. A faster transfection protocol, developed
within this work, showed that the optimal timing for the transfection complex addition was
different depending on the transfection set-ups used. Further investigations demonstrated that
mitosis played a key role, probably due to the nuclear membrane disruption, to provide access
to the nuclear environment for the plasmid DNA molecules.
The glycerol shock performed at the end of the transfection was also shown to play an
important role for efficient transfer of reporter gene in nuclei. This strong osmotic shock
resulted in a cellular volume decrease of approximately 55%. As no intracellular plasmids
were lost during the process, this resulted in a significant increase in intracellular plasmid
concentration. Glycerol shock has to be performed while cells proceed through mitosis. The
nuclear membrane disruption and the increasing intracellular plasmid concentration probably
facilitate the access to the nuclear environment.
- 11 -

The synergy of glycerol shock and cells proceeding through mitosis was a requirement for
efficient reporter gene transfer in the nuclei. If one of those two was omitted, or if they did not
happened at the same time, very low reporter gene expression levels were achieved.
As it was found that plasmid DNA was driving reporter gene expression even after a delay of
45 minutes post cellular uptake, it was possible to efficiently target additional sub-populations
of cells as they proceeded through mitosis with additional glycerol shocks. Those repetitive
glycerol shocks resulted in an increase of positive cells among the transfected populations.
In conclusion, the results obtained in this work permitted to define a model explaining the
importance of the cell cycle in the calcium phosphate transfection, highlighting mitosis and
glycerol shock as key events in plasmid DNA molecules transfer to the nucleus.
- 12 -
Table of content
Acknowledgements _________________________________________________ 4
Résumé ___________________________________________________________ 8
Abstract__________________________________________________________ 11
Table of content ___________________________________________________ 13
Aim of this work ___________________________________________________ 17
Introduction ______________________________________________________ 19
1. Calcium phosphate transfection _________________________________________ 20
1.1 Transient transfection ________________________________________________ 25
1.2 Green Fluorescent Protein (GFP) as reporter gene __________________________ 27
1.3 CHO DG44 cells in biotechnology ______________________________________ 28
2. Cell cycle_____________________________________________________________ 30
2.1 Study of the cell cycle ________________________________________________ 32
2.1.1 Growth rate_____________________________________________________ 32
2.1.2 Microscopic analysis _____________________________________________ 33
2.1.3 Analysis by flow cytometry ________________________________________ 33
2.1.4 DNA stains _____________________________________________________ 34
2.2 Cell synchronization _________________________________________________ 36
2.2.1 Chemical synchronization _________________________________________ 37
2.2.2 Non-chemical synchronization______________________________________ 38
2.2.3 Disadvantages of synchronization ___________________________________ 40
- 13 -

3. Tools for Analysis _____________________________________________________ 41
3.1 Flow Cytometry_____________________________________________________ 41
3.1.1 Set-up _________________________________________________________ 41
3.1.2 Advantages_____________________________________________________ 46
3.1.3 Disadvantages___________________________________________________ 46
3.2 Live imaging _______________________________________________________ 47
3.2.1 Set-up _________________________________________________________ 47
3.2.2 Advantages_____________________________________________________ 48
3.2.3 Disadvantages___________________________________________________ 49
Experiments, results and discussion__________________________________ 51
4. Materials and Methods _________________________________________________ 52
4.1 Plasmid preparation__________________________________________________ 53
4.2 Cell culture ________________________________________________________ 53
4.3 Cell number measurement_____________________________________________ 54
4.3.1 Manual counting_________________________________________________ 54
4.3.2 Automated counting ______________________________________________ 54
4.4 Viability assessment _________________________________________________ 54
4.5 Cell volume measurement_____________________________________________ 55
4.6 Cell synchronization _________________________________________________ 55
4.6.1 Chemical synchronization _________________________________________ 55
4.6.3 Non-chemical synchronization______________________________________ 56
4.7 Cell cycle analysis___________________________________________________ 56
4.7.1 Cell fixation and staining __________________________________________ 56
4.7.2 Flow cytometry analysis___________________________________________ 57
4.8 Calcium phosphate transfection ________________________________________ 57
4.8.1 Classical transfection protocol ______________________________________ 57
4.8.2 Fast transfection protocol__________________________________________ 58
4.9 Reporter gene detection and relative quantification _________________________ 58
4.9.1 Fluorescent microscopy ___________________________________________ 58
4.9.2 Fluorometry ____________________________________________________ 59
4.9.3 Flow cytometry _________________________________________________ 59
- 14 -
5. Calcium phosphate transient transfection efficiency is cell cycle related ________ 60
5.1 Calcium phosphate transfection is S phase-related __________________________ 63
5.2 A faster transfection protocol as a novel tool ______________________________ 66
5.3 Transfection efficiency is shifted with a faster transfection protocol ____________ 70
6. Live imaging__________________________________________________________ 72
6.1 The fate of calcium phosphate precipitate post glycerol shock ________________ 73
6.2 Importance of mitosis ________________________________________________ 75
6.3 Occurrence of positive cells appearing with time ___________________________ 76
6.4 Transgene expression affects cell growth _________________________________ 78
7. Additional EGTA wash-step ____________________________________________ 81
7.1 EGTA treatment does not affect viability or growth rate _____________________ 82
7.2 EGTA wash-step increases overall expression _____________________________ 83
8. Role of glycerol shock __________________________________________________ 85
8.1 Visual effect of glycerol on cells________________________________________ 85
8.2 Osmolarity effect of glycerol __________________________________________ 86
8.3 Quantifying the size change upon glycerol shock___________________________ 88
8.3.1 Flow cytometry approach__________________________________________ 89
8.3.2 CASY approach _________________________________________________ 90
8.3.3 PCV approach __________________________________________________ 91
9. Osmotic shocks with different solutions ___________________________________ 94
9.1 Effect of osmotic shock on cellular volume _______________________________ 95
9.2 Effect of osmotic shock on reporter gene expression ________________________ 97
10. Intracellular plasmid residence time for efficient reporter gene expression_____ 99
- 15 -
11. Possibilities to target more cells during transfection _______________________ 100
11.1 Multiple transfections ______________________________________________ 103
11.2 Repetitive osmotic shocks___________________________________________ 105
12. Cell cycle related model for calcium phosphate transfection ________________ 109
Conclusion ______________________________________________________ 115
Perspectives_____________________________________________________ 121
Bibliography _____________________________________________________ 125
Curriculum Vitae _________________________________________________ 132
- 16 -

Aim of this work Various methods exist to transfect mammalian cells in culture. It is generally accepted that
individual methods have to be optimised for each of the cell lines or cell types used. Despite
the fact that calcium phosphate transfection is widely used, many questions remain about its
mode of action. Repetitive transfections in apparently identical conditions may results in
significant day-to-day variation efficiency, despite the use of optimised protocols.
Some parameters can be controlled such as the cell density, the pH of the medium, the pH of
the transfection solution or the incubation time in presence of the precipitate. But many
parameters are difficult to control such as levels of plasmid uptake, calcium phosphate DNA
complex morphology and internal plasmid degradation in the transfected populations. All
those parameters play an important role in efficient transfer of plasmid DNA into nuclei of
host cells.
Studying the cell cycle implication in transient transfection with two powerful methods (flow
cytometry and live imaging) provided ways to better understand the mechanisms implicated
in the transfer of plasmid DNA in the nuclei of transfected cells and tentatively fill gaps
present in previous models.
This also has implications for stable cell lines production, as stable integration is a random
event within the transfected cell population. If phenomena leading to transient transfection are
better controlled, the efficiency of stable transfections may be improved as well.
A better understanding of the calcium phosphate transfection is expected to result in a more
efficient ratio between plasmid DNA input and recombinant protein output.
- 17 -

- 18 -

Introduction
- 19 -

- 20 -
1. Calcium phosphate transfection By definition, transfection is the introduction of a foreign DNA molecule into a eukaryotic
cell and the subsequent expression of one or more genes in the transfected cell (Alberts et al.,
1994). Many different chemical agents that facilitate transfection are commercially available.
Calcium phosphate-DNA coprecipitation was first described in 1973 and is one of the most
widely used transfection methods (Graham and van der Eb, 1973). It works with many
different cell lines, and it is simple and cost effective. During calcium phosphate transfection,
DNA is complexed with calcium and phosphate to form small insoluble particles that can be
endocytosed by cells (Loyter et al., 1982a; Orrantia and Chang, 1990). The DNA is released
into the cytoplasm by an unknown mechanism and eventually ends up in the cell nucleus
where it is transcribed. Movement of plasmid DNA from the cytoplasm to the nucleus
probably occurs by diffusion, a slow process during which it may be degraded by DNases
(Loyter et al., 1982b).
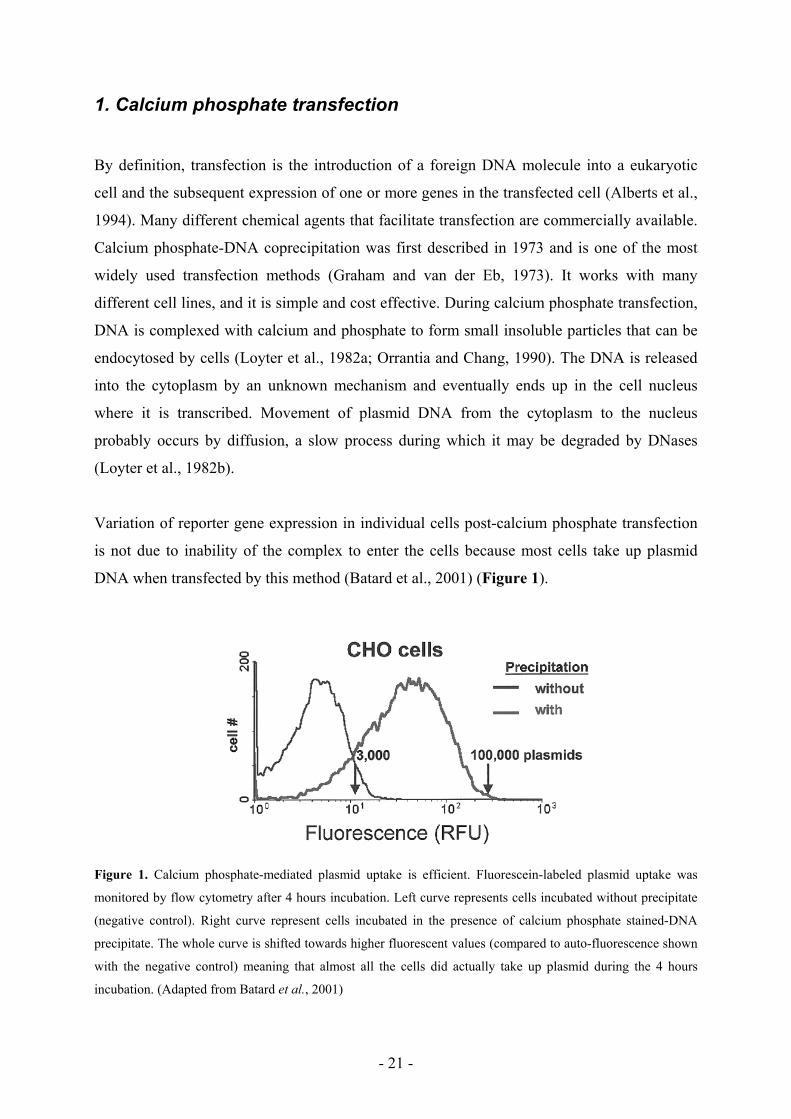
Variation of reporter gene expression in individual cells post-calcium phosphate transfection
is not due to inability of the complex to enter the cells because most cells take up plasmid
DNA when transfected by this method (Batard et al., 2001) (Figure 1).
Figure 1. Calcium phosphate-mediated plasmid uptake is efficient. Fluorescein-labeled plasmid uptake was
monitored by flow cytometry after 4 hours incubation. Left curve represents cells incubated without precipitate
(negative control). Right curve represent cells incubated in the presence of calcium phosphate stained-DNA
precipitate. The whole curve is shifted towards higher fluorescent values (compared to auto-fluorescence shown
with the negative control) meaning that almost all the cells did actually take up plasmid during the 4 hours
incubation. (Adapted from Batard et al., 2001)
- 21 -
The time period of calcium phosphate-DNA coprecipitation prior to addition to cultured cells
is an important parameter for efficient transfection (Jordan et al., 1996; O'Mahoney and
Adams, 1994; Wake et al., 1984). Efficient transfection is also highly dependent on the pH of
the calcium phosphate solution (Loyter et al., 1982a). The optimal pH ranges from 7.1 to 7.5.
A higher pH results in the formation of large calcium phosphate complexes that do not enter
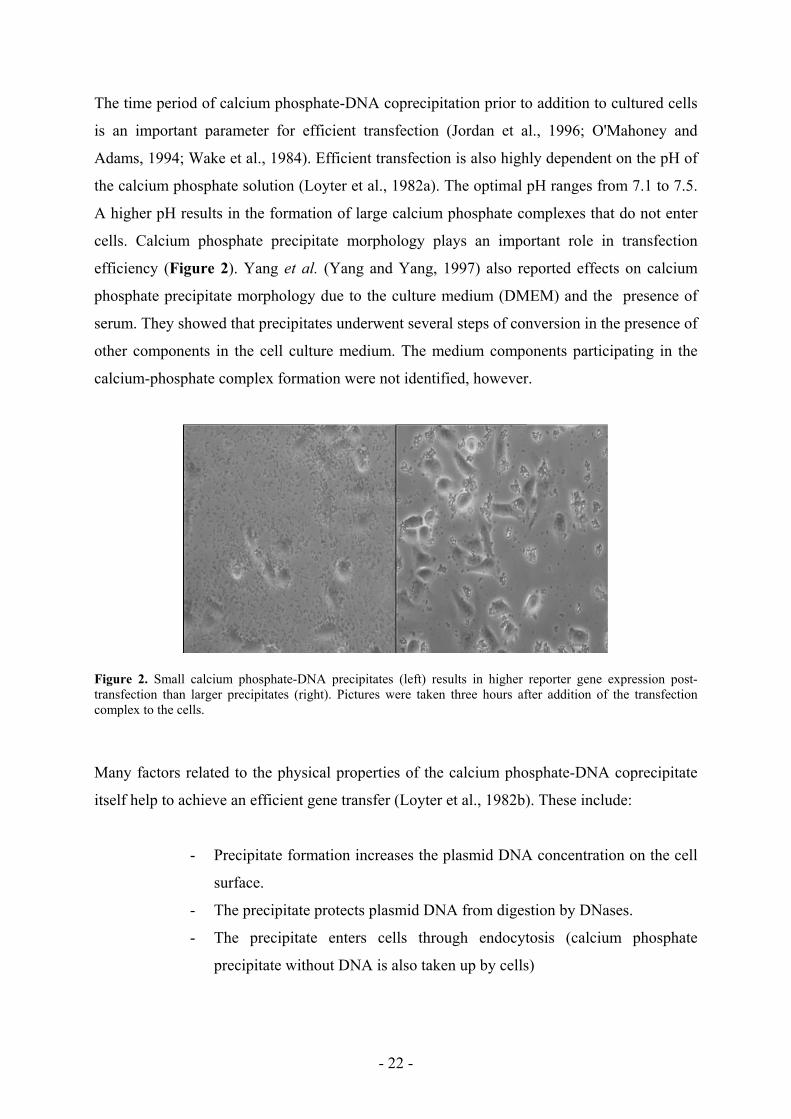
cells. Calcium phosphate precipitate morphology plays an important role in transfection
efficiency (Figure 2). Yang et al. (Yang and Yang, 1997) also reported effects on calcium
phosphate precipitate morphology due to the culture medium (DMEM) and the presence of
serum. They showed that precipitates underwent several steps of conversion in the presence of
other components in the cell culture medium. The medium components participating in the
calcium-phosphate complex formation were not identified, however.
Figure 2. Small calcium phosphate-DNA precipitates (left) results in higher reporter gene expression post-transfection than larger precipitates (right). Pictures were taken three hours after addition of the transfection complex to the cells.
Many factors related to the physical properties of the calcium phosphate-DNA coprecipitate
itself help to achieve an efficient gene transfer (Loyter et al., 1982b). These include:
- Precipitate formation increases the plasmid DNA concentration on the cell
surface.
- The precipitate protects plasmid DNA from digestion by DNases.
- The precipitate enters cells through endocytosis (calcium phosphate
precipitate without DNA is also taken up by cells)
- 22 -

- Electron microscopic data showed that the entire calcium phosphate DNA
complex enters the cell and the nucleus
It is not the concentration of plasmid DNA on the cell surface that affects the level of plasmid
uptake, but more likely the morphology of the calcium phosphate-DNA coprecipitate.
Precipitate formation in presence of high plasmid DNA concentration results in inefficient
precipitate uptake (Loyter et al., 1982b). Calcium phosphate alone also enter cells, suggesting
the absence of a system on the membrane surface facilitating the entry of DNA into a cell
(Loyter et al., 1982a). Controlled cells incubated in the absence of calcium phosphate
precipitate had much less endocytotic vesicles as compared with the cells exposed to the
precipitate (Loyter et al., 1982a).
Calcium phosphate may play a role in escape of DNA from endosomes. In vitro studies have
demonstrated that it promotes fusion between biological membranes and phospholipid
barriers (Fraley et al., 1980; Zakai et al., 1977). Within cells it may cause local solubilization
of endosomal membrane allowing passage of plasmid DNA into the cytoplasm. Plasmid DNA
was shown to access the nucleus still complexed with calcium phosphate (Loyter et al.,
1982a). Using DAPI-stained plasmid DNA, the same authors also shown that the first signal
of plasmid DNA inside the cell occurred after 2 hours of exposure to calcium phosphate-DNA
complexes and increased for the next 8 hours. All exposed cells ended up with internalized
calcium phosphate-DNA complexes in the cytoplasm, but only a few of them had detectable
transfection complexes in the nucleus. It appeared that most of the calcium phosphate-DNA
complexes present in the endocytotic vesicles were eliminated by exocytosis (Loyter et al.,
1982a).
Movement of the coprecipitate complexes from the cytoplasm to the nucleus and their entry
into the nucleus are the most significant barriers to gene transfer. It was shown that
transfected cultures transferred less than 10% of internalized plasmid DNA into nuclei
(Orrantia and Chang, 1990). Another 20% was recovered in the plasma membrane fraction as
well as in the vesicular organelles fraction, and 50% was recovered from cytosolic fractions
but was completely degraded into oligonucleotides of less than 100 base pairs. Intact plasmids
as well as small DNA fragments were found in the nuclei; organelles fractions were enriched
with intact plasmids and contained very little small fragments. These observations were
confirmed by Lechardeur et al. (Lechardeur et al., 1999) who showed that plasmid DNA, both
- 23 -

single-stranded and double-stranded, has a half-life of approximately 50 – 90 minutes in the
cytoplasm where it quickly got degraded by nucleases. The instability of plasmid DNA
caused by cytosolic nucleases constitutes an additional barrier to the efficient translocation to
the nucleus of the precipitate. These authors also showed that it was unlikely that lysosomal
nucleases were responsible for the rapid turnover of plasmid DNA because dissipation of the
acidic pH of the lysosomes with ammonium chloride or chloroquine did not delay the
degradation of injected DNA (Lechardeur et al., 1999).
It was also shown that diffusion of free DNA from the cytoplasm to the nucleus is a very
inefficient process (Capecchi, 1980). Therefore, transport to the nucleus of free DNA would
be rather long, risking degradation by nucleases. One can assume therefore that most of the
plasmid DNA in the cell is not in the form of free DNA but rather complexed with calcium
phosphate, the latter providing protection against nucleases. Nuclear entry has been reported
to be a major limiting step in non-viral gene transfer ((Dowty et al., 1995; Escriou et al., 1998;
Mirzayans et al., 1992; Zabner et al., 1995). Plasmid size also plays a role in its intracellular
diffusion following microinjection into the cytoplasm (Neves et al., 1999). Large plasmid
(7Kbp) did not readily diffuse in the cytoplasm and remained at the site of injection. The low
diffusion rate of plasmid and its degradation in the cytoplasm may be two of the most
important factors limiting non-viral gene transfer efficiency (Lechardeur et al., 1999; Pollard
et al., 1998).
Other obstacles to nuclear accumulation include slow internalization process of transfection
complex in the cells, entrapment of plasmid DNA in the endolysosomal compartment,
diffusion inside the cytoplasm and nuclear envelope barrier (Capecchi, 1980; Ciftci and Levy,
2001; Coonrod et al., 1997; Loyter et al., 1982a; Loyter et al., 1982b; Neves et al., 1999;
Pouton and Seymour, 1998).
Orrantia et al. (Orrantia and Chang, 1990) hypothesized that plasmid DNA does not pass
through the cytosol before it enters the nucleus but is transported directly from the
endosomes-lysosomes to the nucleus through an intermediary vesicle (Figure 3). They
demonstrated that inhibitors of lysosomal functions increased the efficiency of calcium
phosphate DNA delivery to the nucleus, presumably by inhibiting lysosomal degradation of
internalized plasmid DNA.
- 24 -

Other authors reported that plasmid DNA is released from vesicles before nuclear entry
(Lechardeur et al., 1999). Small linear DNA (<1 Kbp) can enter the nucleus through the
nuclear pore complex (NPC), but larger DNA (>1 Kbp) can not diffuse through the NPC and
remains in the cytoplasm and thus requires an alternative route into the nucleus (Hagstrom et
al., 1997)
Figure 3. Proposed model for transport of calcium phosphate DNA complex to the nucleus (Adapted from Orrantia et al. (Orrantia and Chang, 1990)).
Liberation of plasmid DNA from the transfection complex must occur within the nucleus
before transcription can proceed. If the precipitate is too stable then no, or very little,
transcription will occur; if it is not stable enough then degradation will occur before the
plasmid DNA reaches the nucleus (Luo and Saltzman, 2000b).
1.1 Transient transfection
The goal of transient transfection is to introduce foreign DNA into an entire population of
host cells in order to transiently produce a recombinant protein without having to isolate a
stable cell line (Wurm and Bernard, 1999). Therefore, this approach does not require the long
selection, amplification and cloning procedures necessary to achieve a high producing stable
cell line. Plasmid DNA is transfected into the host cells and the recombinant protein is
- 25 -

expressed for a few days. The plasmid DNA is then either degraded or diluted among each
new generation of daughter cells, and the recombinant gene expression eventually diminishes.
Both intracellular and secreted proteins have been expressed in this way. Transient
transfection is not only a rapid tool to investigate the biological properties of a given
recombinant protein, but it has also been used to produce recombinant protein at large scale
(Girard et al., 2002). One drawback of this method is the need for large amounts of plasmid
DNA especially when used in cell culture volumes of tens or hundreds of liters. Often,
transient transfection is performed using the cost effective calcium phosphate-DNA
coprecipitation method. A better understanding of the calcium phosphate transfection is
expected to result in a more efficient ratio between plasmid DNA input and recombinant
protein output.
Many different approaches can be considered to improve reporter gene expression in transient
transfection. The recombinant gene can be codon optimized for the respective host cell
system. Secondly, different eukaryotic promoters have differing strengths in any particular
mammalian cell line (Ray and Gage, 1992; Wenger et al., 1994) (Table 1).
Table 1. Promoter strength in CHO cells
Relative promoter strength in CHO cells CMV 643 RSV 71 SV40 100
(Adapted from Invitrogen Life Technologies informative poster)
Transient transfection also depends on the transfection method. Many different transfection
reagents exist which yield different transfection efficiencies depending on the cell line
transfected. Calcium phosphate is relatively cost effective as compared to other methods
(Table 2). This method works with many different cell lines and in different systems
(adherent cells, cells in suspension, small and large scale cultures) (Girard et al., 2002).
- 26 -

Table 2. Cost comparison for different transfection reagents (cost for a transfection
in a one milliliter volume) (Adapted from (Girard, 2001))
Transfection reagent Cost per well [CHF/ml] CalPhos Max 0.1 CaPi 0.01 CLONfectinTM 1.23 DOSPER 1.22 DOTAP 0.66 FugeneTM 1.55 LipofectAMINETM 2.79 PEI 0.01 SuperfectTM 1.24 Transfectam® 3.00
The condition of the cultured cells is another important parameter for transient gene
expression. Not every cell in a transfected population will efficiently take up plasmid and/or
support the movement of the plasmid into the nucleus. In this work it is shown that the cell
cycle plays a crucial role in the efficient nuclear uptake of plasmid in CHO cells using
calcium phosphate as a transfection agent.
1.2 Green Fluorescent Protein (GFP) as reporter gene
The green fluorescent protein (GFP) was isolated from Aequorea victoria (Shimomura et al.,
1962). It is widely used as a reporter protein in gene expression studies since it can be easily
detected using fluorescent microscopy in a non-invasive manner. Measurement of the
transfected cells can be repeated as often as required, and the GFP level can be measured
quickly by fluorometry (CytoFluor 4000) or by flow cytometry.
Many different variants of GFP are commercially available. Most of them are modified
versions of wild-type GFP (wtGFP) with either a stronger emission signal in mammalian
cells, as for the enhanced GFP (EGFP), or with fluorescence emissions of different
wavelengths such as the enhanced blue (EBFP), enhanced cyan (ECFP) and enhanced yellow
(EYFP) fluorescent proteins (Table 3). EGFP has 35 times the intensity of wtGFP (Clontech,
Living ColorsTM User Manual). Its excitation wavelength of 488nm makes it particularly
interesting, since most flow cytometers are equipped with a 488nm laser.
- 27 -

A fluorescent protein that shifts from green fluorescence when initially expressed to red
fluorescence when fully maturated has also been reported (Terskikh et al., 2000). Another
family of fluorescent molecules has been isolated from Discosoma sp and provides a red
shifted variant of GFP called DsRed (Matz et al., 1999). DsRedExpress, a variant of DsRed, is
similar to EGFP. The resulting fluorescent proteins are in both cases intracellular. They have
a comparable maturation rate, and one can be detected as quickly as the other. DsRedExpres
has spectral properties (Table 3) that are ideal for dual-color experiments with EGFP (Bevis
and Glick, 2002).
Table 3. Excitation and emission maxima for different variants of GFP
Excitation maxima Emission maxima wtGFP 395 nm 508 nm EGFP 488 nm 507 nm EBFP 380 nm 440 nm ECFP 433 nm 475 nm EYFP 513 nm 527 nm DsRed 557 nm 579 nm
(source: www.clontech.com)
1.3 CHO DG44 cells in biotechnology
Animal cell lines are widely used for the production of recombinant proteins such as
hormones, enzymes, antibodies and vaccines. Animal cells are generally capable of secreting
functional proteins that are correctly folded and are biological active. For drug development,
the recombinant protein may require a human glycosylation profile if biological activity is
necessary in the patient. Mammalian cells have the advantage over plant, insect, and
prokaryotic cells, because they often provide such post-translational modifications.
The Chinese Hamster Ovary is popular for expression of recombinant proteins as its
glycosylation machinery resembles that found in human cells (Jenkins and Curling, 1994).
CHO cells are well characterized, stable, and able to produce proteins efficiently.
The CHO DG44 cell line lacks the enzyme dihydrofolate reductase (DHFR) and thus needs to
be provided with both hypoxanthine and thymidine (Urlaub et al., 1986). If the cells are
- 28 -

transfected with a plasmid vector that encodes the DHFR gene, only transfected cells will
actively grow in the absence of hypoxanthine and thymidine.
- 29 -

- 30 -
2. Cell cycle
Each new cell originates from another cell by a process called cell division. The dividing cell
is called the mother cell and the two cells issued from the division are called the daughter
cells. The mother cell transmits its genetic information to the two daughter cells. Each new
cell division corresponds to a new cell cycle. Cells going through the actual division process
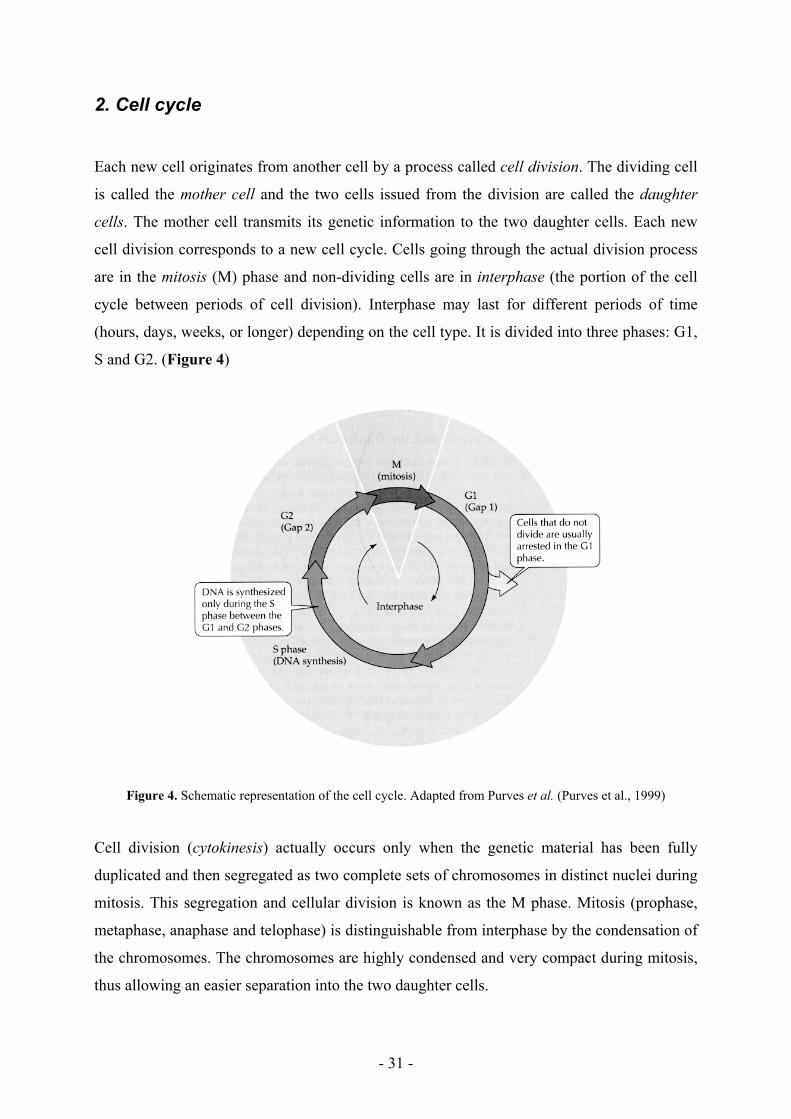
are in the mitosis (M) phase and non-dividing cells are in interphase (the portion of the cell
cycle between periods of cell division). Interphase may last for different periods of time
(hours, days, weeks, or longer) depending on the cell type. It is divided into three phases: G1,
S and G2. (Figure 4)
Figure 4. Schematic representation of the cell cycle. Adapted from Purves et al. (Purves et al., 1999)
Cell division (cytokinesis) actually occurs only when the genetic material has been fully
duplicated and then segregated as two complete sets of chromosomes in distinct nuclei during
mitosis. This segregation and cellular division is known as the M phase. Mitosis (prophase,
metaphase, anaphase and telophase) is distinguishable from interphase by the condensation of
the chromosomes. The chromosomes are highly condensed and very compact during mitosis,
thus allowing an easier separation into the two daughter cells.
- 31 -

To provide a complete set of genetic material for each of its two daughter cells, the genetic
information of the mother cell has to be duplicated, resulting in a cell with twice the normal
amount of DNA. This duplication of the genome is performed during the synthesis (S) phase.
Once mitosis has occurred, the two daughter cells each have a full copy of the DNA
duplicated during the S phase. The S phase and mitosis are separated by the G2 phase where a
checkpoint for completed DNA synthesis occurs. Mitosis and the S phase are separated by the
G1 phase in which a checkpoint for DNA damage occurs.
Cells can reversibly enter a resting phase (G0) during G1 phase, if environmental conditions
are not sufficient for growth and division. Under the appropriate conditions, cells resting in
G0 will proceed through G1 phase.
2.1 Study of the cell cycle
Different approaches exist to study the cell cycle such as monitoring the cell concentration
with time or visually following cells under a microscope. The use of specific stains, combined
with flow cytometry, provides various means of estimation of cellular growth, as well as
determination of doubling time and of percentage of cells present in the different phases of the
cell cycle.
2.1.1 Growth rate
Following the cell growth of a culture (number of cells per milliliter as a function of time) is
the simplest way to determine the average length of a cell cycle in a population. With every
starting cell culture, there will be a lag phase in which little cell growth occurs. Cells will then
grow and divide in an exponential manner until they reach a plateau phase where growth is
inhibited. This may be due to a high cell density or a lack of one or more essential nutrients.
By plotting the log of cell concentration versus time and then calculating the slope of the
curve during the exponential growth phase, the growth rate factor (µ) is determined. The
doubling time (i.e. the average cell cycle duration of the population, tD) can be calculated
from the growth rate factor using the following formula:
tD = ln2/µ
- 32 -

2.1.2 Microscopic analysis
In adherent cultures, only two types of cells can be distinguished from one another
microscopically without the use of chemical stains: actively dividing and non-dividing cells.
Cells tend to spread once they adhere to the cultivation vessel. Upon reaching mitosis they
round up, detach and eventually (in most case) divide into two cells that subsequently settle
down and adhere to the surface of the culture vessel and spread. Cell division occurs in a
rapid time frame (30-60 minutes from rounding to actual division). Cell cycle duration can be
determined, on a cell-by-cell basis by calculating the time between two successive mitotic
events.
2.1.3 Analysis by flow cytometry
The DNA content of a cell increases during S phase from 2n to 4n (Figure 5). It is possible,
using specific fluorescent DNA stains such as DAPI (4’, 6-diamidino-2-phenylindole), to
quantify the relative amount of DNA in each cell of a population using flow cytometry. The
result is a cell cycle profile of the analyzed population, a histogram reflecting the distribution
of cells according to their DNA content (Figure 6). Cells with 4n DNA (G2 and M) will have
twice the fluorescent signal than cells with 2n DNA (G1). Cells actively duplicating their
DNA will have a fluorescent signal that falls in between those for 2n and 4n. The x-axis of the
histogram represents the relative fluorescence measured per cell, and the y-axis indicates the
number of cells with such fluorescence. The x-axis is divided into channels corresponding to
an identical amount of detection window for increasing fluorescence intensity.
G1 S MG2
2n
4n
Figure 5. Schematic representation of DNA content per cell during cell cycle.
- 33 -
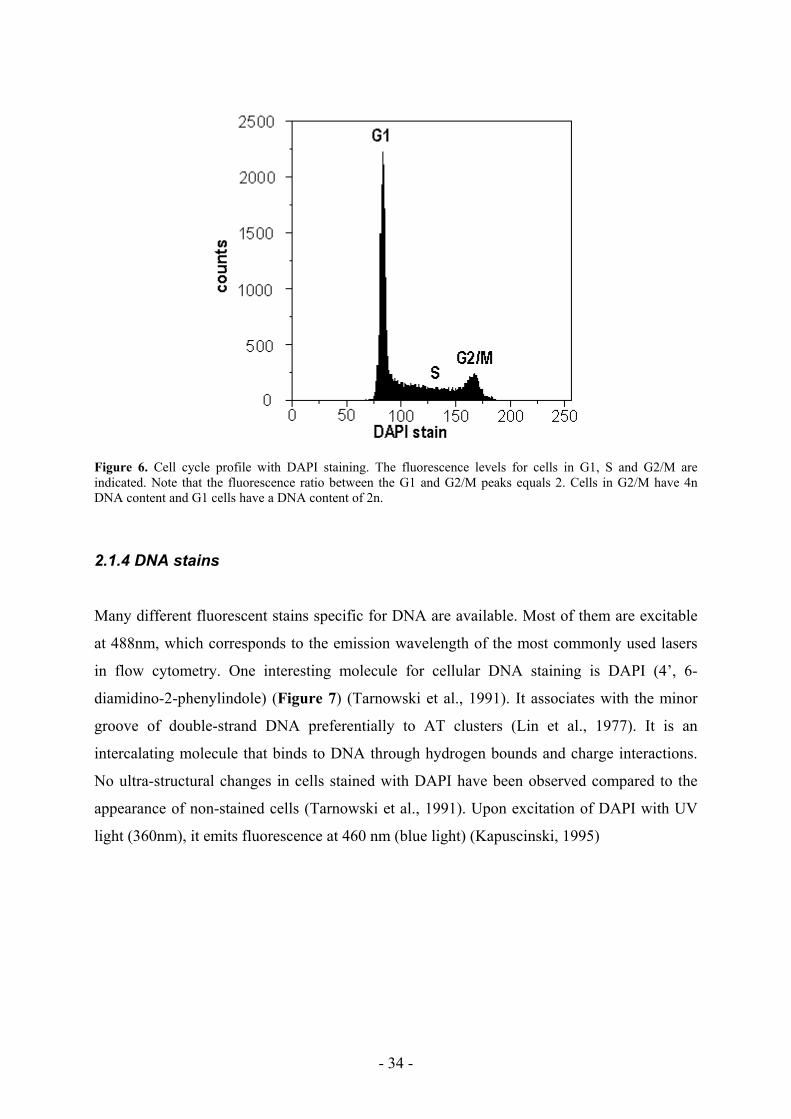
Figure 6. Cell cycle profile with DAPI staining. The fluorescence levels for cells in G1, S and G2/M are indicated. Note that the fluorescence ratio between the G1 and G2/M peaks equals 2. Cells in G2/M have 4n DNA content and G1 cells have a DNA content of 2n.
2.1.4 DNA stains
Many different fluorescent stains specific for DNA are available. Most of them are excitable
at 488nm, which corresponds to the emission wavelength of the most commonly used lasers
in flow cytometry. One interesting molecule for cellular DNA staining is DAPI (4’, 6-
diamidino-2-phenylindole) (Figure 7) (Tarnowski et al., 1991). It associates with the minor
groove of double-strand DNA preferentially to AT clusters (Lin et al., 1977). It is an
intercalating molecule that binds to DNA through hydrogen bounds and charge interactions.
No ultra-structural changes in cells stained with DAPI have been observed compared to the
appearance of non-stained cells (Tarnowski et al., 1991). Upon excitation of DAPI with UV
light (360nm), it emits fluorescence at 460 nm (blue light) (Kapuscinski, 1995)
- 34 -

N
NH2
NH2+
NH2+
NH2
H
Figure 7. 4’, 6-diamidino-2-phenylindole (DAPI)
Once bound to double-strand DNA a 20-fold fluorescence enhancement appears, compared to
the unbound DAPI, due to the displacement of water molecules from both DAPI and the
minor groove (Figures 8 and 9). It does not exhibit fluorescence enhancement when bound to
single stranded DNA or to GC base pairs (Figure 10). Other molecules, such as Hoechst
33258, Ethidium bromide (EtBr) and Propidium iodide (PI), are also commonly used to stain
DNA.
N
NN
NR
NHH
N N
CH3
R'
O
HO
O
HH
Figure 8. Water molecule binds to AT (or GC) base pair by hydrogen bounds (dotted lines)
...
...
N
NN
NR
NHH
NH
N N
CH3
R'
O
HO
Figure 9. Water molecule is removed and replaced by DAPI (dotted lines correspond to hydrogen bounds) in the
minor groove of double-strand DNA.
- 35 -

...
Steric repulsion
...
N N
CH3
R'O
NH
H
N N
N N
O
NH
H
H
R
NH
Figure 10. Base pair – DAPI interaction is much less effective with GC base pair, due to important steric repulsion.
2.2 Cell synchronization
Under normal culture conditions each cell will proceed through the cell cycle independently
of the cells surrounding it. Such a population is called asynchronous, as cells are distributed
randomly throughout the different phases of the cell cycle. To study the effect of a specific
cell cycle phase on an experimental procedure, it is important to have all the cells cycling in a
synchronous manner. Many different approaches have been published to achieve cell
synchronization among a given population in culture. The two main approaches to obtain
synchronized cells are by using a drug that inhibits the progression of cells at some point in
the cell cycle and results in an accumulation of cells at that point (cycling resumes upon drug
removal) and by physiological means such as contact inhibition or nutrient deprivation.
Reversible inhibitors of cellular DNA synthesis are useful tools for synchronization. However
when an asynchronous cell population is treated, only cells reaching the point in the cell cycle
inhibited by the drug will get affected by the synchronization agent and accumulate at that
point. The other cells will continue to cycle until they reach that point. To achieve a high
synchronization, cells must either be pre-synchronized in other phases prior to treatment with
the drug or they must be repeatedly treated with the DNA synthesis inhibitor. Cells must be
exposed to the synchronization agent for more than the cell cycle length to ensure that every
single cell will reach the point in the cycle that is inhibited by the drug. If asynchronous cells
- 36 -
are treated for a shorter period, one can easily understand that not all the cells (randomly
distributed through the cell cycle) will reach the synchronization point and will not be
synchronized if the drug is removed.
Asynchronous, as well as synchronous, cell cycle analysis requires controls to ensure that
cells do actually cycle and to prevent misinterpretation of the analyzes due to a static cell
culture in which no growth is occurring.
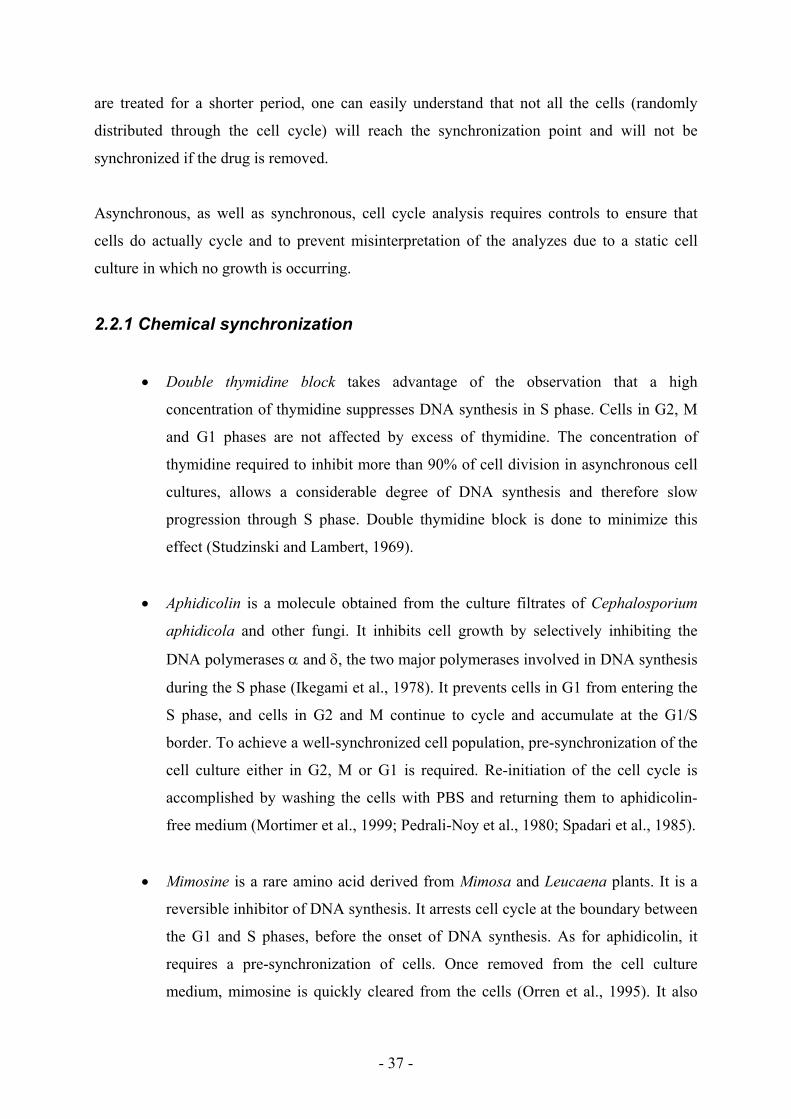
2.2.1 Chemical synchronization
• Double thymidine block takes advantage of the observation that a high
concentration of thymidine suppresses DNA synthesis in S phase. Cells in G2, M
and G1 phases are not affected by excess of thymidine. The concentration of
thymidine required to inhibit more than 90% of cell division in asynchronous cell
cultures, allows a considerable degree of DNA synthesis and therefore slow
progression through S phase. Double thymidine block is done to minimize this
effect (Studzinski and Lambert, 1969).
• Aphidicolin is a molecule obtained from the culture filtrates of Cephalosporium
aphidicola and other fungi. It inhibits cell growth by selectively inhibiting the
DNA polymerases α and δ, the two major polymerases involved in DNA synthesis
during the S phase (Ikegami et al., 1978). It prevents cells in G1 from entering the
S phase, and cells in G2 and M continue to cycle and accumulate at the G1/S
border. To achieve a well-synchronized cell population, pre-synchronization of the
cell culture either in G2, M or G1 is required. Re-initiation of the cell cycle is
accomplished by washing the cells with PBS and returning them to aphidicolin-
free medium (Mortimer et al., 1999; Pedrali-Noy et al., 1980; Spadari et al., 1985).
• Mimosine is a rare amino acid derived from Mimosa and Leucaena plants. It is a
reversible inhibitor of DNA synthesis. It arrests cell cycle at the boundary between
the G1 and S phases, before the onset of DNA synthesis. As for aphidicolin, it
requires a pre-synchronization of cells. Once removed from the cell culture
medium, mimosine is quickly cleared from the cells (Orren et al., 1995). It also
- 37 -

reportedly has no effects on DNA metabolism post-synchronization (Petersen et
al., 1995). After removal of the drug from the medium, cells proceed quickly and
synchronously into S phase. The duration of S phase after mimosine treatment
appears to be unaffected by the synchronization procedure and is identical to the
time normally taken to traverse S phase. Albeit its mechanism of action has not
been clearly defined, mimosine seems to inhibit the action of ribonucleotide
reductases, a class of enzyme involved in the synthesis of deoxyribonucleotides
(dNTPs) (Dai et al., 1994; Gilbert et al., 1995; Reichard, 1993). Lowering the intra
cellular levels of dNTPs prevent entry into the S phase (Dai et al., 1994; Gilbert et
al., 1995; Hoffman et al., 1991; Krude, 1999; Kulp and Vulliet, 1996; Lalande,
1990; Mosca et al., 1992; Watson et al., 1991).
• Hydroxyurea also inhibits the conversion of ribonucleotides to
deoxyribonucleotides and has been used to synchronize cell populations. However,
its effectiveness is cell line dependent. Exposure of S phase CHO cells to 10-3M
hydroxyurea for one hour results in cell death after 20 hours (Chang and Baserga,
1977).
2.2.2 Non-chemical synchronization
• Mitotic shake-off takes advantage of the observation that mammalian cells grown
as a monolayer have a reduced attachment to the surface when they are rounded up
during mitosis. Gently shaking the growing vessel will detach those mitotic cells
that can be further used to start a synchronized cell population. The main
drawback of this method is the low yield of mitotic cells and its applicability to
adherent cells only (Terasima and Tolmach, 1961).
• Baby machine also uses the fact that mitotic cells have a reduced attachment to the
surface of the growing vessel. Cells are grown on a porous membrane that rests on
the top of an inverted funnel. Medium is gently pumped through the funnel, and
cells rounding up for mitosis get detached and are washed away with the passing
medium. These cells provide a synchronous cell culture. This method also yields a
low level of synchronous cells (Thornton et al., 2002).
- 38 -
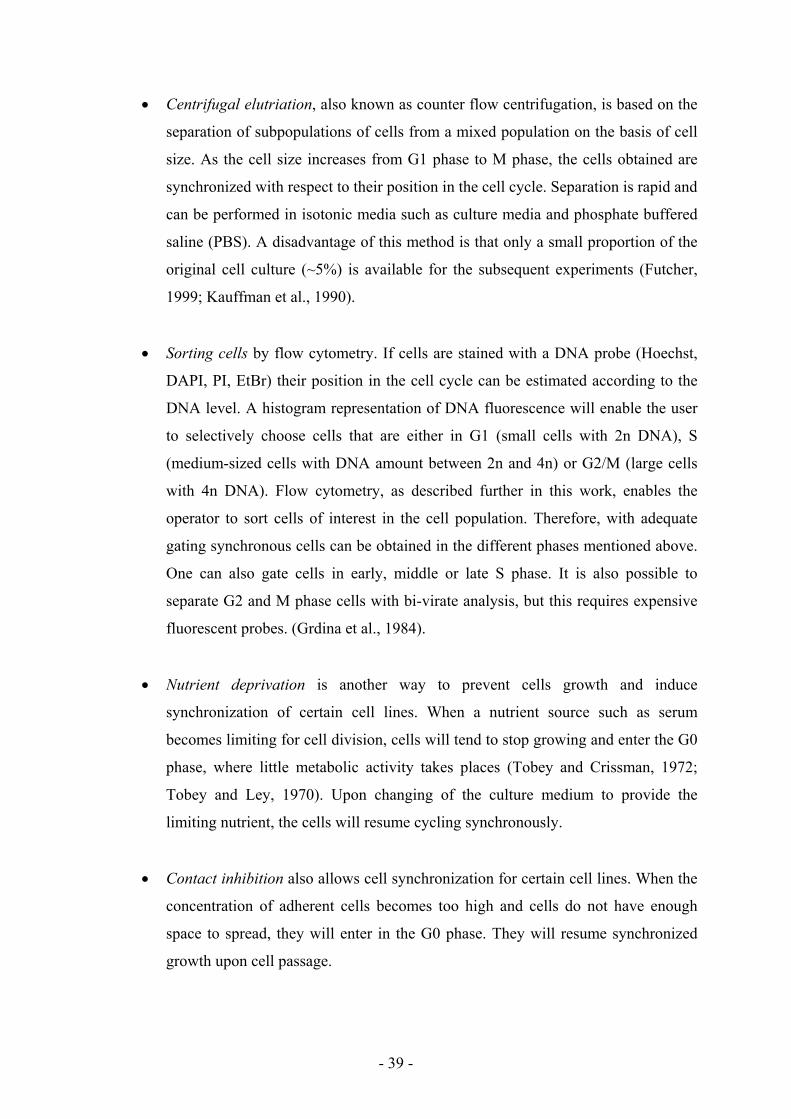
• Centrifugal elutriation, also known as counter flow centrifugation, is based on the
separation of subpopulations of cells from a mixed population on the basis of cell
size. As the cell size increases from G1 phase to M phase, the cells obtained are
synchronized with respect to their position in the cell cycle. Separation is rapid and
can be performed in isotonic media such as culture media and phosphate buffered
saline (PBS). A disadvantage of this method is that only a small proportion of the
original cell culture (~5%) is available for the subsequent experiments (Futcher,
1999; Kauffman et al., 1990).
• Sorting cells by flow cytometry. If cells are stained with a DNA probe (Hoechst,
DAPI, PI, EtBr) their position in the cell cycle can be estimated according to the
DNA level. A histogram representation of DNA fluorescence will enable the user
to selectively choose cells that are either in G1 (small cells with 2n DNA), S
(medium-sized cells with DNA amount between 2n and 4n) or G2/M (large cells
with 4n DNA). Flow cytometry, as described further in this work, enables the
operator to sort cells of interest in the cell population. Therefore, with adequate
gating synchronous cells can be obtained in the different phases mentioned above.
One can also gate cells in early, middle or late S phase. It is also possible to
separate G2 and M phase cells with bi-virate analysis, but this requires expensive
fluorescent probes. (Grdina et al., 1984).
• Nutrient deprivation is another way to prevent cells growth and induce
synchronization of certain cell lines. When a nutrient source such as serum
becomes limiting for cell division, cells will tend to stop growing and enter the G0
phase, where little metabolic activity takes places (Tobey and Crissman, 1972;
Tobey and Ley, 1970). Upon changing of the culture medium to provide the
limiting nutrient, the cells will resume cycling synchronously.
• Contact inhibition also allows cell synchronization for certain cell lines. When the
concentration of adherent cells becomes too high and cells do not have enough
space to spread, they will enter in the G0 phase. They will resume synchronized
growth upon cell passage.
- 39 -
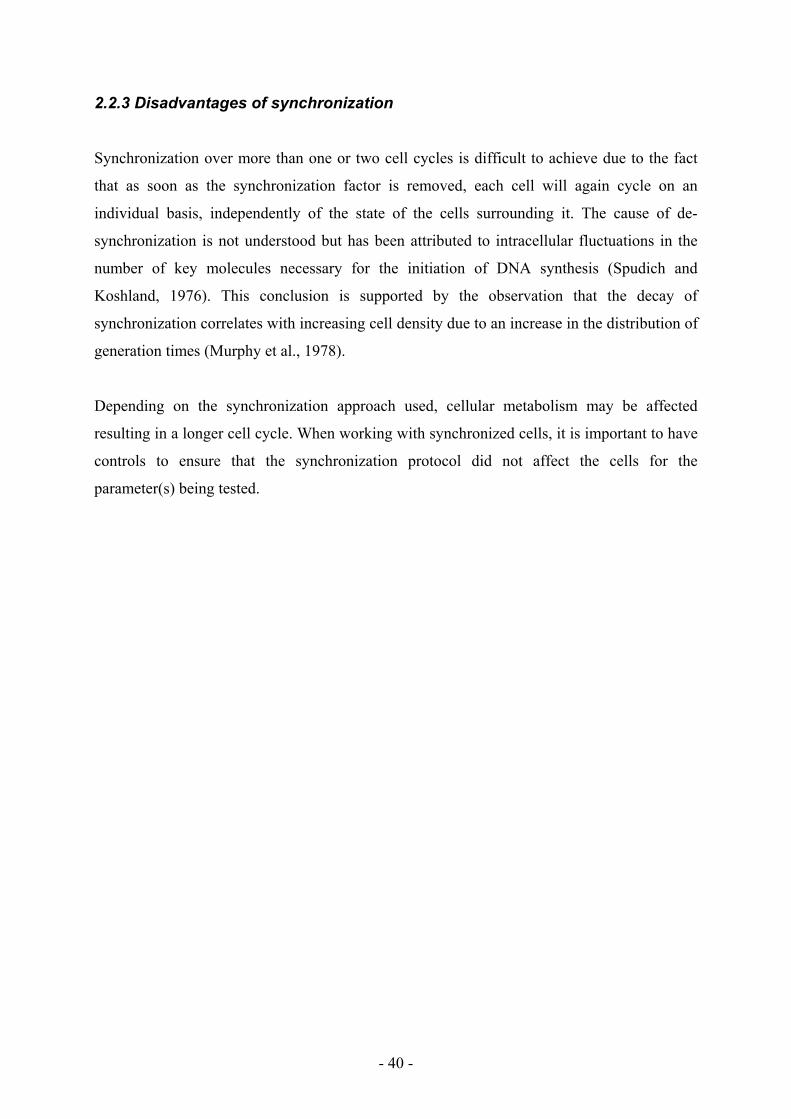
2.2.3 Disadvantages of synchronization
Synchronization over more than one or two cell cycles is difficult to achieve due to the fact
that as soon as the synchronization factor is removed, each cell will again cycle on an
individual basis, independently of the state of the cells surrounding it. The cause of de-
synchronization is not understood but has been attributed to intracellular fluctuations in the
number of key molecules necessary for the initiation of DNA synthesis (Spudich and
Koshland, 1976). This conclusion is supported by the observation that the decay of
synchronization correlates with increasing cell density due to an increase in the distribution of
generation times (Murphy et al., 1978).
Depending on the synchronization approach used, cellular metabolism may be affected
resulting in a longer cell cycle. When working with synchronized cells, it is important to have
controls to ensure that the synchronization protocol did not affect the cells for the
parameter(s) being tested.
- 40 -
3. Tools for Analysis
3.1 Flow Cytometry
Flow cytometry is a laser-based technology that is used to measure many cellular parameters,
on an individual cell basis. It uses specific fluorescently labeled compounds that react with the
cellular component of interest. Using fluorophore-linked antibodies targeted to a specific
intracellular or membrane protein, it is possible to quantify that protein in every labeled cell
being analyzed. Antibodies are not a prerequisite for flow cytometric analysis since other
fluorescent molecules that specifically bind to cellular components are available.
Flow cytometers permit sampling large amounts of suspension cells for many parameters at
the same time on a cell-by-cell basis. Thousands of cells can be sampled per second. Some
flow cytometers are also equipped with a sorting device which permits the selection of
individual cells from a population on the basis of the presence or absence of a specific
molecule(s) or on the basis of a physical parameter such as cell size or shape. This type of
instrument is termed a fluorescence-activated cell sorter (FACS). Not all flow cytometers
have sorting capabilities, however.
3.1.1 Set-up
Flow cytometry takes advantage of laminar flow conditions in capillary tubes to bring cells
one-by-one into the flow cuvette for analysis (Figure 11). Cell suspensions (permeabilized
and/or stained as needed) are injected into a flow channel where a carrier fluid (sheath fluid)
surrounds the cells. Sheath fluid draws the cell suspension into a thin laminar line through a
process called hydrodynamic focusing. The fluids enter a flow cuvette channel made out of
quartz glass where individual cells are illuminated by laser beam (usually at 488nm) and/or
UV-light.
Cells pass the analysis point where they are illuminated to excite the fluorochrome(s). The
emitted light is scattered into different directions with intensities depending on the refractive
index, size and shape of each cell. Light scattered in small angles (Forward Scatter, FSC) is
- 41 -

proportional to the cell size; more light scatter correlates with increased cell size. Scattered
light that is collected perpendicularly to the laser beam is called Side Scatter (SSC). It also is
an indicator of cell size but is mainly influenced by surface and internal structures of the cell.
These two parameters are independent of the presence of any fluorescent marker on or in the
cell. Appropriate photo-detectors measure the magnitude of the pulse of light scattered. The
magnitudes of these pulses are sorted electronically into channels that are represented as
histograms of the number of cells possessing a certain quantitative property.
Figure 11. Flow cuvette with laser and UV excitation beams, hydrodynamic focusing of sample, Forward Scatter and Side Scatter (Adapted from www.partec.de/partec/flowcytometry.html)
Fluorescent markers within the cell or on its surface will be excited and will emit light at a
specific wavelength. This emitted light is measured through sets of mirrors, filters and
different photo-multipliers, each with a specific detection window (wavelength range)
(Figure 12 and Table 4).
- 42 -
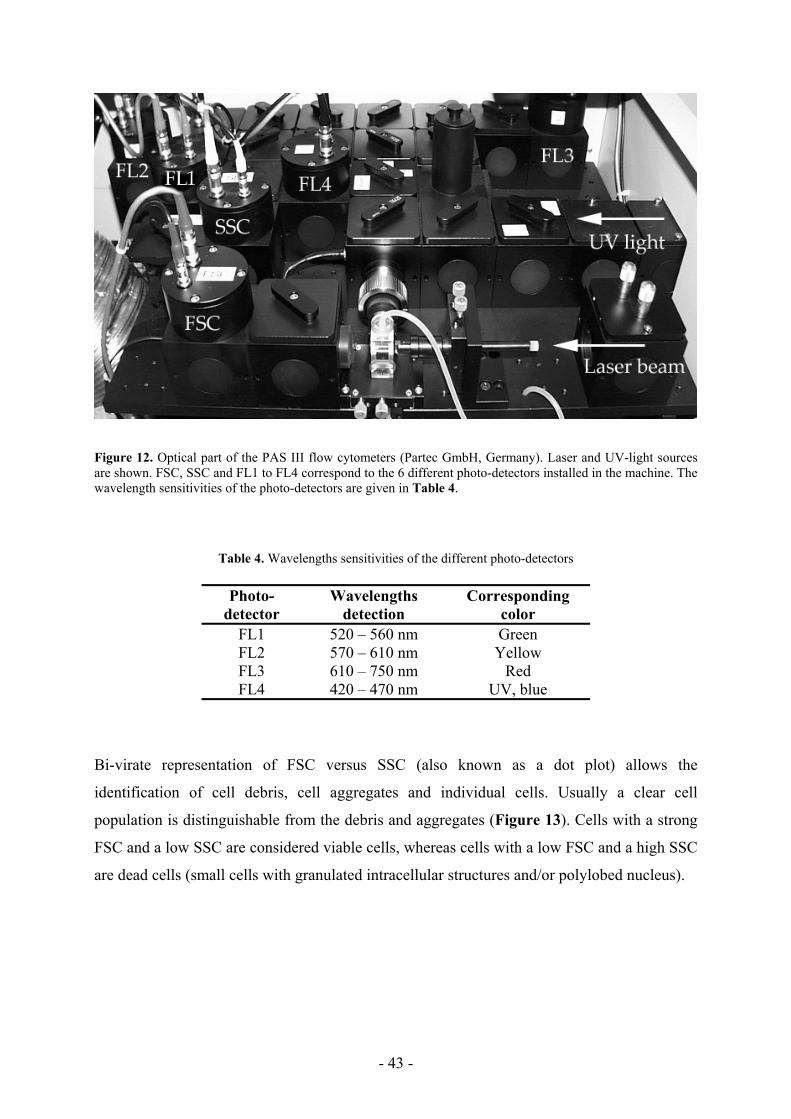
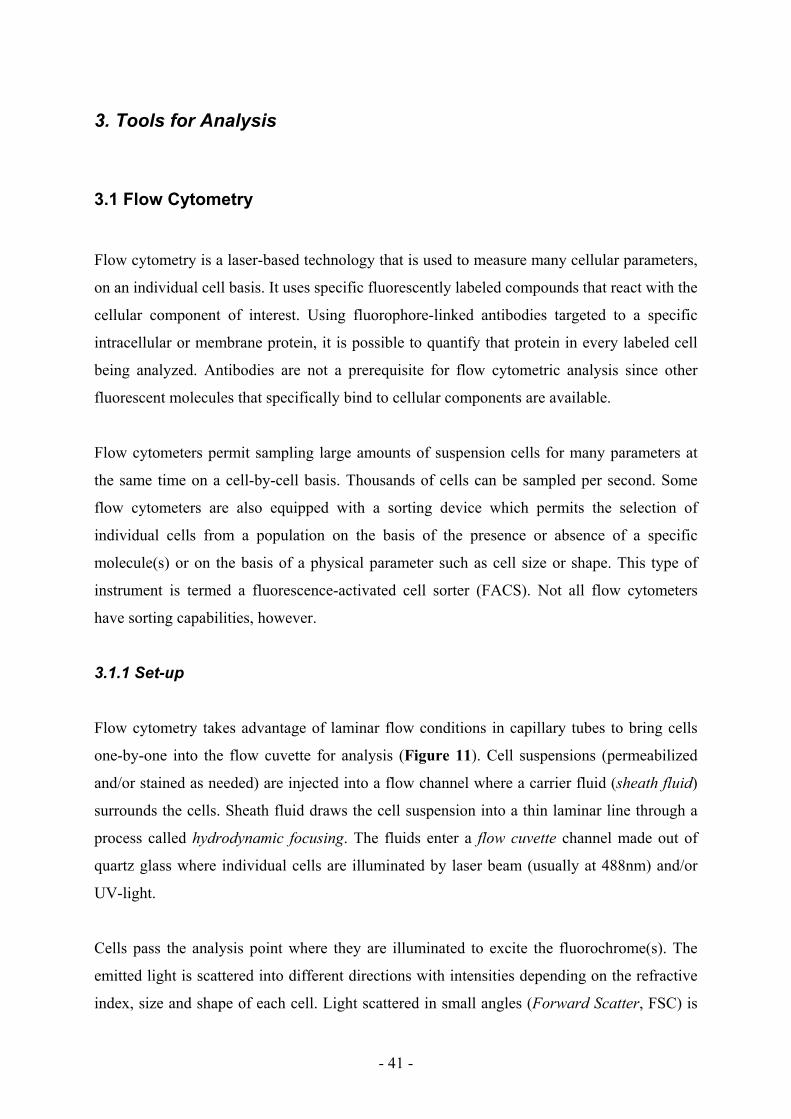
Figure 12. Optical part of the PAS III flow cytometers (Partec GmbH, Germany). Laser and UV-light sources are shown. FSC, SSC and FL1 to FL4 correspond to the 6 different photo-detectors installed in the machine. The wavelength sensitivities of the photo-detectors are given in Table 4.
Table 4. Wavelengths sensitivities of the different photo-detectors
Photo-detector
Wavelengths detection
Corresponding color
FL1 520 – 560 nm Green FL2 570 – 610 nm Yellow FL3 610 – 750 nm Red FL4 420 – 470 nm UV, blue
Bi-virate representation of FSC versus SSC (also known as a dot plot) allows the
identification of cell debris, cell aggregates and individual cells. Usually a clear cell
population is distinguishable from the debris and aggregates (Figure 13). Cells with a strong
FSC and a low SSC are considered viable cells, whereas cells with a low FSC and a high SSC
are dead cells (small cells with granulated intracellular structures and/or polylobed nucleus).
- 43 -
Figure 13. Distinction between single cells, aggregates and debris in bi-virate representation of FSC versus SSC.
As long as the fluorescent markers have an emission spectra distinct from one another, it is
possible to combine them for simultaneous analysis. Up to 7 parameters are now commonly
available on flow cytometers. These include FSC, SSC, and time plus a given number of
fluorescence sensitivities, depending on the inner settings of the machine (filters, mirrors,
photo-detectors). The filters and mirrors can separate the emitted light on independent photo-
detectors for each cell. Optical (scatter, fluorescence) signals are sequentially generated by
each single cell. Signals are detected and displayed for cell distribution analysis. Information
for every cell is stored in a computer for further analysis.
The time parameter is useful when testing new staining conditions to ensure that the
incubation time in the presence of the stain is sufficient to saturate the cell (Figure 14).
During analysis post-staining, the time parameter is still useful as it monitors the fluorescence
intensity of the parameter being studied as a function of time. If staining went well, intensities
will not move towards brighter fluorescence (Figure 15). If the incubation time during
staining was not long enough, a shift towards brighter events will appear during acquisition,
indicating the staining problem. For instance, if a DNA stain is used and the staining
incubation was not long enough, remaining stain molecule in the solution will keep reacting
with the cells during data acquisition, resulting in an increase in fluorescence intensity for
cells in a given phase of the cell cycle (i.e. G1 cells peak will start to shift towards S phase
population because cells in the population being analyzed keep incorporating more stain).
- 44 -

This would finally result in an inaccurate analysis with a high CV% (coefficient of variation),
making data interpretation difficult.
Figure 14. Stain incorporation as function of time. Y-axis represents fluorescence intensity. The first
fluorescence intensity corresponds to the auto-fluorescence of the cells. The gap in fluorescence corresponds to
the time where the stain was added to the analyzed cells. An increase in fluorescence is clearly visible (compared
to auto-fluorescence) as soon as the stain is added. Fluorescence later reaches a plateau, meaning that the cells
are saturated with the stain.
Figure 15. No intensity shift towards higher fluorescence (x-axis) as function of time (y-axis) occurs when cells
are saturated with the stain.
Cell concentration determination is also possible by flow cytometry by adding beads to a
given volume of cell solution as internal control of known concentration. Knowing how many
beads were analyzed during the acquisition, it is possible to calculate the cell concentration of
the sample.
- 45 -
3.1.2 Advantages
• Multi-parameter data acquisition: Appropriate combinations of stains with differing
excitation and emission wavelengths permit the estimation of multiple parameters for
each cell. After data acquisition it is possible to combine these parameters in every
possible combination.
• High-speed analysis: Hundreds of cells per second can be analyzed. High-grade flow
cytometers can easily go up to thousands of cells analyzed per second.
• Sorting: data treatment during acquisition can be electronically processed rapidly
enough to sort the detected cells of interest in the overall population being analyzed. If
a cell specification falls within a defined window, it is physically possible to separate
that cell from the population.
3.1.3 Disadvantages
• The cost of the machine is relatively high. A basic instrument without sorting
capability costs around one hundred thousand Swiss francs. A high grade FACS
instrument costs about 700’000 Swiss francs.
• Optical alignments require time and expertise to achieve valid data acquisition in a
reasonable period of time. Alignments must be done in a meticulous way using
standardized beads as control to ensure a low CV in the detection windows that are to
be used for a particular analysis.
• With flow cytometers it is not possible to follow a given cell as a function of time.
Once a cell has been through the flow cuvette, it is either sorted into a collecting tube
or a multi-well plate or is discarded. Flow cytometry provides a powerful tool to study
one or more parameters among a very large cell population, but it is a poor approach
for a cell-by-cell analysis as function of time.
- 46 -

3.2 Live imaging
Live imaging microscopy is an excellent tool to study transient transfection using fluorescent
proteins as markers. Cells can be monitored visually before, during and after transfection.
Counting fluorescent and non-fluorescent cells gives the transfection efficiency as well as
information on cell proliferation when correlated with time.
It has the advantage over flow cytometry of monitoring cells on an individual basis as a
function of time. Live imaging also provides information on intracellular distribution and
localization of cellular components, which is not possible with flow cytometry.
Cell can be monitored over long periods of time, thus providing a tool for studying cellular
kinetics. To ensure that all the conditions are met for cells to grow as they would in an
incubator, a chamber with controlled temperature, CO2 and humidity is fit onto the
microscope.
3.2.1 Set-up
A live imaging microscope system is a microscope controlled by a computer. Every single
parameter can be monitored and changed from the computer. Magnification lenses can be
permuted during acquisition, normal light and/or UV light can be switched on and off at will,
with exposition time set by the operator. It is possible to use different filter sets for the
detection of diverse fluorophores during acquisition. The operator can also determine the time
between each new acquisition. It is also possible to define different regions of interest that
will be monitored as a function of time with all the conditions set by the operator (Figure 16)
- 47 -

Figure 16. Live Imaging Setup. A: incubation chamber, providing incubator like conditions for the growing cells being monitored. Cells are grown in a multi-well plate placed inside this chamber. B: Motorized microscope, with sets of magnification lenses (10X, 20X, 40X and 63X), sets of filters (for fluorescence and normal light observations), motorized plate holder (x- and y-axis), motorized z-axis, motorized light and UV-light shutters, visible light and UV light source and a video camera for acquisition. C: CO2 line to supply the incubation chamber through a controller. D: CO2 controller. E: Temperature controller. F: plate holder positioner joystick (x- and y-axis). G: UV-light controller. H: plate holder x- and y-axis controller. I: Computer controlling the installation settings and storing acquired pictures. J: Anti-shock, air-suspended stabilization table to avoid vibrations in the system.
3.2.2 Advantages
• Cell-by-cell analysis: Live imaging has the advantage over flow cytometry of allowing
morphological and time-dependent cell-by-cell analysis of adherent cell populations.
If a given cell shows features of interest, it is possible to observe it over a period of
time.
• Simple cell cycle analysis: It is possible to analyze the cell cycle since cytokinesis is a
well-defined event that is easily monitored when the mother cell divides in two
daughter cells. Distinctive observable guideposts of the cell cycle can be used to
- 48 -
determine the effect of the cell cycle on other events such as the expression of a
fluorescent reporter protein as described below. It can also be used to determine the
cell cycle duration for individual cells.
• Multi-channel acquisition: For each filter set used during an acquisition, the pictures
are saved as layers (each fluorescent channel saved as a layer), permitting the
superimposition of every possible combination of the different fluorochromes.
• Co-localization: It is possible to test whether or not two (or more) independent
fluorescent signals in a cell are localized in the same sub-cellular compartment.
• Time-lapse: Each defined acquisition setting (with or without the multi-channel
option) can be applied as a function of time repeatedly, thus providing moving videos
of visual events (fluorescent and non-fluorescent) among the monitored cell
population. It also provides information on the time required for specific, visually
detectable events to occur in a given cell.
• Gradient detections: Using stains sensible to a given molecule or ions, it is possible to
see a gradient in a cell.
• Deconvolution: Some computer programs provide reconstruction in 3D of objects
observed through the Z-axis (with a single or multiple filter sets), thus facilitating co-
localization of cellular structures and/or proteins.
3.2.3 Disadvantages
• Reduced sample size: One of the major drawbacks is, of course, that a much smaller
cell population is being monitored over time compared to the tens of thousands of
cells that can be analyzed in a few minutes with flow cytometry.
• Non-automated analysis: Since many different parameters can be monitored
simultaneously, the software often runs short on possibilities to have automated
analysis.
- 49 -
• Computer power: A lot of memory and a fast processor are required to handle the huge
data files provided by live imaging in a reasonable period of time. For instance,
monitoring cells expressing a fluorescent protein post transfection during 24 hours,
with two pictures taken every 10 minutes (one with normal light and one with UV
light) creates a file of many hundreds of megabytes that does not fit on a CD-Rom. If
time-lapse acquisition has to be analyzed, the computer should be able to store the
whole file in its active memory (not hard disc) and must have powerful video handling
capacities to play all the pictures one after the other in a fluid way by superimposing
pictures from acquisition under normal and UV light. The more fluorophores being
monitored, the bigger the file saved during the acquisition and the more computer
power required to analyze it post-acquisition. As files are too large in their raw format
they cannot be saved on CD-ROMs and thus require a more powerful backup option
such as DVD-ROMs or DAT streamers. If deconvolution is needed, a fast processor is
required to avoid hours and hours of calculation.
• Price: A complete live imaging set-up costs more than one hundred thousand Swiss
francs. The associated computer power cost is proportional to the degree of
complexity of the analyses required. For instance, deconvolution requires a fast
processor as well as calculation software costing tens of thousands of Swiss francs.
- 50 -

Experiments, results and discussion
- 51 -

- 52 -

4. Materials and Methods
4.1 Plasmid preparation
pEGFP-N1 and pDsRedExpress-N1 (Clontech, Palo Alto, CA, USA) plasmids were produced
in DH5α bacteria. Extraction and purification of plasmid DNA was done using a
Nucleobond® AX10000 kit (Machery and Nagel GmbH & Co. KG, Düren, Germany)
according to the manufacturer’s instructions. Purified plasmid DNA was then resuspended in
TE (10mM Tris, 1mM EDTA, pH 7.4) to achieve a final concentration of 1 mg/ml.
4.2 Cell culture
CHO DG44 adherent cells were passaged three times a week in T-75 culture flasks (TPP,
Wohlen, Switzerland) in DMEM/F12 medium (Life Technologies, Basel, Switzerland)
supplemented with 2% Foetal Bovine Serum (FBS, JRH Biosciences) and incubated in an
humidified 5% CO2 atmosphere in a 37°C incubator (Cytoperm, Heraeus).
CHO DG44 cells are dhfr negative (i.e. they lack the enzyme dihydrofolate reductase), so the
culture medium had to be complemented with hypoxanthine and thymidine.
Three times a week, cells were detached from the culture vessel by trypsin-EDTA (Life
Technologies, Basel, Switzerland), counted with a CASY® 1 TTC cell counter (Schärfe
System, Reutlingen, Germany) and sub-cultured with a seeding density of 0.5e+5 c/ml (if
passaged two days later) or 0.2e+5 c/ml (if passaged three days later). These conditions were
determined to result in cultures with approximately 80% - 90% confluence for each new
passage and a good fibroblastic shape, without a significant number of small and round cells.
This passaging routine yielded cells with good growth conditions and avoided entry of cells
into a G0 resting phase with partial synchronization.
For asynchronous transfection, cells were passaged in 12-well plates (TPP, Wohlen,
Switzerland) with a seeding density of 1.5e+5 c/ml in 1 ml of DMEM/F12 supplemented with
- 53 -
2% Foetal Bovine Serum and incubated for 18 hours in an humidified 5% CO2 atmosphere in
a 37°C incubator (Cytoperm, Heraeus).
4.3 Cell number measurement
Cell number was measured during synchronized transfection and each time cells were
passaged using either of the two methods described below.
4.3.1 Manual counting
Cells in suspension were counted using a haemocytometer (Neubauer, Poly-labo; depth =
0.100mm, square surface on the grid = 0.0025 cm2) under an inverted phase contrast
microscope (Zeiss, Germany). Cell concentration was calculated as follows:
Cell concentration [cell/ml] = (number_cells * d * 104)/number_square
(number_cells = number of counted cells; d = dilution factor;
number_square = number of squares taken into account on the haemocytometer grid)
4.3.2 Automated counting
Automated cell counting was performed with a CASY® 1 TTC cell counter. Briefly, 100ul of
the cell sample were added to 10ml of CASYTON, an isotonic saline solution, and gently
mixed by inverting the solution. 200ul of this solution was measured by the CASY.
4.4 Viability assessment
Viability assessment was performed with haemocytometer on cultures stained with Trypan
blue (T-8154, Sigma Chemical Co., St. Louis, MO, USA).
- 54 -

4.5 Cell volume measurement
Cell volume determination was done with a CASY® 1 TTC cell counter. When estimating
cell volume decrease, PCV (packed cell volume) was preferred over the CASY® 1 TTC
measurements.
4.6 Cell synchronization
Cell synchronizations were performed using mimosine (Sigma, St. Louis, MO, USA), a cell
cycle inhibitor that blocks cells at the G1/S border. To control that no side effects arose from
the use of the synchronization drug, mimosine-free synchronizations were performed in repeat
experiments to confirm the observations done with the mimosine-synchronized populations.
4.6.1 Chemical synchronization
Cultured cells were synchronized with mimosine (Figure 17) at the G1/S border prior to
transfection, directly in 12 well plates. Prior to mimosine treatment, a pre-synchronization
step was performed to enrich the amount of cells in the G0/G1 phase by incubating the cells in
low 0.2% serum-containing medium for 48 hours. The medium was then changed for
DMEM/F12 complemented with 10% FBS and 100 µM mimosine. The cells were incubated
for an additional 14 hours, the minimum incubation time to allow all treated cells to cycle to
the growth inhibition point. Incubation in the presence of mimosine has to last for at least a
period of time equal to the duration of the complete cell cycle in order to achieve
synchronization. Subsequently, to reinitiate the cycle, the medium was changed to mimosine-
free medium complemented with 2% serum. Flow cytometry analysis (PAS III, Partec GmbH,
Münster, Germany) of the cycle distribution showed that progression through the cycle
restarted after mimosine was removed.
- 55 -

N
OOH
CH2
HNH2
OHO
Figure 17. Mimosine
4.6.3 Non-chemical synchronization
Contact inhibition was used as a synchronization control. Cells were grown to confluence in
T-75 flasks. Using these conditions CHO cells became synchronized in the G0/G1 phase, until
passaged at a lower cell density where they resumed growth.
4.7 Cell cycle analysis
For each transfection, 12 well plates were prepared with the required cell density per well. At
the time of transfection, 2 – 3 of those wells were fixed for cell cycle analysis while the
remaining wells on the plate were transfected.
4.7.1 Cell fixation and staining
After trypsinization, cells were centrifuged for 5 minutes at 800 rpm in a Labofuge 400
centrifuge (Heraeus Instruments GmbH, Hanau, Germany) and fixed by resuspension in 70%
ethanol for 1 minute. Cells were subsequently centrifuged to remove ethanol, resuspended in
PBS 1X, and stored at 4°C until further treatment.
Fixed cells samples were centrifuged to remove PBS followed by the addition of 2 ml DAPI
solution (FLUKA, 9471 Buchs, Switzerland) (1:1000 in MeOH) to each sample (~1.5E+6
cells per sample). Cells were incubated for 15 minutes at 37°C, centrifuged, resuspended in
PBS, and analyzed within 6 hours post-staining.
- 56 -

4.7.2 Flow cytometry analysis
Forward scatter, side scatter and UV-fluorescence (FL4) were acquired for each sample. Cell
cycle analysis was performed on the acquisition of minimum 30’000 events in order to have
well defined profiles. Determination of the percentage of cells in the different phases of the
cell cycle was done through software analysis (Flomax 2.3, Partec GmbH, Münster,
Germany) when well distinguishable G0/G1 and G2/M peaks were present. For synchronized
populations, when G0/G1 and G2/M peaks were not present (or not significantly enough to be
recognized as such by software analysis), gating of regions of interest was performed to
calculate the percentage of cells in the different phases. Regions gated manually were
compared with software analysis for well-defined profiles to ensure that the estimation was
correct.
4.8 Calcium phosphate transfection
Two different protocols for calcium phosphate transfection were used. The classical
transfection corresponds to the protocol published by Jordan et al. (Jordan et al., 1996) and
the fast transfection protocol was developed during this work. All the transfections were
performed in 12 well plates.
4.8.1 Classical transfection protocol
CHO cells were transfected using an optimized calcium phosphate method (Jordan et al.,
1996) with pEGFP-N1 plasmid (Clontech, Palo Alto, CA, USA). Briefly, for transfection in
12-well plates, 100 µl of transfection solution (0.125 M Ca2+, 0.7mM PO43- and 2.5 µg DNA
per 100 µl of solution) was added per well. Cells were then incubated for 3 hours at 37°C
under a 5% CO2 humidified atmosphere before a glycerol shock was applied for one minute
by changing transfection medium with a 10% glycerol solution in PBS at 37°C. Glycerol-PBS
solution was quickly removed and fresh medium containing 2% serum was added onto cells.
Plates were incubated until reporter gene expression was assessed. When preparing the
transfection mix, the calcium solution (0.25 M, 50µl/well) and DNA (2.5µg/well) were first
mixed together. As soon as the phosphate solution (1.4mM, 50µl/well) was added, the
precipitate was left to maturate for one minute before the transfection complex was added
- 57 -
onto the cells. For asynchronous cell transfection, cells are plated 18 hours before transfection
at a seeding density of 1.5e+5 cells per ml.
4.8.2 Fast transfection protocol
Exponentially growing cells were seeded at a concentration of ~6.5e+5 cells per ml in 12-
well plates. Cells were incubated for 4 hours in a 5% CO2 humidified atmosphere at 37°C.
Just before adding the calcium phosphate DNA precipitate onto the cells, two thirds of the
culture medium were removed from each well. The final volume left per well was 330 µl. 100
µl of transfection solution (0.125 M Ca2+, 0.7mM PO43- and 2.5 µg DNA per 100 µl of
solution) was added per well. Cells were then incubated for one hour at 37°C in a 5% CO2
humidified atmosphere before a glycerol shock was applied as described above. The 10%
glycerol solution in PBS was quickly removed and the cells were washed once with 5mM
EGTA in PBS and then with PBS. Fresh medium containing 2% serum was then added onto
cells. Plates were incubated until reporter gene expression was assessed.
4.9 Reporter gene detection and relative quantification
4.9.1 Fluorescent microscopy
Using a fluorescent inverted microscope (Axiovert 100, Zeiss, Feldbach, Switzerland) with an
HBO 50 lamp as the fluorescence excitation source, transfection efficiency was judged by the
number of EGFP-positive cells. Excitation and emission wavelengths were selected with
Zeiss filter set #25 (excitation: TBP 460, 495, 570nm; beamsplitter: FT 410, 505, 570nm;
emission: TBP 460, 530, 610nm). Digital images were captured on a computer running the
Axiovision 3.0.6.1. software (Carl Zeiss Vision) a color video camera (Sony 3CCD)
connected to a camera control unit (AVF-Horn, Aalen, Germany)
The kinetics of expression by live imaging was done using a motorized fluorescent
microscope (Axiovert 200M, Zeiss, Feldbach, Switzerland) equipped with an incubation
chamber and an HBO 100 lamp as fluorescence excitation source. Image acquisition was
performed under normal and UV light (with corresponding sets of filters) every 10 minutes
for 24 hours post-transfection with a Zeiss AxioCam HRm camera and a computer running
the Axiovision 3.1 Software (Carl Zeiss Vision). Excitation and emission wavelengths were
- 58 -
selected with Zeiss filter set #17 (excitation: BP 485/20nm; beamsplitter: FT 510nm;
emission: BP 515 – 565nm) for EGFP and filter set #14 for DsRedExpress (excitation: BP
510 – 560nm; beamsplitter: FT 580nm; emission: LP 590nm)
Laser scanning confocal microscopy was performed using a Zeiss LSM510 microscope
(Zeiss, Feldbach, Switzerland).
4.9.2 Fluorometry
Relative fluorescence of the transfected population was assessed using a multiwell plate
reader (CytofluorTM 4000; PerSeptive Biosystems Inc., Farmingham, MA, USA) equipped
with a 50W tungsten-halogen lamp. The following excitation/emission filters were used to
measure EGFP and DsRedExpress:
Excitation [nm] Emission [nm]
EGFP 485/20 530/25
DsRedExpress 530/25 590/35
Fluorescence intensity is reported in relative fluorescence units (RFU). Every measurement
was made with a gain set to 80. For each transfection condition, a non-transfected well was
used as a blank to subtract the auto-fluorescence signal of cells and medium from the raw
RFU signal measured in each transfected well.
Reporter gene RFU = Raw RFU signal – blank RFU signal
4.9.3 Flow cytometry
Relative intensity of EGFP positive cells was also monitored through flow cytometry.
Forward Scatter, Side Scatter and corresponding fluorescence sensitive channel (FL1, 520 –
560 nm, for EGFP and FL2, 570 – 610 nm, for DsRedExpress) were acquired. A 488nm air-
cooled argon laser was used as an excitation source. For each sample, 30’000 events were
acquired. Peak localization in the FL1 window gave information on the homogeneity of the
reporter gene expression among the transfected population.
- 59 -

- 60 -
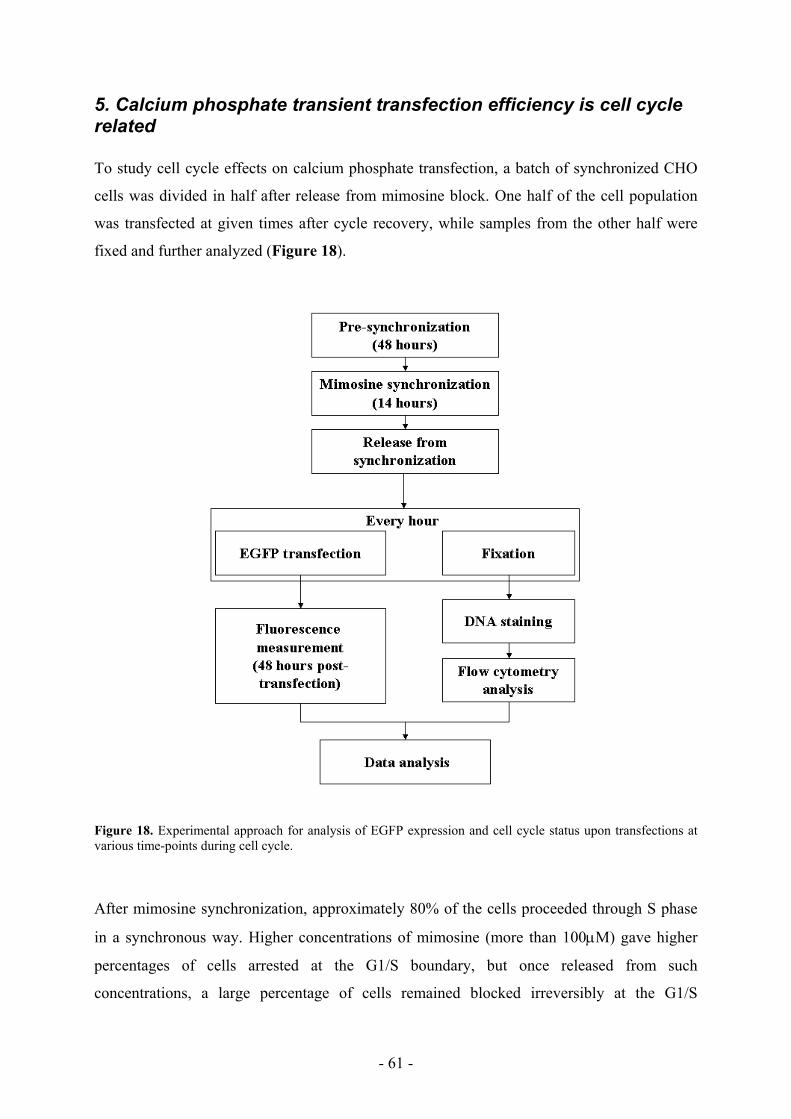
5. Calcium phosphate transient transfection efficiency is cell cycle related To study cell cycle effects on calcium phosphate transfection, a batch of synchronized CHO
cells was divided in half after release from mimosine block. One half of the cell population
was transfected at given times after cycle recovery, while samples from the other half were
fixed and further analyzed (Figure 18).
Figure 18. Experimental approach for analysis of EGFP expression and cell cycle status upon transfections at various time-points during cell cycle.
After mimosine synchronization, approximately 80% of the cells proceeded through S phase
in a synchronous way. Higher concentrations of mimosine (more than 100µM) gave higher
percentages of cells arrested at the G1/S boundary, but once released from such
concentrations, a large percentage of cells remained blocked irreversibly at the G1/S
- 61 -
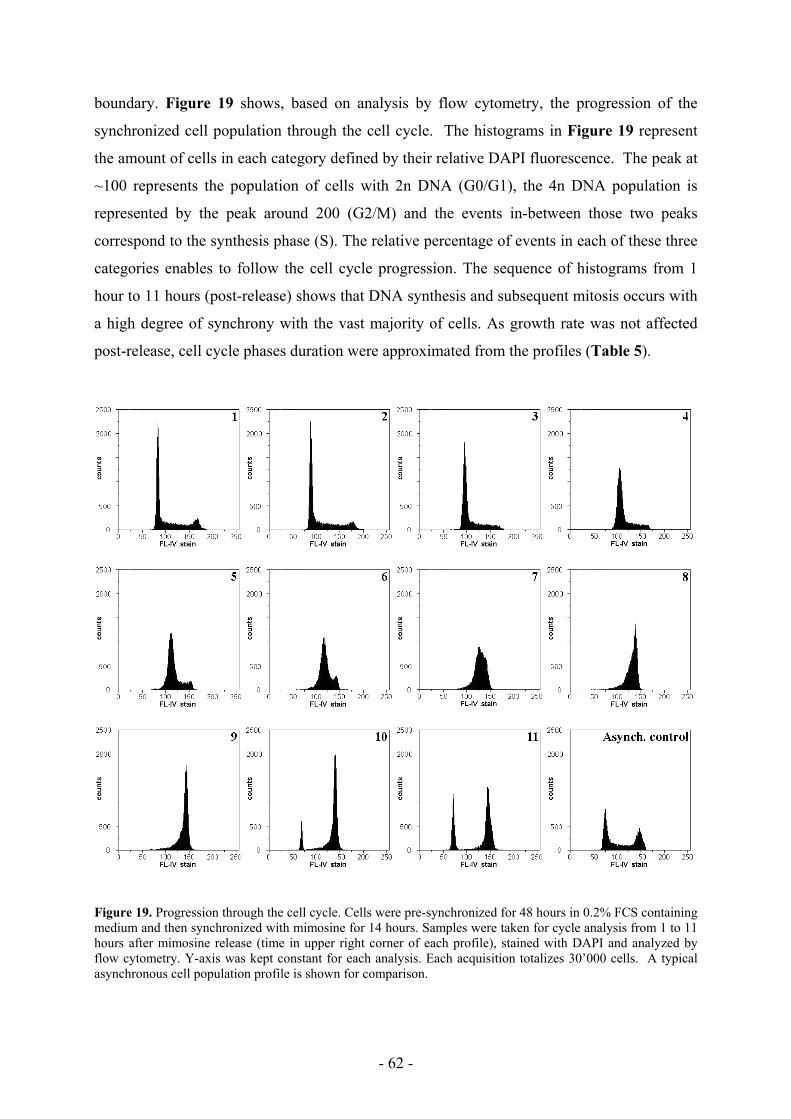
boundary. Figure 19 shows, based on analysis by flow cytometry, the progression of the
synchronized cell population through the cell cycle. The histograms in Figure 19 represent
the amount of cells in each category defined by their relative DAPI fluorescence. The peak at
~100 represents the population of cells with 2n DNA (G0/G1), the 4n DNA population is
represented by the peak around 200 (G2/M) and the events in-between those two peaks
correspond to the synthesis phase (S). The relative percentage of events in each of these three
categories enables to follow the cell cycle progression. The sequence of histograms from 1
hour to 11 hours (post-release) shows that DNA synthesis and subsequent mitosis occurs with
a high degree of synchrony with the vast majority of cells. As growth rate was not affected
post-release, cell cycle phases duration were approximated from the profiles (Table 5).
Figure 19. Progression through the cell cycle. Cells were pre-synchronized for 48 hours in 0.2% FCS containing medium and then synchronized with mimosine for 14 hours. Samples were taken for cycle analysis from 1 to 11 hours after mimosine release (time in upper right corner of each profile), stained with DAPI and analyzed by flow cytometry. Y-axis was kept constant for each analysis. Each acquisition totalizes 30’000 cells. A typical asynchronous cell population profile is shown for comparison.
- 62 -

Table 5. Duration of the different cell cycle phases of the CHO DG44 cells.
Phase length G1 ~ 3 hours S ~ 6 – 7 hours G2 ~ 3 hours M ~ 1 hour
The duration of theses phases correlates with the doubling time of CHO cells (in DMEM/F12
medium supplemented with fetal bovine serum (FBS) in a 5% CO2 atmosphere) of 14 hours
reported by Clough (Clough, 1998).
5.1 Calcium phosphate transfection is S phase-related
Results presented in Figure 20 show EGFP expression levels from cells transfected at various
time points post-mimosine treatment and the corresponding cell cycle distribution of cells
analyzed by flow cytometry and DNA labeling. A strong correlation was observed between
the percentage of cells in S phase at the time of calcium phosphate DNA complex addition
and the EGFP signal measured 48 hours post transfection. The more cells in S phase at the
time of transfection, the higher was the signal for transient EGFP expression 48 hours later.
(Figure 20 and Figure 21).
1000
2000
3000
4000
5000
6000
7000
1:00 3:00 5:00 7:00 9:00 11:00 13:00 15:00
Time post synchronization release [hours]
Rel
ativ
e Fl
uore
scen
ce U
nits
[R
FU]
0
10
20
30
40
50
60
70
80
90
100
% o
f cel
ls in
S p
hase
Figure 20. EGFP expression correlates with percentage of cells in the S phase. Other phase distributions (G0/G1 and G2/M) are not shown for clarity. Transfections were performed on new samples (from the same synchronized batch of cells) every hour for 14 hours after release from mimosine. Dotted line represents the EGFP expression 48 days post transfection. Full line represents the percentage of cells in S phase at the time of transfection.
- 63 -
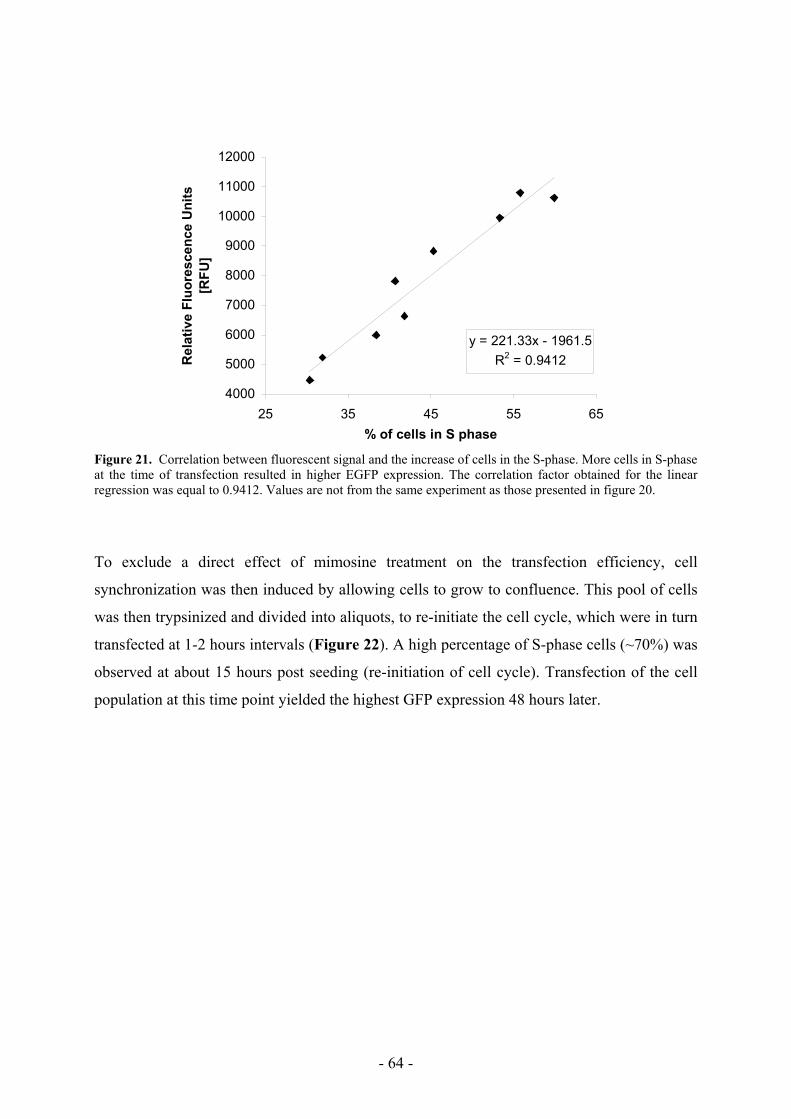
y = 221.33x - 1961.5R2 = 0.9412
4000
5000
6000
7000
8000
9000
10000
11000
12000
25 35 45 55 65% of cells in S phase
Rel
ativ
e Fl
uore
scen
ce U
nits
[RFU
]
Figure 21. Correlation between fluorescent signal and the increase of cells in the S-phase. More cells in S-phase at the time of transfection resulted in higher EGFP expression. The correlation factor obtained for the linear regression was equal to 0.9412. Values are not from the same experiment as those presented in figure 20.
To exclude a direct effect of mimosine treatment on the transfection efficiency, cell
synchronization was then induced by allowing cells to grow to confluence. This pool of cells
was then trypsinized and divided into aliquots, to re-initiate the cell cycle, which were in turn
transfected at 1-2 hours intervals (Figure 22). A high percentage of S-phase cells (~70%) was
observed at about 15 hours post seeding (re-initiation of cell cycle). Transfection of the cell
population at this time point yielded the highest GFP expression 48 hours later.
- 64 -
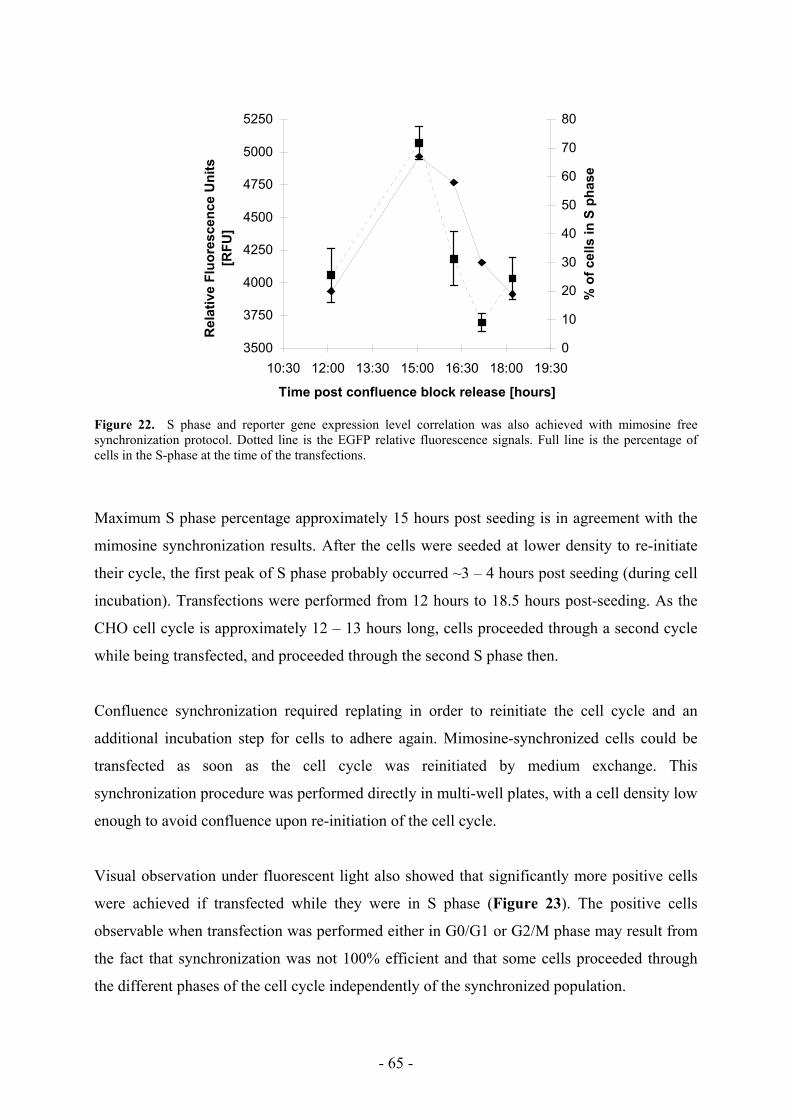
3500
3750
4000
4250
4500
4750
5000
5250
10:30 12:00 13:30 15:00 16:30 18:00 19:30
Time post confluence block release [hours]
Rel
ativ
e Fl
uore
scen
ce U
nits
[R
FU]
0
10
20
30
40
50
60
70
80
% o
f cel
ls in
S p
hase
Figure 22. S phase and reporter gene expression level correlation was also achieved with mimosine free synchronization protocol. Dotted line is the EGFP relative fluorescence signals. Full line is the percentage of cells in the S-phase at the time of the transfections.
Maximum S phase percentage approximately 15 hours post seeding is in agreement with the
mimosine synchronization results. After the cells were seeded at lower density to re-initiate
their cycle, the first peak of S phase probably occurred ~3 – 4 hours post seeding (during cell
incubation). Transfections were performed from 12 hours to 18.5 hours post-seeding. As the
CHO cell cycle is approximately 12 – 13 hours long, cells proceeded through a second cycle
while being transfected, and proceeded through the second S phase then.
Confluence synchronization required replating in order to reinitiate the cell cycle and an
additional incubation step for cells to adhere again. Mimosine-synchronized cells could be
transfected as soon as the cell cycle was reinitiated by medium exchange. This
synchronization procedure was performed directly in multi-well plates, with a cell density low
enough to avoid confluence upon re-initiation of the cell cycle.
Visual observation under fluorescent light also showed that significantly more positive cells
were achieved if transfected while they were in S phase (Figure 23). The positive cells
observable when transfection was performed either in G0/G1 or G2/M phase may result from
the fact that synchronization was not 100% efficient and that some cells proceeded through
the different phases of the cell cycle independently of the synchronized population.
- 65 -
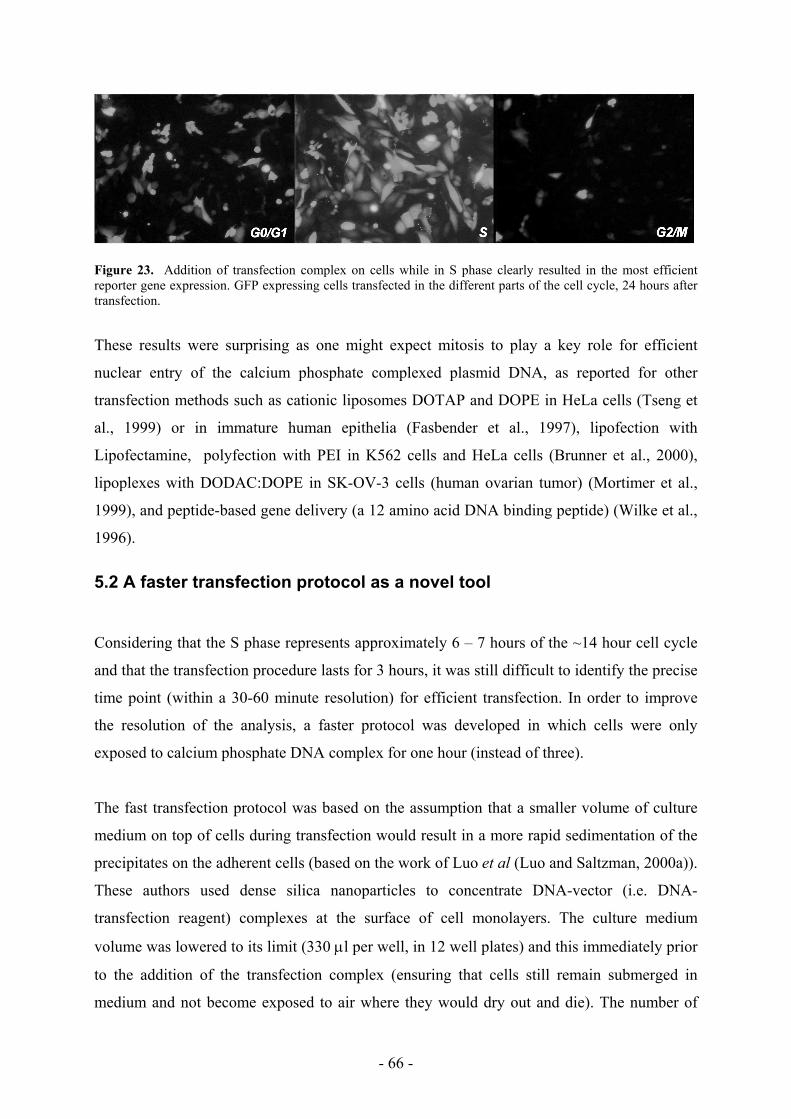
Figure 23. Addition of transfection complex on cells while in S phase clearly resulted in the most efficient reporter gene expression. GFP expressing cells transfected in the different parts of the cell cycle, 24 hours after transfection.
These results were surprising as one might expect mitosis to play a key role for efficient
nuclear entry of the calcium phosphate complexed plasmid DNA, as reported for other
transfection methods such as cationic liposomes DOTAP and DOPE in HeLa cells (Tseng et
al., 1999) or in immature human epithelia (Fasbender et al., 1997), lipofection with
Lipofectamine, polyfection with PEI in K562 cells and HeLa cells (Brunner et al., 2000),
lipoplexes with DODAC:DOPE in SK-OV-3 cells (human ovarian tumor) (Mortimer et al.,
1999), and peptide-based gene delivery (a 12 amino acid DNA binding peptide) (Wilke et al.,
1996).
5.2 A faster transfection protocol as a novel tool
Considering that the S phase represents approximately 6 – 7 hours of the ~14 hour cell cycle
and that the transfection procedure lasts for 3 hours, it was still difficult to identify the precise
time point (within a 30-60 minute resolution) for efficient transfection. In order to improve
the resolution of the analysis, a faster protocol was developed in which cells were only
exposed to calcium phosphate DNA complex for one hour (instead of three).
The fast transfection protocol was based on the assumption that a smaller volume of culture
medium on top of cells during transfection would result in a more rapid sedimentation of the
precipitates on the adherent cells (based on the work of Luo et al (Luo and Saltzman, 2000a)).
These authors used dense silica nanoparticles to concentrate DNA-vector (i.e. DNA-
transfection reagent) complexes at the surface of cell monolayers. The culture medium
volume was lowered to its limit (330 µl per well, in 12 well plates) and this immediately prior
to the addition of the transfection complex (ensuring that cells still remain submerged in
medium and not become exposed to air where they would dry out and die). The number of
- 66 -
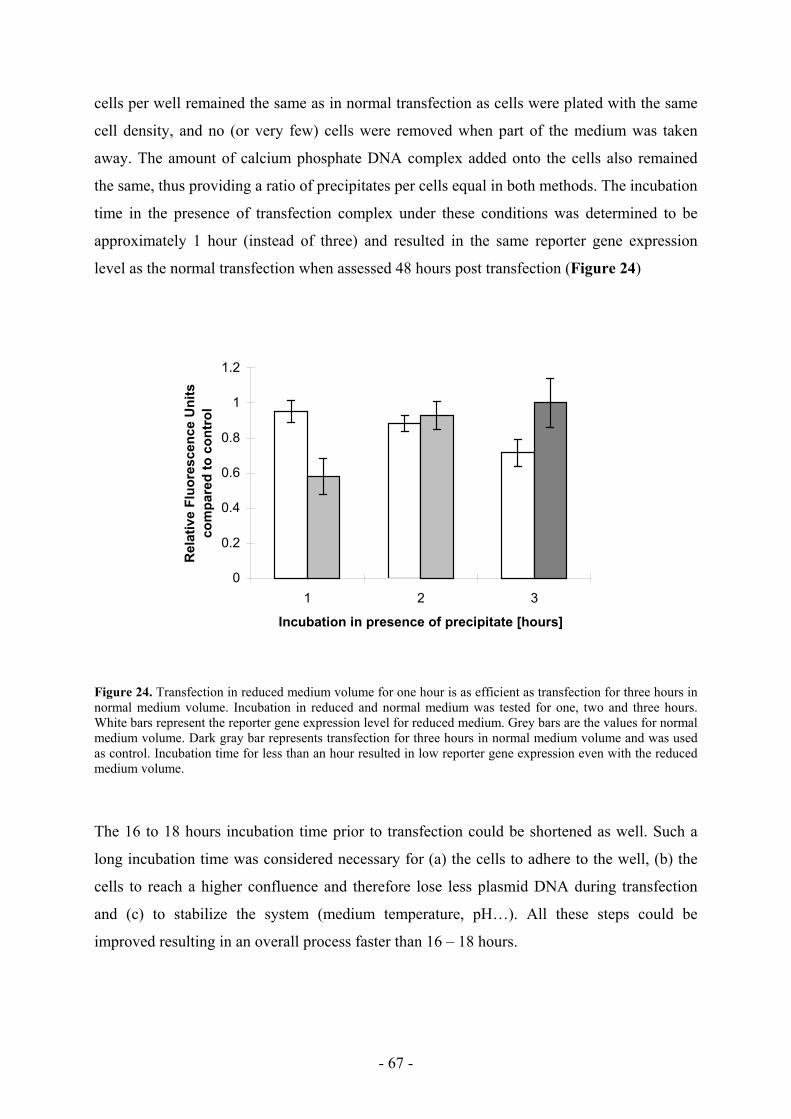
cells per well remained the same as in normal transfection as cells were plated with the same
cell density, and no (or very few) cells were removed when part of the medium was taken
away. The amount of calcium phosphate DNA complex added onto the cells also remained
the same, thus providing a ratio of precipitates per cells equal in both methods. The incubation
time in the presence of transfection complex under these conditions was determined to be
approximately 1 hour (instead of three) and resulted in the same reporter gene expression
level as the normal transfection when assessed 48 hours post transfection (Figure 24)
0
0.2
0.4
0.6
0.8
1
1.2
1 2 3
Incubation in presence of precipitate [hours]
Rel
ativ
e Fl
uore
scen
ce U
nits
com
pare
d to
con
trol
Figure 24. Transfection in reduced medium volume for one hour is as efficient as transfection for three hours in normal medium volume. Incubation in reduced and normal medium was tested for one, two and three hours. White bars represent the reporter gene expression level for reduced medium. Grey bars are the values for normal medium volume. Dark gray bar represents transfection for three hours in normal medium volume and was used as control. Incubation time for less than an hour resulted in low reporter gene expression even with the reduced medium volume.
The 16 to 18 hours incubation time prior to transfection could be shortened as well. Such a
long incubation time was considered necessary for (a) the cells to adhere to the well, (b) the
cells to reach a higher confluence and therefore lose less plasmid DNA during transfection
and (c) to stabilize the system (medium temperature, pH…). All these steps could be
improved resulting in an overall process faster than 16 – 18 hours.
- 67 -
• The cells have to adhere to the well:
The cell adhesion does not require 16 hours: monitoring, every ten minutes, the cell
behavior post seeding, showed that cells started to have their fibroblastic morphology
again after incubation for 4 hours post-seeding.
• The cells have to reach a given confluence:
Increasing the cellular density at seeding and following the cell growth (CASY) enabled
to obtain the desired confluence (~80%) after the 4 hour incubation required by the cells
to become fibroblastic again.
• The system has to stabilize:
After four hours in the incubator, the medium temperature has reached 37°C. The pH of
the medium is comparable to what is achieved after 16 – 18 hours of incubation (~7.4).
These observations led to a shortened incubation time prior to transfection of 4 hours instead
of 16 to 18 hours. The reporter gene levels achieved after these shorter incubations were
comparable to those obtained with a longer classical incubation time and this for a precipitate
exposure time of only one hour.
Different cell seeding densities were tested to find the optimal condition for this fast
transfection protocol in 12 well plates. Those densities ranged from 3.0e+5 c/ml to 7.5e+5
c/ml. The reporter gene expression levels were measured 48 hours post transfection (Figure
25):
- 68 -
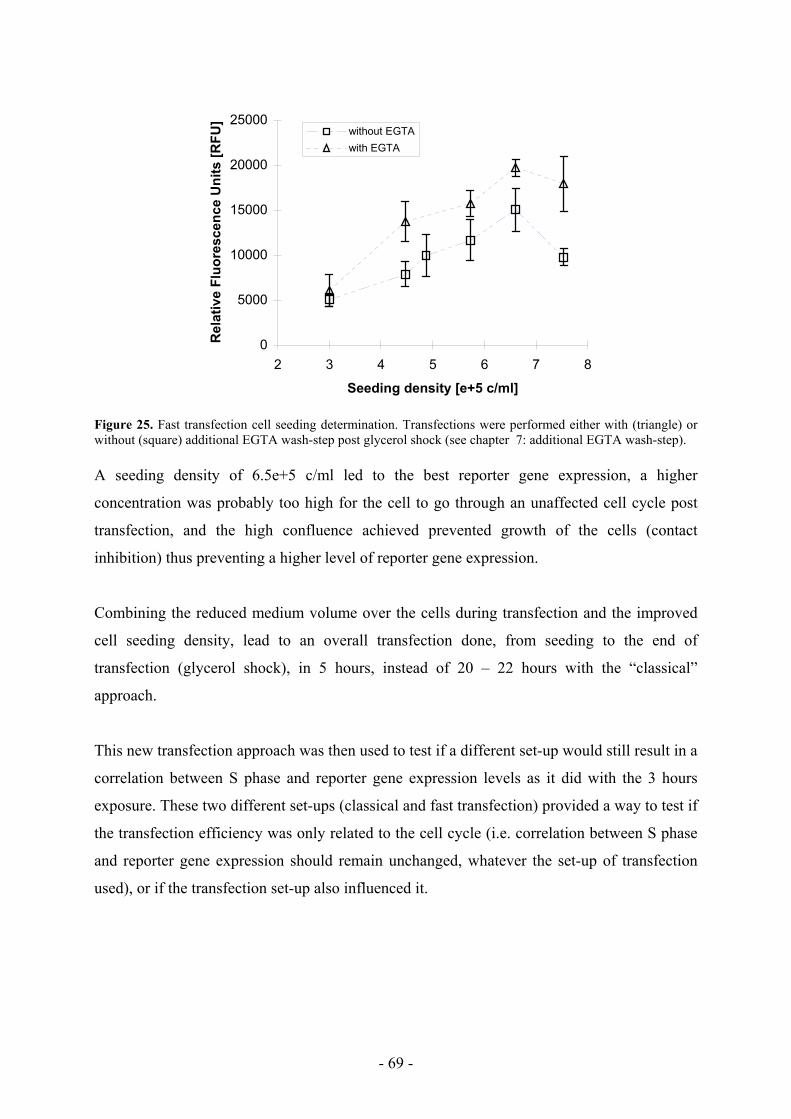
0
5000
10000
15000
20000
25000
2 3 4 5 6 7 8
Seeding density [e+5 c/ml]
Rel
ativ
e Fl
uore
scen
ce U
nits
[RFU
]
without EGTAwith EGTA
Figure 25. Fast transfection cell seeding determination. Transfections were performed either with (triangle) or without (square) additional EGTA wash-step post glycerol shock (see chapter 7: additional EGTA wash-step). A seeding density of 6.5e+5 c/ml led to the best reporter gene expression, a higher
concentration was probably too high for the cell to go through an unaffected cell cycle post
transfection, and the high confluence achieved prevented growth of the cells (contact
inhibition) thus preventing a higher level of reporter gene expression.
Combining the reduced medium volume over the cells during transfection and the improved
cell seeding density, lead to an overall transfection done, from seeding to the end of
transfection (glycerol shock), in 5 hours, instead of 20 – 22 hours with the “classical”
approach.
This new transfection approach was then used to test if a different set-up would still result in a
correlation between S phase and reporter gene expression levels as it did with the 3 hours
exposure. These two different set-ups (classical and fast transfection) provided a way to test if
the transfection efficiency was only related to the cell cycle (i.e. correlation between S phase
and reporter gene expression should remain unchanged, whatever the set-up of transfection
used), or if the transfection set-up also influenced it.
- 69 -

5.3 Transfection efficiency is shifted with a faster transfection protocol
Previous results had shown that while using the classical transfection protocol (i.e. 3 hours
exposure to transfection complex in 1 ml) a maximum reporter gene expression level, at 48
hours post transfection was obtained, when calcium phosphate DNA complex was added onto
cells in S phase, regardless of the synchronization method used (mimosine or contact
inhibition). After being synchronized in T150 flasks, cells were seeded in multi-well plates at
release from mimosine synchronization, and transfected following the shorter protocol. Cell
samples were fixed for further flow cytometric analysis each time a transfection was
performed. With the new system, the highest reporter gene expression level, 48 hours post
transfection, was shifted by approximately two hours closer to mitosis (Figure 26).
0
5000
10000
15000
20000
25000
0:00 1:30 3:00 4:30 6:00 7:30 9:00
Time post-synchronization release [hours]
Rel
ativ
e Fl
uore
scen
ce U
nits
[R
FU]
0%
10%
20%
30%
40%
50%
60%
70%
80%
% o
f cel
ls in
S p
hase
Figure 26. EGFP expression 48 hours post transfection (dotted line) is shifted in comparison to S phase profile of the cell cycle at the time of transfection (full line) using the fast transfection protocol. Repeats of the experiment showed similar results.
These results showed that the role of the cell cycle could be influenced by the transfection
protocol, since with a faster transfection protocol, the S phase correlation was shifted.
Depending on the transfection set-up, the optimal time to add the precipitate on the cells may
be different. Therefore, the S phase may not play the key role in efficient reporter gene
- 70 -

expression post transfection. Another important consideration is of physical nature: a larger
medium volume on the cells results in a longer time for the calcium phosphate precipitate to
settle down on cells, since the gravitational settling occurs over a longer distance. With a
smaller medium volume, the transfection complex has to be added to cells earlier.
The observed two-hour shift for high expression may be due to the shorter time of exposure to
plasmid DNA (one hour instead of three, with the fast transfection protocol used), however, it
may also reflect another phenomena in the cell cycle that could play important roles for
efficient reporter gene expression.
These results also showed that the kinetics of uptake was relatively fast and dependent on the
transfection set-up. One hour of calcium phosphate DNA complex exposure time was enough
to achieve reporter gene levels as high as with three-hour exposure, simply by lowering the
volume of medium present onto cells during transfection. This is in contradiction to Loyter et
al. (Loyter et al., 1982a) who had reported that no detectable uptake was achieved after one
hour exposure in Petri dishes, and that only weak uptake was seen after 2 hours.
- 71 -

- 72 -
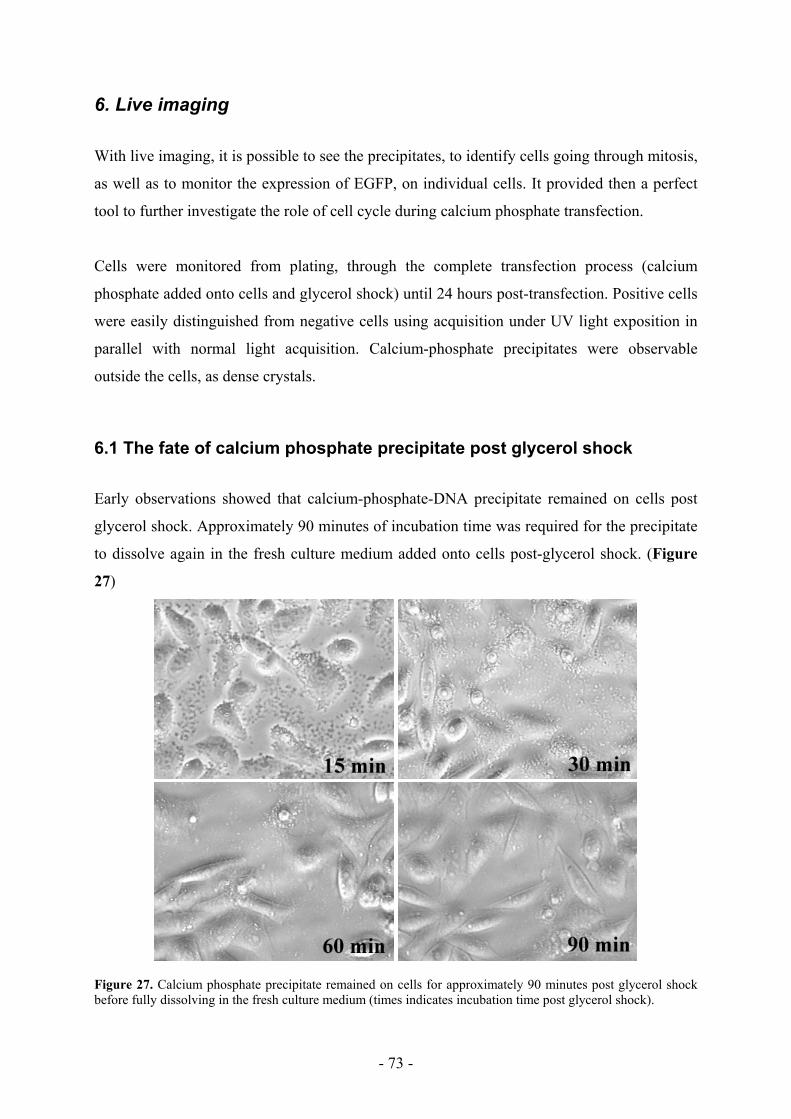
6. Live imaging
With live imaging, it is possible to see the precipitates, to identify cells going through mitosis,
as well as to monitor the expression of EGFP, on individual cells. It provided then a perfect
tool to further investigate the role of cell cycle during calcium phosphate transfection.
Cells were monitored from plating, through the complete transfection process (calcium
phosphate added onto cells and glycerol shock) until 24 hours post-transfection. Positive cells
were easily distinguished from negative cells using acquisition under UV light exposition in
parallel with normal light acquisition. Calcium-phosphate precipitates were observable
outside the cells, as dense crystals.
6.1 The fate of calcium phosphate precipitate post glycerol shock
Early observations showed that calcium-phosphate-DNA precipitate remained on cells post
glycerol shock. Approximately 90 minutes of incubation time was required for the precipitate
to dissolve again in the fresh culture medium added onto cells post-glycerol shock. (Figure
27)
Figure 27. Calcium phosphate precipitate remained on cells for approximately 90 minutes post glycerol shock before fully dissolving in the fresh culture medium (times indicates incubation time post glycerol shock).
- 73 -

Remaining calcium concentration on the cells was monitored during and after transfection by
Nova bio-analyzer (Nova Biomedical, Waltham, MA, USA). An increase in the amount of
residual calcium was measured even 24 hours post transfection. The calcium concentration
was measured pre-transfection, during transfection, immediately post-transfection and 20
hours post-transfection (Table 6)
Table 6. Calcium concentrations in the medium pre-, during and post-transfection
Calcium concentration [mM] Pre-transfection 0.8 During transfection 11.6 Post-transfection 1.0 20 hours post-transfection 1.0
During transfection in a 12 well plate, the amount of calcium present in 1 milliliter of medium
(DMEM/F12, GibcoBRL) is equal to 1.0*10-6 moles; the amount of phosphate present is
equal to 9.5*10-7 moles. The quantity of calcium added through the transfection complex is
equal to 1.25*10-5 moles and phosphate is equal to 7.0*10-8 moles. This calcium addition
corresponds to approximately 10 times more calcium than what is already present (phosphate
added corresponds to approximately a tenth of what is present). The remaining calcium
phosphate precipitate on the cells post glycerol shock is due to calcium more than phosphate.
As there might be negative effects due to calcium toxicity, it was important to ensure the
complete removal of the calcium phosphate precipitate from the medium post-transfection.
This also prevented additional calcium phosphate-DNA uptake by the cells post-glycerol
shock.
To completely remove the precipitate, an additional EGTA (5mM in PBS) wash-step was
performed just after glycerol shock as done by Loyter et al (Loyter et al., 1982b). This was
then followed by a PBS wash-step to remove all the EGTA present. After the EGTA wash-
step, no more precipitate was visible under the microscope. Non-complexed naked plasmid
DNA, as control, did not provide any reporter gene expression. (See chapter 7: Additional
EGTA wash-step)
- 74 -

6.2 Importance of mitosis
In asynchronously transfected cell populations, the first EGFP expressing cells were
detectable approximately 2.5 hour post-glycerol shock. Up to 20% of the transfected cells
were detected as positive, based on EGFP expression. Among these cells, about 90% either
underwent mitosis or appeared to prepare for mitosis (rounding up) but did not divide before
they started to express EGFP. The ratio of executed and non-executed mitosis in the early
EGPF-expressing cells was around 3 to 5.
The first EGFP-positive cells usually became highly fluorescent, indicative of extensive
intracellular accumulation of large quantities of EGFP. None of these cells underwent a
second mitosis. They all became round after 7 to 15 hours post first observation of EGFP and
some of them lost fluorescence after a few hours. Only cells that proceeded through mitosis
post glycerol shock resulted in two EGFP-positive daughter cells (Figure 28). None of the
cells undergoing mitosis between the time of DNA addition and before treatment by a
glycerol shock (first visible EGFP-positive cells) produced two EGFP-positive daughter cells
– only one of them was positive. A non-homogeneous plasmid distribution within the cell at
mitosis was probably responsible for the asymmetry in expression.
02:30 03:20 04:10 05:00 05:50
06:40 07:30 08:20 09:10 10:00
02:30 03:20 04:10 05:00 05:50
06:40 07:30 08:20 09:10 10:00
02:30 03:20 04:10 05:00 05:50
06:40 07:30 08:20 09:10 10:00
02:30 03:20 04:10 05:00 05:50
06:40 07:30 08:20 09:10 10:00 Figure 28. EGFP-positive daughter cells appear post mitosis. ~90% of the positive cells express EGFP post-mitosis or post-aborted mitosis. The time passed since glycerol shock is indicated in hours and minutes in the lower part of each image. GFP-positive cells appear brighter than the others. First detectable signal appeared two and a half hours post-mitosis (position 06:40). These results support the notion that mitotic activity is a requirement for different transfection
methods. Disruption of the nuclear envelope during mitosis permits plasmid entry in the
nuclear environment and its following transcription and translation into protein.
- 75 -

If mitosis provides access for the plasmids to the nuclear environment, then an alternative way
of entry in the nucleus must exist to explain the 10% of positive cells that did not show a clear
mitosis (or aborted mitosis) prior to expression of EGFP. A direct entry of plasmid in the
nucleus without mitosis may explain those, as reported by Coonrod et al. (Coonrod et al.,
1997) for linear plasmid DNA and by Escriou et al. (Escriou et al., 2001) for circular plasmid
DNA microinjected in the cytoplasm. The 10% of positive cells that did not go through
mitosis may come from partially degraded DNA that diffused inside the nucleus. Diffusion of
DNA in the nucleus with micro-injection studies, showed that short linear DNA rapidly
diffuses in the nucleus (up to 1.5Kbp), whereas large plasmid DNA does not (Chin et al.,
1990; Clarenc et al., 1993; Leonetti et al., 1991; Zabner et al., 1995). The size of the promoter
and the gene encoding for the fluorescent protein does not exceed 1.4Kb in both case.
6.3 Occurrence of positive cells appearing with time
As degradation of the plasmid occurs in the cytoplasm (Lechardeur et al., 1999) appearance of
reporter gene expression was followed in individual cells for a period of 17 hours post
transfection, to see if expression occurs preferentially in cells close to glycerol shock at the
time of mitosis or if expression randomly appears unaffected by the mitosis localization in
time.
Analysis of approximately one hundred positive cells, demonstrated that more than 80% of
these appeared within the first 6 hours post-glycerol shock (Figure 29). These observations
showed that glycerol shock is another key parameter for efficient gene transfer into the
nucleus of the cells.
- 76 -
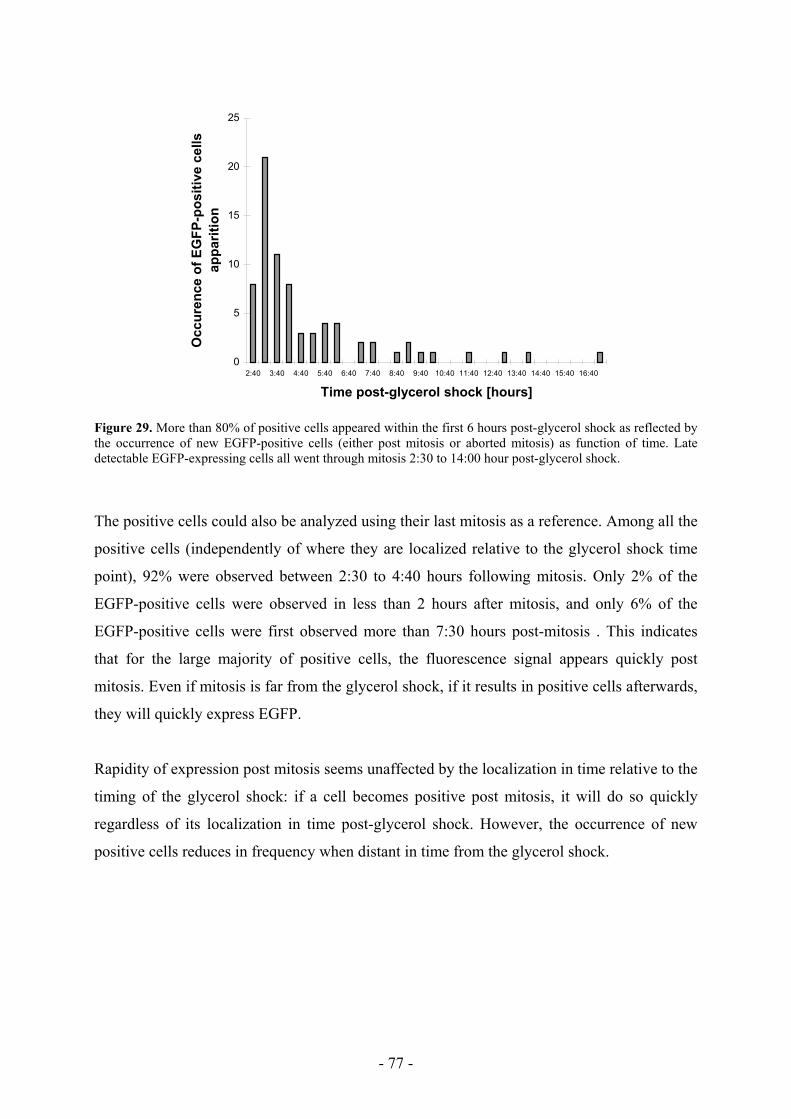
0
5
10
15
20
25
2:40 3:40 4:40 5:40 6:40 7:40 8:40 9:40 10:40 11:40 12:40 13:40 14:40 15:40 16:40
Time post-glycerol shock [hours]
Occ
uren
ce o
f EG
FP-p
ositi
ve c
ells
ap
parit
ion
Figure 29. More than 80% of positive cells appeared within the first 6 hours post-glycerol shock as reflected by the occurrence of new EGFP-positive cells (either post mitosis or aborted mitosis) as function of time. Late detectable EGFP-expressing cells all went through mitosis 2:30 to 14:00 hour post-glycerol shock.
The positive cells could also be analyzed using their last mitosis as a reference. Among all the
positive cells (independently of where they are localized relative to the glycerol shock time
point), 92% were observed between 2:30 to 4:40 hours following mitosis. Only 2% of the
EGFP-positive cells were observed in less than 2 hours after mitosis, and only 6% of the
EGFP-positive cells were first observed more than 7:30 hours post-mitosis . This indicates
that for the large majority of positive cells, the fluorescence signal appears quickly post
mitosis. Even if mitosis is far from the glycerol shock, if it results in positive cells afterwards,
they will quickly express EGFP.
Rapidity of expression post mitosis seems unaffected by the localization in time relative to the
timing of the glycerol shock: if a cell becomes positive post mitosis, it will do so quickly
regardless of its localization in time post-glycerol shock. However, the occurrence of new
positive cells reduces in frequency when distant in time from the glycerol shock.
- 77 -

6.4 Transgene expression affects cell growth
It has been recently shown (Batard et al., 2001) that cells can take up a large number of
plasmid molecules, from 3’000 up to 100’000. Such high copy number of plasmid not only
correlated with expression levels but also exhibited reduced cell proliferation and decreased
survival. Live imaging studies support these results since EGFP-positive cells had an
extended cell cycle compared to negative cells (Table 7). Cells with very high levels of
EGFP often rounded up and detached after a few hours. The occasional loss of fluorescence
in these cells may have been indicative of membrane leakage and eventual cell death as
blebbing was frequently observed.
Table 7. EGFP-positive cells have a longer cell cycle compared to negative cells.
Doubling time [hours] EGFP-negative cells 12 - 14 EGFP-positive cells 18 - 22
First visible EGFP expression in cells was observed as early as 2.5 hours post-glycerol shock.
Figure 30 represents the number of cells counted by microscopy within a surface area of 0.34
mm2. EGFP-positive cells reached a maximum of about 20% of the population by 14 hours
after the glycerol shock (Figure 31). Both EGFP-positive and negative cells increased in
number over a 24-hour time frame, with the growth of EGFP-negative cells outpacing EGFP-
positive cells. For this reason, the EGFP-positive subpopulation of cells fell to about 15% at
24 hours post-glycerol shock.
- 78 -
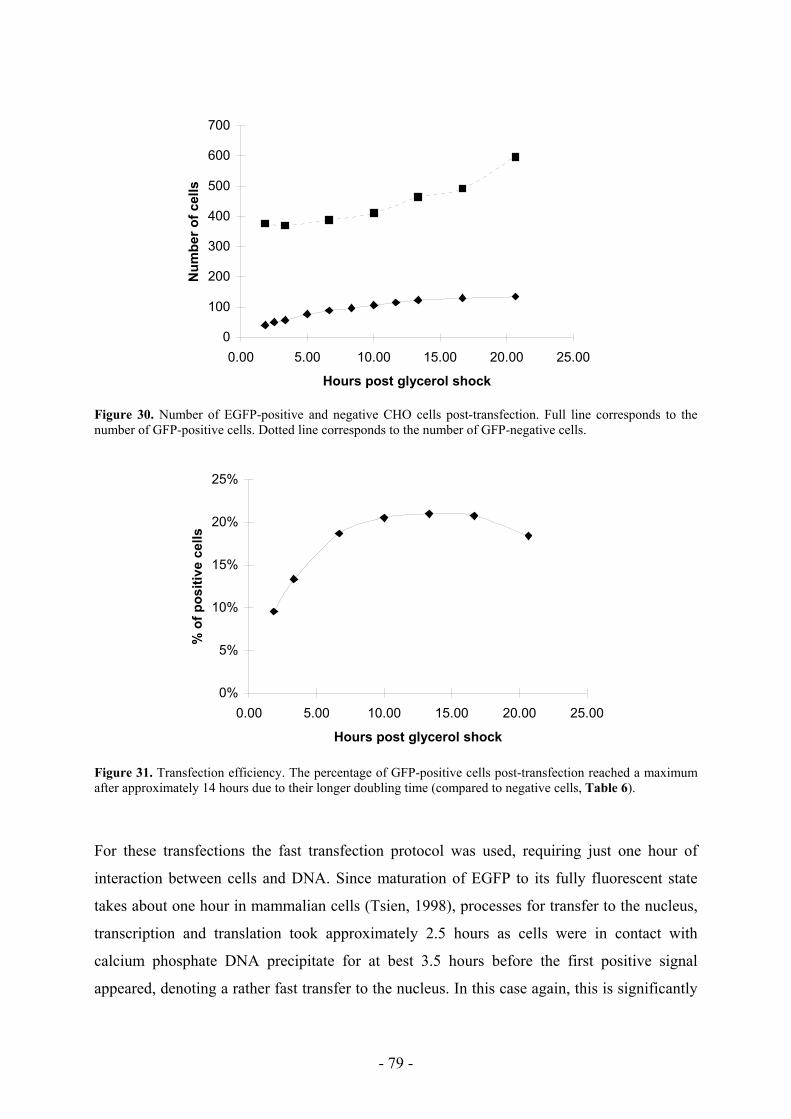
0
100
200
300
400
500
600
700
0.00 5.00 10.00 15.00 20.00 25.00
Hours post glycerol shock
Num
ber o
f cel
ls
Figure 30. Number of EGFP-positive and negative CHO cells post-transfection. Full line corresponds to the number of GFP-positive cells. Dotted line corresponds to the number of GFP-negative cells.
0%
5%
10%
15%
20%
25%
0.00 5.00 10.00 15.00 20.00 25.00
Hours post glycerol shock
% o
f pos
itive
cel
ls
Figure 31. Transfection efficiency. The percentage of GFP-positive cells post-transfection reached a maximum after approximately 14 hours due to their longer doubling time (compared to negative cells, Table 6). For these transfections the fast transfection protocol was used, requiring just one hour of
interaction between cells and DNA. Since maturation of EGFP to its fully fluorescent state
takes about one hour in mammalian cells (Tsien, 1998), processes for transfer to the nucleus,
transcription and translation took approximately 2.5 hours as cells were in contact with
calcium phosphate DNA precipitate for at best 3.5 hours before the first positive signal
appeared, denoting a rather fast transfer to the nucleus. In this case again, this is significantly
- 79 -
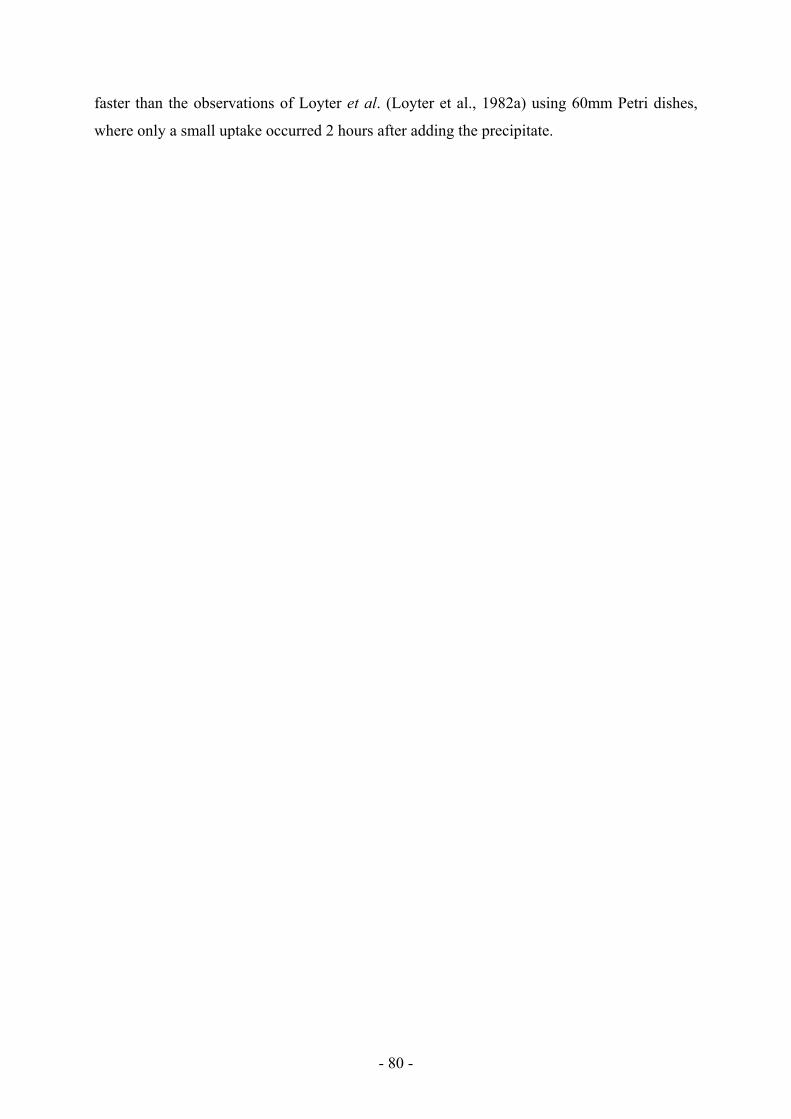
faster than the observations of Loyter et al. (Loyter et al., 1982a) using 60mm Petri dishes,
where only a small uptake occurred 2 hours after adding the precipitate.
- 80 -

7. Additional EGTA wash-step
An EGTA wash-step was added post-transfection to ensure that reporter gene expression only
occurred from plasmid DNA taken up by the cells during the time between the addition of the
transfection complex onto the cells and the osmotic shock. No efficient plasmid uptake
occurred after calcium phosphate complexes were washed away.
Visual controls under the microscope showed the complete removal of all remaining calcium
phosphate complexes on the transfected cells post-EGTA wash-step, whenever this wash step
was applied (before, during or after the glycerol shock).
Tests were performed to check if the EGTA wash-step would affect reporter gene expression
if performed before, after, or at the same time as the glycerol shock or one hour and two hours
after the latter (Figure 32).
0.00.20.40.60.81.01.21.41.61.82.0
no EGTA EGTAbeforeshock
EGTAduringshock
EGTAafter
shock
EGTA 1hafter
shock
EGTA 2hafter
shock
Rel
ativ
e Fl
uore
scen
ce c
ompa
red
to c
ontr
ol
Figure 32. EGTA wash step provided a reporter gene expression increase only if performed close to the osmotic shock. EGTA additional wash step was performed either just before, at the same time, just after, one hour after and two hours after glycerol shock. Cells not exposed to the EGTA wash-step post-transfection (darker bar) were used as control. The EGTA wash-step did not show any negative effects on reporter gene expression. On the
contrary, higher levels of reporter gene expression were achieved when the remaining calcium
phosphate precipitates were fully removed from the cells shortly before or after the glycerol
shock. If performed far from the glycerol shock, in spite of removing all the extra-cellular
- 81 -

calcium, no significant increase in reporter gene expression was observed. This was probably
related to additional calcium uptake by the cells (as in control), due to a longer exposure to
the precipitate and subsequent toxic side effects. Less precipitates uptake occurs if it is
quickly removed from the cells. Lower intracellular calcium concentrations are most likely
achieved with the EGTA wash-step performed close to glycerol shock, and thus fewer side
effects due to calcium.
7.1 EGTA treatment does not affect viability or growth rate
The growth performance of EGTA treated cells was measured. Growth curves and doubling
time were similar for control and EGTA treated cells (Figure 33), as well as the viability of
EGTA-washed cells (Figure 34).
0
2
4
6
8
10
12
14
16
18
20 40 60 80 100
Time post-seeding [hours]
Cel
l con
cent
ratio
n [1
0e+5
c/m
l]
Figure 33. Growth curve for EGTA washed cells (dashed line) and control cells (full line). Cells were seeded at 0.2e+5 c/ml and growth was monitored for 4 days. Doubling time calculated from these data points was respectively 13:24 hours and 13:18 hours for EGTA washed cells and control cells.
- 82 -
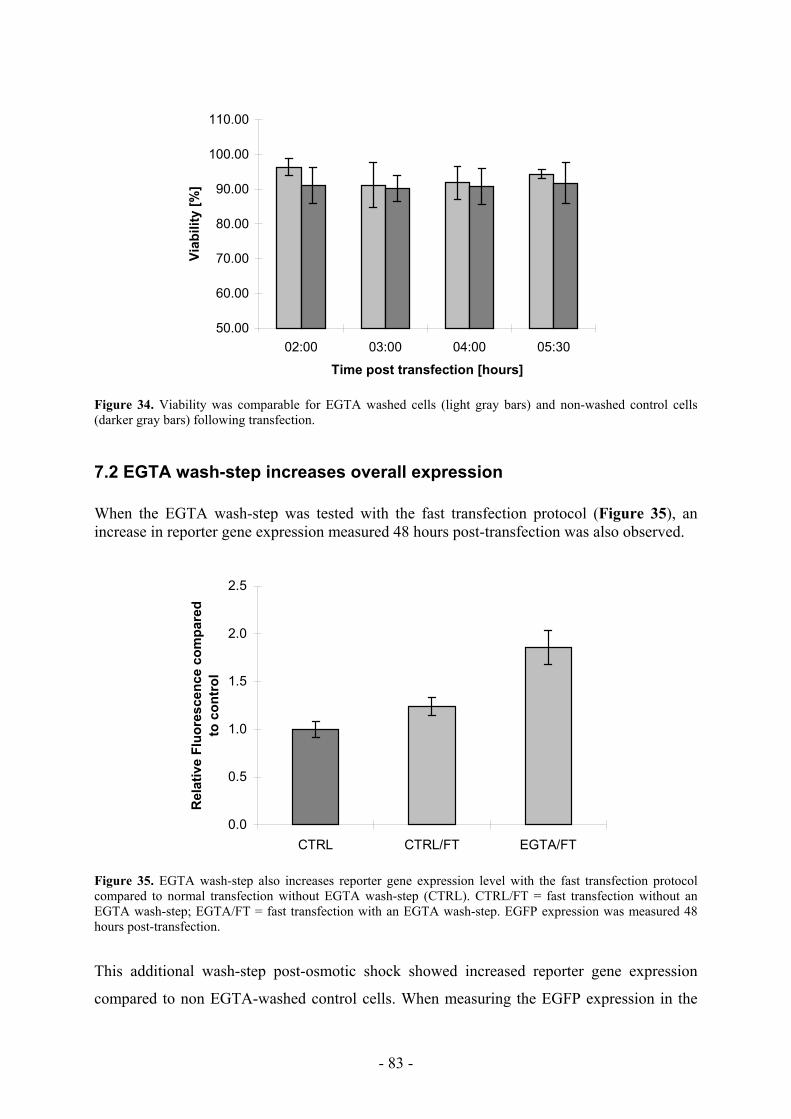
50.00
60.00
70.00
80.00
90.00
100.00
110.00
02:00 03:00 04:00 05:30
Time post transfection [hours]
Viab
ility
[%]
Figure 34. Viability was comparable for EGTA washed cells (light gray bars) and non-washed control cells (darker gray bars) following transfection.
7.2 EGTA wash-step increases overall expression When the EGTA wash-step was tested with the fast transfection protocol (Figure 35), an increase in reporter gene expression measured 48 hours post-transfection was also observed.
0.0
0.5
1.0
1.5
2.0
2.5
CTRL CTRL/FT EGTA/FT
Rel
ativ
e Fl
uore
scen
ce c
ompa
red
to c
ontr
ol
Figure 35. EGTA wash-step also increases reporter gene expression level with the fast transfection protocol compared to normal transfection without EGTA wash-step (CTRL). CTRL/FT = fast transfection without an EGTA wash-step; EGTA/FT = fast transfection with an EGTA wash-step. EGFP expression was measured 48 hours post-transfection.
This additional wash-step post-osmotic shock showed increased reporter gene expression
compared to non EGTA-washed control cells. When measuring the EGFP expression in the
- 83 -

first hours following transfection, instead of 48 hours post-transfection, the difference in the
fluorescence signals was already visible (Figure 36).
0100020003000400050006000700080009000
10000
3:30 4:30 5:30 6:30 7:30 8:30 9:30
Time post-transfection [hours]
Rel
ativ
e Fl
uore
scen
ce U
nits
[RFU
]
Figure 36. EGTA additional wash-step increases reporter gene expression signal already in the first hours post-transfection. EGTA-washed cells (dotted line) showed a clear higher reporter gene expression level compared to non-washed control cells (full line) already in the first hours following transfection.
It was studied whether the increase in reporter gene expression arose from a larger number of
positive cells post-transfection or from boosting the expression of a constant number of
positive cells. Microscope observations clearly showed (Figure 37) more positive cells in the
EGTA-washed population than in the control.
Figure 37. EGTA wash-step post-transfection (right) showed more positive cells in the transfected cell population than non-washed control (left). Both samples were transfected at the same time, with the same transfection mix. Cell confluence was equal in both samples. Pictures taken 24 hours post-transfection.
- 84 -
8. Role of glycerol shock
Glycerol shock did not show an increase in plasmid uptake (Batard et al., 2001) post
transfection, with the amount of intracellular plasmid remaining constant prior to and post-
glycerol shock. Thus its role is not to load more plasmids into cells. The same authors
proposed that destabilization of endosomal and lysosomal membranes by glycerol would
result in temporary pH neutralization within these compartments. Apparently this increases
the plasmid stability and favors its release in the cytosol. Sabelnikov (Sabelnikov, 1994)
proposed that glycerol affected the membrane fluidity.
As live imaging observations suggested, glycerol shock plays a strong role, because less
positive cells appeared when far from the time point where it was applied. Whenever
transfecting CHO DG44 cells with the calcium-phosphate method, high expression levels
were only obtained when cells were treated by an appropriate glycerol shock. It is important
that this shock is applied three hours (classical transfection protocol) or one hour (fast
transfection protocol) after the precipitate has been added onto the cells. It is essential for an
efficient reporter gene expression post transfection, and avoiding it results in low, or no
expression.
8.1 Visual effect of glycerol on cells
The one-minute glycerol shock provokes significant changes in the cellular morphology. The
most striking visible effect is rapid shrinking in volume of the cells. As shown in Figure 38,
glycerol solution acts rapidly upon its addition. In a matter of 10 seconds, cells flattened and
remained in this state until the glycerol solution was removed and cells were returned to
culture medium. One minute after returning into standard culture medium, no morphological
change was detectable compared to non-treated cells. Most cells are attached to the culture
vessel surface and thus the shrinking of the volume results in a flattening of the cells.
- 85 -

Figure 38. Visual effect of glycerol shock on adherent cells. A: cells prior to addition of glycerol. B: cells in glycerol after 10 seconds. C: cells in glycerol after 30 seconds. D: cells in glycerol after 60 seconds. E: cells 10 seconds after return in culture medium. F: cells 30 seconds after return in culture medium. G: cells 60 seconds after return in culture medium. Arrows indicate a detaching cell where a clear shrinkage is visible upon addition of the 10% glycerol solution.
Rounded, detached cells (cells going through mitosis) shrink upon addition of glycerol, thus
visibly reduce their diameter, and regain their original size/shape once glycerol is removed
and they are returned in culture medium.
8.2 Osmolarity effect of glycerol
This “shrinkage” of cells is most likely a purely osmotic effect induced by the high, non-
physiological, osmolarity of glycerol. The osmolarity of solutions used during culture and/or
transfection is given in Table 8.
- 86 -

Table 8. Osmolarity of the different solutions used during transfection
Osmolarity [mOsm] DMEM/F12 + 2% serum 326 DMEM/F12 without serum 328 Trypsine 296 PBS 1X 282 10% glycerol (in PBS 1X) 1976
Using different glycerol concentrations (0, 1, 2, 5, 10, 15, 20, 25 and 30%) (Table 9) showed
that only 10 and 15% glycerol gave good transfection efficiency. Higher concentrations had
negative effects on viability, whereas lower concentrations showed no effect at all. These
different glycerol concentrations were tested on synchronized cells while in S phase as a
comparison and the results obtained were similar (Figure 39).
Table 9. Osmolarity of the different solutions with increasing glycerol percentage
Osmolarity [mOsm] 0 % glycerol 282 1 % glycerol 454 2 % glycerol 628 5 % glycerol 1086 10 % glycerol 1978 15 % glycerol 2788 20 % glycerol 3618 25 % glycerol 4449 30 % glycerol 5279
- 87 -
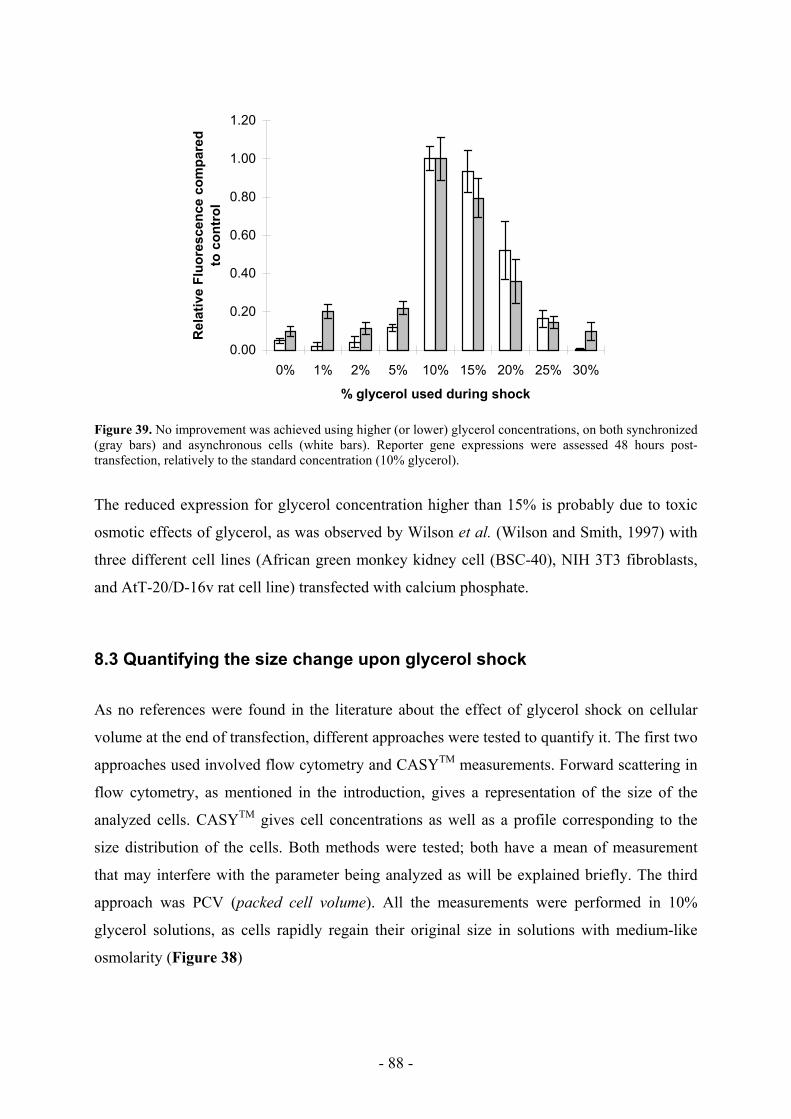
0.00
0.20
0.40
0.60
0.80
1.00
1.20
0% 1% 2% 5% 10% 15% 20% 25% 30%
% glycerol used during shock
Rel
ativ
e Fl
uore
scen
ce c
ompa
red
to c
ontr
ol
Figure 39. No improvement was achieved using higher (or lower) glycerol concentrations, on both synchronized (gray bars) and asynchronous cells (white bars). Reporter gene expressions were assessed 48 hours post-transfection, relatively to the standard concentration (10% glycerol).
The reduced expression for glycerol concentration higher than 15% is probably due to toxic
osmotic effects of glycerol, as was observed by Wilson et al. (Wilson and Smith, 1997) with
three different cell lines (African green monkey kidney cell (BSC-40), NIH 3T3 fibroblasts,
and AtT-20/D-16v rat cell line) transfected with calcium phosphate.
8.3 Quantifying the size change upon glycerol shock
As no references were found in the literature about the effect of glycerol shock on cellular
volume at the end of transfection, different approaches were tested to quantify it. The first two
approaches used involved flow cytometry and CASYTM measurements. Forward scattering in
flow cytometry, as mentioned in the introduction, gives a representation of the size of the
analyzed cells. CASYTM gives cell concentrations as well as a profile corresponding to the
size distribution of the cells. Both methods were tested; both have a mean of measurement
that may interfere with the parameter being analyzed as will be explained briefly. The third
approach was PCV (packed cell volume). All the measurements were performed in 10%
glycerol solutions, as cells rapidly regain their original size in solutions with medium-like
osmolarity (Figure 38)
- 88 -
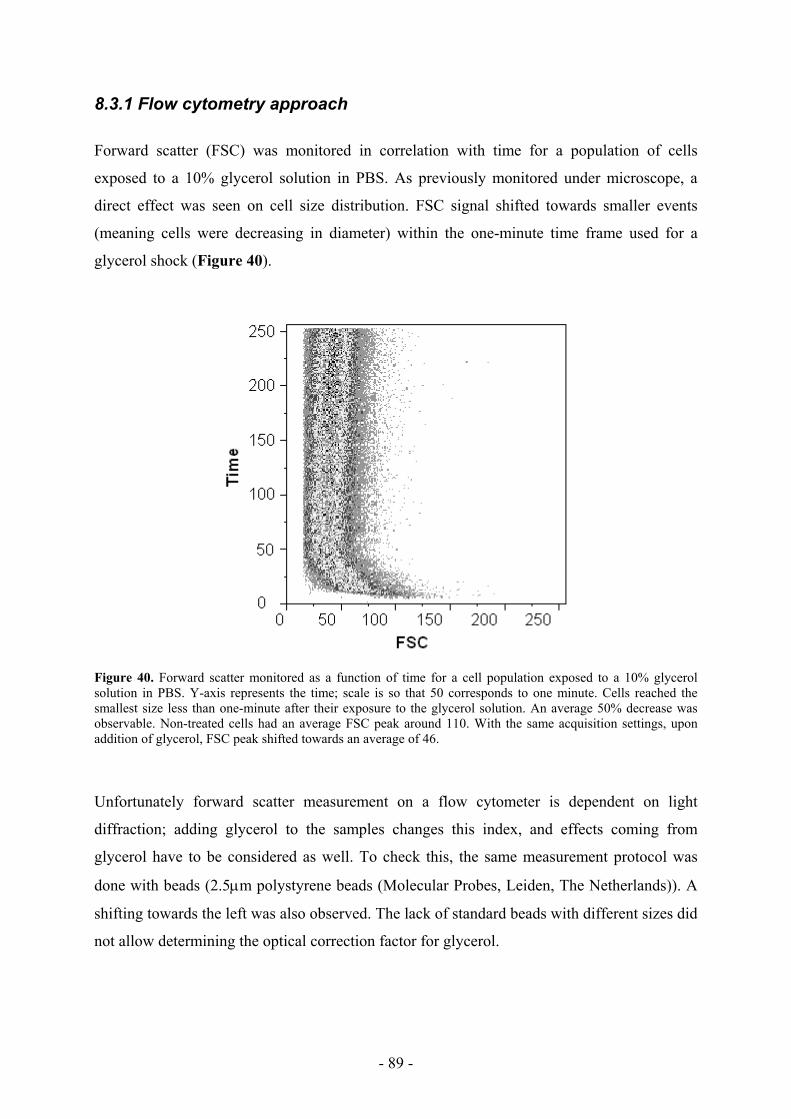
8.3.1 Flow cytometry approach
Forward scatter (FSC) was monitored in correlation with time for a population of cells
exposed to a 10% glycerol solution in PBS. As previously monitored under microscope, a
direct effect was seen on cell size distribution. FSC signal shifted towards smaller events
(meaning cells were decreasing in diameter) within the one-minute time frame used for a
glycerol shock (Figure 40).
Figure 40. Forward scatter monitored as a function of time for a cell population exposed to a 10% glycerol solution in PBS. Y-axis represents the time; scale is so that 50 corresponds to one minute. Cells reached the smallest size less than one-minute after their exposure to the glycerol solution. An average 50% decrease was observable. Non-treated cells had an average FSC peak around 110. With the same acquisition settings, upon addition of glycerol, FSC peak shifted towards an average of 46.
Unfortunately forward scatter measurement on a flow cytometer is dependent on light
diffraction; adding glycerol to the samples changes this index, and effects coming from
glycerol have to be considered as well. To check this, the same measurement protocol was
done with beads (2.5µm polystyrene beads (Molecular Probes, Leiden, The Netherlands)). A
shifting towards the left was also observed. The lack of standard beads with different sizes did
not allow determining the optical correction factor for glycerol.
- 89 -
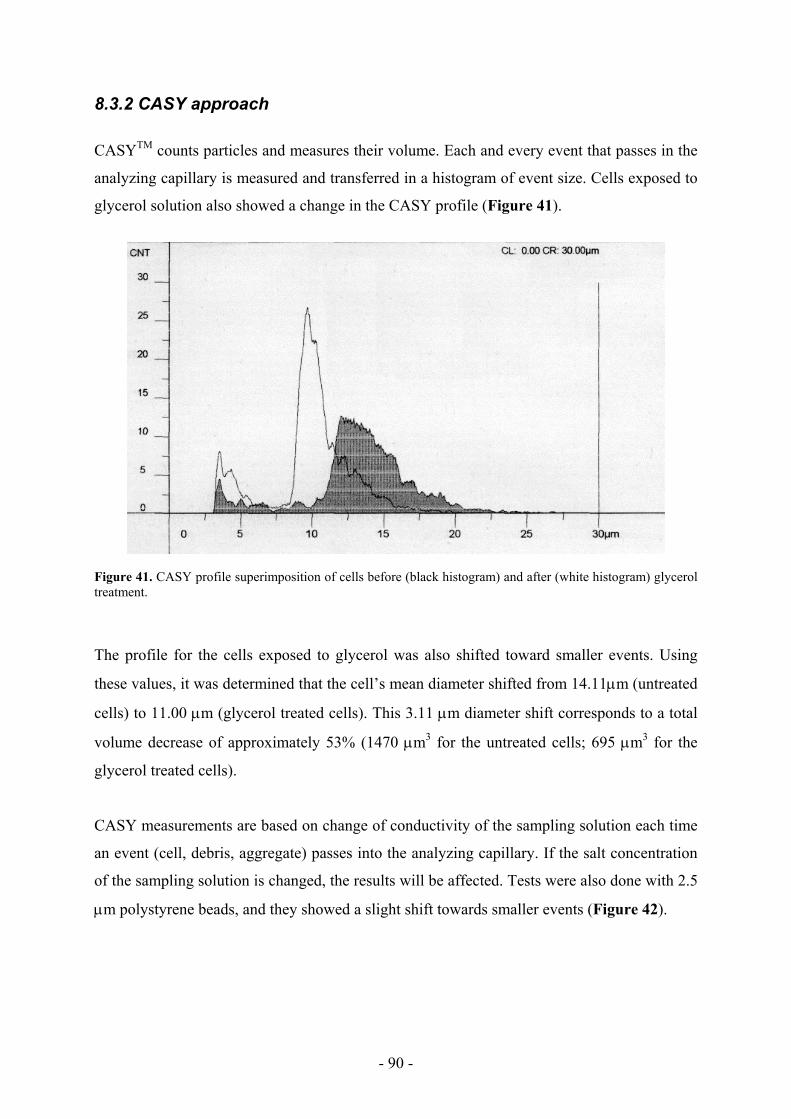
8.3.2 CASY approach
CASYTM counts particles and measures their volume. Each and every event that passes in the
analyzing capillary is measured and transferred in a histogram of event size. Cells exposed to
glycerol solution also showed a change in the CASY profile (Figure 41).
Figure 41. CASY profile superimposition of cells before (black histogram) and after (white histogram) glycerol treatment.
The profile for the cells exposed to glycerol was also shifted toward smaller events. Using
these values, it was determined that the cell’s mean diameter shifted from 14.11µm (untreated
cells) to 11.00 µm (glycerol treated cells). This 3.11 µm diameter shift corresponds to a total
volume decrease of approximately 53% (1470 µm3 for the untreated cells; 695 µm3 for the
glycerol treated cells).
CASY measurements are based on change of conductivity of the sampling solution each time
an event (cell, debris, aggregate) passes into the analyzing capillary. If the salt concentration
of the sampling solution is changed, the results will be affected. Tests were also done with 2.5
µm polystyrene beads, and they showed a slight shift towards smaller events (Figure 42).
- 90 -

Figure 42. Beads tested before (black histogram) and after (white histogram) glycerol treatment. Beads shifted from 2.64um to 2.52um.
Beads shifted from 2.64 µm (untreated) to 2.52 µm (treated with glycerol). This corresponded
to a volume decrease of approximately 14%. Therefore, glycerol affected the measurement
system by its presence in the sampled solution due its different conductivity compared to
CASYTON. No other beads sizes were available to quantify the influence of glycerol on
measurements and thus determine indirectly the real size shift.
8.3.3 PCV approach
With PCV (packed cell volume), cell sizes can be compared in presence or absence of
glycerol, as its presence does not affect the measurement principle. With this method a size
decrease of approximately 55% was estimated for the cells in the presence of 10% glycerol
(Figure 43 and Figure 44). Mini-PCV tubes were used (developed in our lab in collaboration
with TPP (TPP, Wohlen, Switzerland), not available on the market yet) with an Eppendorf
5417C centrifuge. The PCV assessment can be done within one minute (5’000 rpm for one
minute), corresponding therefore to the normal exposure time to glycerol during transfection.
- 91 -
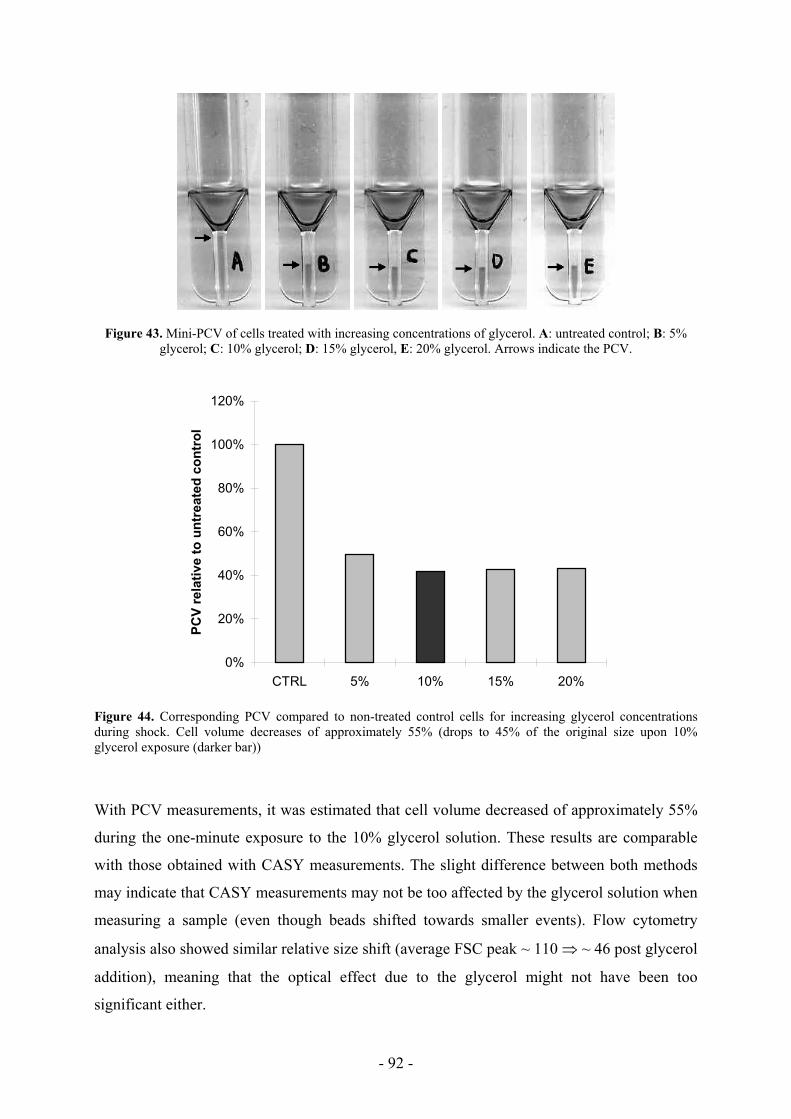
Figure 43. Mini-PCV of cells treated with increasing concentrations of glycerol. A: untreated control; B: 5% glycerol; C: 10% glycerol; D: 15% glycerol, E: 20% glycerol. Arrows indicate the PCV.
0%
20%
40%
60%
80%
100%
120%
CTRL 5% 10% 15% 20%
PCV
rela
tive
to u
ntre
ated
con
trol
Figure 44. Corresponding PCV compared to non-treated control cells for increasing glycerol concentrations during shock. Cell volume decreases of approximately 55% (drops to 45% of the original size upon 10% glycerol exposure (darker bar))
With PCV measurements, it was estimated that cell volume decreased of approximately 55%
during the one-minute exposure to the 10% glycerol solution. These results are comparable
with those obtained with CASY measurements. The slight difference between both methods
may indicate that CASY measurements may not be too affected by the glycerol solution when
measuring a sample (even though beads shifted towards smaller events). Flow cytometry
analysis also showed similar relative size shift (average FSC peak ~ 110 ⇒ ~ 46 post glycerol
addition), meaning that the optical effect due to the glycerol might not have been too
significant either.
- 92 -
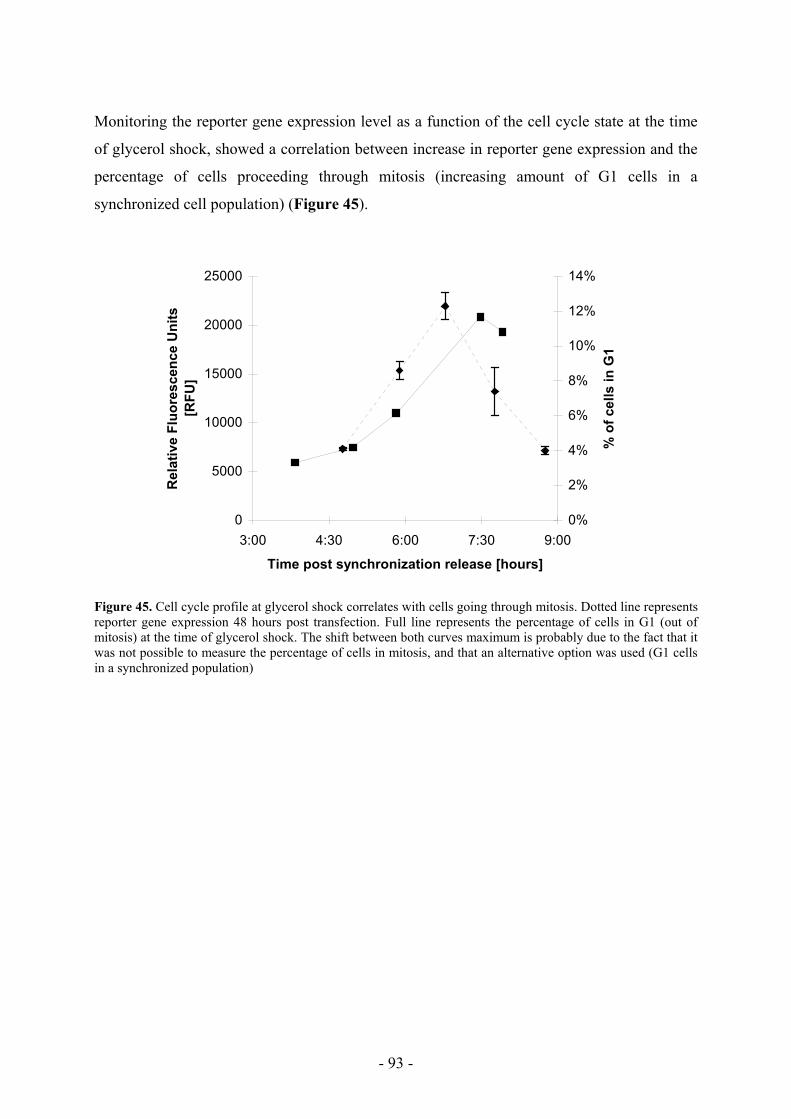
Monitoring the reporter gene expression level as a function of the cell cycle state at the time
of glycerol shock, showed a correlation between increase in reporter gene expression and the
percentage of cells proceeding through mitosis (increasing amount of G1 cells in a
synchronized cell population) (Figure 45).
0
5000
10000
15000
20000
25000
3:00 4:30 6:00 7:30 9:00
Time post synchronization release [hours]
Rel
ativ
e Fl
uore
scen
ce U
nits
[R
FU]
0%
2%
4%
6%
8%
10%
12%
14%
% o
f cel
ls in
G1
Figure 45. Cell cycle profile at glycerol shock correlates with cells going through mitosis. Dotted line represents reporter gene expression 48 hours post transfection. Full line represents the percentage of cells in G1 (out of mitosis) at the time of glycerol shock. The shift between both curves maximum is probably due to the fact that it was not possible to measure the percentage of cells in mitosis, and that an alternative option was used (G1 cells in a synchronized population)
- 93 -

- 94 -
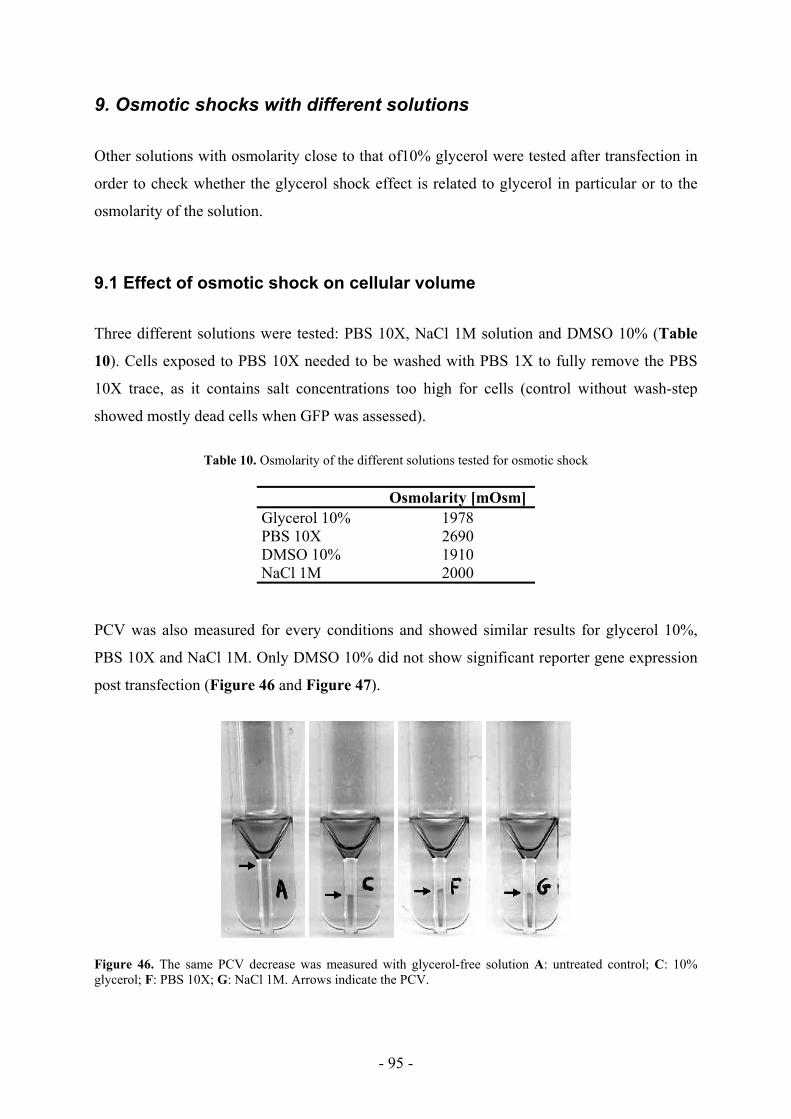
9. Osmotic shocks with different solutions
Other solutions with osmolarity close to that of10% glycerol were tested after transfection in
order to check whether the glycerol shock effect is related to glycerol in particular or to the
osmolarity of the solution.
9.1 Effect of osmotic shock on cellular volume
Three different solutions were tested: PBS 10X, NaCl 1M solution and DMSO 10% (Table
10). Cells exposed to PBS 10X needed to be washed with PBS 1X to fully remove the PBS
10X trace, as it contains salt concentrations too high for cells (control without wash-step
showed mostly dead cells when GFP was assessed).
Table 10. Osmolarity of the different solutions tested for osmotic shock
Osmolarity [mOsm] Glycerol 10% 1978 PBS 10X 2690 DMSO 10% 1910 NaCl 1M 2000
PCV was also measured for every conditions and showed similar results for glycerol 10%,
PBS 10X and NaCl 1M. Only DMSO 10% did not show significant reporter gene expression
post transfection (Figure 46 and Figure 47).
Figure 46. The same PCV decrease was measured with glycerol-free solution A: untreated control; C: 10% glycerol; F: PBS 10X; G: NaCl 1M. Arrows indicate the PCV.
- 95 -
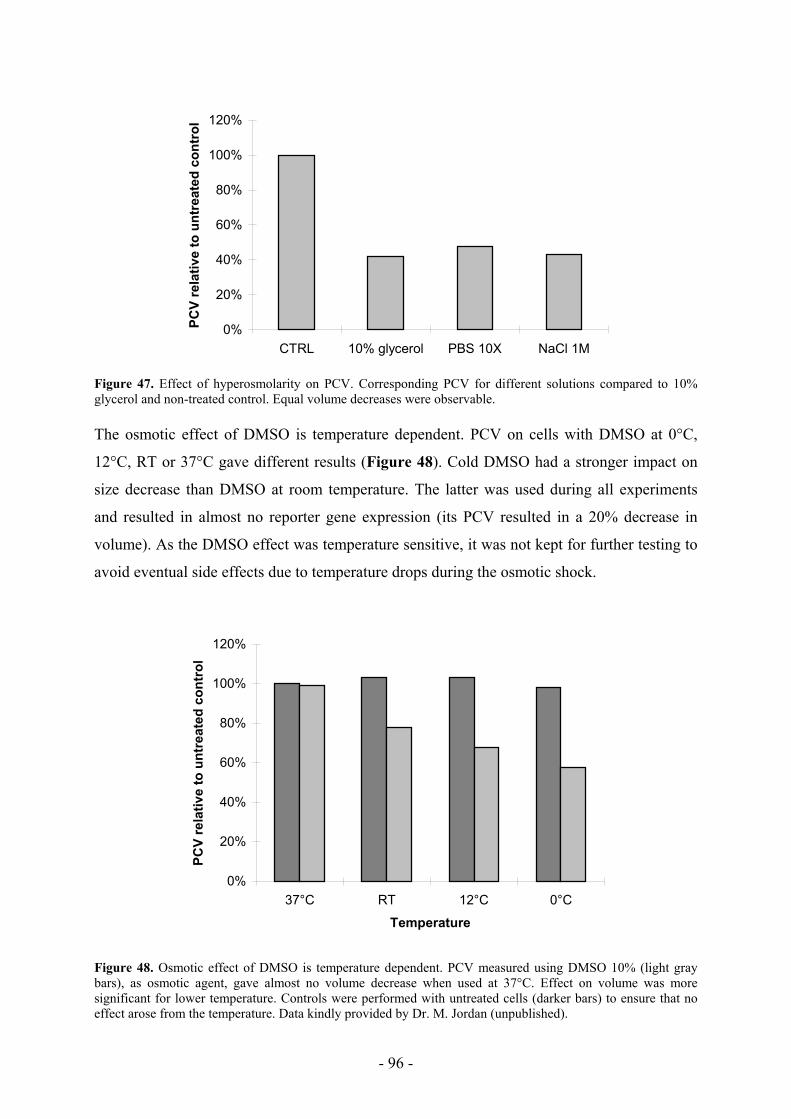
0%
20%
40%
60%
80%
100%
120%
CTRL 10% glycerol PBS 10X NaCl 1M
PCV
rela
tive
to u
ntre
ated
con
trol
Figure 47. Effect of hyperosmolarity on PCV. Corresponding PCV for different solutions compared to 10% glycerol and non-treated control. Equal volume decreases were observable. The osmotic effect of DMSO is temperature dependent. PCV on cells with DMSO at 0°C,
12°C, RT or 37°C gave different results (Figure 48). Cold DMSO had a stronger impact on
size decrease than DMSO at room temperature. The latter was used during all experiments
and resulted in almost no reporter gene expression (its PCV resulted in a 20% decrease in
volume). As the DMSO effect was temperature sensitive, it was not kept for further testing to
avoid eventual side effects due to temperature drops during the osmotic shock.
0%
20%
40%
60%
80%
100%
120%
37°C RT 12°C 0°C
Temperature
PCV
rela
tive
to u
ntre
ated
con
trol
Figure 48. Osmotic effect of DMSO is temperature dependent. PCV measured using DMSO 10% (light gray bars), as osmotic agent, gave almost no volume decrease when used at 37°C. Effect on volume was more significant for lower temperature. Controls were performed with untreated cells (darker bars) to ensure that no effect arose from the temperature. Data kindly provided by Dr. M. Jordan (unpublished).
- 96 -
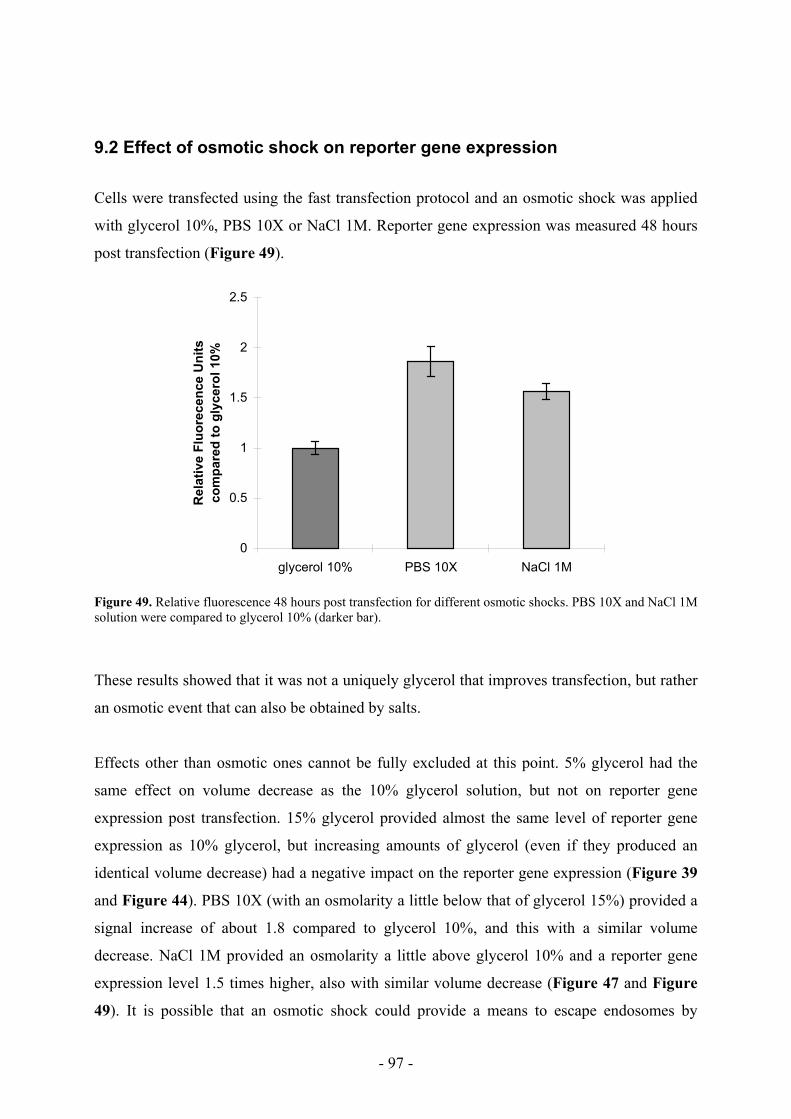
9.2 Effect of osmotic shock on reporter gene expression
Cells were transfected using the fast transfection protocol and an osmotic shock was applied
with glycerol 10%, PBS 10X or NaCl 1M. Reporter gene expression was measured 48 hours
post transfection (Figure 49).
0
0.5
1
1.5
2
2.5
glycerol 10% PBS 10X NaCl 1M
Rel
ativ
e Fl
uore
cenc
e U
nits
com
pare
d to
gly
cero
l 10%
Figure 49. Relative fluorescence 48 hours post transfection for different osmotic shocks. PBS 10X and NaCl 1M solution were compared to glycerol 10% (darker bar).
These results showed that it was not a uniquely glycerol that improves transfection, but rather
an osmotic event that can also be obtained by salts.
Effects other than osmotic ones cannot be fully excluded at this point. 5% glycerol had the
same effect on volume decrease as the 10% glycerol solution, but not on reporter gene
expression post transfection. 15% glycerol provided almost the same level of reporter gene
expression as 10% glycerol, but increasing amounts of glycerol (even if they produced an
identical volume decrease) had a negative impact on the reporter gene expression (Figure 39
and Figure 44). PBS 10X (with an osmolarity a little below that of glycerol 15%) provided a
signal increase of about 1.8 compared to glycerol 10%, and this with a similar volume
decrease. NaCl 1M provided an osmolarity a little above glycerol 10% and a reporter gene
expression level 1.5 times higher, also with similar volume decrease (Figure 47 and Figure
49). It is possible that an osmotic shock could provide a means to escape endosomes by
- 97 -
destabilizing their membrane (Batard et al., 2001; Sabelnikov, 1994), while at the same time
the cellular volume decreases (resulting in an increase of cytoplasmic plasmid concentration
and an easier entry in the nucleus).
- 98 -

10. Intracellular plasmid residence time for efficient reporter gene expression
To test how long the internalized plasmids remain effective for reporter gene expression,
asynchronous cells were transfected for one hour, before the calcium phosphate transfection
complex was removed by EGTA wash-step. At this point the plasmid is within the cell, but
not within the nucleus, as it seems that nuclear uptake is triggered by the osmotic shock. Cells
were left in the incubator for different periods of time before osmotic shock was applied
(Figure 50). It appeared that the osmotic shock could be delayed for approximately 30
minutes without losing much expression. A clear decrease in efficiency was measured for
cells incubated for more than half an hour before osmotic shock was applied. These data are
in agreement with the observations of Lechardeur et al. (Lechardeur et al., 1999) of an
intracellular DNA half-life of approximately 50 - 90 minutes.
0
0.2
0.4
0.6
0.8
1
1.2
0:00 0:15 0:30 0:45 1:00 1:15 1:30 1:45 2:00
Time between precipitate removal and osmotic shock [hours]
Rel
ativ
e Fl
uore
scen
ce c
ompa
red
to
cont
rol
Figure 50. Intracellular plasmid efficiency for transfection quickly decreases with time. Asynchronous cells were exposed to transfection complex for three hours before its complete removal by an EGTA wash-step. Cells were left to incubate for different periods of time before osmotic shock was applied. Reporter gene expression was measured 48 hours later. Control corresponds to cells where osmotic shock was applied one minute after the transfection precipitate was removed. T1/2 calculated from those values, for “efficient plasmid” transfer to the nucleus, was equal to 80 – 85 minutes.
The data also provided evidence that internalized plasmid DNA was still driving reporter gene
expression for at least 30 - 45 minutes after the uptake had finished (controls, where no
osmotic shock was applied, had no significant reporter gene signal measured).
- 99 -

- 100 -

11. Possibilities to target more cells during transfection
Cells apparently have to pass through mitosis to efficiently take up plasmid into the nuclear
environment and to express the reporter gene post-transfection. To further check the impact of
mitosis in cell expression post-transfection, cells were transfected twice with two plasmids
encoding different fluorescent reporter genes: pEGFP-N1 and DsRedExpress-N1 respectively
(both from Clontech). Both plasmids have the same promoter (CMV) and an equivalent size,
thus avoiding size- or promoter-related side-effects (Table 11)
Table 11. pEGFP-N1 and pDsRedExpress-N1 comparison. (Adapted from www.clontech.com)
Promoter Plasmid size Excitation Emission PEGFP-N1 CMV 4.7 Kbp 488 nm 507 nm pDsRedExpress-N1 CMV 4.7 Kbp 557 nm 579 nm
The first transfection was performed with EGFP coding vector, using the fast protocol and the
EGTA wash-step after glycerol shock to prevent any transfection complex entering the cells
post-osmotic shock. An hour and a half later, a second transfection was performed but this
time using DsRedExpress as a reporter gene (Figure 51). The 90-minute incubation between
both transfections was chosen based on the previous experiments (Figure 50). This time
period should ensure that no EGFP plasmids from the first transfection remained in the
cytoplasm when the second osmotic shock was applied. Under these conditions, the second
shock was performed two and a half hours after the first one. Based on Lechardeur et al.
observations of cytoplasmic plasmid half-life equals to 50 – 90 minutes (Lechardeur et al.,
1999). Controls were performed with both plasmids transfected at the same time (Figure 52).
Reporter gene expression was monitored 24 hours post-transfection and no co-localization
was visible, meaning that both vectors were expressed by two distinct sup-populations.
- 101 -

Figure 51. Two successive transfections, using first EGFP (middle) and then DsRedExpress (left), targeted different sup-populations of cells. Both vectors were transfected independently and no reporter gene co-localization was visible.
These results support the importance of mitosis for efficient plasmid transfer into the nucleus.
Once a cell has gone through mitosis, it will take another 12 hours before it goes through the
next one. If a second transfection is performed, cells that went through mitosis during the
glycerol shock at the end of the first transfection will not provide access to their nuclear
environment for the second plasmid molecules. If the time between two successive
transfections is shorter than the duration of the cell cycle, then no double positive cells will be
obtained. Half-life of cytoplasmic plasmid DNA is not long enough for them to subsist
through a complete cell cycle. Controls with both plasmids transfected at the same time, on
the other hands, showed co-localization of both reporter genes (Figure 52).
- 102 -

Figure 52. Co-localization of EGFP (left) and DsRedExpress (right) expression when transfected at the same time (mixed 1:1 prior to transfection complexation with calcium and phosphate)
Those results strongly indicated that whenever two or more plasmids have to be transfected in
cells (i.e. IgG, heavy and light chain sequences on two distinct plasmids), transfection must be
done in the presence of both plasmids if co-expression is required. Transfecting plasmid, one
after the other, with calcium phosphate, will not result in co-expression and therefore will
only provide poor expression titers (if any) in the transiently transfected population, unless a
stable expressing population is re-transfected with a second plasmid.
11.1 Multiple transfections
In theory, repetitive transfections should target different sub-populations, but when it was first
performed on an asynchronous cell population, without an EGTA wash-step, it did not result
in any signal increase (Figure 53). This was probably due to calcium accumulation inside the
cells. It was reported that calcium concentrations higher than 50mM had a negative impact on
cell viability (Lam and Cullis, 2000). Repetitive transfection, even if only exposing cells to
12.5mM calcium each time (normal transfection) could increase the intracellular pool of
calcium, finally reaching the same negative impact that would occur due to an exposure to
calcium with a concentration greater or equal to 50mM. The additional transfections were
performed after more than 3 hours incubation post-first transfection to ensure that no residual
intracellular plasmid from the first transfection would take part in the second transfection
procedure (Figure 50).
- 103 -
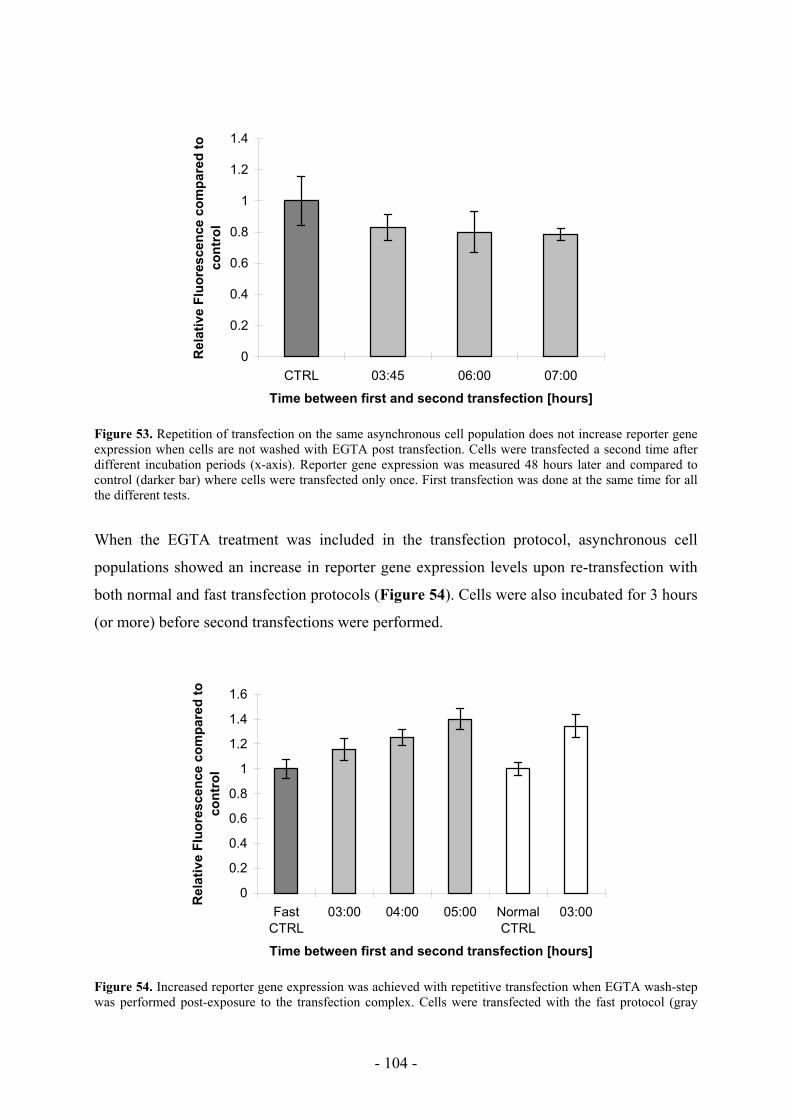
0
0.2
0.4
0.6
0.8
1
1.2
1.4
CTRL 03:45 06:00 07:00
Time between first and second transfection [hours]
Rel
ativ
e Fl
uore
scen
ce c
ompa
red
to
cont
rol
Figure 53. Repetition of transfection on the same asynchronous cell population does not increase reporter gene expression when cells are not washed with EGTA post transfection. Cells were transfected a second time after different incubation periods (x-axis). Reporter gene expression was measured 48 hours later and compared to control (darker bar) where cells were transfected only once. First transfection was done at the same time for all the different tests.
When the EGTA treatment was included in the transfection protocol, asynchronous cell
populations showed an increase in reporter gene expression levels upon re-transfection with
both normal and fast transfection protocols (Figure 54). Cells were also incubated for 3 hours
(or more) before second transfections were performed.
0
0.2
0.4
0.6
0.8
1
1.2
1.4
1.6
FastCTRL
03:00 04:00 05:00 NormalCTRL
03:00
Time between first and second transfection [hours]
Rel
ativ
e Fl
uore
scen
ce c
ompa
red
to
cont
rol
Figure 54. Increased reporter gene expression was achieved with repetitive transfection when EGTA wash-step was performed post-exposure to the transfection complex. Cells were transfected with the fast protocol (gray
- 104 -

bars) or the normal protocol (white bars) for their respective exposure times (i.e. one hour for the fast transfection, 3 hours for the normal transfection). Once the osmotic shock was performed, residual transfection complex was removed and cells were re-incubated for different periods of time (X-axis) before being transfected again. Both fast and normal protocol showed an increase in reporter gene expression when re-transfected compared to control.
This signal increase upon re-transfection with both normal and fast protocols indicated that
this phenomenon was not dependent on the transfection set-up. The difference between the
classical transfection and the fast transfection was probably due to the toxic effect of calcium
accumulation in cells and thus resulted in no signal increase upon normal re-transfection,
whereas the additional EGTA wash-step in the fast transfection protocol enabled reporter
gene increase upon re-transfection.
11.2 Repetitive osmotic shocks
Intracellular plasmid DNA was shown to drive reporter gene expression even after a delay of
45 minutes post cellular uptake, therefore tests were performed to check if more plasmid
molecules could reach nuclei of different subpopulations with repetitive osmotic shocks post-
transfection.
Assuming that plasmid DNA has access to the nuclear environment only during mitosis and
that DNA is rapidly degraded once it has been released into the cytoplasm, one could expect
to target the nuclei of different cell sub-populations, as they pass through mitosis, with
additional osmotic shocks performed while no significant plasmid degradation has occurred.
To test this hypothesis, cells were transfected with the fast protocol, and washed with EGTA
after the first osmotic shock, to prevent any additional precipitate to enter cells. Those same
cells were then subjected to additional osmotic shocks within the hour following the EGTA
wash-step. Reporter gene expression levels measured 48 hours post transfection (Figure 55)
showed that expression was higher for cells that had been exposed to repetitive osmotic
shocks compared to those where only the first osmotic shock was performed.
- 105 -

0
0.2
0.4
0.6
0.8
1
1.2
1.4
1.6
1.8
2
CTRL 2 shocks 3 shocks 4 shocksRel
ativ
e Fl
uore
scen
ce c
ompa
red
to c
ontr
ol
Figure 55. Repetitive osmotic shocks post transfection increase reporter gene expression compared to control. Cells were washed with EGTA post transfection to prevent entry of additional calcium phosphate DNA complex between the repetitive osmotic shocks. For each condition a first osmotic shock was performed one hour after addition of the precipitate and cells were washed with EGTA (control, darker bar). A second shock was applied 20 minutes after the first one, a third one 35 minutes after and a fourth 45 minutes after. 2 shocks indicates that the two first shock were applied on cells, 3 shocks means that the 3 first shocks were applied on cells, 4 shocks means that all the four consecutive shocks were applied on the cells.
Cell cycle analysis showed that cells kept passing through mitosis during the whole process,
as the percentage of cells in G1 increased (meaning that more cells went through division)
during the consecutive osmotic shock period (Figure 56). The signal still increased for the
two last time points, even though the G1 cell percentage decreased. This may result from the
cumulative effect of multiple osmotic shocks performed on the cells. The G1 cell percentage
does not reflect the exact number of cells that went through mitosis, as cells keep on dividing
(and thus enter the G1 peak) and proceed further away in the cell cycle (entering S phase, and
thus leaving the G1 peak). It does reflect however, that there are still a significant number of
cells in G1 phase at the time of repetitive osmotic shock treatment.
- 106 -
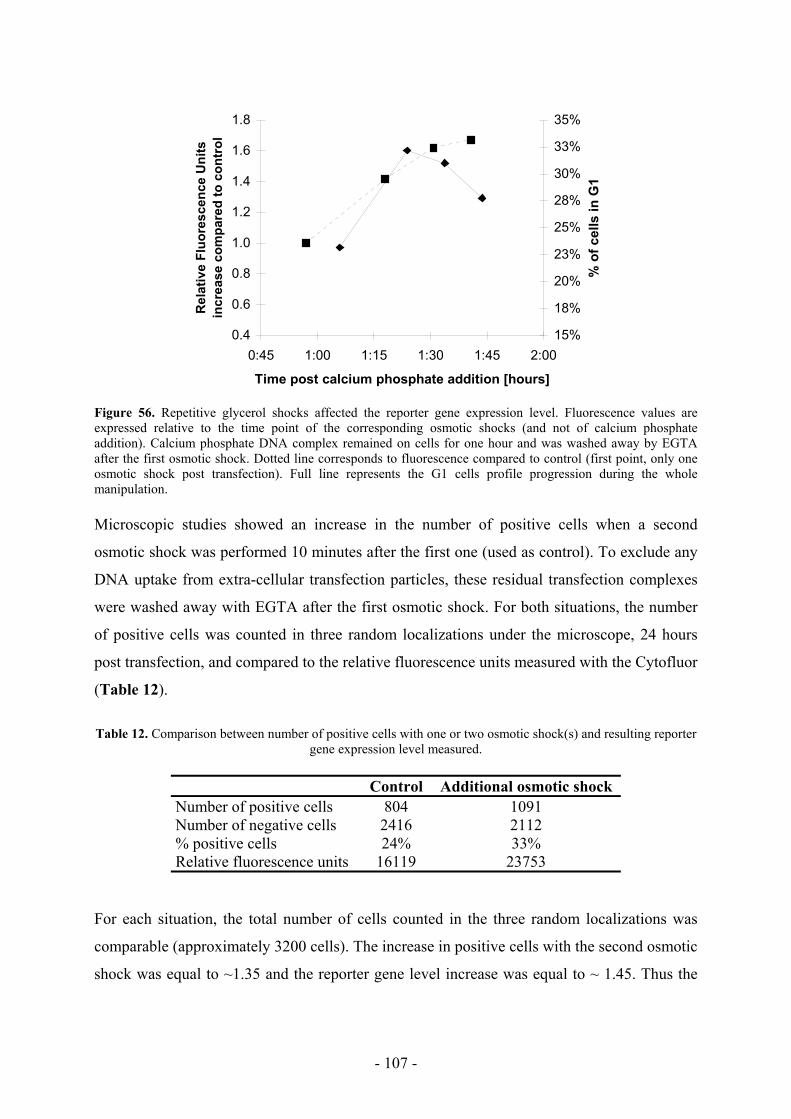
0.4
0.6
0.8
1.0
1.2
1.4
1.6
1.8
0:45 1:00 1:15 1:30 1:45 2:00
Time post calcium phosphate addition [hours]
Rel
ativ
e Fl
uore
scen
ce U
nits
in
crea
se c
ompa
red
to c
ontr
ol
15%
18%
20%
23%
25%
28%
30%
33%
35%
% o
f cel
ls in
G1
Figure 56. Repetitive glycerol shocks affected the reporter gene expression level. Fluorescence values are expressed relative to the time point of the corresponding osmotic shocks (and not of calcium phosphate addition). Calcium phosphate DNA complex remained on cells for one hour and was washed away by EGTA after the first osmotic shock. Dotted line corresponds to fluorescence compared to control (first point, only one osmotic shock post transfection). Full line represents the G1 cells profile progression during the whole manipulation. Microscopic studies showed an increase in the number of positive cells when a second
osmotic shock was performed 10 minutes after the first one (used as control). To exclude any
DNA uptake from extra-cellular transfection particles, these residual transfection complexes
were washed away with EGTA after the first osmotic shock. For both situations, the number
of positive cells was counted in three random localizations under the microscope, 24 hours
post transfection, and compared to the relative fluorescence units measured with the Cytofluor
(Table 12).
Table 12. Comparison between number of positive cells with one or two osmotic shock(s) and resulting reporter
gene expression level measured.
Control Additional osmotic shock Number of positive cells 804 1091 Number of negative cells 2416 2112 % positive cells 24% 33% Relative fluorescence units 16119 23753
For each situation, the total number of cells counted in the three random localizations was
comparable (approximately 3200 cells). The increase in positive cells with the second osmotic
shock was equal to ~1.35 and the reporter gene level increase was equal to ~ 1.45. Thus the
- 107 -
signal increase resulted from a larger amount of positive cells among the transfected
population rather than positive cells being more positive.
- 108 -

12. Cell cycle related model for calcium phosphate transfection
As was shown before, calcium phosphate plasmid DNA is taken up by the cells,
independently of the presence of plasmid, by endocytosis after settling down on the
membrane (Scheme A) (Coonrod et al., 1997; Loyter et al., 1982b; Orrantia and Chang,
1990). This uptake event is rather fast once the precipitate has settled down on the cells. The
fast transfection protocol demonstrated that cells exposed to the calcium phosphate precipitate
(with remaining complexes washed away by EGTA) for just one hour achieved reporter gene
expression levels as high as those achieved with a three hour exposure during a normal
transfection.
Endosomes tend to migrate towards the center of the cells, resulting in enrichment in late
endosomes/lysosomes in the perinuclear region (Coonrod et al., 1997) (Scheme B). This
enrichment was confirmed by confocal microscopy. Cells transfected with pEGFP-Endo
(Clontech, Palo Alto, CA, USA), a fusion protein targeted to the membrane of endosomes,
showed an accumulation of the endosomes in the perinuclear region (Figure 57).
- 109 -

Figure 57. Endosome enrichment in the perinuclear region (right). Acquisitions were done 13 hours post-
transfection. Contrast phase picture clearly showed the nucleus localization (left). Bars represent 10 µm.
The transfection complex must then escape endosomes before it can enter the nucleus.
Haberland et al. suggested that the presence of micro-precipitates of calcium phosphate, as
well as soluble Ca2+, could play a role in mechanisms of membrane lysis and escape from
endosomal/lysosomal compartments (Haberland et al., 1999). This effect even seemed to be
increased with precipitate compared to soluble Ca2+; Loyter et al. also mentioned that calcium
phosphate may cause local solubilization of phagocytic vacuoles, allowing leakage of DNA
into the cytoplasm (Loyter et al., 1982a). Zakai et al. reported local solubilization of
phospholipid bilayers due to calcium phosphate precipitates (Zakai et al., 1977). This could
provide a way out of endosomes for the calcium phosphate DNA complex (Scheme C). Some
plasmid DNA molecules may be lost through fusions of endosomes with other vesicles (such
as early lysosomes or secretory vesicles).
- 110 -

This is where the cell cycle plays a key role for efficient transfer of plasmid DNA in the
nuclear environment. First on the transfection level: cell cycle is important for plasmid uptake
through endocytosis in order to have DNA entry at the right time frame to prevent too much
degradation after its release in the cytoplasm and before it has access to the nucleus. This
access to the nucleus is then greatly facilitated when the cells go through mitosis (i.e. nuclear
membrane gets disrupted, thus facilitating diffusion of plasmid DNA in the nuclear
environment).
On top of that membrane disruption, if osmotic shock (such as glycerol 10%) is applied at the
right moment in the cycle (mitosis), the significant cell volume decrease that will occur
(approximately 55%) without loss of plasmid already taken up by the cells, as shown by
Batard et al.(Batard et al., 2001). This cell volume reduction will increase the intracellular
concentration of plasmid DNA molecules, thus increasing the probability to diffuse in the
nucleus through its disrupted membrane and this before plasmid DNA gets degraded by
nucleases in the cytoplasm (Loyter et al., 1982b; Orrantia and Chang, 1990) (Scheme D).
Electron microscopic data obtained by Loyter et al. (Loyter et al., 1982b) showed that plasmid
DNA enters the nucleus as part of a calcium phosphate complex, hence still protected from
nucleases. If glycerol shock is performed far from mitosis, little reporter gene expression level
will be achieved, because most of the plasmid DNA molecules will become degraded before
they can access the nucleus. The protective effect of calcium against plasmid degradation was
also shown by Lam et al., where additional calcium was mixed with liposome complexes for
transfection, and yielded significantly more intact plasmid DNA in the cells in comparison
with liposome complexes used alone (Lam and Cullis, 2000). These authors showed optimal
calcium concentration for transfections ranging from 5 to 25mM (calcium phosphate
transfection protocol used here falls in between those values, as cells are exposed to a calcium
- 111 -
concentration of 12.5mM during transfection). Higher concentrations of calcium induced
cytotoxicity.
Some partially degraded plasmid may enter the nucleus by diffusion, without the need for
mitosis. Escriou et al. suggested that plasmid DNA could cross the nuclear envelope of CV-1
cells with very low efficiency, but that mitosis considerably enhanced expression of a
transgene (Escriou et al., 2001). According to Coonrod et al., all cells are competent for linear
plasmid uptake in the nucleus, but the bulk of transfected DNA is rapidly eliminated from the
nucleus, probably by a protective mechanism involved in nuclear elimination of exogenous
DNA (Coonrod et al., 1997). The efficiency of such a mechanism may also give insight on the
better transfectability of certain cell lines. Expression may occur in cells whose nuclei are
heavily enough loaded with plasmid DNA molecules that they cannot eliminate all of them.
This could also explain why not all the cells that were in mitosis, during the osmotic shock,
expressed the reporter gene afterwards.
Repetitive osmotic shocks also increase the level of reporter gene expression achieved,
because it provides plasmid entry in other subpopulations of cells going through mitosis,
which were prevented nuclear access during the first shock. These repetitive osmotic shocks
are efficient as long as plasmid DNA is not degraded in the cytoplasm but rapidly became
ineffective because of increasing cytoplasmic plasmid degradation.
The duration of the mitotic phase is approximately 1 hour. Therefore, even with transfection
complexes that are efficiently internalized and released into the cytoplasm, the window of
opportunity, within a typical cell cycle of approximately 12 – 14 hours, to efficiently enter the
nucleus is limited to 1 hour during the mitotic breakdown of the nuclear membrane.
Once the nuclear membrane does reform (post-mitosis), plasmid DNA will be enclosed inside
the nucleus of the two newly divided daughter cells (Scheme E). Plasmids remaining in the
cytoplasm will get degraded.
- 112 -

Plasmid DNA will then get transcribed into mRNA, exported to the cytoplasm and translated
into protein (Scheme F). This process also is rather fast. Detectable reporter gene expression
(EGFP) was already observable two and a half hours post mitosis. Knowing that EGFP needs
one hour to maturate to its fluorescent form (Tsien, 1998), this means that transcription into
mRNA was done during the 1 – 1.5 hour following mitosis (and plasmid localization in the
nuclear environment).
This hypothetical mechanism of action for calcium phosphate mediated transfection implies
three distinct roles played by calcium phosphate:
• It provides a way for the plasmid DNA (once complexed) to enter the cells through
endocytosis (Loyter et al., 1982a)
• Once inside endosomes, it affects the membrane, creating local solubilization and thus
enables release in the cytoplasm (Zakai et al., 1977).
• It protects the plasmid DNA from nuclease activity in the cytoplasm (Lechardeur et
al., 1999).
- 113 -

- 114 -

Conclusion
- 115 -

- 116 -

Complexation of plasmid DNA with calcium phosphate has many advantages for transfection.
It enables plasmid DNA internalisation through endocytosis and probably also triggers
endocytosis as cells exposed to calcium phosphate showed more endocytotic vesicles than
control cells (Loyter et al., 1982a). It also protects plasmid DNA from intracellular
degradation by nucleases present in the cytoplasm (Lechardeur et al., 1999), probably by
preventing reaction with the catalytic sites of the enzymes due to steric obstruction provided
by the precipitate. Calcium phosphate may even create local solubilization of the endosome
membrane (Zakai et al., 1977), allowing leakage of plasmid DNA into the cytoplasm.
Electron microscopy studies showed that the entire calcium phosphate DNA complex entered
the nuclei (Loyter et al., 1982b) thus providing protection during the whole transfer from the
cellular membrane to the nucleus. However, this is probably a relatively rare event as only
10% of the internalised plasmid DNA molecules were found in the nuclei of transfected cells
(Orrantia and Chang, 1990). This low yield in nuclear internalisation is probably due to the
fact that cytoplasmic plasmid DNA has a half-life of approximately 50 – 90 minutes
(Lechardeur et al., 1999). If not internalised rapidly, plasmid DNA molecules are degraded in
the cytoplasm (Lechardeur et al., 1999; Orrantia and Chang, 1990). No plasmid degradation
was shown to occur in the endosomes (Wattiaux et al., 2000).
The cell cycle was monitored to see if it had any implication for efficient transfer of plasmid
DNA molecules in the nuclear environment. Using mimosine synchronized cells, it was
possible to show that it does, indeed, play an important role. The first observations led to the
conclusion that the cell cycle state at the time of addition of the transfection complex onto the
cells was important. A clear correlation was observed between the percentage of cells in S
phase at the time of addition of the calcium phosphate precipitate onto the cells and the
subsequent reporter gene expression measured 48 hours later. Using a faster transfection
protocol, requiring a shorter exposition of the cells to the transfection complex, showed that
this correlation with the cell cycle was still present but also showed that the optimal timing for
the transfection complex addition was dependent on the transfection set-up used.
Knowing that plasmid DNA molecules are rapidly degraded in the cytoplasm if they are not
internalised into the nucleus, live imaging studies were performed to check if it was possible
to distinguish any specificity in the cells that expressed the reporter gene post-transfection
compared to those which remained negative. The results suggest that mitosis is an important
event required for subsequent reporter gene expression, probably due to disruption of the
- 117 -

nuclear membrane occurring during mitosis, which would facilitate access to the nuclear
environment for the plasmid DNA.
The optimal timing for transfection complex addition onto the cells had to be optimised
according to the transfection set-up, as shown with the classical transfection protocol and the
fast transfection protocol, in order to achieve plasmid release in the nuclear vicinity when the
larger amount of the transfected cells passed through mitosis. If released too remote from
mitosis, plasmid DNA molecules will get degraded before they can have access to the nuclear
environment. When using the fast transfection protocol, calcium phosphate DNA settled down
on cells more rapidly than with the classical approach, thus the optimal timing for the addition
of the transfection complex was closer to mitosis. Once internalised with either one of the two
transfection methods, the time required to reach the nucleus vicinity was probably identical,
the only difference for the addition of the transfection complex relative to the cell cycle being
the settling time.
Monitoring the apparition of positive cells post transfection also demonstrated the importance
of the glycerol shock. The more remote from the glycerol shock, the less mitoses resulted in
daughter cells expressing the reporter gene. The glycerol shock was shown to have a drastic
effect on the cell volume. During the one-minute exposure to the 10% glycerol solution,
cellular volume decreased by approximately 55%. Cells regained their original size quickly
upon returning them to culture medium. Since no plasmids are gained or lost during this
strong osmotic shock (Batard et al., 2001), it resulted in an increase of the intracellular
plasmid concentration.
The synergy of glycerol shock and cells proceeding through mitosis was a requirement for
efficient reporter gene transfer in nuclei. If one of the two was omitted, or if they did not
happen at the same time, very low reporter gene expression was achieved. The role of the
glycerol shock was shown not to rely on glycerol itself, but rather on the osmotic strength,
since different other solutions (PBS 10X, NaCl 1M) producing similar volume decreases,
yielded reporter gene expressions as high as those achieved with glycerol 10%, if not higher.
The osmotic shock probably has two different roles. The first being to reduce the cellular
volume, thus helping plasmid DNA molecules transfer into nuclei of mitotic cells, by
increasing their intracellular concentration. The second being to destabilize the endo-
- 118 -

lysosomal membranes, thus providing leakage of plasmid DNA in the cytoplasm (Batard et
al., 2001; Sabelnikov, 1994). Both effects play a role in the overall transfer of plasmid DNA
molecules from the endosomes to the nuclei. The second effect was probably also reflected in
the fact that even if it produced a similar volume decrease as glycerol 10%, the 5% glycerol
solution only resulted in very low reporter gene expression, whereas glycerol concentrations
higher than 15% resulted in increased cell death, in agreement with Wilson et al. (Wilson and
Smith, 1997).
As it was found that plasmid DNA was driving reporter gene expression even after a delay of
45 minutes post-cellular uptake, it was possible during that time to efficiently transfer them in
nuclei of different sub-populations of cells, by applying repetitive osmotic shocks, each
targeting successive sub-populations of mitotic cells.
In theory, cells that went trough mitosis close to the osmotic shock at the end of a first
transfection will not provide access to their nuclear environment for a second plasmid
transfected shortly after the first one. This was shown to be true when transfecting a cell
population once with EGFP and 90 minutes later with DsRedExpress, as no co-localization of
both reporter genes was observed, whereas complete co-localization was achieved when both
were transfected at the same time. These results strongly indicated that whenever two
plasmids have to be transfected in cells, transfection must be done in presence of both
plasmids at the same time if co-expression is expected.
Removing the excess of calcium phosphate precipitate post-glycerol shock with an additional
EGTA wash-step was shown to be positive for subsequent reporter gene expression, probably
by lowering the surrounding calcium concentration and thus avoiding toxic effects due to high
calcium concentrations. This small additional step post-transfection resulted in reporter gene
increase of about 1.5 to 2 times compared to control.
Live imaging also provided information on doubling times of both positive and negative cells.
The fact that cells expressing a reporter gene have a longer doubling time (18 – 22 hours)
compared to negative cells (12 – 14 hours) may explain why it is difficult to achieve high
percentages of positive cells in a transiently transfected population, as negative cells rapidly
outgrow positive cells.
- 119 -

Controlling the cell cycle is apparently not enough to achieve 100% efficiency of transfection.
Levels of plasmid uptake, calcium phosphate DNA complex morphology and internal plasmid
degradation in the transfected population also play important roles that are difficult to control.
Nonetheless, all these results taken together permitted to define a model explaining the
importance of both mitosis and osmotic shock for efficient plasmid DNA molecules transfer
into nuclei, due to the increased intracellular concentration in presence of disrupted nuclear
membrane that they provide when occurring at the same time. This model may also explain
why certain non-dividing cell lines (i.e. neurons or muscle cells) are difficult to transfect, due
to the absence of nuclear membrane disruption.
This model does not fit with the hypothesis of Orrantia et al. that plasmid DNA does not pass
through the cytosol before it enters the nucleus but is transported directly from endosomes-
lysosomes to the nucleus through an intermediary vesicles (Orrantia and Chang, 1990), unless
such vesicles would selectively interact with mitotic cell nuclei only, and plasmid degradation
would take place in those vesicles as it does in the cytoplasm (Lechardeur et al., 1999)
- 120 -

Perspectives
- 121 -

- 122 -

As demonstrated in this work, cell cycle plays an important role in the transfer of plasmids in
the nucleus of CHO cells. Those observations can be used, not only for transient transfection
but also in stable integration of plasmid DNA. By increasing the probability to have plasmid
DNA in the nucleus, the probability to have a random integration resulting in a stable
expression should also increase (selection and amplification of the positive clones would still
be required afterwards).
Cell cycle analysis of cells in suspension (in spinners, or bioreactors) by flow cytometry prior
to transfection, should help to determine the best time to add the transfection complex onto
these cells. This would also avoid low efficiencies due to partial synchronization of the
culture, where more plasmid would be degraded in the cytoplasm than efficiently accessing
the nucleus.
Cell culture conditions for large-scale transfection (i.e. bioreactor) can certainly be optimized
to partially synchronize them (without need for medium exchange as with mimosine).
Monitoring the cell cycle after re-initiation would then help determining the appropriate time
to add the transfection complex. Such large-scale synchronization could be achieved, for
instance, by using nutriment deprivation, and re-initiation of the cycle could be done upon
nutriment complementation of the medium. Such synchronization would prevent the high
costs involved with large-scale mimosine synchronization, due to medium exchanges.
A means to synchronize cells just prior to entry in mitosis should enable to achieve higher
positive CHO cells post transfection, ensuring that such a synchronization would not affect
plasmid uptake. Mimosine synchronization is an interesting tool, but the loss in synchrony
and the fact that it was difficult to achieve a highly synchronous passage through mitosis is
probably responsible for the fact that 30 – 40 % positive cells at maximum could be observed
post transfection. This non-synchronous passage through mitosis was also demonstrated by
the signal increase resulting from multiple osmotic shocks post-transfection.
EGTA wash-step also demonstrated a positive side effect when used on transfected cells, as
an increased reporter gene level was achieved (1.5 to 2.5 times, see annex) compared to
controls. Even if the cellular effect of such an additional wash-step at the end of transfection
is not fully understood, it should be added to the protocol of calcium-phosphate transfection.
Further studies to fully understand why it does result in higher reporter gene expression
- 123 -
should provide interesting information about calcium phosphate and maybe the limit of this
transfection method (possibly due to the high calcium concentration used during the process).
Indications of a “negative” role for the calcium concentration used were found with EGTA
wash step (increase the reporter gene level, maybe due to the removal of an inhibition due to
large amount of calcium).
The fast transfection protocol developed during this work may provide an interesting
alternative way for transfection of adherent CHO cells. The whole process from seeding to
osmotic shock at the end of transfection is performed in 5 hours instead of 22 hours with the
protocol defined by Jordan et al. ((Jordan et al., 1996) and can therefore be done in less than a
day
Monitoring stained-plasmid DNA uptake with flow cytometry combined with cell cycle and
osmotic shock effects on different cell lines (HEK, BHK…) may provide information that
could explain why some cells seem more transfectable than others. This could also be used to
determinate the plasmid uptake rate of those different cell lines.
Better monitoring of the mitotic cells through flow cytometry (using stains specific to mitotic
cells, such as marker for histone H3 phosphorylation (Darzynkiewicz et al., 2001; Hans and
Dimitrov, 2001; Hendzel et al., 1997; Juan et al., 2001; Juan et al., 1998; Van Hooser et al.,
1998; Wei et al., 1998)) would provide more precise tools for analysis and more precise
information on the role played by mitosis during, for instance, repetitive osmotic shock post-
transfection.
Working with stained DNA (i.e. stained with Mirus Label IT® Tracker™ Intracellular
Nucleic Acid Localization Kit, Madison, WI, USA) and stained endosomes could provide
precious information on the hypotheses developed in the “cell cycle related model for calcium
phosphate transfection”, combined with live imaging. This would enable checking how many
cells that uptake plasmid DNA have it localized in the nucleus afterwards, and if it really gets
in during mitosis. This could also validate/invalidate the exogenous DNA elimination system
proposed by Coonrod et al. (Coonrod et al., 1997). This would also give more insights on the
exact role of glycerol.
- 124 -

Bibliography
- 125 -

- 126 -
Alberts, B., Bray, D., Lewis, J., Raff, M., Roberts, K. and Watson, J.D. (1994) Molecular
biology of the cell. Garland Publishing, Inc., New York. Batard, P., Jordan, M. and Wurm, F. (2001) Transfer of high copy number plasmid into
mammalian cells by calcium phosphate transfection. Gene, 270, 61-68. Bevis, B.J. and Glick, B.S. (2002) Rapidly maturing variants of the Discosoma red fluorescent
protein (DsRed). Nat Biotechnol, 20, 83-87. Brunner, S., Sauer, T., Carotta, S., Cotten, M., Saltik, M. and Wagner, E. (2000) Cell cycle
dependence of gene transfer by lipoplex, polyplex and recombinant adenovirus. Gene Ther, 7, 401-407.
Capecchi, M.R. (1980) High efficiency transformation by direct microinjection of DNA into cultured mammalian cells. Cell, 22, 479-488.
Chang, H.L. and Baserga, R. (1977) Time of replication of genes responsible for a temperature-sensitive function in a cell cycle-specific ts mutant from a hamster cell line. J Cell Physiol, 92, 333-343.
Chin, D.J., Green, G.A., Zon, G., Szoka, F.C., Jr. and Straubinger, R.M. (1990) Rapid nuclear accumulation of injected oligodeoxyribonucleotides. New Biol, 2, 1091-1100.
Ciftci, K. and Levy, R.J. (2001) Enhanced plasmid DNA transfection with lysosomotropic agents in cultured fibroblasts. Int J Pharm, 218, 81-92.
Clarenc, J.P., Lebleu, B. and Leonetti, J.P. (1993) Characterization of the nuclear binding sites of oligodeoxyribonucleotides and their analogs. J Biol Chem, 268, 5600-5604.
Clough, B. (1998) Cell & Tissue Culture: Laboratory Procedures. John Wiley & Sons Ltd. Coonrod, A., Li, F.Q. and Horwitz, M. (1997) On the mechanism of DNA transfection:
efficient gene transfer without viruses. Gene Ther, 4, 1313-1321. Dai, Y., Gold, B., Vishwanatha, J.K. and Rhode, S.L. (1994) Mimosine inhibits viral DNA
synthesis through ribonucleotide reductase. Virology, 205, 210-216. Darzynkiewicz, Z., Bedner, E. and Smolewski, P. (2001) Flow cytometry in analysis of cell
cycle and apoptosis. Semin Hematol, 38, 179-193. Dowty, M.E., Williams, P., Zhang, G., Hagstrom, J.E. and Wolff, J.A. (1995) Plasmid DNA
entry into postmitotic nuclei of primary rat myotubes. Proc Natl Acad Sci U S A, 92, 4572-4576.
Escriou, V., Carriere, M., Bussone, F., Wils, P. and Scherman, D. (2001) Critical assessment of the nuclear import of plasmid during cationic lipid-mediated gene transfer. J Gene Med, 3, 179-187.
Escriou, V., Ciolina, C., Helbling-Leclerc, A., Wils, P. and Scherman, D. (1998) Cationic lipid-mediated gene transfer: analysis of cellular uptake and nuclear import of plasmid DNA. Cell Biol Toxicol, 14, 95-104.
Fasbender, A., Zabner, J., Zeiher, B.G. and Welsh, M.J. (1997) A low rate of cell proliferation and reduced DNA uptake limit cationic lipid-mediated gene transfer to primary cultures of ciliated human airway epithelia. Gene Ther, 4, 1173-1180.
Fraley, R., Wilschut, J., Duzgunes, N., Smith, C. and Papahadjopoulos, D. (1980) Studies on the mechanism of membrane fusion: role of phosphate in promoting calcium ion induced fusion of phospholipid vesicles. Biochemistry, 19, 6021-6029.
Futcher, B. (1999) Cell cycle synchronization. Methods Cell Sci, 21, 79-86. Gilbert, D.M., Neilson, A., Miyazawa, H., DePamphilis, M.L. and Burhans, W.C. (1995)
Mimosine arrests DNA synthesis at replication forks by inhibiting deoxyribonucleotide metabolism. J Biol Chem, 270, 9597-9606.
Girard, P. (2001) Rapid Protein Expression in Mammalian Cells: Large-Scale Transient Transfection. Thesis Work. Département de Chimie. Swiss Federal Institute of Technology Lausanne: Lausanne. EPFL, Lausanne, p. 187.
- 127 -
Girard, P., Derouazi, M., Baumgartner, G., Bourgeois, M., Jordan, M., Jacko, B. and Wurm, F. (2002) 100-liter transient transfection. Cytotechnology, 30, 15-21.
Graham, F.L. and van der Eb, A.J. (1973) A new technique for the assay of infectivity of human adenovirus 5 DNA. Virology, 52, 456-467.
Grdina, D.J., Meistrich, M.L., Meyn, R.E., Johnson, T.S. and White, R.A. (1984) Cell synchrony techniques. I. A comparison of methods. Cell Tissue Kinet, 17, 223-236.
Haberland, A., Knaus, T., Zaitsev, S.V., Stahn, R., Mistry, A.R., Coutelle, C., Haller, H. and Bottger, M. (1999) Calcium ions as efficient cofactor of polycation-mediated gene transfer. Biochim Biophys Acta, 1445, 21-30.
Hagstrom, J.E., Ludtke, J.J., Bassik, M.C., Sebestyen, M.G., Adam, S.A. and Wolff, J.A. (1997) Nuclear import of DNA in digitonin-permeabilized cells. J Cell Sci, 110 ( Pt 18), 2323-2331.
Hans, F. and Dimitrov, S. (2001) Histone H3 phosphorylation and cell division. Oncogene, 20, 3021-3027.
Hendzel, M.J., Wei, Y., Mancini, M.A., Van Hooser, A., Ranalli, T., Brinkley, B.R., Bazett-Jones, D.P. and Allis, C.D. (1997) Mitosis-specific phosphorylation of histone H3 initiates primarily within pericentromeric heterochromatin during G2 and spreads in an ordered fashion coincident with mitotic chromosome condensation. Chromosoma, 106, 348-360.
Hoffman, B.D., Hanauske-Abel, H.M., Flint, A. and Lalande, M. (1991) A new class of reversible cell cycle inhibitors. Cytometry, 12, 26-32.
Ikegami, S., Taguchi, T., Ohashi, M., Oguro, M., Nagano, H. and Mano, Y. (1978) Aphidicolin prevents mitotic cell division by interfering with the activity of DNA polymerase-alpha. Nature, 275, 458-460.
Jenkins, N. and Curling, E.M. (1994) Glycosylation of recombinant proteins: problems and prospects. Enzyme Microb Technol, 16, 354-364.
Jordan, M., Schallhorn, A. and Wurm, F.M. (1996) Transfecting mammalian cells: optimization of critical parameters affecting calcium-phosphate precipitate formation. Nucleic Acids Res, 24, 596-601.
Juan, G., Traganos, F. and Darzynkiewicz, Z. (2001) Methods to identify mitotic cells by flow cytometry. Methods Cell Biol, 63, 343-354.
Juan, G., Traganos, F., James, W.M., Ray, J.M., Roberge, M., Sauve, D.M., Anderson, H. and Darzynkiewicz, Z. (1998) Histone H3 phosphorylation and expression of cyclins A and B1 measured in individual cells during their progression through G2 and mitosis. Cytometry, 32, 71-77.
Kapuscinski, J. (1995) DAPI: a DNA-specific fluorescent probe. Biotech Histochem, 70, 220-233.
Kauffman, M.G., Noga, S.J., Kelly, T.J. and Donnenberg, A.D. (1990) Isolation of cell cycle fractions by counterflow centrifugal elutriation. Anal Biochem, 191, 41-46.
Krude, T. (1999) Mimosine arrests proliferating human cells before onset of DNA replication in a dose-dependent manner. Exp Cell Res, 247, 148-159.
Kulp, K.S. and Vulliet, P.R. (1996) Mimosine blocks cell cycle progression by chelating iron in asynchronous human breast cancer cells. Toxicol Appl Pharmacol, 139, 356-364.
Lalande, M. (1990) A reversible arrest point in the late G1 phase of the mammalian cell cycle. Exp Cell Res, 186, 332-339.
Lam, A.M. and Cullis, P.R. (2000) Calcium enhances the transfection potency of plasmid DNA-cationic liposome complexes. Biochim Biophys Acta, 1463, 279-290.
Lechardeur, D., Sohn, K.J., Haardt, M., Joshi, P.B., Monck, M., Graham, R.W., Beatty, B., Squire, J., O'Brodovich, H. and Lukacs, G.L. (1999) Metabolic instability of plasmid DNA in the cytosol: a potential barrier to gene transfer. Gene Ther, 6, 482-497.
- 128 -
Leonetti, J.P., Mechti, N., Degols, G., Gagnor, C. and Lebleu, B. (1991) Intracellular distribution of microinjected antisense oligonucleotides. Proc Natl Acad Sci U S A, 88, 2702-2706.
Lin, M.S., Comings, D.E. and Alfi, O.S. (1977) Optical Studies of the interaction of 4'-6'-diamidino-2-phenylindole with DNA and metaphase chromosomes. Chromosoma, 60, 15-25.
Loyter, A., Scangos, G., Juricek, D., Keene, D. and Ruddle, F.H. (1982a) Mechanisms of DNA entry into mammalian cells. II. Phagocytosis of calcium phosphate DNA co-precipitate visualized by electron microscopy. Exp Cell Res, 139, 223-234.
Loyter, A., Scangos, G.A. and Ruddle, F.H. (1982b) Mechanisms of DNA uptake by mammalian cells: fate of exogenously added DNA monitored by the use of fluorescent dyes. Proc Natl Acad Sci U S A, 79, 422-426.
Luo, D. and Saltzman, W.M. (2000a) Enhancement of transfection by physical concentration of DNA at the cell surface. Nat Biotechnol, 18, 893-895.
Luo, D. and Saltzman, W.M. (2000b) Synthetic DNA delivery systems. Nat Biotechnol, 18, 33-37.
Matz, M.V., Fradkov, A.F., Labas, Y.A., Savitsky, A.P., Zaraisky, A.G., Markelov, M.L. and Lukyanov, S.A. (1999) Fluorescent proteins from nonbioluminescent Anthozoa species. Nat Biotechnol, 17, 969-973.
Mirzayans, R., Aubin, R.A. and Paterson, M.C. (1992) Differential expression and stability of foreign genes introduced into human fibroblasts by nuclear versus cytoplasmic microinjection. Mutat Res, 281, 115-122.
Mortimer, I., Tam, P., MacLachlan, I., Graham, R.W., Saravolac, E.G. and Joshi, P.B. (1999) Cationic lipid-mediated transfection of cells in culture requires mitotic activity. Gene Ther, 6, 403-411.
Mosca, P.J., Dijkwel, P.A. and Hamlin, J.L. (1992) The plant amino acid mimosine may inhibit initiation at origins of replication in Chinese hamster cells. Mol Cell Biol, 12, 4375-4383.
Murphy, J.S., D'Alisa, R., Gershey, E.L. and Landsberger, F.R. (1978) Kinetics of desynchronization and distribution of generation times in synchronized cell populations. Proc Natl Acad Sci U S A, 75, 4404-4407.
Neves, C., Escriou, V., Byk, G., Scherman, D. and Wils, P. (1999) Intracellular fate and nuclear targeting of plasmid DNA. Cell Biol Toxicol, 15, 193-202.
O'Mahoney, J.V. and Adams, T.E. (1994) Optimization of experimental variables influencing reporter gene expression in hepatoma cells following calcium phosphate transfection. DNA Cell Biol, 13, 1227-1232.
Orrantia, E. and Chang, P.L. (1990) Intracellular distribution of DNA internalized through calcium phosphate precipitation. Exp Cell Res, 190, 170-174.
Orren, D.K., Petersen, L.N. and Bohr, V.A. (1995) A UV-responsive G2 checkpoint in rodent cells. Mol Cell Biol, 15, 3722-3730.
Pedrali-Noy, G., Spadari, S., Miller-Faures, A., Miller, A.O., Kruppa, J. and Koch, G. (1980) Synchronization of HeLa cell cultures by inhibition of DNA polymerase alpha with aphidicolin. Nucleic Acids Res, 8, 377-387.
Petersen, L.N., Orren, D.K. and Bohr, V.A. (1995) Gene-specific and strand-specific DNA repair in the G1 and G2 phases of the cell cycle. Mol Cell Biol, 15, 3731-3737.
Pollard, H., Remy, J.S., Loussouarn, G., Demolombe, S., Behr, J.P. and Escande, D. (1998) Polyethylenimine but not cationic lipids promotes transgene delivery to the nucleus in mammalian cells. J Biol Chem, 273, 7507-7511.
Pouton, C.W. and Seymour, L.W. (1998) Key issues in non-viral gene delivery. Adv Drug Deliv Rev, 34, 3-19.
- 129 -

Purves, B., Orians, G., Heller, C. and Sadava, D. (1999) Life, the science of biology. Sinauer Associates, Inc., Sunderland, Massachusetts.
Ray, J. and Gage, F.H. (1992) Gene transfer into established and primary fibroblast cell lines: comparison of transfection methods and promoters. Biotechniques, 13, 598-603.
Reichard, P. (1993) From RNA to DNA, why so many ribonucleotide reductases? Science, 260, 1773-1777.
Sabelnikov, A.G. (1994) Nucleic acid transfer through cell membranes: towards the underlying mechanisms. Prog Biophys Mol Biol, 62, 119-152.
Shimomura, O., Johnson, F.H. and Saiga, Y. (1962) Extraction, purification and properties of Aequorin, a bioluminescent protein from the luminous hydromedusan, Aequorea. Journal of Cellular and Comparative Physiology, 59, 223-239.
Spadari, S., Focher, F., Sala, F., Ciarrocchi, G., Koch, G., Falaschi, A. and Pedrali-Noy, G. (1985) Control of cell division by aphidicolin without adverse effects upon resting cells. Arzneimittelforschung, 35, 1108-1116.
Spudich, J.L. and Koshland, D.E., Jr. (1976) Non-genetic individuality: chance in the single cell. Nature, 262, 467-471.
Studzinski, G.P. and Lambert, W.C. (1969) Thymidine as a synchronizing agent. I. Nucleic acid and protein formation in synchronous HeLa cultures treated with excess thymidine. J Cell Physiol, 73, 109-117.
Tarnowski, B.I., Spinale, F.G. and Nicholson, J.H. (1991) DAPI as a useful stain for nuclear quantitation. Biotech Histochem, 66, 297-302.
Terasima, T. and Tolmach, L.J. (1961) Changes in X-ray sensitivity of HeLa cells during the division cycle. Nature, 190, 1210-1211.
Terskikh, A., Fradkov, A., Ermakova, G., Zaraisky, A., Tan, P., Kajava, A.V., Zhao, X., Lukyanov, S., Matz, M., Kim, S., Weissman, I. and Siebert, P. (2000) "Fluorescent timer": protein that changes color with time. Science, 290, 1585-1588.
Thornton, M., Eward, K.L. and Helmstetter, C.E. (2002) Production of minimally disturbed synchronous cultures of hematopoietic cells. Biotechniques, 32, 1098-1100, 1102, 1105.
Tobey, R.A. and Crissman, H.A. (1972) Preparation of large quantities of synchronized mammalian cells in late G1 in the pre-DNA replicative phase of the cell cycle. Exp Cell Res, 75, 460-464.
Tobey, R.A. and Ley, K.D. (1970) Regulation of initiation of DNA synthesis in Chinese hamster cells. I. Production of stable, reversible G1-arrested populations in suspension culture. J Cell Biol, 46, 151-157.
Tseng, W.C., Haselton, F.R. and Giorgio, T.D. (1999) Mitosis enhances transgene expression of plasmid delivered by cationic liposomes. Biochim Biophys Acta, 1445, 53-64.
Tsien, R.Y. (1998) The green fluorescent protein. Annu Rev Biochem, 67, 509-544. Urlaub, G., Mitchell, P.J., Kas, E., Chasin, L.A., Funanage, V.L., Myoda, T.T. and Hamlin, J.
(1986) Effect of gamma rays at the dihydrofolate reductase locus: deletions and inversions. Somat Cell Mol Genet, 12, 555-566.
Van Hooser, A., Goodrich, D.W., Allis, C.D., Brinkley, B.R. and Mancini, M.A. (1998) Histone H3 phosphorylation is required for the initiation, but not maintenance, of mammalian chromosome condensation. J Cell Sci, 111 ( Pt 23), 3497-3506.
Wake, C.T., Gudewicz, T., Porter, T., White, A. and Wilson, J.H. (1984) How damaged is the biologically active subpopulation of transfected DNA? Mol Cell Biol, 4, 387-398.
Watson, P.A., Hanauske-Abel, H.H., Flint, A. and Lalande, M. (1991) Mimosine reversibly arrests cell cycle progression at the G1-S phase border. Cytometry, 12, 242-246.
Wattiaux, R., Laurent, N., Wattiaux-De Coninck, S. and Jadot, M. (2000) Endosomes, lysosomes: their implication in gene transfer. Adv Drug Deliv Rev, 41, 201-208.
- 130 -

Wei, Y., Mizzen, C.A., Cook, R.G., Gorovsky, M.A. and Allis, C.D. (1998) Phosphorylation of histone H3 at serine 10 is correlated with chromosome condensation during mitosis and meiosis in Tetrahymena. Proc Natl Acad Sci U S A, 95, 7480-7484.
Wenger, R.H., Moreau, H. and Nielsen, P.J. (1994) A comparison of different promoter, enhancer, and cell type combinations in transient transfections. Anal Biochem, 221, 416-418.
Wilke, M., Fortunati, E., van den Broek, M., Hoogeveen, A.T. and Scholte, B.J. (1996) Efficacy of a peptide-based gene delivery system depends on mitotic activity. Gene Ther, 3, 1133-1142.
Wilson, S.P. and Smith, L.A. (1997) Addition of glycerol during DNA exposure enhances calcium phosphate transfection. Anal Biochem, 246, 148-150.
Wurm, F. and Bernard, A. (1999) Large-scale transient expression in mammalian cells for recombinant protein production. Curr Opin Biotechnol, 10, 156-159.
Yang, Y.W. and Yang, J.C. (1997) Calcium phosphate as a gene carrier: electron microscopy. Biomaterials, 18, 213-217.
Zabner, J., Fasbender, A.J., Moninger, T., Poellinger, K.A. and Welsh, M.J. (1995) Cellular and molecular barriers to gene transfer by a cationic lipid. J Biol Chem, 270, 18997-19007.
Zakai, N., Kulka, R.G. and Loyter, A. (1977) Membrane ultrastructural changes during calcium phosphate-induced fusion of human erythrocyte ghosts. Proc Natl Acad Sci U S A, 74, 2417-2421.
- 131 -

- 132 -
Curriculum Vitae Frédéric Grosjean Nationality: Swiss
Origin: Saint-Oyens, VD
Date of birth : June 23, 1972
Education
2000 – 2003 Ph.D. Student at the Laboratory of Cellular Biotechnology
Swiss Federal Institute of Technology Lausanne (EPFL)
Under the direction of Professor Florian Maria Wurm
1998 – 1999 Degree in Biochemistry from the University of Geneva,
Diploma work done in the laboratory of Professor Florian Maria Wurm (EPFL)
1994 – 1998 Study of Biochemistry in the Chemistry Departement of the University of
Geneva
1991 – 1994 Study of Biology at the University of Lausanne
1991 Diplôme de culture générale, type scientifique, at the CESSOUEST high-
school in Nyon
Projects
Teaching assistant at EPFL since 1999, planning and implementation of new student
experiments within the biotechnology field.
Responsible for flow cytometry, live imaging and informatics at LBTC
- 133 -

Publications
Wurm, F. M., L. Baldi, J. P. Girard, J. Lindell, F. Grosjean, N. Muller, R. Jacquet, J.Wright,
A. Mason, D. Hacker, M. DeJesus, S. Picasso, P. Batard, M. Jordan (2003). Transient gene
expression: A novel mammalian cell-based technology for recombinant protein production. A
historical and technical perspective (submitted, Japanese Society of Animal Cell Technology,
Cytotechnology)
Grosjean F., Batard P., Jordan M. and Wurm F.M. (2002). "S-phase synchronized CHO cells
show elevated transfection efficiency and expresion using CaPi." Cytotechnology 38(1-3): 57-
62.
Grosjean, F., Batard. P., Jordan, M. and F.M. Wurm (2001). S-phase synchronized CHO cells
show elevated transfection efficiency and expression using Ca/PO4. In : E. Lindner-Olsson et
al. Animal Cell Technology : From Market to Target, 238-240.
Other publications and presentations
Wurm, F. M., Hunt L., Hacker D., El Abridi H., Grosjean F., Jordan M., DeJesus M. (2003).
Pausing of mammalian cells by cold exposure, limits and opportunities. Poster presentation at
the 18th ESACT meeting in Granada, Spain. Proceedings to be published.
Grosjean F., Jordan M., Wurm F.M. (2003). Analyzing CaPi transfection of adherent CHO
cells using microscopic live imaging. Poster presentation at the 18th ESACT meeting in
Granada, Spain. Proceedings to be published.
Grosjean F., Vukicevic M., Jordan M., Wurm F.M. (2002). CaPi transfection of young and
old CHO DG44 cells. Poster presentation at the European Biotechnology Workshop in
Itingen.
Grosjean, F., Batard. P. and F.M. Wurm (2001). S-phase synchronized CHO cells show
elevated transfection efficiency and expression using Ca/PO4. Poster presentation at the 17th
ESACT meeting in Tylösand, Sweden. Second prize of the poster competition.
- 134 -

Grosjean F., Batard P., Wurm F.M. (1999). Calcium-phosphate transfection efficiency
throughout the CHO cell cycle. Poster presentation at the SPP Minisymposium at ISREC in
Lausanne.
- 135 -