
Controlling and Regulating · building services practitioners, designers and policy makers who...
48
Transcript of Controlling and Regulating · building services practitioners, designers and policy makers who...
Con
trol
ling
and
Reg
ulat
ing
Hea
ting,
Coo
ling
and
Ven
tilat
ion
Met
hods
and
Exa
mpl
es
Sum
mar
y of
IEA
Ann
exes
16
and
17
Ann
ex 1
6 - B
uild
ing
Ene
rgy
Man
agem
ent'S
yste
ms (
BE
MS
) - U
ser
Gui
danc
e A
nnex
17
- Bui
ldin
g E
nerg
y M
anag
emen
t Sys
tem
s (B
EM
S)
- Eva
luat
ion
and
Em
ulat
ion
Tech
niqu
es
Sum
mar
y m
ade
by:
Lars
-Gor
an M
hs
so
n an
d D
on M
clnt
yre
Ada
pted
from
: S
tyra
och
reg
lera
var
me,
kyl
a o
ch v
entil
atio
n M
etod
er o
ch e
xem
pel b
y La
rs-G
oran
MB
nsso
n
Ad
diti
on
al E
diti
ng
by
Mal
colm
Orm
e

Q T
he Energy C
onservation in B
uild
ings a
nd C
omm
unity System
s P
rogramm
e 1997 - All property rights, in
cludin
g copyright are vested
on
behalf of th
e In
tern
atio
nal E
nergy Agency.
In p
articu
lar, n
o p
art o
f this p
ub
licatio
n m
ay be reproduced, sto
red in
a re
trieva
l system or tra
nsm
itted in
any form o
r by
any means, e
lectro
nic, m
echanical, photo
copyin
g, re
cord
ing
or o
therw
ise, w
itho
ut th
e p
rior w
ritten
pe
rmissio
n o
f the
Operating A
gent.

Pre
face
Inte
rnat
iona
l Ene
rgy
Age
ncy
The
In
tern
atio
nal
Ene
rgy
Age
ncy
(IE
A)
was
es
tabl
ishe
d in
19
74 w
ithi
n th
e fr
amew
ork
of
the
Org
anis
atio
n fo
r E
cono
mic
C
o-op
erat
ion
and
Dev
elop
men
t (O
EC
D)
to i
mpl
emen
t an
Inte
rnat
iona
l Ene
rgy
Prog
ram
me.
A b
asic
aim
of
the
IEA
is
to
fost
er c
o-op
erat
ion
amon
g th
e tw
enty
-one
IE
A P
artic
ipat
ing
Cou
ntri
es t
o in
crea
se e
nerg
y se
curi
ty t
hrou
gh e
nerg
y co
nser
vati
on, d
evel
opm
ent
of a
lter
nati
ve
ener
gy s
ourc
es a
nd e
nerg
y re
sear
ch d
evel
opm
ent a
nd d
emon
stra
tion
(RD
&D
).
Ene
rgy
Con
serv
atio
n in
Bui
ldin
gs a
nd C
omm
unit
y Sy
stem
s (E
CB
CS)
The
IE
A s
pons
ors r
esea
rch
andd
evel
opm
ent i
n a
num
ber
of a
reas
rel
ated
to e
nerg
y.
In o
ne o
f th
ese
area
s, e
nerg
y co
nser
vatio
n in
bui
ldin
gs,
the
IEA
is
spon
sori
ng
vari
ous '
exer
cise
s to
pre
dict
mor
e ac
cura
tely
the
ene
rgy
use
of b
uild
ings
, inc
ludi
ng
com
pari
son
of e
xist
ing
com
pute
r pr
ogra
ms,
bui
ldin
g m
onito
ring
, co
mpa
riso
n of
ca
lcul
atio
n m
etho
ds, a
s w
ell a
s ai
r qua
lity
and
stud
ies
of o
ccup
ancy
.
The
Exe
cuti
ve C
omm
itte
e
Ove
rall
con
trol
of
the
prog
ram
me
is m
aint
aine
d by
an
Exe
cutiv
e C
omm
itte
e, w
hich
no
t onl
y m
onito
rs e
xist
ing
proj
ects
but
als
o id
entif
ies
new
are
as w
here
col
labo
rati
ve
effo
rt m
ay b
e be
nefi
cial
. To
date
the
foll
owin
g ha
ve b
een
initi
ated
by
the
Exe
cuti
ve
Com
mitt
ee (c
ompl
eted
pro
ject
s ar
e id
entif
ied
by *
):
Loa
d E
nerg
y D
eter
min
atio
n of
Bui
ldin
gs *
Eki
stic
s an
d A
dvan
ced
Com
mun
ity E
nerg
y Sy
stem
s *
Ene
rgy
Con
serv
atio
n in
Res
iden
tial
Bui
ldin
gs *
Gla
sgow
Com
mer
cial
Bui
ldin
g M
onito
ring
* A
ir I
nfil
trat
ion
and
Ven
tilat
ion
Cen
tre
Ene
rgy
Syst
ems
and
Des
ign
of C
omm
uniti
es *
Loc
al G
over
nmen
t Ene
rgy
Plan
ning
* In
habi
tant
Beh
avio
ur w
ith R
egar
d to
Ven
tilat
ion
* M
inim
um V
entil
atio
n R
ates
* B
uild
ing
HV
AC
Sys
tem
s Sim
ulat
ion
* E
nerg
y A
uditi
ng *
Win
dow
s an
d Fe
nest
ratio
n *
Ene
rgy
Man
agem
ent i
n H
ospi
tals
* C
onde
nsat
ion
* E
nerg
y E
ffic
ienc
y in
Sch
ools
* B
EM
S - 1
: Ene
rgy
Man
agem
ent P
roce
dure
s *
BE
MS
- 2: E
valu
atio
n an
d E
mul
atio
n T
echn
ique
s *
Dem
and
Con
trol
led
Ven
tilat
ing
Syst
ems *
Low
Slo
pe R
oof
Sys
tem
s *
Air
Flo
w P
atte
rns
with
in B
uild
ings
*
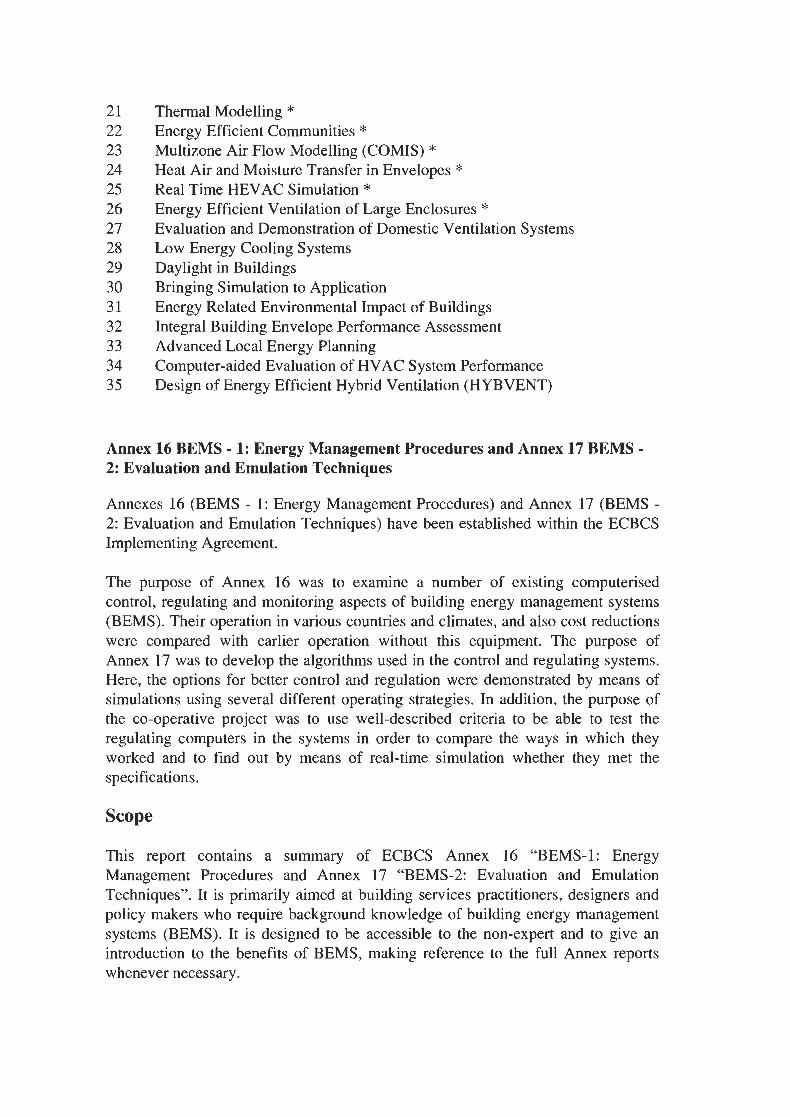
Therm
al Modelling *
Energy E
fficient Com
munities *
Multizone A
ir Flow M
odelling (CO
ME
) * H
eat Air and M
oisture Transfer in E
nvelopes * R
eal Tim
e HE
VA
C Sim
ulation * E
nergy Efficient V
entilation of Large E
nclosures * E
valuation and Dem
onstration of Dom
estic Ventilation System
s L
ow E
nergy Cooling System
s D
aylight in Buildings
Bringing Sim
ulation to Application
Energy R
elated Environm
ental Impact of B
uildings Integral B
uilding Envelope Perform
ance Assessm
ent A
dvanced Local E
nergy Planning C
omputer-aided E
valuation of HV
AC
System Perform
ance D
esign of Energy E
fficient Hybrid V
entilation (HY
BV
EN
T)
Annex 16 B
EM
S - 1: Energy M
anagement P
rocedures and Annex 17 B
EM
S - 2: E
valuation and Em
ulation Techniques
Annexes 16 (B
EM
S - 1: Energy M
anagement P
rocedures) and Annex 17 (B
EM
S - 2: E
valuation and Em
ulation Techniques) have been established w
ithin the EC
BC
S Im
plementing A
greement.
The purpose of
Annex
16 was to exam
ine a number of
existing computerised
control, regulating and monitoring aspects of building energy m
anagement system
s (B
EM
S). Their operation in various countries and clim
ates, and also cost reductions w
ere compared w
ith earlier operation w
ithout this equipment. T
he purpose of A
nnex 17 was to develop the algorithm
s used in the control and regulating systems.
Here, the options for better control and regulation w
ere demonstrated by m
eans of sim
ulations using several different operating strategies. In addition, the purpose of the co-operative project w
as to use well-described criteria to be able to test the
regulating computers in the system
s in order to compare the w
ays in which they
worked and to find out by m
eans of real-time sim
ulation whether they m
et the specifications.
Scope
This
report contains
a sum
mary
of E
CB
CS
Annex
16 "B
EM
S-1: E
nergy M
anagement Procedures
and A
nnex 17 "B
EM
S-2: E
valuation and E
mulation
Techniques". It is prim
arily aimed at building services practitioners, designers and
policy makers w
ho require background knowledge of building energy m
anagement
systems (B
EM
S). It is designed to be accessible to the non-expert and to give an introduction to the benefits of B
EM
S, making reference to the full A
nnex reports w
henever necessary .
Ene
rgy
Con
serv
atio
n in
Bui
ldin
gs a
nd C
omm
unity
Sys
tem
s
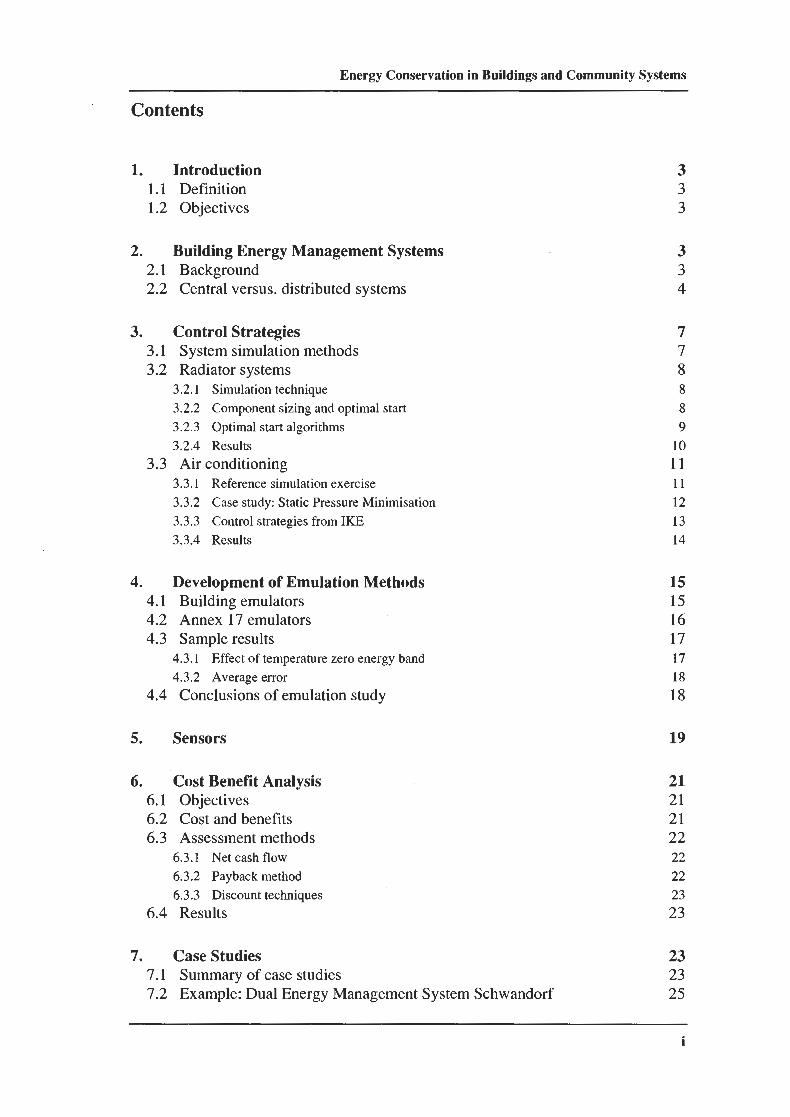
Con
tent
s
Intr
oduc
tion
Def
initi
on
Obj
ecti
ves
Bui
ldin
g E
nerg
y M
anag
emen
t Sys
tem
s B
ackg
roun
d C
entr
al v
ersu
s. d
istr
ibut
ed s
yste
ms
Con
trol
Str
ateg
ies
Syst
em s
imul
atio
n m
etho
ds
Rad
iato
r sy
stem
s 3.
2.1
Sim
ulat
ion
tech
niqu
e 3.
2.2
Com
pone
nt s
izin
g an
d op
timal
sta
rt
3.2.
3 O
ptim
al s
tart
alg
orith
ms
3.2.
4 R
esul
ts
Air
con
diti
onin
g 3.
3.1
Ref
eren
ce s
imul
atio
n ex
erci
se
3.3.
2 C
ase
stud
y: S
tati
c Pr
essu
re M
inim
isat
ion
3.3.
3 C
ontr
ol s
trat
egie
s fr
om IK
E
3.3.
4 R
esul
ts
Dev
elop
men
t of E
mul
atio
n M
etho
ds
Bui
ldin
g em
ulat
ors
Ann
ex 1
7 em
ulat
ors
Sam
ple
resu
lts
4.3.
1 E
ffec
t of
tem
pera
ture
zer
o en
ergy
ban
d 4.
3.2
Ave
rage
err
or
Con
clus
ions
of
emul
atio
n st
udy
Sens
ors
Cos
t Ben
efit
Ana
lysi
s O
bjec
tives
C
ost a
nd b
enef
its
Ass
essm
ent m
etho
ds
6.3.
1 N
et c
ash
flow
6.
3.2
Payb
ack
met
hod
6.3.
3 D
isco
unt t
echn
ique
s R
esul
ts
Cas
e St
udie
s Su
mm
ary
of c
ase
stud
ies
Exa
mpl
e: D
ual E
nerg
y M
anag
emen
t Sys
tem
Sch
wan
dorf
Building E
nergy Managem
ent Systems
8. U
ser Experience
8.1 T
he survey 8.2
Conclusions of survey
9. R
eferences
Appendix 1 P
articipating Institutions
Appendix 2 P
ublication Summ
ary A
nnex 16 and 17 Summ
ary Report
Annex 16. B
uilding Energy M
anagement System
s: A U
ser Guide
Specifications and Standards
Cost B
enefit Assessm
ent Methods
Sensors
Case Studies
User E
xperience
Annex 17 B
EM
S Evaluation and E
mulation T
echniques Synthesis R
eport
Residential H
eating Systems
Air conditioning system
s
Em
ulation methods
Ene
rgy
Con
serv
atio
n in
Bui
ldin
gs a
nd C
omm
unity
Sys
tem
s
1 In
trod
uctio
n
Thi
s re
port
sum
mar
ises
the
find
ings
of
two
proj
ects
on
the
appl
icat
ion
of b
uild
ing
ener
gy m
anag
emen
t sys
tem
s (B
EM
S), r
efer
red
to a
s A
nnex
16
and
Ann
ex 1
7. T
he
purp
ose
of
Ann
ex
16 w
as t
o ex
amin
e th
e fu
ncti
ons
of
a nu
mbe
r of
ex
isti
ng
com
pute
rise
d co
ntro
l, re
gula
ting
and
mon
itori
ng s
yste
ms,
how
the
se w
orke
d in
va
riou
s co
untr
ies
and
clim
ates
, an
d th
e co
st r
educ
tion
s th
at w
ere
note
d co
mpa
red
with
ear
lier
ope
ratio
n w
ithou
t th
is e
quip
men
t. T
his
wor
k w
as d
ivid
ed i
nto
six
sepa
rate
are
as (
show
n in
Tab
le 1
.1).
Whi
le i
n A
nnex
16
the
prim
ary
task
was
to
exam
ine
exis
ting
sys
tem
s to
see
how
th
ey w
orke
d, t
he p
urpo
se o
f A
nnex
17
was
to
deve
lop
the
algo
rith
ms
used
in
the
cont
rol a
nd r
egul
atin
g sy
stem
s. H
ere,
the
opt
ions
for
bet
ter
cont
rol
and
regu
lati
on
wer
e de
mon
stra
ted
by
mea
ns
of
sim
ulat
ions
usi
ng
seve
ral
diff
eren
t op
erat
ing
stra
tegi
es. I
n ad
diti
on,
the
purp
ose
of t
he c
o-op
erat
ion
proj
ect
was
to
use
wel
l-
desc
ribe
d cr
iteri
a to
be
able
to te
st t
he r
egul
atin
g co
mpu
ters
in
the
syst
ems
in o
rder
to
com
pare
the
way
s in
whi
ch t
hey
wor
ked
and
to f
ind
out
by m
eans
of
real
-tim
e si
mul
atio
n w
heth
er th
ey m
et t
he s
peci
fica
tions
. Thi
s w
ork
was
sep
arat
ed in
to t
hree
di
ffer
ent a
reas
(sho
wn
in T
able
l. 1
).
Finl
and,
Ger
man
y, J
apan
, N
ethe
rlan
ds a
nd t
he U
nite
d K
ingd
om p
arti
cipa
ted
in
Ann
ex 1
6, w
ith O
scar
Fab
er C
onsu
lting
Eng
inee
rs a
ctin
g as
the
Ope
rati
ng A
gent
. N
ine
coun
trie
s w
ere
invo
lved
in
Ann
ex 1
7: B
elgi
um,
Fin
land
, Fr
ance
, G
erm
any,
It
aly,
Sw
eden
, The
Net
herl
ands
, the
Uni
ted
Kin
gdom
and
the
Uni
ted
Sta
tes,
with
B
elgi
um (
Uni
vers
ity o
f L
i5ge
) as
Ope
rati
ng A
gent
. The
sep
arat
e ta
sks
unde
rtak
en in
A
nnex
es 1
6 an
d 17
are
list
ed in
Tab
le 1
.1.
Par
tici
pati
ng in
stitu
tions
are
list
ed in
App
endi
x l,
toge
ther
with
the
ir a
bbre
viat
ions
. T
he w
ork
is c
ompl
ete
and
has
resu
lted
in 9
rep
orts
con
tain
ing
a su
bsta
ntia
l am
ount
of
inf
orm
atio
n. T
he ti
tles
are
sum
mar
ised
in T
able
1.2
and
a b
rief
sum
mar
y of
eac
h re
port
is g
iven
in A
ppen
dix
2.
Thi
s re
port
sum
mar
ises
the
find
ings
of
Ann
exes
16
and
17. W
ith s
uch
a la
rge
body
of
wor
k, it
is im
poss
ible
to d
o it
ful
l jus
tice
in a
sho
rt s
umm
ary.
It i
s de
sign
ed to
be
acce
ssib
le to
the
non-
expe
rt a
nd t
o gi
ve th
e re
ader
an
intr
oduc
tion
to th
e be
nefi
ts o
f th
e ap
plic
atio
n of
BE
MS
in b
uild
ings
and
to
dire
ct t
he r
eade
r to
the
ful
l re
port
s w
here
mor
e in
form
atio
n is
requ
ired
. Exa
mpl
es ta
ken
from
the
repo
rts
are
illu
stra
tive
ra
ther
than
com
preh
ensi
ve.
1.1
Def
init
ion
The
IEA
has
ado
pted
the
foll
owin
g de
fini
tion
of
a B
EM
S:
iii
Building E
nergy Managem
ent Systems
An electrical control and m
onitoring system that has the ability to com
municate data
between control nodes (m
onitoring points) and an operator terminal. T
he system can
have attributes from all facets of building control and m
anagement functions such as
HV
AC
, lighting, fire, security, maintenance m
anagement and energy m
anagement.
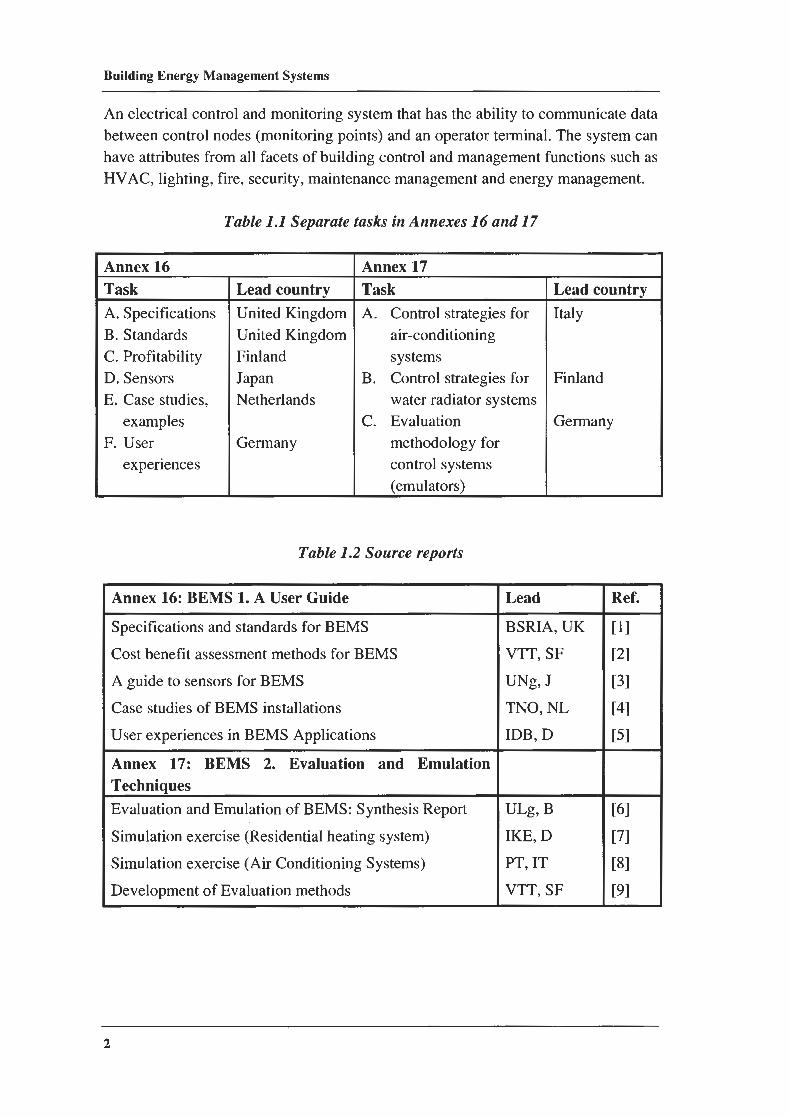
Table 1 .I Separate tasks in A
nnexes l6 and 17
Annex 16
Task
A. S
pecifications B
. Standards
C. Profitability
D. S
ensors E
. Case studies,
examples
F. User
experiences
Lead country
United K
ingdom
United K
ingdom
Finland Japan N
etherlands
Germ
any
Annex 17
Task
A.
Control strategies for
air-conditioning system
s B
. C
ontrol strategies for w
ater radiator systems
C.
Evaluation
methodology for
control systems
(emulators)
Table 1.2 Source reports
Annex 16: B
EM
S 1. A U
ser Guide
Specifications and standards for B
EM
S
Cost benefit assessm
ent methods for B
EM
S
A guide to sensors for B
EM
S
Case studies of B
EM
S installations
User experiences in B
EM
S Applications
Annex
17: B
EM
S 2.
Evaluation
and E
mulation
Techniques
Evaluation and E
mulation of B
EM
S: Synthesis R
eport
Simulation exercise (R
esidential heating system)
Simulation exercise (A
ir Conditioning System
s)
Developm
ent of Evaluation m
ethods
Lead country
Italy
Finland
Germ
any
Lead
BSR
IA, UK
VT
T, S
F
UN
g, J
TN
O, N
L
IDB
, D
UL
g, B
IKE
, D
PT, IT
VT
T, S
F
Ref.
Ene
rgy
Con
serv
atio
n in
Bui
ldin
gs a
nd C
omm
unit
y Sy
stem
s
1.2
Obj
ecti
ves
The
obj
ecti
ves
of c
ompu
teri
sed
cont
rol,
regu
lati
ng a
nd m
onito
ring
sys
tem
s ca
n be
lis
ted
as f
ollo
ws:
l.
To
prov
ide
a he
alth
y an
d pl
easa
nt in
door
clim
ate
2.
To
ensu
re th
e sa
fety
of
the
user
and
the
owne
r 3.
T
o en
sure
eco
nom
ical
run
ning
of
the
build
ing
in r
espe
ct o
f bo
th p
erso
nnel
and
en
ergy
2 B
uild
ing
Ene
rgy
Man
agem
ent S
yste
ms
2.1
Bac
kgro
und
All
syst
ems
in a
bui
ldin
g re
quir
e so
me
form
of
cont
rol;
the
sim
ples
t on-
off
swit
ch
coul
d be
des
crib
ed a
s en
ergy
man
agem
ent.
How
ever
, th
e te
rm B
uild
ing
Ene
rgy
Man
agem
ent S
yste
m h
as b
ecom
e re
stri
cted
to
adva
nced
sys
tem
s us
ing
soph
isti
cate
d co
mpu
ter b
ased
con
trol
s.
The
att
ribu
te w
hich
set
s a
BE
MS
apar
t fr
om o
ther
sys
tem
s is
com
mun
icat
ion:
in
form
atio
n on
the
sta
te o
f th
e bu
ildi
ng's
sy
stem
s ca
n be
rec
eive
d at
a c
entr
al
oper
atin
g te
rmin
al a
nd c
ontr
ol i
nstr
ucti
ons
can
be t
rans
mitt
ed f
rom
the
ope
rati
ng
term
inal
to re
mot
e ac
tuat
ors.
The
ava
ilabi
lity
of s
ubst
anti
al a
mou
nt o
f in
form
atio
n at
th
e ce
ntra
l po
int
allo
ws
the
appl
icat
ion
of
soph
istic
ated
con
trol
and
ope
rati
on
algo
rith
ms
to o
ptim
ise
the
oper
atio
n of
th
e bu
ildin
g an
d ac
hiev
es t
he g
reat
est
effi
cien
cy i
n en
ergy
use
. C
alcu
lati
ons
can
be a
utom
ated
and
dis
play
ed g
raph
ical
ly
so th
at tr
ends
, e.g
. in
ener
gy c
onsu
mpt
ion,
can
be v
iew
ed s
impl
y.
The
re h
as b
een
rapi
d de
velo
pmen
t in
the
hard
war
e as
soci
ated
with
BE
MS;
sen
sors
, co
mm
unic
atio
n hi
ghw
ays,
and
abo
ve a
ll pr
oces
sing
pow
er h
ave
impr
oved
gre
atly
. H
owev
er
the
algo
rith
ms
used
to
co
ntro
l bu
ildin
g op
erat
ions
hav
e no
t be
en
deve
lope
d at
the
sam
e ra
te.
Whi
le t
he b
ehav
iour
of
indi
vidu
al s
ubsy
stem
s is
wel
l un
ders
tood
, th
e in
tera
ctio
n of
the
sub
syst
ems
with
eac
h ot
her,
with
the
bui
ldin
g en
velo
pe
and
with
th
e un
pred
icta
ble
dist
urba
nces
int
rodu
ced
by
the
exte
rnal
en
viro
nmen
t and
the
user
s is
ver
y co
mpl
ex.
Ann
ex
17 c
onsi
ders
asp
ects
of
the
cont
rol
algo
rith
ms
used
to
opti
mis
e en
ergy
ex
pend
itur
e an
d th
e w
ays
in w
hich
BE
MS
syst
ems m
ay b
e te
sted
.
BE
MS
are
now
wid
ely
empl
oyed
in
all t
ypes
of
build
ing.
Som
e of
the
ir f
unct
iona
l ca
pabi
liti
es a
re li
sted
in T
able
2.1
and
som
e of
the
ben
efits
to b
e ga
ined
are
giv
en in
T
able
2.2
.
Building E
nergy Managem
ent Systems
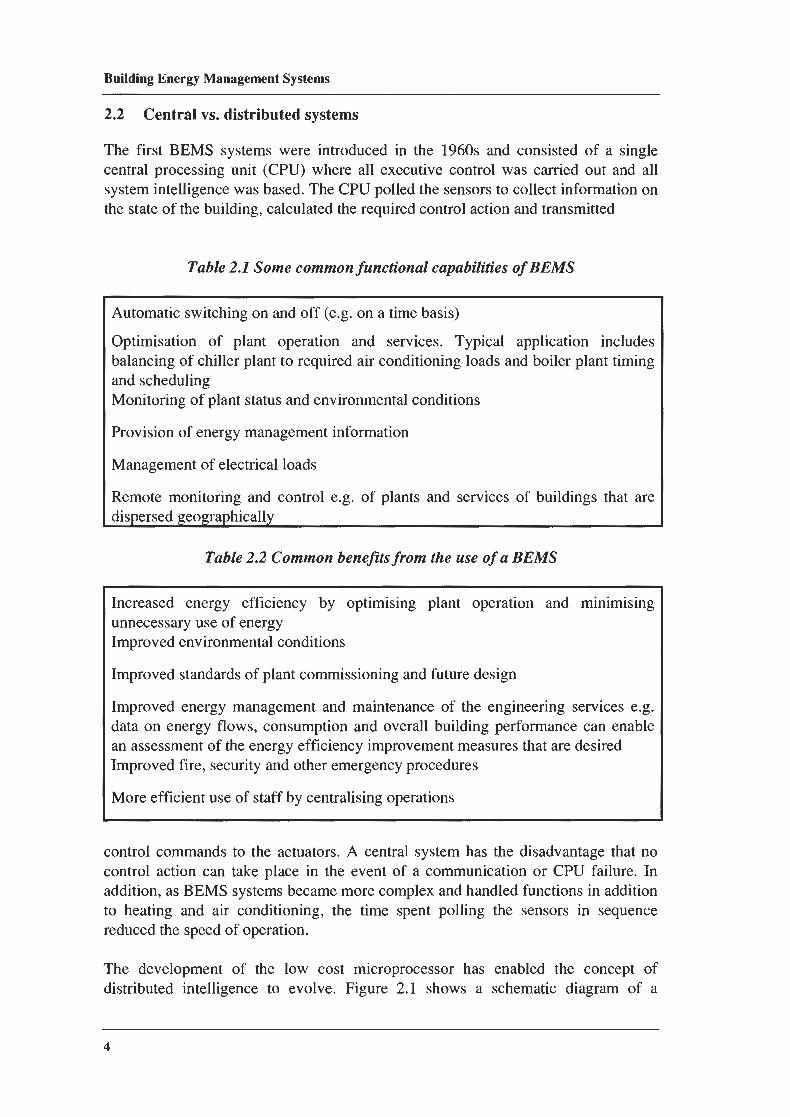
2.2 C
entral vs. distributed systems
The first B
EM
S systems w
ere introduced in the 1960s and consisted of a single central processing unit (C
PU) w
here all executive control was carried out and all
system intelligence w
as based. The C
PU polled the sensors to collect inform
ation on the state of the building, calculated the required control action and transm
itted
Table 2.1 Som
e comm
on functional capabilities of BE
MS
I Autom
atic switching on and off (e.g. on a tim
e basis)
Optim
isation of
plant operation
and services.
Typical
application includes
balancing of chiller plant to required air conditioning loads and boiler plant timing
and scheduling M
onitoring of plant status and environmental conditions
Provision of energy managem
ent information
Managem
ent of electrical loads
Rem
ote monitoring and control e.g. of plants and services of buildings that are
dispersed geographically
Table 2.2 C
omm
on benefits from the use of a B
EM
S
Increased energy
efficiency by
optimising
plant operation
and m
inimising
unnecessary use of energy Im
proved environmental conditions
1 Improved standards of plant com
missioning and future design
l Improved energy m
anagement and m
aintenance of the engineering services e.g. data on energy flow
s, consumption and overall building perform
ance can enable an assessm
ent of the energy efficiency improvem
ent measures that are desired
; Improved fire, security and other em
ergency procedures
More efficient use of staff by centralising operations
control comm
ands to the actuators. A central system
has the disadvantage that no control action can take place in the event of a com
munication or C
PU failure. In
addition, as BE
MS system
s became m
ore complex and handled functions in addition
to heating and air conditioning, the time spent polling the sensors in sequence
reduced the speed of operation.
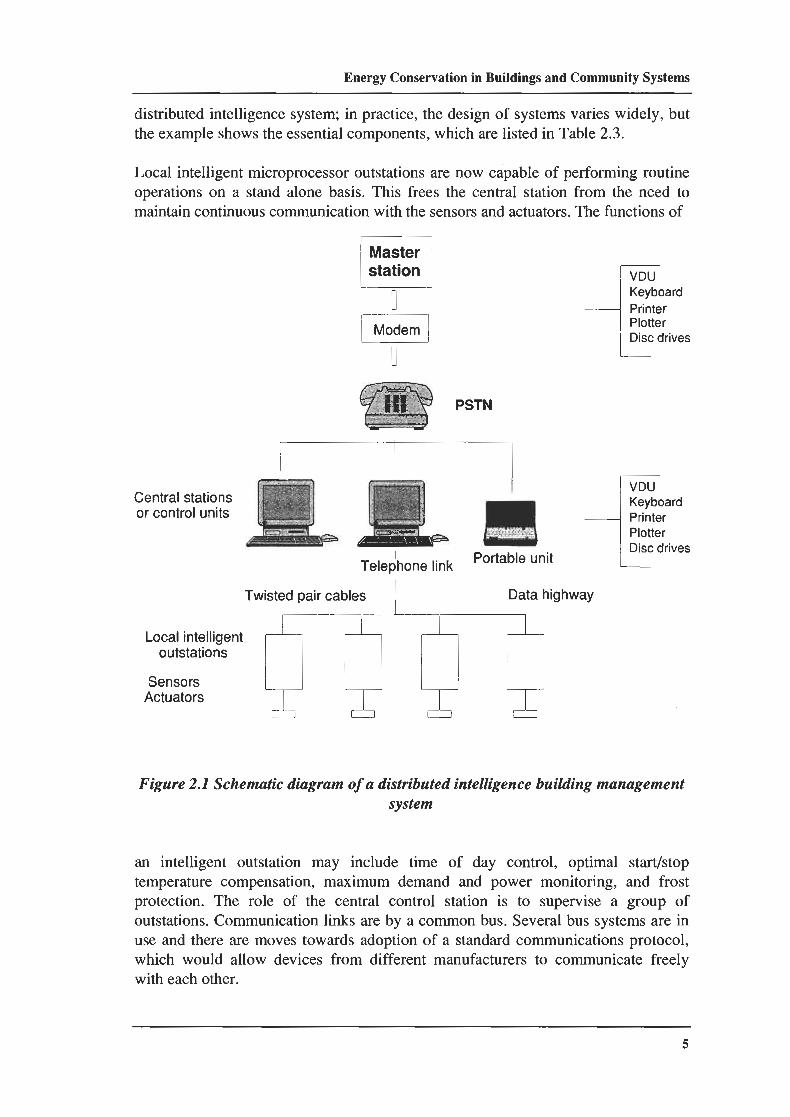
The developm
ent of the low
cost m
icroprocessor has enabled the concept of
distributed intelligence to evolve. Figure 2.1 show
s a schematic diagram
of a
Ene
rgy
Con
serv
atio
n in
Bui
ldin
gs a
nd C
omm
unity
Sys
tem
s
dist
ribu
ted
inte
llige
nce
syst
em; i
n pr
actic
e, th
e de
sign
of
syst
ems
vari
es w
idel
y, b
ut
the
exam
ple
show
s th
e es
sent
ial c
ompo
nent
s, w
hich
are
list
ed in
Tab
le 2
.3.
Loc
al in
telli
gent
mic
ropr
oces
sor
outs
tatio
ns a
re n
ow c
apab
le o
f pe
rfor
min
g ro
utin
e op
erat
ions
on
a st
and
alon
e ba
sis.
Thi
s fr
ees
the
cent
ral
stat
ion
from
the
nee
d to
m
aint
ain
cont
inuo
us c
omm
unic
atio
n w
ith th
e se
nsor
s an
d ac
tuat
ors.
The
func
tions
of
PS
TN
Cen
tral
sta
tions
I
or c
ontr
ol u
nits
~e
~e
dh
on
e
link
Por
tabl
e un
it
Loca
l int
ellig
ent
outs
tatio
ns
Sen
sors
A
ctua
tors
Tw
iste
d pa
ir ca
bles
1
Dat
a hi
ghw
ay
Key
boar
d P
rinte
r P
lotte
r D
isc
driv
es
Key
boar
d P
rinte
r P
lotte
r D
isc
driv
es
Fig
ure
2.1
Sche
mat
ic d
iagr
am o
f a d
istr
ibut
ed in
telli
genc
e bu
ildin
g m
anag
emen
t sy
stem
an
inte
llige
nt
outs
tatio
n m
ay
incl
ude
time
of
day
cont
rol,
optim
al
star
tlsto
p te
mpe
ratu
re c
ompe
nsat
ion,
max
imum
dem
and
and
pow
er m
onito
ring
, an
d fr
ost
prot
ectio
n.
The
rol
e of
th
e ce
ntra
l co
ntro
l st
atio
n is
to
su
perv
ise
a gr
oup
of
outs
tatio
ns. C
omm
unic
atio
n lin
ks a
re b
y a
com
mon
bus
. S
ever
al b
us s
yste
ms
are
in
use
and
ther
e ar
e m
oves
tow
ards
ado
ptio
n of
a s
tand
ard
com
mun
icat
ions
pro
toco
l, w
hich
wou
ld a
llow
dev
ices
fro
m d
iffe
rent
man
ufac
ture
rs t
o co
mm
unic
ate
free
ly
with
eac
h ot
her.
Building E
nergy Managem
ent Systems
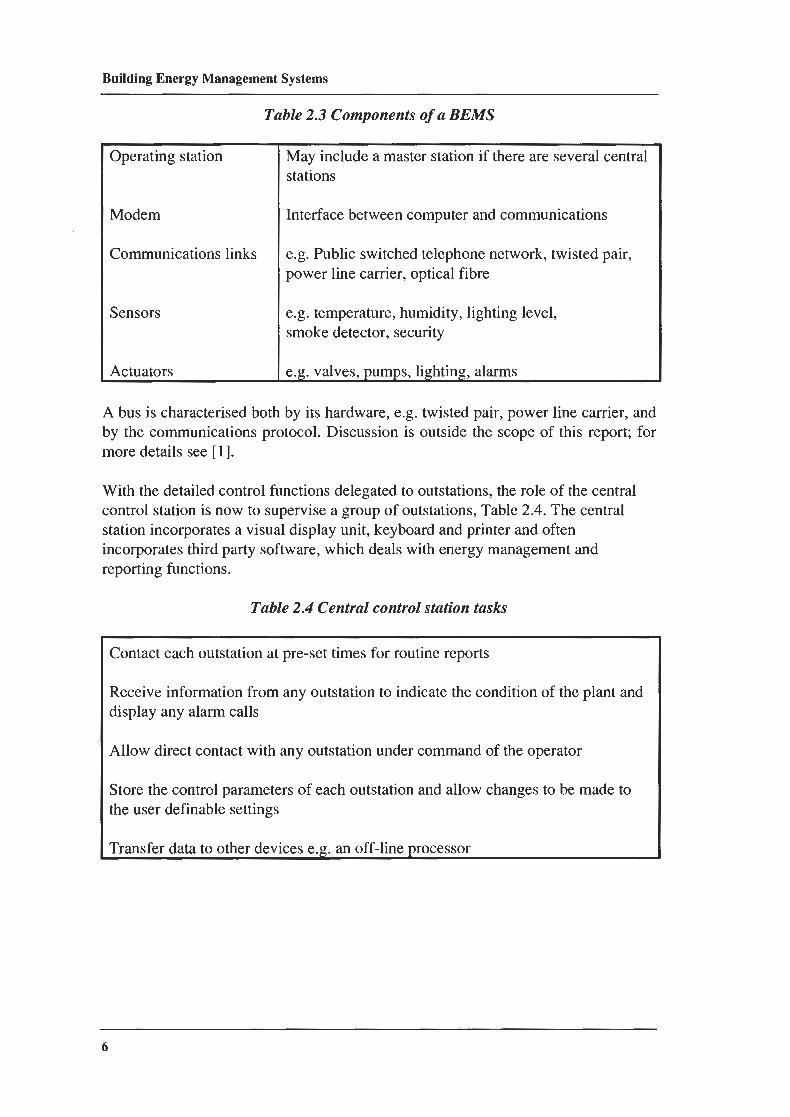
Table 2.3 C
omponents of a B
EM
S
Operating station
Modem
Com
munications links
Sensors
Actuators
May include a m
aster station if there areseveralcentral stations
Interface between com
puter and comm
unications
e.g. Public sw
itched telephone network, tw
isted pair, pow
er line carrier, optical fibre
e.g. temperature, hum
idity, lighting level, sm
oke detector, security
A bus is characterised both by its hardw
are, e.g. twisted pair, pow
er line carrier, and by the com
munications protocol. D
iscussion is outside the scope of this report; for m
ore details see [l].
With the detailed control functions delegated to outstations, the role of the central
control station is now to supervise a group of outstations, T
able 2.4. The central
station incorporates a visual display unit, keyboard and printer and often incorporates third party softw
are, which deals w
ith energy managem
ent and reporting functions.
Table 2.4 C
entral control station tasks
p- P
Contact each outstation at pre-set tim
es for routine reports
Receive inform
ation from any outstation to indicate the condition of the plant and
display any alarm calls
Allow
direct contact with any outstation under com
mand of the operator
Store the control param
eters of each outstation and allow changes to be m
ade to the user definable settings
Transfer data to other devices e.g. an off-line processor
Ene
rgy
Con
serv
atio
n in
Bui
ldin
gs a
nd C
omm
unit
y Sy
stem
s
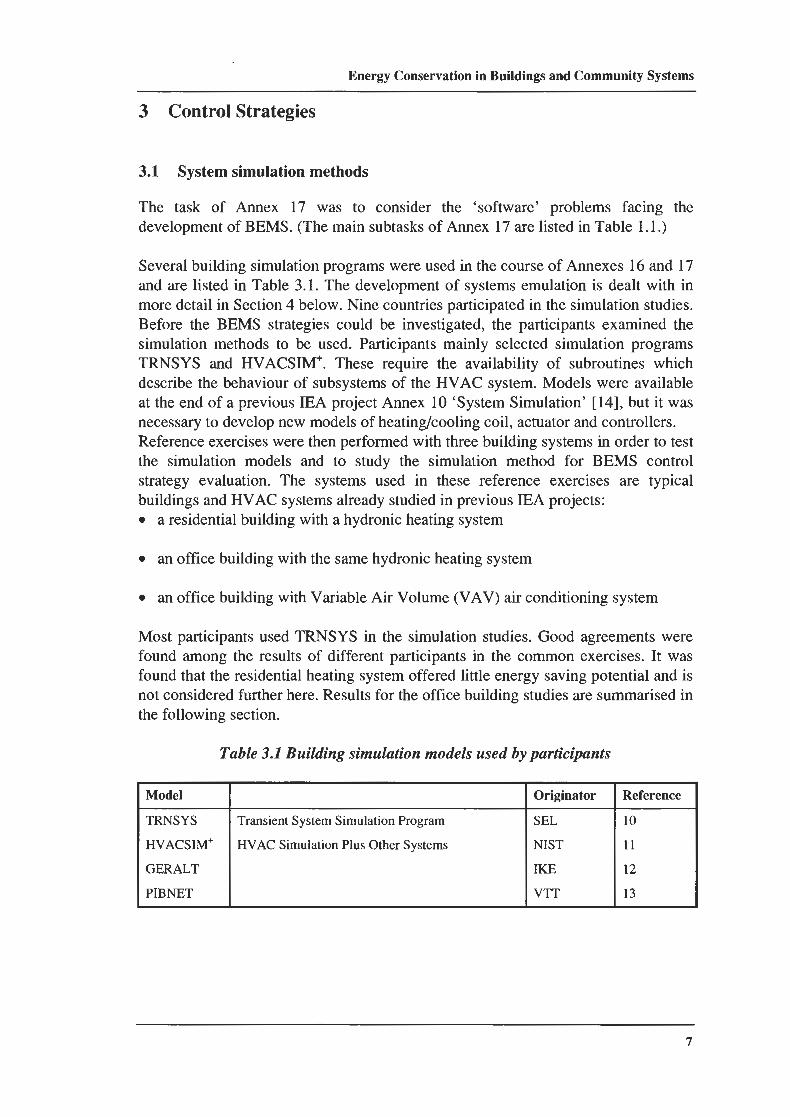
3 C
ontr
ol S
trat
egie
s
3.1
Syst
em si
mul
atio
n m
etho
ds
The
ta
sk
of
Ann
ex
17 w
as
to
cons
ider
the
's
oftw
are'
pr
oble
ms
faci
ng
the
deve
lopm
ent o
f B
EM
S. (
The
mai
n su
btas
ks o
f A
nnex
17
are
list
ed in
Tab
le 1
.l .)
Sev
eral
bui
ldin
g si
mul
atio
n pr
ogra
ms
wer
e us
ed in
the
cour
se o
f A
nnex
es 1
6 an
d 17
an
d ar
e li
sted
in T
able
3.1
. T
he d
evel
opm
ent
of s
yste
ms
emul
atio
n is
dea
lt w
ith i
n m
ore
deta
il in
Sec
tion
4 b
elow
. Nin
e co
untr
ies p
artic
ipat
ed in
the
sim
ulat
ion
stud
ies.
B
efor
e th
e B
EM
S st
rate
gies
cou
ld b
e in
vest
igat
ed, t
he p
artic
ipan
ts e
xam
ined
the
si
mul
atio
n m
etho
ds t
o be
use
d. P
artic
ipan
ts m
ainl
y se
lect
ed s
imul
atio
n pr
ogra
ms
TR
NSY
S an
d H
VA
CSI
M?.
The
se r
equi
re t
he a
vaila
bilit
y of
su
brou
tine
s w
hich
de
scri
be th
e be
havi
our
of s
ubsy
stem
s of
the
HV
AC
sys
tem
. Mod
els
wer
e av
aila
ble
at th
e en
d of
a p
revi
ous
IEA
pro
ject
Ann
ex 1
0 'S
yste
m S
imul
atio
n' [
14],
but
it w
as
nece
ssar
y to
dev
elop
new
mod
els
of h
eati
nglc
ooli
ng co
il, a
ctua
tor a
nd c
ontr
olle
rs.
Ref
eren
ce e
xerc
ises
wer
e th
en p
erfo
rmed
with
thre
e bu
ildi
ng s
yste
ms
in o
rder
to te
st
the
sim
ulat
ion
mod
els
and
to s
tudy
the
sim
ulat
ion
met
hod
for
BE
MS
con
trol
st
rate
gy e
valu
atio
n. T
he s
yste
ms
used
in
the
se r
efer
ence
exe
rcis
es a
re t
ypic
al
build
ings
and
HV
AC
sys
tem
s al
read
y st
udie
d in
pre
viou
s IE
A p
roje
cts:
a
resi
dent
ial b
uild
ing
with
a h
ydro
nic
heat
ing
syst
em
an o
ffic
e bu
ildin
g w
ith th
e sa
me
hydr
onic
hea
ting
syst
em
an o
ffic
e bu
ildin
g w
ith V
aria
ble
Air
Vol
ume
(VA
V) a
ir c
ondi
tion
ing
syst
em
Mos
t pa
rtic
ipan
ts u
sed
TR
NSY
S in
the
sim
ulat
ion
stud
ies.
Goo
d ag
reem
ents
wer
e fo
und
amon
g th
e re
sults
of
diff
eren
t par
tici
pant
s in
the
com
mon
exe
rcis
es. I
t w
as
foun
d th
at th
e re
side
ntia
l hea
ting
syst
em o
ffer
ed li
ttle
ene
rgy
savi
ng p
oten
tial
and
is
not c
onsi
dere
d fu
rthe
r her
e. R
esul
ts f
or th
e of
fice
bui
ldin
g st
udie
s ar
e su
mm
aris
ed in
th
e fo
llow
ing
sect
ion.
Tab
le 3
.1 B
uild
ing
sim
ulat
ion
mod
els
used
by
part
icip
ants
Mod
el
TR
NSY
S
HV
AC
SIM
'
GE
RA
LT
PIB
NE
T
Tra
nsie
nt S
yste
m S
imul
atio
n Pr
ogra
m
HV
AC
Sim
ulat
ion
Plus
Oth
er S
yste
ms
Ori
gina
tor
SE
L
NIS
T
IKE
VTT
Ref
eren
ce
10
11
12
13
Building E
nergy Managem
ent Systems
3.2 R
adiator systems
3.2.1 Sim
ulation technique
The behaviour of
a conventional radiator heating system installed in an office
building was investigated [7]. F
irst the participants compared results for continuous
and intermittent heating w
ith fixed start and stop times, to establish confidence in
the methods used. T
hen the savings in heating energy consumption that could be
achieved with 'perfect' optim
al start were investigated as a function of boiler and
radiator sizing. The third part of the investigation evaluated different algorithm
s that can be used in practice to calculate the optim
al start for a heating system in a period
of changeable weather.
The office building is a conventional m
ulti-cellular block. Each office room
is 5 X 5
m in plan, naturally lit and heated by radiators. T
he insulation of the building com
ponents is consistent with the G
erman E
nergy Saving C
ode. A m
odern high efficiency boiler is used, w
ith flow tem
perature controlled by a three way m
ixing valve as a function of external tem
perature. Room
temperatures are controlled by
thermostatic
radiator valves.
The
thermal
properties of
the building
and the
behaviour of the heating and control systems are m
odelled in considerable detail. T
he simulation period has to be sufficiently long w
here adaptive control systems are
to be evaluated. Data of a G
erman reference m
onth were used; the external dry bulb
temperature is around -4 "C
for a few days, falls to -16 "C
for two days, then m
oves betw
een 6 and -4 "C for the rest of the m
onth. Overall m
ean temperature is about
0.5 "C.
Firstly, the participants in the reference exercise calculated energy consumption for
continuous heating and for intermittent heating w
ith given start and stop times.
Good agreem
ent was found betw
een the participants, with m
aximum
deviation of 6.2%
in the continuous case and 3.0% in the interm
ittent case. The exam
ple was
therefore accepted for further simulation studies. M
uch of the simulation in this and
other studies was based on the T
RN
SYS [10], G
ER
AL
T [l21 and PIB
NE
T [l31
simulation program
s.
3.2.2 C
omponent sizing and optim
al start
Savings in heating energy consum
ption may be m
ade if the heating system is turned
on at the latest possible time for the occupied room
temperature to reach com
fort at the start of the occupation period. T
he amount of energy saved depends on the
power of the heating system
; an oversized system w
ill heat up quickly, while a
system w
hich can just
meet the
steady state heat demand w
ill require to run continuously, show
ing no saving over continuous operation.
The second part of the radiator heating sim
ulation investigated the effect of:
4 sizes of boilers,, from 75%
to 200% of nom
inal size 2 sizes of radiator, 100%
and 200 % of nom
inal size
Ene
rgy
Con
serv
atio
n in
Bui
ldin
gs a
nd C
omm
unity
Sys
tem
s
In t
his
cont
ext
it s
houl
d be
not
ed t
hat
the
syst
em w
as d
esig
ned
to t
he G
eman
st
anda
rd o
f -1
2 "C
ext
erna
l tem
pera
ture
; the
test
mon
th h
ad a
n ex
tern
al te
mpe
ratu
re
of th
e or
der o
f 0.
5 "
C, w
ith tw
o ni
ghts
falli
ng a
s lo
w a
s -1
6 "C
.
Opt
imal
sta
rt ti
mes
wer
e fo
und
by i
tera
tion
i.e. r
unni
ng th
e si
mul
atio
n se
vera
l tim
es
whi
le v
aryi
ng th
e st
art t
ime
for
the
day
of i
nter
est u
ntil
com
fort
tem
pera
ture
was
just
re
ache
d at
the
req
uire
d tim
e. T
he s
imul
atio
n w
as t
hen
run
for
the
who
le m
onth
for
al
l co
mbi
natio
ns o
f bo
iler
and
radi
ator
siz
es, b
oth
for
cont
inuo
us a
nd o
ptim
al s
tart
he
atin
g; th
e sa
me
heat
ing
patte
rn w
as u
sed
for
wee
kday
s an
d w
eeke
nds.
It w
as f
ound
tha
t th
e co
mbi
natio
n of
ove
rsiz
ed r
adia
tors
and
boi
ler
caus
ed s
ome
room
ove
rhea
ting,
and
thi
s co
ndit
ion
was
re-
run
with
the
rad
iato
r th
erm
osta
ts s
et
1 "C
low
er. T
he re
sult
s ar
e sh
own
in T
able
3.2
.
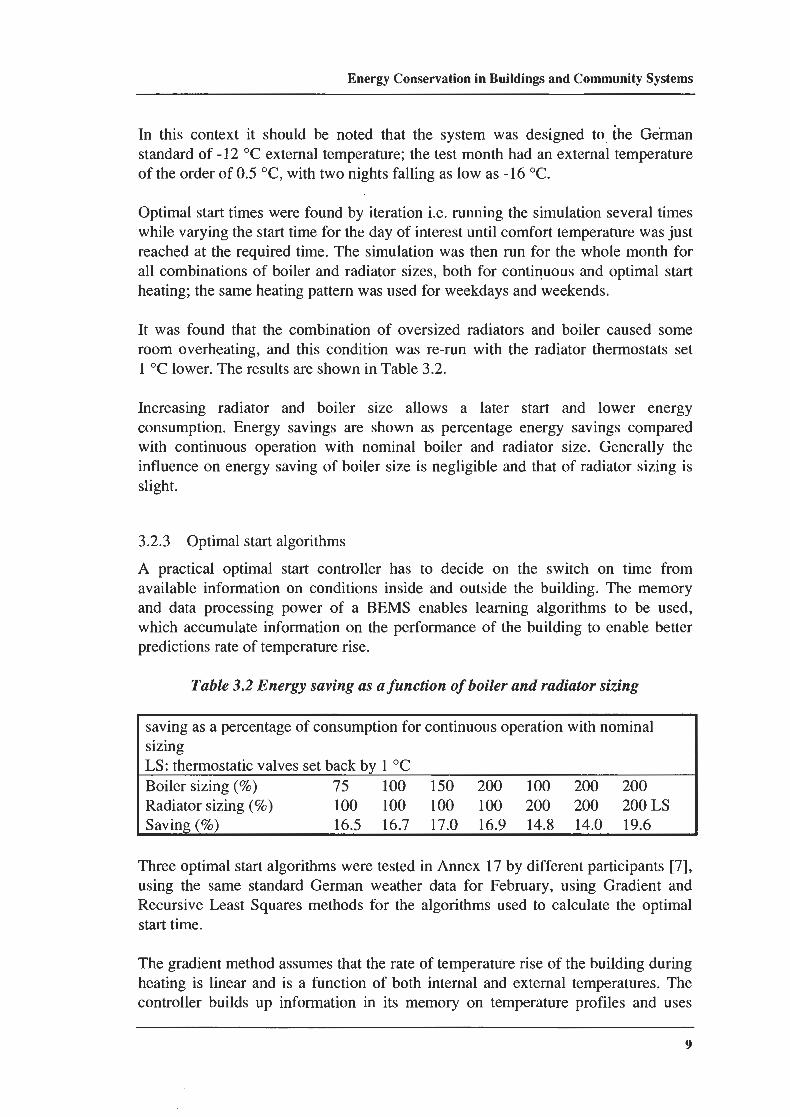
Incr
easi
ng
radi
ator
an
d bo
iler
si
ze
allo
ws
a la
ter
star
t an
d lo
wer
en
ergy
co
nsum
ptio
n. E
nerg
y sa
ving
s ar
e sh
own
as p
erce
ntag
e en
ergy
sav
ings
com
pare
d w
ith c
ontin
uous
ope
ratio
n w
ith n
omin
al b
oile
r an
d ra
diat
or s
ize.
Gen
eral
ly t
he
infl
uenc
e on
ene
rgy
savi
ng o
f bo
iler
size
is n
eglig
ible
and
tha
t of
rad
iato
r si
zing
is
slig
ht.
3.2.
3 O
ptim
al s
tart
alg
orith
ms
A p
ract
ical
opt
imal
sta
rt c
ontr
olle
r ha
s to
dec
ide
on t
he s
witc
h on
tim
e fr
om
avai
labl
e in
form
atio
n on
con
diti
ons
insi
de a
nd o
utsi
de t
he b
uild
ing.
The
mem
ory
and
data
pro
cess
ing
pow
er o
f a
BE
MS
enab
les
lear
ning
alg
orith
ms
to b
e us
ed,
whi
ch a
ccum
ulat
e in
form
atio
n on
the
per
form
ance
of
the
buil
ding
to
enab
le b
ette
r pr
edic
tions
rate
of
tem
pera
ture
rise
.
Tab
le 3
.2 E
nerg
y sa
ving
as
a fu
nctio
n of
boi
ler a
nd r
adia
tor
sizi
ng
I savi
ng a
s a
perc
enta
ge o
f co
nsum
ptio
n fo
r co
ntin
uous
ope
rati
on w
ith n
omin
al
sizi
ng
LS:
ther
mos
tatic
val
ves
set b
ack
by 1
"C
Boi
ler
sizi
ng (%
) 75
10
0 15
0 20
0 10
0 20
0 20
0 R
adia
tor
sizi
ng (%
) 10
0 10
0 10
0 10
0 20
0 20
0 20
0 L
S
Sav
ing
(%)
16.5
16
.7
17.0
16
.9
14.8
14
.0
19.6
Thr
ee o
ptim
al s
tart
alg
orith
ms
wer
e te
sted
in A
nnex
17
by d
iffe
rent
par
tici
pant
s [7
], us
ing
the
sam
e st
anda
rd G
erm
an w
eath
er d
ata
for
Feb
ruar
y, u
sing
Gra
dien
t an
d R
ecur
sive
Lea
st S
quar
es m
etho
ds f
or t
he a
lgor
ithm
s us
ed t
o ca
lcul
ate
the
opti
mal
st
art t
ime.
The
gra
dien
t met
hod
assu
mes
that
the
rate
of
tem
pera
ture
ris
e of
the
bui
ldin
g du
ring
he
atin
g is
lin
ear
and
is a
fun
ctio
n of
bot
h in
tern
al a
nd e
xter
nal
tem
pera
ture
s. T
he
cont
roll
er b
uild
s up
inf
orm
atio
n in
its
mem
ory
on t
empe
ratu
re p
rofi
les
and
uses
Building E
nergy Managem
ent Systems
these to calculate gradients, which are then stored. It is then straightforw
ard to calculate w
hen to turn on the heating to reach the desired internal temperature by the
start of the occupancy period. The sam
e method m
ay be used for optimal stop
controllers. When setting up a controller it is necessary to use fixed start tim
es for a few
days while the controller builds up inform
ation on building behaviour.
3.2.3.1 G
radient method optim
al start controller
The IK
E optim
al start control algorithm w
as developed at the IKE
, University of
Stuttgart. When tested over l m
onth of weather data, it w
as found that the IKE
controller produced errors caused by neglect of the building structure tem
perature. In a situation w
here the weather had returned to norm
al after a cold snap, the structure of the building w
as cold, requiring longer pre-heat times than provided by
the optimal start algorithm
.
A possible solution w
ould be to equip the controller with an additional sensor,
which w
ould measure the structure tem
perature. How
ever, this would have the
disadvantage of increasing the learning time of the controller.
3.2.3.2 G
radient method w
ith weather forecast optim
al start controller
This controller w
as developed at the R
oyal Technical H
igh S
chool (KT
H) in
Stockholm
. It works in a sim
ilar way to the IK
E controller, but operates on a
weighted average tem
perature profile over the last two days; this im
plies that the tim
e constant of the building is not too short.
Som
e additional constraints to the control algorithm w
ere found necessary to avoid instabilities.
An
improvem
ent w
as effected,
by controlling
the w
ater flow
tem
perature as a function of the forecast w
eather temperature. T
his gave good energy saving and also reduced the am
ount of time that the occupied zone spent
below the low
er comfort lim
it of 19.5 "C.
3.2.3.3 R
ecursive Least S
quares method optim
al start controller
This em
ploys the Recursive L
east Squares m
ethod (RL
S) and was developed at the
Technical R
esearch Centre of
Finland. This also assum
es a linear relationship betw
een preheating time and tem
perature differences between desired tem
perature and both inside and outside tem
perature. The param
eters are estimated on-line using
the RL
S technique w
ith an exponential forgetting factor. This m
akes for simpler
programm
ing than the gradient method.
After several days of learning the error in start tim
e reduced to a small value.
How
ever, the controller had difficulty in dealing with a cold snap and predicted too
short a pre-heat period following a w
eekend with the heating sw
itched off.
3.2.4 R
esults
The study of hydronic heating confirm
ed that simultaneous com
puter simulation of
building, heating systems and B
EM
S can be a powerful analysis and developm
ent m
ethod, and confirmed that O
ptimal S
tart control is the most im
portant BE
MS
Ene
rgy
Con
serv
atio
n in
Bui
ldin
gs a
nd C
omm
unit
y Sy
stem
s
func
tion
for h
ydro
nic
heat
ing
syst
ems.
It w
as d
emon
stra
ted
that
the
size
of
the
boile
r ha
d no
inf
luen
ce a
nd t
he s
ize
of t
he r
adia
tors
had
onl
y a
smal
l in
flue
nce
on t
he
ener
gy c
onsu
mpt
ion
of a
hyd
roni
c he
atin
g sy
stem
con
trol
led
by a
per
fect
opt
imal
st
art
cont
roll
er.
The
th
ree
Opt
imal
S
tart
al
gori
thm
s in
vest
igat
ed
show
ed
cons
ider
able
ina
ccur
acie
s. T
he R
LS
met
hod
is w
ell
suit
ed t
o B
EM
S ap
plic
atio
ns
beca
use
it is
eas
ily p
rogr
amm
able
and
doe
s no
t ha
ve l
arge
mem
ory
requ
irem
ents
. H
owev
er,
in t
he e
xam
ples
rep
orte
d, t
he R
LS
cont
roll
er f
aile
d to
cop
e w
ell
with
un
heat
ed w
eeke
nds
or c
old
snap
s an
d sh
owed
lit
tle
impr
ovem
ent
in e
ithe
r co
mfo
rt
cond
itio
ns o
r en
ergy
con
sum
ptio
n ov
er a
fix
ed s
tart
pro
cedu
re.
The
tw
o gr
adie
nt
met
hod
OS
cont
roll
ers p
erfo
rmed
lit
tle
bette
r. I
t is
pro
pose
d th
at a
mea
sure
men
t of
the
stru
ctur
al t
empe
ratu
re w
ould
im
prov
e pe
rfor
man
ce
and
it w
as
show
n th
at
mod
ulat
ing
flow
te
mpe
ratu
re
acco
rdin
g to
a
wea
ther
fo
reca
st
impr
oved
pe
rfor
man
ce.
3.3
Air
con
diti
onin
g
3.3.
1 R
efer
ence
sim
ulat
ion
exer
cise
The
sim
ulat
ion
exer
cise
[S]
was
bas
ed o
n a
mod
el o
f th
e C
olli
ns b
uild
ing,
whi
ch is
an o
ffic
e bl
ock
situ
ated
in G
lasg
ow, S
cotla
nd, t
hat h
as a
lrea
dy b
een
mon
itor
ed a
nd
sim
ulat
ed d
urin
g pr
evio
us I
EA
res
earc
h pr
ojec
ts, A
nnex
es 4
and
10.
The
exe
rcis
e co
nsis
ted
of a
sim
ulat
ion
of t
he C
olli
ns b
uild
ing
over
thr
ee p
erio
ds o
f 15
day
s in
su
mm
er, w
inte
r and
mid
-sea
son.
The
bui
ldin
g in
clud
es th
ree
occu
pied
flo
ors.
Eac
h fl
oor
is d
ivid
ed in
to tw
o th
erm
al
zone
s: a
n oc
cupi
ed s
pace
and
a p
lenu
m f
or r
etur
n ai
r. T
he e
nvel
ope
of t
he o
ccup
ied
zone
s is
com
plet
ely
glaz
ed, w
hile
the
ceili
ng v
oids
are
sur
roun
ded
by o
paqu
e w
alls
. T
he H
VA
C p
lant
is
a V
aria
ble
Air
Vol
ume
(VA
V)
syst
em m
ade
of a
cen
tral
air
ha
ndlin
g pl
ant,
a pr
imar
y sy
stem
and
som
e lo
cal u
nits
. The
cen
tral
pla
nt c
onsi
sts
of
a m
ixin
g bo
x, f
ilte
r, h
eatin
g co
il, h
umid
ifie
r co
olin
g co
il s
uppl
y fa
n an
d ex
trac
t fan
. E
ach
floo
r of
the
bui
ldin
g is
ser
ved
by s
epar
ate
duct
wor
k, a
rehe
at c
oil
and
a V
AV
bo
x. T
he p
rim
ary
syst
em c
onsi
sts
of a
boi
ler
conn
ecte
d to
the
hea
ting
coil
s an
d a
chil
ling
sys
tem
con
nect
ed t
o th
e co
olin
g co
il. A
sch
emat
ic d
iagr
am o
f th
e w
hole
sy
stem
is s
how
n in
Fig
ure
3.1.
Building E
nergy Managem
ent Systems
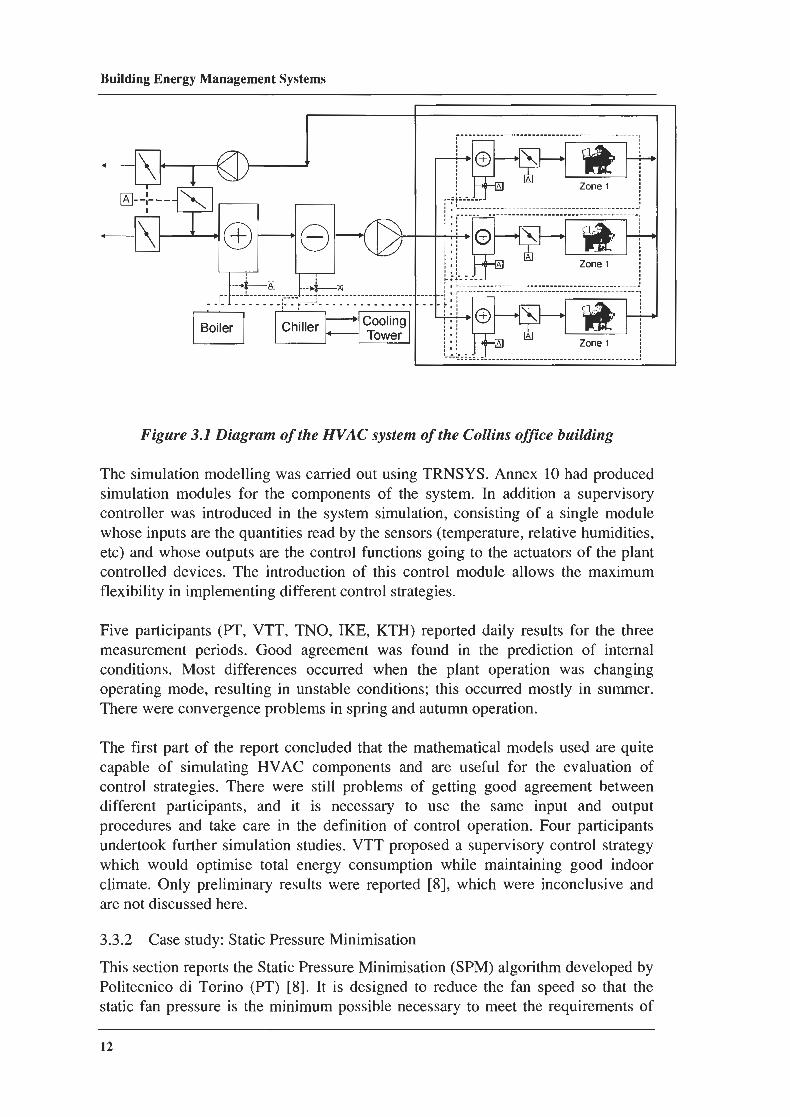
Figure 3.1 D
iagram of the H
VA
C system
of the Collins office building
The sim
ulation modelling w
as carried out using TR
NSY
S. Annex 10 had produced
simulation m
odules for the components of the system
. In addition a supervisory controller w
as introduced in the system sim
ulation, consisting of a single module
whose inputs are the quantities read by the sensors (tem
perature, relative humidities,
etc) and whose outputs are the control functions going to the actuators of the plant
controlled devices. The introduction of this control m
odule allows the m
aximum
flexibility in im
plementing different control strategies.
Five participants (P
T, V
TT
, TN
O, IK
E, K
TH
) reported daily results for the three m
easurement periods. G
ood agreement w
as found in the prediction of internal
conditions. Most differences occurred w
hen the plant operation w
as changing
operating mode, resulting in unstable conditions; this occurred m
ostly in summ
er. T
here were convergence problem
s in spring and autumn operation.
The first part of the report concluded that the m
athematical m
odels used are quite capable of
simulating H
VA
C com
ponents and are useful for the evaluation of control strategies. T
here were still problem
s of getting good agreement betw
een different participants, and
it is
necessary to
use the
same input
and output
procedures and take care in the definition of control operation. Four participants undertook further sim
ulation studies. VT
T proposed a supervisory control strategy
which w
ould optimise total energy consum
ption while m
aintaining good indoor clim
ate. Only prelim
inary results were reported [g], w
hich were inconclusive and
are not discussed here.
3.3.2 C
ase study: Static P
ressure Minim
isation
This section reports the S
tatic Pressure M
inimisation (SPM
) algorithm developed by
Politecnico di Torino (PT
) [g]. It is designed to reduce the fan speed so that the static fan pressure is the m
inimum
possible necessary to meet the requirem
ents of
Ene
rgy
Con
serv
atio
n in
Bui
ldin
gs a
nd C
omm
unit
y Sy
stem
s
the
VA
V b
oxes
. T
he c
ontr
olle
r w
as d
evel
oped
as
a P
I co
ntro
ller
with
a n
egat
ive
deca
y te
rm;
the
SPM
con
trol
ler
deca
y te
rm d
ecre
ases
sta
tic p
ress
ure
at a
con
stan
t ra
te,
whi
le t
he P
I ac
tion
incr
ease
s st
atic
pre
ssur
e w
hen
one
of t
he V
AV
box
es i
s st
arve
d. I
t is
des
irab
le th
at t
he a
ctio
n of
the
SPM
fan
con
trol
be
muc
h sl
ower
than
th
e V
AV
box
con
trol
ler
and
the
fan
blad
e co
ntro
ller.
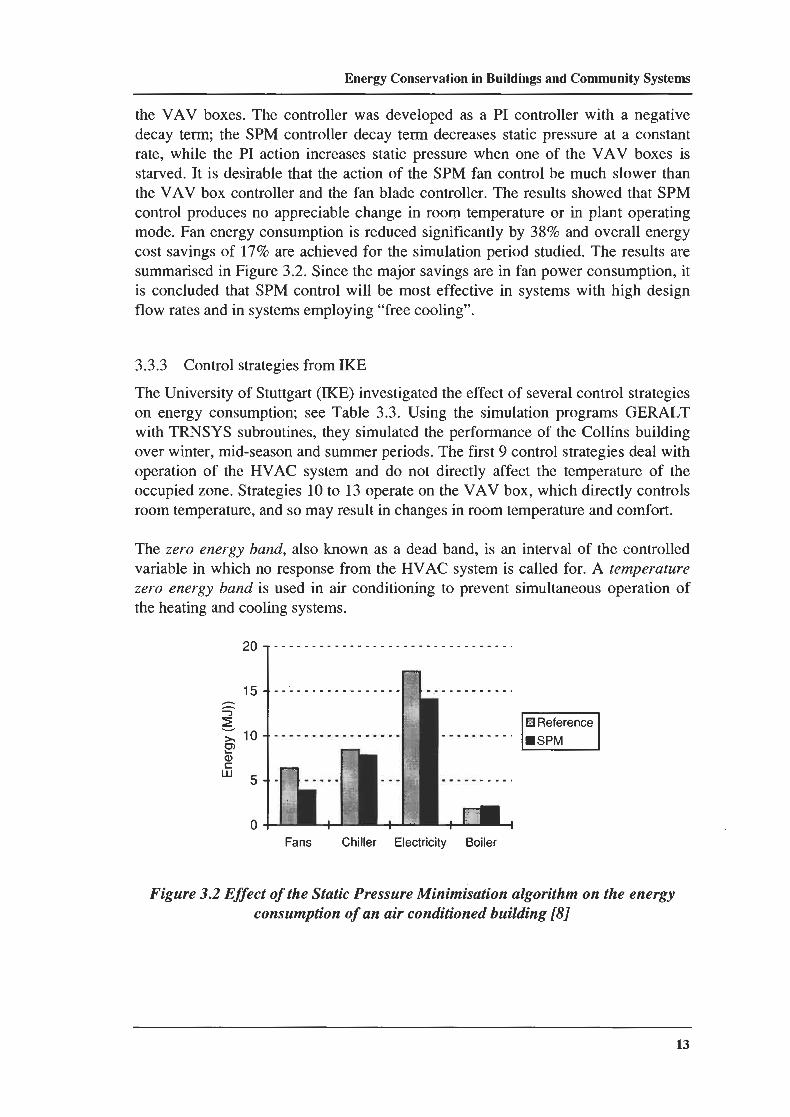
The
res
ults
sho
wed
that
SP
M
cont
rol p
rodu
ces
no a
ppre
ciab
le c
hang
e in
roo
m t
empe
ratu
re o
r in
pla
nt o
pera
ting
mod
e. F
an e
nerg
y co
nsum
ptio
n is
red
uced
sig
nifi
cant
ly b
y 38
% a
nd o
vera
ll en
ergy
co
st s
avin
gs o
f 17
% ar
e ac
hiev
ed f
or th
e si
mul
atio
n pe
riod
stu
died
. The
res
ults
are
su
mm
aris
ed in
Fig
ure
3.2.
Sin
ce th
e m
ajor
sav
ings
are
in f
an p
ower
con
sum
ptio
n, it
is
con
clud
ed t
hat
SPM
con
trol
will
be
mos
t ef
fect
ive
in s
yste
ms
with
hig
h de
sign
fl
ow ra
tes
and
in s
yste
ms e
mpl
oyin
g "f
ree
cool
ing"
.
3.3.
3 C
ontr
ol s
trat
egie
s fr
om IK
E
The
Uni
vers
ity o
f S
tuttg
art (
IKE
) inv
estig
ated
the
effe
ct o
f se
vera
l con
trol
str
ateg
ies
on e
nerg
y co
nsum
ptio
n; s
ee T
able
3.3
. U
sing
the
sim
ulat
ion
prog
ram
s G
ER
AL
T
with
TR
NSY
S su
brou
tines
, the
y si
mul
ated
the
perf
orm
ance
of
the
Col
lins
build
ing
over
win
ter,
mid
-sea
son
and
sum
mer
per
iods
. The
fir
st 9
con
trol
str
ateg
ies
deal
with
op
erat
ion
of t
he H
VA
C s
yste
m a
nd d
o no
t di
rect
ly a
ffec
t th
e te
mpe
ratu
re o
f th
e oc
cupi
ed z
one.
Str
ateg
ies
10 to
13
oper
ate
on th
e V
AV
box
, whi
ch d
irec
tly
cont
rols
ro
om te
mpe
ratu
re, a
nd s
o m
ay r
esul
t in
chan
ges
in ro
om te
mpe
ratu
re a
nd c
omfo
rt.
The
zer
o en
ergy
ban
d, a
lso
know
n as
a d
ead
band
, is
an
inte
rval
of
the
cont
rolle
d va
riab
le i
n w
hich
no
resp
onse
fro
m th
e H
VA
C s
yste
m is
cal
led
for.
A t
empe
ratu
re
zero
ene
rgy
band
is
used
in
air
cond
ition
ing
to p
reve
nt s
imul
tane
ous
oper
atio
n of
th
e he
atin
g an
d co
olin
g sy
stem
s.
Fan
s C
hille
r E
lect
ricity
B
oile
r
H R
efer
ence
m
Fig
ure
3.2
Eff
ect o
f th
e St
atic
Pre
ssur
e M
inim
isat
ion
algo
rith
m o
n th
e en
ergy
co
nsum
ptio
n of
an
air
con
ditio
ned
build
ing
[g]
Building E
nergy Managem
ent Systems
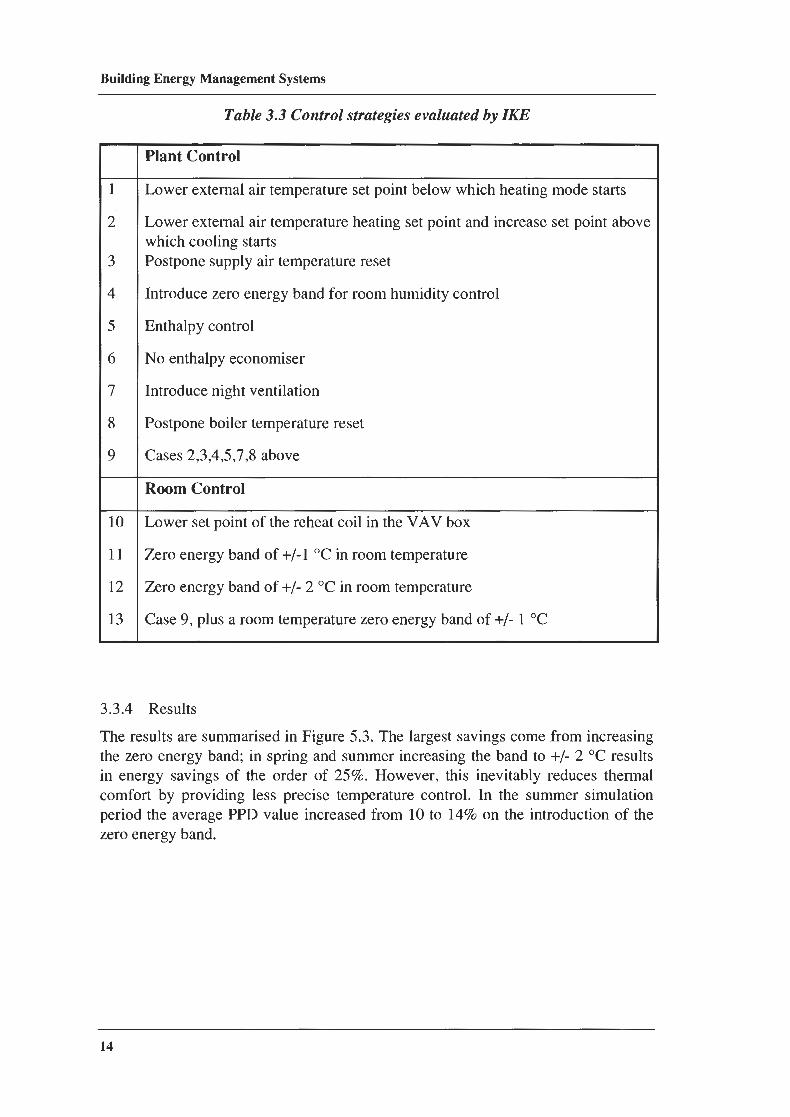
Table 3.3 C
ontrol strategies evaluated by ZKE
Plant C
ontrol
Low
er external air temperature set point below
which heating m
ode starts
Low
er external air temperature heating set point and increase set point above
which cooling starts
Postpone supply air temperature reset
Introduce zero energy band for room hum
idity control
Enthalpy control
No enthalpy econom
iser
Introduce night ventilation
Postpone boiler temperature reset
Cases 2,3,4,5,7,8 above
Room
Control
Low
er set point of the reheat coil in the VA
V box
Zero energy band of +
/-l "C in room
temperature
Zero energy band of +/- 2 "C
in room tem
perature
Case 9, plus a room
temperature zero energy band of +/- l "C
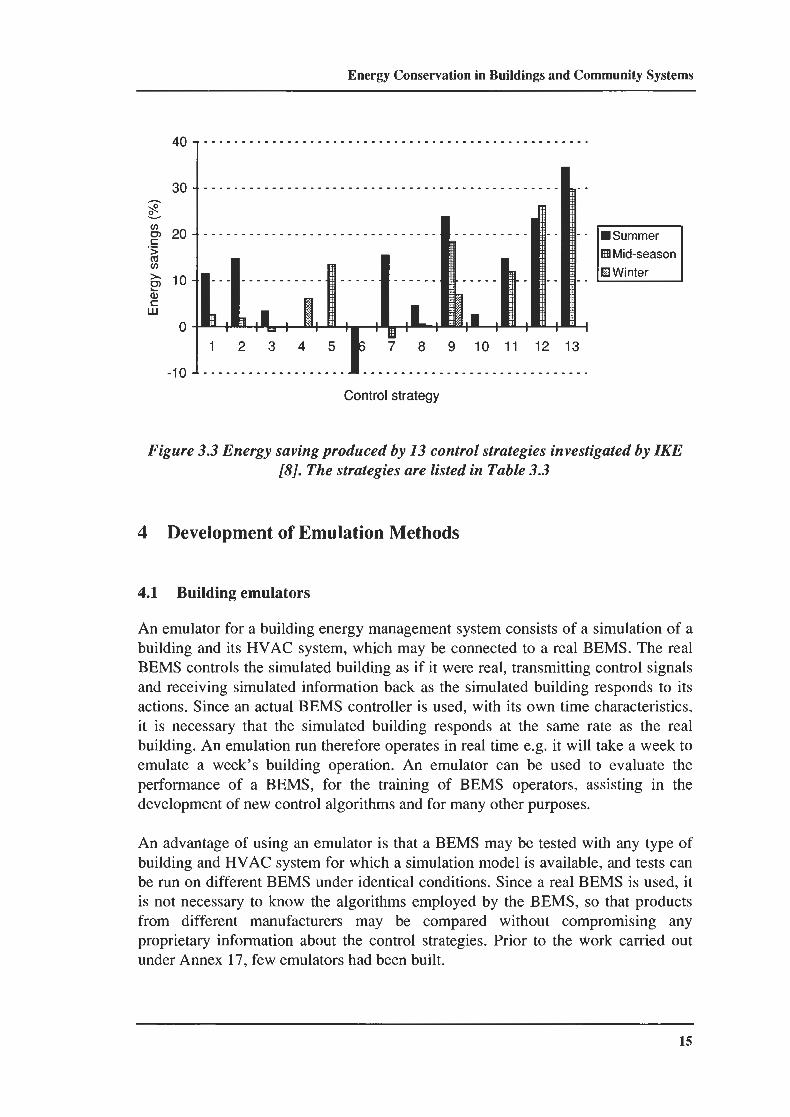
3.3.4 R
esults
The results are sum
marised in Figure 5.3. T
he largest savings come from
increasing the zero energy band; in spring and sum
mer increasing the band to +/- 2 'C
results in energy savings of the order of 25%
. How
ever, this inevitably reduces thermal
comfort by providing less precise tem
perature control. In the summ
er simulation
period the average PPD value increased from
10 to 14% on the introduction of the
zero energy band.
Ene
rgy
Con
serv
atio
n in
Bui
ldin
gs a
nd C
omm
unity
Sys
tem
s
Con
trol s
trat
egy
Fig
ure
3.3
Ene
rgy
savi
ng p
rodu
ced
by 1
3 co
ntro
l str
ateg
ies
inve
stig
ated
by
ZKE
[8].
The
stra
tegi
es a
re li
sted
in T
able
3.3
4 D
evel
opm
ent o
f Em
ulat
ion
Met
hods
4.1
Bui
ldin
g em
ulat
ors
An
emul
ator
for
a b
uild
ing
ener
gy m
anag
emen
t sys
tem
con
sist
s of
a s
imul
atio
n of
a
build
ing
and
its
HV
AC
sys
tem
, whi
ch m
ay b
e co
nnec
ted
to a
rea
l B
EM
S. T
he r
eal
BE
MS
cont
rols
the
sim
ulat
ed b
uild
ing
as if
it w
ere
real
, tra
nsm
ittin
g co
ntro
l sig
nals
an
d re
ceiv
ing
sim
ulat
ed in
form
atio
n ba
ck a
s th
e si
mul
ated
bui
ldin
g re
spon
ds t
o it
s ac
tion
s. S
ince
an
actu
al B
EM
S co
ntro
ller
is u
sed,
with
its
ow
n tim
e ch
arac
teri
stic
s,
it is
nec
essa
ry t
hat
the
sim
ulat
ed b
uild
ing
resp
onds
at
the
sam
e ra
te a
s th
e re
al
build
ing.
An
emul
atio
n ru
n th
eref
ore
oper
ates
in r
eal t
ime
e.g.
it w
ill t
ake
a w
eek
to
emul
ate
a w
eek'
s bu
ildin
g op
erat
ion.
An
emul
ator
can
be
used
to
eval
uate
the
pe
rfor
man
ce o
f a
BE
MS,
for
the
tra
inin
g of
B
EM
S op
erat
ors,
ass
isti
ng i
n th
e de
velo
pmen
t of
new
con
trol
alg
orith
ms
and
for
man
y ot
her p
urpo
ses.
An
adva
ntag
e of
usi
ng a
n em
ulat
or i
s th
at a
BE
MS
may
be
test
ed w
ith a
ny t
ype
of
build
ing
and
HV
AC
sys
tem
for
whi
ch a
sim
ulat
ion
mod
el is
ava
ilab
le, a
nd te
sts
can
be r
un o
n di
ffer
ent B
EM
S un
der
iden
tica
l con
ditio
ns. S
ince
a r
eal B
EM
S is
use
d, i
t is
not
nec
essa
ry t
o kn
ow t
he a
lgor
ithm
s em
ploy
ed b
y th
e B
EM
S, s
o th
at p
rodu
cts
from
di
ffer
ent
man
ufac
ture
rs
may
be
co
mpa
red
with
out
com
prom
isin
g an
y pr
opri
etar
y in
form
atio
n ab
out
the
cont
rol
stra
tegi
es.
Pri
or t
o th
e *
ark
car
ried
out
un
der
Ann
ex 1
7, fe
w e
mul
ator
s ha
d be
en b
uilt.
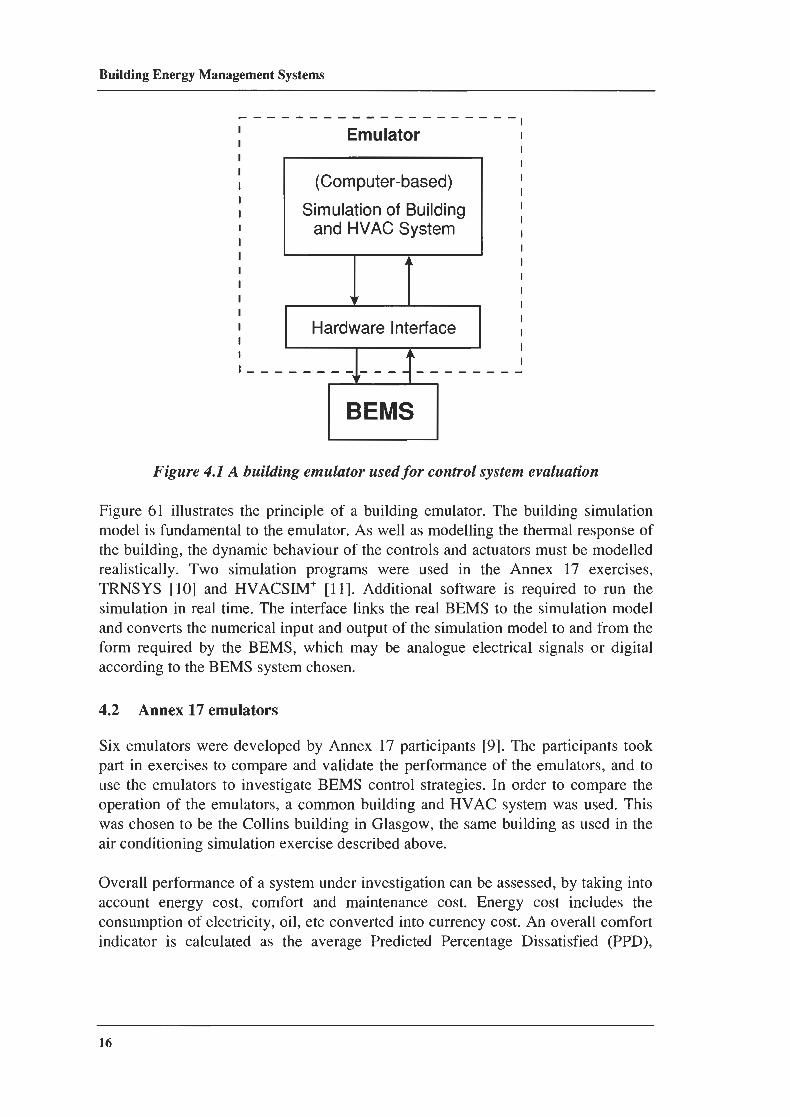
Building E
nergy Managem
ent Systems
I - I
Em
ulator I
I I
I I I I I
Figure 4.1 A
building emulator used for control system
evaluation
I I I
I I I I
I
Figure 61 illustrates the principle of a building em
ulator. The building sim
ulation m
odel is fundamental to the em
ulator. As w
ell as modelling the therm
al response of the building, the dynam
ic behaviour of the controls and actuators must be m
odelled realistically. T
wo
simulation program
s w
ere used
in the
Annex
17 exercises, T
RN
SY
S [l01 and H
VA
CS
IM+
[ll]. Additional softw
are is required to run the sim
ulation in real time. T
he interface links the real BE
MS
to the simulation m
odel and converts the num
erical input and output of the simulation m
odel to and from the
form required by the B
EM
S, w
hich may be analogue electrical signals or digital
according to the BE
MS
system chosen.
(Com
puter-based)
Sim
ulation of Building
and HV
AC
System
I I
4.2 A
nnex 17 emulators
I I I I
A
I I I
Six em
ulators were developed by A
nnex 17 participants [9]. The participants took
part in exercises to compare and validate the perform
ance of the emulators, and to
use the emulators to investigate B
EM
S control strategies. In order to com
pare the operation of the em
ulators, a comm
on building and HV
AC
system w
as used. This
was chosen to be the C
ollins building in Glasgow
, the same building as used in the
air conditioning simulation exercise described above.
Overall perform
ance of a system under investigation can be assessed, by taking into
account energy cost, com
fort and m
aintenance cost. E
nergy cost includes the consum
ption of electricity, oil, etc converted into currency cost. An overall com
fort indicator is calculated as the average P
redicted Percentage D
issatisfied (PP
D),
I v
I I I I
I I I H
ardware Interface
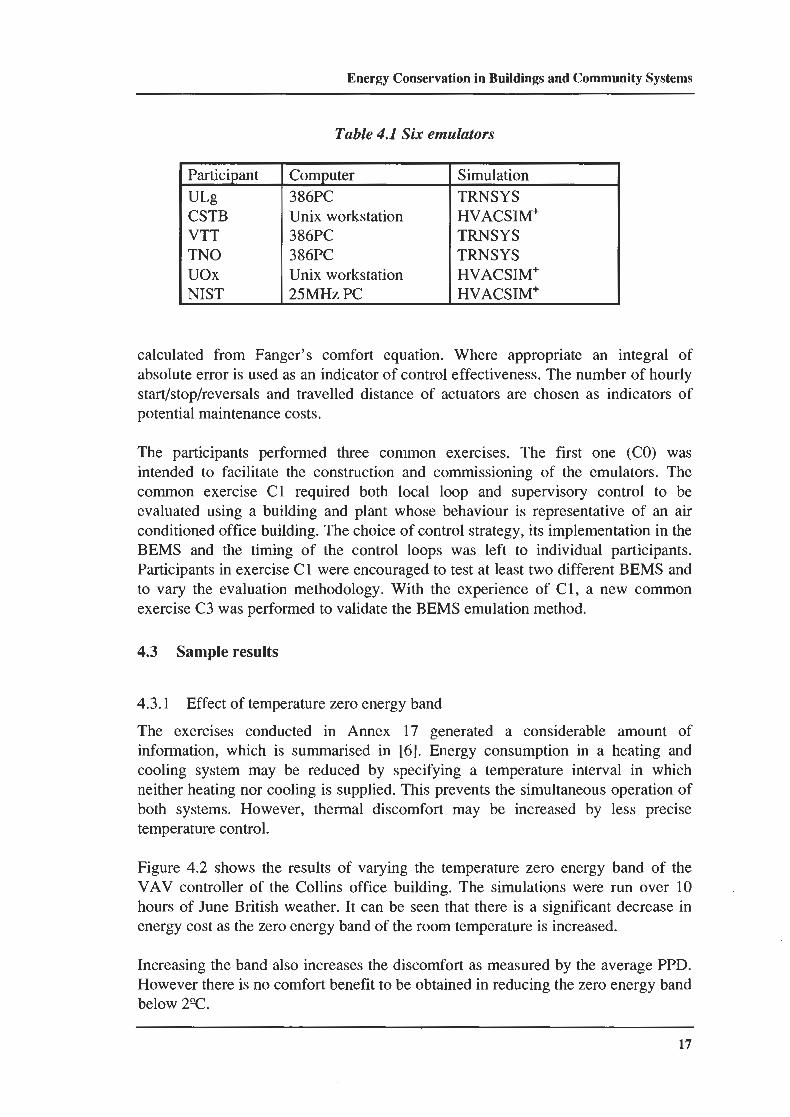
Ene
rgy
Con
serv
atio
n in
Bui
ldin
gs a
nd C
omm
unit
y Sy
stem
s
Tab
le 4
.1 S
ix e
mul
ator
s
CST
B
VT
T
TN
O
uo
x
NIS
T
386P
C
Uni
x w
orks
tatio
n 38
6PC
38
6PC
U
nix
wor
ksta
tion
25M
Hz
PC
Sim
ulat
ion
TR
NSY
S H
VA
CS
IW
TR
NSY
S T
RN
SYS
HV
AC
SIM
' H
VA
CSI
M+
calc
ulat
ed
from
F
ange
r's
com
fort
eq
uati
on.
Whe
re a
ppro
pria
te a
n in
tegr
al o
f ab
solu
te e
rror
is u
sed
as a
n in
dica
tor
of c
ontr
ol e
ffec
tive
ness
. The
num
ber
of h
ourl
y st
art/s
top/
reve
rsal
s an
d tr
avel
led
dist
ance
of
actu
ator
s ar
e ch
osen
as
indi
cato
rs o
f po
tent
ial m
aint
enan
ce c
osts
.
The
par
ticip
ants
pe
rfor
med
th
ree
com
mon
ex
erci
ses.
T
he
firs
t on
e (C
O)
was
in
tend
ed t
o fa
cili
tate
the
con
stru
ctio
n an
d co
mm
issi
onin
g of
the
em
ulat
ors.
The
co
mm
on e
xerc
ise
C1
requ
ired
bo
th
loca
l lo
op a
nd
supe
rvis
ory
cont
rol
to b
e ev
alua
ted
usin
g a
build
ing
and
plan
t w
hose
beh
avio
ur i
s re
pres
enta
tive
of
an a
ir
cond
ition
ed o
ffic
e bu
ildin
g. T
he c
hoic
e of
con
trol
str
ateg
y, it
s im
plem
enta
tion
in th
e B
EM
S an
d th
e tim
ing
of t
he c
ontr
ol l
oops
was
lef
t to
ind
ivid
ual
part
icip
ants
. P
arti
cipa
nts i
n ex
erci
se C
1 w
ere
enco
urag
ed to
test
at l
east
two
diff
eren
t BE
MS
and
to v
ary
the
eval
uatio
n m
etho
dolo
gy.
Wit
h th
e ex
peri
ence
of
Cl,
a n
ew c
omm
on
exer
cise
C3
was
per
form
ed to
val
idat
e th
e B
EM
S em
ulat
ion
met
hod.
4.3
Sam
ple
resu
lts
4.3.
1 E
ffec
t of
tem
pera
ture
zer
o en
ergy
ban
d
The
ex
erci
ses
cond
ucte
d in
A
nnex
17
ge
nera
ted
a co
nsid
erab
le
amou
nt
of
info
rmat
ion,
whi
ch i
s su
mm
aris
ed i
n [6
]. E
nerg
y co
nsum
ptio
n in
a h
eati
ng a
nd
cool
ing
syst
em m
ay b
e re
duce
d by
sp
ecif
ying
a t
empe
ratu
re i
nter
val
in w
hich
ne
ither
hea
ting
nor
cool
ing
is s
uppl
ied.
Thi
s pr
even
ts t
he s
imul
tane
ous
oper
atio
n of
bo
th
syst
ems.
H
owev
er,
ther
mal
dis
com
fort
may
be
in
crea
sed
by
less
pre
cise
te
mpe
ratu
re c
ontr
ol.
Fig
ure
4.2
show
s th
e re
sult
s of
var
ying
the
tem
pera
ture
zer
o en
ergy
ban
d of
the
V
AV
con
trol
ler
of t
he C
olli
ns o
ffic
e bu
ildin
g. T
he s
imul
atio
ns w
ere
run
over
10
hour
s of
Jun
e B
ritis
h w
eath
er.
It c
an b
e se
en th
at t
here
is
a si
gnif
ican
t dec
reas
e in
en
ergy
cos
t as
the
zero
ene
rgy
band
of
the
room
tem
pera
ture
is in
crea
sed.
Incr
easi
ng th
e ba
nd a
lso
incr
ease
s th
e di
scom
fort
as
mea
sure
d by
the
ave
rage
PPD
. H
owev
er th
ere
is n
o co
mfo
rt b
enef
it to
be
obta
ined
in r
educ
ing
the
zero
ene
rgy
band
be
low
2T
.
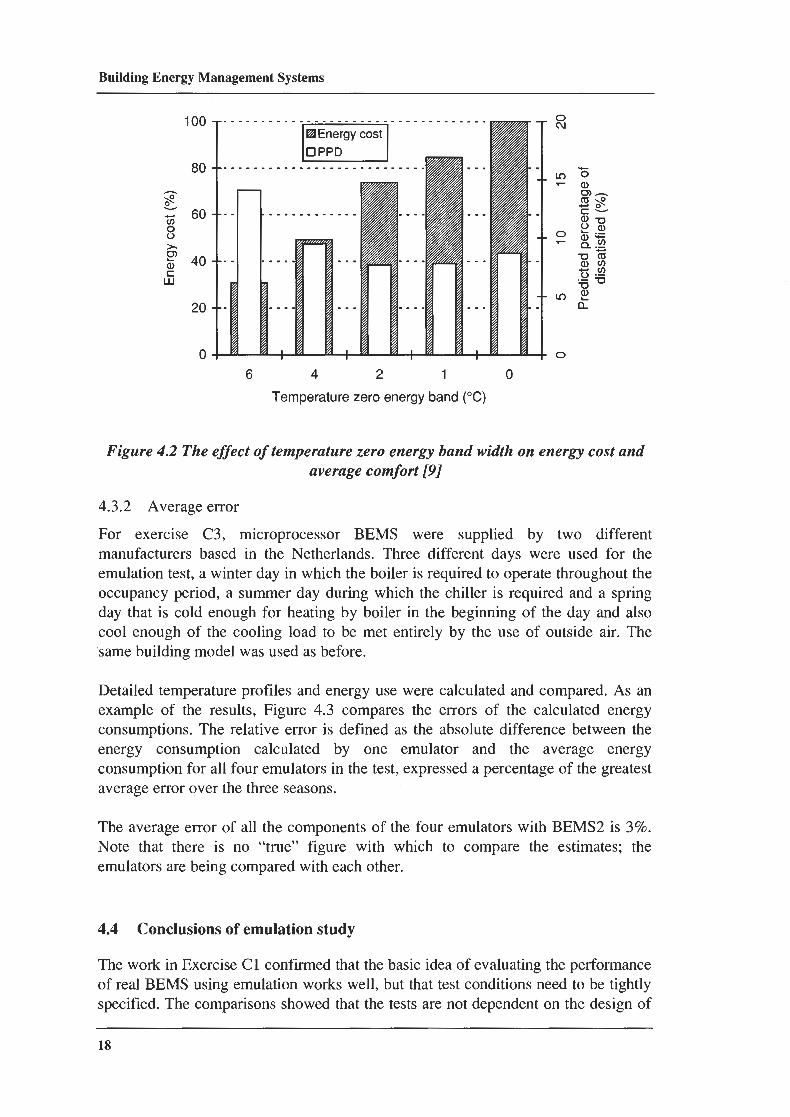
Building E
nergy Managem
ent Systems
H E
nergy cost
6
4 2
1 0
Temperature zero energy band ("C
)
Figure 4.2 T
he effect of temperature zero energy band w
idth on energy cost and average com
fort [9]
4.3.2 A
verage error
For exercise
C3,
microprocessor
BE
MS
were
supplied by
two
different m
anufacturers based in the Netherlands. T
hree different days were used for the
emulation test, a w
inter day in which the boiler is required to operate throughout the
occupancy period, a summ
er day during which the chiller is required and a spring
day that is cold enough for heating by boiler in the beginning of the day and also cool enough of the cooling load to be m
et entirely by the use of outside air. The
'same building m
odel was used as before.
Detailed tem
perature profiles and energy use were calculated and com
pared. As an
example of
the results, Figure 4.3 com
pares the errors of the calculated energy consum
ptions. The relative error is defined as the absolute difference betw
een the energy
consumption
calculated by
one em
ulator and
the average
energy consum
ption for all four emulators in the test, expressed a percentage of the greatest
average error over the three seasons.
The average error of all the com
ponents of the four emulators w
ith BE
MS2 is 3%
. N
ote that there is no "true"
figure with
which to com
pare the estimates; the
emulators are being com
pared with each other.
4.4 C
onclusions of emulation study
The w
ork in Exercise C
l confirmed that the basic idea of evaluating the perform
ance of real B
EM
S using emulation w
orks well, but that test conditions need to be tightly
specified. The com
parisons showed that the tests are not dependent on the design of
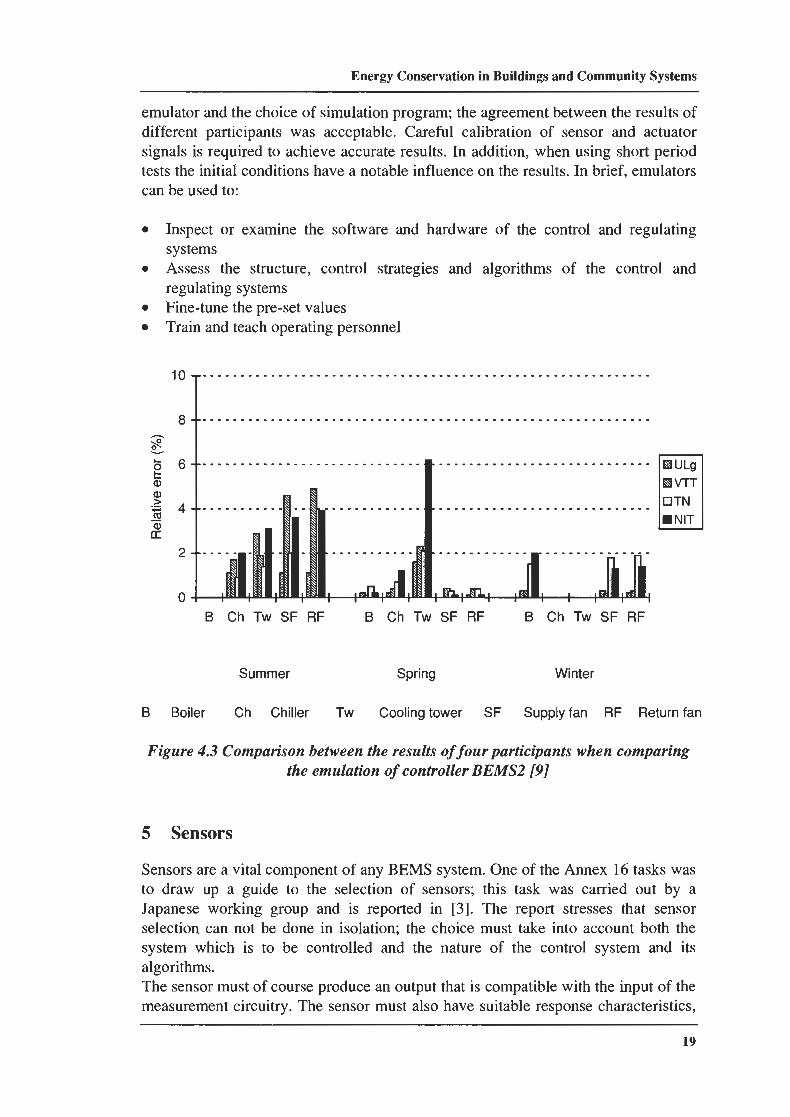
Ene
rgy
Con
serv
atio
n in
Bui
ldin
gs a
nd C
omm
unity
Sys
tem
s
emul
ator
and
the
choi
ce o
f si
mul
atio
n pr
ogra
m; t
he a
gree
men
t bet
wee
n th
e re
sult
s of
di
ffer
ent
part
icip
ants
was
acc
epta
ble.
Car
eful
cal
ibra
tion
of
sens
or a
nd a
ctua
tor
sign
als
is r
equi
red
to a
chie
ve a
ccur
ate
resu
lts.
In
addi
tion
, whe
n us
ing
shor
t per
iod
test
s th
e in
itia
l con
ditio
ns h
ave
a no
tabl
e in
flue
nce
on th
e re
sult
s. In
bri
ef, e
mul
ator
s ca
n be
use
d to
:
Insp
ect
or e
xam
ine
the
soft
war
e an
d ha
rdw
are
of t
he c
ontr
ol a
nd r
egul
atin
g sy
stem
s A
sses
s th
e st
ruct
ure,
con
trol
str
ateg
ies
and
algo
rith
ms
of
the
cont
rol
and
regu
latin
g sy
stem
s F
ine-
tune
the
pre-
set v
alue
s T
rain
and
teac
h op
erat
ing
pers
onne
l
UN
IT F!
Sum
mer
S
prin
g W
inte
r
B
Boi
ler
Ch
Chi
ller
Tw
C
oolin
g to
wer
S
F
Sup
ply
fan
RF
R
etur
n fa
n
Fig
ure
4.3
Com
pari
son
betw
een
the
resu
lts o
f fou
r pa
rtic
ipan
ts w
hen
com
pari
ng
the
emul
atio
n of
con
trol
ler
BE
MS2
[9]
5 Se
nsor
s
Sen
sors
are
a v
ital
com
pone
nt o
f an
y B
EM
S sy
stem
. One
of
the
Ann
ex 1
6 ta
sks
was
to
dra
w u
p a
guid
e to
the
sel
ectio
n of
se
nsor
s; t
his
task
was
car
ried
out
by
a Ja
pane
se w
orki
ng g
roup
and
is
repo
rted
in
[3].
The
rep
ort
stre
sses
tha
t se
nsor
se
lect
ion
can
not
be d
one
in i
sola
tion
; the
cho
ice
mus
t ta
ke i
nto
acco
unt
both
the
sy
stem
whi
ch i
s to
be
cont
rolle
d an
d th
e na
ture
of
the
cont
rol
syst
em a
nd i
ts
algo
rith
ms.
T
he s
enso
r mus
t of
cour
se p
rodu
ce a
n ou
tput
that
is c
ompa
tible
with
the
inpu
t of
the
mea
sure
men
t cir
cuitr
y. T
he s
enso
r m
ust
also
hav
e su
itabl
e re
spon
se c
hara
cter
isti
cs,
Building E
nergy Managem
ent Systems
providing a suitable speed of response for both the measured variable and the
control algorithm. For
instance a sensor must have
sufficiently fast speed of response to ensure that the necessary control action is taken in tim
e; however a very
sensitive sensor may provide nuisance action on short-term
transient inputs.
Care m
ust be taken over the relation of the sensor to the physical quantity being m
easured; air temperature m
ay vary considerably over an occupied room, so that
placement of the sensor is critical to satisfactory operation. T
he report summ
arises the stages in sensor selection as follow
s:
Select each sensor w
ith all aspects of its intended purpose in mind.
Assess w
hether or not a complete space can be satisfactorily represented by
measurem
ent made at a single point.
Consider carefully w
hether there are disturbing influences present which m
ay affect the
accurate operation of the
sensor, such as temperature, hum
idity, radiation, vibration, contam
ination, electromagnetic fields, etc.
Special attention should be paid to the long-term
reliability of integrating sensors, since errors are accum
ulated over time.
Pay special attention to the maintenance aspects, w
hich vary considerably among
types of sensor.
With the falling cost of electronics, there is a grow
ing tendency to incorporate signal processing w
ithin the sensor itself, to produce the so-called intelligent
sensor. Intelligent sensors offer som
e or all of the following characteristics:
signal processing
within
the sensor,
including autom
atic calibration
and com
pensation, detection and exclusion of abnorm
al values, built in control algorithm
s, m
emory,
comm
unication capability, offering direct linking to a comm
unication bus, com
bination of several measured variables to produce an index.
The report goes on to consider a very w
ide range of sensor types, from snow
fall detection to urinal flushing, from
earthquake sensors to flue gas detection. Several
case studies are given to demonstrate the process of sensor selection. T
he importance
of considering the control software w
hen choosing the most appropriate sensor is
stressed throughout the text. Most of the sensors considered are used throughout the
participating countries. How
ever, there are variations between different national
regulations, particularly with respect to fire detection and prevention.
Ene
rgy
Con
serv
atio
n in
Bui
ldin
gs a
nd C
omm
unity
Sys
tem
s
6 C
ost B
enef
it A
naly
sis
6.1
Obj
ecti
ves
A c
ompr
ehen
sive
BE
MS
syst
em r
epre
sent
s a
subs
tant
ial
inve
stm
ent,
whi
ch i
s ex
pect
ed t
o br
ing
a va
riet
y of
ben
efits
. In
ord
er t
o m
ake
a ra
tion
al d
esig
n ov
er th
e le
vel
of i
nves
tmen
t to
cho
ose,
it i
s ne
cess
ary
to h
ave
som
e m
etho
d of
com
pari
son
betw
een
alte
rnat
ive
syst
ems.
Cos
t ben
efit
met
hods
of
anal
ysis
hav
e be
en d
evel
oped
by
eco
nom
ists
whi
ch a
im to
exp
ress
all
cos
ts a
nd b
enef
its
asso
ciat
ed w
ith a
pla
n of
ac
tion
in c
omm
on u
nits
, i.e
. mon
ey, a
nd to
mak
e ra
tiona
l com
pari
sons
bet
wee
n pl
ans
whi
ch m
ay h
ave
diff
eren
t si
ze a
nd t
ime
scal
es.
One
im
port
ant p
rinc
iple
is
that
the
be
nefi
ts a
nd c
osts
mus
t be
expr
esse
d fr
om a
sin
gle
poin
t of
view
e.g
. bet
ter
indo
or a
ir
qual
ity m
ay b
e be
nefi
cial
to t
he o
ffic
e w
orke
r in
ter
ms
of h
ealth
and
com
fort
and
it
may
pro
duce
a b
enef
it fo
r th
e of
fice
ten
ant
in t
erm
s of
in
crea
sed
prod
uctiv
ity.
How
ever
, ne
ither
is
a di
rect
ben
efit
for
the
build
ing
owne
r, w
ho m
ay b
e ab
le t
o ac
hiev
e th
e be
nefi
t in
inc
reas
ed r
ent.
Cos
t be
nefi
t an
alys
is i
s m
ost
stra
ight
forw
ard
whe
re th
e bu
ildin
g ow
ner,
ope
rato
r and
em
ploy
er a
re th
e sa
me.
Whe
re th
ey a
re n
ot, i
t m
ust
be b
orne
in
min
d th
at t
he o
rgan
isat
ion
rece
ivin
g th
e be
nefi
t of
a r
educ
tion
in
ener
gy c
onsu
mpt
ion
may
not
be
the
orga
nisa
tion
that
inst
alle
d th
e B
EM
S.
The
Ann
ex 1
6 ta
sk o
n C
ost B
enef
it A
sses
smen
t M
etho
ds f
or B
EM
S [2
] set
out
to
prod
uce
a co
here
nt a
naly
sis
proc
edur
e w
hich
cou
ld b
e us
ed b
y th
e pa
rtic
ipat
ing
coun
trie
s to
cal
cula
te s
avin
gs f
rom
BE
MS
and
to m
ake
inve
stm
ent d
ecis
ions
. Aft
er
disc
ussi
ons
with
the
par
ticip
ants
, th
e re
port
con
clud
ed n
o si
ngle
mod
el w
ould
be
com
e ac
cept
ed; t
he m
ore
com
mon
met
hods
of
anal
ysis
are
giv
en in
the
repo
rt a
nd
sum
mar
ised
bel
ow. M
ore
impo
rtan
t tha
n th
e m
etho
d ch
osen
is th
e ab
ility
to p
rovi
de
good
qua
lity
inpu
t dat
a, p
artic
ular
ly w
here
it is
nec
essa
ry to
com
pare
dif
fere
nt ty
pes
of c
osts
and
sav
ings
e.g
. inv
estm
ent c
ost v
s. p
rodu
ctiv
ity g
ain.
6.2
Cos
t and
ben
efits
The
rep
ort
reco
mm
ends
that
a d
etai
led
list
ing
is p
repa
red
of t
he c
ost
incu
rred
and
th
e be
nefi
ts e
xpec
ted
from
the
B
EM
S.
A
deta
iled
lis
t as
sist
s es
tim
atio
n an
d co
mpa
riso
n be
twee
n al
tern
ativ
e sy
stem
s.
Tab
le
6.1
sum
mar
ises
the
su
gges
ted
head
ings
, whi
ch m
ay b
e ex
pand
ed in
to c
onsi
dera
bly
mor
e de
tail.
Est
imat
ion
of e
nerg
y sa
ving
requ
ires
a r
efer
ence
nor
m a
gain
st w
hich
the
savi
ngs
are
to b
e co
mpa
red.
A c
ontr
ol s
yste
m c
anno
t in
its
elf
save
ene
rgy,
in
the
way
tha
t im
prov
ed th
erm
al i
nsul
atio
n re
duce
s th
e en
ergy
req
uire
men
t of
a b
uild
ing.
A g
ood
cont
rol s
yste
m re
duce
s w
aste
rat
her
than
red
uces
ene
rgy
requ
irem
ents
. In
a m
oder
n of
fice
bui
ldin
g, s
taff
ing
cost
s do
min
ate
over
ene
rgy
cost
s. T
he b
enef
its o
f im
prov
ed
staf
f ut
ilisa
tion
may
the
refo
re o
utw
eigh
the
sav
ings
in
ener
gy c
onsu
mpt
ion.
The
re
port
quo
tes
estim
ates
whi
ch s
tate
tha
t th
e be
nefi
ts o
f an
int
ellig
ent
buil
ding
in
term
s of
en
ergy
sa
ving
s,
incr
ease
d pr
oduc
tivity
an
d re
duct
ion
in
buil
ding
m
anag
emen
t co
sts
are
roug
hly
equa
l; p
ut a
noth
er w
ay,
this
mea
ns t
hat
the
over
all
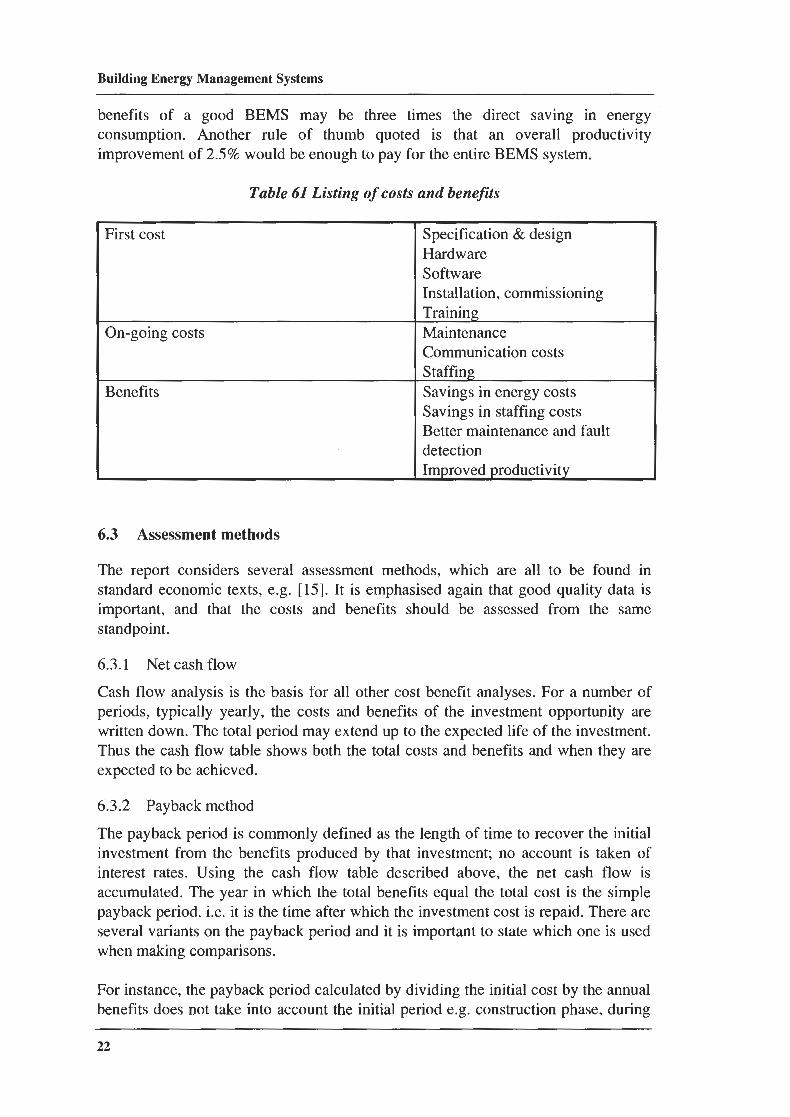
Building E
nergy Managem
ent Systems
benefits of
a good
BE
MS
may
be three
times
the direct
saving in
energy consum
ption. A
nother rule
of thum
b quoted
is that
an overall
productivity im
provement of 2.5%
would be enough to pay for the entire B
EM
S system.
Table 61 L
isting of costs and benefits
First cost
Specification & design
Hardw
are Softw
are Installation, com
missioning
On-going costs
I I detection
Training
Maintenance
Benefits
1 I Im
proved productivity
Com
munication costs
Staffing
Savings in energy costs
Savings in staffing costs
Better m
aintenance and fault
6.3 A
ssessment m
ethods
The report considers several assessm
ent methods, w
hich are all to be found in standard econom
ic texts, e.g. [15]. It is emphasised again that good quality data is
important, and that the
costs and benefits
should be assessed from
the sam
e standpoint.
6.3.1 N
et cash flow
Cash flow
analysis is the basis for all other cost benefit analyses. For a number of
periods, typically yearly, the costs and benefits of the investment opportunity are
written dow
n. The total period m
ay extend up to the expected life of the investment.
Thus the cash flow
table shows both the total costs and benefits and w
hen they are expected to be achieved.
6.3.2 Payback m
ethod
The payback period is com
monly defined as the length of tim
e to recover the initial investm
ent from the benefits produced by that investm
ent; no account is taken of interest rates. U
sing the cash flow table described above, the net cash flow
is accum
ulated. The year in w
hich the total benefits equal the total cost is the simple
payback period. i.e. it is the time after w
hich the investment cost is repaid. T
here are several variants on the payback period and it is im
portant to state which one is used
when m
aking comparisons.
For instance, the payback period calculated by dividing the initial cost by the annual benefits does not take into account the initial period e.g. construction phase, during
Ene
rgy
Con
serv
atio
n in
Bui
ldin
gs a
nd C
omm
unit
y Sy
stem
s
whi
ch n
o be
nefi
ts a
re r
ecei
ved.
In
gene
ral t
he p
ayba
ck p
erio
d fa
ils
to c
onsi
der
the
time
valu
e of
mon
ey i
.e. t
he v
alue
of
mon
ey t
o be
rec
eive
d in
the
fut
ure
is l
ess
than
th
at o
f m
oney
rec
eive
d no
w,
nor
does
it
cons
ider
wha
t ha
ppen
s af
ter
the
payb
ack
peri
od, e
.g. t
he m
agni
tude
and
tim
ing
of th
e ca
sh fl
ows.
The
pay
back
met
hod
tend
s to
fav
our s
hort
er-l
ived
inve
stm
ents
. Acc
epta
ble
valu
es o
f pa
ybac
k pe
riod
var
y w
ith t
he t
ype
of o
rgan
isat
ion.
Typ
ical
ly, p
ayba
ck p
erio
ds o
f 3
year
s or
less
are
requ
ired
by
indu
stry
and
up
to 1
0 ye
ars
by G
over
nmen
t pro
ject
s.
6.3.
3 D
isco
unt t
echn
ique
s
The
re a
re s
ever
al d
isco
unt
tech
niqu
es,
all
of
whi
ch u
se a
dis
coun
t ra
te i
n th
e ca
lcul
atio
ns,
refl
ectin
g th
e tim
e va
lue
of m
oney
. T
he P
rese
nt W
orth
met
hod
is
typi
cal;
als
o kn
own
as N
et P
rese
nt V
alue
. All
futu
re a
mou
nts
in t
he c
ash
flow
tabl
e ar
e di
scou
nted
bac
k to
the
sta
rt o
f th
e pr
ojec
t. T
he d
isco
unt r
ate
may
be
thou
ght o
f as
the
ret
urn
avai
labl
e on
mon
ey f
rom
oth
er i
nves
tmen
ts;
10%
is
typi
call
y us
ed.
With
thi
s m
etho
d of
an
alys
is,
it i
s po
ssib
le t
hat
an i
nves
tmen
t w
hich
sho
ws
a po
siti
ve n
et c
ash
flow
aft
er a
few
yea
rs m
ay s
how
a n
egat
ive
pres
ent
wor
th;
the
impl
icat
ion
is t
hat
it w
ould
be
mor
e pr
ofit
able
to
inve
st t
he m
oney
els
ewhe
re.
Rel
ated
met
hods
incl
ude
Fut
ure
Wor
th a
nd I
nter
nal R
ate
of R
etur
n.
6.4.
R
esul
ts
Eco
nom
ic a
sses
smen
t met
hods
of
cost
ben
efit
ana
lysi
s ar
e w
ell e
stab
lish
ed. T
he IE
A
repo
rt [
2] s
umm
aris
es th
e m
etho
ds a
nd a
lso
give
det
aile
d ex
ampl
es o
f an
alys
is f
or
build
ings
sub
mitt
ed b
y pa
rtic
ipan
ts.
It i
s em
phas
ised
tha
t th
e m
ain
diff
icul
ty i
s in
as
sess
ing
and
quan
tifyi
ng th
e be
nefi
ts to
be
achi
eved
from
the
BE
MS.
Tab
le 6
.1 is
re
prod
uced
fro
m A
ppen
dix
B o
f th
e re
port
and
sho
ws
estim
ates
of
the
payb
ack
peri
ods
asso
ciat
ed w
ith
the
maj
or
cont
rol
func
tion
s of
a
BE
MS.
It
m
ust
be
emph
asis
ed th
at t
hese
are
rou
gh e
stim
ates
onl
y an
d th
at t
he s
avin
gs f
rom
dif
fere
nt
BE
MS
cont
rol f
unct
ions
are
not
add
itive
.
7
Cas
e St
udie
s
7.1
Sum
mar
y of
cas
e st
udie
s
Part
of
the
brie
f of
Ann
ex 1
6 w
as to
stu
dy e
xam
ples
of
actu
al B
EM
S in
stal
lati
ons i
n pa
rtic
ipat
ing
coun
trie
s. T
he w
ork
was
rep
orte
d in
[4]
and
is b
rief
ly s
umm
aris
ed
here
. The
repo
rts
wer
e in
tend
ed to
info
rm th
e re
ader
on
the
poss
ible
app
lica
tion
s of
en
ergy
man
agem
ent a
nd to
illu
stra
te th
e us
e of
BE
MS
in a
rang
e of
bui
ldin
g ty
pes.
T
he ra
nge
of b
uild
ings
stu
died
was
wid
e, c
over
ing
a ra
nge
of s
ize
and
com
plex
ity
of
inst
alla
tion
. Mos
t of
the
build
ings
stu
died
wer
e of
fice
s, b
ut th
ere
wer
e al
so
exam
ples
of
larg
e sy
stem
s whi
ch li
nked
toge
ther
a n
umbe
r of
dis
para
te b
uild
ings
un
der
com
mon
adm
inis
trat
ion.
Tab
le 7
.1 s
umm
aris
es th
e st
udie
s. W
hen
cons
ider
ing
the
case
stu
dies
, it m
ust b
e re
mem
bere
d th
at th
e re
port
was
issu
ed in
199
1, an
d th
at
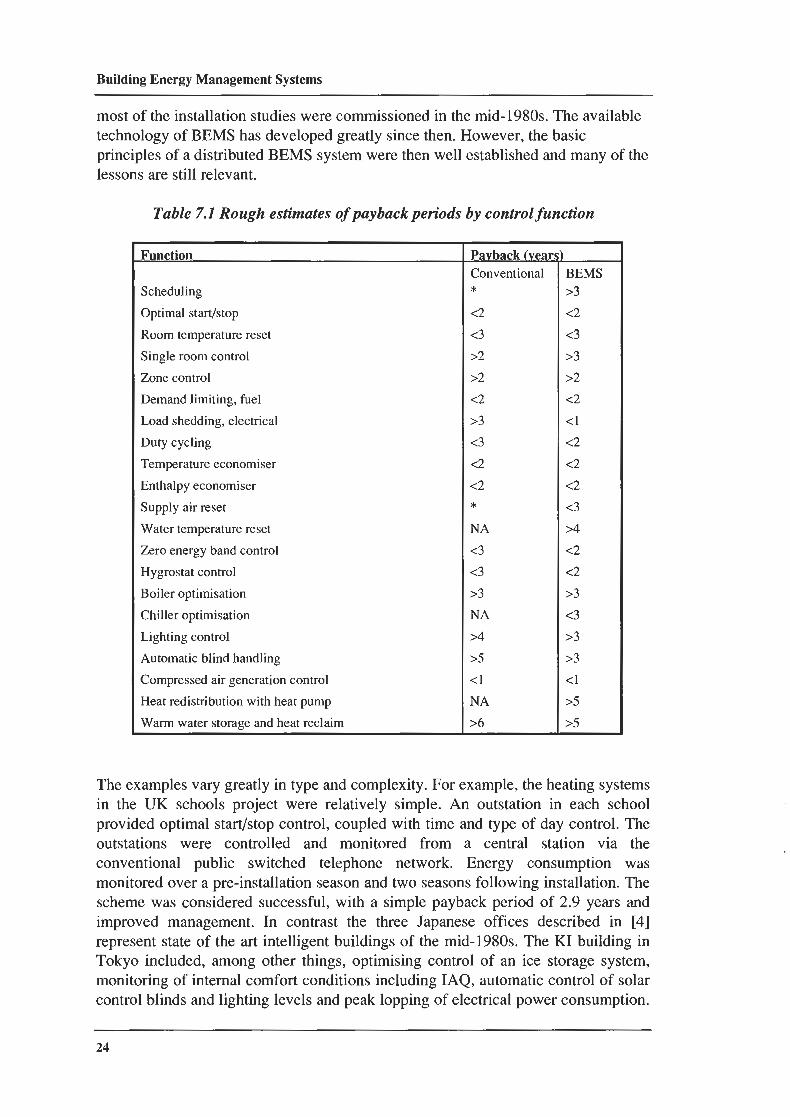
Building E
nergy Managem
ent Systems
most of the installation studies w
ere comm
issioned in the mid-1980s. T
he available technology of B
EM
S has developed greatly since then. How
ever, the basic principles of a distributed B
EM
S system w
ere then well established and m
any of the lessons are still relevant.
Table 7.1 R
ough estimates of payback periods by control function
Function
Scheduling
Optim
al startlstop
Room
temperature reset
Single room control
Zone control
Dem
and limiting, fuel
Load shedding, electrical
Duty cycling
Tem
perature economiser
Enthalpy econom
iser
Supply air reset
Water tem
perature reset
Zero energy band control
Hygrostat control
Boiler optim
isation
Chiller optirnisation
Lighting control
Autom
atic blind handling
Com
pressed air generation control
Heat redistribution w
ith heat pump
Warm
water storage and heat reclaim
Pavback hear
Conventional
* <2
<3
>2
>2
<2
>3
<3
<2
<2 * N
A
<3
<3
>3
NA
>4
>5
<l
NA
>6
BE
MS
>3
<2
<3
>3
>2
<2
<l
<2
<2
<2
<3
>4
<2
<2
>3
<3
>3
>3
<l
>5
>5
The exam
ples vary greatly in type and complexity. For exam
ple, the heating systems
in the UK
schools project were relatively sim
ple. An outstation in each school
provided optimal start/stop control, coupled w
ith time and type of day control. T
he outstations
were
controlled and
monitored
from
a central
station via
the conventional
public sw
itched telephone
network.
Energy
consumption
was
monitored over a pre-installation season and tw
o seasons following installation. T
he schem
e was considered successful, w
ith a simple payback period of 2.9 years and
improved m
anagement. In contrast the three Japanese offices described in
[4] represent state of the art intelligent buildings of the m
id-1980s. The K
1 building in T
okyo included, among other things, optim
ising control of an ice storage system,
monitoring of internal com
fort conditions including IAQ
, automatic control of solar
control blinds and lighting levels and peak lopping of electrical power consum
ption.
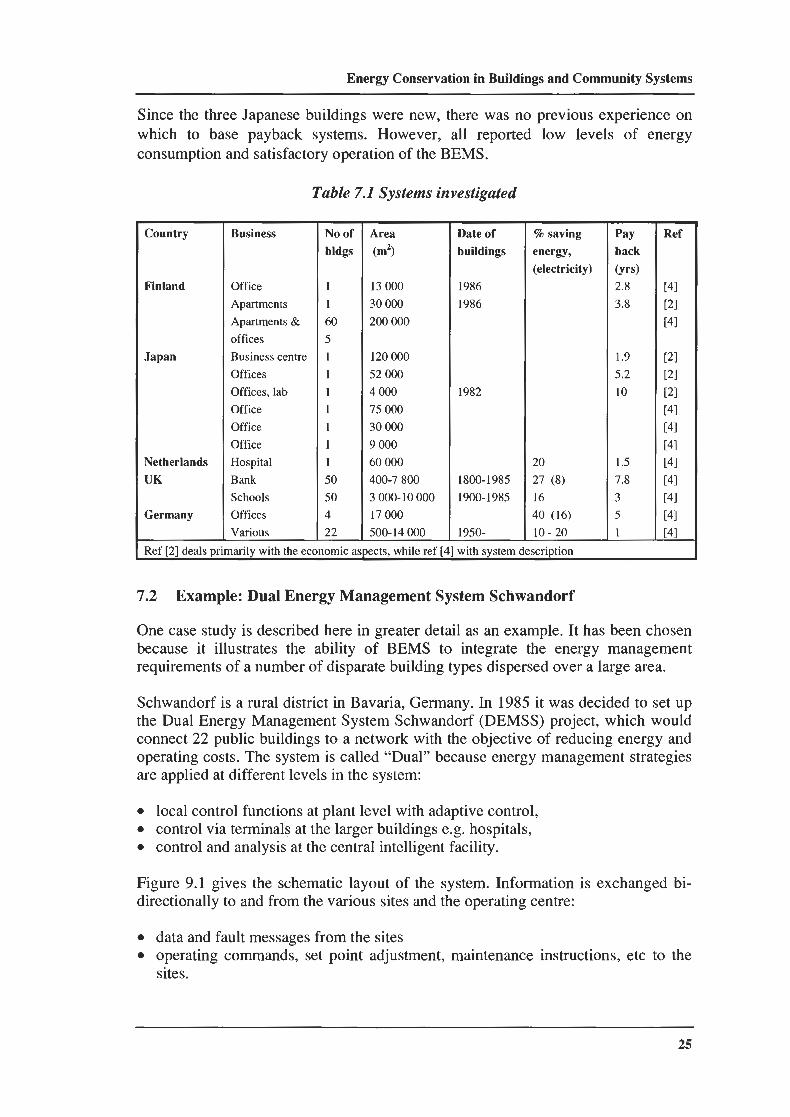
Ene
rgy
Con
serv
atio
n in
Bui
ldin
gs a
nd C
omm
unit
y Sy
stem
s
Sin
ce th
e th
ree
Japa
nese
bui
ldin
gs w
ere
new
, the
re w
as n
o pr
evio
us e
xper
ienc
e on
w
hich
to
base
pay
back
sy
stem
s.
How
ever
, al
l re
port
ed
low
le
vels
of
en
ergy
co
nsum
ptio
n an
d sa
tisfa
ctor
y op
erat
ion
of t
he B
EM
S.
Tab
le 7
.1 S
yste
ms
inve
stig
ated
Cou
ntry
Fin
land
Japa
n
Net
herl
ands
U
K
Ger
man
y
Bus
ines
s
Off
ice
Apa
rtm
ents
A
part
men
ts &
offi
ces
Bus
ines
s ce
ntre
Off
ices
Off
ices
, lab
O
ffic
e
Off
ice
Off
ice
Hos
pita
l
Ban
k
Scho
ols
Off
ices
Var
ious
-
No
of
bldg
s
1 1 60
5 1 1 1 1 1 1 1 50
50
4 22
Are
a
(m2)
13 0
00
30 0
00
200
000
120
000
52 0
00
4 00
0
75 0
00
30 0
00
9 00
0 60
000
400-
7 80
0 3
000-
10 0
00
17 0
00
500-
l4 0
00
Dat
e of
bu
ildin
gs
1986
19
86
1982
1800
-198
5 19
00-1
985
1950
-
% s
avin
g en
ergy
, (e
lect
rici
ty)
20
27
(8)
16
40
(16)
10
- 20
-
pay
back
(yrs
) 2.
8 3.
8
1.9
5.2
10
1.5
7.8
3 5 1 R
ef [
2] d
eals
pri
mar
ily w
ith th
e ec
onom
ic a
spec
ts, w
hile
ref
[4] w
ith s
yste
m d
escr
iptio
n
7.2
Exa
mpl
e: D
ual E
nerg
y M
anag
emen
t Sys
tem
Sch
wan
dorf
One
cas
e st
udy
is d
escr
ibed
her
e in
gre
ater
det
ail a
s an
exa
mpl
e. I
t has
bee
n ch
osen
be
caus
e it
illu
stra
tes
the
abil
ity
of
BE
MS
to i
nteg
rate
the
ene
rgy
man
agem
ent
requ
irem
ents
of
a nu
mbe
r of
dis
para
te b
uild
ing
type
s di
sper
sed
over
a la
rge
area
.
Schw
ando
rf is
a r
ural
dis
tric
t in
Bav
aria
, Ger
man
y. I
n 19
85 it
was
dec
ided
to s
et u
p th
e D
ual E
nerg
y M
anag
emen
t Sys
tem
Sch
wan
dorf
(D
EM
SS)
proj
ect,
whi
ch w
ould
co
nnec
t 22
publ
ic b
uild
ings
to a
net
wor
k w
ith t
he o
bjec
tive
of
redu
cing
ene
rgy
and
oper
atin
g co
sts.
The
sys
tem
is c
alle
d "D
ual"
bec
ause
ene
rgy
man
agem
ent s
trat
egie
s ar
e ap
plie
d at
dif
fere
nt le
vels
in th
e sy
stem
:
loca
l con
trol
func
tion
s at p
lant
leve
l with
ada
ptiv
e co
ntro
l, co
ntro
l via
term
inal
s at
the
larg
er b
uild
ings
e.g
. ho
spit
als,
co
ntro
l and
ana
lysi
s at
the
cent
ral i
ntel
ligen
t fac
ility
.
Fig
ure
9.1
give
s th
e sc
hem
atic
lay
out
of t
he s
yste
m. I
nfor
mat
ion
is e
xcha
nged
bi-
di
rect
iona
lly to
and
from
the
vari
ous
site
s an
d th
e op
erat
ing
cent
re:
data
and
fau
lt m
essa
ges
from
the
site
s op
erat
ing
com
man
ds,
set
poin
t ad
just
men
t, m
aint
enan
ce i
nstr
ucti
ons,
etc
to
the
site
s.
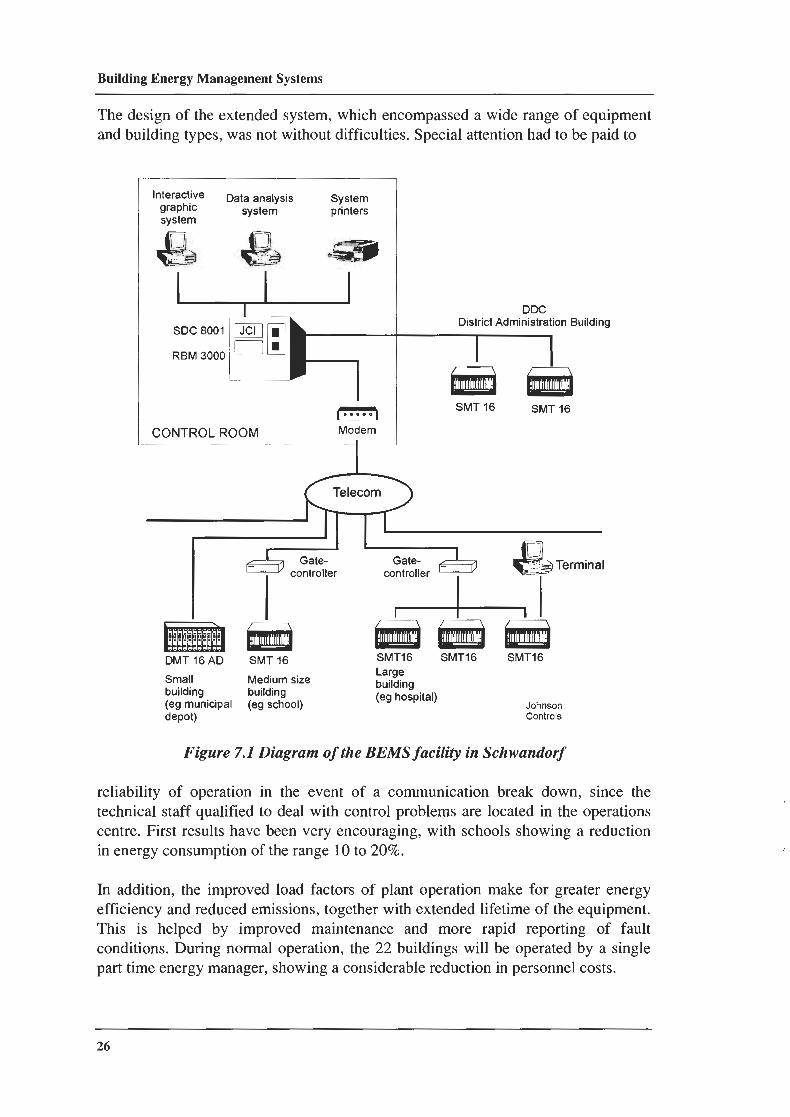
Building E
nergy Managem
ent Systems
The design of the extended system
, which encom
passed a wide range of equipm
ent and building types, w
as not without difficulties. S
pecial attention had to be paid to
Interactive D
ata analysis S
ystem
graphic system
printers
system
RB
M 3000
l.....)
CO
NT
RO
L RO
OM
M
od
em
I
DD
C
District A
dministration B
uilding
I
SM
T 16
SM
T 16
Telecom
27
controller controller
DM
T 16 A
D
SM
T 1
6
-
Large S
mall
Medium
size building
building building
(eg hospital) (eg m
unicipal (eg school)
Johnson depot)
Controls
Figure 7.1 D
iagram of the B
EM
S facility in Schwandorf
reliability of operation in the event of a com
munication break dow
n, since the technical staff qualified to deal w
ith control problems are located in the operations
centre. First results have been very encouraging, w
ith schools showing a reduction
in energy consumption of the range 10 to 20%
.
In addition, the improved load factors of plant operation m
ake for greater energy efficiency and reduced em
issions, together with extended lifetim
e of the equipment.
This
is helped
by im
proved m
aintenance and
more
rapid reporting
of fault
conditions. During norm
al operation, the 22 buildings will be operated by a single
part time energy m
anager, showing a considerable reduction in personnel costs.
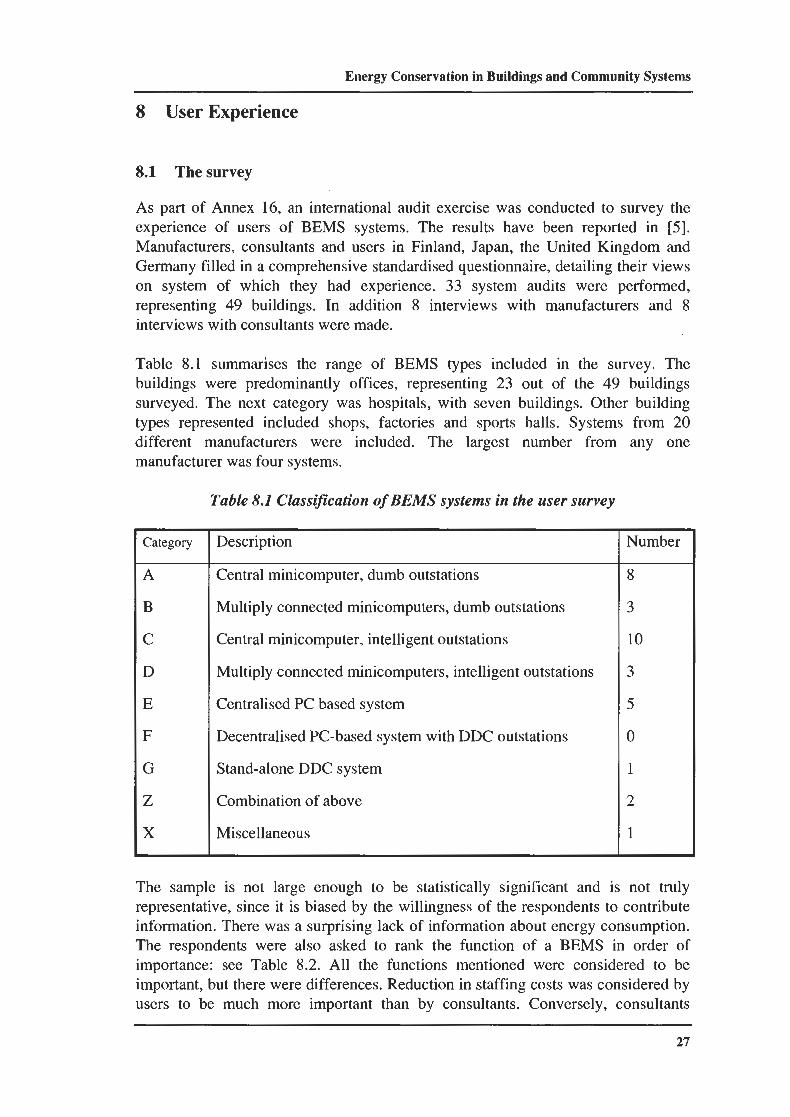
Ene
rgy
Con
serv
atio
n in
Bui
ldin
gs a
nd C
omm
unity
Sys
tem
s
8 U
ser
Exp
erie
nce
8.1
The
surv
ey
As
part
of
Ann
ex 1
6, a
n in
tern
atio
nal a
udit
exer
cise
was
con
duct
ed to
sur
vey
the
expe
rien
ce o
f us
ers
of
BE
MS
syst
ems.
The
res
ults
hav
e be
en r
epor
ted
in
[5].
M
anuf
actu
rers
, con
sulta
nts
and
user
s in
Fin
land
, Ja
pan,
the
Uni
ted
Kin
gdom
and
G
erm
any
fille
d in
a c
ompr
ehen
sive
sta
ndar
dise
d qu
esti
onna
ire,
det
aili
ng th
eir
view
s on
sy
stem
of
whi
ch t
hey
had
expe
rien
ce.
33 s
yste
m a
udits
w
ere
perf
orm
ed,
repr
esen
ting
49
build
ings
. In
ad
ditio
n 8
inte
rvie
ws
with
m
anuf
actu
rers
an
d 8
inte
rvie
ws w
ith c
onsu
ltant
s w
ere
mad
e.
Tab
le 8
.1 s
umm
aris
es t
he r
ange
of
BE
MS
type
s in
clud
ed i
n th
e su
rvey
. T
he
build
ings
wer
e pr
edom
inan
tly o
ffic
es,
repr
esen
ting
23 o
ut o
f th
e 49
bu
ildi
ngs
surv
eyed
. T
he n
ext
cate
gory
was
hos
pita
ls,
with
sev
en b
uild
ings
. O
ther
bui
ldin
g ty
pes
repr
esen
ted
incl
uded
sho
ps,
fact
orie
s an
d sp
orts
hal
ls.
Sys
tem
s fr
om 2
0 di
ffer
ent
man
ufac
ture
rs
wer
e in
clud
ed.
The
la
rges
t nu
mbe
r fr
om
any
one
man
ufac
ture
r was
fou
r sys
tem
s.
Tab
le 8
.1 C
lass
ific
atio
n of
BE
MS
syst
ems
in th
e us
er s
urve
y
Cat
egor
y D
escr
iptio
n
Cen
tral
min
icom
pute
r, d
umb
outs
tatio
ns
Mul
tiply
con
nect
ed m
inic
ompu
ters
, dum
b ou
tsta
tions
Cen
tral
min
icom
pute
r, in
telli
gent
out
stat
ions
Mul
tiply
con
nect
ed m
inic
ompu
ters
, int
elli
gent
out
stat
ions
Cen
tral
ised
PC
bas
ed s
yste
m
Dec
entr
alis
ed P
C-b
ased
sys
tem
with
DD
C o
utst
atio
ns
Sta
nd-a
lone
DD
C s
yste
m
Com
bina
tion
of a
bove
Mis
cella
neou
s
Num
ber
The
sam
ple
is n
ot l
arge
eno
ugh
to b
e st
atis
tical
ly s
igni
fica
nt a
nd i
s no
t tr
uly
repr
esen
tativ
e, s
ince
it i
s bi
ased
by
the
will
ingn
ess
of t
he r
espo
nden
ts t
o co
ntri
bute
in
form
atio
n. T
here
was
a s
urpr
isin
g la
ck o
f in
form
atio
n ab
out e
nerg
y co
nsum
ptio
n.
The
res
pond
ents
wer
e al
so a
sked
to
rank
the
fun
ctio
n of
a
BE
MS
in o
rder
of
impo
rtan
ce:
see
Tab
le 8
.2.
All
the
fun
ctio
ns m
entio
ned
wer
e co
nsid
ered
to
be
impo
rtan
t, bu
t th
ere
wer
e di
ffer
ence
s. R
educ
tion
in s
taff
ing
cost
s w
as c
onsi
dere
d by
us
ers
to b
e m
uch
mor
e im
port
ant
than
by
cons
ulta
nts.
Con
vers
ely,
con
sult
ants
27
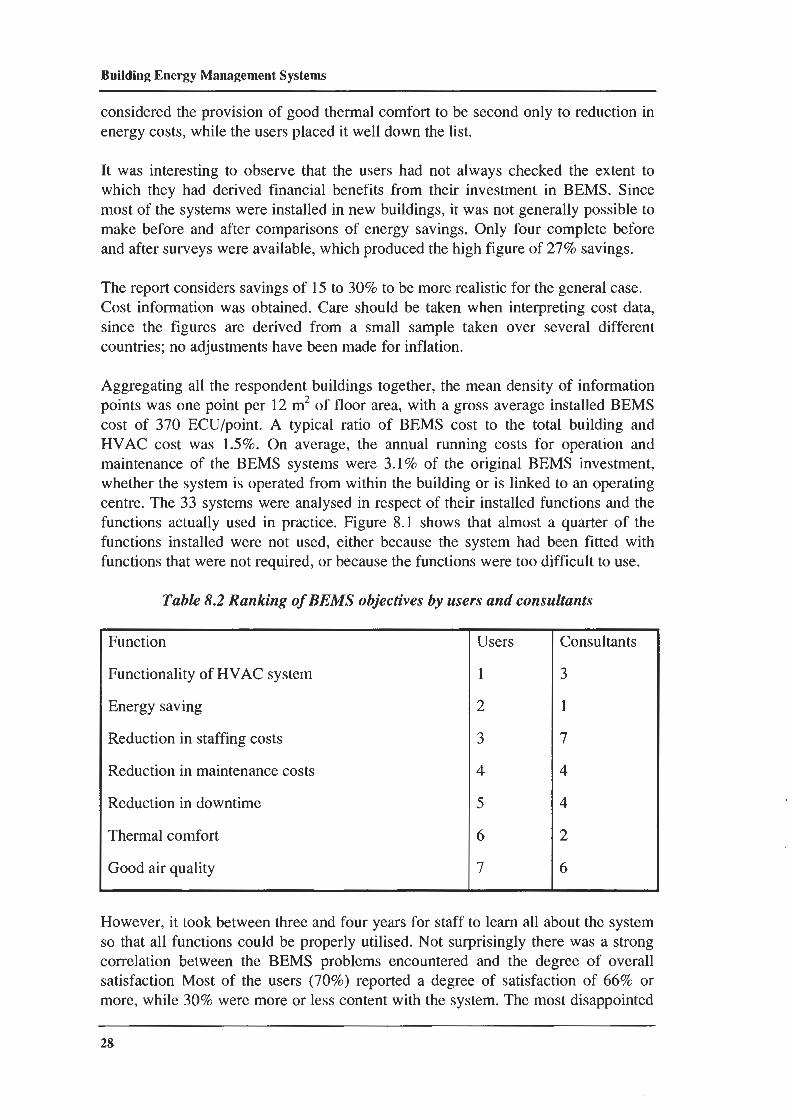
Building E
nergy Managem
ent Systems
considered the provision of good thermal com
fort to be second only to reduction in energy costs, w
hile the users placed it well dow
n the list.
It was interesting to observe that the users had not alw
ays checked the extent to w
hich they had derived financial benefits from their investm
ent in BE
MS. S
ince m
ost of the systems w
ere installed in new buildings, it w
as not generally possible to m
ake before and after comparisons of energy savings. O
nly four complete before
and after surveys were available, w
hich produced the high figure of 27% savings.
The report considers savings of 15 to 30%
to be more realistic for the general case.
Cost inform
ation was obtained. C
are should be taken when interpreting cost data,
since the figures are derived from a sm
all sample taken over several different
countries; no adjustments have been m
ade for inflation.
Aggregating all the respondent buildings together, the m
ean density of information
points was one point per 12 m
2 of floor area, with a gross average installed B
EM
S cost of 370 E
CU
/point. A typical ratio of B
EM
S cost to the total building and H
VA
C cost w
as 1.5%. O
n average, the annual running costs for operation and m
aintenance of the BE
MS system
s were 3.1%
of the original BE
MS investm
ent, w
hether the system is operated from
within the building or is linked to an operating
centre. The 33 system
s were analysed in respect of their installed functions and the
functions actually used in practice. Figure 8.1 shows that alm
ost a quarter of the functions installed w
ere not used, either because the system had been fitted w
ith functions that w
ere not required, or because the functions were too difficult to use.
Table 8.2 R
anking of BE
MS objectives by users and consultants
Function
Functionality of HV
AC
system
Energy saving
Reduction in staffing costs
Reduction in m
aintenance costs
Reduction in dow
ntime
Therm
al comfort
Good air quality
Users
1
2 3 4 5 6 7
Consultants
3 1
7 4 4 2 6
How
ever, it took between three and four years for staff to learn all about the system
so that all functions could be properly utilised. N
ot surprisingly there was a strong
correlation between the B
EM
S problems encountered and the degree of overall
satisfaction Most of the users (70%
) reported a degree of satisfaction of 66% or
more, w
hile 30% w
ere more or less content w
ith the system. T
he most disappointed
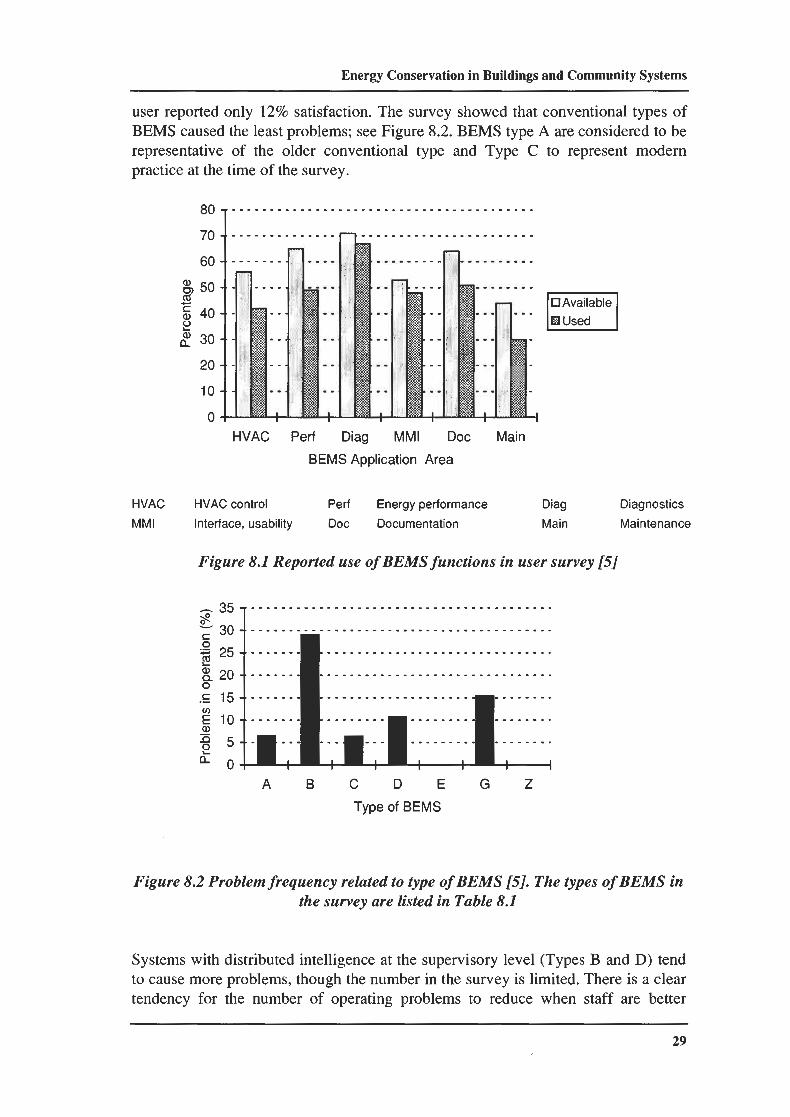
Ene
rgy
Con
serv
atio
n in
Bui
ldin
gs a
nd C
omm
unity
Sys
tem
s
user
rep
orte
d on
ly 1
2% s
atis
fact
ion.
The
sur
vey
show
ed th
at c
onve
ntio
nal t
ypes
of
BE
MS
caus
ed th
e le
ast p
robl
ems;
see
Fig
ure
8.2.
BE
MS
type
A a
re c
onsi
dere
d to
be
repr
esen
tati
ve o
f th
e ol
der
conv
enti
onal
typ
e an
d T
ype
C t
o re
pres
ent
mod
ern
prac
tice
at th
e tim
e of
the
sur
vey.
HV
AC
P
erf
Dia
g M
M1
Doc
M
ain
BE
MS
App
licat
ion
Are
a
HV
AC
H
VA
C c
ontr
ol
Per
f E
nerg
y pe
rfor
man
ce
Dia
g D
iagn
ostic
s M
M1
Inte
rfac
e, u
sabi
lity
Doc
D
ocum
enta
tion
Mai
n M
aint
enan
ce
Fig
ure
8.1
Rep
orte
d us
e of
BE
MS
func
tions
in
user
surv
ey [
5]
A
B
C
D
E
G
Z
Type
of
BE
MS
Fig
ure
8.2
Pro
blem
freq
uenc
y re
late
d to
type
of B
EM
S [5
]. T
he ty
pes
of B
EM
S in
th
e su
rvey
are
list
ed in
Tab
le 8
.1
Syst
ems
with
dis
trib
uted
inte
llige
nce
at th
e su
perv
isor
y le
vel
(Typ
es B
and
D)
tend
to
cau
se m
ore
prob
lem
s, th
ough
the
num
ber
in th
e su
rvey
is li
mite
d. T
here
is a
cle
ar
tend
ency
for
the
num
ber
of
oper
atin
g pr
oble
ms
to r
educ
e w
hen
staf
f ar
e be
tter
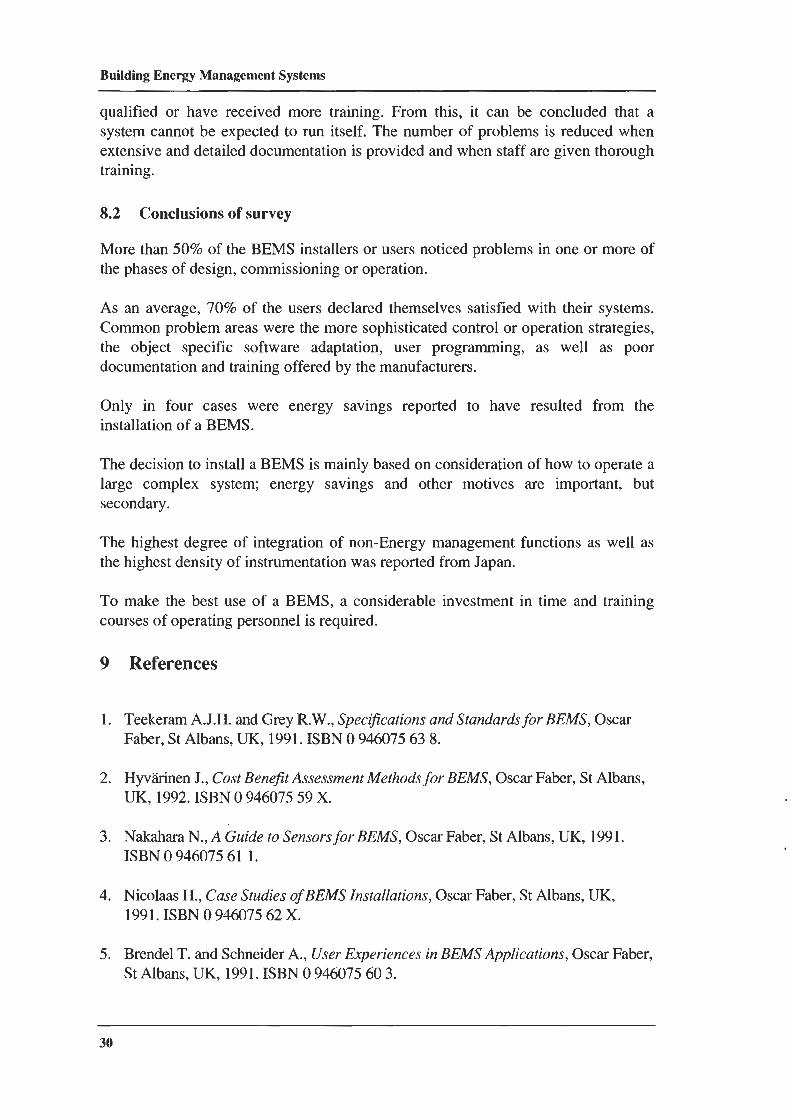
Building E
nergy Managem
ent Systems
qualified or have received more training. From
this, it can be concluded that a system
cannot be expected to run itself. The num
ber of problems is reduced w
hen extensive and detailed docum
entation is provided and when staff are given thorough
training.
8.2 C
onclusions of survey
More than 50%
of the BE
MS installers or users noticed problem
s in one or more of
the phases of design, comm
issioning or operation.
As an average, 70%
of the users declared themselves satisfied w
ith their systems.
Com
mon problem
areas were the m
ore sophisticated control or operation strategies, the
object specific
software
adaptation, user program
ming,
as w
ell as
poor docum
entation and training offered by the manufacturers.
Only in
four cases
were
energy savings reported
to have
resulted from
the
installation of a BE
MS.
The decision to install a B
EM
S is mainly based on consideration of how
to operate a large
complex
system; energy
savings and
other m
otives are
important,
but secondary.
The highest degree of integration of non-E
nergy managem
ent functions as well as
the highest density of instrumentation w
as reported from Japan.
To m
ake the best use of a BE
MS, a considerable investm
ent in time and training
courses of operating personnel is required.
References
Teekeram
A.J.H
. and Grey R
.W., Spec@
cations and Standards for B
EM
S, Oscar
Faber, St Albans, U
K, 1991. ISB
N 0 946075 63 8.
Hyvihinen J., C
ost Benefit A
ssessment M
ethods for BEM
S, Oscar Faber, St A
lbans, U
K, 1992. ISB
N 0 946075 59 X
.
Nakahara N
., A G
uide to Sensors for BEM
S, Oscar Faber, St A
lbans, UK
, 1991. ISB
N 0 946075 6 1 1.
Nicolaas H
., Case S
tudies of BEM
S Installations, Oscar Faber, St A
lbans, UK
, 199 1. ISB
N 0
946075 62 X.
Brendel T
. and Schneider A., U
ser Experiences in B
EMS A
pplications, Oscar Faber,
St A
lbans, UK
, 1991. ISBN
0 946075 60 3.
Ene
rgy
Con
serv
atio
n in
Bui
ldin
gs a
nd C
omm
unit
y Sy
stem
s
6.
Lebr
un J.
and
Wan
g S.
, Eva
luat
ion
and
emul
atio
n of
build
ing
ener
gy m
anag
emen
t sy
stem
s: S
ynth
esis
repo
rt, R
epor
t AN
17-S
RI,
Uni
vers
ity o
f Lie
ge, L
iege
, Bel
gium
, 19
93. I
SBN
2-9
6000
59 1
0.
7.
Mad
jidi M
-, Si
mul
atio
n E
xerc
ise
A2
(Res
iden
tial H
eatin
g Sy
stem
): F
inal
Rep
ort,
Rep
ort A
N17
-SR
2, U
nive
rsity
of
Lic
ge, L
ikge
, Bel
gium
, 199
1. IS
BN
2 9
6000
59 2
9.
8.
Cor
rado
V.,
Maz
za A
., K
arja
lain
en K
., et
al,
Col
lins B
uild
ing
Sim
ulat
ion
Exe
rcis
es
(Air
Con
ditio
ning
Sys
tem
s): F
inal
Rep
ort,
Rep
ort A
N17
-SR
3, U
nive
rsity
of
Lik
ge,
Lik
ge, B
elgi
um, 1
991.
ISB
N 2
960
0059
4 5
.
9.
Kak
i S.,
Dev
elop
men
t of
emul
atio
n m
etho
ds, R
epor
t Res
earc
h N
ote
15 14
, T
echn
ical
Res
earc
h C
entr
e of
Fin
land
, Esp
oo, F
inla
nd, 1
993.
ISB
N 9
5 1 38
444
8 X
.
10. K
lein
S.A
., B
eckm
an W
.A. a
nd D
ufY
ie J.
A.,
"TR
NSY
S - A
tran
sien
t sim
ulat
ion
prog
ram
", A
SHR
AE
Tra
ns, 1
976;
82:
(2)
.
11. P
ark
C.,
Cla
rk D
.R. a
nd K
elly
G.E
., "A
n ov
ervi
ew o
f H
VA
CSI
M'
A d
ynam
ic
build
ing/
HV
AC
/Con
tro1 s
imul
atio
n pr
ogra
m",
l st
Ann
ual B
uild
ing
Ene
rgy
Sim
ulat
ion
Con
fere
nce,
Sea
ttle,
WA
, 198
5. 1
75 S
eattl
e 19
85.
12. G
ERA
LT: M
odul
ares
Sim
ulat
iopl
spro
gram
fir
Hei
z- u
nd R
LT
-Anl
agen
und
G
ebai
ide,
Inte
rnal
repo
rt, I
KE
, Uni
vers
ity o
f St
uttg
art,
19??
13. P
IBN
ET
, A p
rogr
am fo
r dy
nam
ic th
erm
ohyd
raul
ic si
mul
atio
n of
heat
ing
plan
ts,
VlT, E
spoo
, Fin
land
.
14. I
EA A
nnex
10
Fin
al R
epor
t, U
nive
rsity
of
Lic
ge, B
elgi
um, 1
988.
15. T
hues
en H
.G.,
Fabr
ycky
W.J
. and T
hues
en G
.J, E
ngin
eeri
ng E
cono
my,
Pre
ntic
e H
all,
New
Jer
sey,
197
7.
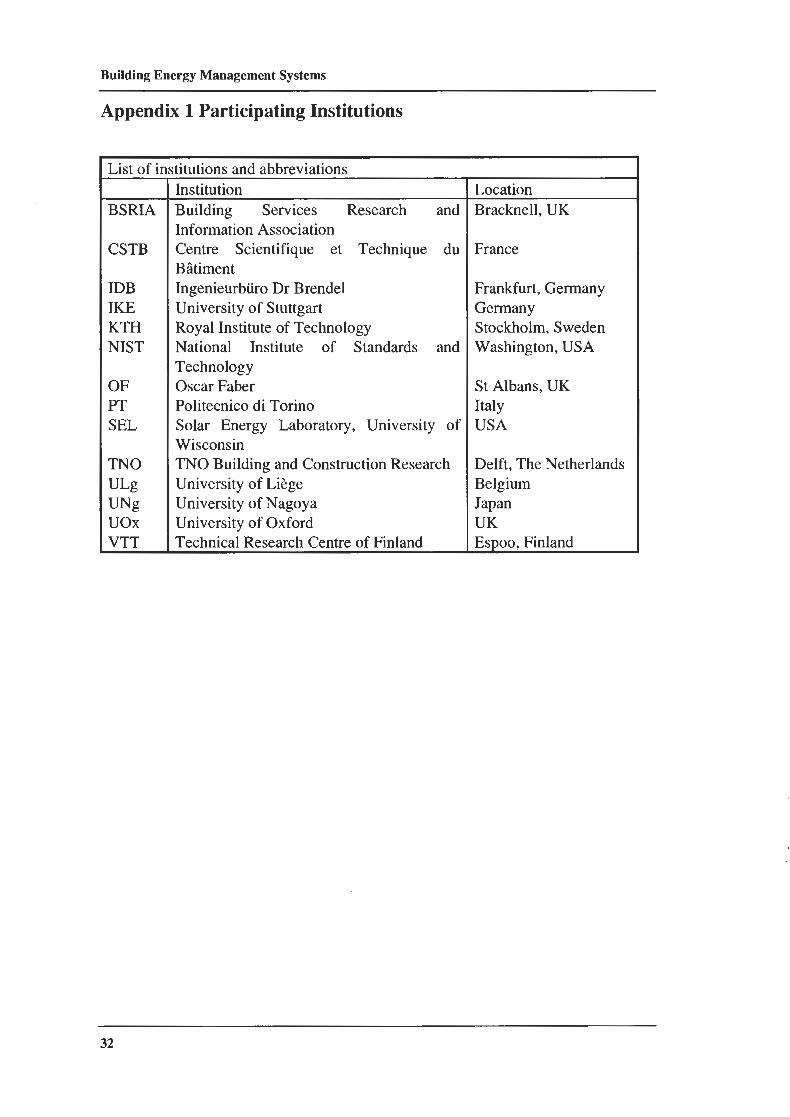
Building E
nergy Managem
ent Systems
Appendix l P
articipating Institutions
Institution B
uilding S
ervices R
esearch and
Information A
ssociation C
entre S
cientifique et
Technique
du B
iitiment
Ingenieurbiiro Dr B
rendel U
niversity of Stuttgart
Royal Institute of T
echnology N
ational Institute
of S
tandards and
Technology
Oscar Faber
Politecnico di T
orino S
olar E
nergy L
aboratory, University
of W
isconsin T
NO
Building and C
onstruction Research
University of L
ikge U
niversity of Nagoya
University of O
xford T
echnical Research C
entre of Finland
BSR
IA
CST
B
IDB
IK
E
KT
H
NIST
OF
PT
S
EL
TN
O
UL
g U
Ng
uo
x
VT
T
List of institutions and abbreviations
Location
Bracknell, U
K
France
Frankfurt, G
ermany
Germ
any S
tockholm, Sw
eden W
ashington, USA
St A
lbans, UK
Italy U
SA
Delft, T
he Netherlands
Belgium
Japan U
K
Espoo, Finland
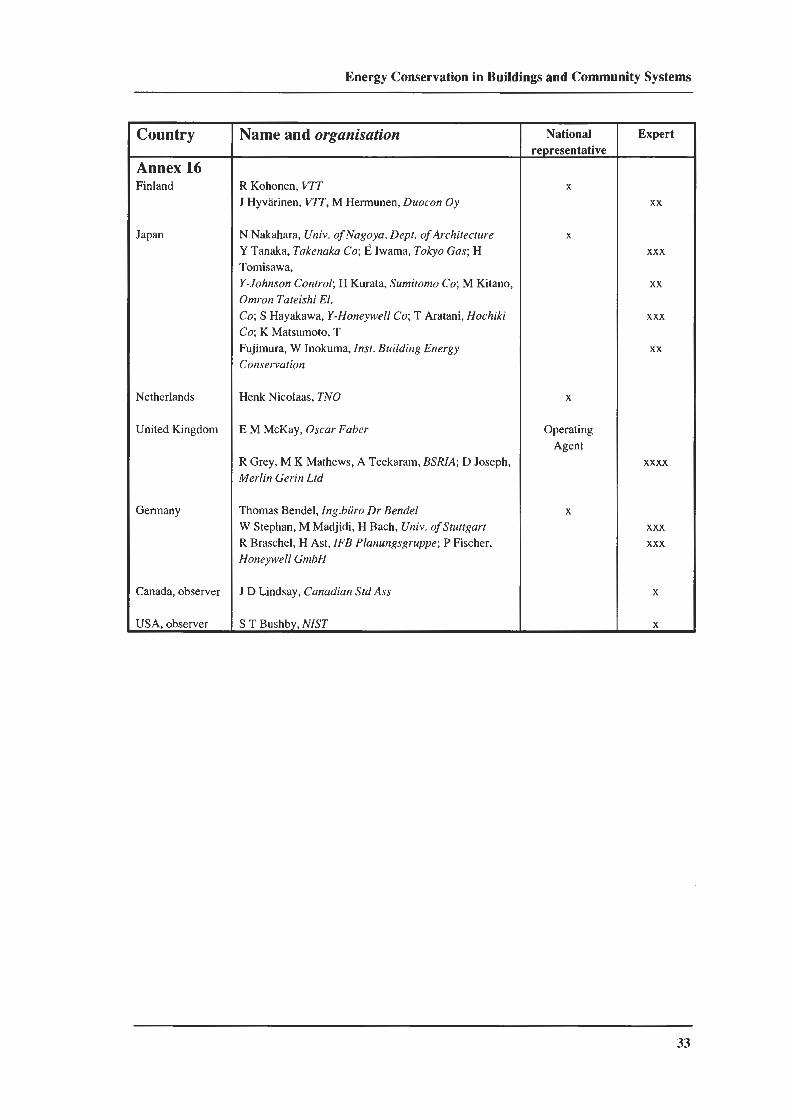
Ene
rgy
Con
serv
atio
n in
Bui
ldin
gs a
nd C
omm
unity
Sys
tem
s
Nam
e an
d or
gani
satio
n
R K
ohon
en, V7T
J H
yv2r
inen
, VT
T, M
Her
mun
en, D
uoco
n O
y
N N
akah
ara,
Uni
v. o
f Nag
oya,
Dep
t. of
Arc
hite
ctur
e Y
Tan
aka,
Tak
enak
a C
O; E
Iwam
a, T
okyo
Gas
; H
Tom
isaw
a,
Y-J
ohns
on C
ontr
ol; H
Kur
ata,
Sum
itom
o C
O; M
Kit
ano,
O
mro
n T
atei
shi E
l. C
O; S
Hay
akaw
a, Y
-Hon
eyw
ell C
O; T
Ara
tani
, Hoc
hiki
C
O; K
Mat
sum
oto,
T
Fuj
imur
a, W
Inok
uma,
Inst
. Bui
ldin
g E
nerg
y C
onse
rvat
ion
Hen
k N
icol
aas,
TNO
E M
McK
ay, O
scar
Fab
er
R G
rey,
M K
Mat
hew
s, A
Tee
kara
rn, B
SRIA
; D J
osep
h,
Mer
lin G
erin
Ltd
Tho
mas
Ben
del,
1ng.
biir
o D
r Ben
del
W S
teph
an, M
Mad
jidi,
H B
ach,
Uni
v. o
f St
uttg
art
R B
rasc
hel,
H A
st, I
FB
Pla
nung
sgru
ppe;
P F
isch
er,
Hon
eyw
ell G
mbH
J D ~
ind
sa
~,
Can
adia
n St
d A
ss
S T
Bus
hby,
NIS
T
Nat
iona
l re
pres
enta
tive
X
Ope
rati
ng
Age
nt
X
Exp
ert
XX
XXX
XX
XXX
XX
XXXX
XXX
XXX
X
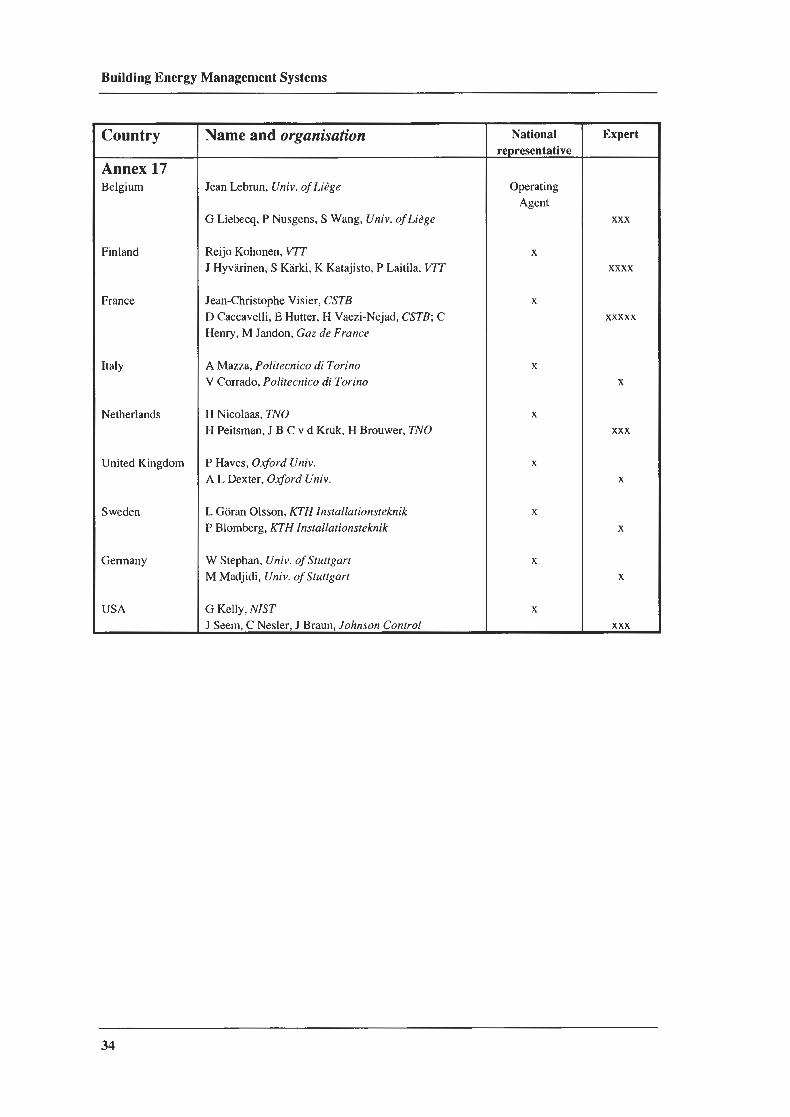
Building E
nergy Managem
ent Systems
Country
Annex 17
Belgium
Finland
France
Italy
Netherlands
United K
ingdom
Sw
eden
Germ
any
USA
Nam
e and organisation
Jean Lebrun, U
niv, of LiZge
G L
iebecq, P Nusgens, S W
ang, Univ. of Libge
Reijo K
ohonen, WT
J H
yvkirinen, S K5rki, K
Katajisto, P L
aitila, VllT
Jean-Christophe V
isier, CST
B
D C
accavelli, E Hutter, H
Vaezi-N
ejad, CST
B; C
H
enry, M Jandon, G
az de France
A M
azza, Politecnico di T
orino V
Conado, P
olitecnico di Torino
H N
icolaas, TN
O
H P
eitsman, J B
C v d K
ruk, H B
rouwer, TN
O
P H
aves, Oxford U
niv. A
L D
exter, Oxford U
niv.
L G
oran Olsson, K
TH Installationsteknik
P Blom
berg, KTH
Installationsteknik
W Stephan, U
niv. of Stuttgart M
Madjidi, U
niv. of Stuttgart
G K
elly, NIST
J Seem, C
Nesler, J B
raun, Johnson Control
National
representative
Operating A
gent
Expert
XXX
XXXX
XX
XX
X
X
XXX
X
X
X
XXX

Ene
rgy
Con
serv
atio
n in
Bui
ldin
gs a
nd C
omm
unity
Sys
tem
s
Building E
nergy Managem
ent Systems
Appendix 2 P
ublication Summ
ary
Annex 16 and 17 Sum
mary R
eport
MA
nsson L.-G
., Styra och reglera varme, kyla och ventilation M
etoder och exempel,
Sw
edish Council for B
uilding Research, Stockholm
, Sw
eden, ISBN
: 91-540-57 19- 1, 1995 (in Sw
edish).
Annex 16. B
uilding Energy M
anagement System
s: A U
ser Guide
Five reports w
ere published under Annex 16, and are sum
marised briefly below
. T
hey can be purchased from:
EC
BC
S Bookshop, c10
AIV
C, U
nit 3a, Sovereign Court, U
niversity of Warw
ick Science P
ark, Sir William
Lyons R
d, Coventry, C
V4 7E
Z, U
nited Kingdom
, T
el: +44 (0)1203 692050, F
ax: +44 (0)1203 416306, E
mail: bookshop@
ecbcs.org
Specifications and Standards [l]
Specifications and Standards for B
EM
S by A.J.H
Teekeram
, and R.W
. Grey.
Part I: Specifications. Part I provides guidance w
hich will be useful to users and
consultants in writing a B
EM
S specifications. Practices differ among countries and
the report summ
arises specifications documents in use in the five participating
countries: UK
, Finland, Japan, Germ
any and the Netherlands. T
he report goes on to cover the im
portant early stages of a project before specifying starts. Guidance in
compiling a B
EM
S specification is given, with exam
ple clauses. The report also
gives the full contents lists of specification documents in use in the participating
countries.
Part 11. Standards for B
EM
S. The second part of the report starts w
ith a review of
the current (1991) status of standardisation of BE
MS in each of the participating
countries. The state of developm
ent of the following standards is sum
marised: FN
D,
PRO
FIBU
S, BA
Cnet, B
AT
IBU
S ; fuller descriptions are given in Appendices. T
he next chapter lists S
tandards, Guidelines and C
odes that may be applicable to a
BE
MS project. T
he report concludes with a list of useful addresses and the IE
A
Glossary of B
EM
S terms.
Cost B
enefit Assessm
ent Methods [2]
Cost B
enefit Assessm
ent Methods for B
EM
S by J. Hyvarinen.
The benefits of a B
EM
S are realisable in different forms e.g. saved energy, reduced
manpow
er, more favourable tariffs. T
he aim of cost benefit analysis is to express all
costs and benefits in comm
on financial terms, to allow
the best investment decision
to be made. It is concluded that no com
mon m
odel could be developed from
practices in the participating countries. Instead, the report discusses the principles of analysis and presents the m
ost comm
only used models. T
he report emphasises that
Ene
rgy
Con
serv
atio
n in
Bui
ldin
gs a
nd C
omm
unity
Sys
tem
s
the
relia
bilit
y of
the
res
ults
dep
ends
mor
e on
the
qual
ity
of i
nfor
mat
ion
used
in
the
asse
ssm
ent t
han
on th
e m
etho
d ch
osen
. The
rep
ort
sets
out
the
econ
omic
pi-i
ncip
les
invo
lved
and
des
crib
es th
e si
mpl
e pa
ybac
k m
etho
d, N
et P
rese
nt V
alue
met
hods
and
th
e V
ecto
r D
iagr
am m
etho
d. T
he s
impl
e pa
ybac
k pe
riod
is th
e m
ost c
omm
only
use
d m
etho
d, b
ut i
s m
ost
suit
able
for
sche
mes
with
a r
apid
ret
urn
on i
nves
tmen
t. W
here
th
e pe
riod
is
over
3 y
ears
, mor
e de
tail
ed m
etho
ds s
houl
d be
use
d. T
he r
epor
t gi
ves
guid
ance
on
list
ing
all
rele
vant
cos
ts a
nd b
enef
its t
hrou
ghou
t th
e li
feti
me
of t
he
proj
ect a
nd g
ives
det
aile
d ca
se s
tudi
es fr
om th
e pa
rtic
ipat
ing
coun
trie
s.
Sen
sors
[3]
A G
uide
to S
enso
rs fo
r BE
MS
by N
. Nak
ahar
a.
The
rep
ort g
ives
a c
ompr
ehen
sive
list
ing
of a
ll ty
pes
of s
enso
r th
at f
ind
appl
icat
ion
in b
uild
ings
; th
e ap
plic
atio
n is
not
res
tric
ted
to H
VA
C, b
ut e
xten
ds to
all
fie
lds
of
build
ing
serv
ices
, inc
ludi
ng fi
re a
nd s
ecur
ity.
Thr
ough
out t
he r
epor
t, th
e im
port
ance
of
the
con
trol
sof
twar
e in
inf
luen
cing
sen
sor
sele
ctio
n is
str
esse
d; a
sen
sor
shou
ld
not b
e se
lect
ed in
depe
nden
tly o
f th
e co
ntro
l sys
tem
it s
erve
s. T
he m
ain
body
of
the
repo
rt c
onsi
sts
of f
ive
chap
ters
dea
ling
with
dif
fere
nt c
ateg
orie
s if
build
ing
serv
ices
. E
ach
give
s gu
idan
ce to
the
sel
ectio
n of
con
trol
sys
tem
s an
d se
nsor
s. E
mph
asis
ing
the
proc
edur
es t
o be
fol
low
ed.
A f
inal
cha
pter
det
ails
nin
e ca
se s
tudi
es w
hich
il
lust
rate
sens
or s
elec
tion
for
a va
riet
y of
situ
atio
ns.
A s
epar
atel
y is
sued
App
endi
x gi
ves
deta
ils
of t
he i
nter
nati
onal
sur
vey
of s
enso
r ap
plic
atio
ns
carr
ied
out
as
part
of
th
e st
udy,
to
geth
er
with
re
fere
nces
an
d bi
blio
grap
hies
on
sens
or a
ppli
cati
on.
Cas
e S
tudi
es [4
]
Cas
e S
tudi
es o
f B
EM
S In
stal
lati
ons b
y H
. Nic
olaa
s.
The
rep
ort d
escr
ibes
10
case
stu
dies
dra
wn
from
the
UK
, Fin
land
, Jap
an, G
erm
any
and
the
Net
herl
ands
. A
co
mm
on r
epor
ting
for
mat
was
us
ed
and
the
syst
ems
desc
ribe
d co
ver
a w
ide
rang
e of
sch
emes
, inc
ludi
ng r
elat
ivel
y si
mpl
e he
atin
g on
ly
scho
ol b
uild
ings
, a
wid
ely
disp
erse
d gr
oup
of
loca
l au
thor
ity
buil
ding
s,
and
adva
nced
sin
gle
offi
ce b
uild
ings
. T
he s
chem
es w
ere
gene
rally
suc
cess
ful,
thou
gh
the
need
for
tra
inin
g is
em
phas
ised
. M
ost
of t
he s
chem
es d
escr
ibed
dat
e fr
om t
he
mid
198
0s.
Use
r Exp
erie
nce [5]
Use
r Exp
erie
nces
in B
EM
S A
pplic
atio
ns b
y T
h. B
rend
el a
nd A
. Sch
neid
er.
The
rep
ort d
escr
ibes
the
met
hods
and
res
ults
of
an in
tern
atio
nal a
udit
prog
ram
me
of
build
ings
equ
ippe
d w
ith B
EM
S. 3
3 si
te a
udits
wer
e pe
rfor
med
in
1990
, rep
rese
ntin
g 49
bui
ldin
gs
in
four
co
untr
ies.
In
ad
diti
on,
inte
rvie
ws
wer
e ca
rrie
d ou
t w
ith
Building E
nergy Managem
ent Systems
manufacturers and consultants. T
he findings are discussed in some detail, w
ith the follow
ing conclusions:
The m
ain reasons quoted for installing BE
MS is the need to operate large com
plex system
s; energy saving and other motives w
ere important, but secondary. Payback
periods of over 10 years were accepted. A
s an average, 70% of the users declared
themselves satisfied w
ith their systems. M
ore than 50% of the installations had
problems at som
e stage. Com
mon problem
s were the m
ore sophisticated control and optim
isation strategies, software provision, poor docum
entation and training. The
need for experience and training of operating personnel is stressed.
Annex 17 B
EM
S Evaluation and E
mulation T
echniques
Four reports w
ere published under Annex 17, and are sum
marised briefly below
. T
hey can be purchased from:
EC
BC
S Bookshop, c10 A
WC
, Unit 3a, Sovereign C
ourt, University of W
arwick
Science Park, Sir W
illiam Lyons R
d, Coventry, C
V4 7E
Z, U
nited Kingdom
, T
el: +44 (0)1203 692050, F
ax: +44 (0)1203 416306, E
mail: bookshop@
ecbcs.org
Synthesis report [6]
Synthesis report. Evaluation and E
mulation of B
EM
S by J. Lebrun and S
. Wang
This docum
ent gives a summ
ary of the work described below
from references
[7,8,9]. It gives a complete set of references to the interim
reports issued under A
nnex 17. The report briefly describes the sim
ulation methods and concludes that
they are a powerful m
ethod of development of B
EM
S control strategies. There is
little discussion of the strategies themselves.
The report then sum
marises the six em
ulators constructed under Annex 17. A
n em
ulator is a computer sim
ulation of a building and its HV
AC
system, together w
ith an interface w
hich allows it to be connected to an actual B
EM
S system and behave
as if it were a real building. T
he different emulators produced com
parable results and it is concluded that an em
ulator provides a very attractive testing approach for a real B
EM
S under simulated 'real'
working conditions. E
mulators can be used for
evaluation of control strategies, controller pre-tuning
and for
the training
of operators.
Residential H
eating Systems [7]
Simulation E
xercises A2 (R
esidential Heating System
) by M. M
adjidi.
Com
puter simulation of a building, system
s and BE
MS is show
n to be a powerful
analysis and development tool. O
ptimal S
tart (OS) is the m
ost important function
for BE
MS in the control of hydronic heating system
s. This report uses com
puter sim
ulation to investigate OS algorithm
s in a residential and an office building equipped w
ith hydronic heating systems. It is show
n that the size of boiler has no
Ene
rgy
Con
serv
atio
n in
Bui
ldin
gs a
nd C
omm
unity
Sys
tem
s
effe
ct a
nd t
he s
ize
of r
adia
tor
only
a s
mal
l ef
fect
on
the
ener
gy c
onsu
mpt
ion
of a
hy
dron
ic h
eatin
g sy
stem
con
trol
led
by a
n op
timal
sta
rt c
ontr
olle
r.
Dif
fere
nt p
ract
ical
OS
algo
rith
ms
wer
e ev
alua
ted:
the
recu
rsiv
e le
ast s
quar
es m
etho
d an
d tw
o ve
rsio
ns o
f th
e gr
adie
nt m
etho
d. A
ll sh
owed
inac
cura
cies
, due
to th
e li
near
ap
prox
imat
ion
of t
he p
rehe
at t
ime.
The
gra
dien
t m
etho
d fa
ils
to c
ompe
nsat
e fu
lly
for
the
ther
mal
ine
rtia
of
the
build
ing.
A p
ossi
ble
impr
ovem
ent
is t
o ad
d a
sens
or
whi
ch m
easu
res
the
stru
ctur
e te
mpe
ratu
re; t
his
shou
ld im
prov
e pr
edic
tion
in p
erio
ds
of c
hang
eabl
e w
eath
er.
Air
con
diti
onin
g sy
stem
s [8
]
Fin
al re
port
: Col
lins
bui
ldin
g si
mul
atio
n ex
erci
ses
(Air
con
diti
onin
g sy
stem
s) b
y V
. C
orra
do, A
. M
azza
, S.
Kar
jala
inen
, K
. K
ataj
isto
, P.
Lai
tila
, W.
Ste
phen
and
L.
G.
Ols
son.
Thi
s re
port
con
tain
s th
e th
erm
al s
imul
atio
n of
a c
omm
erci
al b
uild
ing
fitt
ed w
ith a
V
AV
air
con
ditio
ning
sys
tem
. T
he f
irst
par
t of
the
rep
ort
com
pare
s th
e si
mul
atio
n re
sult
s of
the
com
mon
exe
rcis
e ca
rrie
d ou
t by
the
par
tici
pant
s. T
his
dem
onst
rate
d th
at e
xist
ing
mat
hem
atic
al m
odel
s ar
e qu
ite
capa
ble
of
sim
ulat
ing
buil
ding
and
co
ntro
l sy
stem
s. I
n or
der
to g
et g
ood
agre
emen
t be
twee
n di
ffer
ent
user
s, i
t is
ne
cess
ary
to
use
the
sam
e in
put/o
utpu
t pr
oced
ures
an
d th
e co
ntro
l sy
stem
pa
ram
eter
s m
ust
be c
aref
ully
def
ined
. A
sta
ndar
d pr
oced
ure
is a
lso
requ
ired
to
com
bine
ene
rgy
and
com
fort
con
side
rati
ons w
hen
eval
uati
ng c
ontr
ol s
trat
egie
s.
The
sec
ond
part
of
the
repo
rt p
rese
nts
part
icul
ar s
tudi
es o
n co
ntro
l st
rate
gies
. The
S
tati
c P
ress
ure
Min
imis
atio
n st
rate
gy c
ontr
ols
fan
spee
d to
pro
duce
the
min
imum
pr
essu
re n
eces
sary
to
mee
t th
e re
quir
emen
ts o
f th
e V
AV
box
es.
Thi
s ca
n pr
oduc
e si
gnif
ican
t red
uctio
ns i
n fa
n en
ergy
con
sum
ptio
n. A
noth
er s
tudy
inv
esti
gate
d th
e ef
fect
of
13 v
aria
tions
on
the
cont
rol
stra
tegy
, pro
duci
ng e
nerg
y sa
ving
s of
up
to
30%
. The
mai
n po
int
is t
hat
the
met
hod
of i
nves
tiga
tion
has
bee
n pr
oved
. It
is
emph
asis
ed th
at t
he a
chie
ved
savi
ngs
cann
ot b
e ge
nera
lised
to
othe
r bu
ildi
ngs
and
are
only
val
id f
or th
e ca
se in
vest
igat
ed.
Em
ulat
ion
met
hods
[g]
Dev
elop
men
t of
Em
ulat
ion
Met
hods
by
S K
arki
.
An
emul
ator
is
an a
rtif
icia
l sy
stem
whi
ch a
cts
exte
rnal
ly l
ike
a re
al s
yste
m.
An
emul
ator
for
a B
EM
S co
nsis
ts o
f a
sim
ulat
ed b
uild
ing
and
its H
VA
C s
yste
m
conn
ecte
d vi
a an i
nter
face
to
a re
al B
EM
S. T
he s
imul
ated
bui
ldin
g re
spon
ds t
o th
e co
ntro
l ou
tput
s of
the
BE
MS
and
the
com
pute
r m
odel
fee
ds b
ack
the
appr
opri
ate
sens
or s
igna
ls.
Em
ulat
ors
are
suita
ble
for
use
in t
estin
g, p
rodu
ct d
evel
opm
ent,
trai
ning
, tun
ing
cont
rol e
quip
men
t and
imita
ting
faul
t con
diti
ons.
The
rep
ort
pres
ents
a c
olla
bora
tive
rese
arch
eff
ort
unde
r A
nnex
17.
Six
em
ulat
ors
wer
e co
nstr
ucte
d in
dif
fere
nt c
ount
ries
, usi
ng d
iffe
rent
har
dwar
e an
d so
ftw
are.
The
ir
perf
orm
ance
was
com
pare
d in
a s
erie
s of
tes
ts. I
n ge
nera
l agr
eem
ent w
as g
ood,
but
Building E
nergy Managem
ent Systems
there is a need to ensure systematic initialisation of the system
s at the start of a test run and for w
ell defined calibration procedures.
Overall, the experience of
performing the
exercise showed that
the em
ulation m
ethod is
a very convenient m
ethod for BE
MS
performance evaluation. T
he agreem
ent of the test results shows the em
ulation method is also a reliable testing
method for B
EM
S.