
COMPARISON OF HUMAN THERMAL MODELS, MEASURED RESULTS …
8
COMPARISON OF HUMAN THERMAL MODELS, MEASURED RESULTS AND QUESTIONNAIRES Airaksinen Miimu 1 , Holopainen Riikka 1 , Tuomaala Pekka 1 , Piippo Jouko 1 , Piira Kalevi 1 , Saari Mikko 2 , Antson Arto 2 , Ruotsalainen Risto 2 , Haapakangas Annu 3 , Ruohomäki Virpi 3 , Lahtinen Marjaana 3 1 VTT Technical Research Centre of Finland, Finland 2 VTT Expert Services Ltd, Finland 3 Finnish Institute of Occupational Health, Finland ABSTRACT Increasing concern about building sector energy consumption and the simultaneous need for an acceptable thermal environment makes it necessary to estimate in advance what effect different thermal factors will have on occupants. So far most human thermal comfort models are based on estimates assuming steady-state conditions. However, this often leads to underestimations of local cold or hot surfaces. These kinds of models does not take into account variable conditions. In this paper measurement results from a real office building were used as input values for two methods to comparing predict thermal comfort and user questionnaires. This paper shows the differences between these two methods and highlights also the importance of using a right method in estimating thermal comfort in order to prevent over dimensioning of heating or cooling devices which might lead to unnecessary energy consumption. INTRODUCTION In the northern part of the European Union, 41% of the total final energy use comes from buildings, with 30% being used in residential buildings (Itard and Meijer 2009). In most countries, energy production is extensively based on fossil fuels, so the building sector has a clear connection to environmental issues. Environmental and economic reasons increase the pressure to design, construct and maintain more energy-efficient buildings in future, such as very low-energy houses, passive houses and nearly zero- energy houses. Improving energy efficiency will bring unavoidable changes in structural and building service system design practices. In energy-efficient buildings, the indoor surface temperatures of better insulating envelope components are higher during heating periods. At the same time surface temperatures of (at least traditional) heating devices are lower due to a reduced heating demand. Dimensioning criteria of building structures and heating or cooling systems for future very low- energy buildings need to be reconsidered to ensure the proper functionality of building service systems, and increase the applicability of renewable low- exergy energy sources (e.g. low temperature heating and high temperature cooling). This new design and dimensioning criteria must also ensure the overall thermal comfort of the building user. Thermal comfort has been and is likely to be the dominant cause of indoor environment complaints even in the future, therefore it is important to understand the true nature of human thermal sensation and comfort. In addition creating good thermal comfort conditions indoors automatically leads to energy use in most climate zones. Thus, the importance of understanding thermal comfort increases the possibilities to create energy efficient and comfortable buildings. Two widely used standards - ANSI/ASHRAE Standard 55-1992 (Thermal Environmental Conditions for Human Occupancy) and ISO 7730 (Moderate thermal environments - Determination of the PMV and PPD indices and specification of the conditions for thermal comfort) – use the thermal comfort method originally presented by Fanger in 1972 for evaluation of moderate thermal environment. When using this method, human's thermal sensation is related to the thermal balance of the body as a whole. This balance is influenced by occupant's physical activity and clothing, as well as the environmental parameters: air temperature, mean radiant temperature, air velocity, and air humidity (ISO 7730). The method is derived for steady-state conditions and - due to treating a human body as whole - is does not allow estimations in any spatially non-uniform conditions. In everyday living and working, people are more often exposed to spatially non-uniform and transient temperatures than to thermal environments that are uniform and stabile. We experience transient and non-uniform temperature conditions when moving between spaces - e.g., from indoors to outdoors, from shun to shade, and when occupying spaces with widely varying temperatures. (Zhang 2003) Currently there are many dynamic models estimating human thermal comfort. Smith’s model (1991) is based on a rather realistic representation of the human body. Because of 3-D calculation, it is also applicable to situations with large temperature gradients or highly non-uniformal thermal conditions. The limitation of the model is that the fat and skin layers are modelled as one layer. This affects the heat convection to the skin surface carried Proceedings of BS2013: 13th Conference of International Building Performance Simulation Association, Chambéry, France, August 26-28 - 1657 -
Transcript of COMPARISON OF HUMAN THERMAL MODELS, MEASURED RESULTS …
COMPARISON OF HUMAN THERMAL MODELS, MEASURED RESULTS AND QUESTIONNAIRES
Airaksinen Miimu1, Holopainen Riikka1, Tuomaala Pekka1, Piippo Jouko1, Piira Kalevi1,
Saari Mikko2, Antson Arto2, Ruotsalainen Risto2, Haapakangas Annu3, Ruohomäki Virpi3, Lahtinen Marjaana3
1 VTT Technical Research Centre of Finland, Finland 2 VTT Expert Services Ltd, Finland
3 Finnish Institute of Occupational Health, Finland
ABSTRACT Increasing concern about building sector energy consumption and the simultaneous need for an acceptable thermal environment makes it necessary to estimate in advance what effect different thermal factors will have on occupants. So far most human thermal comfort models are based on estimates assuming steady-state conditions. However, this often leads to underestimations of local cold or hot surfaces. These kinds of models does not take into account variable conditions. In this paper measurement results from a real office building were used as input values for two methods to comparing predict thermal comfort and user questionnaires. This paper shows the differences between these two methods and highlights also the importance of using a right method in estimating thermal comfort in order to prevent over dimensioning of heating or cooling devices which might lead to unnecessary energy consumption.
INTRODUCTION In the northern part of the European Union, 41% of the total final energy use comes from buildings, with 30% being used in residential buildings (Itard and Meijer 2009). In most countries, energy production is extensively based on fossil fuels, so the building sector has a clear connection to environmental issues. Environmental and economic reasons increase the pressure to design, construct and maintain more energy-efficient buildings in future, such as very low-energy houses, passive houses and nearly zero-energy houses. Improving energy efficiency will bring unavoidable changes in structural and building service system design practices. In energy-efficient buildings, the indoor surface temperatures of better insulating envelope components are higher during heating periods. At the same time surface temperatures of (at least traditional) heating devices are lower due to a reduced heating demand. Dimensioning criteria of building structures and heating or cooling systems for future very low-energy buildings need to be reconsidered to ensure the proper functionality of building service systems, and increase the applicability of renewable low-exergy energy sources (e.g. low temperature heating and high temperature cooling). This new design and
dimensioning criteria must also ensure the overall thermal comfort of the building user. Thermal comfort has been and is likely to be the dominant cause of indoor environment complaints even in the future, therefore it is important to understand the true nature of human thermal sensation and comfort. In addition creating good thermal comfort conditions indoors automatically leads to energy use in most climate zones. Thus, the importance of understanding thermal comfort increases the possibilities to create energy efficient and comfortable buildings. Two widely used standards - ANSI/ASHRAE Standard 55-1992 (Thermal Environmental Conditions for Human Occupancy) and ISO 7730 (Moderate thermal environments - Determination of the PMV and PPD indices and specification of the conditions for thermal comfort) – use the thermal comfort method originally presented by Fanger in 1972 for evaluation of moderate thermal environment. When using this method, human's thermal sensation is related to the thermal balance of the body as a whole. This balance is influenced by occupant's physical activity and clothing, as well as the environmental parameters: air temperature, mean radiant temperature, air velocity, and air humidity (ISO 7730). The method is derived for steady-state conditions and - due to treating a human body as whole - is does not allow estimations in any spatially non-uniform conditions. In everyday living and working, people are more often exposed to spatially non-uniform and transient temperatures than to thermal environments that are uniform and stabile. We experience transient and non-uniform temperature conditions when moving between spaces - e.g., from indoors to outdoors, from shun to shade, and when occupying spaces with widely varying temperatures. (Zhang 2003) Currently there are many dynamic models estimating human thermal comfort. Smith’s model (1991) is based on a rather realistic representation of the human body. Because of 3-D calculation, it is also applicable to situations with large temperature gradients or highly non-uniformal thermal conditions. The limitation of the model is that the fat and skin layers are modelled as one layer. This affects the heat convection to the skin surface carried
Proceedings of BS2013: 13th Conference of International Building Performance Simulation Association, Chambéry, France, August 26-28
- 1657 -
by blood flow and the entire-body thermal response. As result simulation results obtained during cold or exercise conditions are not accurate (Wissler 1988). Other limitations are neglecting the blood perfusion incurred in the capillary beds and assuming no moisture accumulation on the skin surface. Fu (1995) developed the first model for the clothed human on the basis of Smith’s model. The finite-element method used by Fu enables a fine nodal spacing and employment of detailed thermoregulatory mechanisms. The model introduces new solutions for blood perfusion, fibre absorption of clothing, fabric interstice effect, radiation in the clothing, and moisture evaporation and accumulation in the skin and clothing. The Fiala model (Fiala 2001) was developed by means of regression analysis using measured responses (whole-body metabolism, evaporative weight/heat loss, body core temperature) obtained from air exposures to cold stress, cold, moderate, warm and hot stress conditions, and exercise intensities between 0.8–10 MET. The model has been verified and validated using independent experiments, and the results revealed good agreement with measured data for regulatory responses, mean and local skin temperatures, and internal temperatures for the whole spectrum of boundary conditions considered. Marken Lichtenbelt et al. (2004) have used Fiala’s model to predict the average human physiological responses. The results showed discrepancies in measured responses of individuals exposed to comfortable and mild cold environmental conditions. The effect was largest on the exposed body elements, because of the largest variation in temperature on these parts. The source or error was the energy metabolism calculation. Using the actual, measured metabolism during the test improved the accuracy of the calculation on a group level but the deviations on an individual level still remained large. Fiala’s active system is based on a regression model. Marken Lichtenbelt et al. suggest using a model with a more physiological background: integration of physiological based control-mechanisms in the model. In spite of the high number of different developed human thermal models, there are few approaches where a human thermal model has been integrated with a CFD tool and presumably no previous approaches, where the model has been integrated with a building simulation environment. Therefore the major new scientific knowledge of Human Thermal Model HTM (Holopainen 2012) is combining the human thermal modelling with a thermal sensation and comfort model inside of a building simulation program. This approach enables i) calculating more realistically the interaction and nonuniform transient heat transfer between the skin surface and the surrounding air and building
structures and ii) taking into account the effect of human thermoregulation and individual human parameters on thermal sensation and comfort. This paper focuses on calculating thermal comfort by using two different methods: the Fanger’s method and HTM. A real measurement data is used as input value. In addition, the calculated results are compared to results from questionnaires made for users.
METHODS In this study thermal comfort in a real office room was studied. Office room air and surface temperatures were measured and used as input values to two different thermal comfort models. The used thermal comfort models were the well know and widely used Fangers (1972) model and human thermal model (HTM) developed by Holopainen (2012). The both thermal comfort model results were compared to the questionnaires to users in the office.
Measured office room The studied building is a typical Finnish office building from 1960-70. The floor area of the studied office room is 11 m2 and it is located along the eastern façade. The exterior wall is 2.75 m wide and the room height is 2.8 m. The surface area of the windows is rather high corresponding to 55% of the exterior wall surface. The window surface is 39% from the floor surface. The working space is located close to window. The indoor environment conditions were measured continuously during March 15th – June 3rd. During this period all surface temperatures, air temperature and relative humidity were measured continuously. In addition the exhaust air flows and supply air duct pressure from nozzle were measured. Relative humidity, air and surface temperature were measured with “Tiny Tag” devices, whose temperature range is between -40°C…+125°C and the accuracy inside of the temperature range between 0°C…50°C is 0.5°C. The accuracy in relative humidity measurement is at 25°C ± 3% RH. Pressure transmitters used were Micatrone devices (MG-1000-D 0-200 Pa SN 18421-021) with measurement range of 0…200 Pa. All the measurements devices were calibrated and accuracy was controlled before measurements. The measured values were used as input values to the simulations of human thermal comfort.
Model for thermal comfort Human thermal models represent the human body from a thermokinetic point of view and they have been used for modeling the thermoregulation system. Over the last hundred years, numerous human thermal models have been developed. The utilization rate of these models has been low due to the complexities of the models and the difficult determination of calculation variables. In this paper a novel approach is presented, where a human thermal
Proceedings of BS2013: 13th Conference of International Building Performance Simulation Association, Chambéry, France, August 26-28
- 1658 -
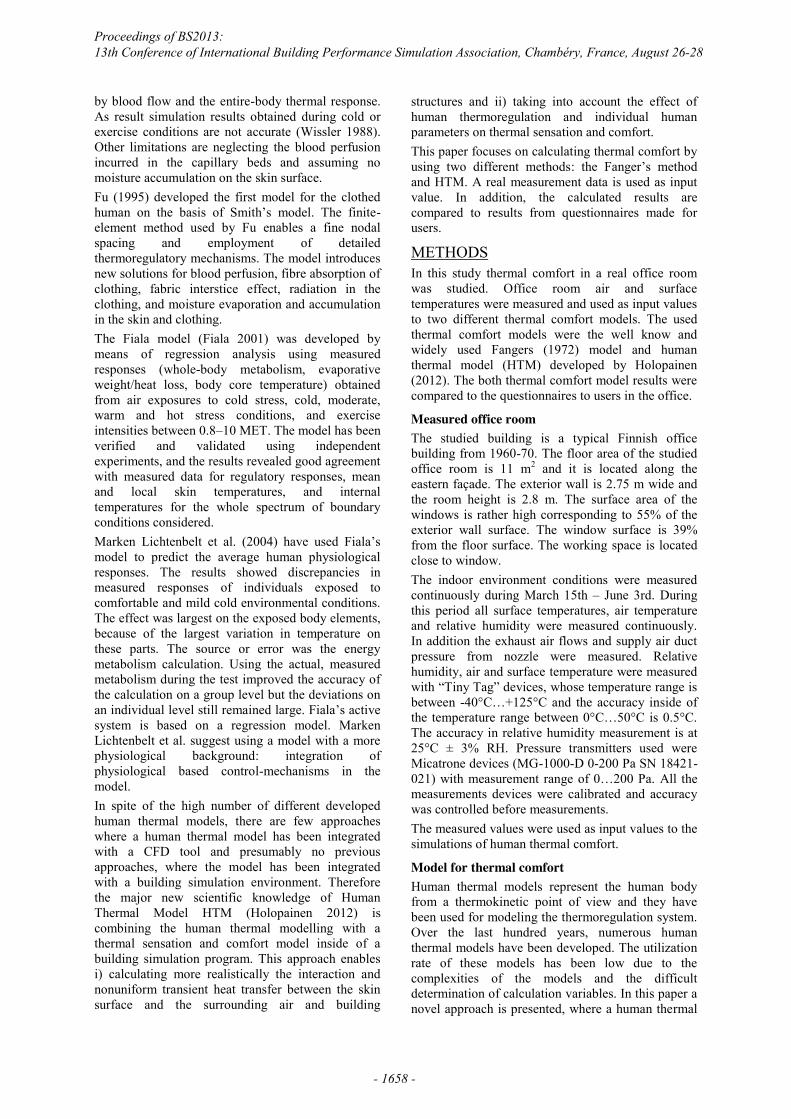
model is implemented in a building simulation environment: the Human Thermal Model (HTM) (Holopainen 2012). HTM can be used for predicting thermal behavior of the human body under both steady-state and transient indoor environment conditions. It is based on true anatomy and physiology of the human body. The connection with the building simulation environment enables defining the external boundary conditions such as surface temperatures and radiation heat transfer more accurately than with the previous human thermal models. The thermal sensation and thermal comfort estimation methodology presented by Zhang (2003) is integrated in HTM. The transient and non-uniform thermal environment as well as our body including our clothing are affecting to our thermal sensation and thus our comfort. Since neither the physiology nor the thermal comfort are uniform for the whole human body, a detailed model is needed in order to estimate realistic thermal sensation and comfort. The model used here for estimating thermal sensation and comfort is based on Zhang (Zhang 2003). Basically, the model calculates local human body part specific thermal sensation and thermal comfort. Based on that information also the overall thermal sensation and comfort can be estimated. Human Body Model For the estimation of thermal sensation and comfort, a human body model interacting with thermal environment is needed. The body model used here is based on Smith’s model (Smith 1991). In this model the human body is divided to 16 parts, and each body part has bone, muscle, fat and skin layers as well as blood circulation. The head has also a brain layer, the chest has lung and viscera layers and the pelvis has a viscera layer.
Figure 1 Human body model
The internal organs of a human being must maintain a fairlyconstant temperature for comfort, around 37.0 ± 0.5 °C. The maximum deviation of the core temperature is about 2 °C from its normal level (Fu 1995). The aim of the human thermoregulatory system is to keep the core temperature constant (Hensel 1981). The human thermoregulatory system senses the thermal state of the body, interprets these thermal signals, and responds accordingly. The
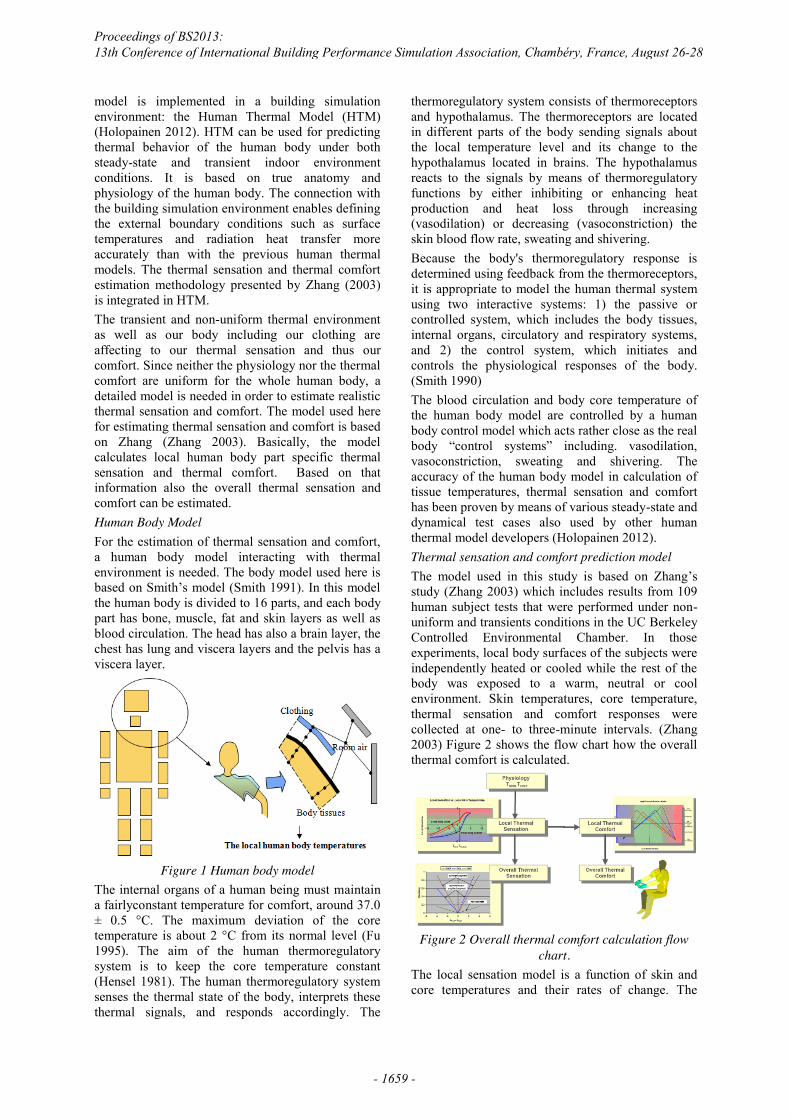
thermoregulatory system consists of thermoreceptors and hypothalamus. The thermoreceptors are located in different parts of the body sending signals about the local temperature level and its change to the hypothalamus located in brains. The hypothalamus reacts to the signals by means of thermoregulatory functions by either inhibiting or enhancing heat production and heat loss through increasing (vasodilation) or decreasing (vasoconstriction) the skin blood flow rate, sweating and shivering. Because the body's thermoregulatory response is determined using feedback from the thermoreceptors, it is appropriate to model the human thermal system using two interactive systems: 1) the passive or controlled system, which includes the body tissues, internal organs, circulatory and respiratory systems, and 2) the control system, which initiates and controls the physiological responses of the body. (Smith 1990) The blood circulation and body core temperature of the human body model are controlled by a human body control model which acts rather close as the real body “control systems” including. vasodilation, vasoconstriction, sweating and shivering. The accuracy of the human body model in calculation of tissue temperatures, thermal sensation and comfort has been proven by means of various steady-state and dynamical test cases also used by other human thermal model developers (Holopainen 2012). Thermal sensation and comfort prediction model The model used in this study is based on Zhang’s study (Zhang 2003) which includes results from 109 human subject tests that were performed under non-uniform and transients conditions in the UC Berkeley Controlled Environmental Chamber. In those experiments, local body surfaces of the subjects were independently heated or cooled while the rest of the body was exposed to a warm, neutral or cool environment. Skin temperatures, core temperature, thermal sensation and comfort responses were collected at one- to three-minute intervals. (Zhang 2003) Figure 2 shows the flow chart how the overall thermal comfort is calculated.
Figure 2 Overall thermal comfort calculation flow
chart. The local sensation model is a function of skin and core temperatures and their rates of change. The
Proceedings of BS2013: 13th Conference of International Building Performance Simulation Association, Chambéry, France, August 26-28
- 1659 -
model calculates each body part separately, and for capturing the asymmetry of thermal conditions. Local comfort is predicted from local sensations and average of all body's local sensations, and the overall sensation model integrates the local sensations. The whole body comfort model integrates the local comfort values. Overall thermal sensation is modelled as a weighted average from the local sensations. For some body parts (e.g., chest and back) the weight is higher than for other parts. The weight is higher either due to body part size or sensitivity. Some body parts are not behaving similarly if the local sensation is higher or lower compared to average thermal sensation. One body part may be more important to determine cold than warm sensation. As the weight is a function between the difference of local and geometrical average of all sensations it assigns larger weights when the local thermal sensation is opposite to rest of the body's thermal sensation. Sensation can have values from -4 to 4. Value 4 corresponds very hot, 3 hot, 2 warm, 1 slightly warm and 0 neutral. Local comfort is a function of local sensation and overall sensation and overall thermal sensation is a function of local thermal comfort. Comfort can have values from -4 to 4, where value 4 corresponds to very comfortable, 2 comfortable and 0 neutral.
Building simulation model The non-commercial building simulation environment VTT House (Tuomaala 2002) simulates air infiltration, ventilation and heat transfer processes. The simulation program is designed for simulation experts, because use of the program requires good knowledge of the simulated case, the target of the simulation and the principles of the nodal network creation. VTT House simultaneously calculates both heat transfer and fluid flow processes. The calculation is based on i) a free nodal approach with discrete definition of mass balance, momentum, and heat balance equations ii) true modelling of thermal conduction, convection, and radiation iii) SIMPLE Algorithm and iv) a sparse matrix solver (Preconditioned Conjugate Gradient Method). The nodal network consists of node capacitances and inter-nodal conductances or heat sources/sinks (e.g., net radiative heat gain components). The transient node temperatures are solved using the finite difference heat balance method (Tuomaala et al. 2002). Thermal conduction, convection, and radiation are included in the calculation, and transient phenomena are modelled allowing transient and asymmetrical simulation results. Calculation of radiative heat transfer is based on estimating view
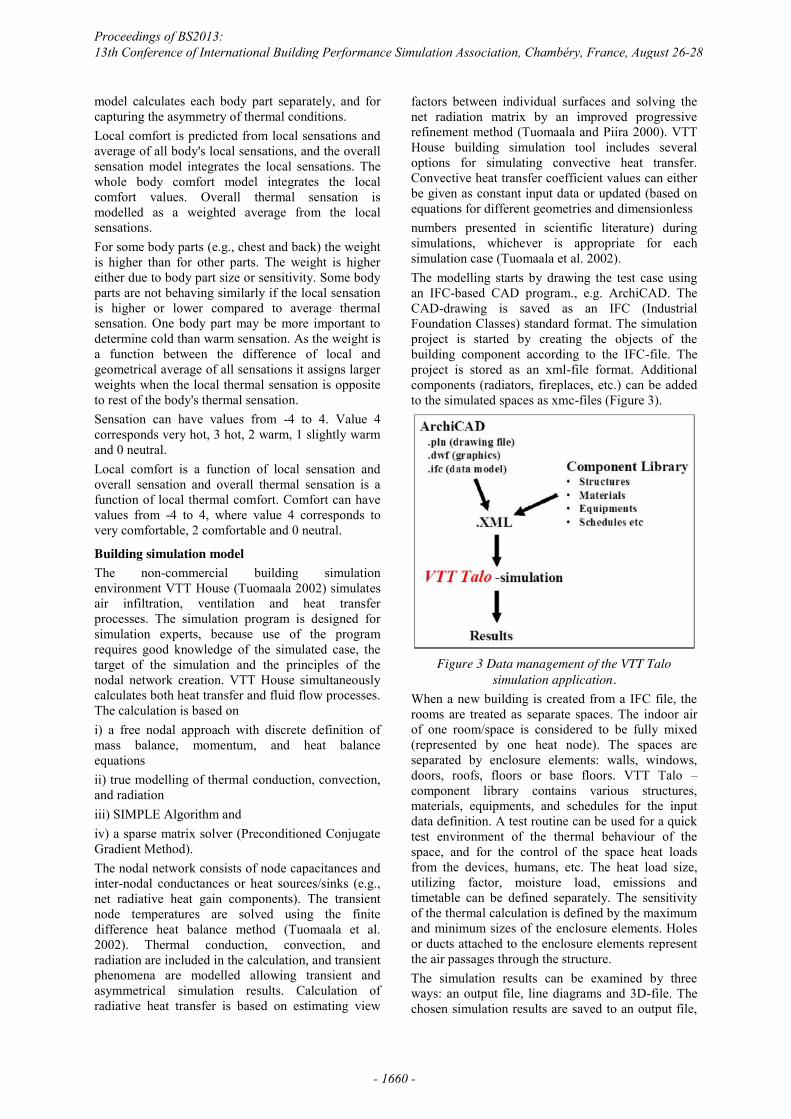
factors between individual surfaces and solving the net radiation matrix by an improved progressive refinement method (Tuomaala and Piira 2000). VTT House building simulation tool includes several options for simulating convective heat transfer. Convective heat transfer coefficient values can either be given as constant input data or updated (based on equations for different geometries and dimensionless numbers presented in scientific literature) during simulations, whichever is appropriate for each simulation case (Tuomaala et al. 2002). The modelling starts by drawing the test case using an IFC-based CAD program., e.g. ArchiCAD. The CAD-drawing is saved as an IFC (Industrial Foundation Classes) standard format. The simulation project is started by creating the objects of the building component according to the IFC-file. The project is stored as an xml-file format. Additional components (radiators, fireplaces, etc.) can be added to the simulated spaces as xmc-files (Figure 3).
Figure 3 Data management of the VTT Talo
simulation application. When a new building is created from a IFC file, the rooms are treated as separate spaces. The indoor air of one room/space is considered to be fully mixed (represented by one heat node). The spaces are separated by enclosure elements: walls, windows, doors, roofs, floors or base floors. VTT Talo – component library contains various structures, materials, equipments, and schedules for the input data definition. A test routine can be used for a quick test environment of the thermal behaviour of the space, and for the control of the space heat loads from the devices, humans, etc. The heat load size, utilizing factor, moisture load, emissions and timetable can be defined separately. The sensitivity of the thermal calculation is defined by the maximum and minimum sizes of the enclosure elements. Holes or ducts attached to the enclosure elements represent the air passages through the structure. The simulation results can be examined by three ways: an output file, line diagrams and 3D-file. The chosen simulation results are saved to an output file,
Proceedings of BS2013: 13th Conference of International Building Performance Simulation Association, Chambéry, France, August 26-28
- 1660 -
which can be opened e.g. in Excel-program. Some of the simulation results can also be examined during the simulation by various line diagrams: node temperatures, heating and cooling powers and energies by the PID-controllers, air and fluid mass or volume flows, realized time steps, etc. Printing files are stored in the VTT Talo directory during the calculation. The files can be used for the 3D representation of surface temperatures, air flows, etc. The starting point of the printing and the printing interval can be defined. Altogether 48 printing files are created. The temperatures of the building elements can be illustrated by means of a colour scale.
Questionnaires for users The user experiences were studied by using Work Environment and Well-Being Questionnaire developed by Finnish Institute of Occupational Health. The survey (Haapakangas et al. 2008) was sent electronically to the users in December 2012 (Ruohomäki et al. 2013). The survey contained a wide range of questions concerning work environment but in this paper only the results concerning thermal comfort, control options and overall satisfaction with work environment are reported. Only the results from users whose office rooms were located in the same façade as the measured room were included in the analyses (N=27). In addition, rooms with higher number that two users were excluded since the measured room was a single person room. In the questionnaire the scale was from 1 to 5 or 1 to 7. The questionnaire focused on the recent user experiences of the work environment, thus, the results most probably describe better the heating season comfort than the summer time comfort.
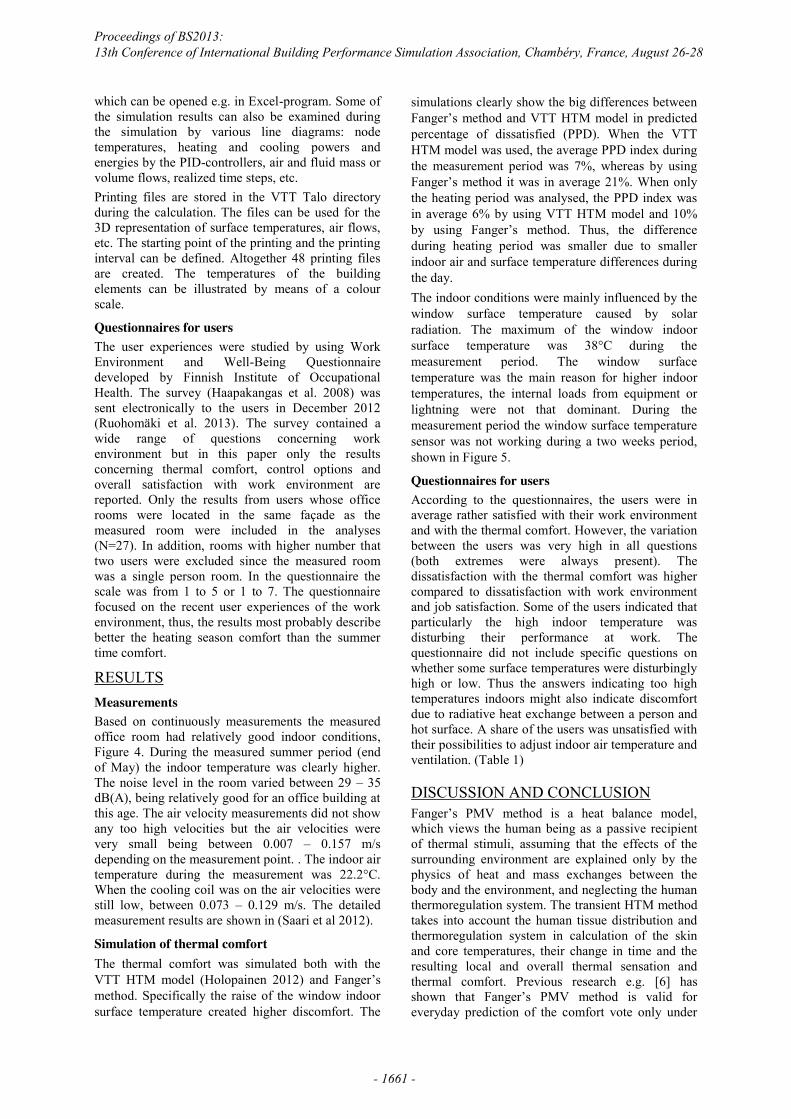
RESULTS Measurements Based on continuously measurements the measured office room had relatively good indoor conditions, Figure 4. During the measured summer period (end of May) the indoor temperature was clearly higher. The noise level in the room varied between 29 – 35 dB(A), being relatively good for an office building at this age. The air velocity measurements did not show any too high velocities but the air velocities were very small being between 0.007 – 0.157 m/s depending on the measurement point. . The indoor air temperature during the measurement was 22.2°C. When the cooling coil was on the air velocities were still low, between 0.073 – 0.129 m/s. The detailed measurement results are shown in (Saari et al 2012).
Simulation of thermal comfort The thermal comfort was simulated both with the VTT HTM model (Holopainen 2012) and Fanger’s method. Specifically the raise of the window indoor surface temperature created higher discomfort. The
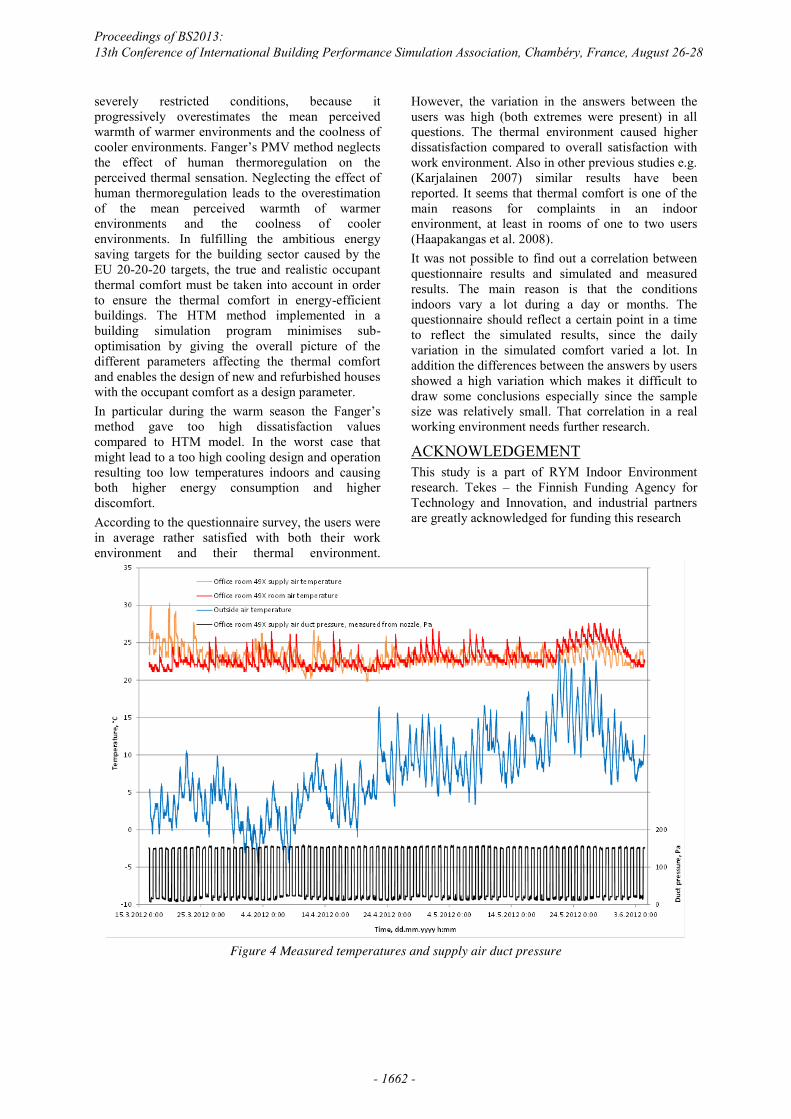
simulations clearly show the big differences between Fanger’s method and VTT HTM model in predicted percentage of dissatisfied (PPD). When the VTT HTM model was used, the average PPD index during the measurement period was 7%, whereas by using Fanger’s method it was in average 21%. When only the heating period was analysed, the PPD index was in average 6% by using VTT HTM model and 10% by using Fanger’s method. Thus, the difference during heating period was smaller due to smaller indoor air and surface temperature differences during the day. The indoor conditions were mainly influenced by the window surface temperature caused by solar radiation. The maximum of the window indoor surface temperature was 38°C during the measurement period. The window surface temperature was the main reason for higher indoor temperatures, the internal loads from equipment or lightning were not that dominant. During the measurement period the window surface temperature sensor was not working during a two weeks period, shown in Figure 5.
Questionnaires for users According to the questionnaires, the users were in average rather satisfied with their work environment and with the thermal comfort. However, the variation between the users was very high in all questions (both extremes were always present). The dissatisfaction with the thermal comfort was higher compared to dissatisfaction with work environment and job satisfaction. Some of the users indicated that particularly the high indoor temperature was disturbing their performance at work. The questionnaire did not include specific questions on whether some surface temperatures were disturbingly high or low. Thus the answers indicating too high temperatures indoors might also indicate discomfort due to radiative heat exchange between a person and hot surface. A share of the users was unsatisfied with their possibilities to adjust indoor air temperature and ventilation. (Table 1)
DISCUSSION AND CONCLUSION Fanger’s PMV method is a heat balance model, which views the human being as a passive recipient of thermal stimuli, assuming that the effects of the surrounding environment are explained only by the physics of heat and mass exchanges between the body and the environment, and neglecting the human thermoregulation system. The transient HTM method takes into account the human tissue distribution and thermoregulation system in calculation of the skin and core temperatures, their change in time and the resulting local and overall thermal sensation and thermal comfort. Previous research e.g. [6] has shown that Fanger’s PMV method is valid for everyday prediction of the comfort vote only under
Proceedings of BS2013: 13th Conference of International Building Performance Simulation Association, Chambéry, France, August 26-28
- 1661 -
severely restricted conditions, because it progressively overestimates the mean perceived warmth of warmer environments and the coolness of cooler environments. Fanger’s PMV method neglects the effect of human thermoregulation on the perceived thermal sensation. Neglecting the effect of human thermoregulation leads to the overestimation of the mean perceived warmth of warmer environments and the coolness of cooler environments. In fulfilling the ambitious energy saving targets for the building sector caused by the EU 20-20-20 targets, the true and realistic occupant thermal comfort must be taken into account in order to ensure the thermal comfort in energy-efficient buildings. The HTM method implemented in a building simulation program minimises sub-optimisation by giving the overall picture of the different parameters affecting the thermal comfort and enables the design of new and refurbished houses with the occupant comfort as a design parameter. In particular during the warm season the Fanger’s method gave too high dissatisfaction values compared to HTM model. In the worst case that might lead to a too high cooling design and operation resulting too low temperatures indoors and causing both higher energy consumption and higher discomfort. According to the questionnaire survey, the users were in average rather satisfied with both their work environment and their thermal environment.
However, the variation in the answers between the users was high (both extremes were present) in all questions. The thermal environment caused higher dissatisfaction compared to overall satisfaction with work environment. Also in other previous studies e.g. (Karjalainen 2007) similar results have been reported. It seems that thermal comfort is one of the main reasons for complaints in an indoor environment, at least in rooms of one to two users (Haapakangas et al. 2008). It was not possible to find out a correlation between questionnaire results and simulated and measured results. The main reason is that the conditions indoors vary a lot during a day or months. The questionnaire should reflect a certain point in a time to reflect the simulated results, since the daily variation in the simulated comfort varied a lot. In addition the differences between the answers by users showed a high variation which makes it difficult to draw some conclusions especially since the sample size was relatively small. That correlation in a real working environment needs further research.
ACKNOWLEDGEMENT This study is a part of RYM Indoor Environment research. Tekes – the Finnish Funding Agency for Technology and Innovation, and industrial partners are greatly acknowledged for funding this research
Figure 4 Measured temperatures and supply air duct pressure
Proceedings of BS2013: 13th Conference of International Building Performance Simulation Association, Chambéry, France, August 26-28
- 1662 -
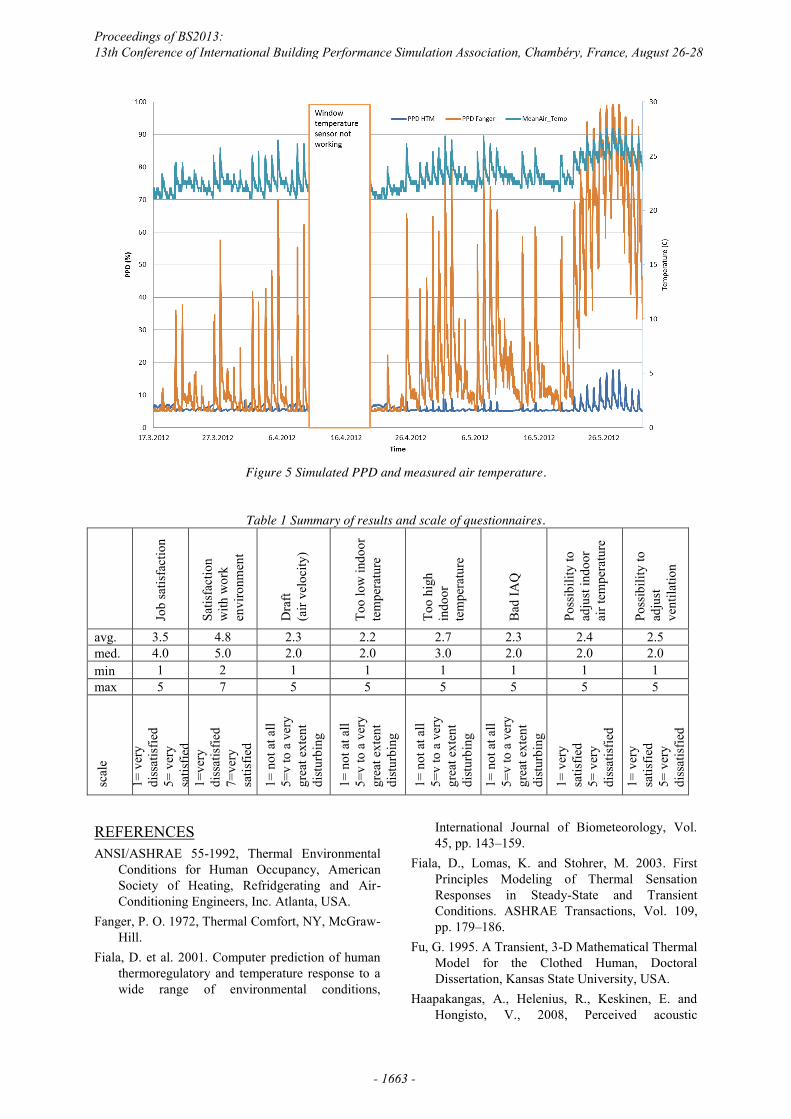
Figure 5 Simulated PPD and measured air temperature.
Table 1 Summary of results and scale of questionnaires.
Job
satis
fact
ion
Satis
fact
ion
with
wor
k en
viro
nmen
t
Dra
ft (a
ir ve
loci
ty)
Too
low
indo
or
tem
pera
ture
Too
high
in
door
te
mpe
ratu
re
Bad
IAQ
Poss
ibili
ty to
ad
just
indo
or
air t
empe
ratu
re
Poss
ibili
ty to
ad
just
ve
ntila
tion
avg. 3.5 4.8 2.3 2.2 2.7 2.3 2.4 2.5 med. 4.0 5.0 2.0 2.0 3.0 2.0 2.0 2.0 min 1 2 1 1 1 1 1 1 max 5 7 5 5 5 5 5 5
scal
e 1=
ver
y di
ssat
isfie
d 5=
ver
y sa
tisfie
d 1=
very
di
ssat
isfie
d 7=
very
sa
tisfie
d
1= n
ot a
t all
5=v
to a
ver
y gr
eat e
xten
t di
stur
bing
1= n
ot a
t all
5=v
to a
ver
y gr
eat e
xten
t di
stur
bing
1= n
ot a
t all
5=v
to a
ver
y gr
eat e
xten
t di
stur
bing
1= n
ot a
t all
5=v
to a
ver
y gr
eat e
xten
t di
stur
bing
1= v
ery
satis
fied
5=
ver
y di
ssat
isfie
d
1= v
ery
satis
fied
5= v
ery
diss
atis
fied
REFERENCES ANSI/ASHRAE 55-1992, Thermal Environmental
Conditions for Human Occupancy, American Society of Heating, Refridgerating and Air-Conditioning Engineers, Inc. Atlanta, USA.
Fanger, P. O. 1972, Thermal Comfort, NY, McGraw-Hill.
Fiala, D. et al. 2001. Computer prediction of human thermoregulatory and temperature response to a wide range of environmental conditions,
International Journal of Biometeorology, Vol. 45, pp. 143–159.
Fiala, D., Lomas, K. and Stohrer, M. 2003. First Principles Modeling of Thermal Sensation Responses in Steady-State and Transient Conditions. ASHRAE Transactions, Vol. 109, pp. 179–186.
Fu, G. 1995. A Transient, 3-D Mathematical Thermal Model for the Clothed Human, Doctoral Dissertation, Kansas State University, USA.
Haapakangas, A., Helenius, R., Keskinen, E. and Hongisto, V., 2008, Perceived acoustic
Proceedings of BS2013: 13th Conference of International Building Performance Simulation Association, Chambéry, France, August 26-28
- 1663 -
environment, work performance and well-being – survey results from Finnish offices. In: Griefahn, B. (Ed.), Proceedings of ICBEN 2008, the 9th Congress of the International Commission on the Biological Effects of Noise, pp. 434–441.
Hensel, H. 1981. Thermoreception and temperature regulation. Academic Press Inc. London, UK
Holopainen, R., 2012,. A human thermal model for improved thermal comfort, VTT SCIENCE 23, Doctoral Dissertation, VTT.
Humphreys, M.A. and Nicol, J.F. 2000. Effects of measurement and formulation error on thermal comfort indices in the ASHRAE database of field studies. ASHRAE Transactions, Vol. 106 (2), pp. 493–502.
Humphreys, M.A. and Nicol, J.F. 2002. The validity of ISO-PMV for predicting comfort votes in every-day thermal environments. Energy and Buildings, Vol. 34, pp. 667–684.
ISO 7730:1994 (E), Moderate thermal environments - Determination of the PMV and PPD indices and specification of the conditions for thermal comfort, International Organization for Standardization, Switzerland.
Itard, L. and Meijer, F. 2009. Towards a Sustainable Northern European Housing Stock, Figures, Facts and Future. IOS Press. Amsterdam, The Netherlands.
Karjalainen, S., 2007, The Characteristics of Usable Room Temperature Control, VTT Publications 662, Doctoral Dissertation, VTT
Marken Lichtenbelt, W.D.v., Frijns, A.J.H., Fiala, D., Janssen, F.E.M., Ooijen, A.M.J.v. and Steenhoven, A.A.v. 2004. Effect of individual characteristics on a mathematical model of human thermoregulation. Journal of Thermal Biology, Vol. 29, pp. 577–581.
Saari M, Antson A, Ruotsalainen R., 2012, Olosuhdemittaukset ennen peruskorjausta, Turun yliopisto, VTT-S-07362-12
Stock: Figures, Facts and Future. IOS Press. Amsterdam, The Netherlands.
Smith, C., 1991, A Transient, Three-Dimensional Model of the Human Thermal System, Doctoral Dissertation, Kansas State University, USA.
Tuomaala, P. and Piira, K. 2000. Thermal radiation in a room: an improved progressive refinement method. Building Service Engineering and Technology, Vol. 21, pp. 9–17.
Tuomaala, P. 2002. Implementation and evaluation of air flow and heat transfer routines for building simulation tools, Doctoral Dissertation, VTT Publications 471, Espoo, Finland. 45 p. app. 52 p.
Tuomaala, P., Simonson, C. and Piira, K. 2002. Validation of Coupled Airflow and Heat Transfer Routines in a Building Simulation Tool. ASHRAE Transactions, Vol. 108, pp. 435–449.
Ruohomäki, V., Haapakangas, A. ja Lahtinen, M., 2013, Tilat työn mukaisiksi: työn analyysi ja koettu sisäympäristö yliopistossa. Sisäilmastoseminaarin raportti
Wissler, E.H. 1988. A review of human thermal models. Environmental Ergonomics. Taylor & Franics, London. pp. 267–285.
Zhang, H., 2003, Human Thermal Sensation and Comfort in Transient and Non-Uniform Thermal Environments. Doctoral Dissertation, University of California, Berkeley, US
Proceedings of BS2013: 13th Conference of International Building Performance Simulation Association, Chambéry, France, August 26-28
- 1664 -