Comparative efficiency between BETYP tags and conventional ...
Munich Personal RePEc Archive
Comparative, dynamic efficiency of
national healthcare systems
Waśniewski, Krzysztof
The Andrzej Frycz - Modrzewski Cracow University, Department of
Economics and Management
10 May 2012
Online at https://mpra.ub.uni-muenchen.de/38029/
MPRA Paper No. 38029, posted 01 Jun 2012 13:46 UTC
1
Comparative, dynamic efficiency of
national healthcare systems
Author: Krzysztof Waśniewski, PhD,
Organisation: Department of Economics and Management, The Andrzej Frycz Modrzewski
Cracow University, ul. Herlinga Grudzińskiego 1, Kraków, Poland;
e-mail: [email protected] , phone: +48601489051
Abstract
The paper is an ex post, critical contribution to the research conducted by the World Health Organisation on
healthcare financing. The issue of national healthcare systems’ efficiency is addressed, through building a model
of change in healthcare quality, in response to changes in healthcare financing, with the core hypothesis stating
that the greater is the change in healthcare expenditures, the lesser is their efficiency in terms of healthcare
quality improvement. Then, empirical evidence is provided, with econometric research proving the robustness of
the model; further, qualitative research provides strong presumptions to a more general thesis, namely that
healthcare systems bear significant transaction costs, proportional to their demographically defined size. Thus,
important, and negative effects of scale are to assume in healthcare financing.
Keywords: healthcare; institutions; efficiency
JEL codes: I1, G28, H41
2
1. Introduction
The World Health Report, issued by the World Health Organisation in 2010, announces that from 20% to 40% of
financing going to healthcare systems is wasted, in the sense that it does not contribute to deliver proper
healthcare as such. The necessity to assure universal coverage, especially in developing countries, goes along
with the imperative to go tight on healthcare expenses. Improving efficiency seems to be the core challenge for
healthcare systems all over the world (WHO 20101). The present paper is an ex post, scientific contribution to
WHO research, with a special focus on both efficiency, and sustainability of national healthcare systems. In any
given country, one the most basic, public decision-makers’ headaches boils down to the following question:
“how much will be enough, next year, to make that whole health business work properly?” Paraphrasing the
well-known Paul Krugman’s metaphor about trade, if some politician in United States declared that they are able
to supply to their fellow citizens hospital healthcare at half the current cost, with quality held constant, they
would be immediately elected president. The moment that said fellow citizens discovered that the scheme
consists in sending American patients to Paraguayan hospitals, the person in question would be immediately
subject to impeachment, and possibly to criminal prosecution. That is quite the issue that the present paper
attempts to explore, i.e. the mutual link between healthcare expenditure, and the quality of healthcare, bearing in
mind the broadly spoken institutional context. The question is relevant for both healthcare policy, and fiscal
policy, as money spent on healthcare is among the most significant categories of public expenditure, ergo among
the most important factors of public debt accumulation.
Before going more in depth into the literature, a preliminary clarification of the “healthcare financing” concept
seems necessary. Basically, the economic concept of financing refers to the input of capital to the production
function; in other words, to investment, and to financial markets. The jargon of healthcare policy uses the term
“financing” in a different manner, referring to all payments received by the suppliers of healthcare products and
services, in exchange of said product and services. From the purely economic point of view, such a kind of
“financing” is the same that supply, or production in product markets. Henceforth, financing of healthcare, as
understood in WHO research, corresponds to the output of the production function, not to its capital input. A
substantial part of healthcare expenditures is made from pooled funds, on the grounds of general contracts with
the suppliers of healthcare products and services. These contracts bear ambiguous characteristics. Technically,
1 Health Systems Financing. The path to universal coverage, World Health Report, World Health Organisation, 2010

3
they consist in buying healthcare goods in bundles, in wholesale quantities so to say. However, for many
suppliers, especially for publicly owned medical operators, these contracts are the basis of their solvency, and of
their ability to invest. These contracts are the equivalent of the Keynesian effective demand, and the anticipation
of their future value and specific provisions is the grounds, on which the suppliers of healthcare goods plan
supply, and investment. The concept of healthcare goods, introduced in the previous sentence, seems, by the
way, adequate for grasping the variety that hides behind the term “healthcare financing”. The most spontaneous
association with healthcare financing is money paid for medical services. However, a substantial part of
healthcare financing serves to refund, totally or partially, the value of drugs, and medical equipment (for
example glucometers) supplied in the given national market. Summing up it is to keep in mind that whenever the
concept of “healthcare financing” is discussed, it refers to a hybrid, institutional system that encompasses a
broad range of contracts, heterogeneous both in nature and in scale.
Over 2000 – 2008, most countries in the world significantly increased their healthcare expenses per capita. In the
world as a whole, average healthcare expenses per capita, measured in US$ PPP, had grown from 566 to 899,
which means that the global network of healthcare systems had absorbed, roughly speaking, an additional 2,5
trillion US$ PPP. In the same time, average life expectancy of the global population had grown just by 3%, from
66 to 68 years. The financial input seems to be disproportionally high in comparison to the human output, so to
say. In most countries, the growth of healthcare expenditures has been absorbed principally by the public pooled
funds, frequently at the expense of the private sector (WHO 20112). For example, in Australia, 22,25 billions of
Australian dollars PPP were injected in the healthcare system over eight years, in addition to the previously spent
58,5 billions a year, with life expectancy having grown by just 2,5%, from 80 to 82 years. Out of these 22
billions, 13,7 were absorbed by the public healthcare system, and 8,5 were the growth of the private healthcare
market.
The line of research represented by the World Health Organisation focuses mostly on assuring universal
coverage in healthcare, which is closely connected to modalities of financing. The private, out-of-pocket system
of payments for healthcare services (OOP) makes almost 50% of the global financing of healthcare systems, and
is visibly, inversely proportional to the given country’s level of income. In high – income countries, the share of
OOP in the total health expenditure (THE) is barely above 36%, to reach some 70% in upper middle-income
countries, and exceeding 85% in lower-income ones (Falkingham 20043; Dummer, Cook 20074; Durairaj et al.
2 World Health Organisation, 2011, World Health Statistics 3 Falkingham, J., 2004, Poverty, out-of-pocket payments and access to health care: evidence from Tajikistan, Social Science & Medicine, 58(2), pp. 247-258 4 Dummer, T., J., B., Cook, I., G., 2007, Exploring China's rural health crises: Processes and policy implications, Health Policy, 83, pp. 1-16
4
2010a5). Efficiency of healthcare financing greatly depends on the efficiency in the actual supply of healthcare
services. No system of financing is efficient per se. An important issue is the link between money and
infrastructure. Significant path dependence is to notice: new directions of financing can hardly create new
infrastructure, but the existing infrastructure tends to attract financing (Durairaj et al. 2010b6). It has been proven
possible to build highly efficient, demand-based healthcare systems, for example in Chile. Such systems require,
however, well-developed information systems to be effective (Missoni, Solimano 20107). There is significant
substitution, in households’ budgets all over the world, between the consumption of privately paid healthcare,
and other goods (Kabawata et al. 20028; Saksena et al 20109). It seems that private health insurance, in
comparison to simple out-of-pocket direct payment for healthcare, improves the overall availability of healthcare
(Saksena et al. 2010). Pooled funds play a significant role in financing healthcare systems. From the political
point of view, social acceptance of redistribution in financing healthcare is an important factor of success in
creating and maintaining pooled funds. There is a body of evidence, which suggests that the social acceptance in
question is, firstly, highly country-specific, even at the same level of income per capita, and, secondly, that the
most widely accepted pattern of pooling is the coverage of approximately the half of the total healthcare
expenses through various means of financial solidarity (James, Savedoff 201010). There is a sharp difference
between the potential, and the effective demand for healthcare. The latter depends on the given population’s
willingness to actually use healthcare services, which, in turn, seems to be proportional to the broadly defined
social status, education included (Gakidou et al. 201011; Xu et al. 2010a12). There is a body of research, which
aims at defining the optimal level, and institutional mix of healthcare expenses. Some findings suggest that a mix
of 5 – 6% of the GDP spent on healthcare by the government, combined with out-of-pocket payments making
some 15 – 20% of the total health expenditure, assure high efficiency and sustainability of the healthcare system.
The same research indicates that only high and upper-middle income countries are able to work out actual,
institutional mix of healthcare expenditures close to that ideal. The same countries display a clear tendency of
5 Durairaj, V., Murali Kannan, M., Gopalan, S.S.,, Jayalakshmi C., Clare, A., CSST, Shivalingiah, M., Sankara Sarma, P., 2010, Lessons
learned from a community-based medisave experiment among rural women in the Indian state of Karnataka, World Health Report (2010), Background Paper, 1, World Health Organisation 6 Durairaj, V., D'Almeida, S., Kirigia, J., 2010, Ghana's approach to social health protection, World Health Report (2010) Background Paper,
2, World Health Organisation 7 Missoni, E., Solimano, G., 2010, Towards Universal Health Coverage: the Chilean experience, World Health Report (2010) Background Paper, 4 8 Kawabata, K., Xu, K., Carrin, G., 2002, Preventing impoverishment through protection against catastrophic health expenditure, Bulletin of the World Health Organization, 2002;80(8):612 9 Saksena, P., Fernandes Antunes, A., Ke Xu, Musango, L., Carrin, G., 2010, Impact of mutual health insurance on access to health care and
financial risk protection in Rwanda, World Health Report (2010), Background Paper, 6. 10 James, Ch., Savedoff, W., 2010, Risk Pooling and Redistribution in Healthcare: An Empirical Analysis of Attitudes Toward Solidarity, World Health Report (2010), Background Paper ,5, World Health Organisation 11 Gakidou, E., Cowling, K., Lozano, R., Murray, C., 2010, Increased educational attainment and its effect on child mortality in 175 countries between 1970 and 2009: a systematic analysis, The Lancet, 2010; 376(9745), pp. 959-74 12 Ke Xu, Saksena, P., Evans, D., B., 2010, Health Financing and Access to Effective Interventions, World Health Report (2010),
Background Paper, 8, World Health Organisation
5
healthcare expenditures to grow faster than the GDP, a pattern not to encounter in low – income countries.
Moreover, private out-of-pocket healthcare expenses grow faster that the public ones, and the former are elastic
to the latter, in a proportion above 1,00, without obvious elasticity in the opposite direction (Musgrove et al.
200213; Xu et al. 2010b14). Healthcare infrastructure is mostly urban, and healthcare services are mostly urban
amenities. The development of health infrastructure is strongly linked to the overall urban development
(Gakidou et al. 2010; Xu et al. 2010a; Kabawata et al. 2002; Saksena et al 2010; Missoni, Solimano 2010). With
healthcare being financed from many sources, an important feature of the system is the optimal, mutual
complementarity of particular sources (modalities) of financing, i.e. they should have as separate domains of
application, as possible, without overlapping (Le Gargasson, Salome 201015). Efficiency of healthcare spending
is highly idiosyncratic among countries. There are many cases of national healthcare systems, which, with
relatively few financial means, achieve much better results, whilst, in the same time, many high – income
countries use their healthcare financing in clearly inefficient ways (Hakkinen, Joumard 200716; Stenberg et al.
201017).
There seems to be a curvilinear correlation between healthcare spending per capita, and life expectancy. That
correlation translates into a remarkably high elasticity of life expectancy to healthcare expenditure per capita, in
countries with low healthcare spending, and a quickly declining elasticity, as expenditures per capita get higher.
Countries, which produce remarkably higher health output for the money spent, are not distinctive by their
strictly spoken efficiency in healthcare, but rather by the universal coverage and accessibility of their healthcare
systems (Evans et al. 200118; Chisholm, Evans 201019).
The trend of change in healthcare systems, observed in the world during the past decade, in connection to the
line of research that dominates the WHO discourse, ask for a general answer to the following question: to what
extent the long-run development of national healthcare systems, and the associated financial changes, are
predictable? Are there any established patterns of change? This general question regards both marginal
efficiency, and systemic idiosyncrasy. Firstly, the WHO research focusing mostly on cross-sectional comparison,
13 Musgrove, P., Zeramdini, R., Carrin, G., 2002, Basic patterns in national health expenditure, Bull World Health Organ;80(2):134-42 14 Ke Xu, Saksena, P., Jowett, M., Indikadahena, Ch., Kutzin, J., Evans, D., B., 2010, Exploring the thresholds of health expenditure for protection against financial risk, World Health Report (2010), Background Paper, 19, World Health Organisation 15 Le Gargasson, J-B., Salome, B., 2010, The Role of Innovative Financing Mechanisms for Health, World Health Report (2010),
Background Paper, 12, World Health Organisation 16
Häkkinen, U., Joumard, I., 2007, Cross-Country Analysis of Efficiency in OECD Health Care Sectors: Options for Research, OECD Economics Department, Working Papers, No. 554, OECD Publishing, 2007 17 Stenberg, K., Elovainio, R., Chisholm, D., Fuhr, D., Perucic, A-M., Rekve, D., Yurekli, A., 2010, Responding to the challenge of resource mobilization - mechanisms for raising additional domestic resources for health, World Health Report (2010) Background Paper, 13, World Health Organisation 18 Evans, D.,B., Tandon, A., Murray, C., J., M, Lauer, J., A., 2001, The comparative efficiency of national health systems in producing health: and analysis of 191 countries, GPE Discussion Paper No. 29, WHO; Geneva, Switzerland. 19 Chisholm, D., Evans D.,B., 2010, Improving health system efficiency as a means of moving towards universal coverage, World Health
Report (2010) Background Paper, 28, World Health Organisation
6
it begs for a more dynamic study, in the sense of links between marginal changes. In other words, given the
current, cross-sectional image of various healthcare systems in the world, what factors determine the optimal
usage of each additional million of dollars, fuelling the healthcare funds? Secondly, to what extent national
healthcare systems are really idiosyncratic? The WHO discourse suggests that the degree of idiosyncrasy is,
indeed, very high, and that any transposition of healthcare institutions from one country to another is utmost
uncertain as for the outcomes obtained. These two issues refer to two streams of institutional economics. Firstly,
as contracts are an important aspect of healthcare systems, the issue of transaction costs, put in a broader context
of the new institutionalism, is an important theoretical asset. Secondly, as institutional idiosyncrasy is concerned,
the reference to old institutional school seems quite obvious. Thus, it is to assume that the system of financing
healthcare is composed of imperfect contracts. As these contracts are drawn and implemented, opportunistic
behaviour of social agents, combined with the noticeable specificity of assets, and bounded rationality, create
substantial costs of managing the whole system, in the lines of the Williamson’s theory (Williamson 197520,
198521, 199122). Opportunistic behaviour seems, by far, to be most important, and the most scalable factor of
transaction costs in national healthcare systems. Corruption and nepotism connected to public procurement in
healthcare are a good illustration to that. Getting from that new institutional, theoretical context to the old
institutionalism, the most important issue to consider seems to be institutional stability of national healthcare
systems. The old institutionalism points out that institutional systems form gradually, with the voting of legal
rules being just the first step in a process, in which economic agents gradually develop typical patterns of
behaviour, these patterns shaping, in turn, the legal rules (see for example: Hodgson 200023, 200624; Searle
199525, 2005; Joas 199626; Twomey 199827; Kilpinen 200028). It is both an empirical observation and a
theoretical development of the old institutionalism that countries with relatively inefficient institutions cannot
just switch to more efficient ones, the process of such change being progressive and imperfectly efficient in itself
(ex Aoki 200729). Still in the line of the old institutionalism, it is to keep in mind that institution forming takes
20 Williamson, O.,E., 1975, Markets and hierarchies, Free Press, New York 21 Williamson, O.,E., 1985, The Economic Institutions of Capitalism: firms, markets, relational contracting, Free Press, New York 22 Williamson, O.,E., 1991, Strategizing, economizing and economic organization, Strategic Management Journal, no. 12, pp. 75 - 94 23 Hodgson, G.,M., 2000, The Essence of Institutional Economics, Journal of Economic Issues, vol. XXXIV, no. 2, June, pp. 317 - 329 24 Hodgson, G.,M., 2006, Institutional Economics, the Individual Actor and Institutional Change, For the Alexander von Humboldt lecture at the University of Nijmegen, December the 5th 25 Searle, J., R., 1995, The Construction of Social Reality, London: Allen Lane 26 Joas, H., 1996, The Creativity of Action, Chicago: University of Chicago Press 27 Twomey, P., 1998, Reviving Veblenian Economic Psychology, Cambridge Journal of Economics, vol. 22, no. 4, July, pp. 433-48 28 Kilpinen, E., 2000, The Enormous Fly-Wheel of Society: Pragmatism’s Habitual Conception of Action and Social Theory, Helsinki: University of Helsinki 29 Aoki, M., 2007, Endogenizing Institutions and Institutional Changes, Stanford University, revised version of an invited lecture at the
2005World Congress of the International Economic Association in Morocco
7
place in polycentric social systems, with the degree of decentralisation being a very important factor of
efficiency (see for example: Ostrom 201030; Agraval, Gibson 200131; Schlager, Ostrom 199232).
2. The model
Consistently with the literature, particularly in accordance with the previously cited Chisholm and Evans’s
research (Chisholm, Evans 2010), it is to assume that any given national healthcare system displays a specific
quality of healthcare, namely βH, possible to estimate as the average life expectancy at birth, and a specific ratio
βH/FH. The latter reflects the quality of healthcare obtained with one unit of healthcare financing, with FH
standing for total healthcare expenditures per capita; βH/FH is heterogeneous among countries. If dβH and dFH
stand, respectively, for marginal quality of healthcare, and marginal healthcare expenditures, the ratio dβH/dFH
represents the dynamic elasticity of healthcare quality to healthcare expenses, i.e. the marginal healthcare quality
obtained with marginal healthcare expenditures. The present model focuses on the dβH/dFH dynamic elasticity as
the core aspect of national healthcare systems’ efficiency.
For a given population of ‘N’ patients, there is a given set of ‘G’ theoretically available healthcare goods (drugs
included), defined on the grounds of the currently best, internationally recognized, medical practice. Each
healthcare good provides specific utility, which is assessed, among others, on the grounds of the possible
complementarity, and substitution with other healthcare goods. For example, physiotherapy may be, to some
extent, the substitute of surgery, each of them being complementary with a subset of drugs. Each patient ‘i’
needs, objectively, a subset of healthcare goods, being the integral of ‘G’, each healthcare good ‘j’ supposed to
be delivered in the expected quantity eQi,j, at the expected price ePi,j. The aggregate demand DH for healthcare is
the sum of those individual, bi-dimensional integrals, as shown in equation (1).
!! = !"!,!!"!,!!
!!!
!
!!! (1)
The assumption of objective needs, in defining the demand for healthcare, is very important. Said demand is not
grounded in what patients want, but in what they need, according to the best current medical practice. Equation
(1) deals with demand for healthcare strictly spoken, i.e. with goods that are required to take care of the patient’s
health as such. Of course, it does not exclude the existence of all kinds of medical “caprices”, like unnecessary
30 Ostrom, E., 2010, Beyond Markets and States: Polycentric Governance of Complex Economic Systems, American Economic Review, 100,
June 2010, pp. 1 - 33 31 Agrawal, A., Gibson, C., ed. 2001., Communities and the Environment: Ethnicity, Gender, and the State in Community-Based Conservation. New Brunswick, NJ: Rutgers University Press 32 Schlager, E., Ostrom, E.,. 1992, Property-Rights Regimes and Natural Resources: A Conceptual Analysis, Land Economics, 68(3): 249–62
8
plastic surgeries, or weight loss clinics. These kinds of medical (or rather vaguely medical) services are not part
of the healthcare system, according to the present model, and are not included in the definition of demand for
healthcare goods. It is also to note that demand for healthcare, as defined in equation (1), is a kind of
technological frontier for any given national healthcare system, i.e. the most advanced basket of healthcare
goods possible. Against that technological frontier, the actual supply SH of healthcare goods is projected.
Healthcare goods that each patient ‘i’ receives, are the integral of ‘K’, each healthcare service ‘j’ delivered in the
actual amount Qi,j, at the actual price Pi,j, as in equation (2).
!! = !!,!!!,!!
!!!
!
!!! (2)
The quality of healthcare has two levels, namely individual, and collective. Individually, for the given patient ‘i’,
the quality of healthcare βi is assessed on the grounds of the correspondence between the expected, and the
actually supplied quantities and prices of healthcare goods. That individual quality of healthcare depends on the
actual accessibility of the state-of-the-art healthcare goods to the given patient. Accessibility, in turn, is
equivalent to the probability that the given patient receives exactly what they need, in terms of healthcare goods.
That probability is Pareto-distributed, as in equation (3), according to the patient overall social status ‘x’, the
latter being measured as a fraction of the highest social status observed in the given population of patients33.
!! ! = !"!,!!"!,!×1 −
!!
!
!
0
!
!!! (3)
There is a threshold ‘xm’ of social status, below which the given patient does not have actual access to healthcare
goods. The parameter ‘α’ represents the elasticity of βi to social status, and is, in fact, the opposite of universal
coverage in healthcare. Both xm and α are country – specific. It is to note that according to equation (3), the
individual quality of healthcare is, in geometrical terms, the volume of an irregular polyhedron. That polyhedron
may take various shapes, but what counts is its volume. In practice, it means that individual quality of healthcare
may be improved through compensating, for example, relatively high prices of some healthcare goods with more
affordable prices of other healthcare goods. At the collective level, the overall quality βH of healthcare in the
given country depends on the distribution of social status across the population, and on the parameters of the
equation (3), namely xm and α, which is formalised in equation (4).
!! = !! !!
!!!,!!!= !"!,!!"!,!×
1 −!!
!
!
0
!
!!!
!
!!!,!!! (4)
33 It is assumed that in most countries there is a minority of the most privileged patients, who can always have access to the best possible
medical assistance, whatever the national average is.
9
Equation (4) bears important assumptions for further consideration. Firstly, it allows assuming that the relative
performance of the given national healthcare system depends, partly, on exogenous factors, namely on expected
quantities, and expected prices of healthcare goods, as well as on the social structure in place. They form the
context, in which the given level of healthcare expenditures assures a certain accessibility of healthcare, with the
latter being defined with two parameters, namely “1/α”, and xm. Equation (4) explains, thus, why national
healthcare systems are, as a rule, imperfectly efficient in translating healthcare expenditures into life expectancy.
It also points at some detailed aspects of said efficiency, especially at the correspondence between the general
concept of healthcare quality, and the empirically used variable of life expectancy. Life expectancy at birth
mostly depends, besides the obvious genetic, and environmental factor, on prenatal medical assistance, as well as
on the supply of paediatric healthcare goods: vaccination, current medical assistance etc. The actual utility of
these healthcare goods greatly depends on their universal accessibility. For example, vaccination is efficient at
the social scale when applied to the great majority of the population; vaccinating just the wealthiest 20% is
pointless as for life expectancy. Thus, equation (4) provides strong theoretical support to the thesis that average
life expectancy at birth is a robust, empirical estimation of healthcare quality.
Considering a function βH(FH), in the lines of the previously cited Chisholm and Evans’s research (Chisholm,
Evans 2010), one has to imagine a system, in which the total stream of healthcare financing comes as a factor of
healthcare goods’ accessibility. Such a system is redistributive in essence, i.e. it has to flatten the Pareto curve,
and to drive its lower extremity down, by minimizing α and xm. However, besides pure redistribution, the system
has to take into account the technological frontier of medical sciences, or, in other words, the demand for
healthcare goods. The crucial issue, for maximising efficiency βH(FH), is to direct the stream of financing to such
groups of patients, where the gap between the objectively defined demand for healthcare goods, and the
individual patients’ capacity to afford them is the greatest. In other words, any healthcare system has to combine
fire and water, namely redistribution, and targeted expenses.
Should marginal change in healthcare quality be considered, or dβH, it has, basically, four different underlying
mechanisms. Firstly, technological progress may drive up the integral of demand for healthcare, with the given
country’s capacity to keep up remaining constant. That mechanism is, a priori, common for all countries,
although sometimes breakthrough medical research conducted in the given country makes, momentarily,
selected advanced therapies more accessible to local population, before these therapies become global in reach.
Secondly, economic growth may drive down the gap between the demand for healthcare goods, and the xm
threshold in the given country. In other words, as people become wealthier in comparison to the world’s average,
10
their purchasing power regarding healthcare goods grows accordingly. Thirdly, the social structure may change,
toward a more equitable one. Such a change is sometimes incremental, and sometimes of a more breakthrough
nature (China is an excellent example of the latter). Finally, other factors held constant, healthcare expenditures
from pooled funds might drive down the parameters of the Pareto distribution, namely α and xm, and so
contribute to compress the gap between the demand for healthcare, and the supply of it. That last mechanism is
the foundation of any healthcare policy, and the grounds, on which dynamic efficiency of healthcare systems
should be assessed.
The shape of the Pareto distribution, underlying βH, depends on the behaviour of healthcare goods’ suppliers, as
well as on the behaviour of the healthcare funds’ operators. Further on, the model assumes that βH is the outcome
of complex, social interactions, which may be modelled as temporary Harsanyi's games with imperfect
information (Harsanyi 195334; 196635; 196736; 196837), and, in the same time, sub-games of a Selten's extensive
game with imperfect recall (Selten 197538). The set of players is structured into subsets consistent with the given
country’s social structure. At any given moment, any given player ‘l’ of the healthcare system game plays a
mixed Nash's strategy, made of pure Nash's strategies (Nash 1950a39; 1950b40; 195141; 195342), in which a set of
modalities of action is associated, through a pay – off function, with a set of results. The set of results is causally
and functionally derived from the set of modalities of action, and that link makes each individual strategy more
or less, internally consistent. The game has a Nash’s solution, i.e. it reaches dynamic equilibrium, when
individual strategies are consistent enough to be predictable43. In dynamic equilibrium, every individual strategy
is in interaction with the space of the game in the sense that individual strategies of different players mutually
shape one another. This, in turn, leads to a certain degree of isomorphism among individual strategies: typical
patterns of behaviour arise, as for the actual usage of healthcare financing. The latter, namely the total stream of
financing FH that comes to the healthcare system is a finite set of nf financial flows (funds). It encompasses both
the public, and the private pooled funds, as well as the patients’ out-of-pocket payments.
34 Harsanyi, J.C., 1953, Cardinal Utility in Welfare Economics and in the Theory of Risk – Taking, The Journal of Political Economy, vol.
61, issue 5, pp. 434 - 435 35 Harsanyi, J.C., 1966, A General Theory of Rational Behavior in Game Situations, Econometrica, vol. 34, no. 3, pp. 613 – 634 36 Harsanyi, J.C., 1967, Games With Incomplete Information Played by “Bayesian” Players. Part I: The Basic Model, Management Science,
vol. 14, no. 3, pp. 159 - 182 37 Harsanyi, J.C., 1968, Games With Incomplete Information Played by “Bayesian” Players. Part II: Bayesian Equilibrium Points – Management Science, vol. 14, no. 5, pp. 320 - 334 38 Selten, R., 1975, Reexamination of the perfectness concept for equilibrium points in extensive games - Journal International Journal of Game Theory, Issue Volume 4, Number 1, reprint: Kuhn, H.W.,( ed. ), Classics in Game Theory, Princeton University Press, 1997, pp. 317 – 354 39 Nash, J.F., 1950, Equilibrium Points in n – Person Games – Proceedings of the National Academy of Sciences of the United States of America, vol. 36, no.1, pp. 48 - 49 40 Nash, J.F., 1950, The Bargaining Problem, Econometrica, vol. 18, no.2, pp. 155 - 162 41 Nash, J.F., 1951, Non – Cooperative Games, The Annals of Mathematics, Second Series, vol. 54, issue 2, pp. 286 - 295 42 Nash, J.F., 1953, Two – Person Cooperative Games – Econometrica, vol. 21, issue 1, pp. 128 - 140 43 According to the Nash’s theory, any given social game has a solution only when utilities of all the possible outcomes of the game have
definite utilities, known to all the players.
11
Each financial flow Fk ∋ FH bears specific transaction costs TC(Fk), i.e. it is collected and distributed with
bounded rationality, in presence of specific assets, and opportunistic behaviour. That makes FH internally
heterogeneous as for efficiency of financing. Logically, the marginal change dFH in healthcare expenditures is
the sum of marginal changes dFk in its components. Each marginal change dFk bears specific transaction costs of
change, which include both the previously mentioned costs TC(Fk) of maintaining the financial flow, and the
costs of change, resulting from specific, opportunistic behaviour, and bounded rationality regarding the change
in question. Consequently, the marginal change dFH in healthcare expenditure is internally heterogeneous as for
efficiency. The current supply of healthcare goods is the difference between gross healthcare expenditures, and
the transaction costs of funding. Accordingly, the marginal change dSH in the supply of healthcare goods is the
difference between the marginal change dFH in healthcare expenditures, and the transaction costs of marginal
change in said expenditures TC(dFH), as in equation (5). In other words, prices and quantities of the actually
supplied healthcare goods significantly depend on the transaction costs of financing the healthcare system.
!"! = !"! − !"(!"!)!!
!!! (5)
Equation (5) means that the elasticity dβH/dFH of marginal change in healthcare quality to marginal change in
healthcare expenditures depends on the transaction costs linked to the said marginal change in healthcare
expenditures. As the present model particularly focuses the dynamics of healthcare systems, transaction costs are
particularly interesting in that dynamic perspective. The question is: how does change in financing generate
transaction costs? Individual financial flows that make the overall healthcare expenditure FH do not change at the
same pace. For any given pair Fk, Fk’ of financial flows, marginal change in Fk is not equal to marginal change in
Fk’. Thus, the overall marginal change in healthcare expenditures is always heterogeneous, and always means a
structural shift in financing. Such a shift induces new challenges for the players of the healthcare system’s game.
The risk incurred by any given player temporarily rises; new transaction costs appear, both in negotiation of
contracts, and in litigation. If we maintain the assumption that financial flows Fk, composing the total health
expenditure FH, are rigorously heterogeneous in their efficiency and pace of change, it is to assume that the
greater is the magnitude of change in healthcare expenditure, the greater is the corresponding structural shift,
and, consequently, the greater are the transaction costs of change. Henceforth, the elasticity dβH/dFH of marginal
change in healthcare quality to marginal change in healthcare expenditures is inversely proportional to the
magnitude of marginal change in healthcare expenditure. Thus, that inversely proportional relationship is not
linear. Moreover, as said transaction costs are not predictable a priori, because of the complex nature of social

12
games, marginal change in healthcare quality is not linearly predictable on the grounds of known marginal
change in healthcare expenditures.
It is further assumed, given all the preceding considerations, that elasticity dβH/dFH is essentially heterogeneous
among countries, and that any given country’s healthcare system is characterized by its individual, comparative
efficiency in using marginal change in healthcare financing to improve healthcare quality, in the lines of the
Ricardian comparative advantage. In the given set of countries, the elasticity of marginal change dβH in
healthcare quality, to marginal change dFH in healthcare expenditure is bounded-Pareto-distributed over the
marginal change in healthcare expenditure, as in equation (6). Consequently, marginal change dβH in healthcare
quality is quasi-bounded-Pareto-distributed over the marginal change in healthcare expenditure, as in equation
(7).
!"!
!"!
=!!"#
!!"!
!!!1
1!!"#
!"#
! (6)
!"! !"! =!!"#
!!"!
!!!1
1!!"#
!"#
!×
1
!"!
=!!"#
!!"!
!!!2
1!!"#
!"#
! (7)
Parameters ‘Min’, and ‘Max’ mean respectively, the minimal, and the maximal, marginal change in healthcare
quality, rationally conceivable for the given healthcare system. The parameter λ is the coefficient of shape in the
Pareto distribution; in this case, it is a general coefficient of elasticity.
Assuming Pareto distribution among countries follows twofold logic. Firstly, and consistently with Chisholm
and Evans’s (Chisholm, Evans 2010) findings, it means that in the global set of national healthcare systems,
there are a few very specific cases, which can be called “champions”, but the great majority achieves rather a
low performance. Secondly, it is a kind of fractal thinking: if within the given country accessibility of healthcare
is Pareto-distributed over social status, countries are Pareto-distributed as for their overall performance too.
13
3. Empirical evidence – validation of the model and additional
insight
Empirical research, conducted by the author, had two goals, namely validating the model introduced in the
previous chapter, and providing additional insights into the issue of healthcare systems’ efficiency. Thus, the
model has been considered as a set of hypotheses to validate, and serving for exploration.
For that purpose, econometric analysis had been carried out, accompanied by qualitative case studies of those
countries, which seem particularly interesting given their quantitative performance in the lines of the model. In
econometric analysis, on the grounds of fata provided by the World Health Organisation (WHO 201144), a set of
N = 189 countries has been used, with the exclusion of Zimbabwe, Somalia, and Democratic People's Republic
of Korea (fault of reliable data). Firstly, and somehow preliminarily, the author repeated the analysis performed
by the previously cited Chisholm and Evans (Chisholm, Evans 2010), namely to test the hypothesis of
logarithmic, regression function linking total healthcare expenses per capita, and life expectancy, at the country
level, with decreasing, and positive elasticity of life expectancy to expenses. The test was made with the 2008
data (Chisholm and Evans used 2006 data). The OLS regression of life expectancy to the per capita health
expenditure, with the 2008 data, gave a logarithmic function of y = 5,3363ln(x) + 36,846, with R² = 0,61936,
and the correlation significant at α = 0,05. The Graph 1, in Appendix, shows a visualisation very much like that
presented by Chisholm and Evans. See also Table 1, in Appendix, for synthetic results of both that step of
econometric analysis, and the further ones, discussed below. The results are consistent with those obtained by
Chisholm and Evans. The hypothesis of cross sectional, positive and decreasing elasticity of life expectancy to
health spending, seems to be quite robust. That preliminary step done, four indexes of marginal change, over
2000 – 2008, computed as the ratio of the 2008 value divided by the 2000 value, have been construed, and
attributed to variables to the model, namely:
a) The index of marginal change in life expectancy, attributed, consistently with the literature, to the
marginal change in healthcare quality dβH. In further discussion of empirical findings that index will be
called dβH.
b) The index of marginal change in total healthcare expenditures per capita, in US$ PPP, attributed to the
marginal change in healthcare expenditures dFH. In further discussion of empirical findings that index
will be called dFH.
44 World Health Organisation, 2011, World Health Statistics
14
c) The indexes of marginal change in, respectively, public, and private healthcare expenditures per capita,
in US$ PPP. These two have been considered as sub – streams in the overall financial flow of dFH, and
are called, in further discussion, respectively dFpl, and dFpr.
Those four simple indexes served to compute further, composite two. Firstly, the ratio dβH/dFH has been
computed for each country and is considered, in further discussion, as the elasticity of marginal change in
healthcare quality to marginal change in healthcare expenditures. In the lines of the model, this is the principal
measure of dynamic (i.e. marginal) efficiency of healthcare systems. Secondly, the difference between dFpl, and
dFpr has been computed, and is called, in further discussion, the index of handover from private to public, or dFpr
→pl = dFpl - dFpr. That composite index has been considered, in turn, as a measure of structural change, as in
equation (5) of the model. It is to be kept in mind that said index is grounded in values expressed in PPP dollars.
Thus, the structural shift may take place not only through changes in nominal expenses, but also though
changing prices, consistently with equation (2) of the model. Table 2, in the Appendix, presents the full list of
countries studied in econometric analysis with the values of said indexes. The list is sorted according to the value
of dβH/dFH, which is viewed by the author as the most important variable of the model.
Regression analysis, using the OLS method, has been run, with dβH, and dFH substituted to their theoretical
counterparts in equations (6), and (7) of the model. For both equations, robust empirical regression functions
have been obtained, significant at α = 0,001, with R2 = 0,99248 for the equation (6), and R2 = 0,85708 for the
equation (7). In both cases these levels of accuracy have been reached with 0 < λ < 0,1. Additionally, in order to
provide indirect evidence to equation (5), the handover index dFpr→pl = dFpl - dFpr has been substituted to dFH in
equation (6). The resulting regression function, significant at α = 0,001, gave an accuracy of R2 = 0,9679, with 0
< λ < 0,1.
Summing up, econometric analysis has provided robust, empirical proof to the model. The next step was
qualitative research, particularly oriented on the general question of transaction costs generated in financing
healthcare. Before a more in-depth study of selected cases is introduced, empirical distributions of the two
composite indexes, namely that of dβH/dFH elasticity index, and that of dFpr→pl = dFpl – dFpr handover index, are
to discuss. On the whole, dβH/dFH is distributed slightly more tightly than the normal curve, with a mean of
0,63917, a standard deviation σ = 0,245060889, a kurtosis K = 15,85482803, and skewness S = 2,819363487.
The rather skimpy tails of that empirical distribution (so the countries beyond one standard deviation distance
from the mean) contain, respectively, 20 countries on the left side, 18 on the right, and 152 countries within one
standard deviation from the mean. Practically all the developed countries, US included, are in the centre of that

15
distribution, with moderate elasticity of dβH to dFH. The nominator of the elasticity index, namely dβH,
represented by marginal change in life expectancy, is distributed fairly evenly. The mean value of dβH in the left
tail of dβH/dFH is 1,042243942; in the centre, it is 1,039307331, and 1,035508401 in the right tail. On the other
hand, the denominator dFH is distributed fairly less evenly. The mean value in the left tail of dβH/dFH is
3,219046171, with 1,743269702 in the centre, and 0,961831987. Summing up, and well in the lines of the
model, cross – sectional disparity of the dβH/dFH, elasticity index results mostly from disparities in marginal
healthcare expenditures. The right tail countries, so the “champions” of dynamic dβH/dFH elasticity (Saudi
Arabia, Mauritania, El Salvador, Uruguay, Seychelles, United Arab Emirates, Liberia, Haiti, Bolivia, Papua New
Guinea, Oman, Paraguay, Brunei Darussalam, Marshall Islands, Nauru, Syrian Arab Republic, Eritrea, Sao
Tome and Principe) are mostly small economies, with populations hardly exceeding that of London in UK. It
could indicate that dynamic efficiency in using healthcare expenditures strongly depends on the demographically
defined size of the given healthcare system. Three categories of countries appear in that right tail of dβH/dFH.
Firstly, it is the category of islander republics (Marshall Islands, Nauru, and Sao Tome and Principe),
representative for small populations, with healthcare systems strongly oriented on serving tourists. Secondly,
Haiti, Eritrea, and Mauritania could be considered as representative for extremely underfinanced healthcare
systems, doing extremely well in dynamic terms, although remaining at a very low level of life expectancy.
These are cases illustrative for the “ambitious poor” paradigm. On the other hand, countries like El Salvador,
Uruguay, Liberia, Bolivia, Papua New Guinea, and Paraguay are representative for developing, and emerging
economies, consuming a part of their economic growth for the improvement of healthcare quality.
The previously mentioned dFpr→pl handover index, whilst having almost the same explanatory power regarding
the distribution of dβH/dFH, than the strictly spoken marginal change in healthcare expenditures, displays
meaningful regularities. In the total set of n = 189 countries, the most frequently encountered pattern of change,
to be observed in 113 cases, is that handover from private to public sector, at the detriment of the private i.e. dFpr
→pl > 0, dFpl > 1, and dFpr < 1. Average elasticity dβH/dFH, in that subset, is of 0,591379669. At the second place,
as for frequency, is the pattern of dFpr→pl > 0, dFpl > dFpr > 1, i.e. that of public expenses growing faster than the
private ones, both displaying real, marginal increase. This subset encompasses 58 countries, and their average
elasticity dβH/dFH is of 0,601201381. The 19 remaining countries present disparate profiles, possible to group
into three patterns of handover, namely:
a) Handover from public to private, decrease in both; very high average dβH/dFH elasticity (dβH/dFH =
1,583226356); 3 countries (Paraguay, Nauru, Sao Tome and Principe).
16
b) Handover from public to private, decrease in public, increase in private; high average dβH/dFH elasticity
(dβH/dFH = 1,126221206); 10 countries (Côte d'Ivoire, Mauritania, United Arab Emirates, Haiti, Papua
New Guinea, Oman, Brunei Darussalam, Marshall Islands, Syrian Arab Republic, Eritrea).
c) Handover from public to private, increase in private greater than in public; moderate average dβH/dFH
elasticity (dβH/dFH = 0,622367999); 6 countries (Myanmar, Lao People's Democratic Republic,
Philippines, Grenada, Turkmenistan, Kenya).
Gradual transfer of healthcare financing from the private sector to the public one seems to be the mainstream of
institutional change in national healthcare systems. Studying said national idiosyncrasies should specifically
address the issue of “public – private” proportions, and their mutual shift, in the given healthcare system.
A more profound study of institutional arrangements in selected cases, picked at various levels of dβH/dFH
elasticity (Liberia, Eritrea, El Salvador, Uruguay, Colombia, Kenya, Poland, Italy) has been conducted, with its
results summarized in the paragraphs that follow.
El Salvador (pop. 6,2 million) belongs to the category of “champions” as for the dβH/dFH elasticity, with
dβH/dFH = 0,90314. The growth of healthcare expenditures was quite moderate, namely dFH = 1,138888889,
falling into the first quartile of that indicator. On the other hand, the growth of life expectancy was the median of
the whole n = 189 set, namely dβH = 1,02857. As for the structural handover, the country belongs to the
prevailing category of healthcare systems switching from private to public expenses, at the detriment of the
former (dFpr→pl = 0,73612; dFpl = 1,49693; dFpr = 0,76082. Nevertheless, the government expenditure on
healthcare fell from 7,7% of the GDP in 2002, to 6,1% in 2008. Hence, the shift from private to public had taken
place mostly due to economic growth, rather than real expansion of the public sector. According to a World
Bank report dating from 2008 (World Bank 200845), so from the end of the period studied, the Salvadorian
government had had good achievements both in stimulating economic growth, and in healing the fiscal situation.
Additionally, poverty had had declined and the overall social situation had had improved. A Health Sector Fund
was created to improve health coverage, and is funded by excise taxes on cigarettes, beer, alcoholic beverages,
and guns. According to the World Bank report on health reforms in Central America (World Bank 200746), a
significant cornerstone for Salvadorian health reforms was the Development Strategic Plan launched by the
Ministry of Health and Social Action in 2001. It focused on improving the efficiency of public healthcare
governance through decentralisation. Departmental management units were replaces with 28 health district units,
45 World Bank, 2008, International Bank for Reconstruction and Development and International Finance Corporation Progress Report on The Country Assistance Strategy for the Republic of El Salvador, February the 1st 46 World Bank, 2007, Key Issues in Central America Health Reforms Diagnosis and Strategic Implications (In Two Volumes) Volume II:
Main Report, March 8, Human Development Sector Management Unit Latin America and the Caribbean Region, Report No. 36426-LAC
17
or SIBASI, empowered to organise and staff public healthcare in their respective areas, which included
procurement and resource allocation. The SIBASI introduced a system of performance-based contracts with
healthcare providers, coupled with a system of community participation mechanisms. In 2005, the Salvadorian
government enacted the SIBASI law, according to which the healthcare sector management of each province had
been split between the Regional Directorate, and the SIBASI. The former had become a supervising unit,
coordinating SIBASI with hospitals. The latter keep their role in assuring primary healthcare at the local scale.
That law enacted, the initial autonomy of SIBASI had significantly decreased, shifting most of the actual
decisional power back to the ministry. On the whole, the SIBASI seem to have had been a good manner to
activate the mutual cooperation between the central governments, and the local ones, in the domain of
healthcare.
According to the most recent health profile, published by the WHO about El Salvador, available at
www.who.int 47 , the Salvadorian healthcare system is characterized, in comparison to the regional (i.e.
Americas48) average, by:
a) Relatively low income per capita, and low healthcare expenditures per capita
b) Good performance as for children immunisation, and tuberculosis treatment
c) Poor performance as for the density of health workforce per 10 000 inhabitants, and as for the resulting
availability of healthcare.
Uruguay (pop. 3,2 million), another South American country among the countries in the right tail of dynamic
efficiency, displays an elasticity slightly above that at El Salvador, namely dβH/dFH = 0,92975. The growth of
healthcare expenditures was even lower than on the previous case (dFH = 1,089900111), with also a lower
growth of life expectancy (dβH = 1,01333). The structural handover was of the same kind than in El Salvador,
i.e. a shift from private to public expenses, with the private ones decreasing (dFpr→pl = 0,39184; dFpl = 1,25813;
dFpr = 0,86629).
During the past decade, Uruguay had been facing a severe economic crisis. Among others, the poverty rate
increased from 15.3% in 2001 to 32.1% in 2004. In 2000, curiously enough, Uruguay was close to the world
record as for the percentage of GDP spent on healthcare, namely 11,2%, with the major part of that spent by the
government (54,6%). In 2008, the proportion to GDP fell slightly to 7,8%, and the share of public expenses grew
to 63,1%. Public healthcare sector, just as all the public sector in Urugay, has been struggling with a heavy
47 Wherever reference is made to www.who.int, it means the latest country profile available at the WHO’s website. Most profiles have been last updated in April, 2011. 48 The “Americas” regional average in WHO statistics encompasses United States and Canada, which drives said average quite high.
18
burden of debt, mostly due to the strong pressure on physicians’ wages, overlapping responsibilities in the
institutional structure, and low pressure on efficiency. In comparison to its region, namely the Americas,
Uruguay does really fine, above the regional average, according to most WHO criteria, especially as for
physicians’ density per 10 000 inhabitants (almost twice the regional average) (www.who.int; WHO 201149;
World Bank 200550).
Liberia (pop. 3,4 million), an African “champion” in dynamic efficiency of healthcare systems, displays an
elasticity of dβH/dFH = 0,94957, with a moderate growth of healthcare expenditures (dFH = 1,179487179), and a
very high, fourth-quartile growth of life expectancy (dβH = 1,12). The structural handover is the typical one, i.e.
a shift from private to public expenses, with the private ones decreasing, only in the Liberian case that shift is
rather a leap than a walk (dFpr→pl = 2,02821; dFpl = 2,5; dFpr = 0,47179). Liberia was a country rising from the
ashes during the period of observation, i.e. from 2000 to 2008 (World Bank 200751). Two, consecutive civil wars
left Liberia with virtually non-existent healthcare systems, and a life expectancy of some 50 years. Any increase
in healthcare expenditure meant creating the healthcare system from scrap, starting with giving elementary tools
for action to the Ministry of Health and Social Welfare. The institutional change that had taken place in Liberia
between 2000 and 2008, and, in the same time, the toughest institutional challenge consisted in passing from a
system of emergency relief (so from a bundle of short-term humanitarian projects) to long-term development
programmes. According to the current WHO information (www.who.int), in comparison to the African average,
Liberia does quite well in children immunisation, antenatal care, birth attendance by skilled personnel, and
tuberculosis treatment. However, the general lack of human resources in healthcare remains a great weakness of
the national healthcare systems, which can be illustrated by the density of physicians per 10 000 inhabitants,
about 23 times lower than the regional average.
Eritrea (pop. 3,5 million), another African country, holding the second place in the overall dβH/dFH ranking, with
dβH/dFH = 1,86339, is a peculiar case. Whilst displaying quite a good performance in increasing life expectancy
(dβH = 1,08197), Eritrea actually decreased its overall healthcare expenditure per capita (dFH = 0,580645161),
and shifted its healthcare system from public to private, with the private sector growing at the expense of the
public (dFpr→pl = -0,55538; dFpl = 0,53333; dFpr = 1,08871). Eritrea went against the mainstream of structural
change in the world, and did it with some success, so to say. However, that change took place in specific
conditions: Eritrea has been shrinking demographically: from 4,1 million people in 2002, the population
49 World Health Organisation, 2011, World Health Statistics 50 World Bank, 2005, International Bank For Reconstruction and Development, Country Assistance Strategy for The Oriental Republic of Uruguay, for The Period FY05 – FY10, May the 10th, Report No. 31804-UY 51 World Bank, 2007, Health Systems Reconstruction in Liberia, Project Information Document
19
descended to 3,45 million in 2007. According to the World Bank (World Bank 200452), the Eritrean government
made healthcare an absolute priority, which took place in an environment strongly marked by communicable and
preventable diseases, HIV among them. At the beginning of the period studied, i.e. in 2000, some 70% of the
population were reported to have access to primary healthcare at within 10 km from their homes. According to
the WHO latest brief (www.who.int), Eritrea has successfully dealt with all the major communicable diseases
(Poliomyelitis, Measles, Diphtheria, Tetanus, and Whooping Cough). Compared to the regional, African
average, Eritrea does exceptionally well as for children immunisation, but quite poorly as for medical assistance
to women (i.e. contraceptive prevalence, and antenatal care), and very poorly as for the density of physicians per
10 000 inhabitants (22% of the regional average). The quality of domestic, medical labour force is, by the way,
another issue: in 1999, 45% of physicians employed by the Ministry of Health were expatriates. The observed
expansion of the private healthcare sector in Eritrea seems to result from two factors (World Bank 2004). Firstly,
Eritrean physicians tend to create for themselves a kind of “mirror” jobs in the private sector, in order to increase
their wages. Secondly, expansion of the private sector in healthcare seems to correspond to the quick increase in
the variety of drugs available in the Eritrean market, with the resulting increase in sales of medicines financed
partly or totally out of the patient’s own pocket.
Colombia (pop. 43,9 million) belongs to the category of average performance in terms of dβH/dFH elasticity,
displaying an important increase in healthcare expenditures per capita, and a reasonably good improvement of
life expectancy (dβH/dFH = 0,76924; dβH = 1,04110; dFH = 1,353403141). The structural change is typical, i.e.
there is a shift from private to public in healthcare financing, private expenses decreasing (dFpr→pl = 0,44093;
dFpl = 1,40453; dFpr = 0,96360). According to the World Bank (World Bank 201153), and to the WHO
(www.who.int), Colombia has achieved quite a good progress in healthcare quality, assuring a reasonably good
level of healthcare, with two, particularly visible weaknesses of its healthcare system. Firstly, said system seems
to be overgrown in bureaucratic terms, with many institutions and programmes overlapping in competences and
targets, and a relatively low real pressure on efficiency. Secondly, environmental risk factors are a major issue,
especially at the outskirts of big cities.
Kenya (pop. 37,2 million), close to Colombia in the dynamic efficiency ranking (dβH/dFH = 0,79125), displays a
good performance in marginal life expectancy (dβH = 1,11111), and an important growth of healthcare
expenditures per capita (dFH = 1,404255319). Kenya is also one of the rare countries, where the structural shift
52 World Bank, 2004, The Health Sector in Eritrea, A World Bank Country Study, Report no. 29793 53 World Bank, 2011, International Bank for Reconstruction and Development and International Finance Corporation, Country Patrnership
Strategy for The Republic of Colombia, for The Period FY2012 – 2016, Report No. 60620 - CO
20
over 2000 – 2008 went from public to private, with both sectors growing (dFpr→pl = -0,08587; dFpl = 1,14286;
dFpr = 1,22872). Reports published by both the World Bank, and the WHO (www.who.int ; World Bank 201054)
suggest that over 2000 – 2008 Kenya went through turbulent changes. Since 1993 until 2003, the country had
gone definitely down as for health indicators, between 2003 and 2007, it was a slow recovery, and the period of
2007 – 2008 meant another deterioration. The Ministry of Health is strongly marked by corruption and nepotism,
which makes the overall reliability and accountability of the public healthcare system, still dominant, very
problematic. Governance seems to be the biggest Kenyan problem in healthcare, which has a negative impact on
the efficiency of the healthcare infrastructure, otherwise quite good in comparison to the regional average.
The two case studies that follow, namely Italy, and Poland are those of European countries, falling into the
centre of the dβH/dFH distribution, within one standard deviation from average. Italy (pop. 58,8 million), the best
of the three as for the dβH/dFH elasticity, is close to Colombia as for the overall dynamics (dβH/dFH = 0,75506;
dβH = 1,03797; dFH = 1,374697043), and presents the same pattern of structural change, healthcare expenditures
shifting from private to public, private expenses decreasing (dFpr→pl = 0,49618; dFpl = 1,44652; dFpr = 0,95035).
The WHO data (www.who.int) suggests that the undeniable growth of healthcare expenses per capita in Italy did
not have any significant influence upon the main factors of life expectancy, like, for example children mortality
and children immunisation. On the other hand, Italy has a very dense medical infrastructure, much denser that
the European, regional average. Healthcare expenditures, having had climbed from 7,9% of the GDP in 1990
Poland (pop. 38 million), whilst also in the centre of the dβH/dFH empirical distribution, displays a much poorer
performance, especially marked by a huge leap in healthcare expenditure (dβH/dFH = 0,47190; dβH = 1,02703;
dFH = 2,176369863). Structural change in Poland is also that of healthcare expenses shifting from private to
public, the shift being quite significant, and private expenses still growing, however (dFpr→pl = 1,05303; dFpl =
2,09291; dFpr = 1,03988).
Case studies allow formulating some general observations. Firstly, size matters for efficiency, and its influence is
inversely proportional. The bigger is the given country, the less chances it has to be highly efficient in
transmuting marginal healthcare expenses into marginal healthcare quality. Estimating the issue quite prudently,
some 5 million people seem to be the critical size for a healthcare system, as for its efficiency. Beyond that,
decentralisation becomes an imperative, and that is the second general observation: decentralisation matters. The
more decentralised in the healthcare system, the better is its dynamic performance. As in has been already
pointed out, small healthcare systems seem to be more manageable than the big ones. Thirdly, the structural shift
54 World Bank, 2010, Project Appraisal Document on a Proposed Credit […] to The Republic of Kenya for A Health Sector Support Project,
Report No. 53988-KE
21
dFpr→pl, whilst being inversely proportional to the dβH/dFH, consistently with the model, plays various roles,
depending on its underlying processes. In most countries, that structural shift is rather evolutionary, and caused
by two, main, clearly counterproductive phenomena: a) the relatively stronger pressure on wages in publicly
financed healthcare b) corruption connected to opportunistic behaviour in public procurement. On the other
hand, in some “champion” countries as for the dβH/dFH, elasticity (El Salvador, Uruguay, Liberia, Eritrea), that
structural shift is connected either to rapid restructuration or rapid reconstruction of the healthcare system. Such
“revolutionary” processes seem to be very productive possibly because they allow neither of the two previously
mentioned counterproductive mechanisms. Not every systemic restructuration conveys so high an efficiency.
The case of Poland is illustrative for that: between 2000 and 2008 the national healthcare system went through a
profound restructuration, and decentralisation, performance – based contracts included, but the bottom line of
these changes is a huge increase in public spending on healthcare, and just a moderate increase in healthcare
quality. Most obviously, Polish reforms were just an institutionalisation of the otherwise significant pressure on
wages in the healthcare sector, and an opportunity to develop new patterns of opportunistic behaviour in public
procurement.
The issue of “revolutionary” changes introduces another question, namely that of sustainability. Countries with
the highest dβH/dFH derive their good performance mostly from changes, which are not sustainable on the long
run. As decentralisation comes, no government can decentralise forever. Decentralisation has to stop at a certain
level. The Salvadorian case shows that, the political context taken into account, decentralisation can stop, and
even reverse, quite quickly. Similarly, the Uruguayan case of expenditure rationalisation calls for commenting
that you cannot rationalise infinitely: it is a process that has to stop at a certain point. The African “champion”
cases, namely Liberia and Eritrea, are representative for a specific type of institutional change. It is the passage
from separate, short – term project of humanitarian aid, to institutionally established systems, which, in both
cases, has brought straightforwardly a leap, in terms of the dβH/dFH efficiency. The same kind of remark is to
make, as for sustainability: you cannot establish forever. Once the basic institutional framework of the system is
in place, the high marginal efficiency resulting from the process of establishing is gone.
Case studies also seem to prove that the pattern of highly efficient, institutional changes in national healthcare
systems is independent from the level of wealth. The four “champion” cases studied display great disparities in
terms of income per capita, the mechanism of achieving a good dβH/dFH result worked quite similarly, though.
As observations from case studies are compared to econometric findings, a paradox arises. On one hand, its has
been robustly proven that the greater is the magnitude of change in healthcare expenditure, and the greater is the
22
corresponding structural shift in financing, the greater are the transaction costs of change, and, henceforth, the
lower is the elasticity dβH/dFH of marginal change in healthcare quality to marginal change in healthcare
expenditures. On the other hand, qualitative insight into individual cases of national healthcare systems brought
some of a contradiction: quick, and profound institutional changes are much more efficient than incremental
ones. The former generate efficiency gains, the latter seem to generate mostly costs. The paradox seems to have
a twofold explanation. The Pareto distribution essentially serves to part the “champions” of the given social
system from the “average performers”. An underlying assumption, present, by the way, in Pareto’s “Cours
d’economie politique” is that the “champions” are highly idiosyncratic in comparison to the rest of the
population. Countries grouped in the centre, and in the left tail of the dβH/dFH empirical distribution, are mostly
representative for incremental growth of healthcare expenditures; even institutional reforms, to notice in many
cases, prove to be quite superficial. That’s the general rule of the model: growth of expenses is mostly
unproductive. Conversely, the “champion” countries from the right tail of the dβH/dFH empirical distribution are
representative for profound institutional reforms, where deep structural shift in expenses did not cause a
significant increase of the latter, and, moreover, brought significant gain in healthcare quality.
4. Conclusion
The research introduced in the present paper provided additional, robust evidence to some of the findings
contained in the World Health Organisation report about the financing of healthcare systems (WHO 201055). It
also brought significant, further insights into the matter of efficiency in national healthcare systems. Firstly, it
has been robustly proven that the dynamic, comparative efficiency of national healthcare systems is strongly
linked to the magnitude, and to the underlying mechanism of marginal changes in healthcare expenditures per
capita. In the great majority of countries reporting to the WHO, healthcare expenditures tend to grow
significantly, especially in the public sector, without real correspondence to the growth of healthcare quality.
Tested with the model introduced in the present paper, most institutional reforms in the healthcare sector,
declared by many countries, from the sample studied, reveal to be superficial, without real outcomes in terms of
efficiency. Moreover, most national healthcare systems seem to be essentially Keynesian, with the quality of
healthcare considered as actually unobservable, and the supply of healthcare goods being put to equality with the
infrastructure in hand. Furthermore, especially in big countries, that Keynesian trait seems to bring a perverse
kind of the Keynes’s “multiplier effect”: the expected value of public procurement for healthcare goods gives
55 WHO, Health Systems Financing. The path to universal coverage, World Health Report, 2010
23
incentives to invest more in infrastructure, which generates, eventually, further increase in public contracts,
healthcare quality being still of secondary importance in the whole process. Some clearly separate cases emerge,
among countries displaying the highest, dynamic efficiency in transforming marginal healthcare expenditures
into marginal healthcare quality. They are small economies, displaying real, deep institutional changes,
combining decentralisation with a profound review of contractual patterns. There, structural shifts in healthcare
financing really seem to work. Unfortunately, such highly efficient patterns of institutional change in national
healthcare systems are essentially not sustainable, as they are grounded in processes clearly limited in time.
At this point, it is time to argue openly with the authors of the previously cited WHO report about healthcare
financing. The main thesis of the report, namely that significant shift of healthcare expenses towards public,
pooled funds, seems to be quite doubtful. Systematic changes of that kind are counterproductive: they bring
more in terms of wages for healthcare personnel, than in terms of patients’ life expectancy. Moreover, most of
the so-called “reforms”, reported by the WHO in many countries, are not real reforms; they consist in an
otherwise logical accumulation of capital around the existing healthcare infrastructure, according to the
Keynesian paradigm. So comes the issue of idiosyncrasy among national healthcare systems. In a general rule,
and once more contrarily to the WHO theses, national healthcare systems are not as idiosyncratic, as they maybe
would like to appear. Their dynamic efficiency seems to obey to quite universal rules, with well observable
causalities. The few “champions” of efficiency are exceptional, indeed, in their achievements, but they are not
idiosyncratic as such. In other words, both the excellent, and the poor performance in the set of countries studies
are possible to explain on the grounds of a common set of hypotheses, contained in the model. That, in turn, is an
opening for research on the link between technological progress, and institutional change. Institutions that make
national healthcare systems are strongly connected to the current state-of-the-art, internationally recognised
medical practice. Putting it plainly, there are no thirty-six ways to run a system of emergency medical help, or a
system of children immunisation. There are internationally recognised standards for it, and they seem to be quite
an important factor of institutional convergence among national healthcare systems.
Getting to an even broader theoretical context, the research introduced in the present paper provides robust
evidence to all the partisans of fiscal conservatism. Healthcare is a schoolbook-like example of public good, and
its supply proves to be of quite a little efficiency, as financial outlays tend to grow. Institutional changes seem to
be much more effective than financial transfers, as drivers of improvement in healthcare quality.
24
References
1. Agrawal, A., Gibson, C., ed. 2001., Communities and the Environment: Ethnicity, Gender, and the
State in Community-Based Conservation. New Brunswick, NJ: Rutgers University Press
2. Aoki, M., 2007, Endogenizing Institutions and Institutional Changes, Stanford University, revised
version of an invited lecture at the 2005World Congress of the International Economic Association in
Morocco
3. Chisholm, D., Evans D.,B., 2010, Improving health system efficiency as a means of moving towards
universal coverage, World Health Report (2010) Background Paper, 28, World Health Organisation
4. Dummer, T., J., B., Cook, I., G., 2007, Exploring China's rural health crises: Processes and policy
implications, Health Policy, 83, pp. 1-16
5. Durairaj, V., D'Almeida, S., Kirigia, J., 2010, Ghana's approach to social health protection, World
Health Report (2010) Background Paper, 2, World Health Organisation
6. Durairaj, V., Murali Kannan, M., Gopalan, S.S.,, Jayalakshmi C., Clare, A., CSST, Shivalingiah, M.,
Sankara Sarma, P., 2010, Lessons learned from a community-based medisave experiment among rural
women in the Indian state of Karnataka, World Health Report (2010), Background Paper, 1, World
Health Organisation
7. Evans, D.,B., Tandon, A., Murray, C., J., M, Lauer, J., A., 2001, The comparative efficiency of national
health systems in producing health: and analysis of 191 countries, GPE Discussion Paper No. 29,
WHO; Geneva, Switzerland.
8. Falkingham, J., 2004, Poverty, out-of-pocket payments and access to health care: evidence from
Tajikistan, Social Science & Medicine, 58(2), pp. 247-258
9. Gakidou, E., Cowling, K., Lozano, R., Murray, C., 2010, Increased educational attainment and its effect
on child mortality in 175 countries between 1970 and 2009: a systematic analysis, The Lancet, 2010;
376(9745), pp. 959-74
10. Häkkinen, U., Joumard, I., 2007, Cross-Country Analysis of Efficiency in OECD Health Care Sectors:
Options for Research, OECD Economics Department, Working Papers, No. 554, OECD Publishing,
2007
25
11. Harsanyi, J.C., 1953, Cardinal Utility in Welfare Economics and in the Theory of Risk – Taking, The
Journal of Political Economy, vol. 61, issue 5, pp. 434 - 435
12. Harsanyi, J.C., 1966, A General Theory of Rational Behavior in Game Situations, Econometrica, vol.
34, no. 3, pp. 613 – 634
13. Harsanyi, J.C., 1967, Games With Incomplete Information Played by “Bayesian” Players. Part I: The
Basic Model, Management Science, vol. 14, no. 3, pp. 159 - 182
14. Harsanyi, J.C., 1968, Games With Incomplete Information Played by “Bayesian” Players. Part II:
Bayesian Equilibrium Points – Management Science, vol. 14, no. 5, pp. 320 - 334
15. Hodgson, G.,M., 2000, The Essence of Institutional Economics, Journal of Economic Issues, vol.
XXXIV, no. 2, June, pp. 317 - 329
16. Hodgson, G.,M., 2006, Institutional Economics, the Individual Actor and Institutional Change, For the
Alexander von Humboldt lecture at the University of Nijmegen, December the 5th
17. James, Ch., Savedoff, W., 2010, Risk Pooling and Redistribution in Healthcare: An Empirical Analysis
of Attitudes Toward Solidarity, World Health Report (2010), Background Paper ,5, World Health
Organisation
18. Joas, H., 1996, The Creativity of Action, Chicago: University of Chicago Press
19. Kawabata, K., Xu, K., Carrin, G., 2002, Preventing impoverishment through protection against
catastrophic health expenditure, Bulletin of the World Health Organization, 2002;80(8):612
20. Ke Xu, Saksena, P., Evans, D., B., 2010, Health Financing and Access to Effective Interventions,
World Health Report (2010), Background Paper, 8, World Health Organisation
21. Ke Xu, Saksena, P., Jowett, M., Indikadahena, Ch., Kutzin, J., Evans, D., B., 2010, Exploring the
thresholds of health expenditure for protection against financial risk, World Health Report (2010),
Background Paper, 19, World Health Organisation
22. Kilpinen, E., 2000, The Enormous Fly-Wheel of Society: Pragmatism’s Habitual Conception of Action
and Social Theory, Helsinki: University of Helsinki
23. Le Gargasson, J-B., Salome, B., 2010, The Role of Innovative Financing Mechanisms for Health,
World Health Report (2010), Background Paper, 12, World Health Organisation
24. Missoni, E., Solimano, G., 2010, Towards Universal Health Coverage: the Chilean experience, World
Health Report (2010) Background Paper, 4
26
25. Musgrove, P., Zeramdini, R., Carrin, G., 2002, Basic patterns in national health expenditure, Bull
World Health Organ;80(2):134-42
26. Nash, J.F., 1950, Equilibrium Points in n – Person Games – Proceedings of the National Academy of
Sciences of the United States of America, vol. 36, no.1, pp. 48 - 49
27. Nash, J.F., 1950, The Bargaining Problem, Econometrica, vol. 18, no.2, pp. 155 - 162
28. Nash, J.F., 1951, Non – Cooperative Games, The Annals of Mathematics, Second Series, vol. 54, issue
2, pp. 286 - 295
29. Nash, J.F., 1953, Two – Person Cooperative Games – Econometrica, vol. 21, issue 1, pp. 128 - 140
30. Ostrom, E., 2010, Beyond Markets and States: Polycentric Governance of Complex Economic Systems,
American Economic Review, 100, June 2010, pp. 1 - 33
31. Saksena, P., Fernandes Antunes, A., Ke Xu, Musango, L., Carrin, G., 2010, Impact of mutual health
insurance on access to health care and financial risk protection in Rwanda, World Health Report (2010),
Background Paper, 6.
32. Schlager, E., Ostrom, E.,. 1992, Property-Rights Regimes and Natural Resources: A Conceptual
Analysis, Land Economics, 68(3): 249–62
33. Searle, J., R., 1995, The Construction of Social Reality, London: Allen Lane
34. Selten, R., 1975, Reexamination of the perfectness concept for equilibrium points in extensive games -
Journal International Journal of Game Theory, Issue Volume 4, Number 1, reprint: Kuhn, H.W.,( ed. ),
Classics in Game Theory, Princeton University Press, 1997, pp. 317 – 354
35. Stenberg, K., Elovainio, R., Chisholm, D., Fuhr, D., Perucic, A-M., Rekve, D., Yurekli, A., 2010,
Responding to the challenge of resource mobilization - mechanisms for raising additional domestic
resources for health, World Health Report (2010) Background Paper, 13, World Health Organisation
36. Twomey, P., 1998, Reviving Veblenian Economic Psychology, Cambridge Journal of Economics, vol.
22, no. 4, July, pp. 433-48
37. Williamson, O.,E., 1975, Markets and hierarchies, Free Press, New York
38. Williamson, O.,E., 1985, The Economic Institutions of Capitalism: firms, markets, relational
contracting, Free Press, New York
39. Williamson, O.,E., 1991, Strategizing, economizing and economic organization, Strategic Management
Journal, no. 12, pp. 75 - 94
40. World Bank, 2004, The Health Sector in Eritrea, A World Bank Country Study, Report no. 29793
27
41. World Bank, 2005, International Bank For Reconstruction and Development, Country Assistance
Strategy for The Oriental Republic of Uruguay, for The Period FY05 – FY10, May the 10th, Report No.
31804-UY
42. World Bank, 2007, Health Systems Reconstruction in Liberia, Project Information Document
43. World Bank, 2007, Key Issues in Central America Health Reforms Diagnosis and Strategic
Implications (In Two Volumes) Volume II: Main Report, March 8, Human Development Sector
Management Unit Latin America and the Caribbean Region, Report No. 36426-LAC
44. World Bank, 2008, International Bank for Reconstruction and Development and International Finance
Corporation Progress Report on The Country Assistance Strategy for the Republic of El Salvador,
February the 1st
45. World Bank, 2010, Project Appraisal Document on a Proposed Credit […] to The Republic of Kenya
for A Health Sector Support Project, Report No. 53988-KE
46. World Bank, 2011, International Bank for Reconstruction and Development and International Finance
Corporation, Country Patrnership Strategy for The Republic of Colombia, for The Period FY2012 –
2016, Report No. 60620 - CO
47. World Health Organisation, 2010, Health Systems Financing. The path to universal coverage, World
Health Report
48. World Health Organisation, 2011, World Health Statistics
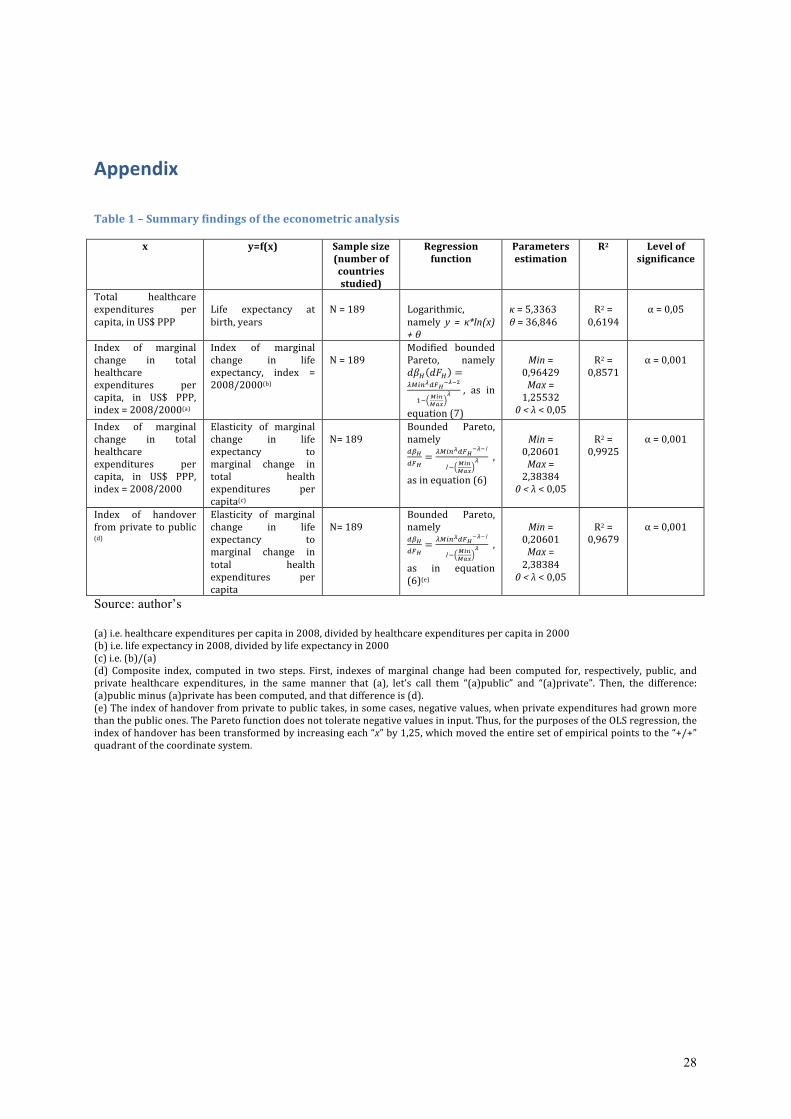
28
Appendix
Table 1 – Summary findings of the econometric analysis
x y=f(x) Sample size (number of countries studied)
Regression function
Parameters estimation
R2 Level of significance
Total healthcare expenditures per capita, in US$ PPP
Life expectancy at birth, years
N = 189
Logarithmic, namely y = κ*ln(x) + θ
κ = 5,3363 θ = 36,846
R2 = 0,6194
α = 0,05
Index of marginal change in total healthcare expenditures per capita, in US$ PPP, index = 2008/2000(a)
Index of marginal change in life expectancy, index = 2008/2000(b)
N = 189
Modified bounded Pareto, namely !"! !"! =
!!"#!!"!
!!!!
!!!"#
!"#
! , as in
equation (7)
Min = 0,96429 Max = 1,25532 0 < λ < 0,05
R2 = 0,8571
α = 0,001
Index of marginal change in total healthcare expenditures per capita, in US$ PPP, index = 2008/2000
Elasticity of marginal change in life expectancy to marginal change in total health expenditures per capita(c)
N= 189
Bounded Pareto, namely !"!
!"!
=!!"#
!!"!
!!!1
1!!"#
!"#
!,
as in equation (6)
Min = 0,20601 Max = 2,38384 0 < λ < 0,05
R2 = 0,9925
α = 0,001
Index of handover from private to public (d)
Elasticity of marginal change in life expectancy to marginal change in total health expenditures per capita
N= 189
Bounded Pareto, namely !"!
!"!
=!!"#
!!"!
!!!1
1!!"#
!"#
!,
as in equation (6)(e)
Min = 0,20601 Max = 2,38384 0 < λ < 0,05
R2 = 0,9679
α = 0,001
Source: author’s
(a) i.e. healthcare expenditures per capita in 2008, divided by healthcare expenditures per capita in 2000 (b) i.e. life expectancy in 2008, divided by life expectancy in 2000 (c) i.e. (b)/(a) (d) Composite index, computed in two steps. First, indexes of marginal change had been computed for, respectively, public, and private healthcare expenditures, in the same manner that (a), let’s call them “(a)public” and “(a)private”. Then, the difference: (a)public minus (a)private has been computed, and that difference is (d). (e) The index of handover from private to public takes, in some cases, negative values, when private expenditures had grown more than the public ones. The Pareto function does not tolerate negative values in input. Thus, for the purposes of the OLS regression, the index of handover has been transformed by increasing each “x” by 1,25, which moved the entire set of empirical points to the “+/+” quadrant of the coordinate system.
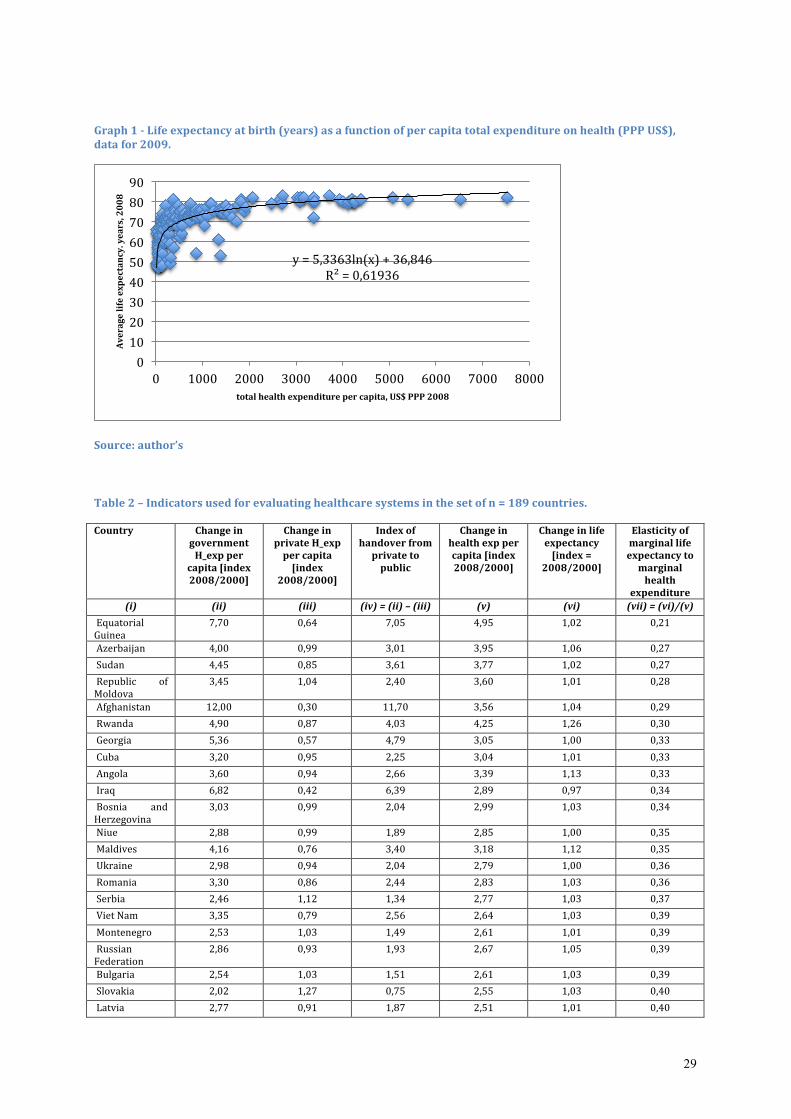
29
Graph 1 -‐ Life expectancy at birth (years) as a function of per capita total expenditure on health (PPP US$), data for 2009.
Source: author’s
Table 2 – Indicators used for evaluating healthcare systems in the set of n = 189 countries.
Country Change in government H_exp per
capita [index 2008/2000]
Change in private H_exp per capita [index
2008/2000]
Index of handover from private to public
Change in health exp per capita [index 2008/2000]
Change in life expectancy [index =
2008/2000]
Elasticity of marginal life expectancy to marginal health
expenditure
(i) (ii) (iii) (iv) = (ii) – (iii) (v) (vi) (vii) = (vi)/(v)
Equatorial Guinea
7,70 0,64 7,05 4,95 1,02 0,21
Azerbaijan 4,00 0,99 3,01 3,95 1,06 0,27
Sudan 4,45 0,85 3,61 3,77 1,02 0,27
Republic of Moldova
3,45 1,04 2,40 3,60 1,01 0,28
Afghanistan 12,00 0,30 11,70 3,56 1,04 0,29
Rwanda 4,90 0,87 4,03 4,25 1,26 0,30
Georgia 5,36 0,57 4,79 3,05 1,00 0,33
Cuba 3,20 0,95 2,25 3,04 1,01 0,33
Angola 3,60 0,94 2,66 3,39 1,13 0,33
Iraq 6,82 0,42 6,39 2,89 0,97 0,34
Bosnia and Herzegovina
3,03 0,99 2,04 2,99 1,03 0,34
Niue 2,88 0,99 1,89 2,85 1,00 0,35
Maldives 4,16 0,76 3,40 3,18 1,12 0,35
Ukraine 2,98 0,94 2,04 2,79 1,00 0,36
Romania 3,30 0,86 2,44 2,83 1,03 0,36
Serbia 2,46 1,12 1,34 2,77 1,03 0,37
Viet Nam 3,35 0,79 2,56 2,64 1,03 0,39
Montenegro 2,53 1,03 1,49 2,61 1,01 0,39
Russian Federation
2,86 0,93 1,93 2,67 1,05 0,39
Bulgaria 2,54 1,03 1,51 2,61 1,03 0,39
Slovakia 2,02 1,27 0,75 2,55 1,03 0,40
Latvia 2,77 0,91 1,87 2,51 1,01 0,40
y = 5,3363ln(x) + 36,846 R² = 0,61936
0
10
20
30
40
50
60
70
80
90
0 1000 2000 3000 4000 5000 6000 7000 8000
Average life expectancy. years, 2008
total health expenditure per capita, US$ PPP 2008
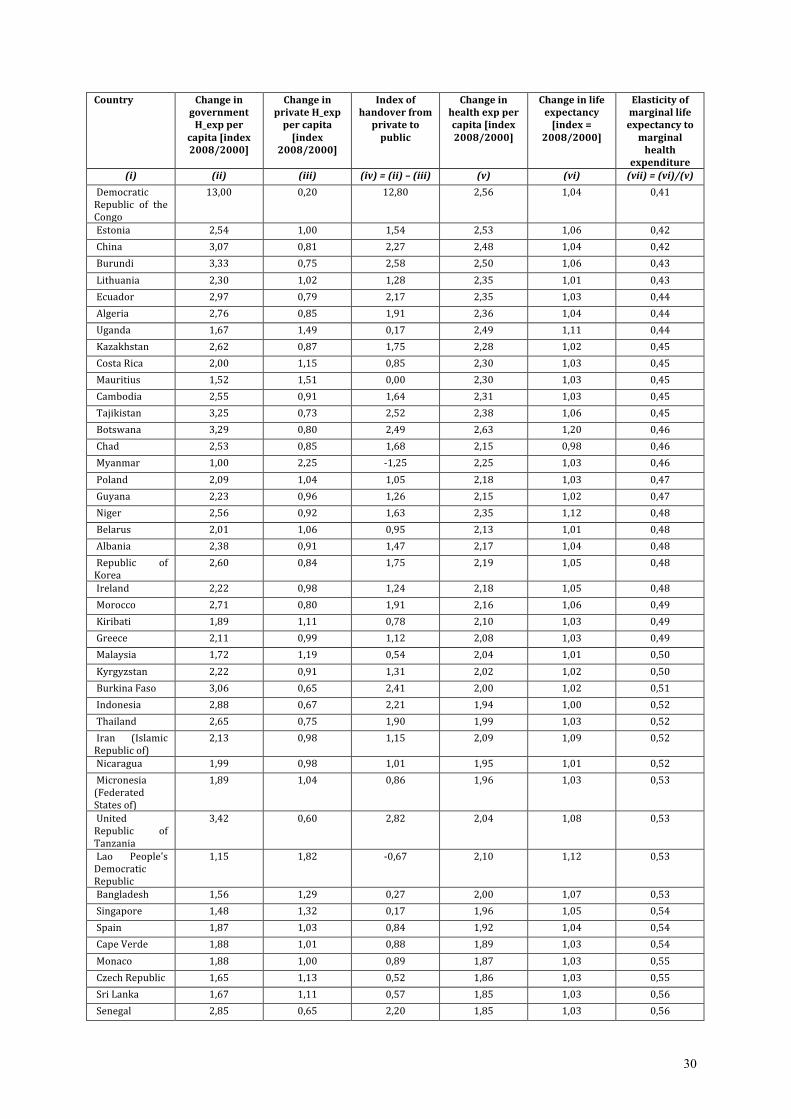
30
Country Change in government H_exp per
capita [index 2008/2000]
Change in private H_exp per capita
[index 2008/2000]
Index of handover from private to
public
Change in health exp per capita [index
2008/2000]
Change in life expectancy [index =
2008/2000]
Elasticity of marginal life expectancy to
marginal health
expenditure
(i) (ii) (iii) (iv) = (ii) – (iii) (v) (vi) (vii) = (vi)/(v)
Democratic Republic of the Congo
13,00 0,20 12,80 2,56 1,04 0,41
Estonia 2,54 1,00 1,54 2,53 1,06 0,42
China 3,07 0,81 2,27 2,48 1,04 0,42
Burundi 3,33 0,75 2,58 2,50 1,06 0,43
Lithuania 2,30 1,02 1,28 2,35 1,01 0,43
Ecuador 2,97 0,79 2,17 2,35 1,03 0,44
Algeria 2,76 0,85 1,91 2,36 1,04 0,44
Uganda 1,67 1,49 0,17 2,49 1,11 0,44
Kazakhstan 2,62 0,87 1,75 2,28 1,02 0,45
Costa Rica 2,00 1,15 0,85 2,30 1,03 0,45
Mauritius 1,52 1,51 0,00 2,30 1,03 0,45
Cambodia 2,55 0,91 1,64 2,31 1,03 0,45
Tajikistan 3,25 0,73 2,52 2,38 1,06 0,45
Botswana 3,29 0,80 2,49 2,63 1,20 0,46
Chad 2,53 0,85 1,68 2,15 0,98 0,46
Myanmar 1,00 2,25 -‐1,25 2,25 1,03 0,46
Poland 2,09 1,04 1,05 2,18 1,03 0,47
Guyana 2,23 0,96 1,26 2,15 1,02 0,47
Niger 2,56 0,92 1,63 2,35 1,12 0,48
Belarus 2,01 1,06 0,95 2,13 1,01 0,48
Albania 2,38 0,91 1,47 2,17 1,04 0,48
Republic of Korea
2,60 0,84 1,75 2,19 1,05 0,48
Ireland 2,22 0,98 1,24 2,18 1,05 0,48
Morocco 2,71 0,80 1,91 2,16 1,06 0,49
Kiribati 1,89 1,11 0,78 2,10 1,03 0,49
Greece 2,11 0,99 1,12 2,08 1,03 0,49
Malaysia 1,72 1,19 0,54 2,04 1,01 0,50
Kyrgyzstan 2,22 0,91 1,31 2,02 1,02 0,50
Burkina Faso 3,06 0,65 2,41 2,00 1,02 0,51
Indonesia 2,88 0,67 2,21 1,94 1,00 0,52
Thailand 2,65 0,75 1,90 1,99 1,03 0,52
Iran (Islamic Republic of)
2,13 0,98 1,15 2,09 1,09 0,52
Nicaragua 1,99 0,98 1,01 1,95 1,01 0,52
Micronesia (Federated States of)
1,89 1,04 0,86 1,96 1,03 0,53
United Republic of Tanzania
3,42 0,60 2,82 2,04 1,08 0,53
Lao People's Democratic Republic
1,15 1,82 -‐0,67 2,10 1,12 0,53
Bangladesh 1,56 1,29 0,27 2,00 1,07 0,53
Singapore 1,48 1,32 0,17 1,96 1,05 0,54
Spain 1,87 1,03 0,84 1,92 1,04 0,54
Cape Verde 1,88 1,01 0,88 1,89 1,03 0,54
Monaco 1,88 1,00 0,89 1,87 1,03 0,55
Czech Republic 1,65 1,13 0,52 1,86 1,03 0,55
Sri Lanka 1,67 1,11 0,57 1,85 1,03 0,56
Senegal 2,85 0,65 2,20 1,85 1,03 0,56
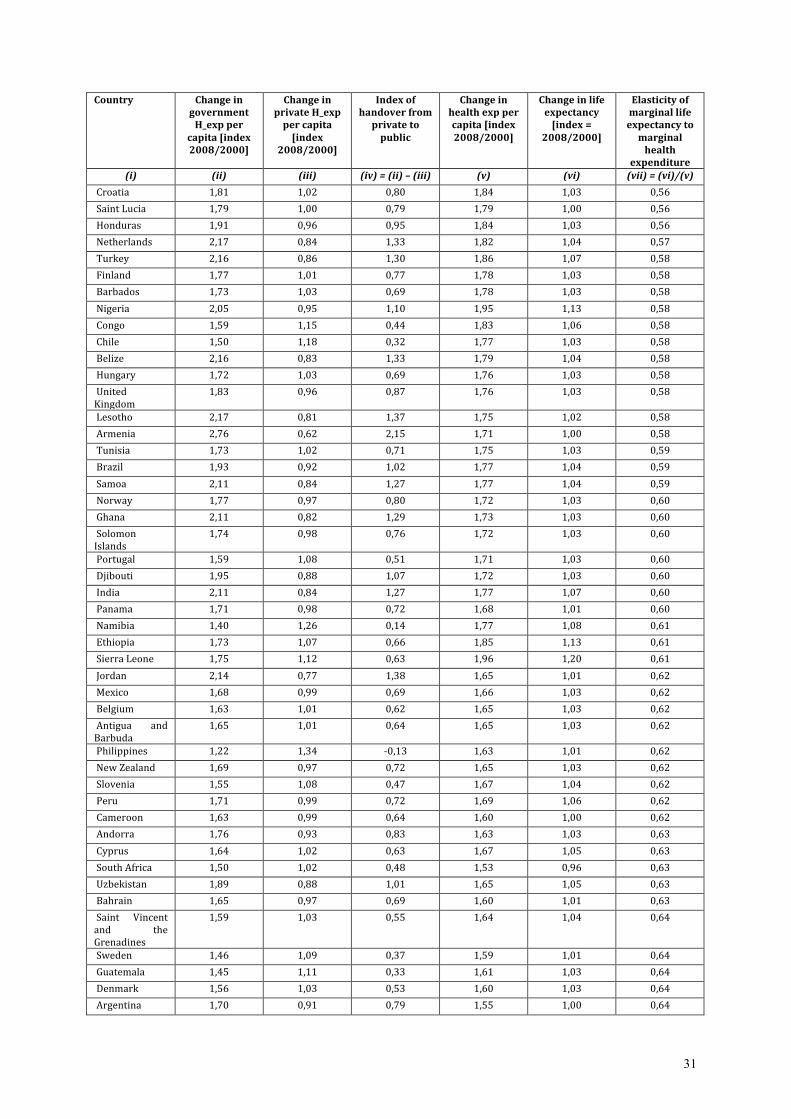
31
Country Change in government H_exp per
capita [index 2008/2000]
Change in private H_exp per capita
[index 2008/2000]
Index of handover from private to
public
Change in health exp per capita [index
2008/2000]
Change in life expectancy [index =
2008/2000]
Elasticity of marginal life expectancy to
marginal health
expenditure
(i) (ii) (iii) (iv) = (ii) – (iii) (v) (vi) (vii) = (vi)/(v)
Croatia 1,81 1,02 0,80 1,84 1,03 0,56
Saint Lucia 1,79 1,00 0,79 1,79 1,00 0,56
Honduras 1,91 0,96 0,95 1,84 1,03 0,56
Netherlands 2,17 0,84 1,33 1,82 1,04 0,57
Turkey 2,16 0,86 1,30 1,86 1,07 0,58
Finland 1,77 1,01 0,77 1,78 1,03 0,58
Barbados 1,73 1,03 0,69 1,78 1,03 0,58
Nigeria 2,05 0,95 1,10 1,95 1,13 0,58
Congo 1,59 1,15 0,44 1,83 1,06 0,58
Chile 1,50 1,18 0,32 1,77 1,03 0,58
Belize 2,16 0,83 1,33 1,79 1,04 0,58
Hungary 1,72 1,03 0,69 1,76 1,03 0,58
United Kingdom
1,83 0,96 0,87 1,76 1,03 0,58
Lesotho 2,17 0,81 1,37 1,75 1,02 0,58
Armenia 2,76 0,62 2,15 1,71 1,00 0,58
Tunisia 1,73 1,02 0,71 1,75 1,03 0,59
Brazil 1,93 0,92 1,02 1,77 1,04 0,59
Samoa 2,11 0,84 1,27 1,77 1,04 0,59
Norway 1,77 0,97 0,80 1,72 1,03 0,60
Ghana 2,11 0,82 1,29 1,73 1,03 0,60
Solomon Islands
1,74 0,98 0,76 1,72 1,03 0,60
Portugal 1,59 1,08 0,51 1,71 1,03 0,60
Djibouti 1,95 0,88 1,07 1,72 1,03 0,60
India 2,11 0,84 1,27 1,77 1,07 0,60
Panama 1,71 0,98 0,72 1,68 1,01 0,60
Namibia 1,40 1,26 0,14 1,77 1,08 0,61
Ethiopia 1,73 1,07 0,66 1,85 1,13 0,61
Sierra Leone 1,75 1,12 0,63 1,96 1,20 0,61
Jordan 2,14 0,77 1,38 1,65 1,01 0,62
Mexico 1,68 0,99 0,69 1,66 1,03 0,62
Belgium 1,63 1,01 0,62 1,65 1,03 0,62
Antigua and Barbuda
1,65 1,01 0,64 1,65 1,03 0,62
Philippines 1,22 1,34 -‐0,13 1,63 1,01 0,62
New Zealand 1,69 0,97 0,72 1,65 1,03 0,62
Slovenia 1,55 1,08 0,47 1,67 1,04 0,62
Peru 1,71 0,99 0,72 1,69 1,06 0,62
Cameroon 1,63 0,99 0,64 1,60 1,00 0,62
Andorra 1,76 0,93 0,83 1,63 1,03 0,63
Cyprus 1,64 1,02 0,63 1,67 1,05 0,63
South Africa 1,50 1,02 0,48 1,53 0,96 0,63
Uzbekistan 1,89 0,88 1,01 1,65 1,05 0,63
Bahrain 1,65 0,97 0,69 1,60 1,01 0,63
Saint Vincent and the Grenadines
1,59 1,03 0,55 1,64 1,04 0,64
Sweden 1,46 1,09 0,37 1,59 1,01 0,64
Guatemala 1,45 1,11 0,33 1,61 1,03 0,64
Denmark 1,56 1,03 0,53 1,60 1,03 0,64
Argentina 1,70 0,91 0,79 1,55 1,00 0,64

32
Country Change in government H_exp per
capita [index 2008/2000]
Change in private H_exp per capita
[index 2008/2000]
Index of handover from private to
public
Change in health exp per capita [index
2008/2000]
Change in life expectancy [index =
2008/2000]
Elasticity of marginal life expectancy to
marginal health
expenditure
(i) (ii) (iii) (iv) = (ii) – (iii) (v) (vi) (vii) = (vi)/(v)
Togo 1,31 1,24 0,06 1,63 1,05 0,65
Vanuatu 1,78 0,90 0,88 1,59 1,03 0,65
Dominican Republic
1,61 0,93 0,68 1,50 0,97 0,65
Dominica 1,39 1,10 0,29 1,54 1,00 0,65
Saint Kitts and Nevis
1,53 1,04 0,49 1,59 1,04 0,66
Grenada 1,10 1,40 -‐0,29 1,54 1,01 0,66
Bhutan 1,66 0,96 0,69 1,59 1,05 0,66
Canada 1,52 1,01 0,50 1,54 1,03 0,67
Timor-‐Leste 1,94 0,86 1,07 1,67 1,12 0,67
Turkmenistan 1,11 1,37 -‐0,26 1,51 1,02 0,67
Guinea-‐Bissau 1,60 0,97 0,63 1,55 1,04 0,67
United States of America
1,69 0,90 0,78 1,52 1,03 0,67
France 1,45 1,05 0,41 1,52 1,03 0,67
Suriname 1,54 1,00 0,53 1,54 1,04 0,68
Mozambique 1,53 0,98 0,54 1,50 1,02 0,68
Yemen 1,26 1,24 0,01 1,56 1,07 0,68
Comoros 1,71 0,88 0,84 1,50 1,03 0,69
Australia 1,45 1,02 0,43 1,48 1,03 0,69
Luxembourg 1,61 0,93 0,67 1,50 1,04 0,69
Madagascar 1,65 0,96 0,69 1,59 1,10 0,69
Switzerland 1,60 0,94 0,66 1,50 1,04 0,70
Kuwait 1,53 0,97 0,56 1,47 1,03 0,70
Germany 1,38 1,07 0,31 1,47 1,03 0,70
Zambia 1,96 0,83 1,13 1,63 1,14 0,70
Venezuela (Bolivarian Republic of)
1,57 0,92 0,64 1,45 1,01 0,70
Nepal 2,27 0,68 1,60 1,53 1,08 0,70
Austria 1,39 1,04 0,35 1,45 1,03 0,71
Malta 1,51 0,96 0,54 1,45 1,03 0,71
Swaziland 1,50 0,96 0,53 1,44 1,02 0,71
Mongolia 1,53 0,99 0,54 1,51 1,08 0,72
Japan 1,42 1,01 0,41 1,43 1,02 0,72
Guinea 1,60 0,91 0,69 1,45 1,04 0,72
Cook Islands 1,49 0,99 0,49 1,48 1,07 0,72
The former Yugoslav Republic of Macedonia
1,68 0,84 0,84 1,42 1,03 0,72
Libyan Arab Jamahiriya
1,72 0,81 0,91 1,40 1,01 0,73
Italy 1,45 0,95 0,50 1,37 1,04 0,76
Egypt 1,45 0,95 0,49 1,38 1,04 0,76
Colombia 1,40 0,96 0,44 1,35 1,04 0,77
Gambia 2,00 0,68 1,32 1,36 1,05 0,77
Gabon 1,39 0,96 0,43 1,33 1,03 0,78
Trinidad and Tobago
2,98 0,44 2,54 1,31 1,01 0,78
Pakistan 2,00 0,66 1,34 1,32 1,03 0,78
Palau 1,27 1,03 0,25 1,31 1,03 0,79
Kenya 1,14 1,23 -‐0,09 1,40 1,11 0,79
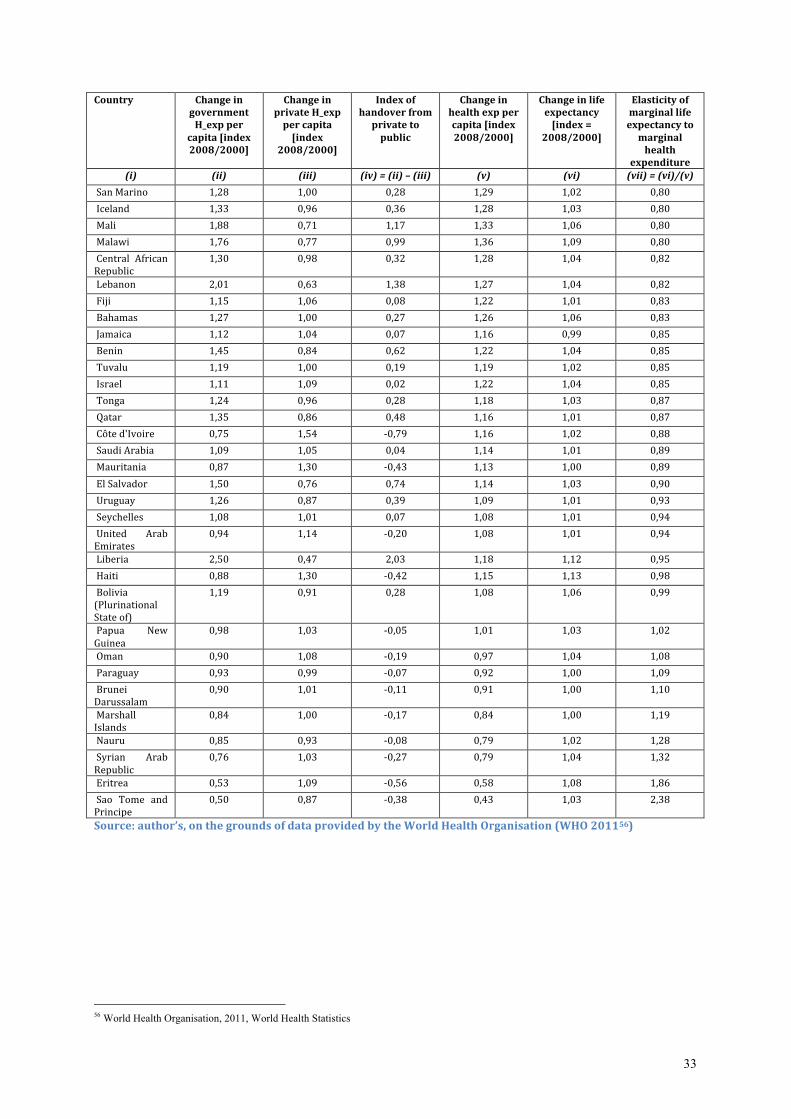
33
Country Change in government H_exp per
capita [index 2008/2000]
Change in private H_exp per capita
[index 2008/2000]
Index of handover from private to
public
Change in health exp per capita [index
2008/2000]
Change in life expectancy [index =
2008/2000]
Elasticity of marginal life expectancy to
marginal health
expenditure
(i) (ii) (iii) (iv) = (ii) – (iii) (v) (vi) (vii) = (vi)/(v)
San Marino 1,28 1,00 0,28 1,29 1,02 0,80
Iceland 1,33 0,96 0,36 1,28 1,03 0,80
Mali 1,88 0,71 1,17 1,33 1,06 0,80
Malawi 1,76 0,77 0,99 1,36 1,09 0,80
Central African Republic
1,30 0,98 0,32 1,28 1,04 0,82
Lebanon 2,01 0,63 1,38 1,27 1,04 0,82
Fiji 1,15 1,06 0,08 1,22 1,01 0,83
Bahamas 1,27 1,00 0,27 1,26 1,06 0,83
Jamaica 1,12 1,04 0,07 1,16 0,99 0,85
Benin 1,45 0,84 0,62 1,22 1,04 0,85
Tuvalu 1,19 1,00 0,19 1,19 1,02 0,85
Israel 1,11 1,09 0,02 1,22 1,04 0,85
Tonga 1,24 0,96 0,28 1,18 1,03 0,87
Qatar 1,35 0,86 0,48 1,16 1,01 0,87
Côte d'Ivoire 0,75 1,54 -‐0,79 1,16 1,02 0,88
Saudi Arabia 1,09 1,05 0,04 1,14 1,01 0,89
Mauritania 0,87 1,30 -‐0,43 1,13 1,00 0,89
El Salvador 1,50 0,76 0,74 1,14 1,03 0,90
Uruguay 1,26 0,87 0,39 1,09 1,01 0,93
Seychelles 1,08 1,01 0,07 1,08 1,01 0,94
United Arab Emirates
0,94 1,14 -‐0,20 1,08 1,01 0,94
Liberia 2,50 0,47 2,03 1,18 1,12 0,95
Haiti 0,88 1,30 -‐0,42 1,15 1,13 0,98
Bolivia (Plurinational State of)
1,19 0,91 0,28 1,08 1,06 0,99
Papua New Guinea
0,98 1,03 -‐0,05 1,01 1,03 1,02
Oman 0,90 1,08 -‐0,19 0,97 1,04 1,08
Paraguay 0,93 0,99 -‐0,07 0,92 1,00 1,09
Brunei Darussalam
0,90 1,01 -‐0,11 0,91 1,00 1,10
Marshall Islands
0,84 1,00 -‐0,17 0,84 1,00 1,19
Nauru 0,85 0,93 -‐0,08 0,79 1,02 1,28
Syrian Arab Republic
0,76 1,03 -‐0,27 0,79 1,04 1,32
Eritrea 0,53 1,09 -‐0,56 0,58 1,08 1,86
Sao Tome and Principe
0,50 0,87 -‐0,38 0,43 1,03 2,38
Source: author’s, on the grounds of data provided by the World Health Organisation (WHO 201156)
56 World Health Organisation, 2011, World Health Statistics


![[SAFE] - Suburban Areas Favoring Energy efficiency](https://static.fdocuments.fr/doc/165x107/62b32f11cbaa4b08b11941c3/safe-suburban-areas-favoring-energy-efficiency.jpg)