Comparative Advantages, Transaction Costs and Factor Content of Agricultural … · 2009-04-13 ·...
33
Comparative Advantages, Transaction Costs and Factor Content of Agricultural Trade: Empirical Evidence from CEE dArtis Kancs Pavel Ciaian y Jan Pokrivcak z April 2009 Abstract The present study examines factor content of the CEE transition country agricultural trade. We examine the relative country abundance for labour, capital and land, and test the Heckscher-Ohlin-Vanek (HOV) hypothesis. Our empirical ndings suggest that the factor content of agricultural exports and imports is rather similar in CEE and most of the agricultural trade ows do not satisfy the HOV prediction. In order to explain the general lack of agricul- tural specialisation and the observed paradox in the CEEs agricultural trade, we examine the role of transaction costs and market imperfections. We nd that transaction costs and market imperfections distort farm specialisation and hence factor content of agricultural trade. Keywords: Factor Content, Agricultural Trade, Comparative Advantages, Trans- action Cost. JEL classication: F12, F14, D23, Q12, Q17. European Commission - Joint Research Centre (IPTS), Catholic University of Leuven and EERI. E-mail: [email protected]. y European Commission - Joint Research Centre (IPTS), Catholic University of Leuven and EERI. E-mail: [email protected]. z Slovak Agricultural University, and Economics and Econometrics Research Institute (EERI). E-mail: [email protected]. 1
Transcript of Comparative Advantages, Transaction Costs and Factor Content of Agricultural … · 2009-04-13 ·...
Comparative Advantages, Transaction Costs andFactor Content of Agricultural Trade:
Empirical Evidence from CEE
d�Artis Kancs� Pavel Ciaian y Jan Pokrivcak z
April 2009
Abstract
The present study examines factor content of the CEE transition countryagricultural trade. We examine the relative country abundance for labour,capital and land, and test the Heckscher-Ohlin-Vanek (HOV) hypothesis. Ourempirical �ndings suggest that the factor content of agricultural exports andimports is rather similar in CEE and most of the agricultural trade �ows donot satisfy the HOV prediction. In order to explain the general lack of agricul-tural specialisation and the observed paradox in the CEE�s agricultural trade,we examine the role of transaction costs and market imperfections. We �ndthat transaction costs and market imperfections distort farm specialisation andhence factor content of agricultural trade.
Keywords: Factor Content, Agricultural Trade, Comparative Advantages, Trans-action Cost.JEL classi�cation: F12, F14, D23, Q12, Q17.�European Commission - Joint Research Centre (IPTS), Catholic University of Leuven and EERI.
E-mail: d�[email protected] Commission - Joint Research Centre (IPTS), Catholic University of Leuven and EERI.
E-mail: [email protected] Agricultural University, and Economics and Econometrics Research Institute (EERI).
E-mail: [email protected].
1
1 Introduction
Relative factor endowment models continue to play a prominent role in internationaltrade literature. There are two principal reasons why one of the key objectives ofinternational economic research has been to account for the factor content of trade.The �rst is that economists want to trace the e¤ects of international in�uences onrelative and absolute factor prices within a country. The Heckscher-Ohlin (HO)model and its variants, with their emphasis on trade arising from di¤erences in theavailability of productive factors, provide a natural setting for such investigations(Davis and Weinstein 2001).The second reason for the focus on the factor content of trade is that it provides
a precise prediction against which to measure how well the trade models work. Therelative factor endowment models are extraordinary in their ambition. They proposeto describe, with but a few parameters and in a uni�ed constellation, the endowments,technologies, production, absorption, and trade of all countries in the world. Thisjuxtaposition of extraordinary ambition and parsimonious speci�cation have madethese theories irresistible to empirical researchers (Davis and Weinstein 2001).Complementing previous empirical studies of factor content of aggregate developed
country trade, the present paper estimates factor content of the CEE agriculturaltrade.1 More precisely, we test the hypothesis relating the relative country endow-ment and technology advantages to the factor content of agricultural trade: whetheragricultural exports of countries with comparative advantages in labour intensiveproducts contain lower capital/labour ratio than agricultural exports of countrieswith comparative advantages in capital intensive products.In contrast to most studies in past, which mostly examine factor intensities in the
developed country manufacturing trade, in this paper we test if the CEE�s agriculturaltrade follows the trade pattern suggested by the HO�s relative factor endowmenttheory. Furthermore, since our focus is on the CEE�s agricultural trade, in light oftechnological di¤erences arising from the dual farm structure, we attempt to identifythe role of transaction costs in the CEEs�specialisation pattern. Our focus on CEE ismotivated by the recent systemic change taking place in CEE, which o¤ers a naturalexperiment for studying country specialisation and factor services in trade. Our focuson factor content of agricultural trade is motivated by the fact, that agricultural sectoris considerably more important in CEE than in developed market economies.The second peculiarity of CEE relates to farm specialisation. In developed market
economies the pattern of specialisation is fully determined by inter-industry di¤er-ences in the expected pro�ts (if we abstract from strategic considerations of �rms).This is entirely di¤erent in centrally planned economies, where �rm specialisationis largely determined by central planners. The Central and Eastern Europe duringthe Soviet period was a great example of a system-wide central planning, where the
1In the present study Central and Eastern Europe (CEE) refers to Czech Republic, Estonia,Hungary, Latvia, Lithuania, Poland, Slovakia and Slovenia.
2
central planning process has led to a high and arbitrary degree of regional division oflabour and regional specialisation (Swinnen 1999; Lerman 2001).The centrally planned pattern of regional specialisation became unsustainable,
when the transition to market economy started. Facing hard budget constrains theformerly state-subsidised farms became unpro�table under free market conditions andhad to be restructured and reorganised. Transition process in agriculture involvedprivatisation of agricultural recourses and farm restructuring. The predominant formof privatisation of agricultural land and other assets in CEE countries was restitutionto former owners (Swinnen 1999; Lerman 2001). The privatisation process was fol-lowed by farm restructuring. New private owners of farm assets and land were allowedto break away from cooperative farms and to start individual farming. This led to thecreation of family farms that were signi�cantly smaller in size than cooperatives, butcomparable to their Western European or American counterparts. However, not allcooperative farms broke up into family farms. Some cooperatives were transformedinto corporate farms. In these cases old socialist cooperatives were turned into coop-eratives of new owners of agricultural assets (including land), joint-stock companies,limited-liability companies or partnerships (Swinnen 1999).The adjustment in farm organisation is constrained by signi�cant transaction
costs, as the transition process did not succeed to eliminate all constrains in adjust-ing farm organisation. According to Ciaian and Swinnen (2006), there still existsigni�cant transaction costs in farm organisation adjustment in CEE. For example,the new land owners face signi�cant transaction costs if they want to withdraw theirland from former cooperative farms and relocate it. The transaction costs of farmreorganisation include costs involved in bargaining with farm management, in obtain-ing information on land and tenure regulations, in implementing the delineation ofthe land and dealing with inheritance and co-owners etc. (Swinnen 1999; Prostermanand Rolfes 2000; Ciaian and Swinnen 2006).These �ndings suggest that the current specialisation pattern of former centrally
planned farms largely depends on farm ability to reorganise their production formand farm structure. The farm ability to reorganise in turn depends on transactioncosts and expected pro�ts from the reorganisation. According to Swinnen (1999),the transaction costs are heterogenous across and within CEE and are largely deter-mined by di¤erences in political priorities, and hence are exogenous to �rms. Hence,we expect that the soviet-period farm organisation, market imperfections and trans-action costs of farm re-organisation would distort the pro�t maximising specialisationpattern of agricultural farms in CEE.Drawing on the the methodology from the empirical trade literature and the theory
of agricultural transition, the present paper makes three contributions to the existingempirical trade literature: (i) it extends the existing literature of factor content oftrade by speci�cally focusing on agricultural trade and including land among theprimary factors; (ii) it attempts to identify the role of transaction costs as a driverof agricultural trade �ows; and (iii) it provides the �rst insights about factor content
3
of international trade in the CEE transition countries, which have been neglected inthe previous literature.The paper is organised as follows. Section 2 introduces the theoretical framework
which is the basis for calculating factor content of trade in literature and the presentstudy. Section 3 provides a brief overview of previous empirical studies on factor con-tent of trade. Section 4 presents the empirical evidence of relative factor endowmentand cross-country technology di¤erences driven by di¤erences in farm organisationin CEE. We derive the empirical hypothesis relating the CEE country comparativeadvantages in agriculture and factor content of agricultural trade. In section 5 weexamine factor intensities of the CEE agricultural trade and test the HOV prediction.We also attempt to identify the role of transaction costs and market imperfectionsin determining farm specialisation and the pattern of agricultural trade. Section 6concludes and outlines avenues for future research on factor content of agriculturaltrade.
2 Theoretical framework
In this section we outline the theoretical framework which is commonly used inprevious and also in the present study for examining the factor content of foreigntrade. According to the neo-classical general equilibrium models of internationaltrade, countries and regions trade with each other because of their di¤erences or dueto economies of scale. Ricardian model of international trade (Ricardo 1817) statesthat di¤erences in technology between trading partners determine trade pattern whileHeckscher-Ohlin model states that countries trade because of di¤erences in relativefactor endowments.The standard multifactor, multicommodity, and multicountry model for predict-
ing factor content of trade is the Heckscher-Ohlin-Vanek (HOV) model. The keyassumptions of the HOV model are identical technologies, and identical and homo-thetical preferences across countries; di¤erences in factor endowment, free trade ingoods and services and no factor intensity reversals. The HOV suggests that if allcountries would have their endowments within their core of diversi�cation, then factorprices were equalised across countries.The HOV model relates factor content of trade to the relative country endowment
with production factors and can be described as follows. Assume that r = 1; :::; Rindex regions/countries, i = 1; :::; I are industries; and f = 1; :::; F index factors.Let A = [aif ]0 be the amount of production factors used to produce one unit in eachindustry, where rows of the A matrix index factors and columns industries. MatrixAt measures the total factor demand, i.e. direct factor demand plus indirect factoruse. According to Deardor¤ (1984), in the case of more traded goods than factors,the total factor intensities are important for explaining the trade �ows. To see thiswe post-multiply the direct factor demand matrix, Ad, by the Leontief �s inverse,(I �Br)�1:
4
Ar = Ard (I �Br)�1 (1)
where I is the identity matrix andBr is the technical coe¢ cient matrix (Br matrix)computed from the region/country r�s input-output table.Let Yir be the (I � 1) vector of each industry i�s input and let Dir be the (I � 1)
vector of demand for each good. The net export vector of goods, Tr, originating fromregion/country r can then be written as:
Tr = Yr �Dr (2)
The factor content of trade, i.e. the (F � 1) vector of trade in factor services, canthen be de�ned as:
Fr = ArTr (3)
Identical technologies across countries and factor price equalisation imply thatAr = A, which makes the interpretation of Fr = ATr straightforward: a positivevalue of an element in Fr indicates that the factor is exported and a negative valueindicates that the factor is imported.Assuming full employment of all primary factors we can write AYr = Vr, where Vr
is the endowment of factor f in region/country r. With factor price equalisation, freetrade and identical homothetic preferences across region/countries, region/countryc�s consumption vector must be proportional to the total world consumption:
Dr = srDw (4)
where sr is region/country r�s share in the world demand, Dw. Assuming thatworld production is equal to world consumption we obtain:
ADr = srADw = srAYw = srVw (5)
Together with the expressions for AVr and ADr we can derive the theoretical HOVhypothesis:
Fr � ATr = Vr � srVw (6)
The left hand side of equation (6) captures the production side of the HOV the-orem and is often labelled as the measured factor content of trade. The right handside of equation (6) captures the consumption/demand and is often referred to as thepredicted factor content of trade. For factor f the equation (6) can be rewritten as:
Ffr = Vfr � srVfw (7)
Equation (7) relates country r�s factor f�s net content of trade to its own andthe world�s endowments. The relative factor abundance is de�ned as follows: if
5
region/country r�s endowment with factor f relative to world endowment of thatfactor exceeds region/country r�s share in the world�s GDP, i.e. Vfr
Vfw> sr, then
country r is abundant in factor f .
3 Previous studies
Two strands of trade literature contribute to a better understanding of factor contentof agricultural trade in CEE. In section 3.1 we summarise the key literature �ndingsfrom the factor content studies and relative endowment models. Given that there isno literature on factor content of agricultural trade in CEE, in section 3.2 we reviewthe key literature �ndings from general trade literature on CEE.
3.1 Factor content of trade
In this section we summarise the key �ndings from previous empirical trade stud-ies and discuss their implications for the present study. Leontief (1954) providesone of the �rst attempts to examine the HO theory empirically.2 Leontief foundthat the U.S. (the most capital-abundant country in the world by any criteria) ex-ported labour-intensive commodities and imported capital-intensive commodities, incontradiction with HO theory.3 Hence, Leontief Paradox undermined the validity ofthe HO theorem, which predicted that trade patterns would be based on countries�comparative advantage in certain factors of production (such as capital and labour).The Leontief Paradox has generated a huge literature in the subsequent years. Em-
pirically, the HOV theorem has frequently been rejected for US and other developedeconomies in favour of statistical hypotheses such as a zero correlation between fac-tor endowments and trade patterns (see Davis andWeinstein 2001 for an overview).The widespread view of nineties was well summarised by Leamer and Levinsohn�s(1995) appraisal of the empirical performance of factor endowment theories: �It ismore convenient to estimate the speed of arbitrage rather than test if the arbitrage isperfect and instantaneous�.Theoretically, Leontief �s methodology has been criticised along many lines (see
e.g. Schott 2003 for an overview). In the context of factor content of agriculturalgoods� trade one of the main objections to Leontief �s methodology might be thatLeontief used a two-factor model (labour and capital), thus abstracting from otherfactors such as natural resources (land, climate, mineral deposits, forests, etc). Vanek(1959) pointed out that a commodity might be intensive in natural resources so that
2Although, the Leontief �s attempt cannot be classi�ed as a formal test of the HOV theorem, heprovides one of the �rst attempts to examine the HO theory empirically.
3Leontief calculated labour-output ratios and capital-output ratios for a number of industriesin the U.S. economy. Using these coe¢ cients, he then calculated the amount of labour and capitalembodied in U.S. imports and exports. Leontief found that the capital-labour ratio embodied inimports exceeded the ratio embodied in exports by approximately 30 %.
6
classifying it as either capital or labour-intensive would clearly be inappropriate.Vanek argues that the omitted factors help to explain the Leontief Paradox and hestresses the importance of restoring the traditional triad of capital, labour and landin factor endowment considerations.Stern (1975) emphasised the need for models of more than two factors because
capital and labour are required to improve natural resources to give them economicvalue, and countries may certainly combine these factors in somewhat di¤erent pro-portions when producing natural resource-based products. Thus, consideration ofnatural resources is important in the examination of the e¤ect of factor endowmenton trade.Summarising �ndings from the previous studies we may draw several conclusions
important for the present study. First, as the Leontief �s original study itself, most ofthe factor content studies to date have been applied to developed countries, becauseonly these countries have the necessary input-output and trade data required forcomputing factor content of trade for each sector and trading partner (Davis andWeinstein 2001). According to our knowledge, there is no single study analysingfactor content in all CEE transition country trade to date. Second, there are veryfew studies examining factor content of agricultural trade. The works by Schluter andLee (1978) and Lee, Wills and Schluter (1988) are among the few exceptions. Third,most of the previous studies have analysed factor content and the relative endowmentonly of labour and capital. However, the �ndings of Vanek (1959) and Stern (1975)suggest that omitting other factors might yield biased factor content estimates.The present study attempts to address all three issues of the previous studies.
First, this study departs from previous literature and examines factor content in theCEE transition country trade, where the pattern of foreign trade may be a¤ected bytransition processes. Second, the present study examines the theoretical predictionsthat relate the factor content of agricultural trade to cross-country di¤erences inrelative factor endowment. Agricultural trade is particularly important in CEE, wherein some countries the share of farming sector in total GDP and employment amountsup to 12%. Third, in addition to the traditional factors such as capital and labour,our empirical analysis includes land. Considering land in our study is additionallymotivated by the fact that we examine the factor content of agricultural trade.
3.2 Relative factor intensities in the CEE trade
A general �nding of the existing CEE literature is that factor content of the CEE tradehas been changing since the beginning of transition (e.g. World Bank 2005). Both,merchandise exports and imports are more skilled labour and capital intensive in 2003than they were in 1996. Specialisation in many CEE countries is becoming moreskilled labour and capital intensive (Landesmann and Stehrer 2002, Woerz 2003).Dulleck and Foster (2004) distinguish between CEE-5 (the Czech Republic, Hungary,Poland, Slovakia and Slovenia) and the rest of the CEE (Bulgaria, Rumania and the
7
Baltic States). According to Dulleck and Foster, CEE-5 are upgrading their productsusing more skilled labour and capital, while the rest of CEE remains seemingly in thetrap of low quality specialisation of production and trade.Nemen (1995) uses cluster analysis to divide industries into �ve distinctive groups
representing di¤erent factor intensities. Nemen �nds that trade of developed NorthEU countries with CEE is characterised by large and positive trade balances in indus-try groups that are intensive in technology and human capital while less developedSouth EU countries, which have a large and positive trade balance in industries thatuse relatively little capital. This suggests that North EU countries have a compara-tive advantage relative to CEE in technology and human capital intensive industries,while South EU countries have a comparative advantage in capital extensive indus-tries. Nemen further observes that CEE has factor endowments rather similar tothose of South Europe. From Nemen�s analysis it follows that in the long-run CEEhas comparative advantage in labour intensive industries.Worz (2005) studies the pattern of trade specialisation of CEEs. He �nds that all
the CEEs are above-average exporters in low and medium/low-skill-intensive indus-tries, and relative net importers in medium-high and high-skill-intensive industries.Over time some catch-up with the EU is observed, i.e. convergence but also a de-specialisation trend is visible.4
A signi�cant feature of CEE�s trade integration into the European and worldmarkets was a rapid growth of IIT. At the beginning of transition IIT trade of CEEsand EU15 was in the range of 20-50 percent and it was similar to the share of IITof peripheral EU countries such as Finland, Greece or Portugal. The IIT�s share ofCEE trade increased during the 1990s reaching similar levels observed in Spain, Italyand other EU countries (50-70% for most of the CEE) (Fidrmuc, 2005). Janda andMunich (2004) note that the Czech industries with high share of IIT employ high per-centage of low-educated labour. On the other hand, industries with low share of IITemploy low percentage of low-educated labour and are mainly net importers. Czechimports correspond to higher technology goods whose production requires a largeshare of capital and a highly educated labour. The scarcity of capital in the CzechRepublic could be considered as a reason for high net imports in these industries.Ferto (2005) is one of the few studies investigating IIT in agriculture. He exam-
ines the relationship between the factor endowment and the pattern of intra-industrytrade with agricultural products. Ferto distinguishes between horizontal and verticalproduct di¤erentiation. For the trade between Hungary and EU countries verticalproduct di¤erentiation is �nd to be more important than horizontal product di¤eren-tiation. Ferto con�rms the predictions of the existing literature that vertical productdi¤erentiation is positively related to di¤erences in factor endowments. The preva-lence of the vertical IIT between CEE and EU15 implies that there are adjustmentcosts related to reallocation of factors of production during integration of CEE into
4In this context de-specialisation means increased share of IIT in total trade and smaller di¤er-ences in factor endowments.
8
the EU.Based on these studies, which are representative for the existing literature on rela-
tive factor intensities in the CEE foreign trade, we may conclude that with respect torelative factor intensities the majority of the existing literature focuses either on man-ufacturing sectors or aggregate trade �ows. In addition, the most recent CEE tradestudies focus on intra-industry trade (IIT). The literature analysing factor contentof CEE trade mainly focuses in describing how factor content of the CEE�s importsand exports evolve over time and and comparing with the EU. Hence, in light of thescarce existing literature on factor content of the CEE agricultural trade, the presentstudy will be one of the �rst studies on factor content of the CEE agricultural trade.
4 Production technology and relative factor en-dowment in CEE
In this section we present the empirical evidence of farming sector and agriculturaltrade in CEE. In particular, we examine two key drivers of agricultural trade: (i)relative factor endowment; and (ii) di¤erences in production technology.5 In section3.4 we summarise the key �ndings of the CEEs� relative comparative advantages,which allow us to derive the empirical hypothesis. As usual, we begin with introducingthe data we use.
4.1 Data
In the empirical analysis of factor content of trade we use data for 2004. The agricul-tural trade data is extracted from the COMEXT trade data base Eurostat (2007) andGTAP 7 data base. The COMEXT data base provides data for Member States ofthe European Union on external trade with each other and with non-member coun-tries. It contains data on external trade collected and processed by all EU MemberStates and more than 100 trade partners, including U.S.A., Japan and the EFTAcountries. COMEXT contains several types of data from various sources (EuropeanUnion, United Nations, IMF etc) and with di¤erent structures (corresponding todi¤erent nomenclatures like CN, SITC Rev2, SITC Rev3 etc).In addition to the bilateral trade �ows, the GTAP Data Base provides national
input-output �ows in CEE and data for macroeconomic variables such as consump-tion, GDP, etc. The advantage of the GTAP Data Base compared to EU membercountries�trade in the COMEXT Data Base is that it is a global data base repre-senting the world economy.
5Other often studied sources of comparative advantage are tastes, size (with increasing returns),market structure (with imperfect competition), location (with trade costs), and initial conditions(agglomeration).
9
The TFP estimates are based on a two year (2004 and 2005) �rm-level panel datafrom the Farm Accountancy Data Network (FADN). The annual sample of FADNcovers approximately 80.000 agricultural farms. In 2004 they represented a populationof about 5.000.000 farms in the 25 Member States, covering approximately 90% ofthe total utilised agricultural area (UAA) and accounting for more than 90% of thetotal agricultural production of the EU. In the present study we make use of a paneldata for 8 CEE economies covering two years - 2004 and 2005. The unbalanced panelcontains 37416 observations: 34851 for IF and 2565 for CF. In the sample 827 CFfarms and 10012 IF are represented in both years. Although, the CF amount only to6.86% of the total number of farms in our sample, they cultivate almost half of thetotal UAA in CEE.In order to reveal sectoral di¤erences in production, trade and demand, we dis-
aggregate agricultural sector in eight sub-sectors, which are summarised in Table 8in the Annex. In order to account for international di¤erences in production and de-mand, we disaggregate CEE into eight countries (Czech Republic, Estonia, Hungary,Latvia, Lithuania, Poland, Slovakia and Slovenia).
4.2 Farm organisation and production technology
The Ricardian theory of international trade suggests that in order to exploit theircomparative advantages, countries specialise in producing what they produce best.In other words, inter-industry di¤erences in production technology determine thespecialisation pattern of regions and countries.6 Among other factors, the Ricardiangains from specialisation and trade depend on the size of inter-industry di¤erencesin production technology and how large are international (inter-regional) technolog-ical di¤erences. Hence, in this section we explore both the relative and absolutetechnological di¤erences in turn.7
In Western Europe, North America and other developed countries, where agri-cultural sector is dominated by relatively small and, compared to CEE, homogenousfamily farms input and output markets are functioning well and transaction costsof adjusting farm organisation are relatively low, the inter-regional and internationalvariation in production technology is little a¤ected by farm organisation (Jensen andMeckling 1976; Pollak 1985; Schmitt 1991, Allen and Lueck 1998). Hence, if farmscan straightforwardly adjust their organisation and production structure accordingto changed market conditions, a given farm organisation little constrains �rm spe-cialisation. This is usually the case in developed market economies.
6In the present study the terms industries and activities are used as synonyms. Hence, inter-industry di¤erences denote di¤erences between agricultural activities, such as milk, grain, horticul-ture, etc.
7Generally, the production technology at �rm level is determined by many factors (see e.g. Jensenand Meckling 1976). However, in the present study we particularly focus on farm organisation anddeliberately abstract from other determinants of production technology.
10
A distinctive di¤erence of the CEE�s agriculture is heterogeneity in farm organ-isation and signi�cant market imperfections, which heavily a¤ect farm productiontechnology (Swain 1999; World Bank 1999; Dale and Baldwin 2000; Rozelle andSwinnen 2004; Ciaian and Swinnen 2006). As a result, because of often prohibitivefarm reorganisation costs, the agricultural sector in the CEE transition countries ischaracterised by a dual farm structure (Lerman 2001; Rozelle and Swinnen 2004).8
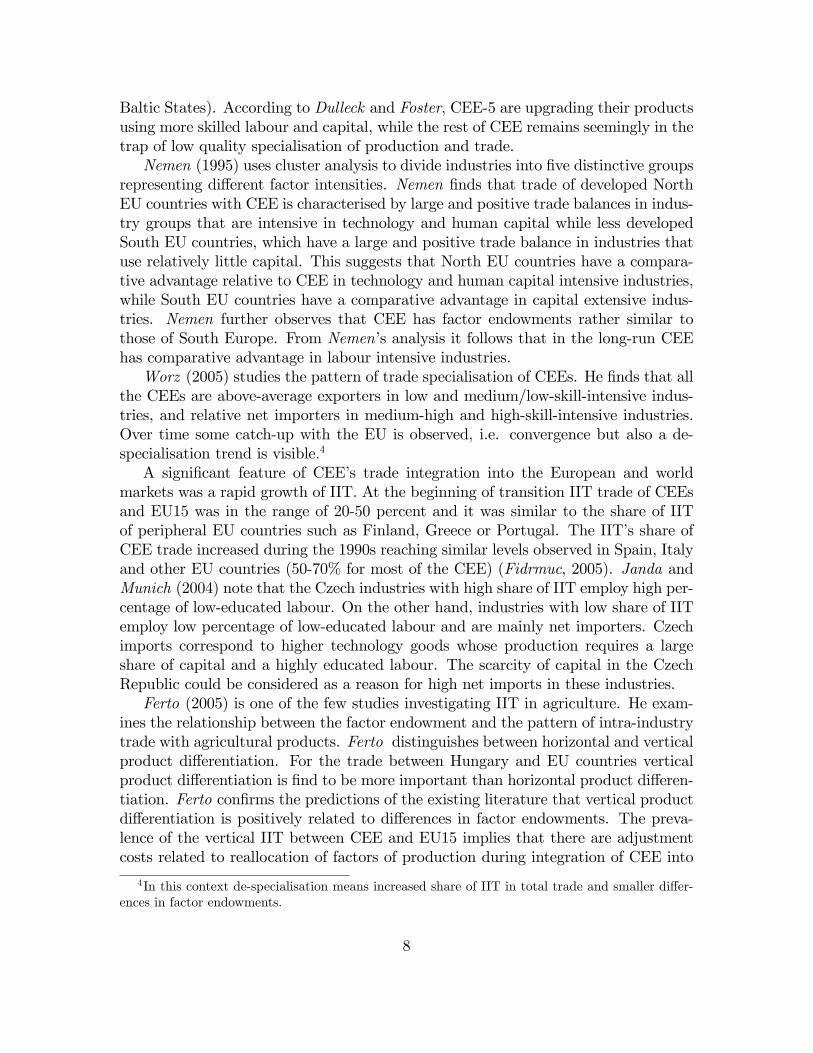
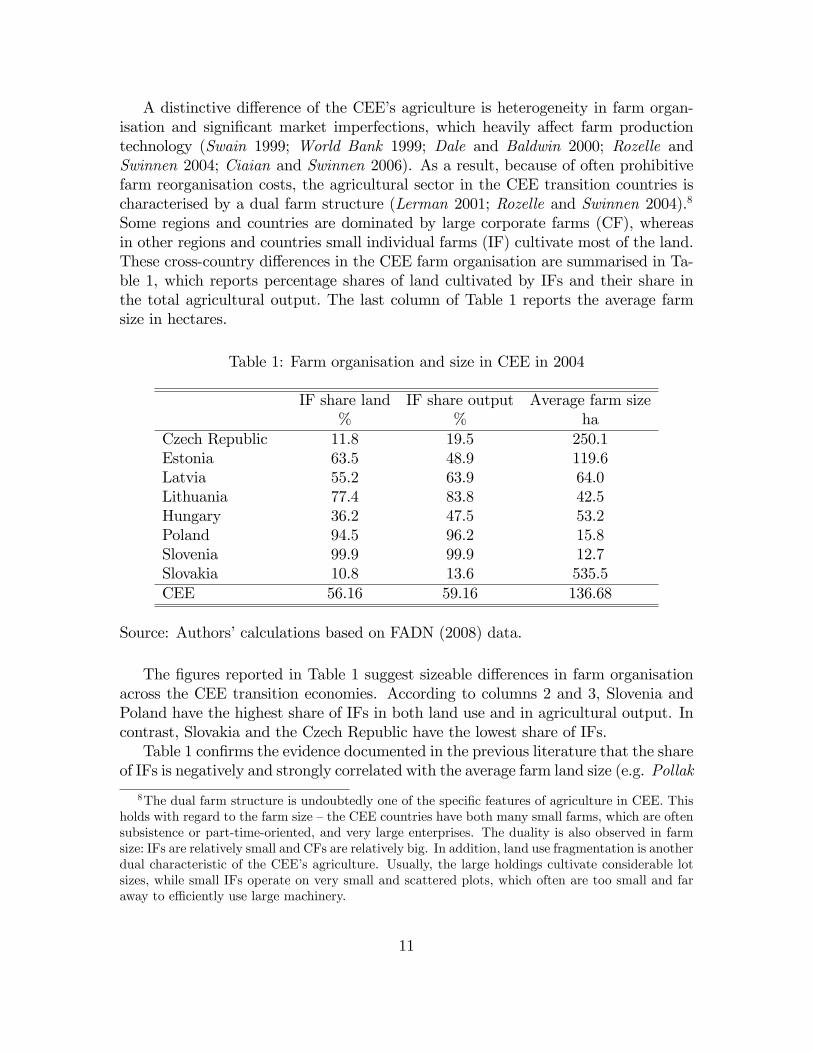
Some regions and countries are dominated by large corporate farms (CF), whereasin other regions and countries small individual farms (IF) cultivate most of the land.These cross-country di¤erences in the CEE farm organisation are summarised in Ta-ble 1, which reports percentage shares of land cultivated by IFs and their share inthe total agricultural output. The last column of Table 1 reports the average farmsize in hectares.
Table 1: Farm organisation and size in CEE in 2004
IF share land IF share output Average farm size% % ha
Czech Republic 11.8 19.5 250.1Estonia 63.5 48.9 119.6Latvia 55.2 63.9 64.0Lithuania 77.4 83.8 42.5Hungary 36.2 47.5 53.2Poland 94.5 96.2 15.8Slovenia 99.9 99.9 12.7Slovakia 10.8 13.6 535.5CEE 56.16 59.16 136.68
Source: Authors�calculations based on FADN (2008) data.
The �gures reported in Table 1 suggest sizeable di¤erences in farm organisationacross the CEE transition economies. According to columns 2 and 3, Slovenia andPoland have the highest share of IFs in both land use and in agricultural output. Incontrast, Slovakia and the Czech Republic have the lowest share of IFs.Table 1 con�rms the evidence documented in the previous literature that the share
of IFs is negatively and strongly correlated with the average farm land size (e.g. Pollak
8The dual farm structure is undoubtedly one of the speci�c features of agriculture in CEE. Thisholds with regard to the farm size �the CEE countries have both many small farms, which are oftensubsistence or part-time-oriented, and very large enterprises. The duality is also observed in farmsize: IFs are relatively small and CFs are relatively big. In addition, land use fragmentation is anotherdual characteristic of the CEE�s agriculture. Usually, the large holdings cultivate considerable lotsizes, while small IFs operate on very small and scattered plots, which often are too small and faraway to e¢ ciently use large machinery.
11
1985; Allen and Lueck 1998). Countries with relatively high share of CFs (low shareof IFs), e.g. the Czech Republic and Slovakia, have considerably larger farms thancountries with high share of IFs (e.g. Slovenia and Poland). Given that cultivating 12or 15 ha land, as in Slovenia and Poland, requires a considerably di¤erent technologythan cultivating 535 ha land, as in Slovakia, both farm organisation and size co-determine the production technology in CEE.Table 1 also suggests that, on average, the IF share in land use is lower than the
IF share in output (compare columns 2 and 3). This can be explained by the factthat, on average, IFs tend to specialise in more labour intensive products, which arealso more cost intensive and hence have a higher value per hectare of cultivated landand physical output unit compared to CFs. For example horticulture, the productionof which is dominated by IFs, has a considerably higher value per output unit andthe cultivated land hectare than cereals and oilseeds, the production of which isdominated by CFs.In terms of farm specialisation and factor content of agricultural trade, the share
of IFs and CFs is important, if relative factor requirements in producing the sameproduct are di¤erent between the two types of farms, i.e. they use di¤erent tech-nologies. According to Pollak (1985) and Allen and Lueck (1998), one of the keydistinctive di¤erences in production technology between IFs and CFs is the relativelabour and capital intensity. Indeed, several studies, which have evaluated the pro-duction technology of individual farms and corporate farms, have found signi�cantdi¤erences in the relative labour/capital intensity (e.g. Pollak 1985; Allen and Lueck1998). On average, IFs tend to use less capital compared to CFs, whereas CFs tendto use less labour compared to IFs in producing the same product.According to Pollak (1985); Allen and Lueck (1998), These farm-type di¤erences
in labour/capital intensity are largely determined by di¤erences in the relative factorcosts and factor productivity. In terms of labour, usually, IFs face lower labour costs.Given that farmer is the residual income claimant, IFs do not su¤er frommoral hazardproblem, which is an important issue in CFs (Schmitt 1991). This leads to higherlabour productivity in IFs compared to CFs. On the other hand, labour productivityof IFs might be hindered by lack of labour specialisation, which reduces marginalproduct of labour. Most of the previous studies �nd the former e¤ect is larger thanthe latter (Pollak 1985; Allen and Lueck 1998).In terms of capital, usually IFs face higher per-unit capital costs. Because of
missing collateral, IFs are more credit constrained than CFs, and in the presenceof �xed capital transaction costs, IFs face higher per-unit capital costs than CFs.Moreover, capital productivity of IFs is often lower compared to CFs because ofsub-optimal production scale and underemployment of �xed farm equipment andmachinery (Pollak 1985; Allen and Lueck 1998). Hence, large CFs tend to havehigher marginal productivity of capital than small IFs.In order to gain the empirical evidence about farm-type productivity di¤erences,
we estimate Total Factor Productivity (TFP) for IF and CF. The TFP estimates
12
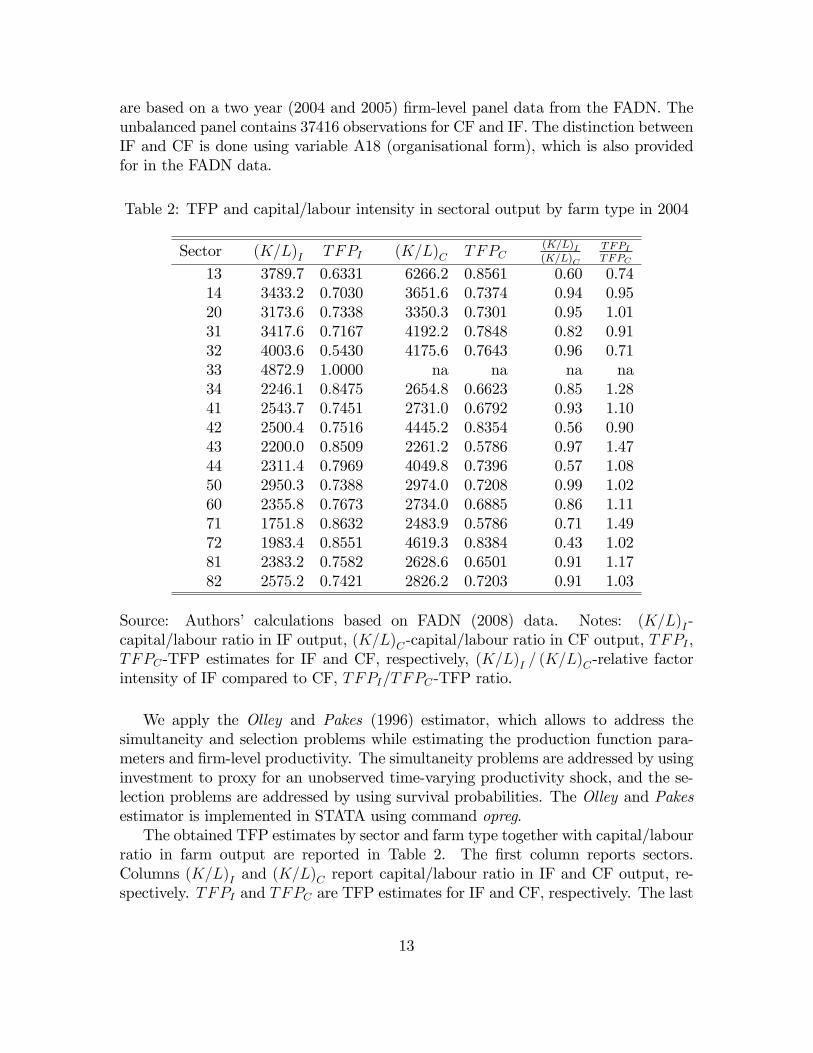
are based on a two year (2004 and 2005) �rm-level panel data from the FADN. Theunbalanced panel contains 37416 observations for CF and IF. The distinction betweenIF and CF is done using variable A18 (organisational form), which is also providedfor in the FADN data.
Table 2: TFP and capital/labour intensity in sectoral output by farm type in 2004
Sector (K=L)I TFPI (K=L)C TFPC(K=L)I(K=L)C
TFPITFPC
13 3789.7 0.6331 6266.2 0.8561 0.60 0.7414 3433.2 0.7030 3651.6 0.7374 0.94 0.9520 3173.6 0.7338 3350.3 0.7301 0.95 1.0131 3417.6 0.7167 4192.2 0.7848 0.82 0.9132 4003.6 0.5430 4175.6 0.7643 0.96 0.7133 4872.9 1.0000 na na na na34 2246.1 0.8475 2654.8 0.6623 0.85 1.2841 2543.7 0.7451 2731.0 0.6792 0.93 1.1042 2500.4 0.7516 4445.2 0.8354 0.56 0.9043 2200.0 0.8509 2261.2 0.5786 0.97 1.4744 2311.4 0.7969 4049.8 0.7396 0.57 1.0850 2950.3 0.7388 2974.0 0.7208 0.99 1.0260 2355.8 0.7673 2734.0 0.6885 0.86 1.1171 1751.8 0.8632 2483.9 0.5786 0.71 1.4972 1983.4 0.8551 4619.3 0.8384 0.43 1.0281 2383.2 0.7582 2628.6 0.6501 0.91 1.1782 2575.2 0.7421 2826.2 0.7203 0.91 1.03
Source: Authors� calculations based on FADN (2008) data. Notes: (K=L)I-capital/labour ratio in IF output, (K=L)C-capital/labour ratio in CF output, TFPI ,TFPC-TFP estimates for IF and CF, respectively, (K=L)I = (K=L)C-relative factorintensity of IF compared to CF, TFPI/TFPC-TFP ratio.
We apply the Olley and Pakes (1996) estimator, which allows to address thesimultaneity and selection problems while estimating the production function para-meters and �rm-level productivity. The simultaneity problems are addressed by usinginvestment to proxy for an unobserved time-varying productivity shock, and the se-lection problems are addressed by using survival probabilities. The Olley and Pakesestimator is implemented in STATA using command opreg.The obtained TFP estimates by sector and farm type together with capital/labour
ratio in farm output are reported in Table 2. The �rst column reports sectors.Columns (K=L)I and (K=L)C report capital/labour ratio in IF and CF output, re-spectively. TFPI and TFPC are TFP estimates for IF and CF, respectively. The last
13
two columns - (K=L)I = (K=L)C and TFPI/TFPC report the relative factor intensityof IF compared to CF and TFP ratio.The results reported in Table 2 suggest a considerable inter-sectoral and farm-
type variation in the capital/labour intensity in farm output. Generally, IF tend tobe more productive than CF when the capital labour ratio is small (labour share islarge). The opposite holds for CF. However, the capital labour ratio seems not to bethe only determinant of farm TFP. For example, sectors 41 (dairying) and 14 (rootcrops and technical crops) have nearly the same capital/labour ratio in IF and CFoutput (0.93 and 0.94), but signi�cant di¤erences in farm-type TFP ratios (1.10 and0.95). According to our estimates, in milk sector IF are more productive than CF,whereas the opposite holds for root and technical crops.The relative factor intensity estimates reported in column (K=L)I = (K=L)C sug-
gest that in the CEE transition countries IFs tend to use more labour in all agricul-tural activities - the share of labour/capital ratio is higher for IFs in all activities.Column (K=L)I = (K=L)C also suggests that farm-type technological di¤erences arerather heterogenous across agricultural activities. The most sizeable technologicaldi¤erences in terms of factor use are estimated for sector 72 (mixed livestock), wherethe relative capital labour content in IF output amounts only to 43% of CF output.Most of IF belonging to this category are weakly specialised semi-subsistance farms.In contrast, pig and poultry production is nearly equally capital intensive - IF out-put contains 2950.3 EUR capital per worker and CF output contains EUR capital perworker 2974.0. These results are broadly in line with previous literature on farm-typedi¤erences in production technology (e.g. Pollak 1985; Allen and Lueck 1998).The Ricardian theory of international trade suggests that, in presence of mar-
ket imperfections and signi�cant transaction costs of adjusting farm organisation,technological di¤erences would lead to di¤erent specialisation patterns between IF-dominated and CF-dominated regions, and hence magnify the cross-regional di¤er-ences in factor content of agricultural output and trade: IF-dominated regions wouldspecialise in labour intensive goods, whereas CF-dominated regions would specialisein capital intensive goods.Hence, in the presence of market imperfections and prohibitive transaction costs
of changing farm organisation, we would expect that countries with high share of IFs(Slovenia and Poland) would produce and export relatively labour intensive productsand import products with relatively high capital content. In contrast, if all otherconditions were equal, we would expect that countries with high share of CFs (Slo-vakia and Czech Republic) would produce and export relatively more capital intensivegoods and import relatively more labour intensive goods.
4.3 Relative factor endowment
The HO theory of international trade suggests that in order to exploit their compar-ative endowment advantages countries should produce and export goods that utilise
14
their abundant factor(s) of production and import products that utilise the coun-tries�scarce factor(s).9 In this section we examine di¤erences in factor endowmentacross CEE. Indeed, several studies have found that di¤erences in resources, ratherthan di¤erences in technology (e.g. Debaere 2003), are among the most importantdeterminants of country comparative advantage. Hence, we begin by examining therelative CEE�s endowment with primary factors.10
First, we calculate the relative endowment with primary production factors com-paring di¤erent factors. The standard approach of comparing the relative countryendowments is to consider factor ratios, although there is no preferred combination offactors in forming these ratios. Table 3 reports absolute land and capital endowmentfor each CEE country. Land endowment is measured in hectares of agricultural landper capita. Capital endowment is measured in thousands of Euros per agriculturalworker. In addition to factor ratios, we also include a relative measure of agriculturallabour force. Labour force is proxied by the share of agricultural employment in thetotal employment in 1990. We include this additional proxy for agricultural labourforce for two reasons: (i) it is highly correlated with the unobservable agriculturallabour endowment;11 and (ii) it is highly exogenous, i.e. it is not determined by farmlabour demand in 2004.12 Moreover, those workers which worked in agriculture untilthe nineties are experienced, many of them have agricultural education and, mostimportantly, they live in rural areas as their competitiveness for manufacturing jobsin cities is limited (Csaki and Lerman 1996).13
The �gures reported in Table 3 suggest a substantial cross-country variation inendowment with primary production factors. According to Table 3, the most landabundant countries are Lithuania and Latvia with 0.76 and 0.71 hectare of agriculturalland per capita, respectively. In contrast, the least land abundant country Sloveniahas only 0.25 hectare of agricultural land per capita.Table 3 also suggests sizeable di¤erences in the relative endowment with capital
9Although, similarities across countries can also promote trade. Indeed, volume of trade amongst�similar�countries is greater than volume amongst �very di¤erent�countries. Nevertheless, country�di¤erences�rather than �similarities�are usually assumed as a more fundamental reason for trade.10Generally, country endowment advantages capture many more variables than the three pri-
mary production factors. We focus on these three because the main focus of the present study islabour/capital and land endowment and content in agricultural goods.11In the context of the present study the agricultural labour force captures both the size of
agricultural workers and the size of agricultural employment seekers.12We perform sensitivity analyses using alternatives measures of rural labour endowment (rural
population density, rural unemployment rate and rural-urban wage gap). Given that the use ofalternative proxies does not change the presented results signi�cantly, they are not reported herefor the sake of brevity.13Although, a certain share of them have left the rural regions, worker decision to leave is an
endogenous process largely driven by wage di¤erences and employment opportunities. Hence, thecurrent agricultural employment share cannot be considered as a measure of exogenous comparativeadvantages.
15
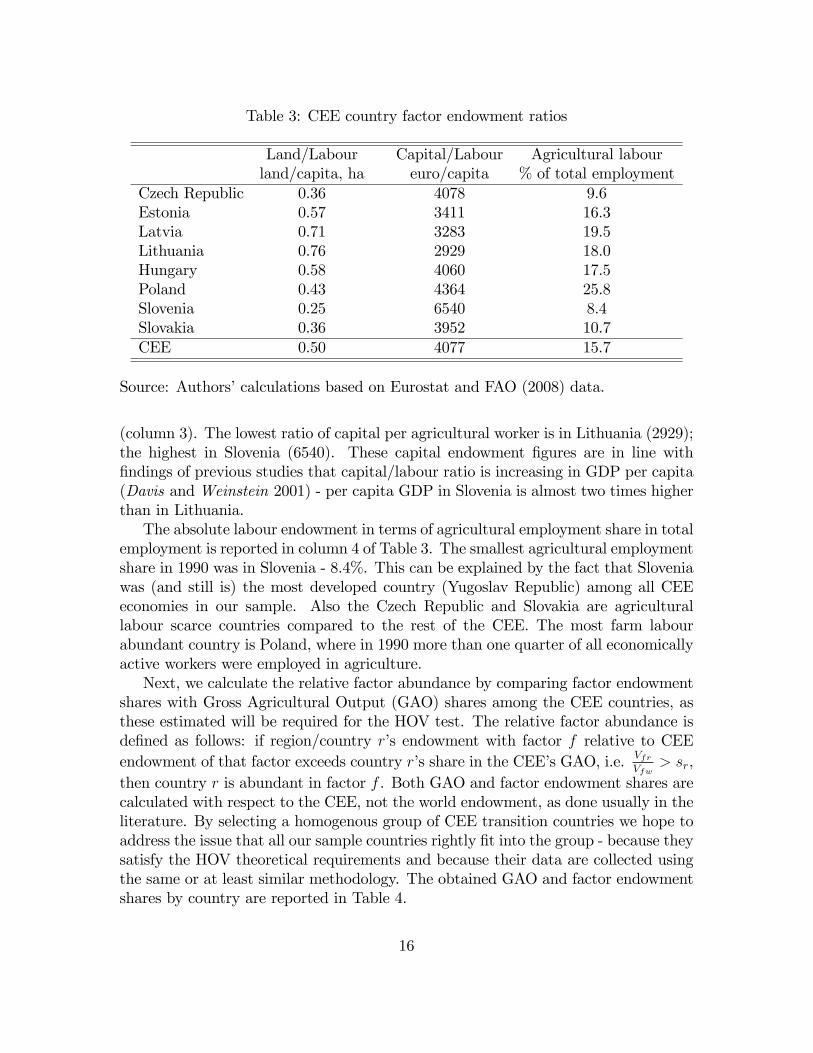
Table 3: CEE country factor endowment ratios
Land/Labour Capital/Labour Agricultural labourland/capita, ha euro/capita % of total employment
Czech Republic 0.36 4078 9.6Estonia 0.57 3411 16.3Latvia 0.71 3283 19.5Lithuania 0.76 2929 18.0Hungary 0.58 4060 17.5Poland 0.43 4364 25.8Slovenia 0.25 6540 8.4Slovakia 0.36 3952 10.7CEE 0.50 4077 15.7
Source: Authors�calculations based on Eurostat and FAO (2008) data.
(column 3). The lowest ratio of capital per agricultural worker is in Lithuania (2929);the highest in Slovenia (6540). These capital endowment �gures are in line with�ndings of previous studies that capital/labour ratio is increasing in GDP per capita(Davis andWeinstein 2001) - per capita GDP in Slovenia is almost two times higherthan in Lithuania.The absolute labour endowment in terms of agricultural employment share in total
employment is reported in column 4 of Table 3. The smallest agricultural employmentshare in 1990 was in Slovenia - 8.4%. This can be explained by the fact that Sloveniawas (and still is) the most developed country (Yugoslav Republic) among all CEEeconomies in our sample. Also the Czech Republic and Slovakia are agriculturallabour scarce countries compared to the rest of the CEE. The most farm labourabundant country is Poland, where in 1990 more than one quarter of all economicallyactive workers were employed in agriculture.Next, we calculate the relative factor abundance by comparing factor endowment
shares with Gross Agricultural Output (GAO) shares among the CEE countries, asthese estimated will be required for the HOV test. The relative factor abundance isde�ned as follows: if region/country r�s endowment with factor f relative to CEEendowment of that factor exceeds country r�s share in the CEE�s GAO, i.e. Vfr
Vfw> sr,
then country r is abundant in factor f . Both GAO and factor endowment shares arecalculated with respect to the CEE, not the world endowment, as done usually in theliterature. By selecting a homogenous group of CEE transition countries we hope toaddress the issue that all our sample countries rightly �t into the group - because theysatisfy the HOV theoretical requirements and because their data are collected usingthe same or at least similar methodology. The obtained GAO and factor endowmentshares by country are reported in Table 4.
16
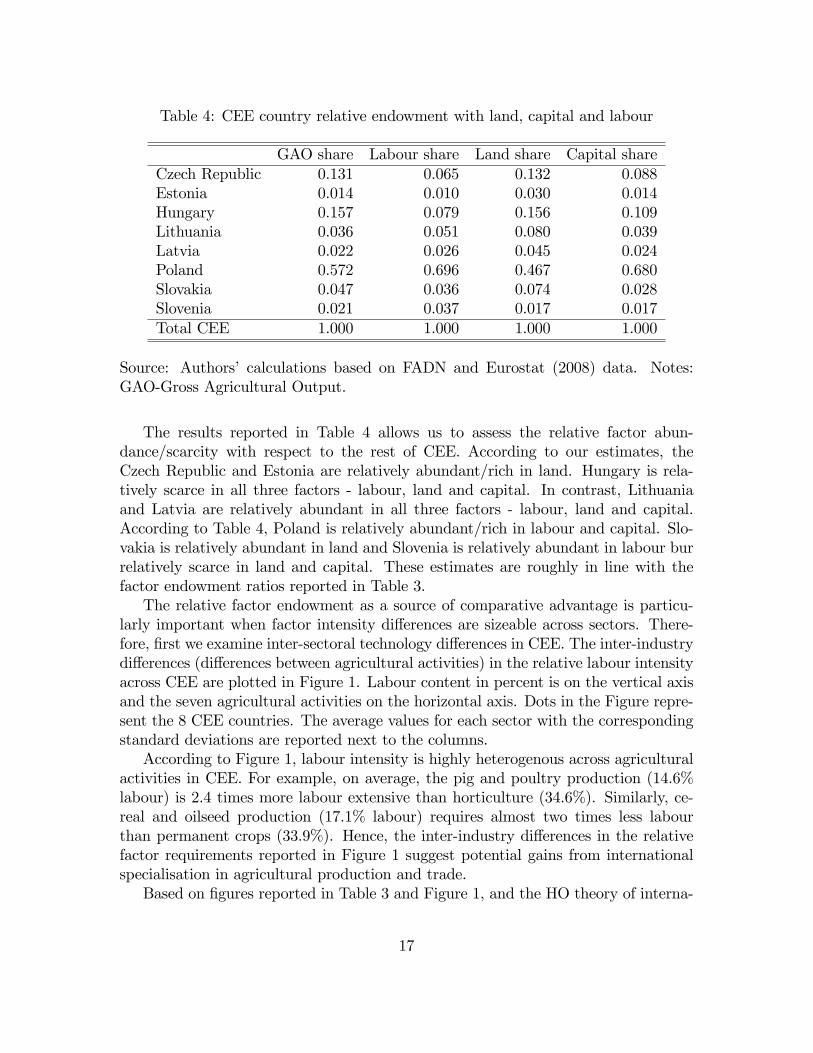
Table 4: CEE country relative endowment with land, capital and labour
GAO share Labour share Land share Capital shareCzech Republic 0.131 0.065 0.132 0.088Estonia 0.014 0.010 0.030 0.014Hungary 0.157 0.079 0.156 0.109Lithuania 0.036 0.051 0.080 0.039Latvia 0.022 0.026 0.045 0.024Poland 0.572 0.696 0.467 0.680Slovakia 0.047 0.036 0.074 0.028Slovenia 0.021 0.037 0.017 0.017Total CEE 1.000 1.000 1.000 1.000
Source: Authors� calculations based on FADN and Eurostat (2008) data. Notes:GAO-Gross Agricultural Output.
The results reported in Table 4 allows us to assess the relative factor abun-dance/scarcity with respect to the rest of CEE. According to our estimates, theCzech Republic and Estonia are relatively abundant/rich in land. Hungary is rela-tively scarce in all three factors - labour, land and capital. In contrast, Lithuaniaand Latvia are relatively abundant in all three factors - labour, land and capital.According to Table 4, Poland is relatively abundant/rich in labour and capital. Slo-vakia is relatively abundant in land and Slovenia is relatively abundant in labour burrelatively scarce in land and capital. These estimates are roughly in line with thefactor endowment ratios reported in Table 3.The relative factor endowment as a source of comparative advantage is particu-
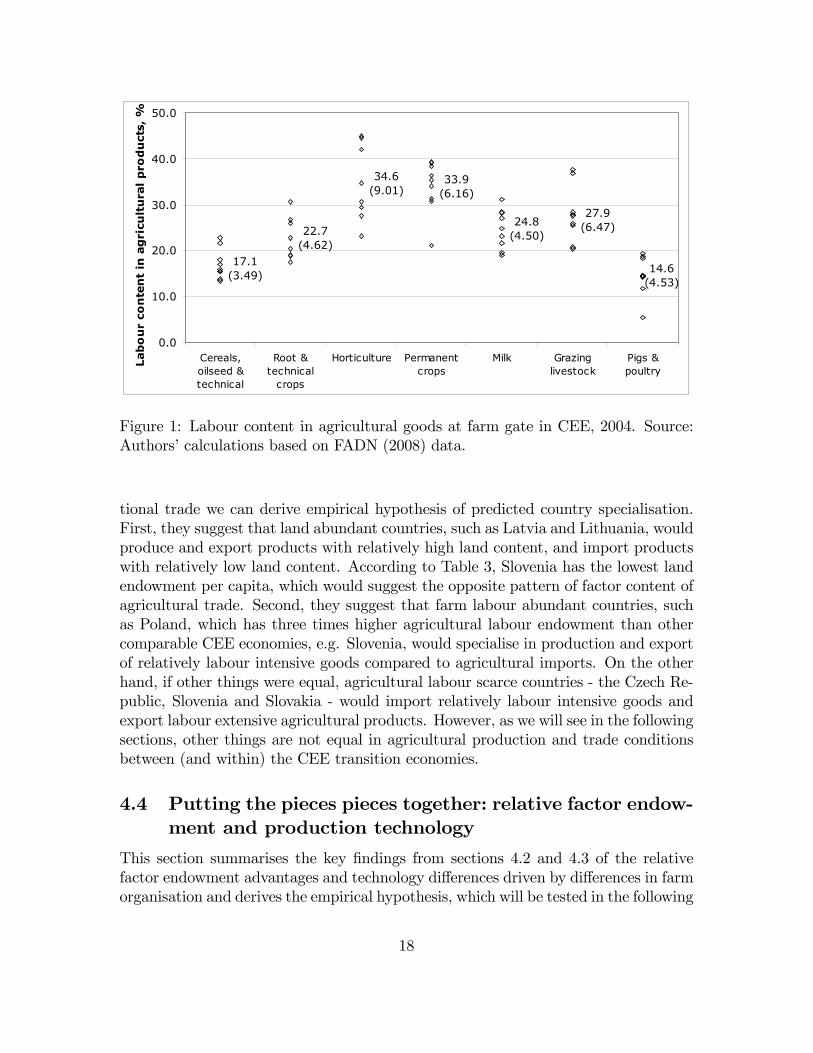
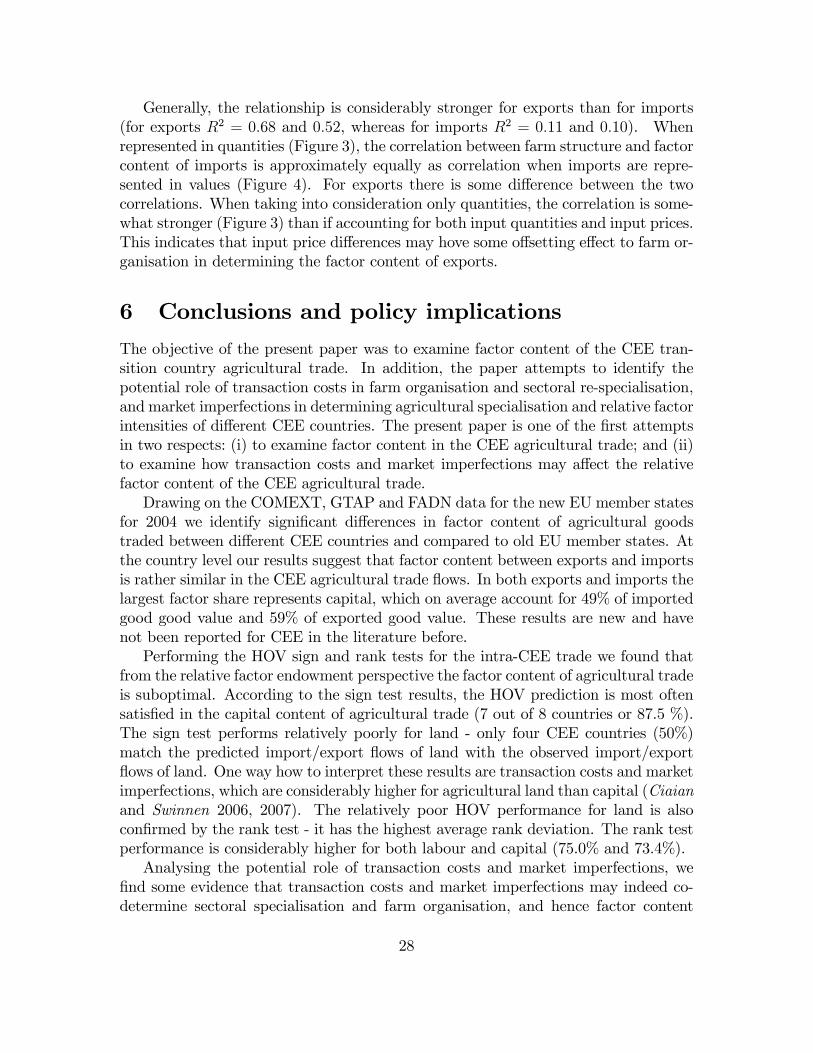
larly important when factor intensity di¤erences are sizeable across sectors. There-fore, �rst we examine inter-sectoral technology di¤erences in CEE. The inter-industrydi¤erences (di¤erences between agricultural activities) in the relative labour intensityacross CEE are plotted in Figure 1. Labour content in percent is on the vertical axisand the seven agricultural activities on the horizontal axis. Dots in the Figure repre-sent the 8 CEE countries. The average values for each sector with the correspondingstandard deviations are reported next to the columns.According to Figure 1, labour intensity is highly heterogenous across agricultural
activities in CEE. For example, on average, the pig and poultry production (14.6%labour) is 2.4 times more labour extensive than horticulture (34.6%). Similarly, ce-real and oilseed production (17.1% labour) requires almost two times less labourthan permanent crops (33.9%). Hence, the inter-industry di¤erences in the relativefactor requirements reported in Figure 1 suggest potential gains from internationalspecialisation in agricultural production and trade.Based on �gures reported in Table 3 and Figure 1, and the HO theory of interna-
17
17.1(3.49)
22.7(4.62)
34.6(9.01)
33.9(6.16)
24.8(4.50)
27.9(6.47)
14.6(4.53)
0.0
10.0
20.0
30.0
40.0
50.0
Cereals,oilseed &technical
Root &technical
crops
Horticulture Permanentcrops
Milk Grazinglivestock
Pigs &poultry
Lab
ou
r co
nte
nt
in a
gri
cult
ura
l p
rod
uct
s, %
Figure 1: Labour content in agricultural goods at farm gate in CEE, 2004. Source:Authors�calculations based on FADN (2008) data.
tional trade we can derive empirical hypothesis of predicted country specialisation.First, they suggest that land abundant countries, such as Latvia and Lithuania, wouldproduce and export products with relatively high land content, and import productswith relatively low land content. According to Table 3, Slovenia has the lowest landendowment per capita, which would suggest the opposite pattern of factor content ofagricultural trade. Second, they suggest that farm labour abundant countries, suchas Poland, which has three times higher agricultural labour endowment than othercomparable CEE economies, e.g. Slovenia, would specialise in production and exportof relatively labour intensive goods compared to agricultural imports. On the otherhand, if other things were equal, agricultural labour scarce countries - the Czech Re-public, Slovenia and Slovakia - would import relatively labour intensive goods andexport labour extensive agricultural products. However, as we will see in the followingsections, other things are not equal in agricultural production and trade conditionsbetween (and within) the CEE transition economies.
4.4 Putting the pieces pieces together: relative factor endow-ment and production technology
This section summarises the key �ndings from sections 4.2 and 4.3 of the relativefactor endowment advantages and technology di¤erences driven by di¤erences in farmorganisation and derives the empirical hypothesis, which will be tested in the following
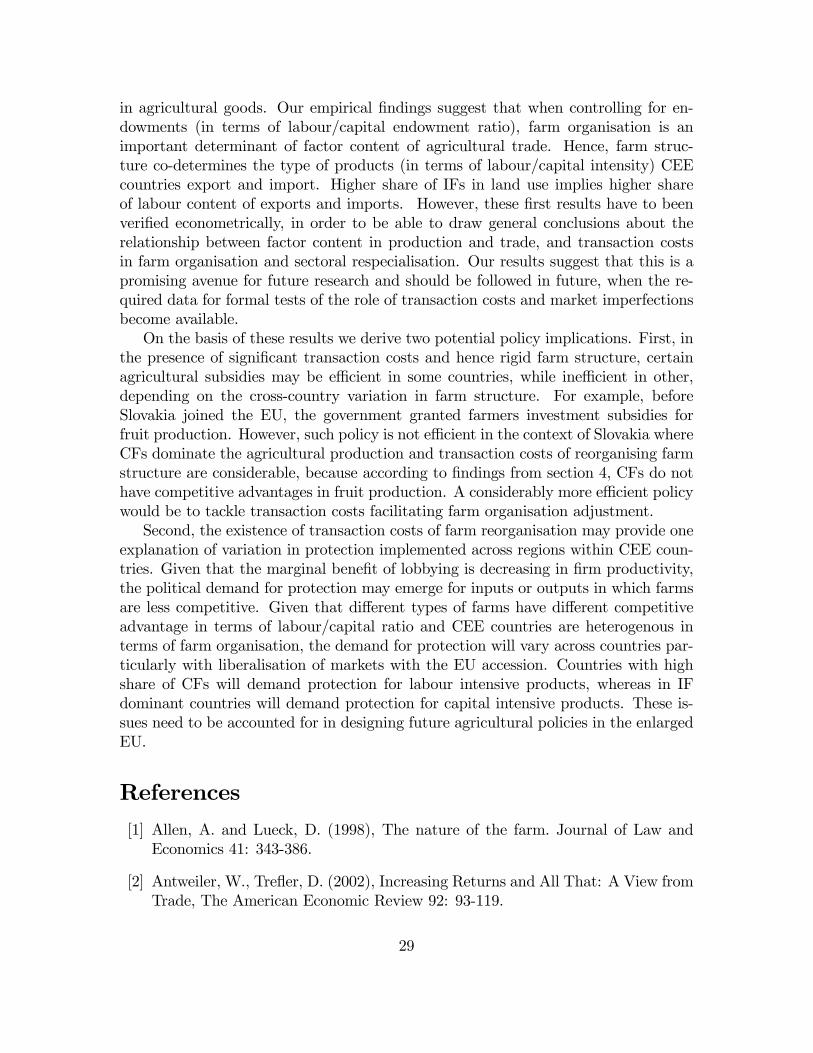
18
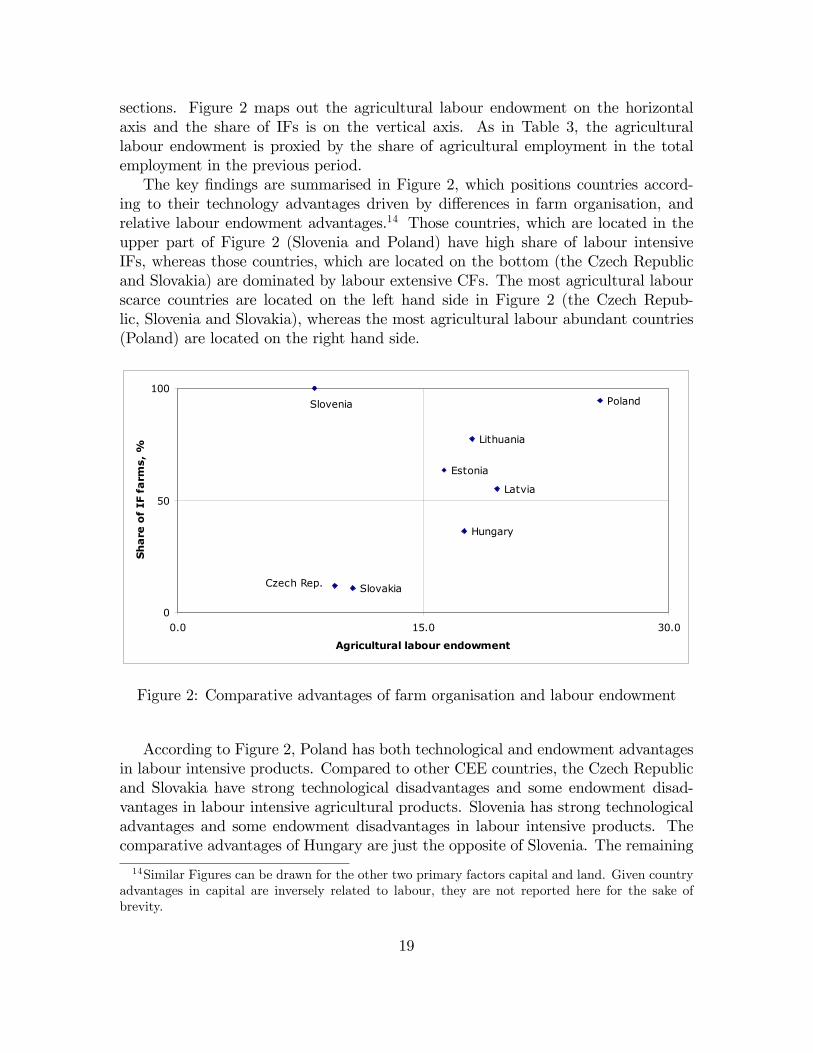
sections. Figure 2 maps out the agricultural labour endowment on the horizontalaxis and the share of IFs is on the vertical axis. As in Table 3, the agriculturallabour endowment is proxied by the share of agricultural employment in the totalemployment in the previous period.The key �ndings are summarised in Figure 2, which positions countries accord-
ing to their technology advantages driven by di¤erences in farm organisation, andrelative labour endowment advantages.14 Those countries, which are located in theupper part of Figure 2 (Slovenia and Poland) have high share of labour intensiveIFs, whereas those countries, which are located on the bottom (the Czech Republicand Slovakia) are dominated by labour extensive CFs. The most agricultural labourscarce countries are located on the left hand side in Figure 2 (the Czech Repub-lic, Slovenia and Slovakia), whereas the most agricultural labour abundant countries(Poland) are located on the right hand side.
Slovakia
PolandSlovenia
Czech Rep.
Hungary
Lithuania
Latvia
Estonia
0
50
100
0.0 15.0 30.0
Agricultural labour endowment
Sh
are
of
IF f
arm
s, %
Figure 2: Comparative advantages of farm organisation and labour endowment
According to Figure 2, Poland has both technological and endowment advantagesin labour intensive products. Compared to other CEE countries, the Czech Republicand Slovakia have strong technological disadvantages and some endowment disad-vantages in labour intensive agricultural products. Slovenia has strong technologicaladvantages and some endowment disadvantages in labour intensive products. Thecomparative advantages of Hungary are just the opposite of Slovenia. The remaining
14Similar Figures can be drawn for the other two primary factors capital and land. Given countryadvantages in capital are inversely related to labour, they are not reported here for the sake ofbrevity.
19
group of countries, the Baltic states, which are located in the central part of Figure 2,have slight labour endowment advantages, but do not have pronounced technologicaladvantages/disadvantages in labour intensive agricultural industries.Based on these �ndings, the Ricardian and HO theories of international trade
suggest that agricultural exports of countries with comparative advantages in labourintensive products (e.g. Poland) would contain lower capital/labour ratio than agri-cultural exports of countries with comparative advantages in capital intensive prod-ucts (e.g. Czech Republic and Slovakia). This is our empirical hypothesis, which wewill examine in the following section.
5 Factor content of CEE agricultural trade: thehypothesis testing
In this section we estimate the factor content of agricultural trade in CEE. We alsoexamine to what extent the CEE economies specialise in export of goods, accordingto their technological and factor endowment advantages identi�ed in the previoussections. First, in section 5.1 we analyse the empirical hypothesis relating the rel-ative country endowment and technology advantages to factor shares of the CEE-EU25 agricultural trade. In section 5.2 we test the HOV prediction formally for theintra-CEE agricultural trade. In section 5.3 we discuss the potential role of farmorganisation in determining the pattern of agricultural trade and factor content offarm output.
5.1 Factor content of CEE-EU agricultural trade
In this section we estimate the factor content of CEE-EU25 agricultural trade. First,we analyse the agricultural exports from CEE to the rest of the world (most of whichgo to EU-25) and imports from the rest of the world (most of which originate from EU-25) to CEE. Second, we examine the factor content hypothesis relating the relativecountry endowment to factor content of agricultural trade. Given that the two groupsof countries are rather heterogenous (i.e. new EU member states are very di¤erentfrom old EU member states), they violate the key underlying HOV assumptions, suchas equal factor prices, identical technologies, etc. Hence, factor content of agriculturaltrade between these two groups of countries cannot be analysed in a standard HOVframework. In order to get around these issues, we process as follows: (i) we analysefactor content of the CEE-EU25 agricultural trade relying on qualitative analysis;and (ii) we calculate not only value of factor content of trade but also quantity ratios,which may reveal the role which factor price di¤erences between the CEE and oldEU member states play.The disaggregated content of factor services of the gross agricultural trade �ows
are reported in Tables 5 and 6. In both Tables columns 2-4 report factor content
20
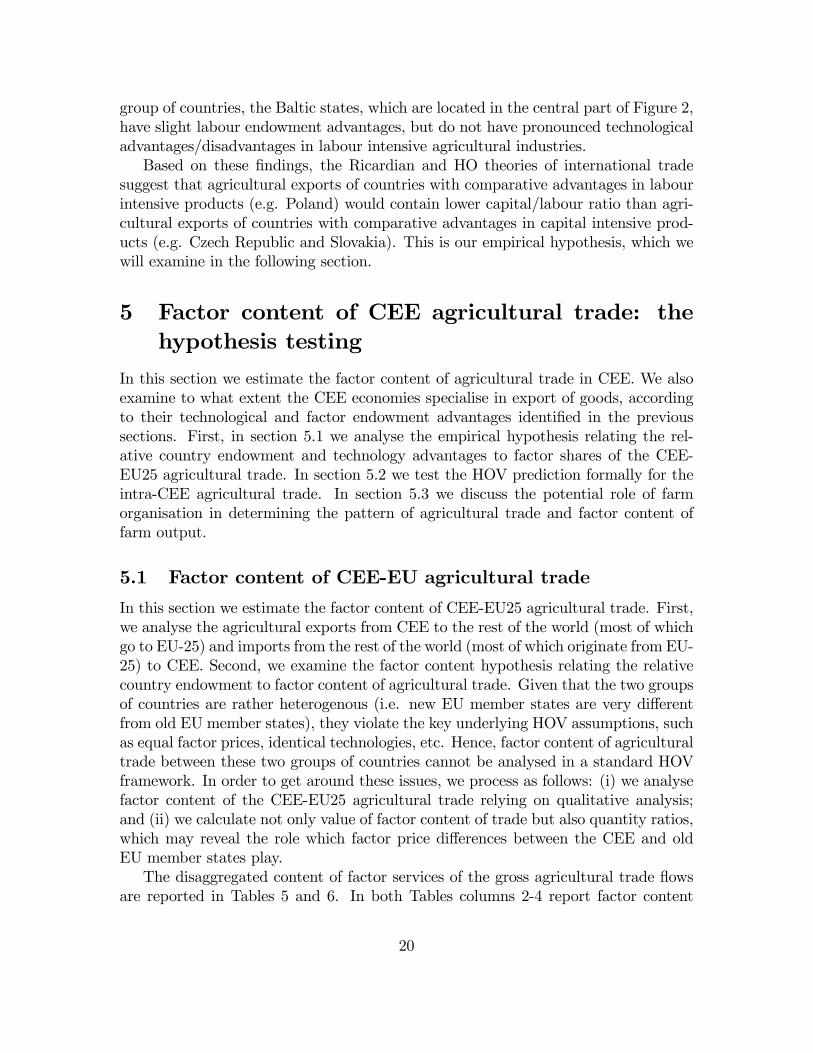
in agricultural imports from EU-25 to CEE; and columns 5-7 report factor contentin agricultural exports from CEE to EU-25. We use EU-25 factor intensities inproduction to obtain factor shares of CEE imports in Tables 5 and 6. This is a goodapproximation given the fact that most of the CEE trade is with EU (more than75%). For exports we use factor intensities in production of CEE countries itself.15
Given that agricultural trade is not balanced for all countries in our sample, the factorcontent is calculated per unit of exports and imports.
Table 5: Factor ratios of agricultural trade in 2004 (in quantities)
Factor ratios in imports Factor ratios in exportsL/A L/K K/A L/A L/K K/A
Czech Republic 13.10 0.87 15.06 7.04 0.90 7.81Estonia 10.68 0.85 12.54 6.79 1.34 5.07Latvia 12.54 0.82 15.23 8.40 1.90 4.42Lithuania 11.39 0.84 13.57 8.74 2.87 3.05Hungary 11.28 0.76 14.78 9.58 0.82 11.62Poland 12.26 0.87 14.07 23.36 2.10 11.10Slovenia 9.65 0.81 11.92 17.58 1.53 11.46Slovakia 10.58 0.76 13.92 5.92 0.97 6.11CEE 11.35 0.82 13.80 9.25 1.40 6.60
Source: Authors�calculations based on Eurostat (2007), FADN (2008) and GTAP(2008) data. Notes: A-land, L-labour, K-capital.
The �gures reported in Table 5 suggest some di¤erences in factor ratios betweenexports and imports. On average, the CEE tend to have higher labour contentrelative to capital, and higher land content relative to capital and labour in exports ascompared to imports. Comparing factor content between countries there is relativelysmall variation for imports. However, a stronger variation is observed for exports.Particularly, Poland and Slovenia have high labour/land ratio in exports, while theopposite holds for the Czech Republic and Slovakia. The Czech Republic, Hungaryand Slovakia have low labour/capital ratio compared to other countries. Hungary,Slovenia, and Poland also have high capital/land ratio in exports.Turning to the analysis of values shares of factor services in the gross trade �ows
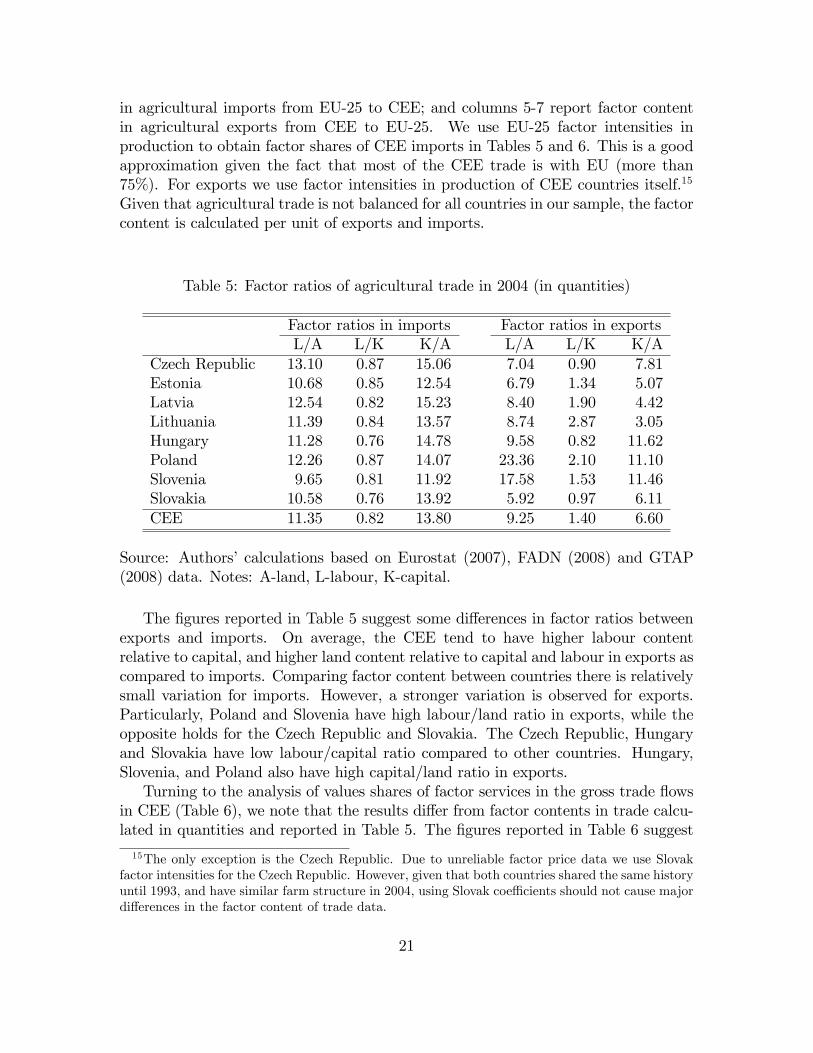
in CEE (Table 6), we note that the results di¤er from factor contents in trade calcu-lated in quantities and reported in Table 5. The �gures reported in Table 6 suggest
15The only exception is the Czech Republic. Due to unreliable factor price data we use Slovakfactor intensities for the Czech Republic. However, given that both countries shared the same historyuntil 1993, and have similar farm structure in 2004, using Slovak coe¢ cients should not cause majordi¤erences in the factor content of trade data.
21
signi�cant di¤erences in factor content between exports and imports. In both exportsand imports the largest factor share represents capital, which on average accounts for58.5% and 49.1% of export and imports value, respectively. The agricultural importsfrom the CEE countries have higher labour content than exports (45.8% and 39.5%),whereas agricultural exports from CEE contain more capital value than imports toCEE (58.5% and 49.1%). The third primary production factor land accounts on aver-age for only 2.0% (5.1%) of import (export) value. In contrast to the results reportedin Table 5, where we account only for relative factor quantities, in Table 6, wherewe account for both relative factor quantities and factor prices, the relative share ofcapital/labour and capital/land and labour/land is higher in exports than in imports.This can be attributed to factor price di¤erences between CEE and trading partners(mostly old EU members states). More expensive capital relative to labour in CEEas compared to old EU member states reverts the ratio of capital to other factors intrade, when factor content of trade is calculated in values.
Table 6: Factor content shares of agricultural trade in 2004 (in values)
Factor shares in imports Factor shares in exportsLand Labour Capital Land Labour Capital
Czech Republic 4.68 47.65 47.66 1.50 28.64 69.86Estonia 5.43 46.12 48.46 0.67 56.09 43.24Latvia 4.70 46.40 48.89 1.21 42.00 56.79Lithuania 5.24 46.44 48.31 2.36 46.82 50.81Hungary 4.96 44.13 50.90 1.99 37.01 61.00Poland 5.04 47.41 47.56 3.05 46.84 50.11Slovenia 5.68 44.80 49.52 3.83 30.80 65.37Slovakia 5.31 43.06 51.63 1.67 27.46 70.88CEE 5.13 45.75 49.12 2.03 39.46 58.51
Source: Authors�calculations based on Eurostat (2007), FADN (2008) and GTAP(2008) data. Notes: For each countries the sum of shares normalised to 1.
According to Table 6, the variation of factor content in imports is rather smallacross the CEE countries. Similar to Table 5, a stronger variation is observed forexports. Slovakia, the Czech Republic and Slovenia have the highest share of capitalcontent in exports, whereas labour is the largest component of agricultural goodexports in Estonia, Lithuania and Poland.On average, the exported goods are more capital intensive than agricultural goods
produced domestically (58.5% and 51.7%). In contrast, locally produced agriculturalgoods are more labour intensive than exported goods (45.9% and 39.5%). The averageland content is slightly higher in the aggregate farm output compared to agricultural
22
exports. Slovakia, Slovenia and Estonia have the largest di¤erences in factor contentbetween farm output and agricultural exports, which raises important questions aboutdi¤erences in the drivers of factor content in agricultural trade.
5.2 Factor content of intra-CEE agricultural trade
In this section we examine the factor content hypothesis for the intra-CEE agriculturaltrade, i.e. we analyse agricultural trade from each CEE country to the rest of the CEEand vice versa. Given that countries within the CEE group are rather homogenous(because of their common past and similar initial conditions), the key underlyingHOV assumptions, such as equal factor prices, identical technologies, are roughlysatis�ed in the data. Hence, factor content of agricultural trade within the CEEgroup can be analysed using the HOV framework.In order to test the HOV hypothesis, we rewrite equation (7) as a di¤erence
between the observed factor content of agricultural trade and the predicted factorcontent of agricultural trade. The obtained equation (8) provides the theoreticalhypothesis for testing the HOV.
HOfr � Ffr � (Vfr � srVfw) = 0 (8)
According to (Davis and Weinstein 2001), equation (8) can be estimated eitheras a world version or country pair version. Most of previous studies have employedthe world version (e.g. Bowen, Leamer and Sveikauskus 1987; Tre�er 1995). Yet thecountry pair version have several methodological advantages of assessing the successof HOV. On the one hand, one does not have to employ and construct endowmentdata for the world as a whole. More speci�cally, the world endowment number iswrong as soon as countries are missing, or as soon as the data for a particular countryare unreliable. On the other hand, and more importantly, it can be shown that thetwo-country version only requires that the speci�c HOV assumptions hold for thetwo countries considered (Brecher and Choudri 1988). As soon as the assumptionsof HOV do not hold for the world as a whole, relying on world endowments is notcorrect.In the present study we adopt a hybrid approach of the world and country pair
versions for estimating equation (8). More precisely, we reformulate HOV for a smallergroup of countries (yet larger than two).16 This allows us to avoid constructing andemploying endowment data for the whole world, which at a reasonable con�dence levelis not available for all agricultural activities and all world countries. In addition, byselecting a homogenous group of CEE transition countries we hope to address theissue that all our sample countries rightly �t into the group - because they satisfy theHOV theoretical requirements and because their data are collected using the same orat least similar methodology.
16Our group of countries include 8 CEEs: Czech Republic, Estonia, Hungary, Latvia, Lithuania,Poland, Slovakia and Slovenia.
23
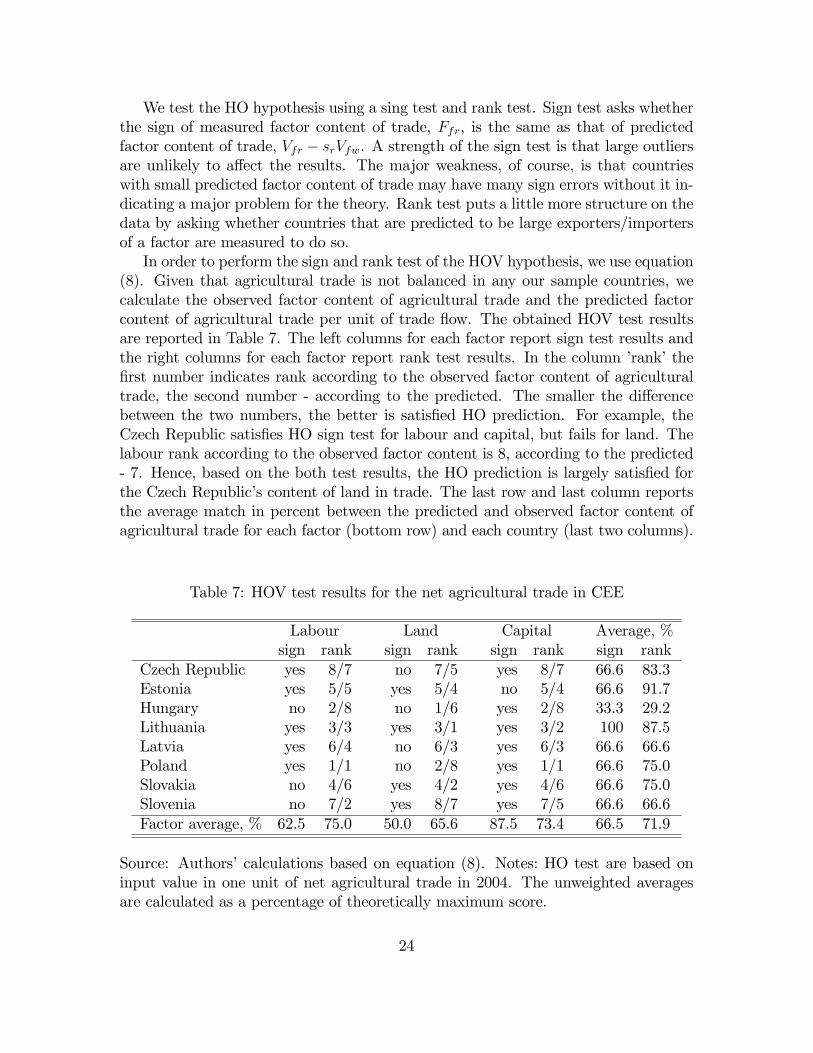
We test the HO hypothesis using a sing test and rank test. Sign test asks whetherthe sign of measured factor content of trade, Ffr, is the same as that of predictedfactor content of trade, Vfr � srVfw. A strength of the sign test is that large outliersare unlikely to a¤ect the results. The major weakness, of course, is that countrieswith small predicted factor content of trade may have many sign errors without it in-dicating a major problem for the theory. Rank test puts a little more structure on thedata by asking whether countries that are predicted to be large exporters/importersof a factor are measured to do so.In order to perform the sign and rank test of the HOV hypothesis, we use equation
(8). Given that agricultural trade is not balanced in any our sample countries, wecalculate the observed factor content of agricultural trade and the predicted factorcontent of agricultural trade per unit of trade �ow. The obtained HOV test resultsare reported in Table 7. The left columns for each factor report sign test results andthe right columns for each factor report rank test results. In the column �rank�the�rst number indicates rank according to the observed factor content of agriculturaltrade, the second number - according to the predicted. The smaller the di¤erencebetween the two numbers, the better is satis�ed HO prediction. For example, theCzech Republic satis�es HO sign test for labour and capital, but fails for land. Thelabour rank according to the observed factor content is 8, according to the predicted- 7. Hence, based on the both test results, the HO prediction is largely satis�ed forthe Czech Republic�s content of land in trade. The last row and last column reportsthe average match in percent between the predicted and observed factor content ofagricultural trade for each factor (bottom row) and each country (last two columns).
Table 7: HOV test results for the net agricultural trade in CEE
Labour Land Capital Average, %sign rank sign rank sign rank sign rank
Czech Republic yes 8/7 no 7/5 yes 8/7 66.6 83.3Estonia yes 5/5 yes 5/4 no 5/4 66.6 91.7Hungary no 2/8 no 1/6 yes 2/8 33.3 29.2Lithuania yes 3/3 yes 3/1 yes 3/2 100 87.5Latvia yes 6/4 no 6/3 yes 6/3 66.6 66.6Poland yes 1/1 no 2/8 yes 1/1 66.6 75.0Slovakia no 4/6 yes 4/2 yes 4/6 66.6 75.0Slovenia no 7/2 yes 8/7 yes 7/5 66.6 66.6Factor average, % 62.5 75.0 50.0 65.6 87.5 73.4 66.5 71.9
Source: Authors�calculations based on equation (8). Notes: HO test are based oninput value in one unit of net agricultural trade in 2004. The unweighted averagesare calculated as a percentage of theoretically maximum score.
24
According to the sign test results reported in Table 7, the HOV prediction is mostoften satis�ed in the capital content of agricultural trade (7 out of 8 countries or 87.5%). The sign test performs relatively poorly for land - only four CEE countries (50%)match the predicted import/export �ows of land with the observed import/export�ows of land. One way how to interpret these results are transaction costs and marketimperfections, which are considerably higher for agricultural land than capital (Ciaianand Swinnen 2006, 2007). The relatively poor HOV performance for land is alsocon�rmed by the rank test - it has the highest average rank deviation. The rank testperformance is considerably higher for both labour and capital (75.0% and 73.4%).In the case of labour, three countries match the predicted and measured ranks exactly- Estonia, Lithuania and Poland. Moreover, Polish trade of agricultural goods also�ts perfectly the predicted capital content with the observed.Turning to country-speci�c results, we note that the least rank deviation is esti-
mated for Estonia. However, the factor content of Estonian agricultural trade failssign test for capital. Lithuania performs the best in terms of both rank and signtests - it satis�ed all three sign tests and the average average rank deviation is only1.00, which is the second lowest in our sample (after Estonia). We estimate thelargest deviations between the predicted and observed labour, land and capital con-tent for Hungary, which fails sign test for two out of three factors and the averagerank deviation is 5.67, which is the highest in our sample.In addition, we also assess the HO prediction with respect to factor content in total
trade (not per unit). This alternative evaluation allows us to assess the magnitude ofdeviations across factors. In terms of magnitudes of the predicted and observed factorcontent of agricultural trade, the HOV test results suggest signi�cant discrepanciesbetween the predicted and observed factor content of agricultural trade in CEE.For example, the Czech Republic and Slovenia export considerably more labour andslightly more land than suggested by the relative factor endowment. In contrast, theCzech Republic and Slovenia export more capital, than would be optimal from theHO perspective. Estonia and Latvia export all three primary factors more than theHOV theorem suggests. Lithuania and Slovakia export too much land but importtoo much labour and capital. Hungary imports more labour, land and capital thancountry�s endowment would suggest. Poland imports too much land and labour,whereas export too much capital.Finally, we also perform the HO sign and rank tests for factor quantities of agri-
cultural trade. The alternative test results yield similar results. Therefore, we do notrepeat the results presented above for factor value of agricultural trade.
5.3 The role of farm organisation
Summarising �ndings from the previous two sections we may conclude that the mea-sured factor content of imported and exported agricultural goods is rather similar inCEE. Second, the CEE transition countries only weakly specialise their international
25
trade in agricultural goods according to their comparative advantages in primaryfactor endowment.In this section we provide a �rst attempt to explain these peculiarities observed
in the CEE agricultural trade. In particular, we aim at assessing the role of marketimperfections and transaction costs. Given that neither market imperfections nortransaction costs are observable, we need to account for them indirectly. Moreover,our sample size (eight observations) does not allow to perform a formal testing of therole of market imperfections and transaction costs.In order to get around these issues, we adopt a qualitative analysis approach to in-
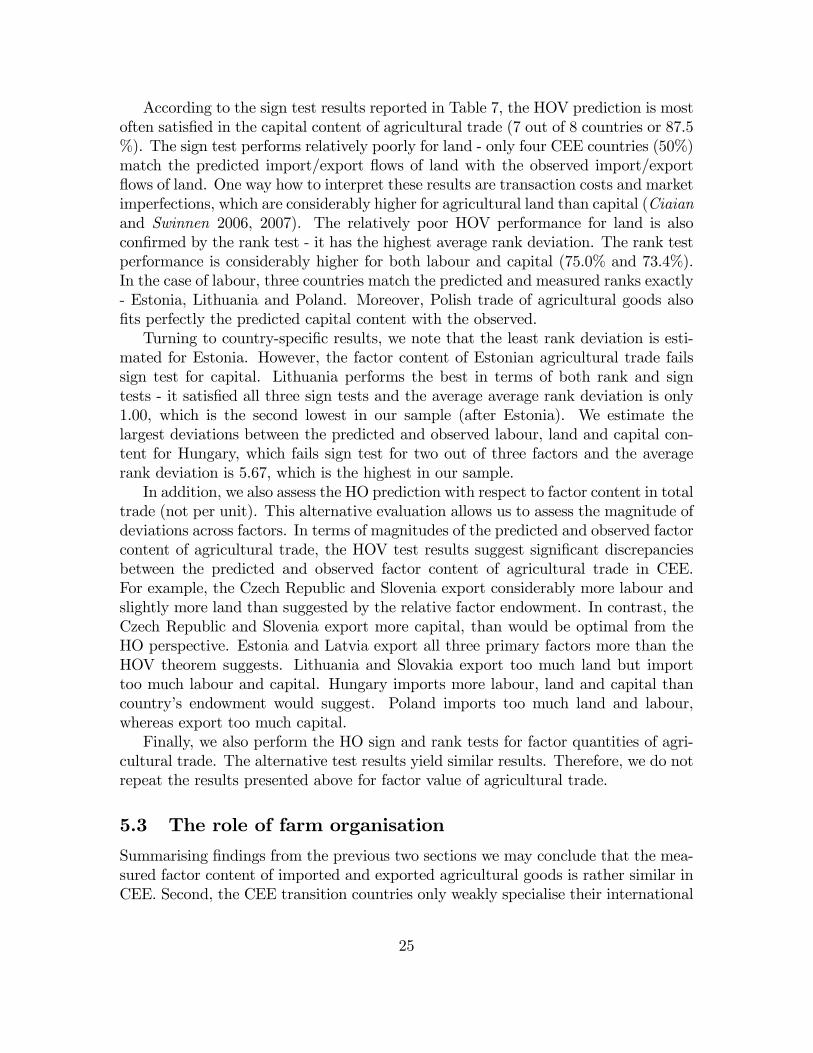
vestigate the potential role of farm organisation in factor content of agricultural trade.More precisely, in order to examine the relationship between farm organisation andfactor content of agricultural trade, in Figures 3 and 4 we plot the share of land usedby IF (x axis) relative to the ratio of labour/capital in trade to labour/capital en-dowments (y axis). Our null hypothesis is that farm organisation is fully endogenousand hence does not a¤ect the factor content of agricultural trade.
y (imports) = 0.0023x + 0.6729R2 = 0.1055
y (exports) = 0.0175x + 0.51R2 = 0.6768
0
1
2
3
0 20 40 60 80 100 120Share of IF on land (% )
Rat
io la
bor/
capi
tal-l
and
quan
tity
in tr
ade
tola
bor/
capi
tal e
ndow
men
ts
Exports Imports Linear (Imports) Linear (Exports)
Figure 3: Farm structure and ratio labour/capital quantity in trade to labour/capitalendowments in 2004
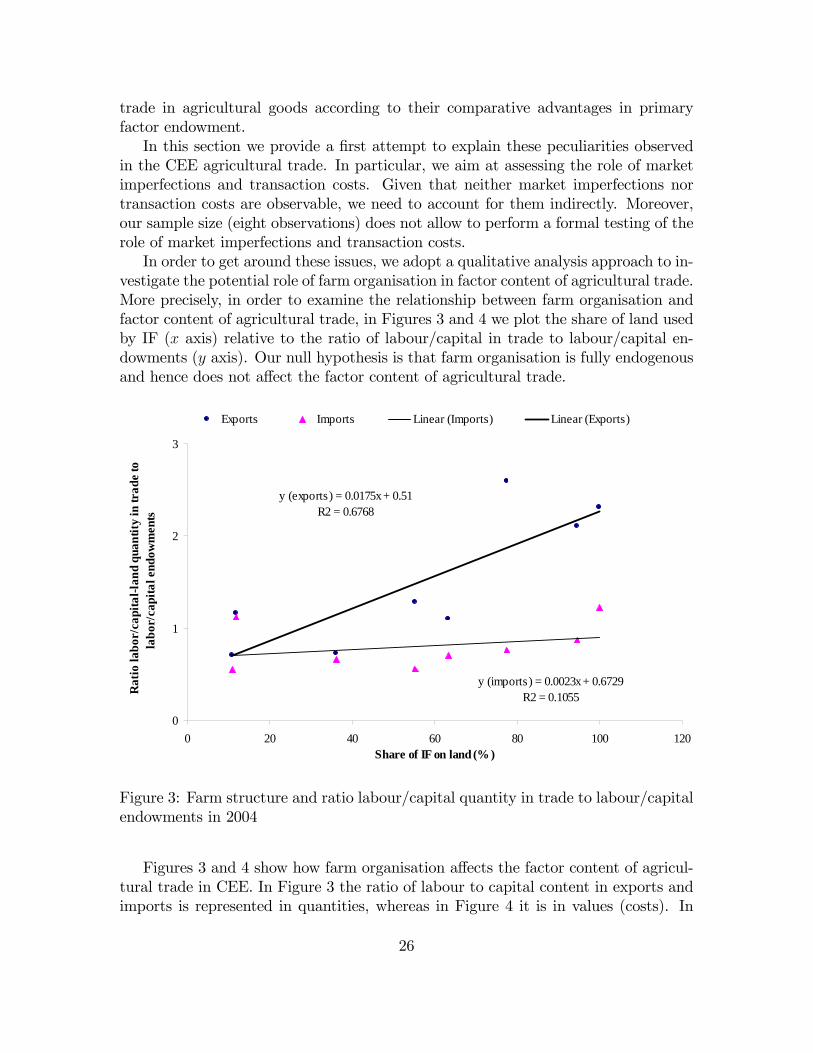
Figures 3 and 4 show how farm organisation a¤ects the factor content of agricul-tural trade in CEE. In Figure 3 the ratio of labour to capital content in exports andimports is represented in quantities, whereas in Figure 4 it is in values (costs). In
26
y (exports) = 0.0054x + 0.3669R2 = 0.5193
y (imports) = 0.0026x + 0.7644R2 = 0.102
0
0.5
1
1.5
0 20 40 60 80 100 120
Share of IF on land (% )
Rat
io la
bor/
capi
tal-l
and
cost
s in
trad
e to
labo
r/ca
pita
l end
owm
ents
Exports Imports Linear (Exports) Linear (Imports)
Figure 4: Farm structure and ratio labour/capital cots in trade to labour/capitalendowments in 2004
other words, the di¤erence is that Figure and 4 takes into consideration di¤erences ininput quantities and input prices in exports and imports whereas Figure 3 accountsonly for di¤erences in input quantities in exports and imports in CEE.The results reported in Figures 3 and 4 suggest that when controlling for en-
dowments (in terms of labour/capital endowment ratio), farm organisation is animportant determinant of factor content of agricultural trade. Hence, farm structureco-determines the type of products (in terms of labour/capital intensity) CEE coun-tries export and import. Higher share of IFs in land use implies higher share of labourcontent of exports and imports. The sign for exports is in line with our expectations.In contrast, our theoretical hypothesis suggests the opposite sign for imports - coun-tries with IF dominance would import more capital intensive products. However, ourresults for imports reported in Figures 3 and 4 do not con�rm this hypothesis. Therelationship for imports have the same sign as for exports, however, the correlationis not signi�cant for imports. This might be due to the fact that imports are de-termined by other factors which we do not control for. For example, di¤erences inconsumers preferences, market size e¤ects (through the number of available varietiesto consumers) and other di¤erences in consumer behaviour, which are neglected inthe present study.
27
Generally, the relationship is considerably stronger for exports than for imports(for exports R2 = 0:68 and 0:52, whereas for imports R2 = 0:11 and 0:10). Whenrepresented in quantities (Figure 3), the correlation between farm structure and factorcontent of imports is approximately equally as correlation when imports are repre-sented in values (Figure 4). For exports there is some di¤erence between the twocorrelations. When taking into consideration only quantities, the correlation is some-what stronger (Figure 3) than if accounting for both input quantities and input prices.This indicates that input price di¤erences may hove some o¤setting e¤ect to farm or-ganisation in determining the factor content of exports.
6 Conclusions and policy implications
The objective of the present paper was to examine factor content of the CEE tran-sition country agricultural trade. In addition, the paper attempts to identify thepotential role of transaction costs in farm organisation and sectoral re-specialisation,and market imperfections in determining agricultural specialisation and relative factorintensities of di¤erent CEE countries. The present paper is one of the �rst attemptsin two respects: (i) to examine factor content in the CEE agricultural trade; and (ii)to examine how transaction costs and market imperfections may a¤ect the relativefactor content of the CEE agricultural trade.Drawing on the COMEXT, GTAP and FADN data for the new EU member states
for 2004 we identify signi�cant di¤erences in factor content of agricultural goodstraded between di¤erent CEE countries and compared to old EU member states. Atthe country level our results suggest that factor content between exports and importsis rather similar in the CEE agricultural trade �ows. In both exports and imports thelargest factor share represents capital, which on average account for 49% of importedgood good value and 59% of exported good value. These results are new and havenot been reported for CEE in the literature before.Performing the HOV sign and rank tests for the intra-CEE trade we found that
from the relative factor endowment perspective the factor content of agricultural tradeis suboptimal. According to the sign test results, the HOV prediction is most oftensatis�ed in the capital content of agricultural trade (7 out of 8 countries or 87.5 %).The sign test performs relatively poorly for land - only four CEE countries (50%)match the predicted import/export �ows of land with the observed import/export�ows of land. One way how to interpret these results are transaction costs and marketimperfections, which are considerably higher for agricultural land than capital (Ciaianand Swinnen 2006, 2007). The relatively poor HOV performance for land is alsocon�rmed by the rank test - it has the highest average rank deviation. The rank testperformance is considerably higher for both labour and capital (75.0% and 73.4%).Analysing the potential role of transaction costs and market imperfections, we
�nd some evidence that transaction costs and market imperfections may indeed co-determine sectoral specialisation and farm organisation, and hence factor content
28
in agricultural goods. Our empirical �ndings suggest that when controlling for en-dowments (in terms of labour/capital endowment ratio), farm organisation is animportant determinant of factor content of agricultural trade. Hence, farm struc-ture co-determines the type of products (in terms of labour/capital intensity) CEEcountries export and import. Higher share of IFs in land use implies higher shareof labour content of exports and imports. However, these �rst results have to beenveri�ed econometrically, in order to be able to draw general conclusions about therelationship between factor content in production and trade, and transaction costsin farm organisation and sectoral respecialisation. Our results suggest that this is apromising avenue for future research and should be followed in future, when the re-quired data for formal tests of the role of transaction costs and market imperfectionsbecome available.On the basis of these results we derive two potential policy implications. First, in
the presence of signi�cant transaction costs and hence rigid farm structure, certainagricultural subsidies may be e¢ cient in some countries, while ine¢ cient in other,depending on the cross-country variation in farm structure. For example, beforeSlovakia joined the EU, the government granted farmers investment subsidies forfruit production. However, such policy is not e¢ cient in the context of Slovakia whereCFs dominate the agricultural production and transaction costs of reorganising farmstructure are considerable, because according to �ndings from section 4, CFs do nothave competitive advantages in fruit production. A considerably more e¢ cient policywould be to tackle transaction costs facilitating farm organisation adjustment.Second, the existence of transaction costs of farm reorganisation may provide one
explanation of variation in protection implemented across regions within CEE coun-tries. Given that the marginal bene�t of lobbying is decreasing in �rm productivity,the political demand for protection may emerge for inputs or outputs in which farmsare less competitive. Given that di¤erent types of farms have di¤erent competitiveadvantage in terms of labour/capital ratio and CEE countries are heterogenous interms of farm organisation, the demand for protection will vary across countries par-ticularly with liberalisation of markets with the EU accession. Countries with highshare of CFs will demand protection for labour intensive products, whereas in IFdominant countries will demand protection for capital intensive products. These is-sues need to be accounted for in designing future agricultural policies in the enlargedEU.
References
[1] Allen, A. and Lueck, D. (1998), The nature of the farm. Journal of Law andEconomics 41: 343-386.
[2] Antweiler, W., Tre�er, D. (2002), Increasing Returns and All That: A View fromTrade, The American Economic Review 92: 93-119.
29
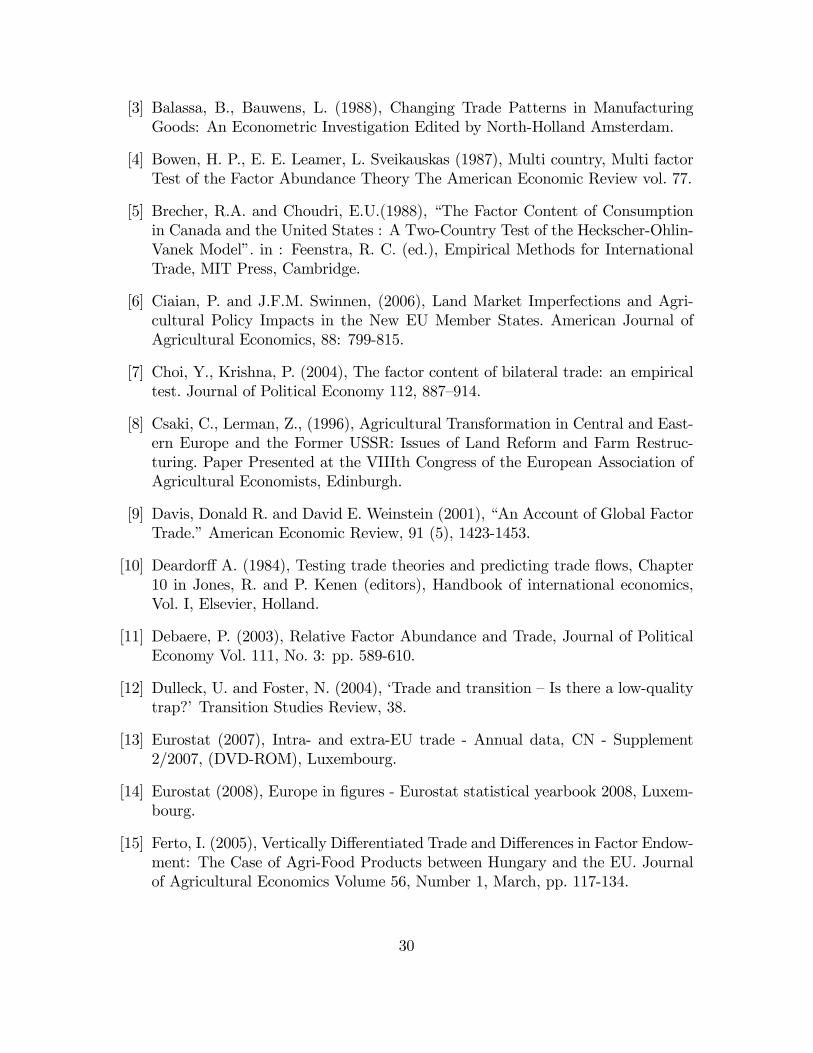
[3] Balassa, B., Bauwens, L. (1988), Changing Trade Patterns in ManufacturingGoods: An Econometric Investigation Edited by North-Holland Amsterdam.
[4] Bowen, H. P., E. E. Leamer, L. Sveikauskas (1987), Multi country, Multi factorTest of the Factor Abundance Theory The American Economic Review vol. 77.
[5] Brecher, R.A. and Choudri, E.U.(1988), �The Factor Content of Consumptionin Canada and the United States : A Two-Country Test of the Heckscher-Ohlin-Vanek Model�. in : Feenstra, R. C. (ed.), Empirical Methods for InternationalTrade, MIT Press, Cambridge.
[6] Ciaian, P. and J.F.M. Swinnen, (2006), Land Market Imperfections and Agri-cultural Policy Impacts in the New EU Member States. American Journal ofAgricultural Economics, 88: 799-815.
[7] Choi, Y., Krishna, P. (2004), The factor content of bilateral trade: an empiricaltest. Journal of Political Economy 112, 887�914.
[8] Csaki, C., Lerman, Z., (1996), Agricultural Transformation in Central and East-ern Europe and the Former USSR: Issues of Land Reform and Farm Restruc-turing. Paper Presented at the VIIIth Congress of the European Association ofAgricultural Economists, Edinburgh.
[9] Davis, Donald R. and David E. Weinstein (2001), �An Account of Global FactorTrade.�American Economic Review, 91 (5), 1423-1453.
[10] Deardor¤ A. (1984), Testing trade theories and predicting trade �ows, Chapter10 in Jones, R. and P. Kenen (editors), Handbook of international economics,Vol. I, Elsevier, Holland.
[11] Debaere, P. (2003), Relative Factor Abundance and Trade, Journal of PoliticalEconomy Vol. 111, No. 3: pp. 589-610.
[12] Dulleck, U. and Foster, N. (2004), �Trade and transition �Is there a low-qualitytrap?�Transition Studies Review, 38.
[13] Eurostat (2007), Intra- and extra-EU trade - Annual data, CN - Supplement2/2007, (DVD-ROM), Luxembourg.
[14] Eurostat (2008), Europe in �gures - Eurostat statistical yearbook 2008, Luxem-bourg.
[15] Ferto, I. (2005), Vertically Di¤erentiated Trade and Di¤erences in Factor Endow-ment: The Case of Agri-Food Products between Hungary and the EU. Journalof Agricultural Economics Volume 56, Number 1, March, pp. 117-134.
30
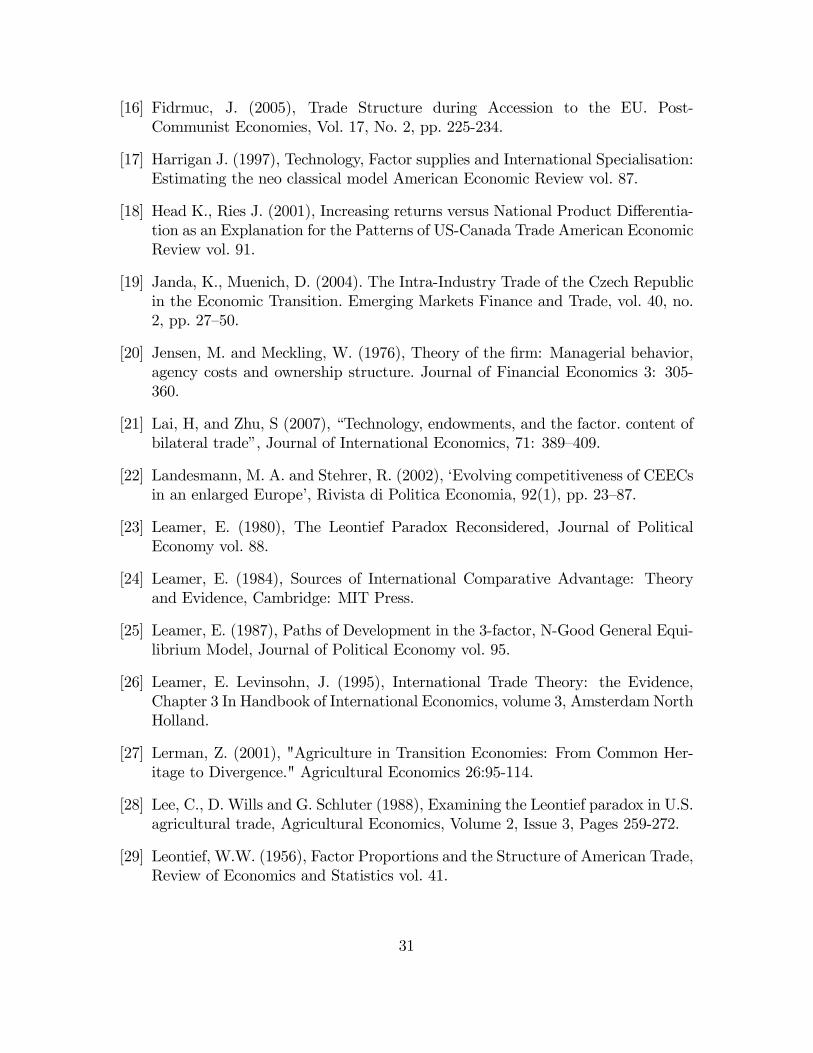
[16] Fidrmuc, J. (2005), Trade Structure during Accession to the EU. Post-Communist Economies, Vol. 17, No. 2, pp. 225-234.
[17] Harrigan J. (1997), Technology, Factor supplies and International Specialisation:Estimating the neo classical model American Economic Review vol. 87.
[18] Head K., Ries J. (2001), Increasing returns versus National Product Di¤erentia-tion as an Explanation for the Patterns of US-Canada Trade American EconomicReview vol. 91.
[19] Janda, K., Muenich, D. (2004). The Intra-Industry Trade of the Czech Republicin the Economic Transition. Emerging Markets Finance and Trade, vol. 40, no.2, pp. 27�50.
[20] Jensen, M. and Meckling, W. (1976), Theory of the �rm: Managerial behavior,agency costs and ownership structure. Journal of Financial Economics 3: 305-360.
[21] Lai, H, and Zhu, S (2007), �Technology, endowments, and the factor. content ofbilateral trade�, Journal of International Economics, 71: 389�409.
[22] Landesmann, M. A. and Stehrer, R. (2002), �Evolving competitiveness of CEECsin an enlarged Europe�, Rivista di Politica Economia, 92(1), pp. 23�87.
[23] Leamer, E. (1980), The Leontief Paradox Reconsidered, Journal of PoliticalEconomy vol. 88.
[24] Leamer, E. (1984), Sources of International Comparative Advantage: Theoryand Evidence, Cambridge: MIT Press.
[25] Leamer, E. (1987), Paths of Development in the 3-factor, N-Good General Equi-librium Model, Journal of Political Economy vol. 95.
[26] Leamer, E. Levinsohn, J. (1995), International Trade Theory: the Evidence,Chapter 3 In Handbook of International Economics, volume 3, Amsterdam NorthHolland.
[27] Lerman, Z. (2001), "Agriculture in Transition Economies: From Common Her-itage to Divergence." Agricultural Economics 26:95-114.
[28] Lee, C., D. Wills and G. Schluter (1988), Examining the Leontief paradox in U.S.agricultural trade, Agricultural Economics, Volume 2, Issue 3, Pages 259-272.
[29] Leontief, W.W. (1956), Factor Proportions and the Structure of American Trade,Review of Economics and Statistics vol. 41.
31
[30] Nemen, D. (1995), Trade Liberalization with Eastern Nations: Some DistributionIssues. European Economic Review 39, pp. 622-632.
[31] Olley, G. S., and A. Pakes (1996), The dynamics of productivity in the telecom-munications equipment industry. Econometrica 64: 1263�1297.
[32] Pollak, R. A., (1985), A transaction costs approach to families and households,Journal of Economic Literature, 23, June, 581-608.
[33] Prosterman, R.L., Rolfes, L. (Jr.)., (1999), Review of the Legal Basis for Agri-cultural Land Markets in Lithuania, Poland and Romania, in Csaki & Lermaneds., Structural Changes in the Farming Sectors in Central and Eastern Europe:Lessons for EU Accession.
[34] Rozelle S., and J.F.M. Swinnen (2004), Success and failure of reforms: Insightsfrom transition agriculture, Journal of Economic Literature, XLII, 404-456.
[35] Schluter G. and Gene K. Lee (1991), Is Leontief�s Paradox Applicable to U.S.Agricultural Trade? Western Journal of Agricultural Economics 03 (02): 165-171.
[36] Schmitt, G., (1991), Why is the Agriculture of Advanced Western Countriesstill Organised by Family Farms? Will this continue to be so in the Future?European Review of Agricultural Economics 18: 443-458.
[37] Schott, P. (2003), "One Size Fits All? Heckscher-Ohlin Specialisation in GlobalProduction." American Economic Review 93, no. 3 (2003): 686-708.
[38] Schott, P. (2004), Across Product versus Within-Product Specialisation in In-ternational Trade, Quarterly Journal of Economics vol. 119.
[39] Swain, N., (1999), Agricultural Restitution and Co-operative Transformation inthe Czech Republic, Hungary and Slovakia. Europe-Asia Studies 51:1199 1219.
[40] Tre�er, D. (1995), The case of the Missing Trade and Other Mysteries, TheAmerican Economic review, vol. 85.
[41] World Bank (2005), From Disintegration into Reintegration: Eastern Europeand the Former Soviet Union in International Trade.
[42] Woerz, J. (2003), �Skill upgrading in Central and Eastern European manufac-turing trade�, The Empirical Economics Letters, 2(6), pp. 247�56.
[43] Woerz, J. (2005), Dynamics of Trade Specialization in Developed and Less De-veloped Countries. Emerging Markets Finance and Trade, vol. 41, no. 3, pp.92�111.
32
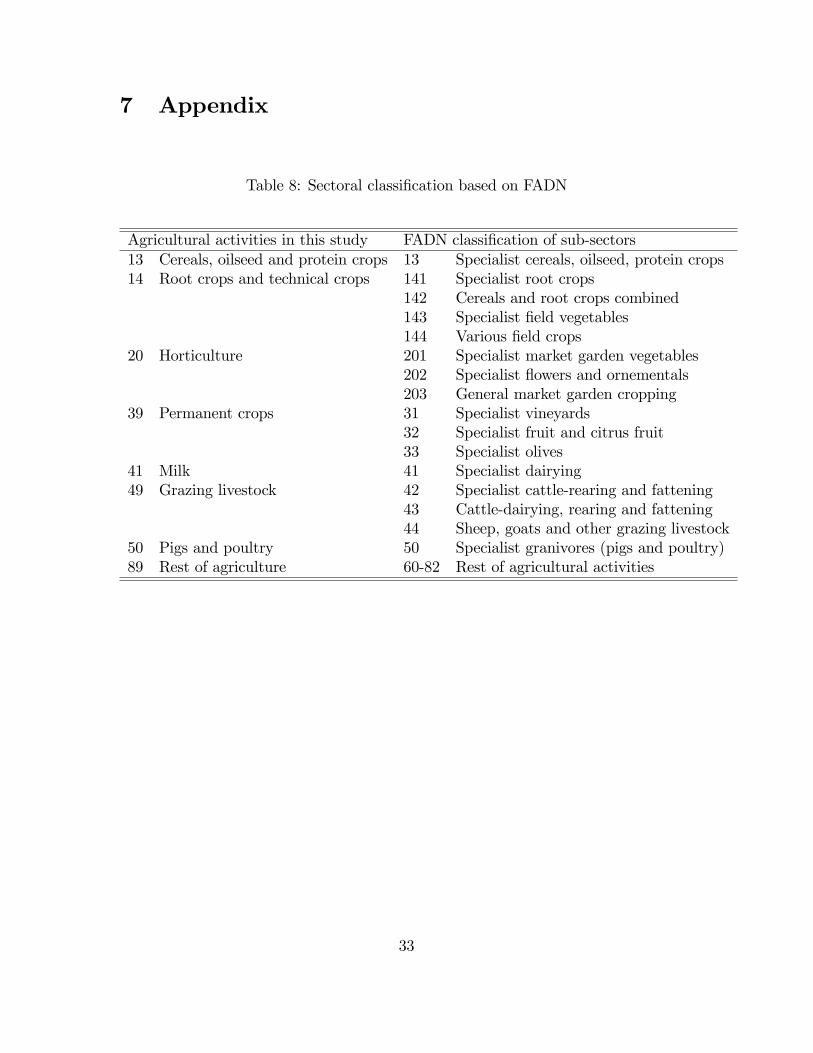
7 Appendix
Table 8: Sectoral classi�cation based on FADN
Agricultural activities in this study FADN classi�cation of sub-sectors13 Cereals, oilseed and protein crops 13 Specialist cereals, oilseed, protein crops14 Root crops and technical crops 141 Specialist root crops
142 Cereals and root crops combined143 Specialist �eld vegetables144 Various �eld crops
20 Horticulture 201 Specialist market garden vegetables202 Specialist �owers and ornementals203 General market garden cropping
39 Permanent crops 31 Specialist vineyards32 Specialist fruit and citrus fruit33 Specialist olives
41 Milk 41 Specialist dairying49 Grazing livestock 42 Specialist cattle-rearing and fattening
43 Cattle-dairying, rearing and fattening44 Sheep, goats and other grazing livestock
50 Pigs and poultry 50 Specialist granivores (pigs and poultry)89 Rest of agriculture 60-82 Rest of agricultural activities
33


![[eng] AGRICULTURAL PRICES : Price indices and absolute ... · agricultural production Eurostat publications on agricultural price statistics Page 5 Signes et abréviations employés](https://static.fdocuments.fr/doc/165x107/5f82febcf143ec7a1a0d0d02/eng-agricultural-prices-price-indices-and-absolute-agricultural-production.jpg)