
Chapitre 4 Ciments - Université Paris-Sud€¦ · BIOMATERIAUX Chapitre 4 – Ciments Chapitre 4D...
23
BIOMATERIAUX Chapitre 4 – Ciments Chapitre 4D – Qq applications du R.S. D. Bazin Laboratoire de Physique des Solides UMR 8502, Université Paris Sud, Bât 510 91405 Orsay Cedex, France.
Transcript of Chapitre 4 Ciments - Université Paris-Sud€¦ · BIOMATERIAUX Chapitre 4 – Ciments Chapitre 4D...
BIOMATERIAUX
Chapitre 4 – Ciments
Chapitre 4D – Qq applications du R.S.
D. Bazin
Laboratoire de Physique des Solides UMR 8502,
Université Paris Sud, Bât 510 91405 Orsay Cedex, France.
PLAN Chapitre 4 Les ciments phosphocalciques
Chapitre 4A L’adhésion cellule – biomatériaux
Chapitre 4B Les ciments phosphatiques
Chapitre 4C Quelques généralités sur le rayonnement synchrotron
Chapitre 4D Quelques applications du R. S.
Chapitre 4D.1 Expériences de µdiffraction
Chapitre 4D.1.a Expérience de µdiffraction
Chapitre 4D.1.b Newly formed bone at prosthesis interface
Chapitre 4D.1.c Interface bone and a SiO2-stabilized TCP bioceramic
Chapitre 4D.2 Expériences de µfluorescence X
Chapitre 4D.2.a Montage expérimental
Chapitre 4D.2.b Imagerie cellulaire
Chapitre 4D.2.c Imagerie d’une dent
Chapitre 4D.2.d Cartographie du Pb et du Ca dans l’os
Chapitre 4D.3 Tomography Chapitre 4D.3.a 4D chemical imaging based on a third-generation S.R.
Chapitre 4D.3.b Synchrotron X-ray microtomography
Chapitre 4E La spectroscopie d’absorption X (Xanes – Exafs)
Chapitre 4D.1 .1 Expériences de µdiffraction
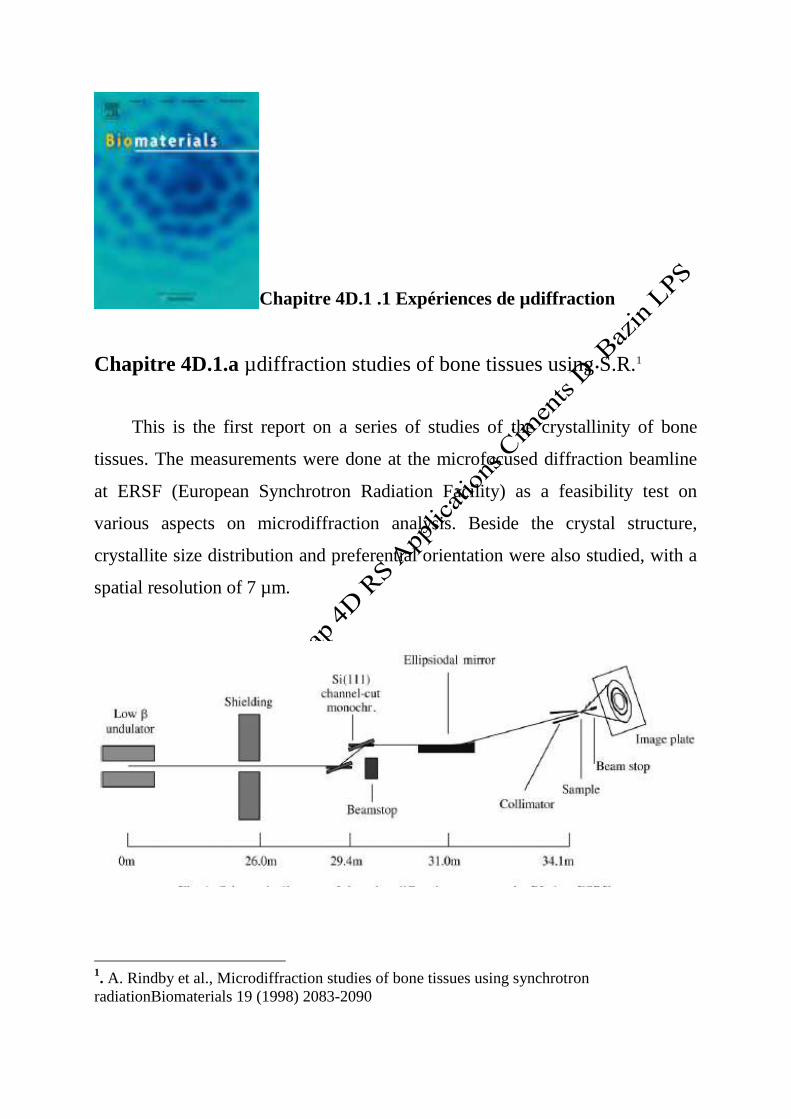
Chapitre 4D.1.a µdiffraction studies of bone tissues using S.R.1
This is the first report on a series of studies of the crystallinity of bone
tissues. The measurements were done at the microfocused diffraction beamline
at ERSF (European Synchrotron Radiation Facility) as a feasibility test on
various aspects on microdiffraction analysis. Beside the crystal structure,
crystallite size distribution and preferential orientation were also studied, with a
spatial resolution of 7 µm.
1. A. Rindby et al., Microdiffraction studies of bone tissues using synchrotron
radiationBiomaterials 19 (1998) 2083-2090
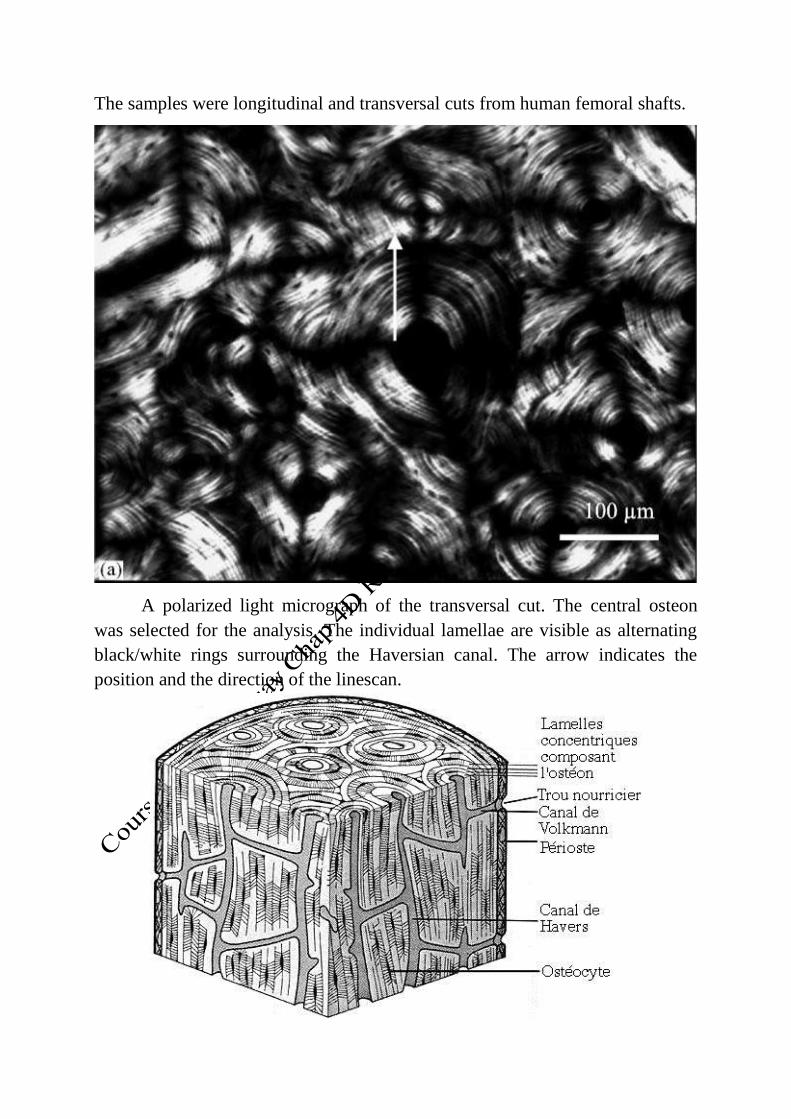
The samples were longitudinal and transversal cuts from human femoral shafts.
A polarized light micrograph of the transversal cut. The central osteon
was selected for the analysis. The individual lamellae are visible as alternating
black/white rings surrounding the Haversian canal. The arrow indicates the
position and the direction of the linescan.
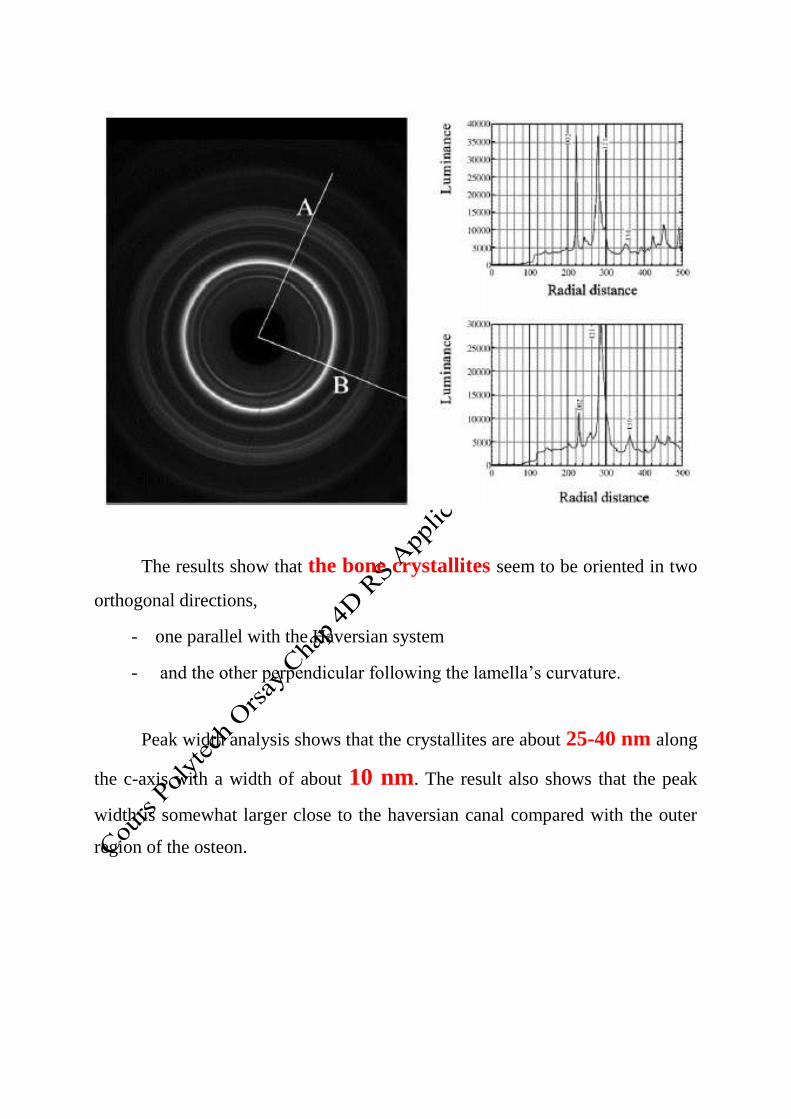
The results show that the bone crystallites seem to be oriented in two
orthogonal directions,
- one parallel with the Haversian system
- and the other perpendicular following the lamella’s curvature.
Peak width analysis shows that the crystallites are about 25-40 nm along
the c-axis with a width of about 10 nm. The result also shows that the peak
width is somewhat larger close to the haversian canal compared with the outer
region of the osteon.
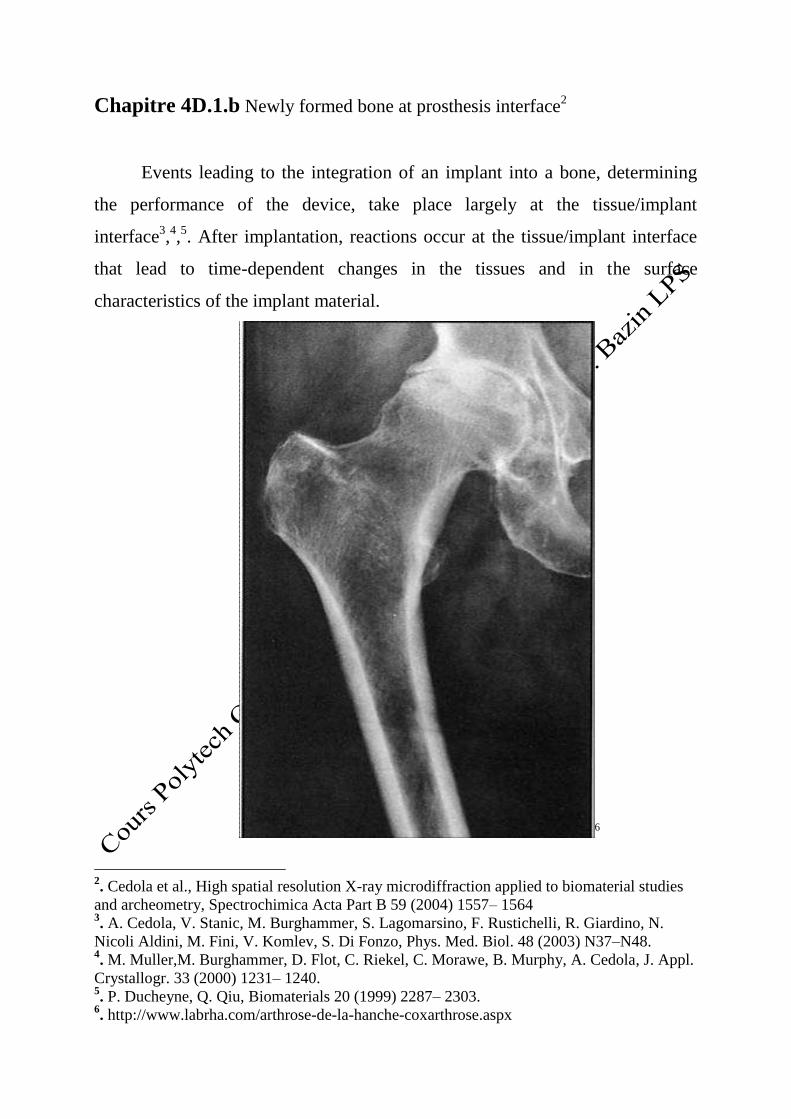
Chapitre 4D.1.b Newly formed bone at prosthesis interface2
Events leading to the integration of an implant into a bone, determining
the performance of the device, take place largely at the tissue/implant
interface3,4,5. After implantation, reactions occur at the tissue/implant interface
that lead to time-dependent changes in the tissues and in the surface
characteristics of the implant material.
6
2. Cedola et al., High spatial resolution X-ray microdiffraction applied to biomaterial studies
and archeometry, Spectrochimica Acta Part B 59 (2004) 1557– 1564 3. A. Cedola, V. Stanic, M. Burghammer, S. Lagomarsino, F. Rustichelli, R. Giardino, N.
Nicoli Aldini, M. Fini, V. Komlev, S. Di Fonzo, Phys. Med. Biol. 48 (2003) N37–N48. 4. M. Muller,M. Burghammer, D. Flot, C. Riekel, C. Morawe, B. Murphy, A. Cedola, J. Appl.
Crystallogr. 33 (2000) 1231– 1240. 5. P. Ducheyne, Q. Qiu, Biomaterials 20 (1999) 2287– 2303.
6. http://www.labrha.com/arthrose-de-la-hanche-coxarthrose.aspx
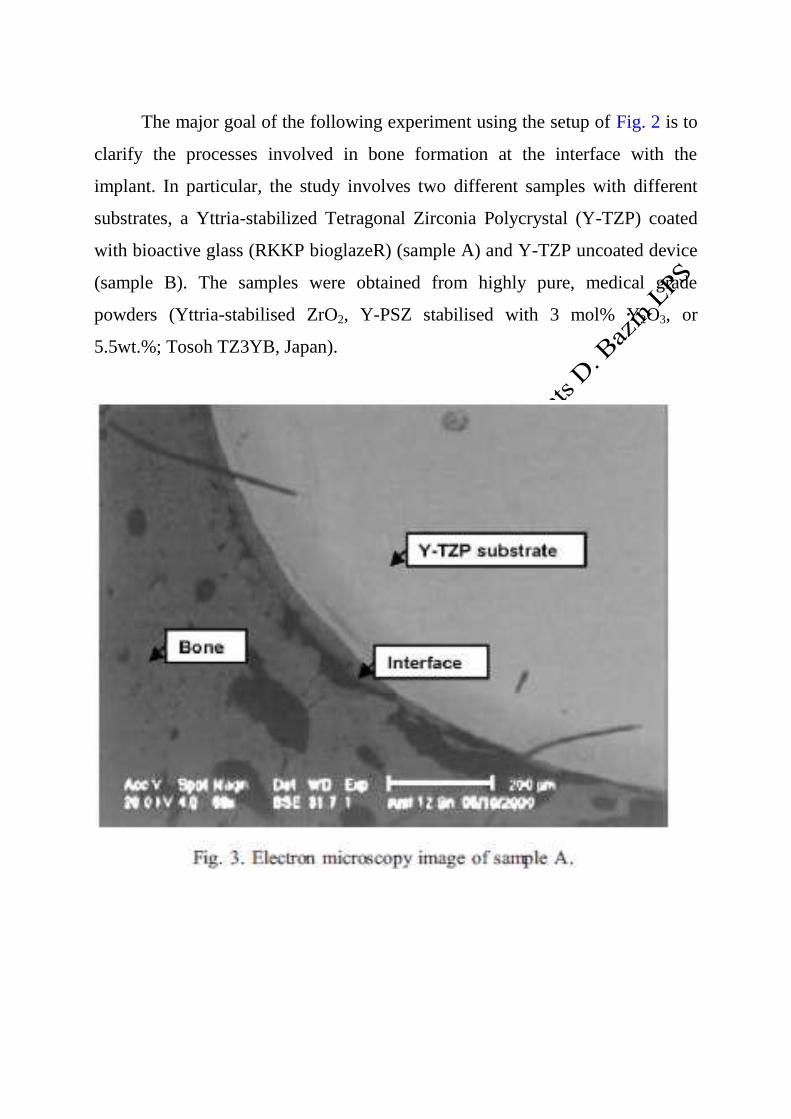
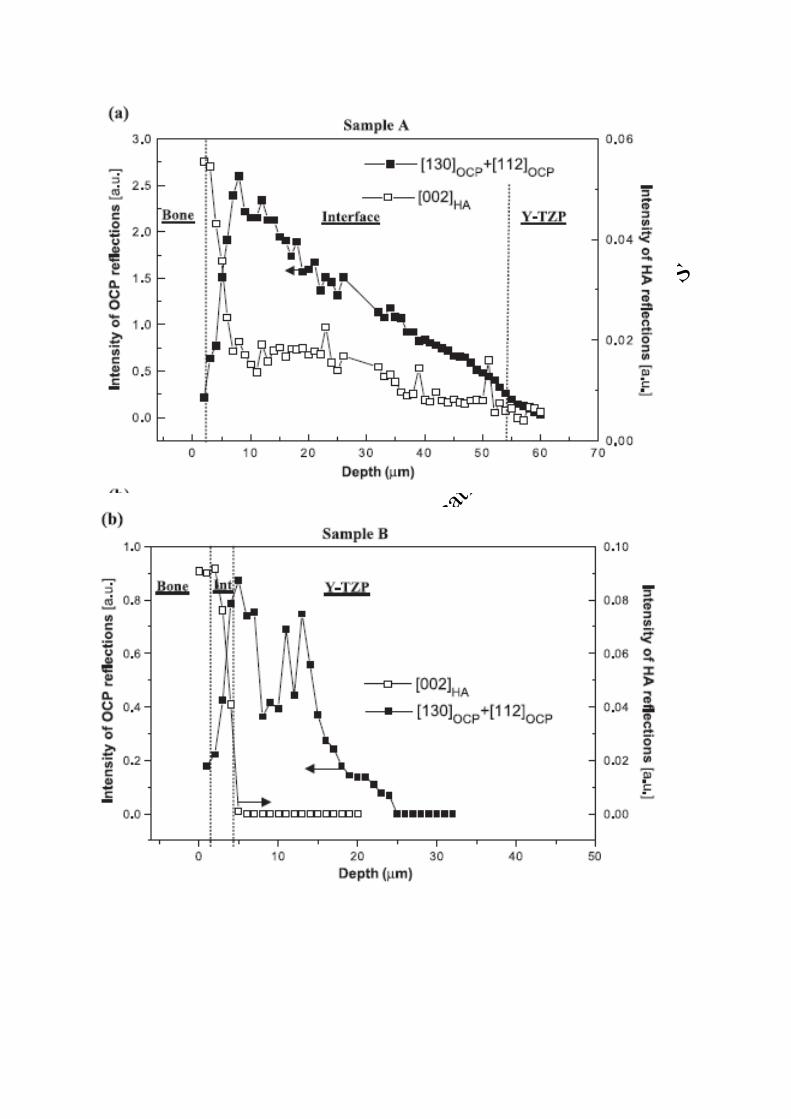
The major goal of the following experiment using the setup of Fig. 2 is to
clarify the processes involved in bone formation at the interface with the
implant. In particular, the study involves two different samples with different
substrates, a Yttria-stabilized Tetragonal Zirconia Polycrystal (Y-TZP) coated
with bioactive glass (RKKP bioglazeR) (sample A) and Y-TZP uncoated device
(sample B). The samples were obtained from highly pure, medical grade
powders (Yttria-stabilised ZrO2, Y-PSZ stabilised with 3 mol% Y2O3, or
5.5wt.%; Tosoh TZ3YB, Japan).
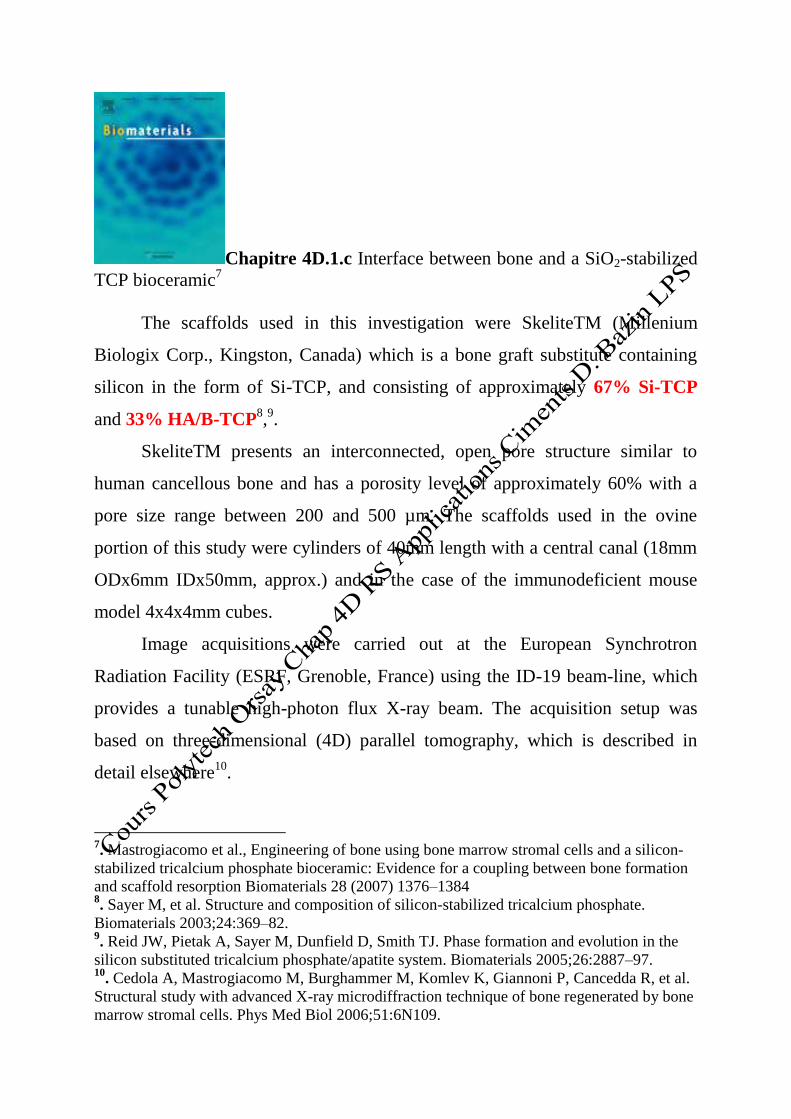
Chapitre 4D.1.c Interface between bone and a SiO2-stabilized
TCP bioceramic7
The scaffolds used in this investigation were SkeliteTM (Millenium
Biologix Corp., Kingston, Canada) which is a bone graft substitute containing
silicon in the form of Si-TCP, and consisting of approximately 67% Si-TCP
and 33% HA/B-TCP8,9.
SkeliteTM presents an interconnected, open pore structure similar to
human cancellous bone and has a porosity level of approximately 60% with a
pore size range between 200 and 500 µm. The scaffolds used in the ovine
portion of this study were cylinders of 40mm length with a central canal (18mm
ODx6mm IDx50mm, approx.) and in the case of the immunodeficient mouse
model 4x4x4mm cubes.
Image acquisitions were carried out at the European Synchrotron
Radiation Facility (ESRF, Grenoble, France) using the ID-19 beam-line, which
provides a tunable high-photon flux X-ray beam. The acquisition setup was
based on three-dimensional (4D) parallel tomography, which is described in
detail elsewhere10
.
7. Mastrogiacomo et al., Engineering of bone using bone marrow stromal cells and a silicon-
stabilized tricalcium phosphate bioceramic: Evidence for a coupling between bone formation
and scaffold resorption Biomaterials 28 (2007) 1376–1384 8. Sayer M, et al. Structure and composition of silicon-stabilized tricalcium phosphate.
Biomaterials 2003;24:369–82. 9. Reid JW, Pietak A, Sayer M, Dunfield D, Smith TJ. Phase formation and evolution in the
silicon substituted tricalcium phosphate/apatite system. Biomaterials 2005;26:2887–97. 10
. Cedola A, Mastrogiacomo M, Burghammer M, Komlev K, Giannoni P, Cancedda R, et al.
Structural study with advanced X-ray microdiffraction technique of bone regenerated by bone
marrow stromal cells. Phys Med Biol 2006;51:6N109.
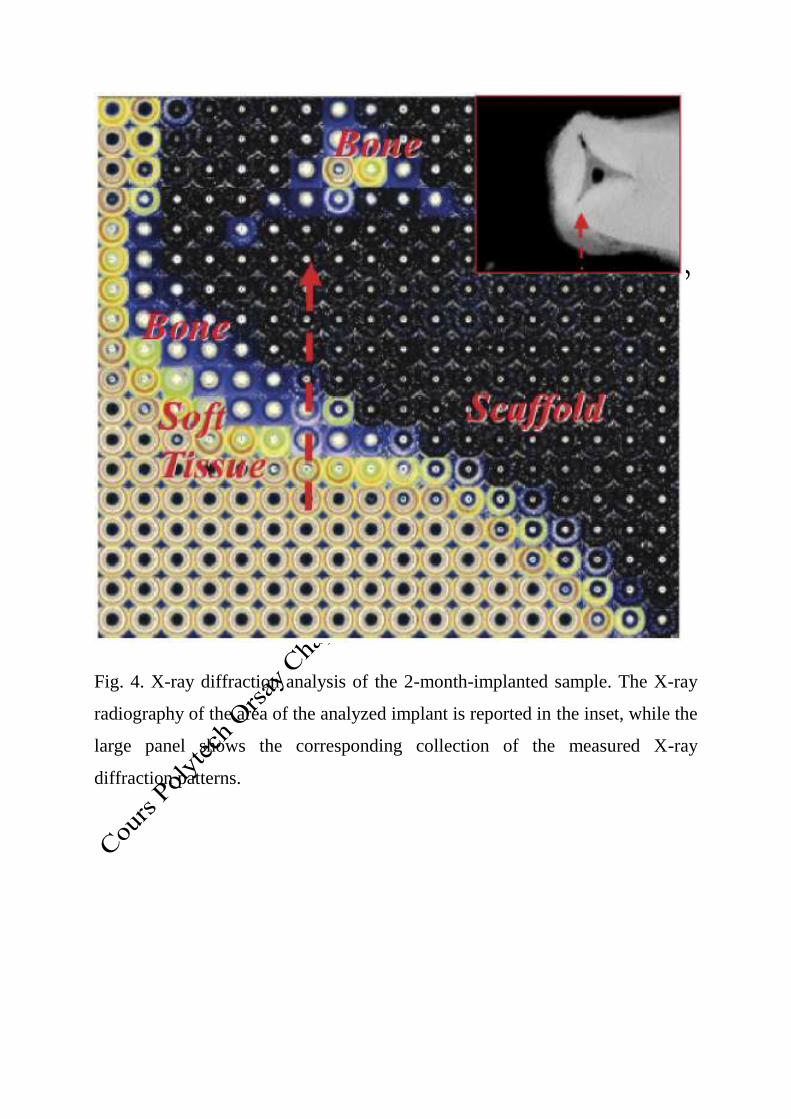
Fig. 4. X-ray diffraction analysis of the 2-month-implanted sample. The X-ray
radiography of the area of the analyzed implant is reported in the inset, while the
large panel shows the corresponding collection of the measured X-ray
diffraction patterns.
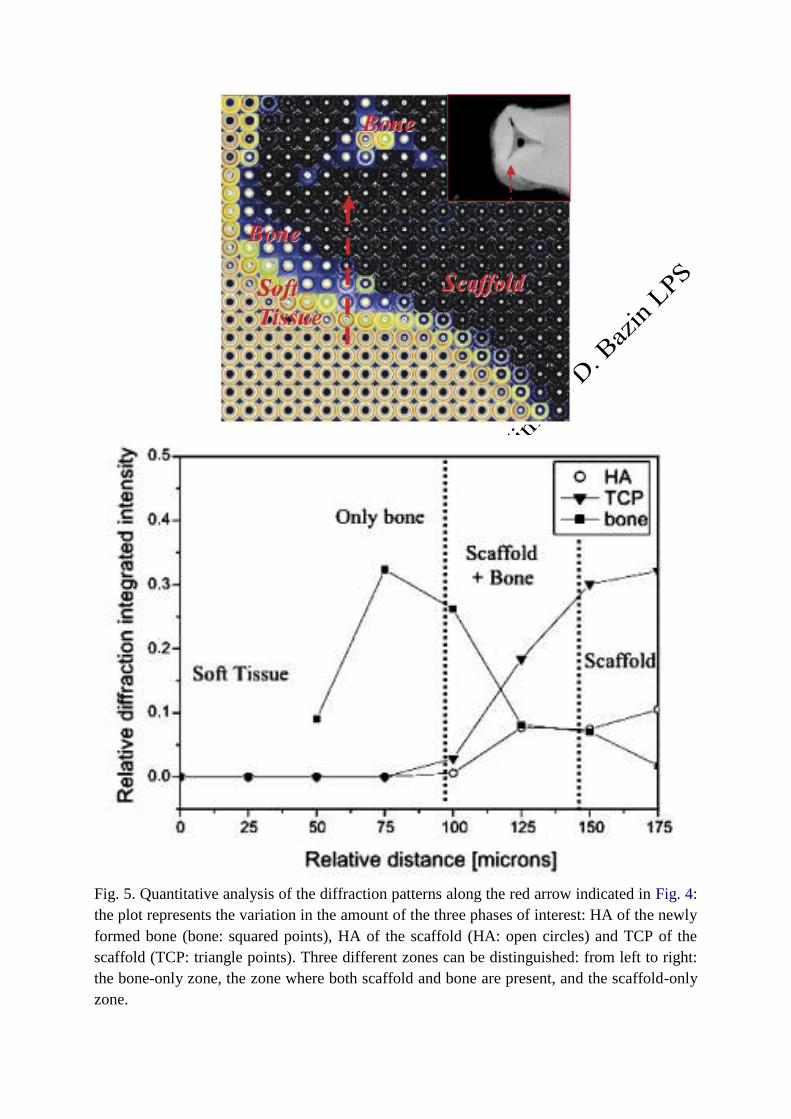
Fig. 5. Quantitative analysis of the diffraction patterns along the red arrow indicated in Fig. 4:
the plot represents the variation in the amount of the three phases of interest: HA of the newly
formed bone (bone: squared points), HA of the scaffold (HA: open circles) and TCP of the
scaffold (TCP: triangle points). Three different zones can be distinguished: from left to right:
the bone-only zone, the zone where both scaffold and bone are present, and the scaffold-only
zone.
Chapitre 4D.2 Expériences de µfluorescence X
Chapitre 4D.2.a Montage expérimental In Situ Imaging of Metals in Cells and Tissues
11
Approximately one third of the human proteome contains metal cations,
either in the form of cofactors with catalytic functions or as structural support
elements12
. To guarantee a proper maintenance of this metal ion pool, both at the
cellular and at whole organism levels, nature has evolved a highly sophisticated
machinery comprised of a complex interplay between DNA, proteins, and
biomolecules13
.
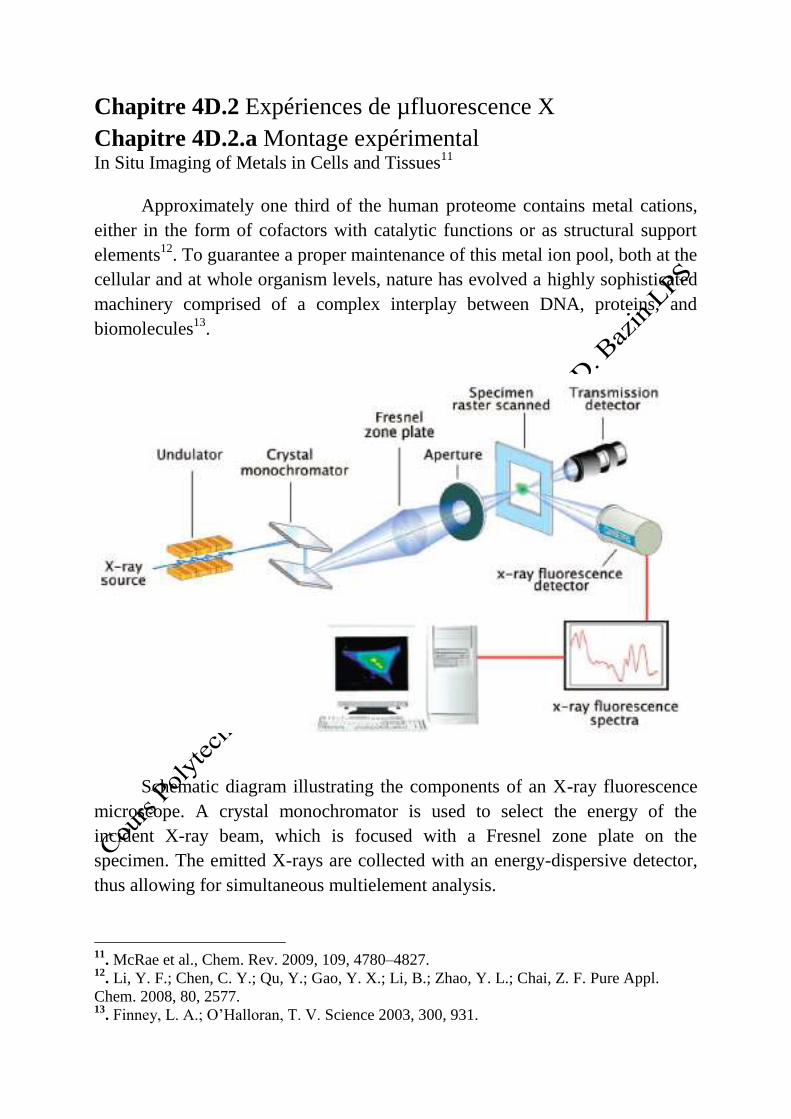
Schematic diagram illustrating the components of an X-ray fluorescence
microscope. A crystal monochromator is used to select the energy of the
incident X-ray beam, which is focused with a Fresnel zone plate on the
specimen. The emitted X-rays are collected with an energy-dispersive detector,
thus allowing for simultaneous multielement analysis.
11
. McRae et al., Chem. Rev. 2009, 109, 4780–4827. 12
. Li, Y. F.; Chen, C. Y.; Qu, Y.; Gao, Y. X.; Li, B.; Zhao, Y. L.; Chai, Z. F. Pure Appl.
Chem. 2008, 80, 2577. 13
. Finney, L. A.; O’Halloran, T. V. Science 2003, 300, 931.
Chapitre 4D.2.b Imagerie cellulaire
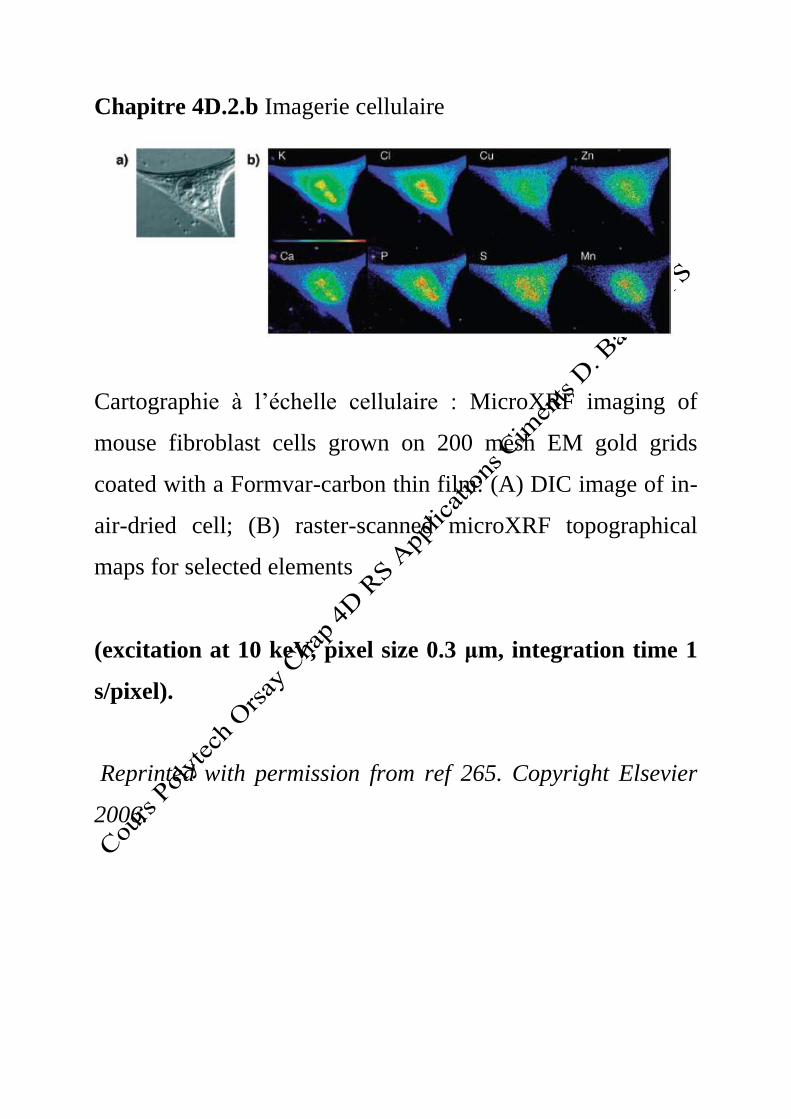
Cartographie à l’échelle cellulaire : MicroXRF imaging of
mouse fibroblast cells grown on 200 mesh EM gold grids
coated with a Formvar-carbon thin film: (A) DIC image of in-
air-dried cell; (B) raster-scanned microXRF topographical
maps for selected elements
(excitation at 10 keV, pixel size 0.3 μm, integration time 1
s/pixel).
Reprinted with permission from ref 265. Copyright Elsevier
2006.
Chapitre 4D.2.c Imagerie d’une dent
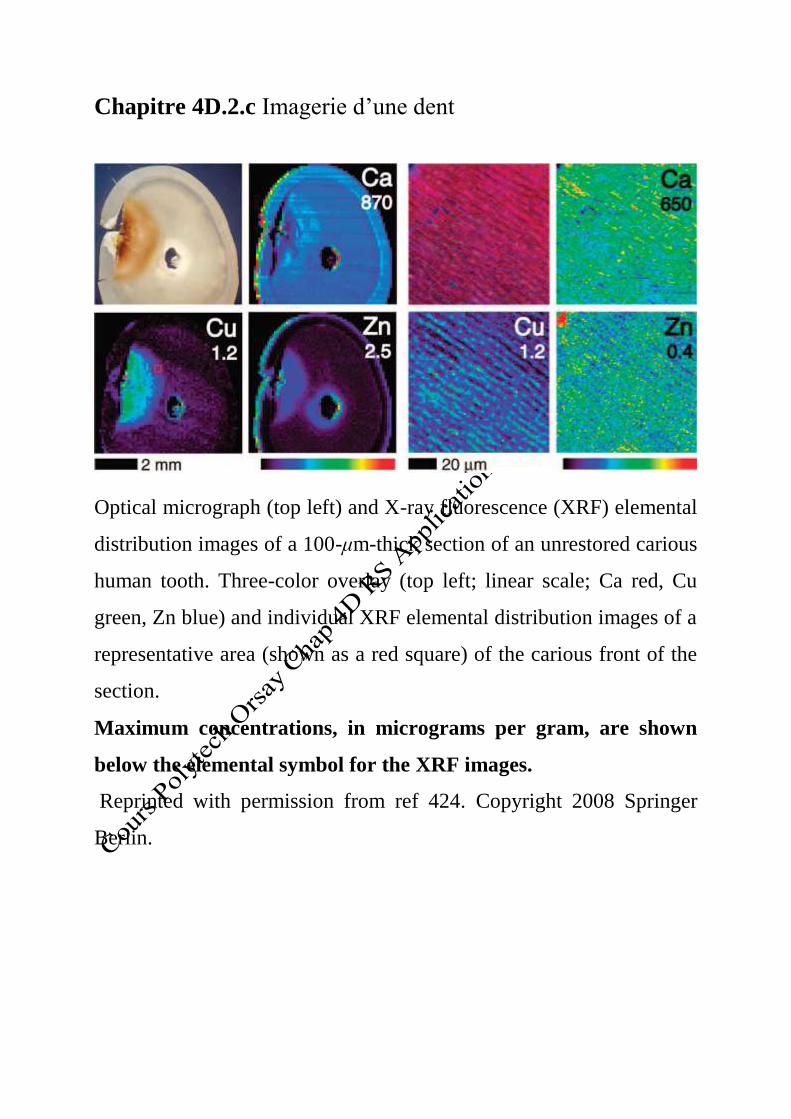
Optical micrograph (top left) and X-ray fluorescence (XRF) elemental
distribution images of a 100-μm-thick section of an unrestored carious
human tooth. Three-color overlay (top left; linear scale; Ca red, Cu
green, Zn blue) and individual XRF elemental distribution images of a
representative area (shown as a red square) of the carious front of the
section.
Maximum concentrations, in micrograms per gram, are shown
below the elemental symbol for the XRF images.
Reprinted with permission from ref 424. Copyright 2008 Springer
Berlin.
Chapitre 4D.2.d Cartographie du Pb et du Ca dans l’os Applications of Synchrotron Radiation-Induced X-Ray Emission (SRIXE)
14
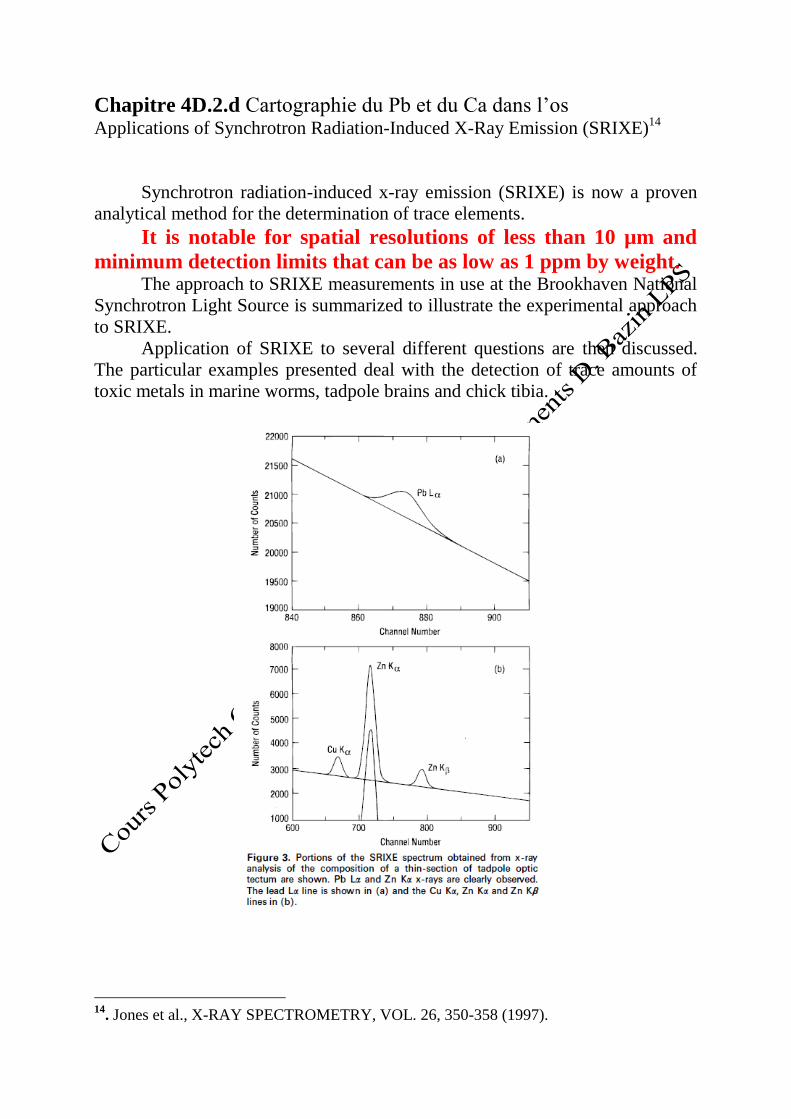
Synchrotron radiation-induced x-ray emission (SRIXE) is now a proven
analytical method for the determination of trace elements.
It is notable for spatial resolutions of less than 10 µm and
minimum detection limits that can be as low as 1 ppm by weight. The approach to SRIXE measurements in use at the Brookhaven National
Synchrotron Light Source is summarized to illustrate the experimental approach
to SRIXE.
Application of SRIXE to several different questions are then discussed.
The particular examples presented deal with the detection of trace amounts of
toxic metals in marine worms, tadpole brains and chick tibia.
14
. Jones et al., X-RAY SPECTROMETRY, VOL. 26, 350-358 (1997).
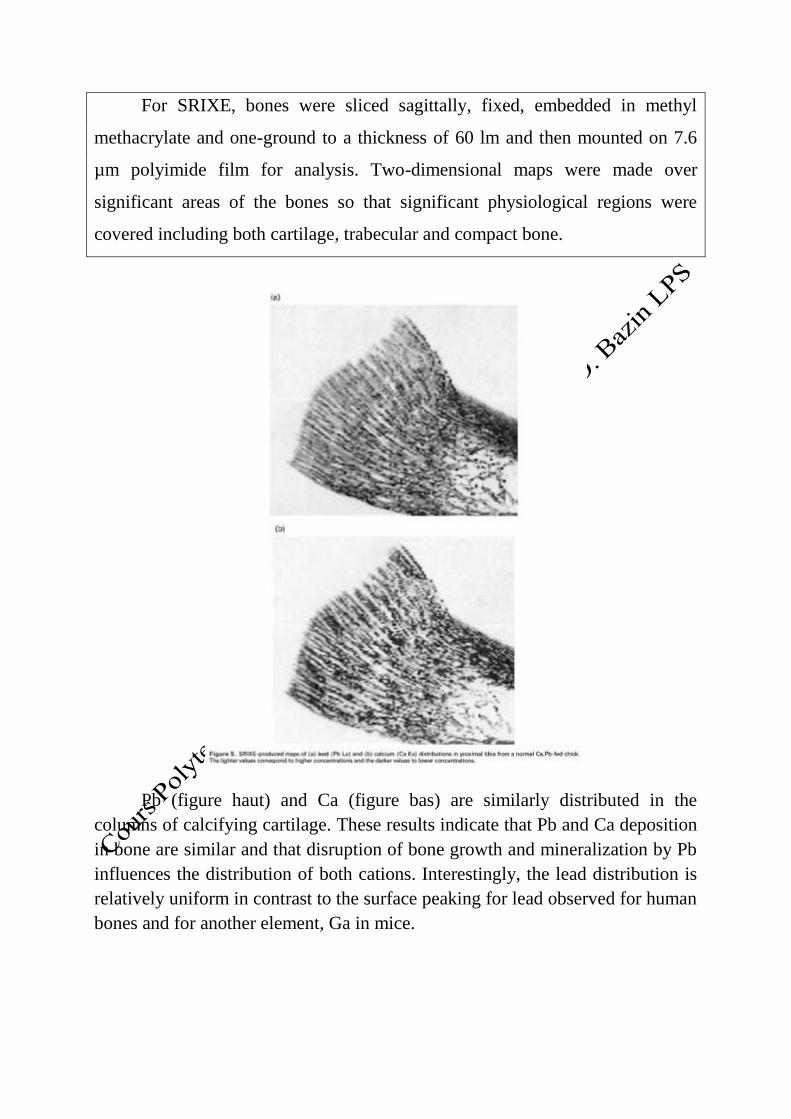
For SRIXE, bones were sliced sagittally, fixed, embedded in methyl
methacrylate and one-ground to a thickness of 60 lm and then mounted on 7.6
µm polyimide film for analysis. Two-dimensional maps were made over
significant areas of the bones so that significant physiological regions were
covered including both cartilage, trabecular and compact bone.
Pb (figure haut) and Ca (figure bas) are similarly distributed in the
columns of calcifying cartilage. These results indicate that Pb and Ca deposition
in bone are similar and that disruption of bone growth and mineralization by Pb
influences the distribution of both cations. Interestingly, the lead distribution is
relatively uniform in contrast to the surface peaking for lead observed for human
bones and for another element, Ga in mice.
Chapitre 4D.3 Tomography
Chapitre 4D.3.a 4D chemical imaging based on a third-generation S.R.15
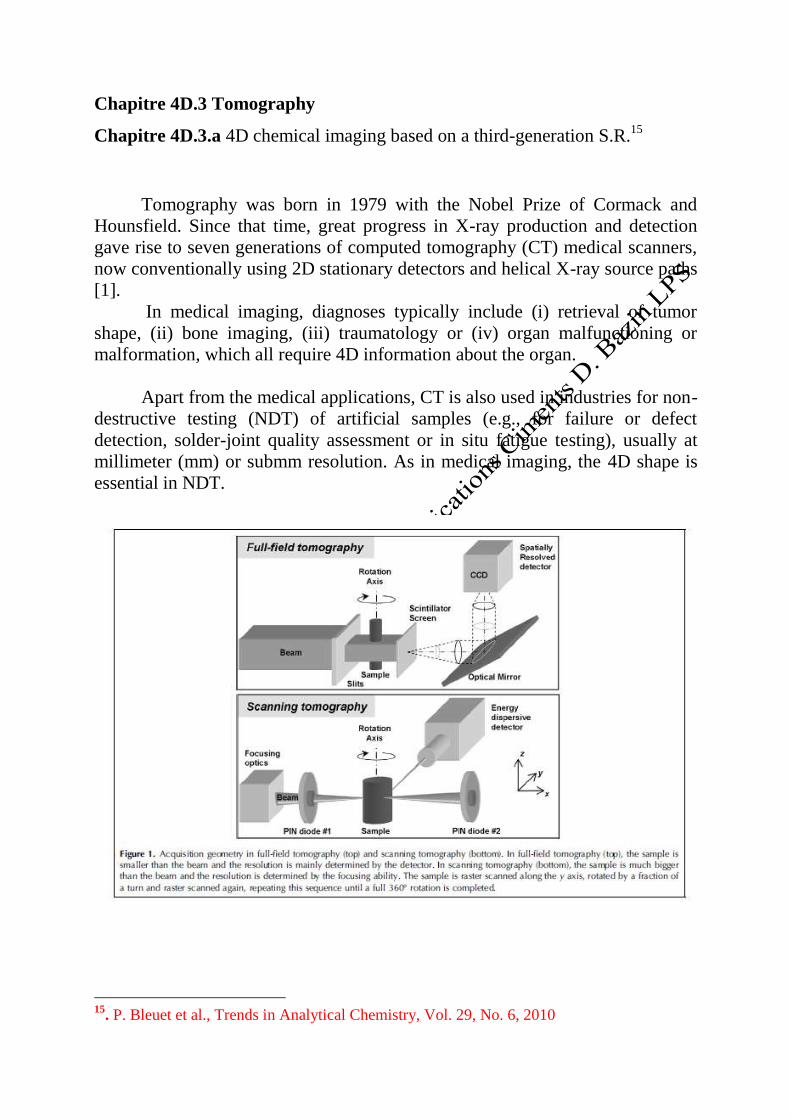
Tomography was born in 1979 with the Nobel Prize of Cormack and
Hounsfield. Since that time, great progress in X-ray production and detection
gave rise to seven generations of computed tomography (CT) medical scanners,
now conventionally using 2D stationary detectors and helical X-ray source paths
[1].
In medical imaging, diagnoses typically include (i) retrieval of tumor
shape, (ii) bone imaging, (iii) traumatology or (iv) organ malfunctioning or
malformation, which all require 4D information about the organ.
Apart from the medical applications, CT is also used in industries for non-
destructive testing (NDT) of artificial samples (e.g., for failure or defect
detection, solder-joint quality assessment or in situ fatigue testing), usually at
millimeter (mm) or submm resolution. As in medical imaging, the 4D shape is
essential in NDT.
15
. P. Bleuet et al., Trends in Analytical Chemistry, Vol. 29, No. 6, 2010
Chapitre 4D.3.b Synchrotron X-ray microtomography (on a
micron scale) provides three-dimensional imaging representation of bone
ingrowth in calcium phosphate biomaterials16
The BCP blocks usedwere Macroporous Biphasic Calcium Phosphate
ceramic (MBCPt, Biomatlante, Vigneux, France) with a 60/40 HA/bTCP (w/w)
ratio. All implants had macropore diameters of 300–565 µm, with 40–50%
macroporosity.
Biphasic structure and ceramic purity, as checkedrespect ively by X-ray
diffraction and Fourier transform infrared (FTIR) spectroscopy, confirmedthe
HA/bTCP ratio and the absence of carbonate andpyroph osphate impurities.
Macro and micro porosity were determined by image analysis using
scanning electron microscopy (SEM) observations. Microporosity was
equivalent in all implants, representing 33%±0.5 of the ceramic surface17
.
Total micro- and macroporosity was 70%.
16
. P. Weiss et al., Synchrotron X-ray microtomography (on a micron scale) provides three-
dimensional imaging representation of bone ingrowth in calcium phosphate biomaterials,
Biomaterials 24 (2003) 4591-4601 17
. Gauthier O, Bouler JM, Aguado E, Pilet P, Daculsi G. Macroporous biphasic calcium
phosphate ceramics: influence of macropore diameter and macroporosity percentage on bone
in growth. Biomaterials 1998;19:133-9.
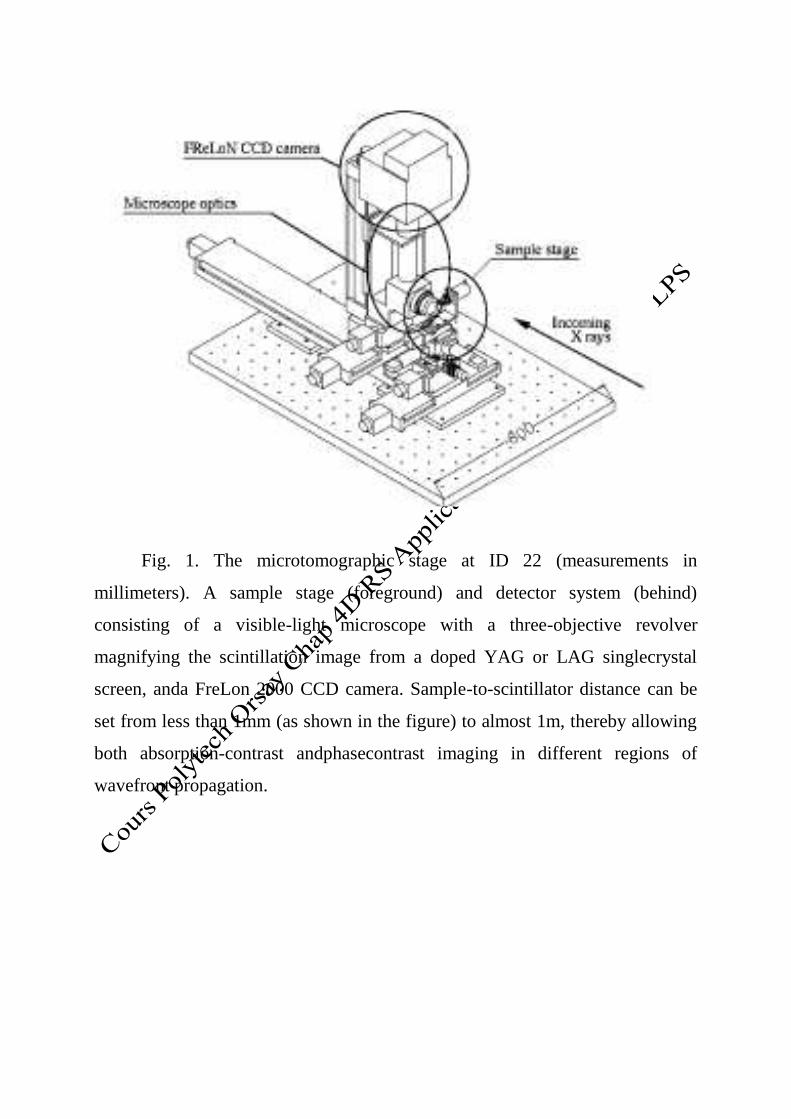
Fig. 1. The microtomographic stage at ID 22 (measurements in
millimeters). A sample stage (foreground) and detector system (behind)
consisting of a visible-light microscope with a three-objective revolver
magnifying the scintillation image from a doped YAG or LAG singlecrystal
screen, anda FreLon 2000 CCD camera. Sample-to-scintillator distance can be
set from less than 1mm (as shown in the figure) to almost 1m, thereby allowing
both absorption-contrast andphasecontrast imaging in different regions of
wavefront propagation.
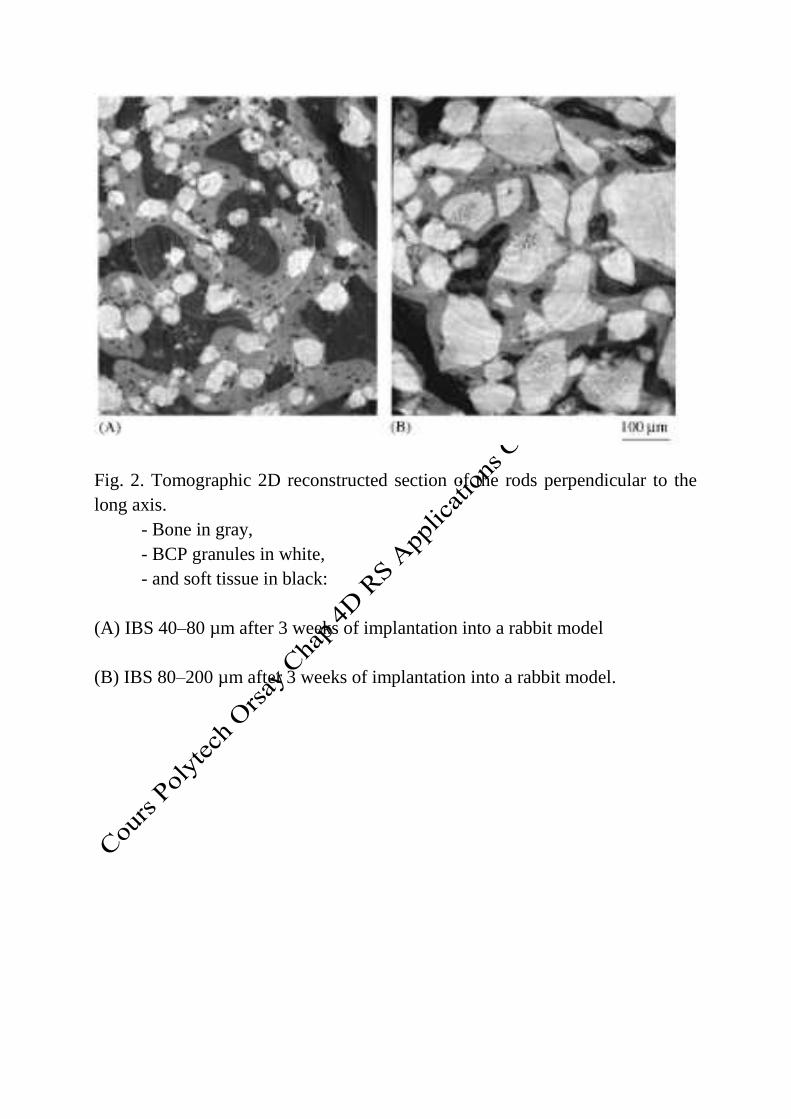
Fig. 2. Tomographic 2D reconstructed section of the rods perpendicular to the
long axis.
- Bone in gray,
- BCP granules in white,
- and soft tissue in black:
(A) IBS 40–80 µm after 3 weeks of implantation into a rabbit model
(B) IBS 80–200 µm after 3 weeks of implantation into a rabbit model.
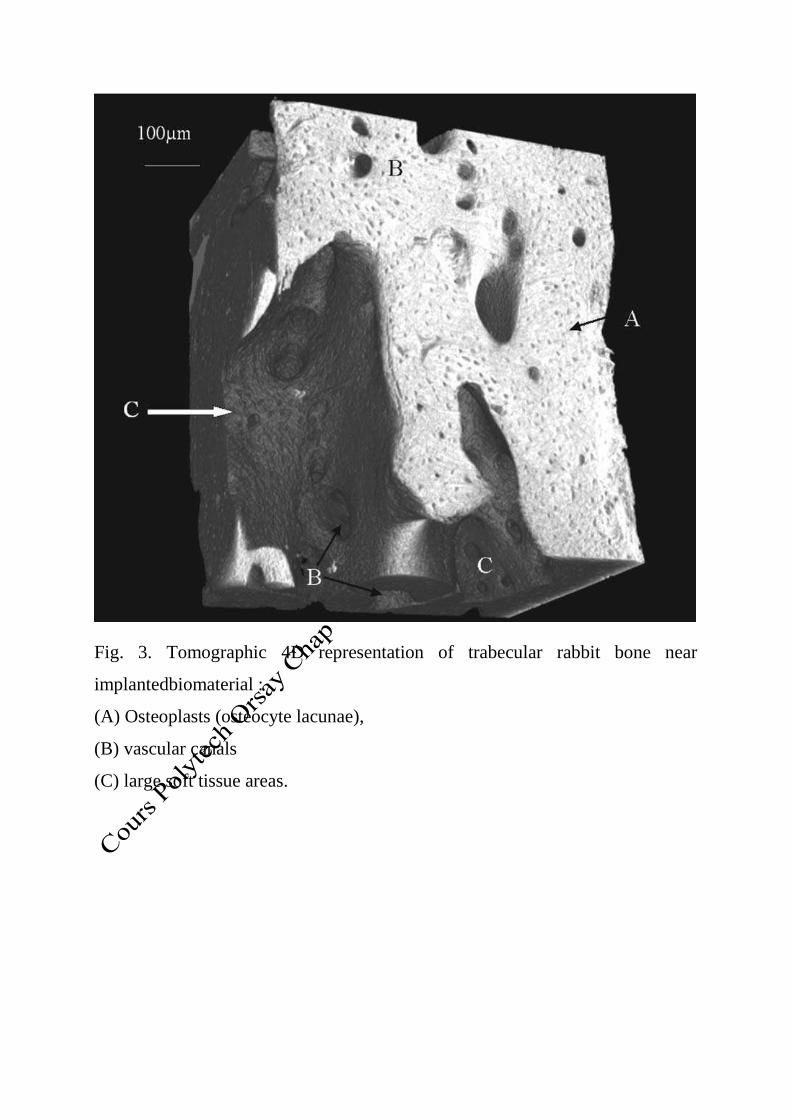
Fig. 3. Tomographic 4D representation of trabecular rabbit bone near
implantedbiomaterial :
(A) Osteoplasts (osteocyte lacunae),
(B) vascular canals
(C) large soft tissue areas.