Cell-to-cell influence on growth in large populations
12
Research Article Vol. 10, No. 9 / 1 September 2019 / Biomedical Optics Express 4664 Cell-to-cell influence on growth in large populations MIKHAIL E. K ANDEL , 1,2,6 WENLONG L U, 2,3,6 J ON L IANG , 1 O NUR AYDIN , 4 TAHER A. S AIF , 4 AND G ABRIEL P OPESCU 1,2,5,* 1 Quantitative Light Imaging Laboratory, Department of Electrical and Computer Engineering, University of Illinois, Urbana, IL 61820, USA 2 Beckman Institute, University of Illinois at Urbana-Champaign, Urbana, IL 61820, USA 3 The State Key Laboratory of Digital Manufacturing Equipment and Technology, School of Mechanical Science and Engineering, Huazhong University of Science and Technology, Wuhan, China 4 Department of Mechanical Science and Engineering, University of Illinois, Urbana, IL 61820, USA 5 Department of Bioengineering, University of Illinois, Urbana, IL 61820, USA 6 Denotes equal contribution * [email protected] Abstract: Recent studies have revealed the importance of outlier cells in complex cellular systems. Quantifying heterogeneity in such systems may lead to a better understanding of organ engineering, microtumor growth, and disease models, as well as more precise drug design. We used the ability of quantitative phase imaging to perform long-term imaging of cell growth to estimate the “influence” of cellular clusters on their neighbors. We validated our approach by analyzing epithelial and fibroblast cultures imaged over the course of several days. Interestingly, we found that there is a significant number of cells characterized by a medium correlation between their growth rate and distance (modulus of the Pearson coefficient between 0.25-.5). Furthermore, we found a small percentage of cells exhibiting strong such correlations, which we label as “influencer” cellular clusters. Our approach might find important applications in studying dynamic phenomena, such as organogenesis and metastasis. © 2019 Optical Society of America under the terms of the OSA Open Access Publishing Agreement 1. Introduction Progress in systems biology has shown that emergent cellular phenomena such as differentiation and metastasis are driven by symmetry breaking [1]. Recent studies have revealed the importance of cellular outliers, which might be genetically programmed to disturb normal metabolism in a given system [2]. The development of 3D ex vivo tissue models for studying organ development, function, and disease face challenges when quantifying individual cell growth in highly heterogeneous systems [3–6]. It has been argued that, in developing multicellular engineered living systems, understanding emergence requires tremendous efforts not only in synthetic biology but also in characterization and imaging [7]. It is evident that assessing the behavior of individual cells in relation to the surrounding tissue is imperative. Here, we investigate, for the first time to our knowledge, spatial inhomogeneity of cell growth rates in large populations, over several cell cycles. Understanding growth and homeostasis in mammalian cells has been described as “one of the last big unsolved problems” in cell biology [8]. Proliferation and differentiation are controlled by individual cells and cell populations in subtle ways that continue to elude scientists today [9–12]. From a clinical perspective, basic understating of cell growth kinetics and how it is modulated by disease and treatment will allow for more targeted drug development. Existing methods provide information on the overall effects of compounds on cell viability, but they are restricted to bulk measurements and require large sample sizes. One common approach is using the reduction of a colorless tetrazolium salt to yield a colored formazan, which is proportional to the number of viable cells. Although such #367930 https://doi.org/10.1364/BOE.10.004664 Journal © 2019 Received 23 May 2019; revised 2 Aug 2019; accepted 6 Aug 2019; published 20 Aug 2019
Transcript of Cell-to-cell influence on growth in large populations
Research Article Vol. 10, No. 9 / 1 September 2019 / Biomedical Optics Express 4664
Cell-to-cell influence on growth in largepopulationsMIKHAIL E. KANDEL,1,2,6 WENLONG LU,2,3,6 JON LIANG,1 ONURAYDIN,4 TAHER A. SAIF,4 AND GABRIEL POPESCU1,2,5,*
1Quantitative Light Imaging Laboratory, Department of Electrical and Computer Engineering, Universityof Illinois, Urbana, IL 61820, USA2Beckman Institute, University of Illinois at Urbana-Champaign, Urbana, IL 61820, USA3The State Key Laboratory of Digital Manufacturing Equipment and Technology, School of MechanicalScience and Engineering, Huazhong University of Science and Technology, Wuhan, China4Department of Mechanical Science and Engineering, University of Illinois, Urbana, IL 61820, USA5Department of Bioengineering, University of Illinois, Urbana, IL 61820, USA6Denotes equal contribution*[email protected]
Abstract: Recent studies have revealed the importance of outlier cells in complex cellularsystems. Quantifying heterogeneity in such systems may lead to a better understanding of organengineering, microtumor growth, and disease models, as well as more precise drug design. Weused the ability of quantitative phase imaging to perform long-term imaging of cell growth toestimate the “influence” of cellular clusters on their neighbors. We validated our approach byanalyzing epithelial and fibroblast cultures imaged over the course of several days. Interestingly,we found that there is a significant number of cells characterized by a medium correlationbetween their growth rate and distance (modulus of the Pearson coefficient between 0.25-.5).Furthermore, we found a small percentage of cells exhibiting strong such correlations, whichwe label as “influencer” cellular clusters. Our approach might find important applications instudying dynamic phenomena, such as organogenesis and metastasis.
© 2019 Optical Society of America under the terms of the OSA Open Access Publishing Agreement
1. Introduction
Progress in systems biology has shown that emergent cellular phenomena such as differentiationand metastasis are driven by symmetry breaking [1]. Recent studies have revealed the importanceof cellular outliers, which might be genetically programmed to disturb normal metabolismin a given system [2]. The development of 3D ex vivo tissue models for studying organdevelopment, function, and disease face challenges when quantifying individual cell growthin highly heterogeneous systems [3–6]. It has been argued that, in developing multicellularengineered living systems, understanding emergence requires tremendous efforts not only insynthetic biology but also in characterization and imaging [7]. It is evident that assessing thebehavior of individual cells in relation to the surrounding tissue is imperative.
Here, we investigate, for the first time to our knowledge, spatial inhomogeneity of cell growthrates in large populations, over several cell cycles. Understanding growth and homeostasis inmammalian cells has been described as “one of the last big unsolved problems” in cell biology[8]. Proliferation and differentiation are controlled by individual cells and cell populations insubtle ways that continue to elude scientists today [9–12]. From a clinical perspective, basicunderstating of cell growth kinetics and how it is modulated by disease and treatment will allowfor more targeted drug development. Existing methods provide information on the overall effectsof compounds on cell viability, but they are restricted to bulk measurements and require largesample sizes. One common approach is using the reduction of a colorless tetrazolium salt toyield a colored formazan, which is proportional to the number of viable cells. Although such
#367930 https://doi.org/10.1364/BOE.10.004664Journal © 2019 Received 23 May 2019; revised 2 Aug 2019; accepted 6 Aug 2019; published 20 Aug 2019
Research Article Vol. 10, No. 9 / 1 September 2019 / Biomedical Optics Express 4665
assays are useful for measuring the overall cytotoxic effectiveness of a compound, they lack thecapability to measure proliferation kinetics at the individual cell level and to report on spatialinhomogeneities in the population [13].
Measuring the individual cell mass vs. growth rate, M vs. dM/dt, has the potential to reveal themechanisms of coordination between cell cycle and cell growth [14,15] and determine whetherthe growth rate is proportional [16–18] or constant [9,19–21] with the cell mass. Linear growthwould indicate that the rate of biosynthesis is dictated by the amount of DNA that can initiate thetranscription process [10]. By contrast, the exponential growth model is based on the assumptionthat the cell mass production depends on the amount of ribosomal machinery and cytoplasm [10].Thus, larger (heavier) cells produce more mass and accelerate in growth. In principle, lineargrowth can be maintained without a size-dependent mechanism, whereas the exponential growthrequires a size-dependent mechanism to maintain homeostasis [16].
Performing direct mass measurements of individual live cells in cultures has been challengingfor several reasons, including the cell’s small size, morphological heterogeneity, adhesiveness,and wet environment [22]. Until recently, the state-of-the-art method to assess single cell growthrates over time was using Coulter counters to measure the volume of a large number of cells,in combination with careful mathematical analysis [23]. For relatively simple cells such asEscherichia coli (E. coli), traditional fluorescence microscopy techniques have also been used toassess growth in great detail [24]. In this type of method, the assumption is that volume is a goodsurrogate for mass; however, this assumption is not always valid, for example, due to variationsin osmotic pressure [25]. Recently, shifts in the resonant frequency of vibrating microchannelshave been used to quantify the buoyant mass of cells flowing through the structures [26,27].Using this approach, Godin et al. have shown that several cell types grow exponentially, i.e.,heavier cells grow faster than lighter ones [27]. Later, the technology was upgraded to allow forparallel measurements of multiple cells [28]. While this method is sensitive enough to measureindividual cell growth, it cannot be applied to adherent cell lines. To meet this challenge, thisprinciple was extended to allow mass measurements on adherent cells by culturing cells directlyon resonating pads [29]. This benefit comes at the expense of sensitivity and throughput.
Quantitative phase imaging (QPI) [30] is an interferometric, label-free approach that has foundimportant applications in cell biology [31]. Cell growth has been one of the crucial applicationsof QPI, especially because the method is quantitative, lacks photobleaching, and presents lowphototoxicity. The principle behind using interferometry to measure cell dry mass was establishedin the early 1950s when it was recognized that the optical phase delay accumulated through a livecell is linearly proportional to the dry mass (non-aqueous content) of the cell [32,33]. Since then,significant progress has been made using QPI to study cell mass and growth kinetics [25,34–39].However, despite these advances, three main limitations commonly degrade the performanceof quantitative phase imaging instruments: i) reduced contrast due to the speckle generated bythe laser sources, ii) stability of the phase measurement, and iii) the complexity of experimentalsetups, which has presented practical obstacles for interoperability with existing workflows. Anideal method will perform parallel growth measurements on an ensemble of cells simultaneouslyand continuously over more than one cell cycle, quantify possible cell cycle phase-dependentgrowth, spatially-dependent growth, apply equally well to adherent and non-adherent cells, andintegrate into existing workflows.In order to study spatial correlations of growth rates in large populations of adherent cells,
we used spatial light interference microscopy (SLIM) [40,41], which satisfies the constraintsdiscussed above (Fig. 1(a). SLIM (CellVista SLIM Pro, Phi Optics, Inc.) is a highly sensitivequantitative phase instrument that combines white light illumination (thus, speckle-free) withcommon path interferometry (thus, highly stable) and can be implemented as an upgrade moduleonto existing phase contrast microscopes (thus, easy to adopt). The instrument is fully automatedand capable of scanning large fields of view, such as multiwell plates. We applied SLIM to
Research Article Vol. 10, No. 9 / 1 September 2019 / Biomedical Optics Express 4666
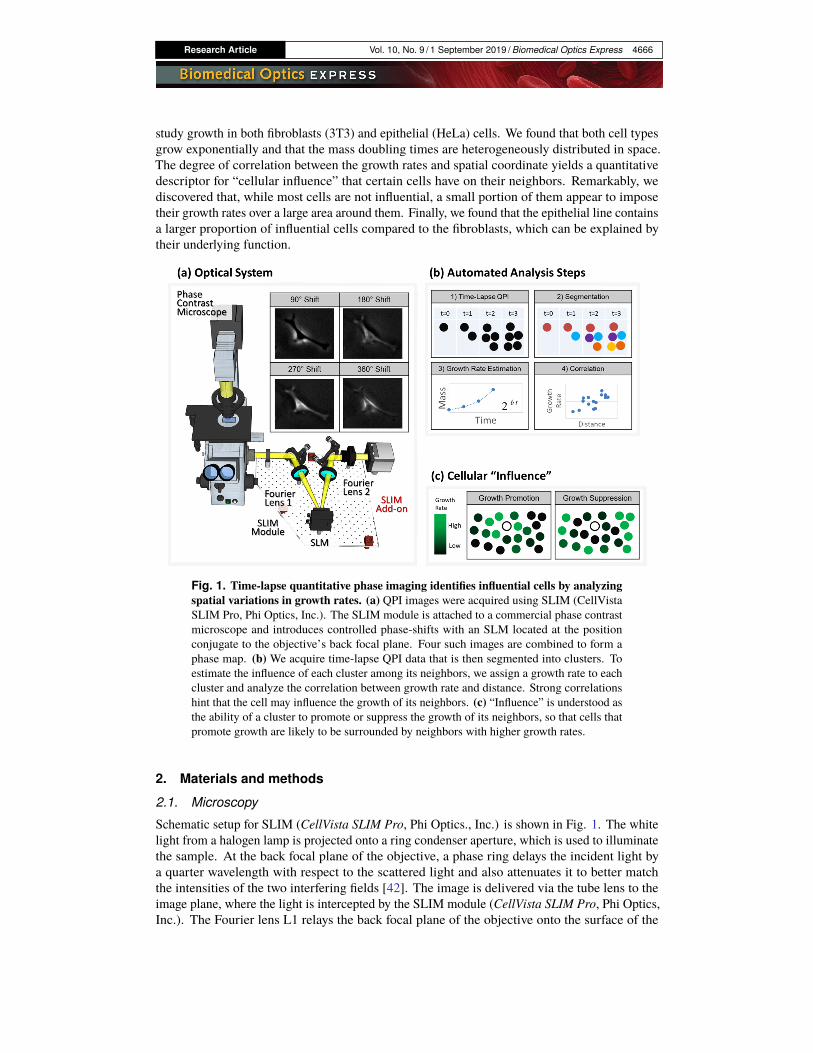
study growth in both fibroblasts (3T3) and epithelial (HeLa) cells. We found that both cell typesgrow exponentially and that the mass doubling times are heterogeneously distributed in space.The degree of correlation between the growth rates and spatial coordinate yields a quantitativedescriptor for “cellular influence” that certain cells have on their neighbors. Remarkably, wediscovered that, while most cells are not influential, a small portion of them appear to imposetheir growth rates over a large area around them. Finally, we found that the epithelial line containsa larger proportion of influential cells compared to the fibroblasts, which can be explained bytheir underlying function.
Fig. 1. Time-lapse quantitative phase imaging identifies influential cells by analyzingspatial variations in growth rates. (a) QPI images were acquired using SLIM (CellVistaSLIM Pro, Phi Optics, Inc.). The SLIM module is attached to a commercial phase contrastmicroscope and introduces controlled phase-shifts with an SLM located at the positionconjugate to the objective’s back focal plane. Four such images are combined to form aphase map. (b) We acquire time-lapse QPI data that is then segmented into clusters. Toestimate the influence of each cluster among its neighbors, we assign a growth rate to eachcluster and analyze the correlation between growth rate and distance. Strong correlationshint that the cell may influence the growth of its neighbors. (c) “Influence” is understood asthe ability of a cluster to promote or suppress the growth of its neighbors, so that cells thatpromote growth are likely to be surrounded by neighbors with higher growth rates.
2. Materials and methods
2.1. Microscopy
Schematic setup for SLIM (CellVista SLIM Pro, Phi Optics., Inc.) is shown in Fig. 1. The whitelight from a halogen lamp is projected onto a ring condenser aperture, which is used to illuminatethe sample. At the back focal plane of the objective, a phase ring delays the incident light bya quarter wavelength with respect to the scattered light and also attenuates it to better matchthe intensities of the two interfering fields [42]. The image is delivered via the tube lens to theimage plane, where the light is intercepted by the SLIM module (CellVista SLIM Pro, Phi Optics,Inc.). The Fourier lens L1 relays the back focal plane of the objective onto the surface of the

Research Article Vol. 10, No. 9 / 1 September 2019 / Biomedical Optics Express 4667
spatial light modulator. Fourier lens L2 reconstructs the final image at the CCD plane, which isconjugated with the image plane. The lenses described were customized (Phi Optics, Inc.) topreserve diffraction limited resolution across the field of view. By displaying different masks onthe SLM, the phase delay between the scattered and transmitted components is modulated inquadrature. The resulting four images are collated into a single image as outlined in [40].
2.2. Cell preparation
Fibroblasts (NIH/3T3, ATCC CRL-1658) and Epithelial (HeLa, ATCC CCL-2) cells were grownfollowing vendor recommended procedure (ATCC). Before imaging, the cells were transferred topoly-d-lysine coated glass bottom Petri dishes (Cellvis). After allowing for six hours of attachmenttime, the cells were transferred to a thermally stabilized microscope with a mini-incubationchamber (AxioObserver Z1, Zeiss). To avoid focus drift due to thermal fluctuations, the cellswere allowed to stabilize in the chamber for two hours before the start of imaging.
2.3. Cell segmentation procedure
To improve our segmentation performance, we analyzed the data as a three-dimensional stackwith time as the third dimension. 3D morphological operations were performed using MATLABon a computer with 256 Gb of RAM. The resulting process converts the time-lapse images ofcells into “genealogical” trees, with cells splitting into branches after each division (Fig. 2).
Fig. 2. Cell growth resembles a genealogical tree when time is taken as the 3rd dimension,with two daughter cells after the first division (red), and four daughter cells (purple) after thesecond division.
To generate the stack, we perform the following operations:
1) Phase data is pre-processed using a fast halo-removal algorithm [43]
2) 2D mosaic tiles are stitched into a single image (see section on Mosaic Generation)
3) Large 2D images are down-sampled to fit into computer memory and loaded as a 3Dvolume
Once the stack is ready, we perform segmentation according to the following recipe
4) A threshold is used to separate the cells from the background
Research Article Vol. 10, No. 9 / 1 September 2019 / Biomedical Optics Express 4668
5) 3D dimensional hole filling refines the segmentation mask around the perimeter of the cell
6) A small 3D size threshold is used to remove debris
7) Cells that may have moved between time points are reconnected by applying dilation,followed by hole filling, and an erosion step to restore the original boundary
8) A temporal size filter removes cells that have detached (died) before the end of theexperiment
9) 3D connected component analysis places a unique identifier on the remaining black andwhite clusters
2.4. Dry mass calculation and analysis
Following the procedure in [38], we recover the dry mass as
m(x, y) =λ
2πγφ(x, y) (1)
where λ is the center wavelength; γ=0.2 ml/g is the refractive increment, and φ(x, y) is themeasured phase.
2.5. Mosaic generation
The large fields of view used in this work were assembled from mosaic tiles aligned usingsoftware developed in-house [44]. In short, the algorithm estimates tile displacements with phasecorrelation. The global alignment error, due to disagreements between tile positions, is reducedin a least-squares fashion [45]. Following the implementation in [46] tiles are aligned throughtime, and the error tolerance for displacement estimation is decreased in an interactive fashionuntil the final configuration stabilizes.
2.6. Calculating the correlation coefficient between growth and distance
Our algorithm proceeds as follows: for the ith cluster’s correlation coefficient, it finds all thenearby clusters within a distance R (400 µm in this work) away from the ith cluster giving acertain number of nearby clusters, N. This size scale, R, is selected by choosing the shortestdistance that results in no qualitative changes in correlation coefficients. For example, at thelimit of a very large size distance, the correlation coefficients tend to zero. Next, compute thedistances between the jth (j=1,2,. . . ,N) nearby cluster and the ith cluster by using the clusters’mass weighted centroids. In this experiment, we observe that the clusters do not migrate overtime, and we use the centroid at the starting as the point from which distances are measured forsubsequent time points. In such a way, for each cluster, it is possible to produce a scatter plot ofgrowth rate and distance (Fig. 1(c)). From this plot, for each cluster, we compute the correlationcoefficient between growth and distance, which is the ith cluster’s correlation coefficient. Thecovariance between distance and growth rate is cov(r, b−1), such that the Pearson correlationcoefficient between growth and distance is,
ρ =cov(r, b−1)√σrσb−1
(2)
Applying this algorithm to the whole field of view we can project the relative influence of eachcluster on to the segmentation mask, arriving at a visual representation of cellular influence.
Research Article Vol. 10, No. 9 / 1 September 2019 / Biomedical Optics Express 4669
3. Results
To determine influential cellular clusters, we monitored their growth rates relative to theirneighbors (Fig. 1(b-c)). The SLIM instrument was used to scan large fields of view of livecells over several cell cycles (Fig. 1(b)). The goal is to generate a growth rate map of the cellpopulation and quantify how it correlates with spatial distance. As shown in Fig. 1(b), we imagedand segmented the cells and compute the doubling times across the entire field of view. Thenwe calculated the Pearson correlation coefficient between the growth rate and distance from thecenter of the cluster. Finally, we generated a map of the correlation coefficients, which inform uson how similar growth of certain cell clusters is with respect to their surroundings. We refer tothe clusters characterized by local minima or maxima in correlation coefficients as “influential”(Fig. 1(c)).
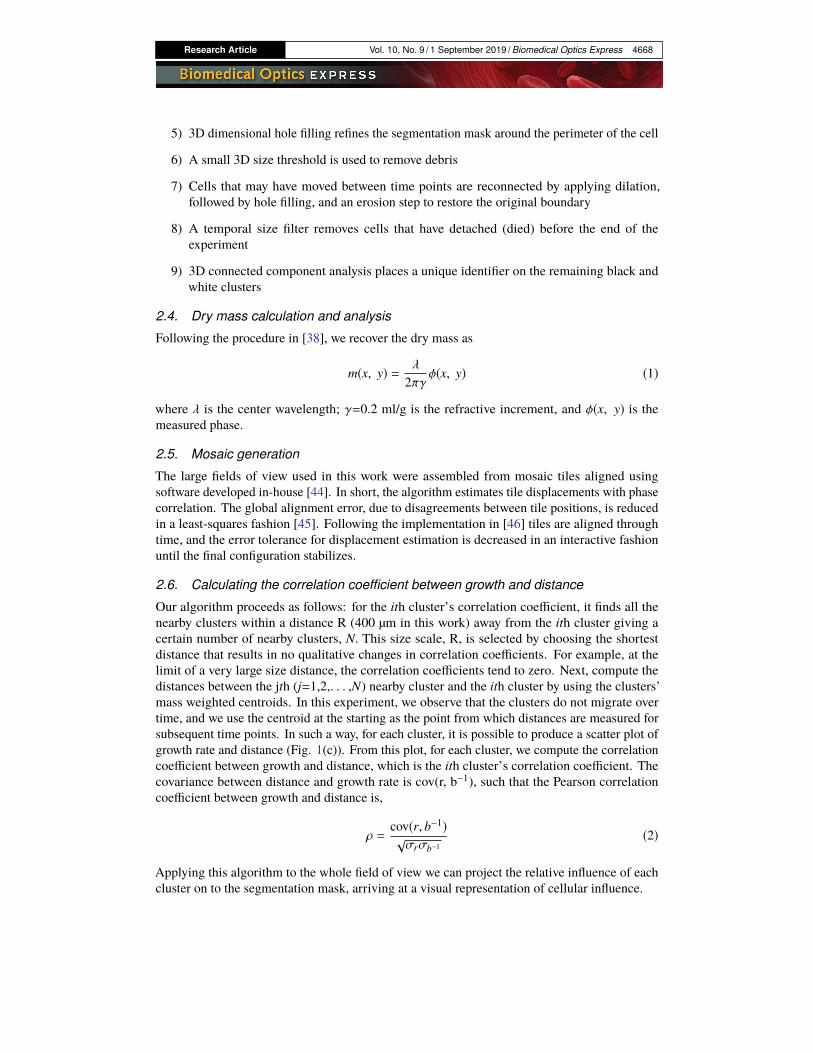
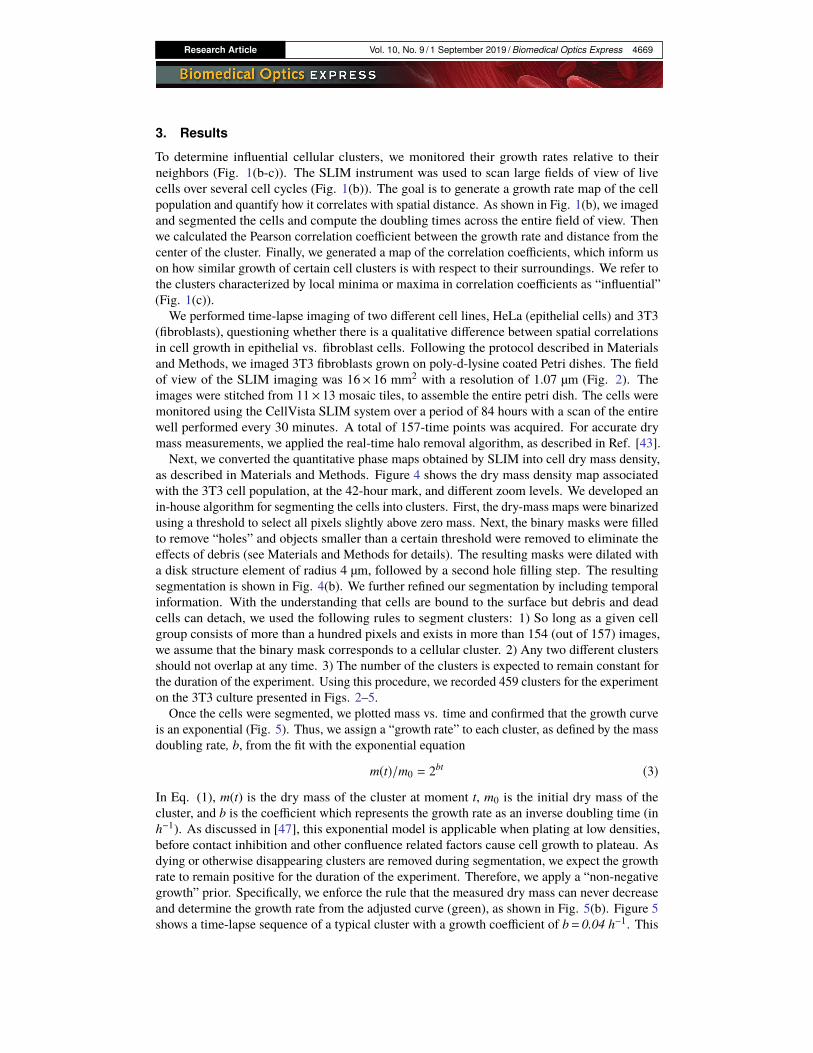
We performed time-lapse imaging of two different cell lines, HeLa (epithelial cells) and 3T3(fibroblasts), questioning whether there is a qualitative difference between spatial correlationsin cell growth in epithelial vs. fibroblast cells. Following the protocol described in Materialsand Methods, we imaged 3T3 fibroblasts grown on poly-d-lysine coated Petri dishes. The fieldof view of the SLIM imaging was 16× 16 mm2 with a resolution of 1.07 µm (Fig. 2). Theimages were stitched from 11× 13 mosaic tiles, to assemble the entire petri dish. The cells weremonitored using the CellVista SLIM system over a period of 84 hours with a scan of the entirewell performed every 30 minutes. A total of 157-time points was acquired. For accurate drymass measurements, we applied the real-time halo removal algorithm, as described in Ref. [43].
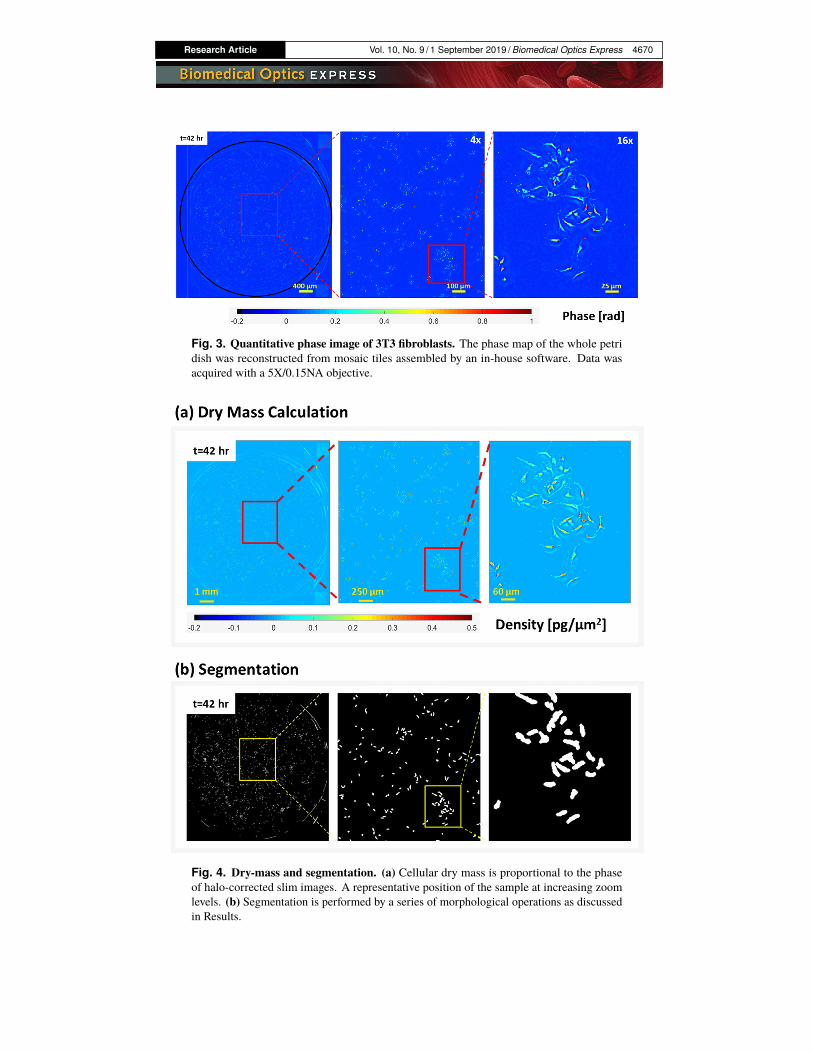
Next, we converted the quantitative phase maps obtained by SLIM into cell dry mass density,as described in Materials and Methods. Figure 4 shows the dry mass density map associatedwith the 3T3 cell population, at the 42-hour mark, and different zoom levels. We developed anin-house algorithm for segmenting the cells into clusters. First, the dry-mass maps were binarizedusing a threshold to select all pixels slightly above zero mass. Next, the binary masks were filledto remove “holes” and objects smaller than a certain threshold were removed to eliminate theeffects of debris (see Materials and Methods for details). The resulting masks were dilated witha disk structure element of radius 4 µm, followed by a second hole filling step. The resultingsegmentation is shown in Fig. 4(b). We further refined our segmentation by including temporalinformation. With the understanding that cells are bound to the surface but debris and deadcells can detach, we used the following rules to segment clusters: 1) So long as a given cellgroup consists of more than a hundred pixels and exists in more than 154 (out of 157) images,we assume that the binary mask corresponds to a cellular cluster. 2) Any two different clustersshould not overlap at any time. 3) The number of the clusters is expected to remain constant forthe duration of the experiment. Using this procedure, we recorded 459 clusters for the experimenton the 3T3 culture presented in Figs. 2–5.
Once the cells were segmented, we plotted mass vs. time and confirmed that the growth curveis an exponential (Fig. 5). Thus, we assign a “growth rate” to each cluster, as defined by the massdoubling rate, b, from the fit with the exponential equation
m(t)/m0 = 2bt (3)
In Eq. (1), m(t) is the dry mass of the cluster at moment t, m0 is the initial dry mass of thecluster, and b is the coefficient which represents the growth rate as an inverse doubling time (inh−1). As discussed in [47], this exponential model is applicable when plating at low densities,before contact inhibition and other confluence related factors cause cell growth to plateau. Asdying or otherwise disappearing clusters are removed during segmentation, we expect the growthrate to remain positive for the duration of the experiment. Therefore, we apply a “non-negativegrowth” prior. Specifically, we enforce the rule that the measured dry mass can never decreaseand determine the growth rate from the adjusted curve (green), as shown in Fig. 5(b). Figure 5shows a time-lapse sequence of a typical cluster with a growth coefficient of b= 0.04 h−1. This
Research Article Vol. 10, No. 9 / 1 September 2019 / Biomedical Optics Express 4670
Fig. 3. Quantitative phase image of 3T3 fibroblasts. The phase map of the whole petridish was reconstructed from mosaic tiles assembled by an in-house software. Data wasacquired with a 5X/0.15NA objective.
Fig. 4. Dry-mass and segmentation. (a) Cellular dry mass is proportional to the phaseof halo-corrected slim images. A representative position of the sample at increasing zoomlevels. (b) Segmentation is performed by a series of morphological operations as discussedin Results.
Research Article Vol. 10, No. 9 / 1 September 2019 / Biomedical Optics Express 4671
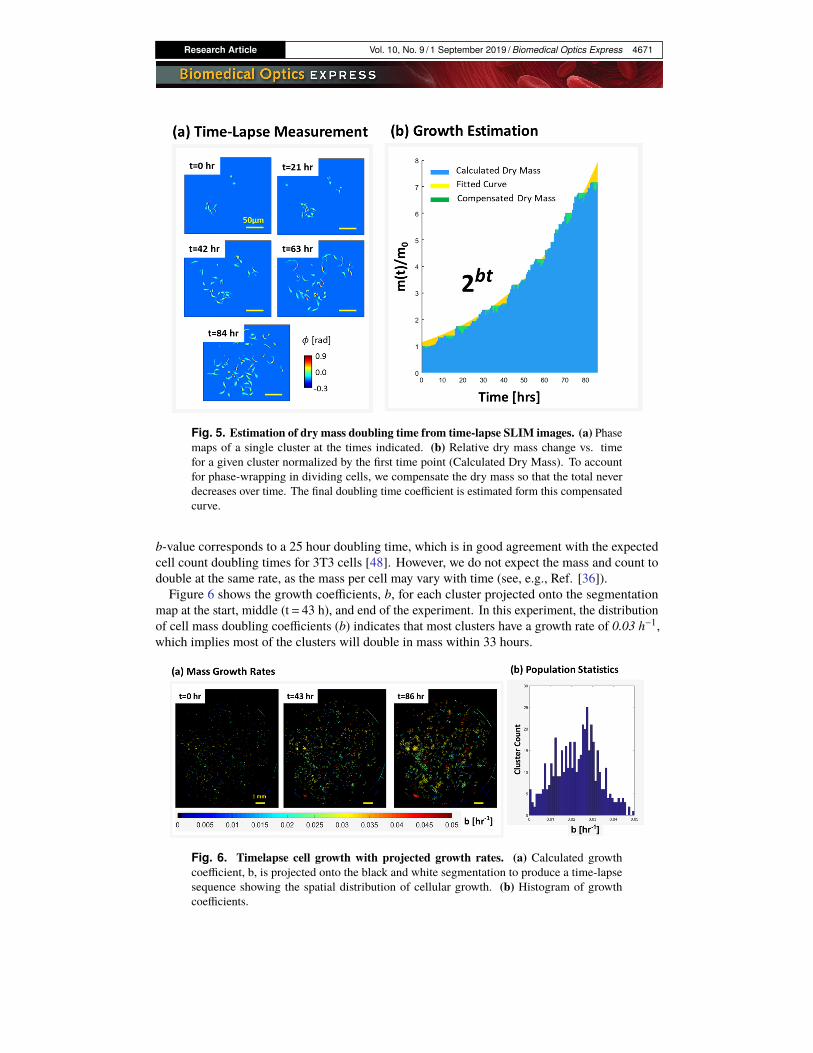
Fig. 5. Estimation of dry mass doubling time from time-lapse SLIM images. (a) Phasemaps of a single cluster at the times indicated. (b) Relative dry mass change vs. timefor a given cluster normalized by the first time point (Calculated Dry Mass). To accountfor phase-wrapping in dividing cells, we compensate the dry mass so that the total neverdecreases over time. The final doubling time coefficient is estimated form this compensatedcurve.
b-value corresponds to a 25 hour doubling time, which is in good agreement with the expectedcell count doubling times for 3T3 cells [48]. However, we do not expect the mass and count todouble at the same rate, as the mass per cell may vary with time (see, e.g., Ref. [36]).Figure 6 shows the growth coefficients, b, for each cluster projected onto the segmentation
map at the start, middle (t= 43 h), and end of the experiment. In this experiment, the distributionof cell mass doubling coefficients (b) indicates that most clusters have a growth rate of 0.03 h−1,which implies most of the clusters will double in mass within 33 hours.
Fig. 6. Timelapse cell growth with projected growth rates. (a) Calculated growthcoefficient, b, is projected onto the black and white segmentation to produce a time-lapsesequence showing the spatial distribution of cellular growth. (b) Histogram of growthcoefficients.
Research Article Vol. 10, No. 9 / 1 September 2019 / Biomedical Optics Express 4672
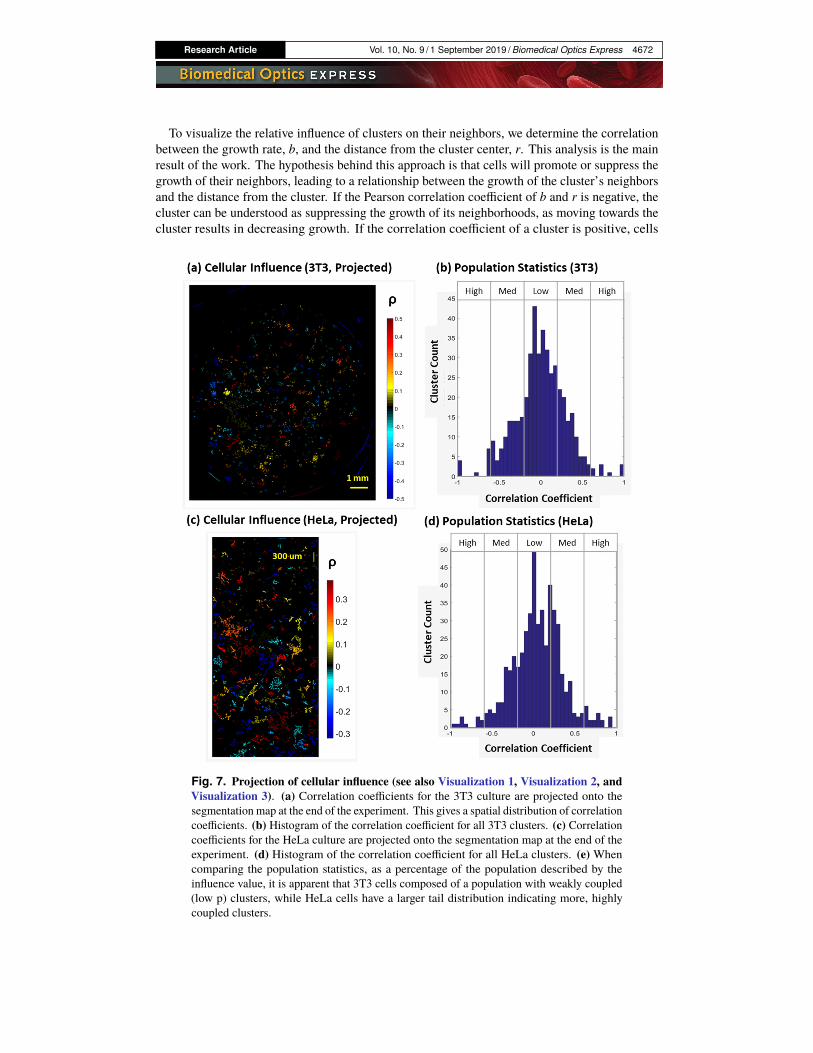
To visualize the relative influence of clusters on their neighbors, we determine the correlationbetween the growth rate, b, and the distance from the cluster center, r. This analysis is the mainresult of the work. The hypothesis behind this approach is that cells will promote or suppress thegrowth of their neighbors, leading to a relationship between the growth of the cluster’s neighborsand the distance from the cluster. If the Pearson correlation coefficient of b and r is negative, thecluster can be understood as suppressing the growth of its neighborhoods, as moving towards thecluster results in decreasing growth. If the correlation coefficient of a cluster is positive, cells
Fig. 7. Projection of cellular influence (see also Visualization 1, Visualization 2, andVisualization 3). (a) Correlation coefficients for the 3T3 culture are projected onto thesegmentation map at the end of the experiment. This gives a spatial distribution of correlationcoefficients. (b) Histogram of the correlation coefficient for all 3T3 clusters. (c) Correlationcoefficients for the HeLa culture are projected onto the segmentation map at the end of theexperiment. (d) Histogram of the correlation coefficient for all HeLa clusters. (e) Whencomparing the population statistics, as a percentage of the population described by theinfluence value, it is apparent that 3T3 cells composed of a population with weakly coupled(low p) clusters, while HeLa cells have a larger tail distribution indicating more, highlycoupled clusters.
Research Article Vol. 10, No. 9 / 1 September 2019 / Biomedical Optics Express 4673
nearer to the cluster have higher growth rates, hinting that the cluster is promoting growth. Whenno strong relationship exists, the cell cluster is not “influential”.
We performed the same analysis on a commonly used line of epithelial cells (HeLa cells). Theresults of are shown in Visualization 1, Visualization 2, and Visualization 3, showing the phasemap, growth rates, and projection of the magnitude influence. The distribution of the correlationcoefficients for all clusters is shown in Fig. 7(b, d). From Fig. 7, we can see that while mostclusters do not have substantial influence over their neighbors (|ρ|<0.3), several clusters exhibitsubstantial correlation coefficients (Fig. 7(a), red) marking them as cells of interest. A typicalcluster has approximately 20 neighbors, which for a ρ = 0.5 implies a 0.95 confidence interval of[0.04,0.78] [49].
4. Discussion
In this work, we presented a quantitative analysis to determine influential cells from time-lapsemeasurements of cellular dry mass. Due to the high quality of the SLIM images, we can use low-magnification objectives, enabling us to rapidly digitize large areas with reduced photo-toxicity.From these data, we can directly measure the mass of individual cells over an entire petri dishthrough several cell cycles. Furthermore, as phase maps are interferometrically normalized,the processing is straightforward with adequate results achieved using simple morphologicaloperations. Note that such studies on large populations of adherent cells are impossible toperform using vibrating cantilever techniques. Previous reports showed that fibroblasts respondto signals from epithelial cells [50]. Studying the co-culture of epithelial cells and fibroblasts arethe subject of current investigation.
Funding
National Science Foundation (CBET-0939511 STC, NRT-UtB 1735252); National Institute ofGeneral Medical Sciences (GM129709).
Acknowledgments
MK proposed the experiment and performed imaging. MK and WL performed analysis. MK,WL, GP wrote the manuscript. Cells were provided by JL, OA, and TS. GP supervised theproject.
Disclosures
GP has a financial interest in Phi Optics Inc, a company developing quantitative phase imaginginstruments.
References1. J. J. Frost, K. J. Pienta, and D. S. Coffey, “Symmetry and symmetry breaking in cancer: a foundational approach to
the cancer problem,” OncoTargets Ther. 9(14), 11429–11440 (2018).2. R. J. DeBerardinis and C. B. Thompson, “Cellular Metabolism and Disease: What Do Metabolic Outliers Teach Us?”
Cell 148(6), 1132–1144 (2012).3. J. W. Brown and J. C. Mills, “Implantable synthetic organoid matrices for intestinal regeneration,” Nat. Cell Biol.
19(11), 1307–1308 (2017).4. N. Gjorevski and M. P. Lutolf, “Synthesis and characterization of well-defined hydrogel matrices and their application
to intestinal stem cell and organoid culture,” Nat. Protoc. 12(11), 2263–2274 (2017).5. V. Munnamalai and D. M. Fekete, “Building the human inner ear in an organoid,” Nat. Biotechnol. 35(6), 518–520
(2017).6. N. de Souza, “Stem cells: Organoid variability examined,” Nat. Methods 14(7), 655 (2017).7. R. D. Kamm, R. Bashir, N. Arora, R. D. Dar, M. U. Gillette, L. G. Griffith, M. L. Kemp, K. Kinlaw, M. Levin, and
A. C. Martin, “Perspective: The promise of multi-cellular engineered living systems,” APL Bioeng. 2(4), 040901(2018).
8. J. B. Weitzman, “Growing without a size checkpoint,” J. Biol. 2(1), 3 (2003).
Research Article Vol. 10, No. 9 / 1 September 2019 / Biomedical Optics Express 4674
9. M. Brackstone, J. L. Townson, and A. F. Chambers, “Tumour dormancy in breast cancer: an update,” Breast CancerRes. 9(3), 208 (2007).
10. A. F. Chambers, A. C. Groom, and I. C. MacDonald, “Dissemination and growth of cancer cells in metastatic sites,”Nat. Rev. Cancer 2(8), 563–572 (2002).
11. P. Goss, A. L. Allan, D. I. Rodenhiser, P. J. Foster, and A. F. Chambers, “New clinical and experimental approachesfor studying tumor dormancy: does tumor dormancy offer a therapeutic target?” APMIS 116(7-8), 552–568 (2008).
12. K. W. Hunter, N. P. Crawford, and J. Alsarraj, “Mechanisms of metastasis,” Breast Cancer Res. 10(S1), S2 (2008).13. B. A. Teicher, D. L. Selwood, and P. A. Andrews, “Anticancer drug development: preclinical screening, clinical trials
and approval (vol 91, pg 1000, 2004),” Br. J. Cancer 91(11), 1977 (2004).14. R. A. Weinberg, “The many faces of tumor dormancy,” APMIS 116(7-8), 548–551 (2008).15. H. Wikman, R. Vessella, and K. Pantel, “Cancer micrometastasis and tumour dormancy,” APMIS 116(7-8), 754–770
(2008).16. M. D. Cameron, E. E. Schmidt, N. Kerkvliet, K. V. Nadkarni, V. L. Morris, A. C. Groom, A. F. Chambers, and I.
C. MacDonald, “Temporal progression of metastasis in lung: cell survival, dormancy, and location dependence ofmetastatic inefficiency,” Cancer Res 60, 2541–2546 (2000).
17. A. K. Croker and A. L. Allan, “Cancer stem cells: implications for the progression and treatment of metastaticdisease,” J. Cell. Mol. Med. 12(2), 374–390 (2008).
18. K. Pantel and R. H. Brakenhoff, “Dissecting the metastatic cascade,” Nat. Rev. Cancer 4(6), 448–456 (2004).19. P. Hahnfeldt, D. Panigrahy, J. Folkman, and L. Hlatky, “Tumor development under angiogenic signaling: a dynamical
theory of tumor growth, treatment response, and postvascular dormancy,” Cancer Res 59, 4770–4775 (1999).20. I. C. MacDonald, A. C. Groom, and A. F. Chambers, “Cancer spread and micrometastasis development: quantitative
approaches for in vivo models,” BioEssays 24(10), 885–893 (2002).21. G. N. Naumov, I. C. MacDonald, P. M. Weinmeister, N. Kerkvliet, K. V. Nadkarni, S. M. Wilson, V. L. Morris, A.
C. Groom, and A. F. Chambers, “Persistence of solitary mammary carcinoma cells in a secondary site: a possiblecontributor to dormancy,” Cancer Res 62, 2162–2168 (2002).
22. G. Popescu, K. Park, M. Mir, and R. Bashir, “New technologies for measuring single cell mass,” Lab Chip 14(4),646–652 (2014).
23. A. Tzur, R. Kafri, V. S. LeBleu, G. Lahav, and M. W. Kirschner, “Cell growth and size homeostasis in proliferatinganimal cells,” Science 325(5937), 167–171 (2009).
24. G. Reshes, S. Vanounou, I. Fishov, and M. Feingold, “Cell shape dynamics in Escherichia coli,” Biophys. J. 94(1),251–264 (2008).
25. G. Popescu, Y. Park, N. Lue, C. Best-Popescu, L. Deflores, R. R. Dasari, M. S. Feld, and K. Badizadegan, “Opticalimaging of cell mass and growth dynamics,” Am. J. Physiol. Cell Physiol. 295(2), C538–C544 (2008).
26. A. K. Bryan, A. Goranov, A. Amon, and S. R. Manalis, “Measurement of mass, density, and volume during the cellcycle of yeast,” Proc. Natl. Acad. Sci. U. S. A. 107(3), 999–1004 (2010).
27. M. Godin, F. F. Delgado, S. Son, W. H. Grover, A. K. Bryan, A. Tzur, P. Jorgensen, K. Payer, A. D. Grossman, M.W. Kirschner, and S. R. Manalis, “Using buoyant mass to measure the growth of single cells,” Nat. Methods 7(5),387–390 (2010).
28. N. Cermak, S. Olcum, F. F. Delgado, S. C. Wasserman, K. R. Payer, M. A. Murakami, M. Knudsen, R. J. Kimmerling,M. M. Stevens, Y. Kikuchi, A. Sandikci, M. Ogawa, V. Agache, F. Baleras, D. M. Weinstock, and S. R. Manalis,“High-throughput measurement of single-cell growth rates using serial microfluidic mass sensor arrays,” Nat.Biotechnol. 34(10), 1052–1059 (2016).
29. K. Park, L. Millet, J. Huan, N. Kim, G. Popescu, N. Aluru, K. J. Hsia, and R. Bashir, “Measurement of Adherent CellMass and Growth,” Proc. Natl. Acad. Sci. U. S. A. 107(48), 20691–20696 (2010).
30. G. Popescu, Quantitative Phase Imaging of Cells and Tissues, McGraw-Hill Biophotonics (McGraw-Hill, 2011).31. Y. Park, C. Depeursinge, and G. Popescu, “Quantitative phase imaging in biomedicine,” Nat. Photonics 12(10),
578–589 (2018).32. R. Barer, ““Phase-contrast” methods and birefringence,” Nature 167(4251), 642–643 (1951).33. H. G. Davies and M. H. Wilkins, “Interference microscopy and mass determination,” Nature 169(4300), 541 (1952).34. G. A. Dunn and D. Zicha, “Dynamics Of Fibroblast Spreading,” J. Cell Sci. 108, 1239–1249 (1995).35. K. Lee, K. Kim, J. Jung, J. Heo, S. Cho, S. Lee, G. Chang, Y. Jo, H. Park, and Y. Park, “Quantitative phase imaging
techniques for the study of cell pathophysiology: from principles to applications,” Sensors 13(4), 4170–4191 (2013).36. M. Mir, A. Bergamaschi, B. S. Katzenellenbogen, and G. Popescu, “Highly Sensitive Quantitative Imaging for
Monitoring Single Cancer Cell Growth Kinetics and Drug Response,” PLoS One 9(2), e89000 (2014).37. S. Sridharan Weaver, Y. Li, L. Foucard, H. Majeed, B. Bhaduri, A. J. Levine, K. A. Kilian, and G. Popescu,
“Simultaneous cell traction and growth measurements using light,” J. Biophotonics 12(3), e201800182 (2019).38. M. Mir, Z. Wang, Z. Shen, M. Bednarz, R. Bashir, I. Golding, S. G. Prasanth, and G. Popescu, “Optical measurement
of cycle-dependent cell growth,” Proc. Natl. Acad. Sci. U. S. A. 108(32), 13124–13129 (2011).39. M. Mugnano, P. Memmolo, L. Miccio, S. Grilli, F. Merola, A. Calabuig, A. Bramanti, E. Mazzon, and P. Ferraro, “In
vitro cytotoxicity evaluation of cadmium by label-free holographic microscopy,” J. Biophotonics 11(12), e201800099(2018).
40. Z. Wang, L. J. Millet, M. Mir, H. Ding, S. Unarunotai, J. A. Rogers, M. U. Gillette, and G. Popescu, “Spatial lightinterference microscopy (SLIM),” Opt. Express 19(2), 1016 (2011).
Research Article Vol. 10, No. 9 / 1 September 2019 / Biomedical Optics Express 4675
41. T. Kim, R. J. Zhou, M. Mir, S. D. Babacan, P. S. Carney, L. L. Goddard, and G. Popescu, “White-light diffractiontomography of unlabeled live cells,” Nat. Photonics 8(3), 256–263 (2014).
42. Z. Wang, I. S. Chun, X. L. Li, Z. Y. Ong, E. Pop, L. Millet, M. Gillette, and G. Popescu, “Topography andrefractometry of nanostructures using spatial light interference microscopy,” Opt. Lett. 35(2), 208–210 (2010).
43. M. E. Kandel, M. Fanous, C. Best-Popescu, and G. Popescu, “Real-time halo correction in phase contrast imaging,”Biomed. Opt. Express 9(2), 623–635 (2018).
44. M. E. Kandel, S. Sridharan, J. Liang, Z. Luo, K. Han, V. Macias, A. Shah, R. Patel, K. Tangella, A. Kajdacsy-Balla,G. Guzman, and G. Popescu, “Label-free tissue scanner for colorectal cancer screening,” J. Biomed. Opt. 22(6),066016 (2017).
45. B. S. Reddy and B. N. Chatterji, “An FFT-based technique for translation, rotation, and scale-invariant imageregistration,” IEEE Trans. Image Process 5(8), 1266–1271 (1996).
46. G. Quadrato, T. Nguyen, E. Z. Macosko, J. L. Sherwood, S. Min Yang, D. R. Berger, N. Maria, J. Scholvin, M.Goldman, J. P. Kinney, E. S. Boyden, J. W. Lichtman, Z. M. Williams, S. A. McCarroll, and P. Arlotta, “Cell diversityand network dynamics in photosensitive human brain organoids,” Nature 545(7652), 48–53 (2017).
47. ATCC, “Passage Number and Population Doubling Level,” ATCC Animal Cell Culture Guide, p. 4.48. S. T. Christensen, I. R. Veland, A. Schwab, M. Cammer, and P. Satir, “Chapter Three - Analysis of Primary Cilia in
Directional Cell Migration in Fibroblasts,” in Methods in Enzymology, W. F. Marshall, ed. (Academic Press, 2013),pp. 45–58.
49. R. Lowry, “The Confidence Interval of rho”, retrieved http://vassarstats.net/rho.html.50. J. P. Thiery, H. Acloque, R. Y. Huang, and M. A. Nieto, “Epithelial-mesenchymal transitions in development and
disease,” Cell 139(5), 871–890 (2009).