
Blowout in Gas Storage Caverns - pdfs.semanticscholar.org · INTRODUCTION A blowout is the...
17
Blowout in Gas Storage Caverns H. Djizanne 1 *, P. Bérest 1 , B. Brouard 2 and A. Frangi 3 1 LMS, École Polytechnique ParisTech, École des Mines de Paris, École des Ponts et Chaussées, UMR 7649 CNRS, route de Saclay, 91120 Palaiseau - France 2 Brouard Consulting, 101 rue du temple, 75003 Paris - France 3 Politecnico di Milano, Piazza Leonardo da Vinci, 32, 20133 Milano - Italy e-mail: [email protected] - [email protected] - [email protected] - [email protected] * Corresponding author Abstract — A small number of blowouts from gas storage caverns has been described in the litera- ture. Gas flow lasted several days before the caverns were emptied. In this paper, we suggest simpli- fied methods that allow for computing blowout duration, and evolution of gas temperature and pressure in the cavern and in the well. This method is used to compute air flow from an abandoned mine, an accident described by Van Sambeek in 2009, and a natural gas blowout in an underground storage facility in Kansas. The case of a hydrogen storage cavern also is considered, as it is known that hydrogen depressurization can lead, in certain cases, to an increase in hydrogen temperature. Re´ sume´ — E ´ ruption en cavite´s de stockage de gaz — Un petit nombre d’e´ruptions en cavite´s salines de stockage de gaz a e´te´ de´crit dans la litte´rature. L’e´coulement de gaz dure plusieurs jours avant que les cavite´s ne se vident comple`tement. Dans cet article, nous proposons une me´thode de calcul de la dure´e de l’e´ruption et de l’e´volution des parame`tres majeurs du syste`me tels que la tempe´rature, la pression et la vitesse du gaz dans la cavite´ ou dans le puits. Cette me´thode est utilise´e pour calculer le de´bit d’air expulse´ par un puits d’acce`s a` une mine de sel abandonne´e, un accident de´crit par Van Sambeek en 2009, et une e´ruption suivie d’une combustion du gaz naturel sur un site de stockage souterrain de gaz naturel au Kansas. Le cas d’une cavite´ de stockage d’hydroge`ne est e´galement examine´, avec le souci de ve´rifier si la de´tente de l’hydroge`ne peut conduire, dans certains cas, a` une augmentation de sa tempe´rature. Oil & Gas Science and Technology – Rev. IFP Energies nouvelles, Vol. 69 (2014), No. 7, pp. 1251-1267 Copyright Ó 2014, IFP Energies nouvelles DOI: 10.2516/ogst/2013208
Transcript of Blowout in Gas Storage Caverns - pdfs.semanticscholar.org · INTRODUCTION A blowout is the...
D o s s i e rSecond and Third Generation Biofuels: Towards Sustainability and Competitiveness
Seconde et troisième génération de biocarburants : développement durable et compétitivité
Blowout in Gas Storage Caverns
H. Djizanne1*, P. Bérest1, B. Brouard2 and A. Frangi3
1 LMS, École Polytechnique ParisTech, École des Mines de Paris, École des Ponts et Chaussées,UMR 7649 CNRS, route de Saclay, 91120 Palaiseau - France2 Brouard Consulting, 101 rue du temple, 75003 Paris - France
3 Politecnico di Milano, Piazza Leonardo da Vinci, 32, 20133 Milano - Italye-mail: [email protected] - [email protected] - [email protected] - [email protected]
* Corresponding author
Abstract — A small number of blowouts from gas storage caverns has been described in the litera-
ture. Gas flow lasted several days before the caverns were emptied. In this paper, we suggest simpli-
fied methods that allow for computing blowout duration, and evolution of gas temperature and
pressure in the cavern and in the well. This method is used to compute air flow from an abandoned
mine, an accident described by Van Sambeek in 2009, and a natural gas blowout in an underground
storage facility in Kansas. The case of a hydrogen storage cavern also is considered, as it is known
that hydrogen depressurization can lead, in certain cases, to an increase in hydrogen temperature.
Resume — Eruption en cavites de stockage de gaz — Un petit nombre d’eruptions en cavites
salines de stockage de gaz a ete decrit dans la litterature. L’ecoulement de gaz dure plusieurs
jours avant que les cavites ne se vident completement. Dans cet article, nous proposons une
methode de calcul de la duree de l’eruption et de l’evolution des parametres majeurs du
systeme tels que la temperature, la pression et la vitesse du gaz dans la cavite ou dans le puits.
Cette methode est utilisee pour calculer le debit d’air expulse par un puits d’acces a une mine
de sel abandonnee, un accident decrit par Van Sambeek en 2009, et une eruption suivie d’une
combustion du gaz naturel sur un site de stockage souterrain de gaz naturel au Kansas. Le cas
d’une cavite de stockage d’hydrogene est egalement examine, avec le souci de verifier si la
detente de l’hydrogene peut conduire, dans certains cas, a une augmentation de sa temperature.
Oil & Gas Science and Technology – Rev. IFP Energies nouvelles, Vol. 69 (2014), No. 7, pp. 1251-1267Copyright � 2014, IFP Energies nouvellesDOI: 10.2516/ogst/2013208
LIST OF SYMBOLS
a van der Waals gas coefficient, measures attrac-
tion between particles, J.m3/kg2
b van der Waals gas coefficient, excluded volume
per unit of mass of a gas, m3/kg
Cp Heat capacity at constant pressure, J/kg.K
Cv Heat capacity at constant volume, J/kg.K
D Well diameter, m
e Internal energy, J
F Friction coefficient, /m
f Friction factor
g Gravity acceleration, m/s2
H Borehole length, m
h Gas enthalpy, J/kg
K Thermal conductivity of salt, W/m.�Ck Thermal diffusivity of salt, m2/s
M Molar mass, g/mol
m Gas mass, kg
P Pressure, Pa
Patm Atmospheric pressure, Pa
Pc Cavern pressure, Pa
Pwh Wellhead cavern pressure, Pa
Q Heat flux at cavern wall, W
S Gas entropy, J/K
t Time, s
T Temperature, K
Tc Cavern temperature, K
Tcr Critical temperature, K
Twh Wellhead gas temperature, K
uc Gas velocity at casing-shoe depth, m/s
uwh Wellhead gas velocity, m/s
V0 Cavern volume, m3
z Depth, m
GREEK LETTERS
c Ratio of specific heats, c = Cp/Cv
e Absolute roughness of the well, m
g Kinematic viscosity of gas, m2/s
_l Mass flow, kg/s.m2
m Specific volume of gas, m3/kg
mc Specific volume of cavern gas, m3/kg
mwh Specific volume of wellhead gas, m3/kg
q Gas density, kg/m3
R Cross-sectional area of well, m2
Rc Actual surface of cavern walls, m2
INTRODUCTION
A blowout is the uncontrolled release of crude oil and/
or natural gas from an oil or gas well after pressure
control systems have failed. It often is a dramatic acci-
dent when it affects a conventional reservoir, as the
amount of gas or oil that can be released can be huge;
blowout duration can be several months long. Blow-
outs from storage caverns of liquid or liquefied hydro-
carbons have a different character, as the amount of
products immediately released after wellhead failure
is relatively small (Berest and Brouard, 2003). Several
examples of blowouts in gas storage caverns have been
described in the literature, such as that in an ethane
storage at Fort Saskatchewan, Canada (Alberta
Energy and Utilities Board, 2002) or in a natural gas
storage at Moss Bluff, Texas (Rittenhour and Heath,
2012). There were no casualties in these instances, as
the gas rapidly ignited, although the entire inventory
was lost. A somewhat similar accident occurred in a
“compressed air storage” (in fact, an abandoned salt
mine) at Kanopolis, Kansas; a complete description
can be found in Van Sambeek (2009).
The most striking difference between a blowout in a
well tapped in an oil or gas reservoir and a blowout in
a gas-cavern well is that the blowout in a gas-cavern well
is completed within a couple of days, as the gas inventory
in a cavern is much smaller than in a reservior. Another
difference is that the modeling of the thermodynamic
behavior of gas in the cavern is much simpler than in a
permeable reservoir, allowing a complete computation
of the blowout.
In this paper, a simple method for computing a blow-
out from a salt cavern is proposed. It involves relatively
simple formulae and light numerical computations. Dis-
cussion of the numerical results focuses on blowout
duration, gas rates at ground level and the evolutions
of gas temperature in the cavern. This last issue is of spe-
cial significance. The drop of gas temperature in a cav-
ern during a blowout often is severe, and thermal
tensile stresses are generated at the cavern wall (Berest
et al., 2013). It has been suspected that these stresses
lead to fracturing at the cavern wall, spalling and loss
of cavern tightness, and correct assessment of cavern
temperature is important in this context. In fact, it will
be proved that low gas temperatures in the cavern are
experienced during a relatively short period of time,
and that the depth of penetration of temperature
changes at cavern walls is too small to generate deep ten-
sile fractures.
1252 Oil & Gas Science and Technology – Rev. IFP Energies nouvelles, Vol. 69xx (2014), No. 7

1 EVOLUTION OF GAS TEMPERATURE AND PRESSUREIN THE CAVERN
1.1 Salt Caverns
Salt caverns currently are used for storing hydrocar-
bons, air or hydrogen. These caverns are created
through solution mining. In this system, a well is
drilled to the salt formation, and cased and cemented
to the formation. A smaller tube is set inside the cas-
ing, as a straw in a bottle. Soft water is injected
through the central tube. The water leaches out the
salt, and the formed brine is withdrawn from the cav-
ern through the annular space between the central
string and the casing. After a year or so, a large
cavern is created. Its depth ranges from 200 m to
2 000 m, and its volume ranges from 10 000 m3 to
several millions m3. When solution mining is com-
pleted, the cavern is filled with saturated brine. Gas
then is injected through the annular space, and brine
is withdrawn through the central tubing (“de-
brining”). A small amount of brine is left at the
cavern bottom, and the gas in the cavern is wet.
A typical operation cycle includes withdrawal during
winter and injection during summer. Minimum and
maximum gas pressures typically range from, respec-
tively, 15% to 90% of the geostatic pressure (i.e.,
the weight of the overburden).
1.2 Energy Balance
Gas temperature, Tc tð Þ; and gas pressure, Pc tð Þ; can be
considered almost uniform throughout the entire volume
of a cavern (Berest et al., 2012). The stored gas is charac-
terized by its state equation, which defines gas pressure
Pð Þ as a function of gas specific volume ðm ¼ 1=q;q is
the gas density) and of gas (absolute) temperature Tð Þ;by a thermodynamic potential, for instance, its enthalpy
per unit of mass hð Þ or its internal energy per unit of mass
(e = h�Pv):
P ¼ P m; Tð Þ ð1Þ
h ¼ h T ;Pð Þ ð2Þ
The kinetic energy of gas in the cavern is neglected.
The energy balance equation can be written:
m _ec þ Pc _mcð Þ ¼ Q þ < _m > hinj � hc� �þ L _C ð3Þ
where m is the mass of gas in the cavern, ec is the gas
internal energy, and:
_ec þ Pc _vc ¼ Cv _Tc þ TcðoP=oTÞjvc _vc
< _m >¼ _m when _m > 0 and < _m >¼ 0 when _m < 0:When gas is injected in the cavern < _m >¼ _m > 0ð Þ,the difference between the enthalpy of the injected gas
hinj� �
and the enthalpy of the cavern gas hcð Þ must be
taken into account. C is the amount of water vapor in
the cavern, and L is the phase-change heat of water (from
liquid phase to vapor phase). Q is the heat flux trans-
ferred from the rock mass to the cavern gas through
the cavern wall, or:
Q ¼Z
�KsaltoTsalt
onda ð4Þ
where Ksalt is the thermal conductivity of salt (typically,
Ksalt ¼ 6 W=m:�CÞ and Tsalt is the temperature of the
rock mass.
1.3 Simplifications
In the following, it is assumed that the gas is ideal,
Pv ¼ rT ; e ¼ CvT ; and _eþ P _m ¼ Cv _T þ rT _v=v: During a
blowout, _m < 0 and < _m >¼ 0. During gas withdrawal,
cavern volume, or V 0; experiences only a small change
and can be considered constant, or V 0 ¼ mm and
m _m ¼ � _mm. Water vapor condenses during gas depres-
surization (“raining”, or even “snowing”, in the cavern);
however, from the perspective of energy balance, this
term is small and can be neglected.
The heat flux from the cavern is much more signifi-
cant; it can be computed as follows. The evolution of
temperature in the rock mass is governed by thermal
conduction. Generally speaking, penetration of temper-
ature changes in the rock mass is slow. For instance,
when a cold gas temperature, T0, has been kept constant
over a t-long period of time on the (flat) surface of a half-
space x > 0ð Þ whose initial temperature (at t ¼ 0Þ was
T1, temperature evolution can be written:
T x; tð Þ ¼ T1 þ T0 � T1ð Þerfc x
2ffiffiffiffikt
p� �
where k � 3� 10�6m2=s is the rock thermal diffusivity.
Heat flux per unit area at the surface is:
Q ¼ �Ksalt T1 � T0ð Þ=ffiffiffiffiffiffiffipkt
p
Rock temperature changes significantly (by more
than: T � T1ð Þ= T0 � T1ð Þ ¼ erfc 1=2ð Þ ’ 50%) in a
domain with a thickness of d ¼ ffiffiffiffikt
p, or d � 1 m after
t ¼ 4 days. Blowout in a gas cavern is a rapid process:
it is completed within a week or less. During such a short
period of time, temperature changes are not given time
enough to penetrate deep into the rock mass and, from
H. Djizanne et al. / Blowout in Gas Storage Caverns 1253

the perspective of thermal conduction, cavern walls can
be considered as a flat surface whose area equals the
actual area of the cavern (in other words, for numerical
computations, actual surface must be smoothed to elim-
inate shape irregularities whose radii of curvature are
smaller than d), as was noted by Crotogino et al.
(2001) and Krieter (2011).
When a varying temperature, Tc ¼ Tc tð Þ, is applied on
the surface, the heat flux per surface unit can be
expressed as:
Q ¼Z t
0�Ksalt
_Tc sð Þffiffiffiffiffiffiffiffiffiffiffiffiffiffiffiffiffiffiffipk t � sð Þp ds ð5Þ
When these simplifications are accepted, the heat
balance equation can be written:
_Tc tð Þvc tð Þ þ ðc� 1Þ _vc tð ÞTc tð Þ
v2c tð Þ ¼ � RcK
CvV 0
ffiffiffik
pZ t
0
_Tc sð Þffiffiffiffiffiffiffiffiffiffiffiffiffiffiffiffip t � sð Þp ds
ð6Þ
where Rc is the (actual) surface of the cavern walls. When
the heat flux is neglected K ¼ 0ð Þ; the thermodynamic
behavior of gas is isentropic and Tmc�1 is constant as
expected.
1.4 The case of a van der Waals Gas
In Section 6, the case of a hydrogen storage is discussed,
in which a van der Waals equation — instead of an ideal
gas equation — is more appropriate:
P ¼ �a=m2 þ RT= m� bð Þ
and
h ¼ CvT � 2a=mþ rTm= m� bð Þ
The heat balance equation can be written:
_TcðtÞmcðtÞ þ c� 1ð Þ _mc tð ÞTcðtÞ
mc2�bmc¼ � RcK
CvV 0
ffiffiffik
pZ t
0
_Tc sð Þffiffiffiffiffiffiffiffiffiffiffiffiffiffiffiffip t � sð Þp ds
ð7Þ
1.5 An Example
Equation (6) was validated against the results of a
withdrawal test performed in a gas-storage cavern at
Melville (Canada), described by Crossley (1996). The
measured flow rate, cavern pressure and temperature
are drawn in Figure 1. The withdrawal period was 5 days
long. The following values were selected: c ¼ 1:305,and Cp ¼ 2 237 J=kg:K: The cavern volume is
V 0 ¼ 46 000 m3: Cavern shape was unknown, and the
surface of the cavern walls was selected to be twice the
surface of a sphere whose volume equals the actual
cavern volume. Note that slightly before the end of the
withdrawal phase (day 5), gas starts warming, as the heat
flux from the rock mass becomes quite high.
2 EVOLUTION OF GAS TEMPERATURE AND PRESSURE INTHE WELLBORE
In this section, the flow of gas through the well is dis-
cussed. Here, gas temperature, pressure or specific vol-
ume are functions of z ðz ¼ 0 at the cavern top or
casing shoe and z = H at the wellhead).
2.1 Main Assumptions
Duct
Duct diameter, D; is assumed to be constant all along the
well; hence, the cross-sectional area of the duct,R; is con-stant as well.
Adiabatic Flow
Gas temperature decreases in the cavern and borehole.
Casing steel, cement and rock at the vicinity of the well
experience large temperature changes and thermal con-
traction. Conversely, the amount of heat transferred
from the rock mass to the gas is not able to change
gas temperature significantly, as the flow rate of gas
is extremely fast. Heat transfer from the rock mass is
neglected, and gas flow is considered adiabatic. This
issue was discussed in Brouard Consulting and
RESPEC (2013).
Turbulent Flow
Except maybe at the end of the blowout, gas flow is tur-
bulent. The effects of friction are confined to a thin
boundary layer at the steel casing wall. The average
gas velocity is uniform through any cross-sectional area
(except, of course, in the boundary layer).
Steady-State Flow
The gas rate in a borehole typically is a couple hun-
dreds of meters per second (more, when hydrogen is
considered). In other words, only a few seconds are
needed for gas to travel from the cavern top to ground
level. Such a short period of time is insufficient for
1254 Oil & Gas Science and Technology – Rev. IFP Energies nouvelles, Vol. 69xx (2014), No. 7

cavern pressure and temperature change significantly.
Steady-state flow is assumed and, for simplicity, gas
temperature, velocity etc. will be noted Tc ¼ Tc zð Þ;
u ¼ u zð Þ; etc. (Obviously, when longer periods of time
are considered, cavern pressure slowly decreases).
These assumptions, which are part of the so-called
“Fanno-flow” model, are commonly accepted (Von
Vogel and Marx, 1985), although Ma et al. (2011) con-
sider an “isothermal” flow in the well.
2.2 Equations
In addition to Equations (1) and (2), gas flow can be
described by the following set of equations:
_l ¼ uðzÞvðzÞ ¼ �V 0
R
_mðzÞm2ðzÞ ð8Þ
dh
dzþ u
du
dzþ g ¼ 0 ð9Þ
mdP
dzþ u
du
dzþ g ¼ �f uð Þ ð10Þ
udS
dz� 0 ð11Þ
Equation (8) is the mass conservation equation, where
u and m define celerity and specific volume, respectively,
and _l ¼ uðzÞ=vðzÞ is a constant in the well. Equation
(9) is the energy equation, where g is the gravity acceler-
ation. Equation (10) is the momentum equation. Head
losses per unit of length are described by f uð Þ > 0, wheref ¼ f u;D; e; :::ð Þ is a function of gas velocity, duct diam-
eter, wall roughness, etc. Statement (11) is the condition
of positivity of entropy Sð Þ change, which plays an
important role in the context of the Fanno-flow
model.
2.3 Boundary Conditions and Subsonic Flow
Equations (8) to (10) allow computation of gas pressure
and gas temperature in the borehole. Boundary condi-
tions are needed. Pressure and temperature in the cavern
[Pc ¼ Pðz ¼ 0Þ and Tc ¼ Tðz ¼ 0Þ] are assumed known
at any instant. Then, the specific volume of gas, or mc,can be computed through the state equation
Pc ¼ Pðmc; TcÞ: In principle, gas pressure at the wellhead,
Pwh, should be atmospheric: Pwh ¼ Patm:
However, this boundary condition cannot always be
satisfied. It is known from thermodynamics textbooks
that dh S;Pð Þ ¼ TdS þ mdP; hence:
dh S; mð Þ ¼ TdS �c2dm=m
800
600
400
200
00 2 4 6 8 10 12
Date (day)
0 2 4 6 8 10 12
Date (day)
0 2 4 6 8 10 12
Date (day)
Flo
wra
te (
MS
CF
H)
Pre
ssur
e (P
SIG
)Te
mpe
ratu
re (
° F)
Measured
800
1 000
1 200
1 400
1 600
1 800
2 000Computed
Measured
Computed
Measured
70
80
90
100
110
Figure 1
Melville Cavern: gas withdrawal rate, pressure and tempera-
ture evolutions, as observed (after Crossley, 1996) and com-
puted.
1MSCFH= 28 317 Nm3/h, 1MPa= 145 psig and 20�C=
68�F.
H. Djizanne et al. / Blowout in Gas Storage Caverns 1255
where c is the velocity of sound. (For an ideal gas,
c2 ¼ cPm:) When gravity is disregarded in a Fanno flow,
dhþ udu ¼ 0, and TdS ¼ ðc2 � u2Þdm=m. However, the
sign of dS must not change; in other words, when the
flow of gas is subsonic uc < ccð Þ at cavern top
(z=0), it must remain subsonic uðzÞ < cðzÞ½ � in the bore-
hole (except perhaps at ground level, z ¼ HÞ:When applying the boundary condition, Pwh ¼ Patm;
leads to a solution such that gas flow is supersonic in a
part of the well (this may occur when cavern pressure
is sufficiently high), another solution must be selected
(Landau and Lifchitz, 1971, Section 91). This solution
is constructed such that uwh ¼ cwh: (The flow, which is
sonic at ground level, is said to be “choked”.) In such
a case, no constraint is applied to Pwh, which, in general,
is larger than atmospheric. Conversely, when the cavern
pressure is relatively small, the gas flow is said to be
“normal”. Even at ground level, the gas rate is signifi-
cantly slower than the speed of sound, and the boundary
condition Pwh ¼ Patm applies.
2.4 Simplifications
The following simplified version of this set of equations
allows a closed-form solution to be obtained.
Body Forces
Body forces are disregarded, g ¼ 0: (However, the case
when g 6¼ 0 is discussed in Appendix A; it has been
proven that, in practical terms, this case does not lead
to significant differences.)
Colebrook's Equation
Our main interest is in gas average velocities larger than
u ¼ 1m=s (and up to several hundreds of m/sÞ: Typi-cally, air viscosity is g ¼ 1:3� 10�5 m2=s, duct diameter
is D ¼ 0:2m; and Reynolds number (Re ¼ uD/g) is largerthan 104: In this context, head losses can be written
f uð Þ ¼ Fu2, where F = f/2D is the friction coefficient,
and f is the friction factor. Especially at the beginning
of a blowout, when the velocity of gas is high and the
Reynolds number is very large, the Colebrook’s
equation is written:
1ffiffiffif
p ¼ �2log10e
3:71D
� �ð12Þ
where e is the well roughness. ðe ¼ 0:02mm is a typical
value.)
Gas State Equation
The gas state equation,P ¼ P m; Tð Þ, canbe simplified as in
the following two cases. In the first case, the gas (typically,
natural gas or air) is ideal — i.e., its state equation is:
Pm ¼ rT ; r ¼ Cp � Cv; c ¼ Cp=Cv
and its enthalpy can be written h ¼ CpT , where the heatcapacity of the gas at constant pressure Cp is constant. In
the second case, the gas (typically, hydrogen) is of the
van der Waals type — i.e., its state equation is:
P ¼ �a=m2 þ RT=ðm� bÞ
where a; b are two constants, and its enthalpy is:
h ¼ CvT � 2a=mþ rTm=ðm� bÞ
where the heat capacity of the gas at constant volume Cv
is constant.
The properties of gases used in this paper are pre-
sented in Table 1 (from gas encyclopedia, Air Liquide,
2012; pressure and temperature are 105 Pa and
298.15 K respectively).
2.5 Model Assessment
The aim of this paper is to provide a clear picture of the
main phenomena that affect gas flow during a blowout,
although results are indicative rather than exact. In fact,
the model suffers from the following three flaws:
– head losses are roughly estimated by the simplified
Colebrook’s equation; in fact, actual coefficient F is a
function of the flow rate, especially when this rate is
small;
– even the van derWaals state equation is a less than per-
fect description of the actual behavior of hydrogen,
and heat capacity, Cv; is a function of temperature;
– at the end of a blowout, gas flow rates are low, and the
simplifications considered in Section 2.4 no longer hold.
A more precise description of gas behavior can be
taken into account in Equations (1) and (2) — for
instance, Cv ¼ Cv T ; vð Þ and Pv ¼ rTZ T ;Pð Þ. However,
when such a description is accepted, numerical computa-
tions are required to compute the flow of gas in the well.
3 AIR OR NATURAL-GAS FLOW
3.1 Momentum Equation
In this Section, Equations (8) to (11) are used to obtain a
relation between gas temperature in the cavern, Tc; and
the specific mass of the gas in the cavern, vc: Taking into
1256 Oil & Gas Science and Technology – Rev. IFP Energies nouvelles, Vol. 69xx (2014), No. 7

account the simplifications noted in Section 2.4, energy
Equation (6) can be re-written as:
CpT zð Þ þ _l2m2 zð Þ=2 ¼ CpTc þ _l2m2c2 ð13Þ
Or
P zð Þ ¼ Pc þ c� 1
2c_l2mc
� �mcm zð Þ �
c� 1
2c
� �_l2m zð Þ ð14Þ
and momentum Equation (10) can be written as:
rTc
_l2þ c� 1
2cm2c
� �1
m3 zð Þ �cþ 1
2cm zð Þ ¼ Fdz
dmzð Þ ð15Þ
Note that this equation also can be written:
c2 zð Þ � u2 zð Þ ¼ c _l2m3 zð ÞF dz
dmzð Þ
Because only solutions resulting in u2 < c2 are consid-
ered, m is an increasing function of z:Integration of momentum Equation (15) from z ¼ 0
(casing shoe) to z ¼ H (wellhead) leads to:
1
2
rTc
_l2þ c� 1
2cm2c
� �1
m2c� 1
m2wh
� � � cþ 1
4c
� �Log
m2whm2c
¼ FH
ð16Þ
3.2 Normal Flow
Gas pressure at ground level is, in principle, atmo-
spheric, Pwh ¼ Patm:
Pwh ¼ rTc þ c� 1
2c_l2m2c
� �1
mwh� c� 1
2c
� �_l2mwh ¼ Patm
ð17Þ
The positive solution of this second-degree equation
(with respect to vwh) can be computed easily, and its
combination with Equation (8) leads to the following
differential equation:
_vc ¼ �Rcvc _l rTc; vc; c;FH ;Patmð Þ=V 0 ð18Þ
However, this solution is valid only when Equation
(11) is true (normal flow) — i.e., when:
c2 � u2 ¼ cPm� _l2m2 ¼
c rTc þ c� 1
2c_l2m2c
� �� cþ 1
2
� �_l2m2 > 0
ð19Þ
3.3 Choked Flow
When condition (19) is not met, the solution (normal
flow) must be rejected. The boundary condition
Pwh ¼ Patm can no longer be satisfied. Instead of
Pwh ¼ Patm (Eq. 17), the choked-flow condition,
cwh � uwh ¼ 0, must be used:
rTc þ c� 1
2c
� �_l2m2c �
cþ 1
2c
� �_l2m2wh ¼ 0 ð20Þ
Eliminating _l2 between (16) and (20) leads to:
v2wh=v2c
� �� 1� Log v2wh=v2c
� � ¼ ½4c= cþ 1ð Þ�FH
which proves that vwh=vc is a function of c and FH and
that:
_lvc ¼ Iðc;FHÞffiffiffiffiffiffiffirTc
pCombining again with Equation (8) leads to:
_vc ¼ RffiffiffiffiffiffiffirTc
pI c;FHð Þ=V 0 ð21Þ
Equations (18) or (21), together with Equation (6),
allow computation of gas temperature and specific-
volume evolutions of gas during a blowout.
4 THE MOSS BLUFF BLOWOUT
In August 2004, Cavern #1 of the Moss Bluff natural gas
storage in Texas experienced a major gas release and fire
(Fig. 2). The cavern bottom was filled with saturated
brine, and the volume of the gas-filled part of the cavern
was V0 = 1 268 000 m3. The blowout initiated during
de-brining of the cavern when gas entered the 8-5=8” brine
string, causing the pipe to burst at ground level. The
ensuing fire resulted, 21 hours (0.88 day) later, in
TABLE 1
Gases constants
Gases Cp (J/kg.K) Cv (J/kg.K) c(-) M (g/mol) a (J.m3/kg2) b (m3/kg)
Air 1 010 719 1.402 28.95 – –
CH4 2 237 1 714 1.305 16.043 – –
H2 14 831 10 714 1.384 2.016 6 092 0.013
H. Djizanne et al. / Blowout in Gas Storage Caverns 1257

separation of the wellhead assembly and the uncontrolled
loss of gas from the 20” production casing. The fire self-
extinguished about 6-1=2 days later, when all the gas was
burned off. More than 6 sbcf of gas had been released.
Several witnesses report that, after the natural-gas
release had been completed, air at ground level was
“sucked” into the cavern over several dozens of minutes.
One possible explanation is that, during the blowout, the
cavern gas was oversaturated with water vapor: partial
pressure of the vapor dropped, but not enough time
was left for the vapor to condense fully and to reach ther-
modynamic equilibrium with the brine sump at the bot-
tom of the cavern. When the blowout was complete,
additional condensation took place, leading to a
decrease in the cavern gas pressure, and air was sucked
into the cavern.
The surface of the cavern walls (not including the brine-
gas interface)was computed tobeRc ¼ 84 200m2. The fric-
tion factor was assumed to be f ¼ 0:012 when diameter is
D ¼ 8-5=8 inches and f ¼ 0:010 when the well diameter is
D ¼ 20 inches. The borehole length is H ¼ 765 m. The gas
initial pressure and temperature were assumed to be
P0c ¼ 13:89 MPa and T0
c ¼ 51�C ð324:15KÞ:Main results are presented in Figure 3. It was said that
after 21 hours (0.88 day), the well diameter increased
fromD=8-5/8” toD=20”. As a result of this diameter
increase, head losses are smaller and gas velocities are
faster; the rate of pressure and temperature changes,
and the heat flux from the rock mass abruply increases.
Total duration of the computed flow is slighly less than
6 days (the actual duration was 6.5 days). Gas flow is
choked (gas velocity is sonic at the wellhead) during
the first 3.5 days. Later, the cavern gas pressure becomes
much smaller, resulting in slower velocities and normal
flow.
Gas temperature in the cavern drops to Tc ¼ �5�C in
two days before slowly warming. At this point, gas tem-
perature at the wellhead is Twh ¼ �40�C: Cavern tem-
perature reaches a minimum when the energy change
rate generated by gas expansion exactly balances the
heat-flux rate from the rock mass, as predicted by Equa-
tion (6). At the blowout climax, heat flux from the rock
mass is approximately 50 MW.
The “end” of the blowout is a difficult notion to
define. It can be seen in Figure 3, however, that, during
day 5, the gas-flow velocity rapidly decreases and is
almost nill after 5.8 days. However, thermal equilibrium
between cavern gas and rock mass is not reached, and
the cavern gas slowly warms, resulting in a gas outflow
of approximately uc ’ uwh � 1 m/s; the pressure differ-
ence between the cavern and ground level is no longer
the driving force for gas flow. As was mentioned before,
the actual validity of the mathematical solution at the
end of the blowout is arguable, as water vapor condensa-
tion, for instance, may play a significant role. Note also
that, at the end of the blowout, gas temperature increase
is fast: gas density is small (pressure is atmospheric) and
gas volumetric heat capacity is much smaller than it was
before the blowout. For this reason, as explained in
Section 1.3, significant temperature changes are not
Figure 2
Moss Bluff blowout. From a) Rittenhour and Heath (2012); b) Cavern#1 profile, from Brouard Consulting and RESPEC (2013).
1258 Oil & Gas Science and Technology – Rev. IFP Energies nouvelles, Vol. 69xx (2014), No. 7

given time enough to penetrate deep into the rock mass.
Significant tensile stresses are observed in a thin ‘‘skin’’
at cavern wall and deep fractures cannot develop
(Brouard Consulting and RESPEC, 2013).
5 THE KANOPOLIS BLOWOUT
Compressed Air Energy Storage (CAES) is experienc-
ing a rise in interest, as it can be used as buffer energy
storage in support of intermittent sources of renewable
energy, such as wind mills. We discuss here an air
blowout that occurred in an abandoned mine that pre-
sents some similarities with the case of a blowout in an
air storage cavern and provide some validation of the
model. Obviously, in sharp contrast with natural gas
or hydrogen, air cannot burn or explode, and less
severe consequences must be expected from an air
blowout.
Van Sambeek (2009) gave a complete account of a
remarkable accident in an abandoned salt mine, and
provided a comprehensive and convincing explanation
of that event. “On October 26, 2000, a brick factory in
Kanopolis, Kansas, was substantially destroyed by
bricks, sand, and water falling from the sky. The jet of
air blew from a previously sealed salt mine shaft and
through a pile of bricks next to the brick factory”
(p. 620; Fig. 4). Bricks and sand were blown into the
air more than 100 m “for longer than 5 minutes but less
than 20 minutes” (p. 621). The hypothesis analyzed by
Van Sambeek was that “groundwater had entered the
mine through the shafts over a long time and compressed
the air within the mine” until the shaft plug collapsed in
October 2000 and air escaped from the mine.
0 1 2 3 4 5 6 7
Time (day) 0 1 2 3 4 5 6 7
Time (day)
0 1 2 3 4 5 6 7Time (day)
0 1 2 3 4 5 6 7
Time (day)
Choked flow Normal flow Choked flow Normal flow
Choked flow Normal flowChoked flow
Normal flow
0
100
200
300
400
500M
etha
ne v
eloc
ity (
m/s
)
Met
hane
tem
pera
ture
(° C
)H
eat f
lux
at c
aver
n w
all (
MW
)
uc
uwh
Pc
Pwh
Tc
Twh
60
40
20
0
-20
-40
0
10
20
30
40
50
60
0
2
4
6
8
10
12
14
16
Met
hane
pre
ssur
e (M
Pa)
Figure 3
Computed evolutions of gas velocity, gas temperature, gas pressure and heat flux from the cavern wall as a function of time during the
Moss Bluff blowout.
H. Djizanne et al. / Blowout in Gas Storage Caverns 1259

The Kanopolis Mine is not a salt cavern and, in the
context of a blowout, several differences are noted. The
cross-sectional area of the access well (a mine shaft) is lar-
ger than the cross-sectional area of a cavern borehole by
twoorders ofmagnitude,making blowout durationmuch
shorter (10 or so minutes instead of several days).
The shaft, lined with wood timber, had a length of
H ¼ 240 m; and its inside dimensions were about
3:6 m� 5:2 m. An equivalent circular cross-section,
S ¼ 18:72 m2, and a friction coefficient, F ¼ 0:225=m,
were selected, (this value was selected to match observed
data, as Colebrook’s equation hardly applies to gas flow
in an old wood-lined mine shaft). For air, c ¼ 1:4. VanSambeek (2009) suggests that the compressed-air (abso-
lute) pressure might have been P0c ¼ 0:272 MPa
(0.172 MPa relative) and that the air volume in the mine
was V 0 ¼ 670 000 m3. We assume that the initial air tem-
perature was T0c ¼ 15�C (288 K).
It might have been expected that the drop in the
mine’s air temperature would be much more severe
than in a conventional gas-storage cavern, as heat pro-
vided by the rock mass seems not to be given enough
time to warm the air in the mine. In fact, heat was pro-
vided by the mine roof and by the dry surface of the
pillars, whose overall surface is approximately
Rc ¼ 1 000 000 m2: (No attempt was made to take into
account the heat transferred from the brine that filled
the lower part of the mine rooms.) The ratio between
the wall area and the mine volume in Equation (9)
(or Rc=V 0 ¼ 1:3 mÞ is much larger in a mine than it
is in a cavern, making the heat flux from the rock mass
much faster.
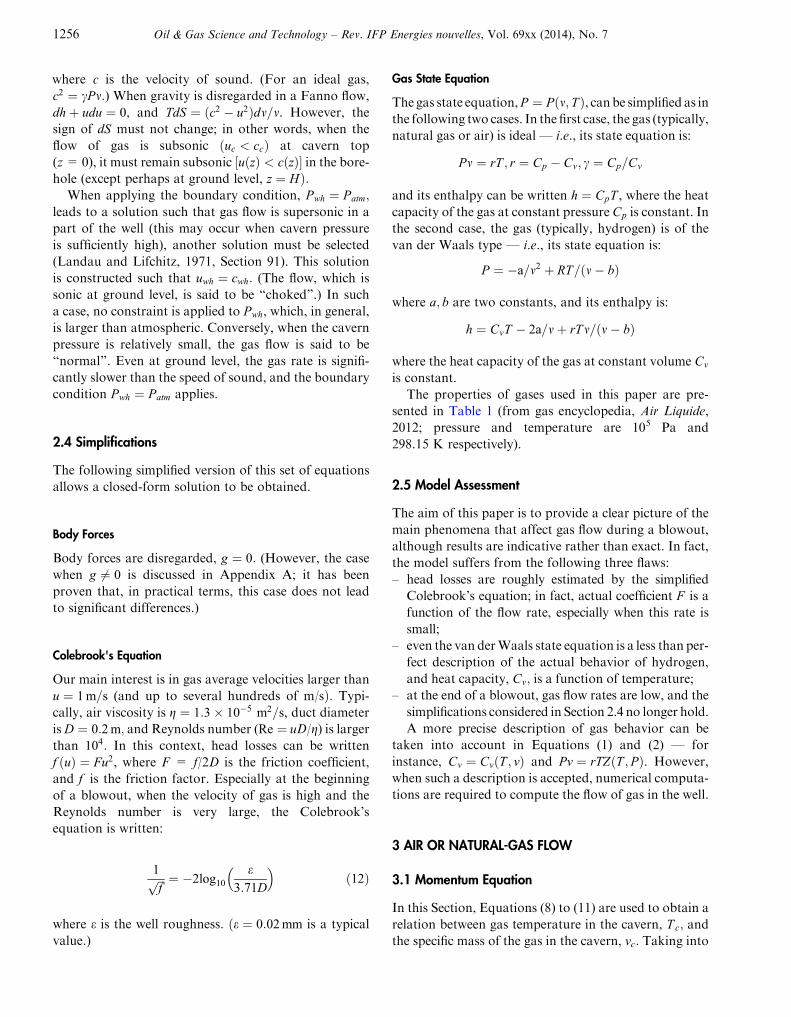
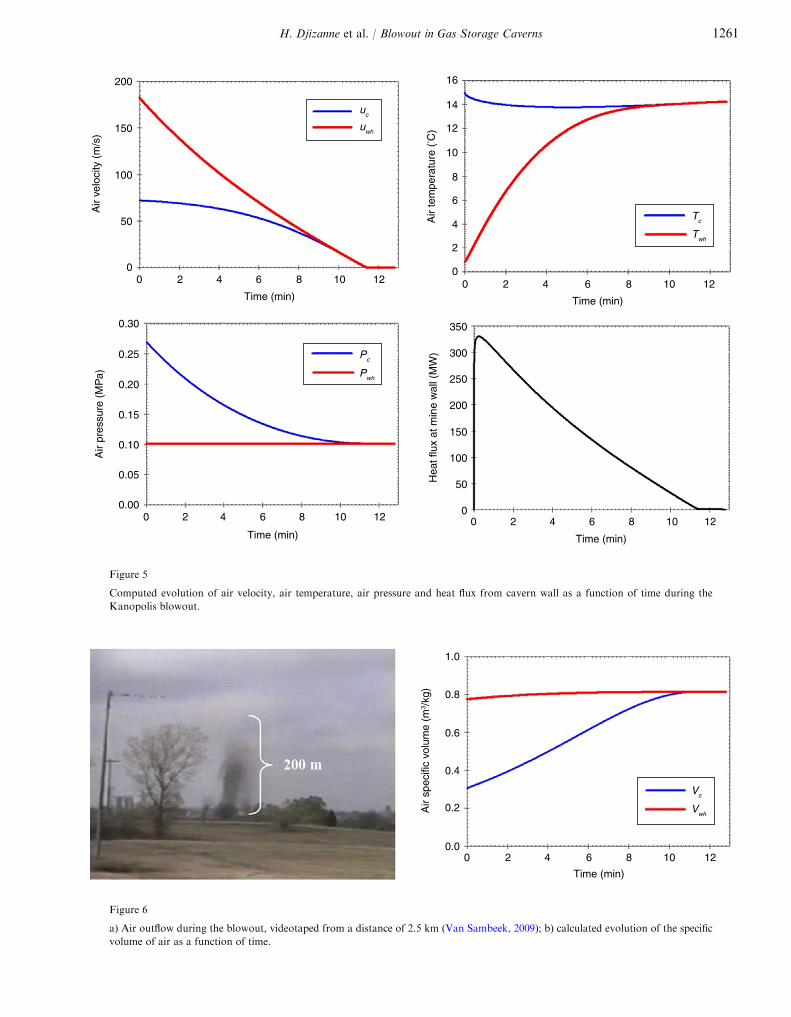
Results are provided in Figure 5. The flow is normal
(not choked). At ground level, air speed decreases from
180 m/s (650 km/h) to a few m/s in 11 minutes. This
result is consistent with what was reported by Van
Sambeek (2009) who proved that an air-stream speed
of 180 m/s generates a drag force that is able to propel
bricks perhaps as high as 100 m (Fig. 6). Figure 5 also
displays air pressure and temperature during the blow-
out. Air temperature at ground level drops first to 1�Cbefore increasing to 14�C at the end of the blowout.
Air temperature in the mine does not experience changes
larger than 1�C. Note (Fig. 5) that the heat flux from
the rock mass reaches 330 MW after a few dozens of
seconds.
6 HYDROGEN BLOWOUT
Salt caverns storing hydrogen (which have gas pressure
in the 7-21MPa range) are operated in the UK (Teesside,
Figure 4
Kanopolis brick factory after the blowout (Van Sambeek, 2009).
1260 Oil & Gas Science and Technology – Rev. IFP Energies nouvelles, Vol. 69xx (2014), No. 7
0 2 4 6 8 10 12
Time (min)
0 2 4 6 8 10 12
Time (min)0
0
50
100
150
200
250
300
350
2 4 6 8 10 12
Time (min)
Time (min)
0 2 4 6 8 10 12
uc
uwh
Tc
Twh
Pc
Pwh
0
50
100
150
200A
ir ve
loci
ty (
m/s
)
Air
tem
pera
ture
(° C
)
Air
pres
sure
(M
Pa)
0.30
0.25
0.20
0.15
0.10
0.05
0.00
0
2
4
6
8
10
12
14
16
Hea
t flu
x at
min
e w
all (
MW
)
Figure 5
Computed evolution of air velocity, air temperature, air pressure and heat flux from cavern wall as a function of time during the
Kanopolis blowout.
1.0
0.8
0.6
0.4
0.2
0.0
Air
spec
ific
volu
me
(m3 /
kg)
0 2 4 6 8 10 12
Time (min)
Vc
Vwh
Figure 6
a) Air outflow during the blowout, videotaped from a distance of 2.5 km (Van Sambeek, 2009); b) calculated evolution of the specific
volume of air as a function of time.
H. Djizanne et al. / Blowout in Gas Storage Caverns 1261

three 70 000-m3 caverns at a 370-m depth) and in Texas
(Clemens Dome, Mont Belvieu, Moss Bluff). Hydrogen
storage raises interesting problems, as its state equation
and thermo-dynamic potentials differ significantly from
those of an ideal gas.
6.1 Blowout from a Generic Hydrogen Storage
A discussion of a blowout from a generic hydrogen stor-
age cavern is provided here. In this discussion, the cavern
is cylindrical, with a volumeV0=1 000 000m3, an overall
surface Rc=60 000 m2, a casing-shoe depth H ¼ 370 m,
and tubing diameter D ¼ 7”: A friction factor f ¼ 0:01was selected, and the initial cavern pressure and tempera-
ture were P0c ¼ 4:5 MPa and T0
c ¼ 35 �C; respectively.
The thermodynamic behavior of hydrogen exhibits some
specific features of interest (in particular, an isenthalpic
depressurization leads to hydrogen warming); so, instead
of the standard state equation of an ideal gas, a van der
Waals state equation was selected to describe the gas
behavior (Appendix B).
Main results are provided in Figure 7. The blowout is
approximately 9 days long. The flow is choked during
the first 4 days and is normal during the second half of
the blowout.Gas velocities are high, as the speed of sound
in hydrogen c � 1200m=sð Þ is much faster than in air or
natural gas (c2 � crT ; r ¼ Cp � Cv, and hydrogen heat
capacities are large; Tab. 1). The same argument (large
heat capacity) explains why the temperature drop in the
cavern (the temperature plummets to 20�C) is not verylarge (Eq. 13). However, the temperature drop in the
Choked flow Normal flow
Choked flow
Choked flow
Normal flow
Normal flow
Choked flow
Normal flow
uc
uwh
Tc
Twh
Pc
Pwh
0
2
4
6
8
10
12
14
16
Hea
t flu
x at
cav
ern
wal
l (M
W)
Time (day) Time (day)
Time (day) Time (day)
0 2 4 6 8 10
00
1
2
3
4
5
2 4 6 8 10 0 2 4 6 8 10
0
-20
0
20
40
2 4 6 8 100
200
400
600
800
1 000
1 200
1 400H
ydro
gen
velo
city
(m
/s)
Hyd
roge
n te
mpe
ratu
re (
° C)
Hyd
roge
n pr
essu
re (
MP
a)
Figure 7
Computed evolution of hydrogen velocity, hydrogen temperature, hydrogen pressure and heat flux from the cavern as a function of time
during a blowout.
1262 Oil & Gas Science and Technology – Rev. IFP Energies nouvelles, Vol. 69xx (2014), No. 7

well is not very different from what it is during a natural
gas blowout, as the value:
Tc � Twh ¼ u2=2Cp
� �whc
� crTc=2Cp � c� 1ð ÞTc=2c
is not very different from one gas to another. No hydro-
gen warming in the well was observed.
The same computations were performed when assum-
ing that hydrogen is an ideal gas (instead of a van der
Waals gas). Only tiny differences were observed; how-
ever, this conclusion may be wrong in some cases, as
explained in the next section.
6.2 Joule-Thomson Effect
It can be observed in Figure 7 that, except at the end of
the blowout, the wellhead temperature Twhð Þ is much
colder than the cavern temperature Tcð Þ: the tempera-
ture of hydrogen decreases when it travels from the cav-
ern top to the ground surface. However, it is known that
when a real gas (as differentiated from an ideal gas)
expands through a throttling device (the so-called
Joule-Thomson expansion), its enthalpy remains con-
stant, and gas temperature may either decrease or
increase. Gases have a Joule-Thomson inversion temper-
ature above which the gas temperature increases during
an isenthalpic expansion. For hydrogen, this inversion
temperature is �71�C (much lower than the tempera-
tures considered here).
However, the expansion of a gas during a blowout is
not a Joule-Thomson expansion, as kinetic energy
cannot be neglected (Eq. 9). It is expected that hydrogen
temperature increases during its expansion when kinetic
energy can be neglected — i.e., when head losses are
large.
An example of a hydrogen blowout involving gas-
temperature increase is presented in Figure 8. Parame-
ters are the same as presented in Section 6.1 except for
the friction factor, which is f ¼ 97:3 instead of
f ¼ 0:01. (Head losses are larger by a factor of 10 000.)
The celerity of gas flow in the well is much smaller (it
is divided by a factor of 10) than in the example
described in Section 6.1, and the cavern is emptied in
one year or so (“blowout” is somewhat of a misnomer).
The hydrogen temperature is slightly warmer at ground
level than it is in the cavern, an effect that is not captured
when the state equation of gas is ideal. It can be con-
cluded that, when realistic blowout scenarios are consid-
ered, the Joule-Thomson effect plays a minor role.
CONCLUSIONS
A simplified solution was proposed to compute the
evolution of gas pressures, temperatures and velocities
during a blowout in a gas storage cavern. It was shown
that, in general, the flow is choked when gas pressure
in the cavern is high and is normal when the cavern pres-
sure is low. Results must be considered as indicative
rather than exact, as simple gas state equations and
thermodynamic potentials were selected. Validation of
the model is difficult: for obvious practical reasons,
few parameters can be measured accurately during a
0
-100
-200
-300
0
-100
-200
-300
34.0 34.5 35.0 35.5 36.0 34.0 34.5 35.0 35.5 36.0
Temperature (°C) Temperature (°C)
Dep
th (
m)
Dep
th (
m)
f = 0.012f = 0.097
f = 0.972
f = 97.29
f = 0.012f = 0.097
f = 0.972
f = 97.29
Figure 8
Temperature distribution in the well: when head losses are extremely large, hydrogen temperature increases in the well a), an effect that is
not captured when the state equation of gas is ideal b).
H. Djizanne et al. / Blowout in Gas Storage Caverns 1263

blowout. However, the thermodynamic model of the
cavern is able to explain correctly the evolution of cavern
gas temperature during a (controlled) gas withdrawal;
duration of the Moss Bluff blowout can be back-
calculated correctly; and the computed air velocities
are compatible with the ballistic flight of bricks observed
during the Kanopolis blowout, as was proved by Van
Sambeek (2009). It is believed that this model provides
a good basis for computation of the thermomechanical
behavior of cavern walls during a blowout, a concern
of special significance for two reasons: it is important,
before a blowout, to establish a credible scenario (gas
rate, duration) and, after a blowout, to assess if the cav-
erns can be operated again.
ACKNOWLEDGMENTS
The authors thank Ron Benefield and his colleagues
from Spectra Energy Transmission, and the Solution
Mining Research Institute (SMRI), which granted per-
mission that some results of the Moss Bluff Cavern#1
analysis performed for the SMRI (Research Report
2013-01) be published in this paper. They also are
indebted to Leo van Sambeek, who provided them with
additional comments on his remarkable analysis of the
Kanopolis accident. Special thanks to Kathy Sikora.
This study was funded partially by the French Agence
Nationale de la Recherche (ANR) in the framework of
the SACRE Project devoted to adiabatic CAES design.
This project includes researchers from EDF, GEO-
STOCK, PROMES (Perpignan), HEI (Lille) and Ecole
Polytechnique ParisTech (Palaiseau).
REFERENCES
Air liquide (2012) Gas Encyclopedia, <http://encyclopedia.air-liquide.com>.
Alberta Energy and Utilities Board (2002) BP Canada EnergyCompany: Ethane Cavern well fires, Fort Saskatchewan,Alberta, Aug./Sept. 2001, EUB post incident report.
Berest P., Brouard B. (2003) Safety of salt caverns used forunderground storage, Oil & Gas Science and Technology –Rev. IFP 58, 3, 361-384.
Berest P., Djizanne H., Brouard B., Hevin G. (2012) Rapid De-pressurizations: can they lead to irreversible damage? Proc.SMRI Spring Technical Conference, Regina, Canada,24-23 April, 63-86.
Berest P., Djizanne H., Brouard B., Frangi A. (2013) A Simpli-fied Solution For Gas Flow During a Blow-out in an H2 or AirStorage Cavern, Proc. SMRI Spring Technical Conference,Lafayette, Louisiana, 23-23 April, 86-94.
Brouard Consulting and RESPEC (2013) Analysis of CavernMB#1 Moss Bluff Blowout data, Research Report 2013-01,Solution Mining Research Institute, 197 pages.
Crotogino F., Mohmeyer K.U., Scharf R. (2001) HuntorfCAES: More than 20 Years of Successful Operation, Proc.SMRI Spring Technical Conference, Orlando, Florida,15-18April, 351-362.
Crossley N.G. (1996) Salt cavern Integrity Evaluation UsingDownhole Probes. A Transgas Perspective, Proc. SMRI FallMeeting, Cleveland, Ohio, 21-54.
Krieter M. (2011) Influence of gas cavern’s surface area onthermodynamic behavior and operation, Proc. SMRI FallTechnical Conference, York, UK, 179-184.
Landau L., Lifchitz E. (1971) Mecanique des Fluides. EditionsMIR. (in French).
Ma L., Liu X., Xu H., Yang S., Wang Z. (2011) Stability anal-ysis of salt rock gas storage cavern under uncontrolled blow-out, Rock and Soil Mechanics 32, 9, 2791-2798 (in Chinese).
Rittenhour T.P., Heath S.A. (2012) Moss Bluff Cavern 1 Blow-out, Proc. SMRI Fall Technical Conference, Bremen, Germany,119-130.
Van Sambeek L. (2009) Natural compressed air storage: acatastrophe at a Kansas salt mine, Proc. 9th Int. Symp. on Salt,Beijing, Zuoliang Sha ed., Vol. 1, 621-632.
Von Vogel P., Marx C. (1985) Berechnung von Blowoutratenin Erdgassonden, Erdoel-Erdgas, 101.Jg, Heft 10, Oktober1985, 311-316 (in German).
Manuscript accepted in November 2013
Published online in May 2014
Copyright � 2014 IFP Energies nouvelles
Permission to make digital or hard copies of part or all of this work for personal or classroom use is granted without fee provided that copies are notmade or distributed for profit or commercial advantage and that copies bear this notice and the full citation on the first page. Copyrights forcomponents of this work owned by others than IFP Energies nouvelles must be honored. Abstracting with credit is permitted. To copy otherwise,to republish, to post on servers, or to redistribute to lists, requires prior specific permission and/or a fee: request permission from InformationMission, IFP Energies nouvelles, [email protected].
1264 Oil & Gas Science and Technology – Rev. IFP Energies nouvelles, Vol. 69xx (2014), No. 7

Appendix A – Gravity Forces
From Equations (9) and (10) in the main text, it is seen that gravity forces may play a significant role when gH is not
much smaller than u2=2½ �whc : Because gH typically is 10 000 m2/s2, gravity forces must be taken into account when
uwh � 100 m=s— i.e., when the flow is normal. When gravity forces are taken into account ðg 6¼ 0Þ;the following equa-tions apply (instead of Eq. 13, 14 and 15).
CPT þ _l2m2=2þ gz ¼ CPTc þ _l2m2c=2 ðA1Þ
P ¼ Pc þ c� 1
2c_l2mc
� �mcm� c� 1
2c_l2mþ 2gz
v
� �ðA2Þ
rTc þ c� 1
2c_l2m2c
� �1
m� cþ 1
2c_l2v� c� 1
cgz
v¼
g
cþ F _l2v2
� �dz
dm
ðA3Þ
The solution of the differential equation (A3) can be written as:
F _l2H ¼ v1�cwh
g
cF _l2þ v2wh
� �c� 12
Z vwh
vc
rTc þ c� 1
2c_l2m2c
� �1w� cþ 1
2c_l2w
w1�c g
cF _l2þ w2
� �cþ 12
dw
ðA4Þ
Pwh ¼ rTc þ c� 1
2c_l2m2c
� �1
vwh� c� 1
2c_l2mwh þ 2gH
vwh
� �ðA5Þ
Equations (A4) and (A5) allow to compute vwh, _l2 etc. Main results are provided in Figure A1 (g=10 m/s2), which
must be compared to the corresponding results provided in Figure 5 (g = 0 m/s2) in the main text. Differences are
0.30
0.25
0.20
0.15
0.10
0.05
0.00
Air
pres
sure
(M
Pa)
Air
tem
pera
ture
(° C
)
0 2 4 6 8 10 12
Time (min)0 2 4 6 8 10 12
Time (min)
Tc
Twh
Pc
Pwh
-2
0
2
4
6
8
10
12
14
16
Figure A1
Kanopolis blowout (g = 10 m/s2): computed evolutions of a) air pressure and b) air temperature as a function of time.
H. Djizanne et al. / Blowout in Gas Storage Caverns 1265

exceedingly small, except at the end of the blowout, as static pressure and temperature distributions in the well are
modified by gravity forces. Equations (A1) and (A2) prove that, when thermodynamic equilibrium is reached,
Twh = T1�(gH/Cp) = 12.6�C (instead of: Twh ¼ T1 ¼ 15�CÞ and that Pc ¼ PwhðT1=TwhÞc�1c ¼ 1:003 Pwh (instead
of: Pc ¼ Pwh ¼ PatmÞ. This solution is partly artificial, as it results from various assumptions that are not fully consis-
tent. (Well walls are adiabatic; cavern walls are not.)
Appendix B – Hydrogen Flow
It is known that hydrogen exhibits special behavioral characteristics — in particular, during depressurization such
that hydrogen enthalpy is constant (for instance, when hydrogen leaks from a pressurized vessel through a pinhole),
the temperature of hydrogen “increases”. (For most gases in similar circumstances, the temperature decreases). For
this reason, instead of the ideal gas equation, the more precise van der Waals equation is used:
P ¼ � a
m2þ rT
m� bðB1Þ
where a and b are constants. It can be assumed that the temperature is above the critical temperature, Tcr ¼ 33:2 K(which means that (B1) allows computation of v when P and T are known). The internal energy and enthalpy of
hydrogen are:
e T ; mð Þ ¼ CvT � am
h T ; mð Þ ¼ eþ Pm ¼ CvT � 2am þ rTm
m� b
(ðB2Þ
The same method as used for air can be used here: energy equation allows computation of pressure and tempera-
ture. Let �Cp ¼ Cv þ r (for a van der Waals gas, �Cp is not the heat capacity at constant pressure, Cp) and �c ¼ �Cp=Cv:
T ¼ �c� 1ð Þ m� bð Þhc þ 1
2_l2m2c þ
2am� 12_l2m2
r m�c� bð Þ ðB3Þ
P ¼ � a
m2þ �c� 1ð Þ
hc þ 12_l2m2c þ
2am� 12_l2m2
�cm� bðB4Þ
When one sets:
w m; _lð Þ ¼ �c
b2hc þ 1
2_l2m2c þ
2a�cb
� �b
�cm� bð Þ þ Logm�c� b
m
� �� �
it can be inferred that:
� 2a
3m3þ �c� 1ð Þ � a
bm2þ w m; _lð Þ � 1
2�c_l2Log m�c� bð Þ � _l2m
2 �cm� bð Þ
þ _l2Log mð Þ ¼ �F _l2dz
dvðB5Þ
Instead of Equations (16, 17) and (19) when g ¼ 0, we now have:
� 2a
3m3þ �c� 1ð Þ � a
bm2þ w m; _lð Þ � 1
2�c_l2Log m�c� bð Þ � _l2m
2 �cm� bð Þ
þ _l2Log mð Þ ¼ �FH _l2 mwh
mc
ðB6Þ
Pwh ¼ � a
m2whþ �c� 1ð Þ
hc þ 12_l2m2c þ
2amwh
� 12_l2m2wh
�cmwh � bðB7Þ
1266 Oil & Gas Science and Technology – Rev. IFP Energies nouvelles, Vol. 69xx (2014), No. 7

c2 � u2 ¼ � 2a
mþ m2
m� bð Þ�c �c� 1ð Þhc þ 1
2_l2m2c þ 2a
m � 12_l2m2
m�c� b� _l2m2 > 0 ðB8Þ
Here, again, when inequality (B8) is met (normal flow), Equations (B6) and (B7) allow elimination of _l2 and com-
putation of mwh. When inequality (B8) is not met (choked flow), Equation (B6) together with the condition
c2wh � u2wh ¼ 0; as given in (B9):
� 2a
m3whþ�c �c� 1ð Þ hc þ 2a
mwh
� �mwh � bð Þ mwh�c� bð Þ ¼ _l2 1þ �c �c� 1ð Þ m2wh � m2c
� �2 mwh � bð Þ mwh�c� bð Þ
ðB9Þ
allow for computation of mwh This is shown in Figure B1.
An example is provided here. Hydrogen properties are provided in Table 1 in the main text. In Figure B1a, cavern
temperature and pressure are Tc ¼ 313:15 K and Pc ¼ 0:5 MPa, respectively, resulting in an inlet hydrogen specific
volume mc ¼ 2:6 m3=kg. The well is 1000-m deep, the well diameter is 0.5 m and the friction factor is f ¼ 0:01:Equations (B6, B7) and (B9) allow three curves to be drawn: _l2FH ¼ _l2FH vwhð Þ; _l2atm ¼ _l2atm vwhð Þ and _l2son ¼ _l2son vwhð Þ;respectively. The grey zone is the supersonic zone, in which cwh < uwh (not acceptable). The intersection of the curves
described by Equations (B6) and (B7), obtained when the specific volume at the exit is mwh ¼ 11:4m3/kg, can be accep-
ted, as it lays outside the supersonic zone: the flow is normal.
In Figure B1b, cavern temperature and pressure are Tc ¼ 313:15 K and Pc ¼ 13 MPa, respectively, resulting in an
inlet gas specific volume mc ¼ 0:10 m3/kg. Here, again, FH ¼ 10: The intersection of the curves representing (B6) and
(B7) belongs to the gray supersonic zone and does not provide an acceptable solution: the flow cannot be normal. The
flow is choked, and the specific volume at the exit, mwh ¼ 0:55m3/kg, is given by the intersection of the curves described
by (B6) and (B9): _l2FH ¼ _l2FH vwhð Þ and _l2son ¼ _l2son vwhð Þ: Note that, at this intersection, the curve _l2FH ¼ _l2FH vwhð Þ rea-ches a maximum, as mwh � cwh ¼ 0:
2.0×10⁴ 1.0×10⁷
0.8×10⁷
0.6×10⁷
0.4×10⁷
0.2×10⁷
0
1.6×10⁴
1.2×10⁴
0.8×10⁴
0.4×10⁴
0
2
μ atm2
μ son2
μ FH2
(kg2 / s2 .m4) μ 2 (kg2 / s2 .m4)
0 5 10 15 20vcvc
vwh (m3 / kg) vwh (m
3 / kg)0 0.5 1.51.0 2.0
a) b)
⋅
⋅μ⋅
⋅
⋅
μ atm2
μ son2
μ FH2
⋅
⋅
⋅
Figure B1
Determination of the specific volume of hydrogen at the exit, vwh, in the case of a) normal flow and b) choked flow.
H. Djizanne et al. / Blowout in Gas Storage Caverns 1267


![Light oil-gas two-phase ow pattern identi cation in di erent pipe …scientiairanica.sharif.edu/article_4303_0cff1721257000f... · 2019-12-09 · Baker [8], Mandhane et al. [1], and](https://static.fdocuments.fr/doc/165x107/5e902494f1ca7c050c35ffb6/light-oil-gas-two-phase-ow-pattern-identi-cation-in-di-erent-pipe-2019-12-09-baker.jpg)