BLOOD CLEARANCE AND TISSUE DISTRIBUTION OF PEGYLATED …
32
BLOOD CLEARANCE AND TISSUE DISTRIBUTION OF PEGYLATED AND NON-PEGYLATED GOLD NANORODS AFTER INTRAVENOUS ADMINISTRATION IN RATS Daniëlle P.K. Lankveld 1 , Raja G. Rayavarapu 2 , Petra Krystek 3 , Agnes G. Oomen 4 , Hennie W. Verharen 1 , Ton G. van Leeuwen 2 , Wim H. De Jong 1# , Srirang Manohar 2 1 Laboratory for Health Protection Research, National Institute for Public Health and the Environment (RIVM), PO Box 1, 3720 BA, Bilthoven, The Netherlands. Tel: ++31 30 274 91111, Fax: ++31 30 274 4446 E-mail: [email protected], [email protected], [email protected] 2 Biophysical Engineering Group, Institute for Biomedical Technology (BMTI), Faculty of Science and Technology, University of Twente, P.O. Box 217, 7500 AE Enschede, The Netherlands. Tel: ++31 53 489 3160, Fax: ++31 53 489 3157, E-mail: [email protected], [email protected], [email protected] 3 MiPlaza Material Analysis, Philips Research, High Tech Campus 11, 5656 AE Eindhoven, The Netherlands. Tel: ++31 40 274 1721, Fax: ++31 40 274 3075, E-mail: [email protected] 4 Centre for Substances and Integrated Risk Assessment, National Institute for Public Health and the Environment (RIVM), PO Box 1, 3720 BA, Bilthoven, The Netherlands. Tel: ++31 30 274 91111, Fax: ++31 30 274 4475, E-mail: [email protected] # Corresponding author at. Laboratory for Health Protection Research, National Institute for Public Health and the Environment (RIVM), PO Box 1, 3720 BA, Bilthoven, The Netherlands. Tel: ++31 30 274 2311, Fax: ++31 30 274 4446, E-mail: [email protected]
Transcript of BLOOD CLEARANCE AND TISSUE DISTRIBUTION OF PEGYLATED …
BLOOD CLEARANCE AND TISSUE DISTRIBUTION OF PEGYLATED AND NON-PEGYLATED GOLD NANORODS AFTER INTRAVENOUS ADMINISTRATION IN RATS Daniëlle P.K. Lankveld1, Raja G. Rayavarapu2, Petra Krystek3, Agnes G. Oomen4, Hennie W. Verharen1, Ton G. van Leeuwen2, Wim H. De Jong1#, Srirang Manohar2 1 Laboratory for Health Protection Research, National Institute for Public Health and the Environment (RIVM), PO Box 1, 3720 BA, Bilthoven, The Netherlands. Tel: ++31 30 274 91111, Fax: ++31 30 274 4446 E-mail: [email protected], [email protected], [email protected] 2 Biophysical Engineering Group, Institute for Biomedical Technology (BMTI), Faculty of Science and Technology, University of Twente, P.O. Box 217, 7500 AE Enschede, The Netherlands. Tel: ++31 53 489 3160, Fax: ++31 53 489 3157, E-mail: [email protected], [email protected], [email protected] 3 MiPlaza Material Analysis, Philips Research, High Tech Campus 11, 5656 AE Eindhoven, The Netherlands. Tel: ++31 40 274 1721, Fax: ++31 40 274 3075, E-mail: [email protected] 4 Centre for Substances and Integrated Risk Assessment, National Institute for Public Health and the Environment (RIVM), PO Box 1, 3720 BA, Bilthoven, The Netherlands. Tel: ++31 30 274 91111, Fax: ++31 30 274 4475, E-mail: [email protected] #Corresponding author at. Laboratory for Health Protection Research, National Institute for Public Health and the Environment (RIVM), PO Box 1, 3720 BA, Bilthoven, The Netherlands. Tel: ++31 30 274 2311, Fax: ++31 30 274 4446, E-mail: [email protected]
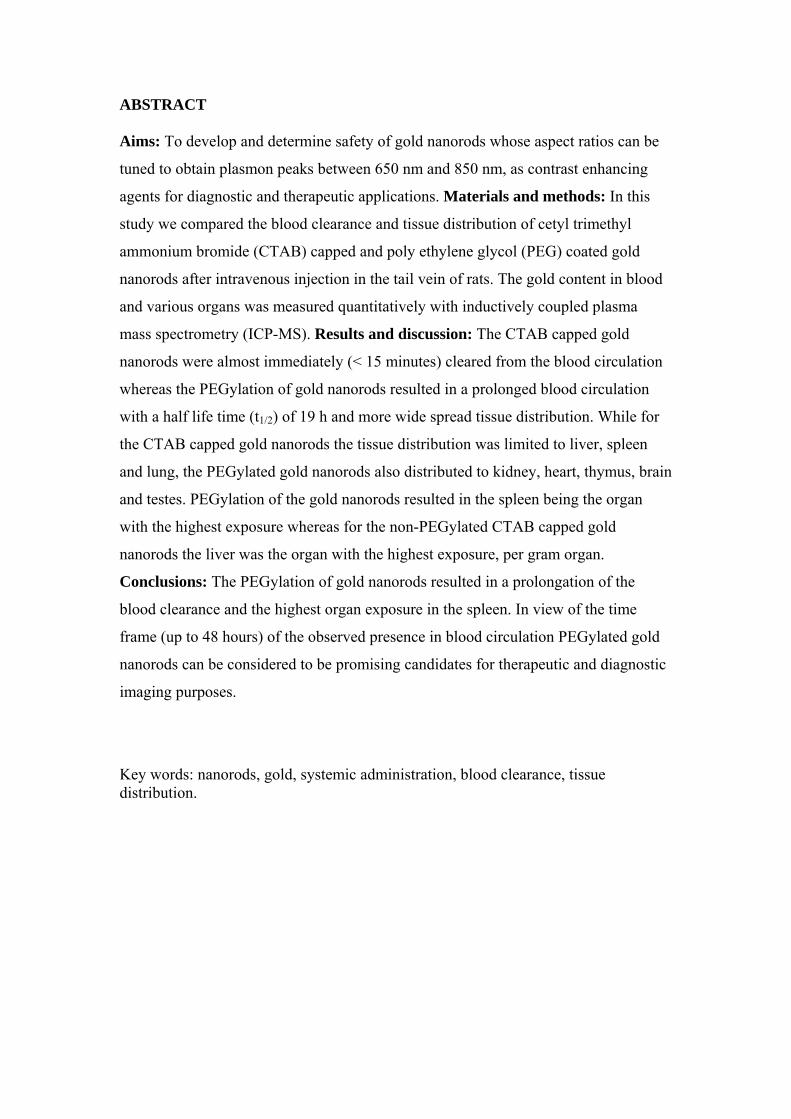
ABSTRACT Aims: To develop and determine safety of gold nanorods whose aspect ratios can be
tuned to obtain plasmon peaks between 650 nm and 850 nm, as contrast enhancing
agents for diagnostic and therapeutic applications. Materials and methods: In this
study we compared the blood clearance and tissue distribution of cetyl trimethyl
ammonium bromide (CTAB) capped and poly ethylene glycol (PEG) coated gold
nanorods after intravenous injection in the tail vein of rats. The gold content in blood
and various organs was measured quantitatively with inductively coupled plasma
mass spectrometry (ICP-MS). Results and discussion: The CTAB capped gold
nanorods were almost immediately (< 15 minutes) cleared from the blood circulation
whereas the PEGylation of gold nanorods resulted in a prolonged blood circulation
with a half life time (t1/2) of 19 h and more wide spread tissue distribution. While for
the CTAB capped gold nanorods the tissue distribution was limited to liver, spleen
and lung, the PEGylated gold nanorods also distributed to kidney, heart, thymus, brain
and testes. PEGylation of the gold nanorods resulted in the spleen being the organ
with the highest exposure whereas for the non-PEGylated CTAB capped gold
nanorods the liver was the organ with the highest exposure, per gram organ.
Conclusions: The PEGylation of gold nanorods resulted in a prolongation of the
blood clearance and the highest organ exposure in the spleen. In view of the time
frame (up to 48 hours) of the observed presence in blood circulation PEGylated gold
nanorods can be considered to be promising candidates for therapeutic and diagnostic
imaging purposes.
Key words: nanorods, gold, systemic administration, blood clearance, tissue distribution.
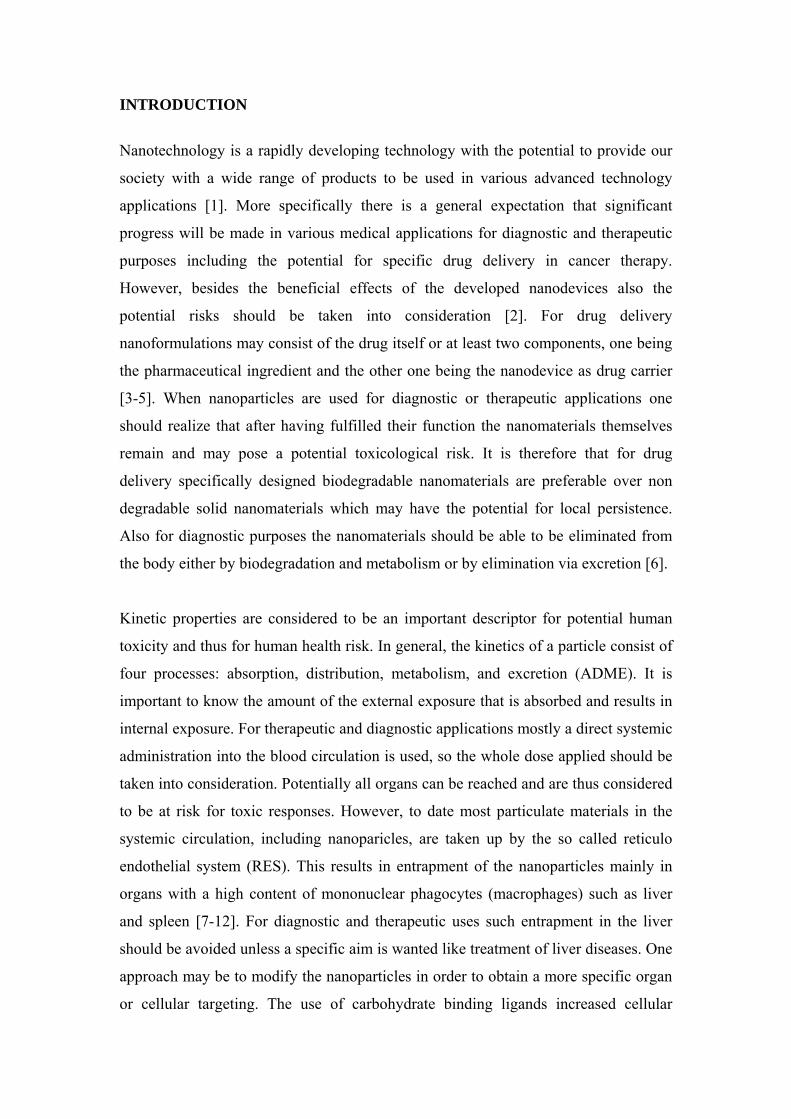
INTRODUCTION
Nanotechnology is a rapidly developing technology with the potential to provide our
society with a wide range of products to be used in various advanced technology
applications [1]. More specifically there is a general expectation that significant
progress will be made in various medical applications for diagnostic and therapeutic
purposes including the potential for specific drug delivery in cancer therapy.
However, besides the beneficial effects of the developed nanodevices also the
potential risks should be taken into consideration [2]. For drug delivery
nanoformulations may consist of the drug itself or at least two components, one being
the pharmaceutical ingredient and the other one being the nanodevice as drug carrier
[3-5]. When nanoparticles are used for diagnostic or therapeutic applications one
should realize that after having fulfilled their function the nanomaterials themselves
remain and may pose a potential toxicological risk. It is therefore that for drug
delivery specifically designed biodegradable nanomaterials are preferable over non
degradable solid nanomaterials which may have the potential for local persistence.
Also for diagnostic purposes the nanomaterials should be able to be eliminated from
the body either by biodegradation and metabolism or by elimination via excretion [6].
Kinetic properties are considered to be an important descriptor for potential human
toxicity and thus for human health risk. In general, the kinetics of a particle consist of
four processes: absorption, distribution, metabolism, and excretion (ADME). It is
important to know the amount of the external exposure that is absorbed and results in
internal exposure. For therapeutic and diagnostic applications mostly a direct systemic
administration into the blood circulation is used, so the whole dose applied should be
taken into consideration. Potentially all organs can be reached and are thus considered
to be at risk for toxic responses. However, to date most particulate materials in the
systemic circulation, including nanoparicles, are taken up by the so called reticulo
endothelial system (RES). This results in entrapment of the nanoparticles mainly in
organs with a high content of mononuclear phagocytes (macrophages) such as liver
and spleen [7-12]. For diagnostic and therapeutic uses such entrapment in the liver
should be avoided unless a specific aim is wanted like treatment of liver diseases. One
approach may be to modify the nanoparticles in order to obtain a more specific organ
or cellular targeting. The use of carbohydrate binding ligands increased cellular

binding of poly(D,L-lactic-co-glycolide)acid (PLGA) nanospheres [13], whereas the
use of specific antibodies enabled a more specific immunologically directed targeting
of the nanoparticles [14, 15]. Cellular entrapment in macrophages can be avoided by
surface modification of the nanoparticles. Coupling of polyethylene glycol (PEG)
onto the surface of nanoparticles was found to increase their circulation time in the
blood by inhibiting recognition and phagocytosis by macrophages [16, 17, 18]. Using
PEGylation of gold nanorods an increase of gold, as measured by inductively coupled
plasma - mass spectrometry (ICP-MS), in both spleen and tumor tissue was observed
[17, 19] while the level in the liver was remarkably reduced [17]. In addition, the size
of nanoparticles can be a significant determinant of particle distribution, as shown for
spherical gold nanoparticles and gold composite nanodevices [7, 20, 21].
For diagnostic purposes optical imaging is currently under development for detecting,
diagnosing, staging, and treatment monitoring of disease. Progression of disease is
usually accompanied by changes in physiology and pathology that are manifested as
location specific changes in optical properties thereby providing contrast for optical
imaging to study disease. Imaging techniques use contrast enhancing agents of which
gold nanoparticles have emerged due to their unusual optical properties and inherent
biocompatibility [22-24].
Gold metal nanoparticles exhibit narrow and intense absorption and scattering bands
due to the phenomenon of plasmon resonance, the collective oscillation that the
conduction electrons experience in an electromagnetic field of the appropriate
wavelength [25]. The plasmon resonant condition of gold nanoparticles depends upon
their size, shape, structure (solid or hollow), and upon the refractive index of the
embedding medium. Spherical gold nanoparticles have a single plasmon resonant
extinction peak at around 520 nm, which does not shift extensively with changes in
size and refractive index of the surrounding medium. Due to strong scattering and
absorption by hemoglobin, at this wavelength, light penetration in tissue is poor and
gold nanospheres are not useful in contrast enhancement for deep tissue imaging.
Rod-shaped nanoparticles exhibit two plasmon resonances due to oscillation of the
conduction electrons along the short axis as well as along the long axis of the
particles. Thus by tailoring the length and/or width of these particles, their extinction
peaks may be made to cover the low-energy visible to infrared wavelength regions [1,
23]. Further, gold-protein chemistry is well developed and several bioconjugation
protocols are available in the literature, which allows the combination of the targeting
functionality of antibodies with such gold nanoparticles. The inertness and
biocompatibility of gold in general hold promise for the use of gold nanoparticles for
in vivo imaging applications.
The aim of the present study was to determine the influence of PEGylation of gold
nanorods on the blood clearance and tissue distribution and potential organ
accumulation in the rat. In this study, we used gold nanorods (AuNR) absorbing in the
near infrared region (NIR) of the spectrum (peak absorbing wavelength of ~770 nm).
The PEGylated and non-PEGylated AuNR were intraveneously injected into rats and
gold content in various organs was determined by ICP-MS.
MATERIALS, ANIMALS, and METHODS Materials
We used hexadecyltrimethylammonium bromide (CTAB, product Acros 22716V) for
both growth and seed solutions. Gold salt (Tetrachloroauric acid HAuCl4.3H2O,
99.99%) was purchased from Acros Organics (Belgium), sodium borohydride
(NaBH4, 99%), and ascorbic acid (99%) from Aldrich (The Netherlands), and silver
nitrate (AgNO3, 99.8%) from Merck (Germany), methoxy PEG thiol (5000 MW)
from Fluka (The Netherlands). Prior to use, all glassware was cleaned with
hydrofluoric acid (HF), further with aqua regia (HCl/HNO3 3:1) and rinsed
thoroughly with Milli Q water.
Synthesis of gold nanorods (AuNRs)
In the seed-mediated, surfactant and silver assisted method for the synthesis of AuNR,
gold nanospheres produced by fast reduction of gold salt are used to seed a growth
solution in the presence of a weak reductant, a facet-selective capping surfactant and
silver nitrate (AgNO3) [26]. Specifically, the gold nanospheres are produced by
reducing gold salt (tetrachloroauric acid) using sodium borohydride in the presence of
surfactant CTAB. The growth solution comprises tetrachloroauric acid, AgNO3, with
ascorbic acid as weak reducing agent and CTAB as the capping agent. Reduction of
gold on the gold seed takes place, but because CTAB assisted by silver passivates
certain facets of the seed particles, gold deposition occurs preferentially on the
exposed tips to yield rod-shaped particles.[26, 27]. The AuNR which are synthesized
by this technique are thus stabilized with a bilayer of CTAB which imparts the
particle with a net positive charge and helps maintain colloidal stability due to
electrostatic repulsion.
We provide here a short description of the steps involved in the protocol, but more
details may be found in [1, 26].
Preparation of growth solution.: To freshly prepared 0.5 ml of 0.01 M gold salt
solution, 9.5 ml of 0.1 M CTAB solution was added with thorough mixing to yield a
dark yellow solution. To this 60 µl of 0.006M silver nitrate was added. Further 55 µl
of 0.1 M ascorbic acid was added with stirring. The resultant turned colorless. Ten
identical growth solutions were prepared to have a final volume of 100 ml suspension
of nanorods.
Preparation of gold seed: To freshly prepared 0.25 ml of 0.01 M gold salt solution,
9.75 ml of 0.1 M CTAB was added with stirring. Ice-cold, freshly prepared 0.01 M
sodium borohydride solution in a volume of 0.6 ml was added to the mixture all at
once with stirring for 2 minutes. The resultant seed solution showed a light-brownish
color and was added within about 5 minutes to the growth solution.
Growth phase: The seed solution (12 µl) was added to the growth solutions with
gentle stirring. The resultants were maintained undisturbed at 25 oC for 24 hours after
which they were centrifuged twice at 10,000 g/20 minutes and the supernatants
removed. The precipitates were re-dispersed in phosphate buffered saline (PBS).
PEGylation of AuNRs
In vitro cell studies [28-30] have demonstrated that AuNRs carrying CTAB are
potentially toxic due to the presence of the surfactant. Incubation of the particles with
mPEG-thiol can cause strong sulfur binding of the polymer’s thiol terminal to the gold
surface thereby completely or almost completely displacing the CTAB layer. We refer
to the resulting particles as PEG-AuNR, while the as-prepared particles are designated
as CTAB-AuNR due to the presence of the surfactant bilayer.
Details of the PEGylation are described here: The AuNRs were washed twice at
10,000g/20 minutes, to rid the dispersion of excess unbound CTAB. The supernatant
was discarded and to the pellet of AuRNs, containing approximately 1x10¹¹, 0.5 ml
of 5mM mPEG-SH was added along with 0.5 ml of PBS, giving a PEG:AuNR ratio of
approximately 1.5x10⁶:1. The AuNRs were then vortexed for 30 seconds and later
were kept overnight on stirring. The AuNR were centrifuged once to remove excess
of PEG thiol and the pellet was dispersed in PBS. No aggregation of the PEG-AuNR
was observed. The PEGylation of gold nanorods results in stability of the particles in
PBS solutions in contrast to CTAB coated gold nanorods which tend to flocculate or
aggregate in PBS with time[ 18].
AuNRs characterization .
Electron microscopy of the AuNRs was performed using a Zeiss-1550 high-resolution
scanning electron microscope (HR-SEM). Particle sizes were estimated using the NI
Vision module (Labview, National Instruments) on the digital SEM images for which
approximately 250 particles were considered.
Optical spectra of nanorods were measured with collimated transmission in a
Shimadzu PC3101 UV-Vis-NIR spectrophotometer. The nanorods synthesized had
two plasmon peaks, a transverse plasmon peak at approximately 517 nm and a
longitudinal plasmon peak at 770 nm. The longitudinal plasmon peak was in the near
infrared region (NIR) of the spectrum. The concentrations of non-PEGylated and
PEGylated gold nanorods were determined by the optical spectra. The extinction
coefficient value of the longitudinal plasmon peak was taken into consideration for
calculating the number density (particles/ml). The mean length and width of gold
nanorods were measured. The mass of a single AuNR was calculated by multiplying
the density of gold with the volume of a rod. The number density was multiplied with
the mass of gold nanorods to calculate the concentration of Au in µg/ml.
Zeta potential measurements of AuNRs
Zeta potential reflects the charge present on the surface of nanoparticle. The
measurements were carried out using a Malvern Zetasizer Nano Z(S). One ml
nanorods were filled in the cuvette (DTS 1060) using a syringe avoiding any air-
bubbles. The CTAB-AuNR showed positive zeta potential due to the presence of the
positively charged CTAB bilayer on the surfaces of the gold nanorods. The
PEGylation of gold nanorods caused the displacement of CTAB with PEG and hence
the surface charge changes to neutral. The zeta potential of the original CTAB capped
gold nanorods (CTAB-AuNR) was (+ 42 ± 7.2) mV, while for the PEGylated gold
nanorods (PEG-AuNR) the zeta potential was (+0.4 ± 2.1) mV.
The results of the characterization of the gold nanorods are presented in Table 1. The
optical spectra and a HR-SEM image of the gold nanorods are presented in Figure 1.
Animals
Six-week-old male Wistar rats (HsdCpb:WU) were purchased from Harlan Nederland
BV (Horst, The Netherlands) and allowed to acclimatize for 2 weeks before starting

the experiment. Animals were bred under specific pathogen-free (SPF) conditions and
barrier maintained during the entire experiment in Macrolon cages at a room
temperature of (23 ± 1)°C, a relative humidity of (50 ± 5)% and a 12-hours light/dark
cycle. Drinking water and conventional feed were provided ad libitum. The
experiment was approved by an independent Ethical Committee on Animal
Experimentation and conducted in compliance with all applicable provisions of the
national laws, i.e. the Experiments on Animal Decree and the Experiments on Animal
Act.
Experimental design
Rats were divided in 3 groups: CTAB-AuNR (n=6), PEG-AuNR (n=6), and PBS
vehicle control (n=3). Four days prior to the start of the experiment, a single venous
blood sample (tail vein; 100 μl) was obtained from the animals in the control group.
On day 0, rats were intravenously injected (tail vein) with either 1 ml nanogold
dispersion or vehicle control. The injections were well tolerated and no adverse
effects were observed during the entire experiment. Starting at day 0 venous blood
samples were obtained from the treatment-groups at 0.25 (15 minutes), 0.5 (30
minutes), 1, 2, 4, 8, 24 (day 1), 48 (day 2), 96 (day 4), and 144 (day 6) hours after
injection. Blood samples from the animals in the control group were collected at day
“minus” 4 (96 hours before the start of the experiment) and at day 8 (192 hours after
start of the experiment). At 24 hours (day 1) and 144 hours (day 6) after the injection,
rats (n=12, 6 per treatment group) and at 192 hours (day 8) the 3 control rats were
anaesthetized with isoflurane (Isoflu®, AST Pharma, Oudewater, The Netherlands) in
oxygen and subsequently euthanized by drawing blood from the abdominal aorta.
Next to blood, liver, spleen, kidneys, lungs, heart, thymus, brain and testes were
collected. Organs were weighed and homogenized. All samples were stored at -20°C
for determination of the gold content. After subjecting the sample material to a
digestion process, the gold content was determined by inductively coupled plasma
mass spectrometry (ICP-MS).
Sample pre-treatment and inductively coupled plasma- mass spectrometry (ICP-
MS)

Reagents : All chemicals used for ICP-MS were of analytical grade or of high purity.
Nitric acid (HNO3) and hydrochloric acid (HCl) were purchased from Merck,
Darmstadt, Germany. The calibration standard solution of gold (Au), as well as a
solution of the element rhodium (Rh) used as internal standard, were prepared using
single element stock solutions with a concentration of 1,000 µg/ml from Inorganic
Ventures, supplied by Instrument Solutions, Nieuwegein, The Netherlands. Deionised
water (H2O) with 17.2 MΩcm was produced by a system from Christ, Zoeterwoude,
The Netherlands.
Instrumentation: A drying cabinet, from Heraeus, type T6060 (supplied by Thermo,
Breda, The Netherlands) was used. For the digestion of the sample materials, a Stuart
block heater SBH200D (supplied by Omnilabo, Breda, The Netherlands) was used.
The presence of gold was measured with an inductively coupled plasma mass
spectrometer (ICP-MS, type ELAN DRC Plus, Perkin Elmer, Groningen, The
Netherlands).
Accuracy and quality control aspects of the analytical procedure: Next to the control
of chemical blanks, experiments were included to cover different performance
characteristics and quality control aspects. However, for gold (nanoparticles) in
biological materials there is no suitable reference material commercially available.
The matrix effects were studied by the standard addition experiments and calculation
of the recovery. These standard addition experiments were carried out by spiking
blood samples of non treated control rats with the nanoparticles (PEG-AuNR and
CTAB-AuNR) prior to sample pre-treatment and analysis. For gathering details about
inhomogeneity in the sample material, four blood samples were analysed as
independent duplicates (sub-samples A and B).
Sample preparation: To the homogenized organ samples (0.2 - 0.5 g) 0.5 ml
concentrated HNO3 was added. The samples were placed in the drying cabinet at 50oC
for 1 hour to pre-dissolve the sample material. Then, the samples were transferred into
digestion vials by adding three times 0.5 ml concentrated HCl. For blood the sample
amount was ~ 0.3 g blood, to which 2 ml aqua regia (concentrated HNO3 and
concentrated HCl (1:3)) was added. The mixture was digested overnight with a
maximum temperature of 125oC. Afterwards the mixture was transferred into another
vial, spiked with the internal standard Rh (final concentration: 100 µg/L) and H2O
was added to a total volume of 10 ml. The total solution was shortly shaken by hand.
ICP-MS measurement: The quantification was carried out by external calibration with
internal standard correction. Stock solutions were diluted with diluted (1:5) aqua regia
to relevant concentration levels. All measurements of standards and samples were
carried out with the ICP-MS system. The main instrumental operating conditions were
as follows: RF power 1450 W and nebulizer gas flow 0.91 L/min Air. The following
isotopes were measured: 197Au and 103Rh as internal standard.
RESULTS
Blood clearance
The blood clearance of the intravenously administered gold nanorods is presented in
Figures 2 and 3. The results show an almost immediate clearance of the CTAB-AuNR
gold nanorods from the circulation as at 15 minutes after the administration barely
detectable levels of gold were measured in the blood (Figure 2). For the PEG-AuNR
blood gold levels remain detectable until 48 hours after the administration (Figure 2).
Figure 3 presents a description of the blood clearance in a mathematical model.
Starting with a bi-exponential model, it immediately appeared that the concentration-
time course could well be described with a mono-exponential model:
0( ) exp( )C t C k t
Fitting this model to the data the values 0C 2100 ( 50) ng/g and k 0.036
( 0.004) -/h were found. The corresponding half life time in blood 1/ 2 ln(2) /t k is
19 hours with a 95% confidence interval of 16 to 25 hours. The starting concentration
of 2100 ng Au/g blood in rats of 300 grams containing 18 grams of blood (60 g/kg
body weight) results in a calculated administered dose of 37.8 μg.
Tissue distribution.
The gold concentrations were measured in blood, liver, lungs, spleen, brain, heart,
thymus, kidneys and testes at day 1 (t=24 hours) and at day 6 (t=144 hours) after
intravenous administration. In control rats (n=3) the gold levels were at or below the
detection limit (data not shown).
The gold content in tissues per gram organ is presented in Table 2. The results show
that the CTAB-AuNR are mainly found in the liver and spleen, and to a lesser extent
in the lung. Similar levels are observed both on day 1 and day 6 after administration.
Expressed per gram organ the highest exposure is observed in the liver, followed by
spleen and lung. For the PEG-AuNR in most organs at t=24 hours and t= 144 hours
gold could be detected with the highest levels on day 1 in spleen, blood and liver. At
day 6 clearly accumulation in all organs was observed with the highest level in the
spleen followed by the liver (Table 2).
When we consider the total levels of gold in the whole organ for the PEG-AuNR at
day 1 the highest levels are in the blood followed by liver and spleen (Table 3). In
most organs investigated gold could be detected indicating the wide spread
distribution of the PEG-AuNR in the body with the highest level per whole organ in
the liver (Table 3). Both at day 1 and day 6 for the CTAB-AuNR the highest levels
are present in the liver at similar magnitude. In addition also in the lung gold could be
clearly detected.
Table 4 and Figure 4 show the total recovery in organs when compared to the
administered dose for day 1 and day 6. The total recovery varied from approximately
70 to more than 100%. However, the recovery might be overestimated. Based on the
calculations for the blood clearance for the PEG-AuNR a starting dose of 37.8 μg was
calculated. The dose administered according to Table 1 based on optical density
calculations indicate a concentration per ml and thus dose per animal of 25 μg. ICP-
MS measurement of the PEG-AuNR showed a concentration of 34.5 μg which was
more in line with the figure calculated from the blood concentrations (data not
shown).
DISCUSSION
We investigated the blood clearance and tissue distribution of two types of gold
nanorods, CTAB capped AuNR and PEGylated AuNR, specifically designed as
potential probes for light based imaging techniques [1]. The main finding was the
remarkable contrast in blood clearance between the two types: CTAB-AuNR were
almost directly removed from the blood circulation, whereas for the PEG-AuNR a
blood half time value of 19 hours was observed.
It has been demonstrated with several types of nanoparticles [31] including gold
nanoparticles [32, 33], that when incubated with blood, the particles’ surfaces become
coated with numerous proteins including immunoglobulins which can enhance
recognition and uptake by cells of the reticuloendothelial system (RES). We contend
that in our in vivo case with CTAB-AuNR, there is the immediate formation of a
serum protein ‘corona’ [34-36] comprising opsonin ligands, which initiates the
mechanisms of recognition and internalization by components of the RES. This
causes rapid clearance of the CTAB-AuNR from blood with deposition into organs of
the RES.
When CTAB-AuNR are incubated with mPEG-thiol, strong sulphur binding to the
gold surface causes replacement of the CTAB bilayer [30, 37] as seen in the near-
neutral zeta-potential values (Table. 1). The PEG layer also stabilizes the NRs against
aggregation with a steric hindrance mechanism as seen in the retention of the
characteristic plasmon peaks after PEGylation (Figure 1). The hydrophilic and neutral
PEG coating on AuNRs prevents or minimizes adsorption of serum proteins [36, 38-
40], and also prevents the close approach of the underlying AuNR to cell surfaces
[38]. The effect of the PEG coating is then a reduced interaction of the nanocomposite
with macrophage cell receptors: PEG-AuNRs thus experience prolonged blood
persistence.
This result is in general agreement with recent studies using AuNRs [16-18], while
there are major differences in the studies. Firstly, Niidome et al. [16], Akiyama et al.
[17], and Von Maltzahn et al.[18] used mice for the experiments. Secondly, while the
PEG lengths used in the studies was the same, the density of the PEG layer on the
particles is expected to be different. We used polymer in great excess during
PEGylation with PEG:AuNR ratios of approximately 1.5x10⁶:1, to ensure a complete
coverage of the gold surfaces. Von Maltzahn et al. [18] actually measured a value
around 20,000 per particle, while it appears that Niidome and co-workers [16, 17]
used low PEG:AuNR ratios. With these differences, the blood circulation half-life is a
parameter which is difficult to compare across these studies. In any case, while we
measured 70% of the PEGylated particle dose in the blood 24 hours after injection,
Niidome et al. [16] found only 8% and Akiyama et al. [17] found between 20% to
40% at the same time point, while von Maltzahn et al. [18] measured 50% of the
injected dose after 20 hours with a circulation half-life time of 17 h comparable with
19 h from this work.
Although for diagnostic use the clearance of imaging contrast agents has to be
reasonably fast, the very rapid blood clearance as seen for the CTAB-AuNR greatly
diminishes its potential applications considering as well that these particles have been
shown to be toxic in in vitro studies [28-30]. In this respect the PEG-AuNR show
promise as they remain in circulation for some time. The half time of 19 hours allows
the nanorods to reach all organs in the body thus widening the possible use as imaging
agent.
In addition to the dramatic differences in blood clearance kinetics between the two
types of particles, the final organ distribution of the particles was also significantly
different. CTAB-AuNR were taken up predominantly by the liver, and to a lesser
extent by the spleen followed by the lungs. When expressed as dose per gram organ
the highest exposure for CTAB-AuNR was observed in the liver, 1.8 times greater
than in the spleen on the 6th day. (Table 2). On the other hand, the PEG-coating of the
PEG-AuNR served to shift the distribution profile more towards the spleen with at
day 6 a dose per gram organ 6.8 times in excess of that in the liver. This effect on
tissue distribution and internal organ dose is especially relevant for the potential
toxicity of the used nanomaterials.
As discussed earlier, the CTAB-AuNRs attract a protein corona due largely to their
positive charge and and are thus opsonized or tagged for uptake by hepatosplenic
macrophages in general, but in particular by the Kupffer cells in the liver [34-36]. The
sequestration of the particles into the liver and spleen is rapid, and occurs within
minutes. On the other hand PEGylation of nanoparticles causes a reduced uptake by
the Kupffer cells and a promotion of uptake in splenic macrophages. The precise
mechanism which directs PEG-AuNR towards clearance by the spleen [41] after a
long blood residence time is not clear, but this general trend has been observed now
for a few decades for a myriad of nanoparticle types [36, 38-40].
Besides the liver and spleen other organs with detectable gold levels were kidney,
lung, heart, and to a lesser extent thymus, brain and testes. In the brain the content
dropped below the detection level at day 6 after administration. However, we have to
realise that low levels expressed as mass or as percentage of the injected dose still
may be a considerable amount of nanoparticles. When we look at the 0.19% of the
injected dose present in the brain at day 1 after injection, this translates to a number of
approximately 2x10⁸ PEG-AuNR based on the data presented in Table 1. When local
accumulation in organs would occur this low fraction of the injected dose still may be
the cause for a delayed toxic response. The elimination of gold nanoparticles from the
liver was reported to be rather slow with a reduction in gold liver content of about 9%
at six months after administration [42]. The percentage recovery of the injected dose
was for the PEG-AuNR for other organs than liver and spleen below 2% at day 1
which decreased further below 1% at day 6, indicating the possible elimination of the
gold nanorods. In liver and spleen there was a considerable increase in gold content
when comparing the gold level at day 6 with day 1.
At autopsy as much blood as possible was collected to maximize removal of residual
blood from the organs. The amount of gold in residual blood is included in the
measured tissue concentrations. This should be especially considered for the PEG-
AuNR as these remain in circulation for a prolonged time. Hence, tissue levels could
have been overestimated. However, an organ with a high-blood content like the spleen
shows at day 1 a higher gold concentration than blood, suggesting that residual blood
could have had only a minor effect on the amount of gold measured. On the other
hand, the concentrations found in the other organs (liver, kidney, lung, heart, thymus,
brain, and testes) were below the concentration in blood. Therefore, contribution of
residual blood cannot be ruled out for these organs. For the measurements of the
CTAB-AuNR and the day 6 measurements blood levels are too low to have an effect
on the tissue measurements. The day 6 measurements clearly show the difference in
tissue distribution between the PEG-AuNR and CTAB-AuNR with the PEGylated
gold nanorods showing a more widespread tissue distribution. The total recovery at
day 6 was relatively low for the PEG-AuNR in contrast to the CTAB-AuNR (Table
4). This difference might be explained by possible sequestration of the PEG-AuNR in
tissues and animal carcass not collected and measured with ICP-MS for their gold
content. The high recovery for the CTAB-AuNR can be explained by the almost
immediate disappearance of the CTAB-AuNR from the blood and sequestration in the
liver. As the liver content remained similar between days 1 and 6 this can explain the
high recovery levels for CTAB-AuNR.
The distribution of the gold nanorods in blood and tissue was determined by
measuring the gold content of tissue samples by ICP-MS, a method commonly used
for the determination of the tissue levels of gold nanoparticles [7, 17, 24, 29] and
other metal nanoparticles in biological systems [43]. Other methods used for
following the fate of gold nanoparticles are neutron activation either before use [19]
so the radionucleide Au197 or Au198 is administered, or afterwards in the tissue
samples by instrumental neutron activation analysis (INAA) [18]. Although the
method of neutron activation allows the determination of the gold nanoparticles
themselves when the activation of the nanogold preparation is done before the
administration to the animals, it also requires specific infrastructures that are not
easily available. For INAA the same applies as for ICP-MS that the total gold content
is determined and not specifically the gold nanoparticles. For ICP-MS measurement
sample preparation (digestion) is needed with e.g. the possibility of loss of the sample
due to the used procedure. Determination of the tissue distribution of injected
materials is also possible with the use of a radioactive label, which, depending on the
label, can be used with a more limited processing method that may limit loss of test
sample. For more complex composed nanoparticles there is, however, the possibility
for losing the label, as was previously demonstrated for technetium labeled carbon
particles used for studying lung passage of inhaled ultrafine particles [45-47]. As the
degradation of the gold seems unlikely the determination of the gold content in organs
by ICP-MS is a good measure for the tissue distribution of gold nanomaterials such as
gold nanoparticles and nanorods.
CONCLUSIONS
We demonstrated that the coating of gold nanorods with PEG had a significant effect
on both the blood clearance and tissue distribution of the gold nanorods. PEGylation
of gold nanorods resulted in a prolonged blood circulation with a half life time of 19
hours and more wide spread tissue distribution. PEGylation of the gold nanorods
resulted in the spleen being the organ with the highest exposure whereas for the non-
PEGylated CTAB capped gold nanorods the liver was the organ with the highest
exposure. In view of the time frame (up to 48 h) of the observed increase in blood
circulation PEGylated gold nanorods can be considered to be promising candidates for
diagnostic imaging purposes.
EXECUTIVE SUMMARY
PEGylation of gold nanorods prolongs blood circulation time when compared to CTAB capped gold nanorods.
The prolonged circulation time allows for the use of PEGylated gold nanorods as diagnostic imaging agents.
PEGylation of the gold nanorods resulted in the spleen to be the organ with the highest exposure in contrast to the liver.
The increase of spleen exposure by PEGylated nanoparticles needs further investigation in view of possible immunotoxic effects
ACKNOWLEDGEMENTS This work was funded through the thrust area program NIMTIK of the MIRA Institute (formerly BMTI) of University of Twente; through the PRESMITT project (IPD067771) of the SenterNovem program IOP Photonic Devices; and by the Nederlandse Wetenschappelijk Organisatie (NWO) and Stichting Technische Wetenschappen (STW) through project TTF 6527. Ron Vlug, Hans Strootman, Liset de la Fonteyne, Nick van Oyen (RIVM), and Amanda Troost - De Jong and Jeannette Smulders (MiPlaza) are acknowledged for their excellent technical support during the study. Jan Van Eijkeren (RIVM) is acknowledged for the mathematical modelling of the data. Wilma Petersen (MIRA-UT) is acknowledged for technical help.

REFERENCES 1. Rayavarapu RG, Petersen W, Ungureanu C, Post JN, Van Leeuwen TG, Manohar S: Synthesis and Bioconjugation of Gold Nanoparticles as Potential Molecular Probes for Light-Based Imaging Techniques. Int J Biomed Imaging Article ID 29817 (2007). 2 De Jong WH, Borm PJA: Drug delivery and nanoparticles: Applications and hazards. Int J Nanomedicine 3, 133-149 (2008)
Review with focus on toxicological evaluation of nanoparticles for drug delivery 3 Duncan R: The dawning era of polymer therapeutics. Nat Rev Drug Disc 2, 347-360 (2003). 4 Ferrari M: Cancer nanotechnology: opportunities and challenges. Nat Rev Cancer 5, 161-171 (2005).
Comprehensive overview of possibilities for use of nanomaterials for cancer treatment
5 Li S-D, Huang L: Pharmacokinetics and biodistribution of nanoparticles. Mol Pharmac 5, 496-504 (2008). 6 Alexis F, Pridgen E, Molnar LK, Farokhzad OC: Factors affecting the clearance and biodistribution of polymeric nanoparticles. Mol Pharmac 5, 505-515 (2008).
Review dealing with factors affecting blood clearance of nanoparticles 7 De Jong WH, Hagens WI, Krystek P, Burger MC, Sips AJAM, Geertsma RE: Particle size dependent organ distribution of gold nanoparticles after intravenous administration. Biomaterials 29, 1912-1919 (2008). 8 Demoy M, Gibaud S, Andreux JP, Weingarten C, Gouritin B, Couvreur P: Splenic trapping of nanoparticles: complementary approaches for in situ studies. Pharm Res 14, 463-468 (1997). 9 Gibaud S, Demoy M, Andreux JP, Weingarten C, Gouritin B, Couvreur P: Cells involved in the capture of nanoparticles in hematopoietic organs. J Pharm Sci 85, 944-950 (1996). 10 Lenaerts V, Nagelkerke JF, Van Berkel TJ et al.: In vivo uptake of polyisobutyl cyanoacrylate nanopartuicles by rat liver Kupffer, endothelial, and parenchyma cells. J Pharm Sci 73, 980-982 (1984). 11 Moghimi SM, Hunter AC, Murray JC: Long circulating and target specific nanoparticles: theory and practice Pharmacol Rev 53, 283-318 (2001). 12 Sadauskas E, Wallin H, Stoltenberg M et al.: Kupffer cells are central in the removal of nanoparticles from the organism. Part Fibre Toxicol 4, 10 (2007).
Study clearly demonstrating localization of nanoparticles in Kupffer cells of liver. 13 Weissenbrock A, Wirth M, Gabor F: WGA grafted PLGA-nanospheres: preparation and association with Caco-2 cells. J Contr Release 99, 383-392 (2004). 14 Nobs L, Buchegger F, Gurny R, Allémann E: Poly(lactic acid) nanoparticles labeled with biologically active NeutravidinTM for active targeting. Eur J Pharm Biopharm 58, 483-490 (2004).
15 Prinzen L, Miserus R, Dirksen A et al.:, Optical and magnetic resonance imaging of cell death and platelet activation using annexin A5-functionalized quantum dots. Nano Lett 7, 93-100 (2007). 16 Niidome T, Yamagata M, Okamoto Y et al.:, PEG-modified gold nanorods with a stealth character for in vivo application. J Control Release 114, 343- 347 (2006). 17 Akiyama Y, Mori T, Katayama Y, Niidome T: The effects of PEG grafting level and injection dose on gold nanorod biodistribution in the tumor bearing mice. J Contr Release 139, 81-84 (2009). 18 Von Maltzahn G, Park J-H, Agrawal A et al.:, Computationally guided photothermal tumor tehrapy using long-circulating gold nanorod antennas. Cancer Res 69, 3892-3900 (2009). 19 Eghtedari M, Liopo AV, Copland JA, Oraevsky AA, Motamedi M: Engineering of hetero-functional gold nanorods for the in vivo molecular targeting of breast cancer cells. NanoLetters 9, 287-291 (2009). 20 Balogh L, Nigavekar SS, Nair BM et al.:, Significant effect of size on the in vivo biodistribution of gold composite nanodevices in mouse tumor models. Nanomedicine: Nanotechnol, Biol, and Medicine 3, 281-296 (2007). 21 Semmler-Behnke M, Kreyling WG, Lipka J et al.:,. Biodistribution of 1.4- and 18-nm gold particles in rats. Small 4, 2108-2111 (2008). 22 Lin AWH, Lewinski NA, West JL, Halas NJ, Drezek RA: Optically tunable nanoparticle contrast agents for early cancer detection: model-based analysis of gold nanoshells. J Biomed Optics 10, Article ID 064035 (2005). 23 Perez-Juste J, Pastoriza-Santos I, Liz-Marzan L, Mulvaney P: Gold Nanorods: Synthesis, Characterization and Applications. Coord Chem Rev 249, 1870–1901 (2005). 24 Sokolov K, Follen M, Aaron J et al.:, Real-time vital optical imaging of precancer using anti-epidermal growth factor receptor antibodies conjugated to gold nanoparticles. Cancer Res 63, 1999–2004 (2003). 25 Stuart DA, Haes AJ, Yonzon CR, Hicks EM, Van Duyne RP: Biological applications of localised surface plasmonic phenomenae. IEE Proc Nanobiotechnol 152, 13–32 (2005). 26 Nikoobakht B, El-Sayed MA: Preparation and growth mechanism of gold nanorods (NRs) using seed-mediated growth method. Chemistry of Materials 15, 1957-1962. (2003). 27 Liu M, Guyot-Sionnest P: Mechanism of silver(I)-assisted growth of gold nanorods and bipyramids. J Physic Chem B 109, 22192-22200 (2005) 28 Takahashi H, Niidome Y, Niidome T, Kaneko K, Kawasaki H, Yamada S: Modification of gold nanorods using phosphatidylcholine to reduce cytotoxicity. Langmuir 22, 2-5 (2006). 29 Alkilany AM, Nagaria PK, Hexel CR, Shaw TJ, Murphy CJ, Wyatt MD: Cellular uptake and cytotoxicity of gold nanorods: Molecular origin of cytotoxicity and surface effects. Small 5, 701-708 (2009). 30 Rayavarapu RG, Petersen W, Hartsuiker L et al.: In vitro toxicity studies of polymer-coated gold nanorods. Nanotechnology 21, No. 145101. (2010)
31 Aggarwal P, Hall JB, McLeland CB, Dobrovolskaia MA, McNeil SE: Nanoparticle interaction with plasma proteins as it relates to particle biodistribution, biocompatibility and therapeutic efficacy. Adv Drug Del Rev 61, 428-437 (2009).
Review on nanoparticle protein interaction. 32 Dobrovolskaia MA, Patri AK, Zheng J et al.: Interaction of colloidal gold nanoparticles with human blood: effects on particle size and analysis of plasma protein binding profiles. Nanomedicine: Nanotechnology, Biology, and Medicine 5, 106-117 (2009). 33 De Paoli Lacerda SH, Park JJ, Meuse C et al.: Interaction of gold nanoparticles with common human blood proteins. ACS Nano 4, 365-379 (2010). 34 Lynch I, Cedervall T, Lundqvist M, Cabaleiro-Lago C, Linse S, Dawson KA : The nanoparticle-protein complex as a biological entity; a complex fluids and surface science challenge for the 21st century. Adv Colloid Interface Sci 134-135, 167-174. (2007). 35 Lynch I, Dawson KA: Protein-nanoparticle interactions. Nano Today 3, 40-47 (2008). 36 Nel AE, Mädler L, Velegol D et al.: Xia T, Hoek EMV, Somasundaran P, Klaessig F, Castranova V, Thompson M. Understanding biophysicochemical interactions at the nano-bio interface. Nature Materials 8, 543-557 (2009). 37 Liao H, Hafner JH: Gold nanorod bioconjugates. Chemistry of Materials 17, 4636-4641 (2005). 38 Storm G, Belliot SO, Daemen T, Lasic DD. Surface modification of nanoparticles to oppose uptake by the mononuclear phagocyte system. Adv Drug Del Rev 17, 31-48 (1995).
Early review on possibilities to avoid uptake of nanoparticles by phagocytic cells by surface modification.
39 Gref R, Lück M, Quellec P et al.: 'Stealth' corona-core nanoparticles surface modified by polyethylene glycol (PEG): Influences of the corona (PEG chain length and surface density) and of the core composition on phagocytic uptake and plasma protein adsorption. Colloids and Surfaces B: Biointerfaces 18, 301-313 (2000). 40 Owens III DE, Peppas NA. Opsonization, biodistribution, and pharmacokinetics of polymeric nanoparticles. Int J Pharm 307, 93-102 (2006).
Review on serum protein and polymer coated nanoparticle interaction, and influence on in vivo fate of the particles.
41 Moghimi SM: Mechanisms of splenic clearance of blood cells and particles: Towards development of new splenotropic agents. Adv Drug Del Rev 17, 103-115 (1995).
Review describing the anatomy and function of the spleen as blood filter. 42 Sadauskas E, Danscher G, Stoltenberg M, Vogel U, Larsen A, Wallin H: Protrated elimination of gold nanoparticles from mouse liver. Nanomedicine: Nanotechnology, Biology, and Medicine 5, 162-169 (2009). 43 Xia T, Kovonich M, Liong M et al.: Comparison of the mechanism of toxicity of zinc oxide and cerium oxide nanoparticles based on dissolution and oxidative stress. ACSnano 2, 2121-21334 (2008).

44 Yu LE, Yung L-YL, Ong C-N et al. :. Translocation and effects of gold nanoparticles after inhalation exposure in rats. Nanotoxicol 1, 235-242, (2007). 45 Nemmar A, Hoet PH, Vanquickenborne B et al.:, Passage of inhaled particles into the blood circulation in humans. Circulation 105, 411-414 (2002).
Study showing nanoparticle translocation form lung to blood, but debated because of loss of radiolabel.
46 Kreyling WG, Semmler M, Moller W: Dosimetry and toxicology of ultrafine particles. J Aerosol Med 17,140-152 (2004). 47 Mills NL, Amin N, Robinson SD et al.;, Do inhaled carbon nanoparticles translocate directly into the circulation in humans? Am J Respir Crit Care Med 173, 426-431 (2006).

TABLES AND FIGURES Table 1 Characteristics of gold nanorods before/after poly ethylene glycol (PEG) coating Samples CTAB-AuNR PEG-AuNR ) Size given as mean (nm) 55.3 x 18.5 55.3 x 18.5 Aspect ratio 3 3 Number concentration (n/ml) 12 x 1011 9.8 x 10¹⁰ Mass concentration (µg/ml) 30.5 25 Zeta potential (mV) + 42 ± 7.2 + 0.4 ± 2.1

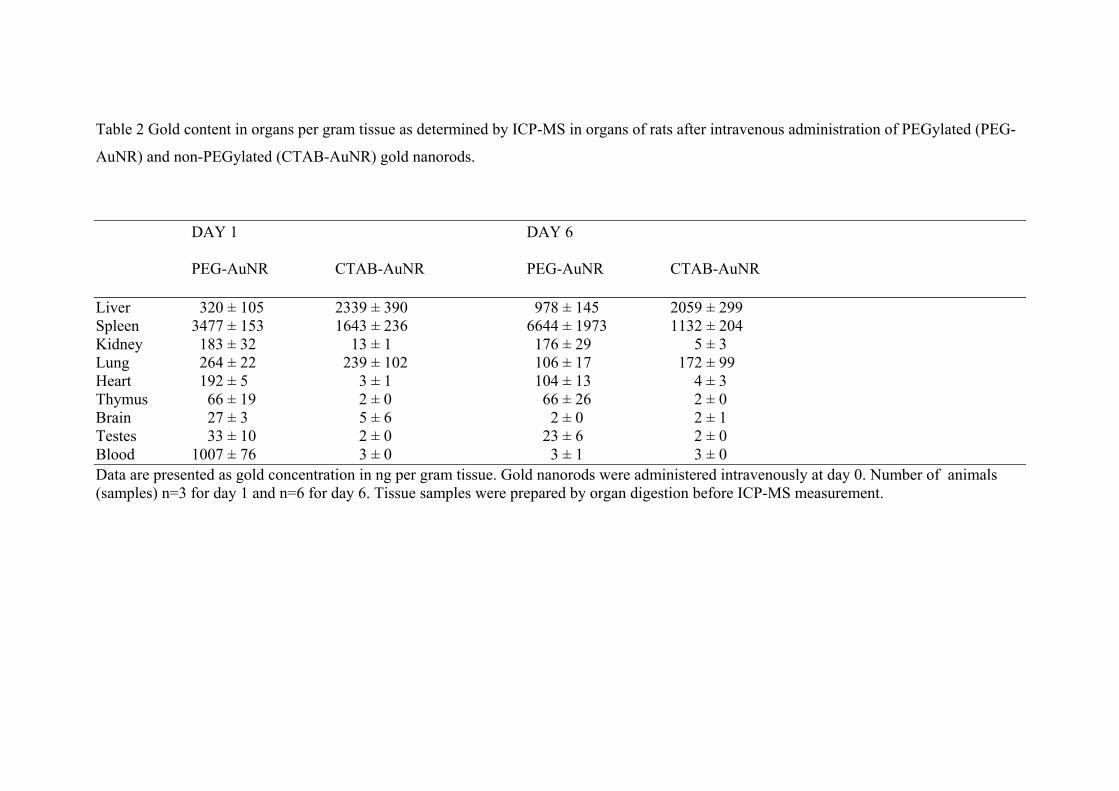
Table 2 Gold content in organs per gram tissue as determined by ICP-MS in organs of rats after intravenous administration of PEGylated (PEG-
AuNR) and non-PEGylated (CTAB-AuNR) gold nanorods.
DAY 1 DAY 6 PEG-AuNR CTAB-AuNR PEG-AuNR CTAB-AuNR Liver 320 ± 105 2339 ± 390 978 ± 145 2059 ± 299 Spleen 3477 ± 153 1643 ± 236 6644 ± 1973 1132 ± 204 Kidney 183 ± 32 13 ± 1 176 ± 29 5 ± 3 Lung 264 ± 22 239 ± 102 106 ± 17 172 ± 99 Heart 192 ± 5 3 ± 1 104 ± 13 4 ± 3 Thymus 66 ± 19 2 ± 0 66 ± 26 2 ± 0 Brain 27 ± 3 5 ± 6 2 ± 0 2 ± 1 Testes 33 ± 10 2 ± 0 23 ± 6 2 ± 0 Blood 1007 ± 76 3 ± 0 3 ± 1 3 ± 0 Data are presented as gold concentration in ng per gram tissue. Gold nanorods were administered intravenously at day 0. Number of animals (samples) n=3 for day 1 and n=6 for day 6. Tissue samples were prepared by organ digestion before ICP-MS measurement.
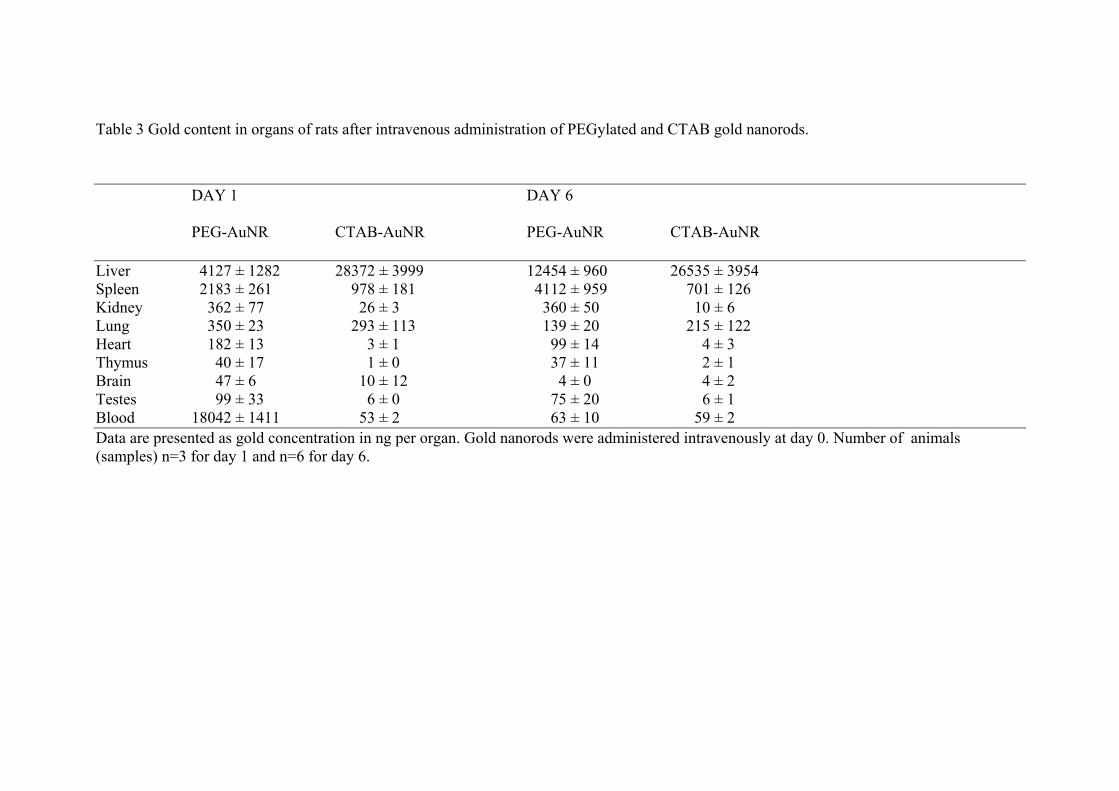
Table 3 Gold content in organs of rats after intravenous administration of PEGylated and CTAB gold nanorods.
DAY 1 DAY 6 PEG-AuNR CTAB-AuNR PEG-AuNR CTAB-AuNR Liver 4127 ± 1282 28372 ± 3999 12454 ± 960 26535 ± 3954 Spleen 2183 ± 261 978 ± 181 4112 ± 959 701 ± 126 Kidney 362 ± 77 26 ± 3 360 ± 50 10 ± 6 Lung 350 ± 23 293 ± 113 139 ± 20 215 ± 122 Heart 182 ± 13 3 ± 1 99 ± 14 4 ± 3 Thymus 40 ± 17 1 ± 0 37 ± 11 2 ± 1 Brain 47 ± 6 10 ± 12 4 ± 0 4 ± 2 Testes 99 ± 33 6 ± 0 75 ± 20 6 ± 1 Blood 18042 ± 1411 53 ± 2 63 ± 10 59 ± 2 Data are presented as gold concentration in ng per organ. Gold nanorods were administered intravenously at day 0. Number of animals (samples) n=3 for day 1 and n=6 for day 6.

Table 4 Total recovery of gold content in organs as percentage of administered dose.
PEG-AuNR CTAB-AuNR
Day 1 25.43 µg (101.7%) 29.67 (97.3%)
Day 6 17.28 µg (69.1%) 27.47 µg (90.1%)
At day 0 the gold nanorods were intravenously injected. PEG-AuNR as 25 µg per animal,
and CTAB-AuNR as 30.5 µg per animal.

Figure 1 Optical spectroscopy and SEM image of gold nanorods
Left, optical spectra of non-PEGylated (CTAB-AuNR) and PEGylated (PEG-AuNR) gold nanorods. Right, HR-SEM image of CTAB-AuNR.
400 500 600 700 800 9000.0
0.1
0.2
0.3
0.4
0.5
Ext
inct
ion
coef
ficie
nt (
mm
-1)
wavelength (nm)
Non- PEGylated AuNR PEGylated AuNR

Figure 2 Blood clearance of PEGylated (PEG-AuNR) and non-PEGylated (CTAB-AuNR) gold nanorods.
Blood clearance of PEGylated and non PEGylated Au nanorods
0
500
1000
1500
2000
2500
-96 0,25 0,5 1 2 4 8 24 48 96 144 192
Time after injection (hour)
Au
blo
od le
vel (
ng/
g)
Control
PEG-AuNR
CTAB-AuNR
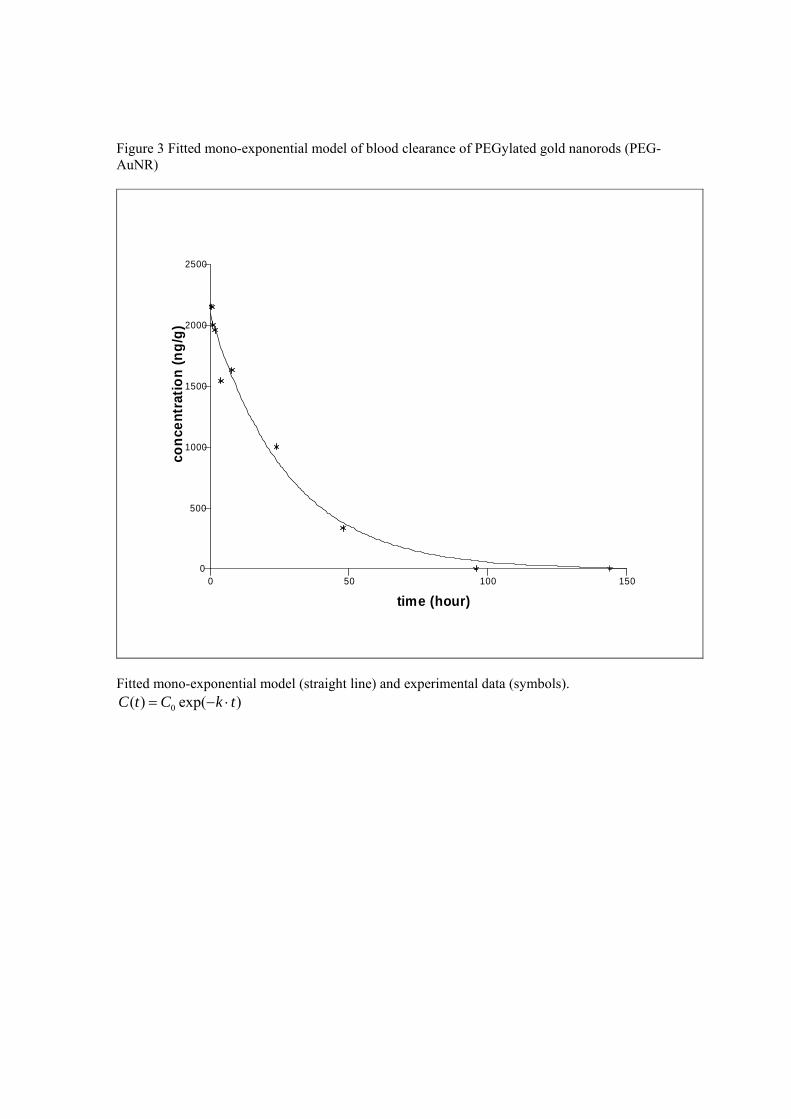
Figure 3 Fitted mono-exponential model of blood clearance of PEGylated gold nanorods (PEG-AuNR)
0 50 100 150
time (hour)
0
500
1000
1500
2000
2500
con
cen
trat
ion
(n
g/g
)
Fitted mono-exponential model (straight line) and experimental data (symbols).
0( ) exp( )C t C k t
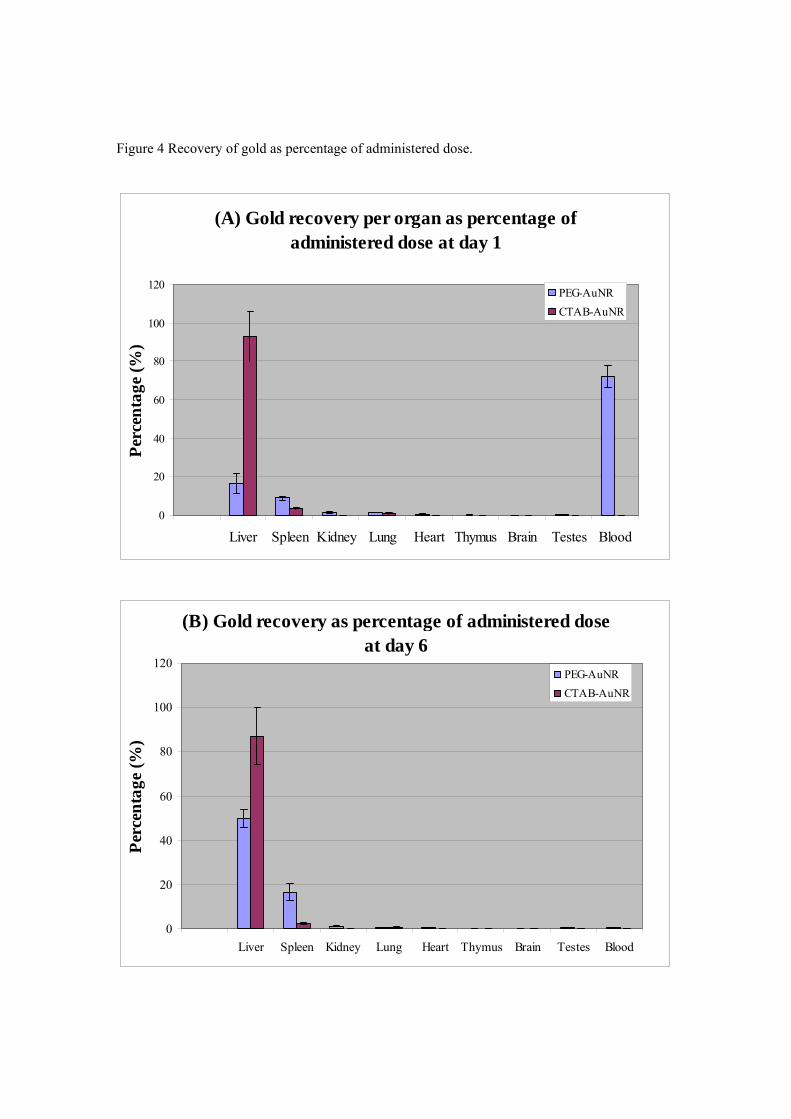
Figure 4 Recovery of gold as percentage of administered dose.
(A) Gold recovery per organ as percentage of administered dose at day 1
0
20
40
60
80
100
120
Liver Spleen Kidney Lung Heart Thymus Brain Testes Blood
Per
cen
tage
(%
)
PEG-AuNR
CTAB-AuNR
(B) Gold recovery as percentage of administered dose at day 6
0
20
40
60
80
100
120
Liver Spleen Kidney Lung Heart Thymus Brain Testes Blood
Per
cen
tage
(%
)
PEG-AuNR
CTAB-AuNR