Big-Data-Driven Materials Science and its FAIR Data ...
28
1 PERSPECTIVE SECTION of the Handbook of Materials Modeling (eds. S. Yip and W. Andreoni), Springer 2018 Big-Data-Driven Materials Science and its FAIR Data Infrastructure Claudia Draxl (1, 2) and Matthias Scheffler (2, 1) 1) IRIS Adlershof, Humboldt-Universität zu Berlin, Zum Großen Windkanal 6, 12489 Berlin, Germany Email: [email protected] 2) Fritz-Haber-Institut der Max-Planck-Gesellschaft, Faradayweg 4-6, 14195 Berlin, Germany Email: [email protected] Abstract This chapter addresses the challenges and chances of big-data driven materials science, and it describes concepts and implementation of the forth paradigm of materials research. The importance of an all-embracing sharing (open data), of an efficient data infrastructure, and of the consideration of all computer codes used in the community is emphasized: Data must be FINDABLE, ACCESSABLE INTEROPERABLE and RE-PURPOSABLE. Recent developments of methods from artificial intelligence are reviewed and demonstrated, and the chapter is concluded by a forward looking perspective addressing important not yet solved challenges. 1. Introduction Materials science is entering an era where the growth of data from experiments and computations is expanding beyond a level that can be handled by established methods. The so-called “4 V challenge” – concerning Volume (the amount of data), Variety (the heterogeneity of form and meaning of data), Velocity (the rate at which data may change or new data arrive), and Veracity (the uncertainty of data quality) is clearly becoming eminent. Most importantly, however, is that big data of materials science offer novel, extraordinary, and expansive opportunities for achieving scientific knowledge and insight. These opportunities require new research concepts and lines of thought. While this chapter focusses on computational materials science, we emphasize that the described concepts and methods are valid for experimental data as well. In most cases, the results of computational materials science studies are published as focused research studies, reporting only those few data that are directly relevant
Transcript of Big-Data-Driven Materials Science and its FAIR Data ...
1
PERSPECTIVE SECTION of the Handbook of Materials Modeling (eds. S. Yip and W.
Andreoni), Springer 2018
Big-Data-Driven Materials Science and its FAIR
Data Infrastructure
Claudia Draxl(1, 2) and Matthias Scheffler(2, 1)
1) IRIS Adlershof, Humboldt-Universität zu Berlin,
Zum Großen Windkanal 6, 12489 Berlin, Germany
Email: [email protected]
2) Fritz-Haber-Institut der Max-Planck-Gesellschaft,
Faradayweg 4-6, 14195 Berlin, Germany
Email: [email protected]
Abstract
This chapter addresses the challenges and chances of big-data driven materials
science, and it describes concepts and implementation of the forth paradigm of
materials research. The importance of an all-embracing sharing (open data), of an
efficient data infrastructure, and of the consideration of all computer codes used
in the community is emphasized: Data must be FINDABLE, ACCESSABLE
INTEROPERABLE and RE-PURPOSABLE. Recent developments of methods
from artificial intelligence are reviewed and demonstrated, and the chapter is
concluded by a forward looking perspective addressing important not yet solved
challenges.
1. Introduction
Materials science is entering an era where the growth of data from experiments and
computations is expanding beyond a level that can be handled by established
methods. The so-called “4 V challenge” – concerning Volume (the amount of data),
Variety (the heterogeneity of form and meaning of data), Velocity (the rate at which
data may change or new data arrive), and Veracity (the uncertainty of data quality)
is clearly becoming eminent. Most importantly, however, is that big data of
materials science offer novel, extraordinary, and expansive opportunities for
achieving scientific knowledge and insight. These opportunities require new
research concepts and lines of thought. While this chapter focusses on
computational materials science, we emphasize that the described concepts and
methods are valid for experimental data as well.
In most cases, the results of computational materials science studies are published
as focused research studies, reporting only those few data that are directly relevant
2
for the respective publication. Thus, even from very extensive computations
(thousands or millions of CPU core hours) just very few results are shared with the
community. Most data, in particular when they were not deemed of immediate
relevance, are kept private or even thrown away. In November 2014, the principal
investigators of the NOMAD Center of Excellence (NOMAD) launched an
initiative at the Psi-k community (Psi-k network), proposing “a change in scientific
culture” of computational materials science and engineering, i.e. the extensive
sharing of data of this field – of all data: If and only if the full input and output
files of computations would be shared, calculations don’t need to be repeated again
and again, and the field will have access to big data which can be used in a totally
new research manner, i.e. by artificial-intelligence methods. As will be elaborated
in sections 2 and 5 below, one can find structure and patters in big data, gaining
new insight that cannot be obtained by studying small data sets, and this way even
allegedly useless data get value. A popular example from real life on the value of
big-data analytics is the tracking of the movement of mobile phones which
provides instantaneous information on traffic flow and jam. Another example is
the local information of google searches for flu symptoms and medicine which
reflect the spreading of a flue wave. Initially, many but not every colleague in
computational material science liked the initiative towards all-embracing open
access, but four years later it is clear that the overwhelming part of the community
supports an extensive data sharing (sections 2 and 3).1
The NOMAD Center of Excellence (NOMAD) has assumed a pioneering role in
data sharing and analytics, also considering all aspects (Draxl and Scheffler 2018)
of what is now called the FAIR handling of data (Wilkinson et al. 2016):2 Data are
FINDABLE for anyone interested; they are stored in a way that make it easily
ACCESSABLE; their representation follows accepted standards (Ghiringhelli et al.
2016), and all specifications are open – hence data are INTEROPERABLE.3 All of
this enables the data to be used for research questions that could be different from
their original purpose; hence data are RE-PURPOSABLE.4
The chapter is structured as follows. In section 2 we briefly summarize the history
of the four research paradigms of materials science, with particular focus on the
fourth one, “big-data-driven materials science”. section 3 then stresses the
importance of an extensive data sharing for the advancements of science and
1 As important side remark, we note that the all-embracing sharing of research raw data
helps the prevention of scientific misconduct. 2 The concept of the NOMAD Repository and Archive (NOMAD) was developed in
2014, independently and parallel to the “FAIR Guiding Principles” (Wilkinson et al.
2016). Interestingly, the essence is practically identical. 3 The understanding of “interoperable” is somewhat controversial. It may be defined as:
1) Metadata and data use a formal, accessible, shared, and widely accepted language for
data representation; 2) The vocabulary of metadata and data follow FAIR principles; 3)
Metadata and data include qualified references to other (meta)data and to the authors who
created the results. 4 The NOMAD CoE uses the term re-purposable, while in the FAIR concept it was
termed re-usable. Both obviously mean the same in this context.
3
engineering and the (so far) empty rhetoric of scientific societies and funding
agencies (Nature editorial 2017). In section 4, the NOMAD concept is highlighted
and it is discussed how it is orthogonal to and how it plays synergistically together
with other important databases, particularly AFLOW (AFLOW), Materials Project
(Materials Project), and OQMD (OQMD)5. Section 5 addresses artificial-
intelligence concepts for materials-science data with some specific examples.
Finally, in section 6, we give an extensive outlook on the developments and open
questions of big-data driven materials science.
2. Development of the four paradigms of material sciences
Figure 1 sketches the historical evolution of methods and concepts of materials
science. Experimental research dates back to the Stone Age, and the basic
techniques of metallurgy were developed in the Copper and Bronze Ages which
started in the late 6th millennium BCE. The control of fire prompted a major
experimental breakthrough. Towards the end of the 16th century, scientists began
to describe physical relationships through equations. Well-known names from the
early days are Tycho Brahe (1546-1601), Tomas Harriot (ca.1560-1621), Galileo
Galilei (1564-1642), Johannes Kepler (1571-1630), Isaac Newton (1643-1727),
and Gottfried Wilhelm Leibniz (1646-1716). The latter two also developed the
concept of the mathematical differential and derivatives. Thus, analytical equations
became the central instrument of theoretical physics. Second from the left in Fig.
1, this new way of thinking – paradigm – is symbolized by the Schrödinger
equation. Needless to say, the first paradigm, the empirical and experimental
sciences, did not become obsolete, but theoretical physics represents an important
complementary methodology.
5 Other important, databases with largely experimental data are the PAULING FILE and the
Crystallography Open Database (COD), both presented in the handbook (Blokhin and Vilhars 2018,
Gražulis et al. 2018)
Figure 1. Development of the paradigms of materials science and engineering.
4
Since the 1950s electronic-structure theory was advanced for materials by J. C.
Slater (e.g. Slater 1937, 1957, 1963, 1965, 1967, Slater and Johnson 1972), the
Monte-Carlo method was introduced by (Metropolis et al. 1953), and (Alder and
Wainwright 1958, 1962, 1970) and (Rahman 1964) introduced molecular
dynamics. (Hohenberg and Kohn 1964) and (Kohn and Sham 1965) laid the
foundation of density-functional theory (DFT)6 in the mid nineteen-sixties. All
these developments enabled the numerical calculation and analysis of
thermodynamics and statistical mechanics on the one hand, and the quantum-
mechanical properties of solids and liquids on the other hand. They define the
beginning of computational materials science, what is nowadays considered the 3rd
paradigm. Herewith “computer experiments” were introduced, i.e. simulations,
whose results are often treated and analyzed analogous to those of experimental
studies. Initially developed independently, the fields of electronic-structure theory
and statistical mechanics and thermodynamics are now growing together (Reuter
et al. 2005 and references therein). Likewise, in parallel to DFT, many-body
techniques, based on Green functions were introduced (Hedin 1965), which are
now synergistically interleaved with DFT to form the forefront of electronic-
structure theory, including excitations.
Today, big data and artificial intelligence revolutionize many areas of our lives,
and materials science is no exception (Agrawal and Choudhary 2016). Jim Gray
had probably first discussed this 4th paradigm (Gray 2007) arguing explicitly that
big data reveal correlations and dependencies that cannot be seen when studying
small data sets. A further important difference to the second paradigm is that we
accept that many materials properties, i.e. patterns and correlations in big data,
cannot be described in terms of a closed mathematical formulation, as they are
governed by several, intermingled theoretical concepts and multilevel, intricate
processes.
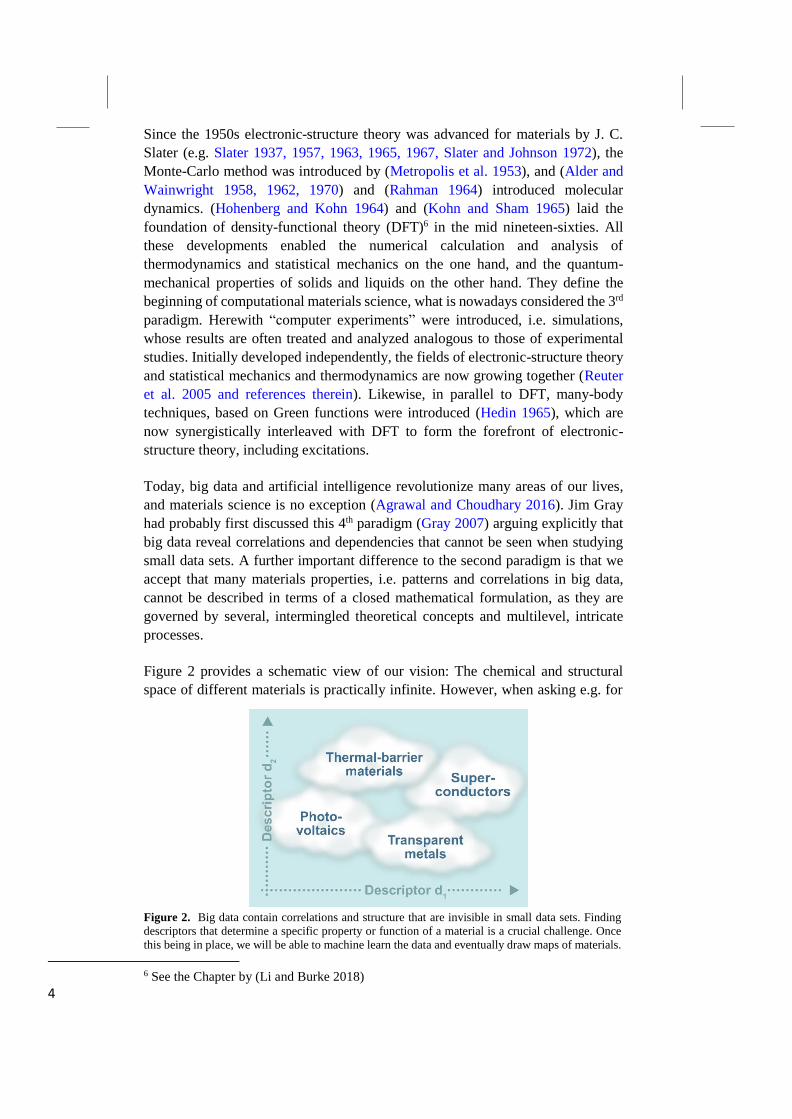
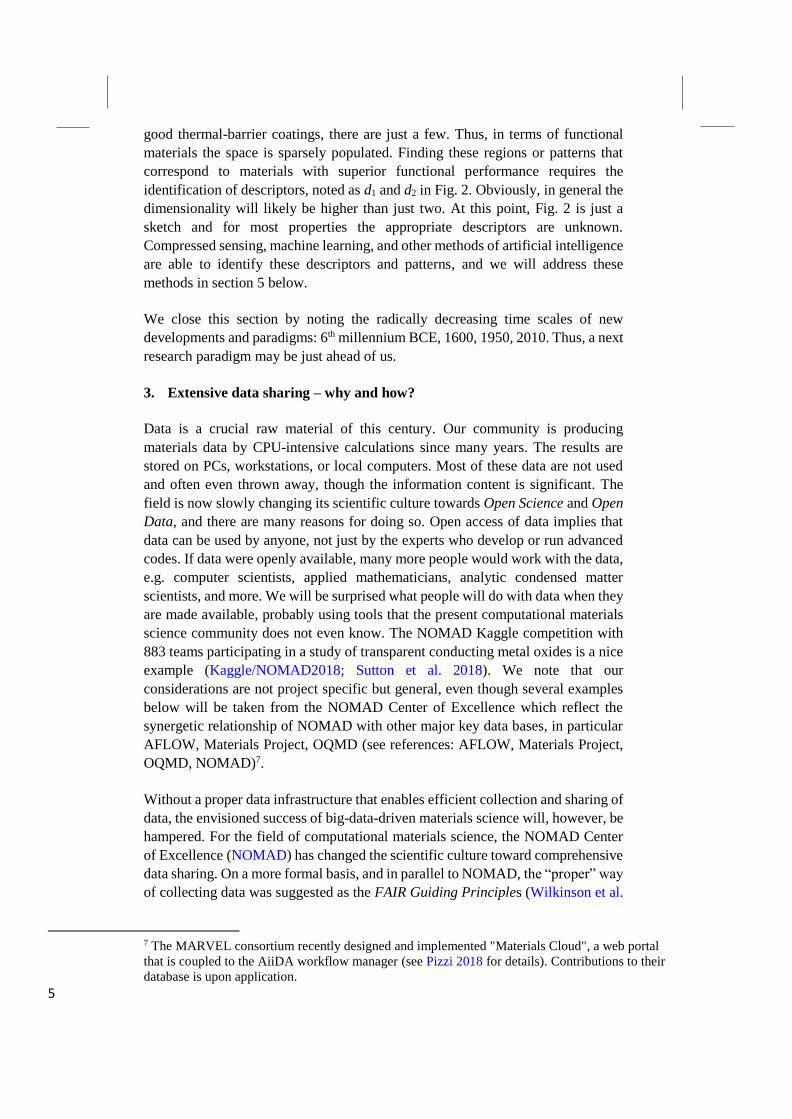
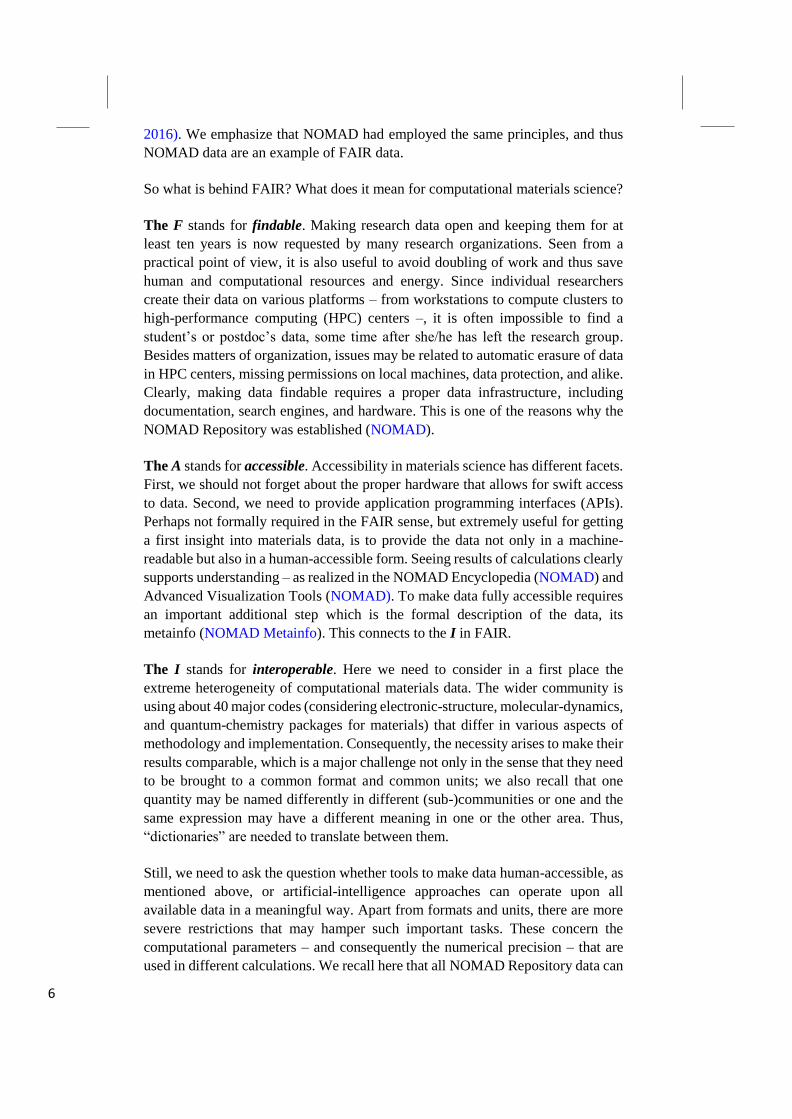
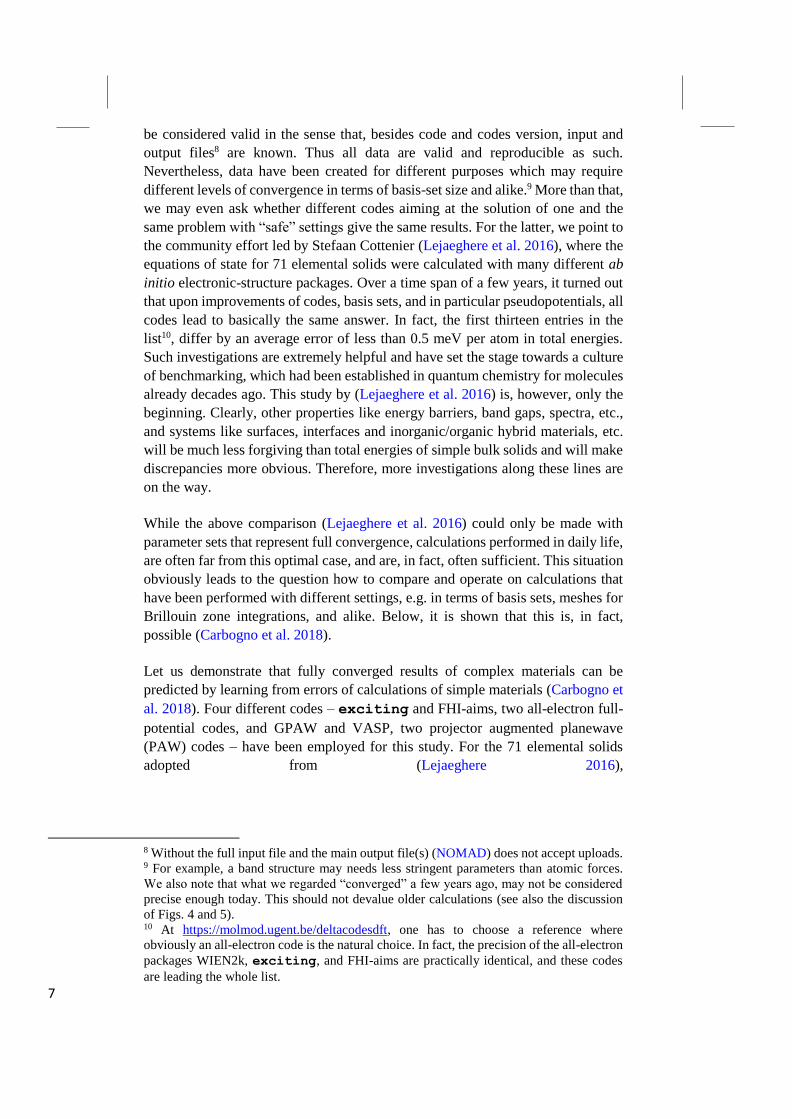
Figure 2 provides a schematic view of our vision: The chemical and structural
space of different materials is practically infinite. However, when asking e.g. for
6 See the Chapter by (Li and Burke 2018)
Figure 2. Big data contain correlations and structure that are invisible in small data sets. Finding
descriptors that determine a specific property or function of a material is a crucial challenge. Once
this being in place, we will be able to machine learn the data and eventually draw maps of materials.
5
good thermal-barrier coatings, there are just a few. Thus, in terms of functional
materials the space is sparsely populated. Finding these regions or patterns that
correspond to materials with superior functional performance requires the
identification of descriptors, noted as d1 and d2 in Fig. 2. Obviously, in general the
dimensionality will likely be higher than just two. At this point, Fig. 2 is just a
sketch and for most properties the appropriate descriptors are unknown.
Compressed sensing, machine learning, and other methods of artificial intelligence
are able to identify these descriptors and patterns, and we will address these
methods in section 5 below.
We close this section by noting the radically decreasing time scales of new
developments and paradigms: 6th millennium BCE, 1600, 1950, 2010. Thus, a next
research paradigm may be just ahead of us.
3. Extensive data sharing – why and how?
Data is a crucial raw material of this century. Our community is producing
materials data by CPU-intensive calculations since many years. The results are
stored on PCs, workstations, or local computers. Most of these data are not used
and often even thrown away, though the information content is significant. The
field is now slowly changing its scientific culture towards Open Science and Open
Data, and there are many reasons for doing so. Open access of data implies that
data can be used by anyone, not just by the experts who develop or run advanced
codes. If data were openly available, many more people would work with the data,
e.g. computer scientists, applied mathematicians, analytic condensed matter
scientists, and more. We will be surprised what people will do with data when they
are made available, probably using tools that the present computational materials
science community does not even know. The NOMAD Kaggle competition with
883 teams participating in a study of transparent conducting metal oxides is a nice
example (Kaggle/NOMAD2018; Sutton et al. 2018). We note that our
considerations are not project specific but general, even though several examples
below will be taken from the NOMAD Center of Excellence which reflect the
synergetic relationship of NOMAD with other major key data bases, in particular
AFLOW, Materials Project, OQMD (see references: AFLOW, Materials Project,
OQMD, NOMAD)7.
Without a proper data infrastructure that enables efficient collection and sharing of
data, the envisioned success of big-data-driven materials science will, however, be
hampered. For the field of computational materials science, the NOMAD Center
of Excellence (NOMAD) has changed the scientific culture toward comprehensive
data sharing. On a more formal basis, and in parallel to NOMAD, the “proper” way
of collecting data was suggested as the FAIR Guiding Principles (Wilkinson et al.
7 The MARVEL consortium recently designed and implemented "Materials Cloud", a web portal
that is coupled to the AiiDA workflow manager (see Pizzi 2018 for details). Contributions to their
database is upon application.
6
2016). We emphasize that NOMAD had employed the same principles, and thus
NOMAD data are an example of FAIR data.
So what is behind FAIR? What does it mean for computational materials science?
The F stands for findable. Making research data open and keeping them for at
least ten years is now requested by many research organizations. Seen from a
practical point of view, it is also useful to avoid doubling of work and thus save
human and computational resources and energy. Since individual researchers
create their data on various platforms – from workstations to compute clusters to
high-performance computing (HPC) centers –, it is often impossible to find a
student’s or postdoc’s data, some time after she/he has left the research group.
Besides matters of organization, issues may be related to automatic erasure of data
in HPC centers, missing permissions on local machines, data protection, and alike.
Clearly, making data findable requires a proper data infrastructure, including
documentation, search engines, and hardware. This is one of the reasons why the
NOMAD Repository was established (NOMAD).
The A stands for accessible. Accessibility in materials science has different facets.
First, we should not forget about the proper hardware that allows for swift access
to data. Second, we need to provide application programming interfaces (APIs).
Perhaps not formally required in the FAIR sense, but extremely useful for getting
a first insight into materials data, is to provide the data not only in a machine-
readable but also in a human-accessible form. Seeing results of calculations clearly
supports understanding – as realized in the NOMAD Encyclopedia (NOMAD) and
Advanced Visualization Tools (NOMAD). To make data fully accessible requires
an important additional step which is the formal description of the data, its
metainfo (NOMAD Metainfo). This connects to the I in FAIR.
The I stands for interoperable. Here we need to consider in a first place the
extreme heterogeneity of computational materials data. The wider community is
using about 40 major codes (considering electronic-structure, molecular-dynamics,
and quantum-chemistry packages for materials) that differ in various aspects of
methodology and implementation. Consequently, the necessity arises to make their
results comparable, which is a major challenge not only in the sense that they need
to be brought to a common format and common units; we also recall that one
quantity may be named differently in different (sub-)communities or one and the
same expression may have a different meaning in one or the other area. Thus,
“dictionaries” are needed to translate between them.
Still, we need to ask the question whether tools to make data human-accessible, as
mentioned above, or artificial-intelligence approaches can operate upon all
available data in a meaningful way. Apart from formats and units, there are more
severe restrictions that may hamper such important tasks. These concern the
computational parameters – and consequently the numerical precision – that are
used in different calculations. We recall here that all NOMAD Repository data can
7
be considered valid in the sense that, besides code and codes version, input and
output files8 are known. Thus all data are valid and reproducible as such.
Nevertheless, data have been created for different purposes which may require
different levels of convergence in terms of basis-set size and alike.9 More than that,
we may even ask whether different codes aiming at the solution of one and the
same problem with “safe” settings give the same results. For the latter, we point to
the community effort led by Stefaan Cottenier (Lejaeghere et al. 2016), where the
equations of state for 71 elemental solids were calculated with many different ab
initio electronic-structure packages. Over a time span of a few years, it turned out
that upon improvements of codes, basis sets, and in particular pseudopotentials, all
codes lead to basically the same answer. In fact, the first thirteen entries in the
list10, differ by an average error of less than 0.5 meV per atom in total energies.
Such investigations are extremely helpful and have set the stage towards a culture
of benchmarking, which had been established in quantum chemistry for molecules
already decades ago. This study by (Lejaeghere et al. 2016) is, however, only the
beginning. Clearly, other properties like energy barriers, band gaps, spectra, etc.,
and systems like surfaces, interfaces and inorganic/organic hybrid materials, etc.
will be much less forgiving than total energies of simple bulk solids and will make
discrepancies more obvious. Therefore, more investigations along these lines are
on the way.
While the above comparison (Lejaeghere et al. 2016) could only be made with
parameter sets that represent full convergence, calculations performed in daily life,
are often far from this optimal case, and are, in fact, often sufficient. This situation
obviously leads to the question how to compare and operate on calculations that
have been performed with different settings, e.g. in terms of basis sets, meshes for
Brillouin zone integrations, and alike. Below, it is shown that this is, in fact,
possible (Carbogno et al. 2018).
Let us demonstrate that fully converged results of complex materials can be
predicted by learning from errors of calculations of simple materials (Carbogno et
al. 2018). Four different codes – exciting and FHI-aims, two all-electron full-
potential codes, and GPAW and VASP, two projector augmented planewave
(PAW) codes – have been employed for this study. For the 71 elemental solids
adopted from (Lejaeghere 2016),
8 Without the full input file and the main output file(s) (NOMAD) does not accept uploads. 9 For example, a band structure may needs less stringent parameters than atomic forces.
We also note that what we regarded “converged” a few years ago, may not be considered
precise enough today. This should not devalue older calculations (see also the discussion
of Figs. 4 and 5). 10 At https://molmod.ugent.be/deltacodesdft, one has to choose a reference where
obviously an all-electron code is the natural choice. In fact, the precision of the all-electron
packages WIEN2k, exciting, and FHI-aims are practically identical, and these codes
are leading the whole list.
8
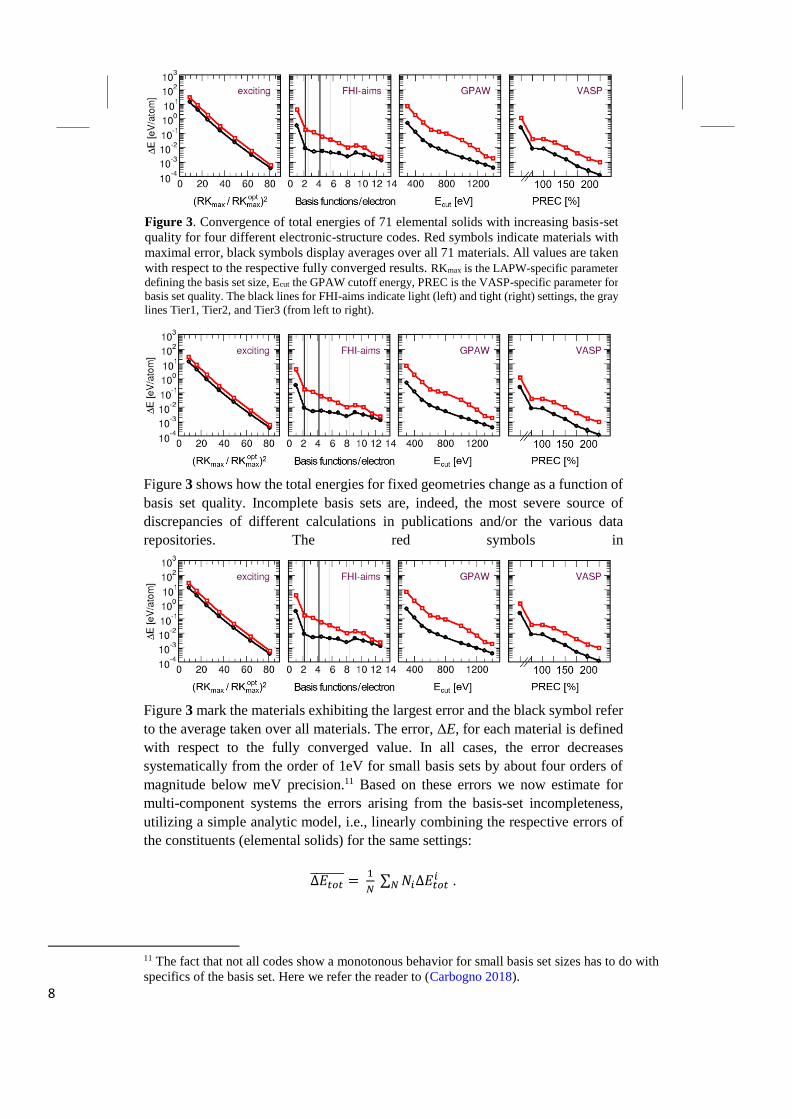
Figure 3 shows how the total energies for fixed geometries change as a function of
basis set quality. Incomplete basis sets are, indeed, the most severe source of
discrepancies of different calculations in publications and/or the various data
repositories. The red symbols in
Figure 3 mark the materials exhibiting the largest error and the black symbol refer
to the average taken over all materials. The error, ΔE, for each material is defined
with respect to the fully converged value. In all cases, the error decreases
systematically from the order of 1eV for small basis sets by about four orders of
magnitude below meV precision.11 Based on these errors we now estimate for
multi-component systems the errors arising from the basis-set incompleteness,
utilizing a simple analytic model, i.e., linearly combining the respective errors of
the constituents (elemental solids) for the same settings:
∆𝐸𝑡𝑜𝑡̅̅ ̅̅ ̅̅ ̅ =
1
𝑁 ∑ 𝑁𝑖∆𝐸𝑡𝑜𝑡
𝑖𝑁 .
11 The fact that not all codes show a monotonous behavior for small basis set sizes has to do with
specifics of the basis set. Here we refer the reader to (Carbogno 2018).
Figure 3. Convergence of total energies of 71 elemental solids with increasing basis-set
quality for four different electronic-structure codes. Red symbols indicate materials with
maximal error, black symbols display averages over all 71 materials. All values are taken
with respect to the respective fully converged results. RKmax is the LAPW-specific parameter
defining the basis set size, Ecut the GPAW cutoff energy, PREC is the VASP-specific parameter for
basis set quality. The black lines for FHI-aims indicate light (left) and tight (right) settings, the gray
lines Tier1, Tier2, and Tier3 (from left to right).
9
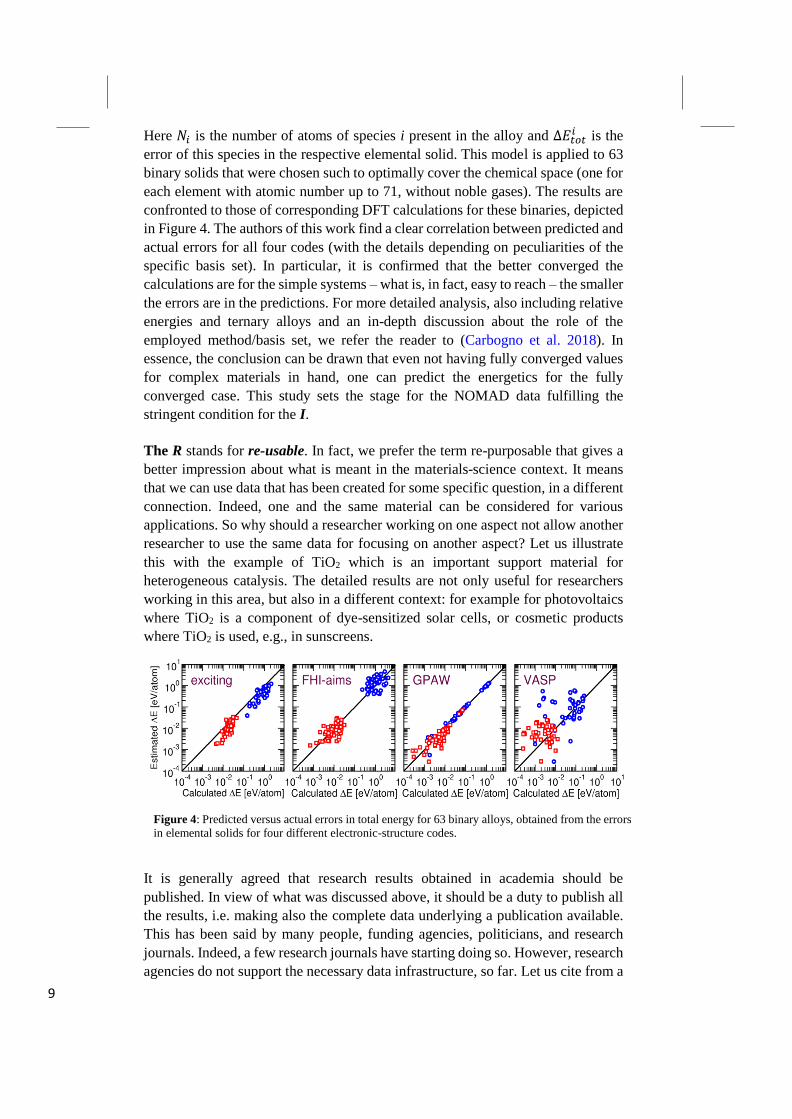
Here 𝑁𝑖 is the number of atoms of species i present in the alloy and ∆𝐸𝑡𝑜𝑡𝑖 is the
error of this species in the respective elemental solid. This model is applied to 63
binary solids that were chosen such to optimally cover the chemical space (one for
each element with atomic number up to 71, without noble gases). The results are
confronted to those of corresponding DFT calculations for these binaries, depicted
in Figure 4. The authors of this work find a clear correlation between predicted and
actual errors for all four codes (with the details depending on peculiarities of the
specific basis set). In particular, it is confirmed that the better converged the
calculations are for the simple systems – what is, in fact, easy to reach – the smaller
the errors are in the predictions. For more detailed analysis, also including relative
energies and ternary alloys and an in-depth discussion about the role of the
employed method/basis set, we refer the reader to (Carbogno et al. 2018). In
essence, the conclusion can be drawn that even not having fully converged values
for complex materials in hand, one can predict the energetics for the fully
converged case. This study sets the stage for the NOMAD data fulfilling the
stringent condition for the I.
The R stands for re-usable. In fact, we prefer the term re-purposable that gives a
better impression about what is meant in the materials-science context. It means
that we can use data that has been created for some specific question, in a different
connection. Indeed, one and the same material can be considered for various
applications. So why should a researcher working on one aspect not allow another
researcher to use the same data for focusing on another aspect? Let us illustrate
this with the example of TiO2 which is an important support material for
heterogeneous catalysis. The detailed results are not only useful for researchers
working in this area, but also in a different context: for example for photovoltaics
where TiO2 is a component of dye-sensitized solar cells, or cosmetic products
where TiO2 is used, e.g., in sunscreens.
It is generally agreed that research results obtained in academia should be
published. In view of what was discussed above, it should be a duty to publish all
the results, i.e. making also the complete data underlying a publication available.
This has been said by many people, funding agencies, politicians, and research
journals. Indeed, a few research journals have starting doing so. However, research
agencies do not support the necessary data infrastructure, so far. Let us cite from a
Figure 4: Predicted versus actual errors in total energy for 63 binary alloys, obtained from the errors
in elemental solids for four different electronic-structure codes.
10
recent Nature Editorial “Empty rhetoric over data sharing slows science” (Nature
editorial 2017): “Everyone agrees that there are good reasons for having open data.
It speeds research, allowing others to build promptly on results. It improves
replicability. It enables scientists to test whether claims in a paper truly reflect the
whole data set. It helps them to find incorrect data. And it improves the attribution
of credit to the data’s originators. But who will pay? And who will host?” – and
further “Governments, funders and scientific communities must move beyond lip-
service and commit to data-sharing practices and platforms.” For computational
materials science though, NOMAD had already changed the culture and
implemented the platform (Draxl et al. 2017).
4. The NOMAD concept
As briefly outlined in the previous section, NOMAD (NOMAD) has initiated
extensive data sharing in computational materials science. The NOMAD
Laboratory processes, cleanses, and hosts computational materials science data,
computed by all important materials-science codes available today and makes this
data accessible by providing several related data services. The big picture is to
advance materials science by enabling researchers in basic science and engineering
to understand and utilize materials data to identify new materials and, in turn, pave
the way to novel products and technologies. NOMAD also collaborates with many
researchers and all other big databases, specifically AFLOW (AFLOW), Materials
Project (Materials Project), and OQMD (OQMD), Computational Materials
Repository (CMR), and others. In the following, NOMAD’s corner stones are
described in some more detail.
The NOMAD Repository forms the basis of all NOMAD tools by processing and
hosting the raw materials data. Made publically available in early 2014, it contains
by now the input and output files from millions of high-quality calculations and
became the world’s largest collection of computational materials science data. It
comprises calculations that have been produced with any of the leading electronic-
structure codes and increasingly also with codes from quantum chemistry.
Presently, NOMAD supports about 40 codes, and less-frequently used or newly
established codes will be added on demand. We point to the orthogonality
compared to these latter databases, and emphasize that the NOMAD Repository is
not restricted to selected computer codes or closed research teams but serves the
entire community with its ecosystem of very different computer codes.
By hosting raw data, the NOMAD Repository not only helps researchers to
organize their results and make them available to others keeping scientific data for
free for at least 10 years12. The NOMAD Repository was the first repository in
materials science recommended by Scientific Data as stable and safe long-time
storage.
12 NOMAD guarantees to keep data for at least ten years from the last upload. In practice
this means that overall, data are kept much longer than ten years.
11
Upload of data is possible without any barrier. Results are requested in their raw
format as produced by the underlying code. For downloading data, not even
registration is needed. NOMAD sticks to an open data policy, where data are
published according to the Creative Commons Attribution 3.0 License.
Nevertheless, uploaders can keep their data secret for a certain period that can be
used for publishing the results and / or restricting the access to a selected group of
colleagues (or referees). After a maximum period of three years though, all data
become open access.
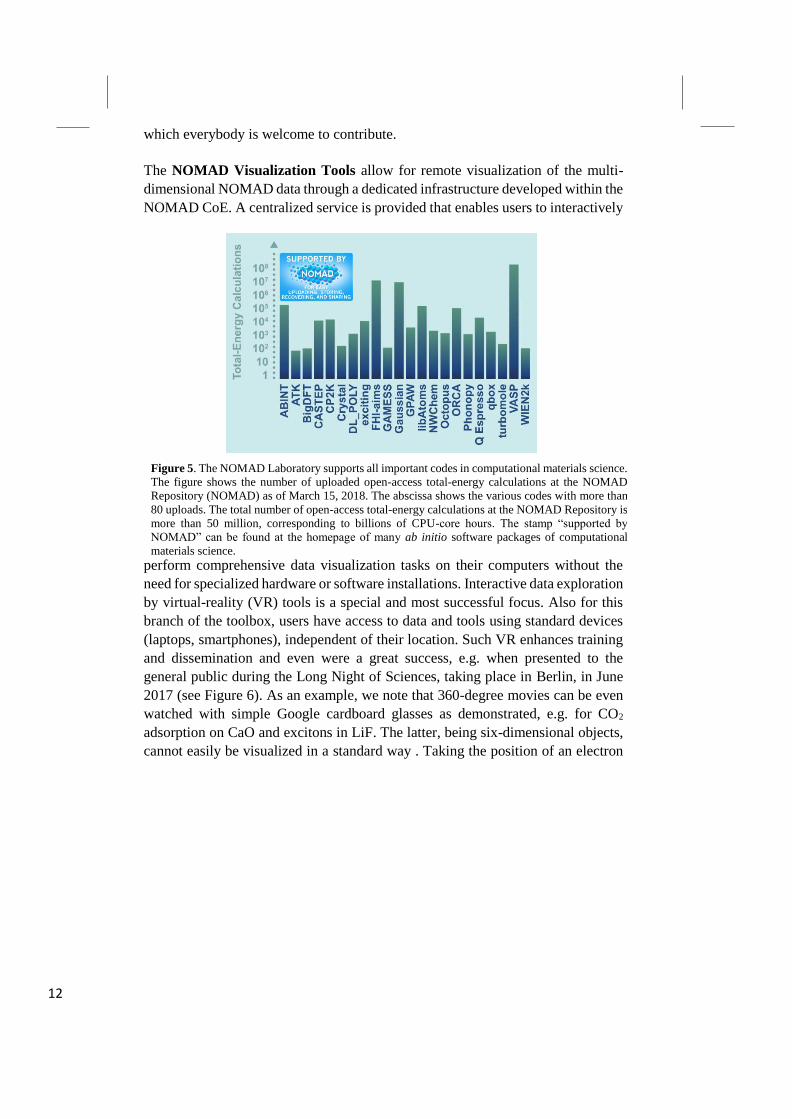
Figure 3 reflects how actively the entire community is participating in the NOMAD
initiative. It depicts a snapshot of the NOMAD Archive by March 15, 2018,
showing the number of uploads (total-energy calculations) of data from various
community codes.
The NOMAD Archive hosts the normalized data, i.e. the open-access data of the
NOMAD Repository converted into a common, code-independent format. In other
words, numerous parsers have been developed that read out and translate all the
information contained in in- and output files. This ensures the I in FAIR, namely
that data from different sources can be compared and, hence, collectively operated
upon by various NOMAD (and other) tools.
As mentioned already above, a clear metadata definition is a prerequisite for this
normalization step to make sure that the results/values obtained atomistic or ab
initio calculations are correctly interpreted by the parsers. Such activity should be
community driven and the result of a key workshop on the goal was published in
(Ghringhelli et al. 2016, 2017). The development of an open, flexible, and
hierarchical metadata classification system (NOMAD Metainfo), as achieved by
NOMAD, was indeed challenging. Obviously, as codes are continuously updated
and extended, and new codes may be developed, this is an ongoing process, to
12
which everybody is welcome to contribute.
The NOMAD Visualization Tools allow for remote visualization of the multi-
dimensional NOMAD data through a dedicated infrastructure developed within the
NOMAD CoE. A centralized service is provided that enables users to interactively
perform comprehensive data visualization tasks on their computers without the
need for specialized hardware or software installations. Interactive data exploration
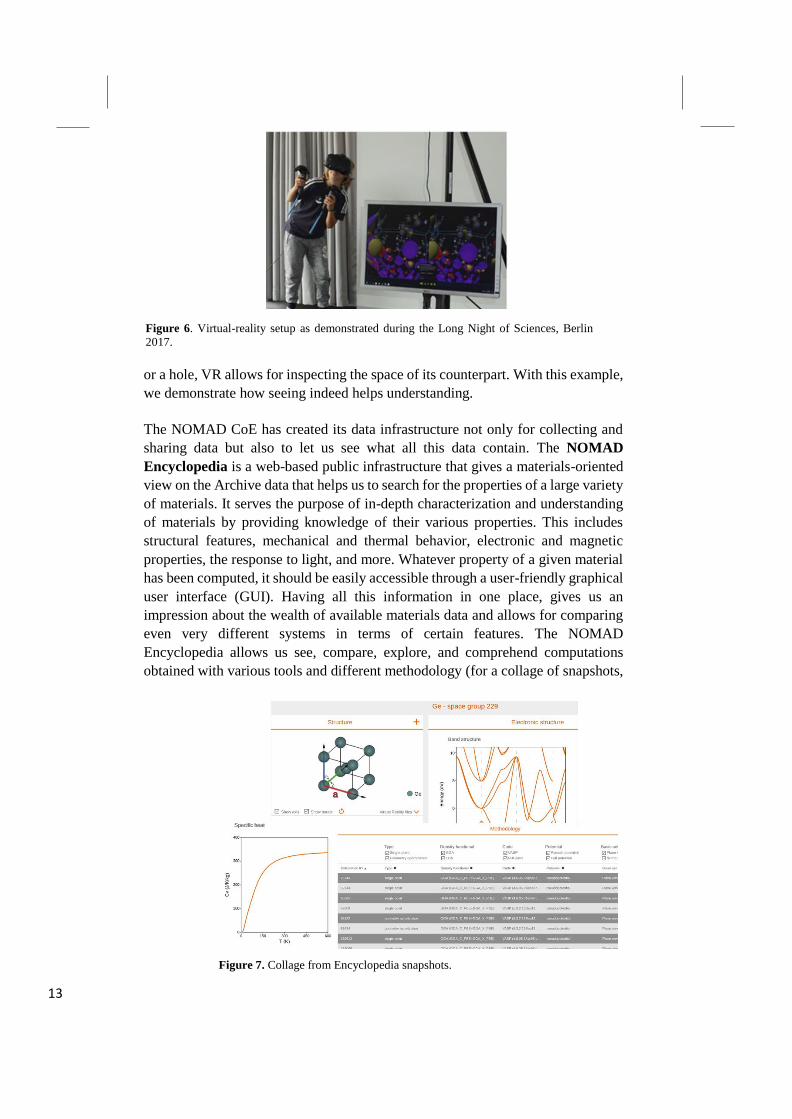
by virtual-reality (VR) tools is a special and most successful focus. Also for this
branch of the toolbox, users have access to data and tools using standard devices
(laptops, smartphones), independent of their location. Such VR enhances training
and dissemination and even were a great success, e.g. when presented to the
general public during the Long Night of Sciences, taking place in Berlin, in June
2017 (see Figure 6). As an example, we note that 360-degree movies can be even
watched with simple Google cardboard glasses as demonstrated, e.g. for CO2
adsorption on CaO and excitons in LiF. The latter, being six-dimensional objects,
cannot easily be visualized in a standard way . Taking the position of an electron
Figure 5. The NOMAD Laboratory supports all important codes in computational materials science.
The figure shows the number of uploaded open-access total-energy calculations at the NOMAD
Repository (NOMAD) as of March 15, 2018. The abscissa shows the various codes with more than
80 uploads. The total number of open-access total-energy calculations at the NOMAD Repository is
more than 50 million, corresponding to billions of CPU-core hours. The stamp “supported by
NOMAD” can be found at the homepage of many ab initio software packages of computational
materials science.
13
or a hole, VR allows for inspecting the space of its counterpart. With this example,
we demonstrate how seeing indeed helps understanding.
The NOMAD CoE has created its data infrastructure not only for collecting and
sharing data but also to let us see what all this data contain. The NOMAD
Encyclopedia is a web-based public infrastructure that gives a materials-oriented
view on the Archive data that helps us to search for the properties of a large variety
of materials. It serves the purpose of in-depth characterization and understanding
of materials by providing knowledge of their various properties. This includes
structural features, mechanical and thermal behavior, electronic and magnetic
properties, the response to light, and more. Whatever property of a given material
has been computed, it should be easily accessible through a user-friendly graphical
user interface (GUI). Having all this information in one place, gives us an
impression about the wealth of available materials data and allows for comparing
even very different systems in terms of certain features. The NOMAD
Encyclopedia allows us see, compare, explore, and comprehend computations
obtained with various tools and different methodology (for a collage of snapshots,
Figure 6. Virtual-reality setup as demonstrated during the Long Night of Sciences, Berlin
2017.
Figure 7. Collage from Encyclopedia snapshots.
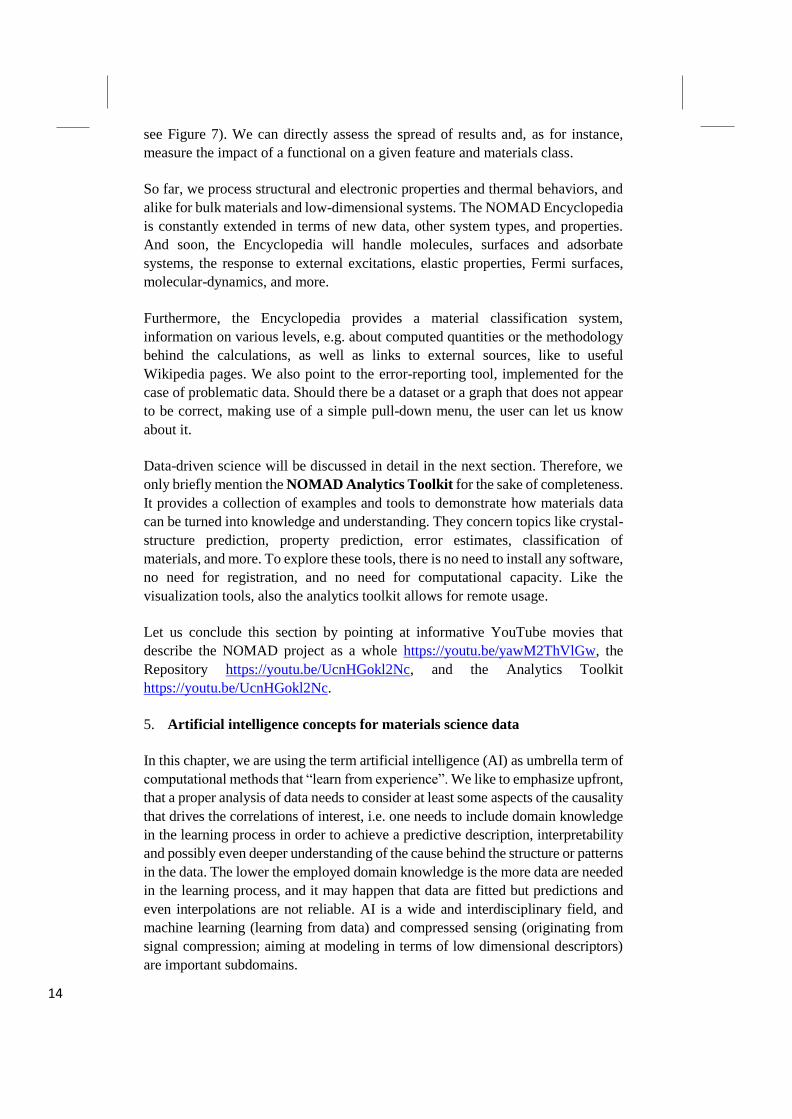
14
see Figure 7). We can directly assess the spread of results and, as for instance,
measure the impact of a functional on a given feature and materials class.
So far, we process structural and electronic properties and thermal behaviors, and
alike for bulk materials and low-dimensional systems. The NOMAD Encyclopedia
is constantly extended in terms of new data, other system types, and properties.
And soon, the Encyclopedia will handle molecules, surfaces and adsorbate
systems, the response to external excitations, elastic properties, Fermi surfaces,
molecular-dynamics, and more.
Furthermore, the Encyclopedia provides a material classification system,
information on various levels, e.g. about computed quantities or the methodology
behind the calculations, as well as links to external sources, like to useful
Wikipedia pages. We also point to the error-reporting tool, implemented for the
case of problematic data. Should there be a dataset or a graph that does not appear
to be correct, making use of a simple pull-down menu, the user can let us know
about it.
Data-driven science will be discussed in detail in the next section. Therefore, we
only briefly mention the NOMAD Analytics Toolkit for the sake of completeness.
It provides a collection of examples and tools to demonstrate how materials data
can be turned into knowledge and understanding. They concern topics like crystal-
structure prediction, property prediction, error estimates, classification of
materials, and more. To explore these tools, there is no need to install any software,
no need for registration, and no need for computational capacity. Like the
visualization tools, also the analytics toolkit allows for remote usage.
Let us conclude this section by pointing at informative YouTube movies that
describe the NOMAD project as a whole https://youtu.be/yawM2ThVlGw, the
Repository https://youtu.be/UcnHGokl2Nc, and the Analytics Toolkit
https://youtu.be/UcnHGokl2Nc.
5. Artificial intelligence concepts for materials science data
In this chapter, we are using the term artificial intelligence (AI) as umbrella term of
computational methods that “learn from experience”. We like to emphasize upfront,
that a proper analysis of data needs to consider at least some aspects of the causality
that drives the correlations of interest, i.e. one needs to include domain knowledge
in the learning process in order to achieve a predictive description, interpretability
and possibly even deeper understanding of the cause behind the structure or patterns
in the data. The lower the employed domain knowledge is the more data are needed
in the learning process, and it may happen that data are fitted but predictions and
even interpolations are not reliable. AI is a wide and interdisciplinary field, and
machine learning (learning from data) and compressed sensing (originating from
signal compression; aiming at modeling in terms of low dimensional descriptors)
are important subdomains.
15
As noted above (see the discussion of Fig. 2), big data may reveal correlations
(structure and patters) if and only if the data are arranged in a proper way, e.g.
represented by appropriate descriptors. These correlations can be found by AI but
the identification of such correlations does not necessarily go along with deeper
insight or understanding. To some extent we like to argue, that the wish for insight
is often overrated. This is well documented by the Periodic Table of the Elements,
that may arguably be considered as one of the most impacting achievements for
chemistry, condensed matter physics, engineering, and biophysics:. When
Mendeleev published his table in 1871, based on knowledge of 63 atoms (their
weights and chemical behavior), there was no understanding of the deeper cause
behind the structure of the table (Scerri 2008; Pyykkö 2012). Still, the table
predicted the existence of at that time unknown atoms, and even their properties
where described. However, the underlying causality, i.e. that the different rows
reflect the different number of nodes of the radial wave functions of the outer
valence electrons, and that the different columns refer to the number of valence
electrons, was unknown when the table was created. It only was understood about
50 years later, when the shell structure of electrons in atoms was described by
quantum mechanics.
Thus, identifying correlations, structures, and patterns in big data is an important
step by its own. When the relationship between a property of interest, P, and a set
of useful descriptive parameters (the descriptors d1, d2, ... – sometimes called
representation) is known, graphs as in Figure 2 or approximate equations can be
obtained for the relationship P(d1, d2, ...). For the example of the Periodic Table, the
descriptors are the row and column numbers. Obviously, as the number of possible
materials is practically infinite, building a map as in Fig. 2 is a highly demanding
task, of much higher complexity than building the Periodic Table of the Elements.
How to find the descriptors for materials properties? The direct descriptor for a
quantum-mechanical problem is given by the position of all atoms, the nuclear
numbers and the total number of electrons: {RI, ZI}, Ne. This fully describes the
many-body Hamiltonian but it is too complex to learn. Thus, the amount of data
needed for a training (fitting) a function based on {RI, ZI}, Ne is unrealistically high.
We distinguish 3 concepts for choosing proper descriptors: a) the descriptor may be
selected out of a huge, systematically created pool of candidates; b) the descriptor
may be built in the machine-learning step in an abstract manner; and c) one may
just use a (known) descriptor assuming that with many data the actuals choice may
be not so important. Concept a) will be discussed below when we describe
compressed sensing and subgroup discovery. Concept b) is realized in neural-
network approaches which, in the learning step, minimizes an objective function
that quantifies the difference between the predicted and the correct (known) data.
Through this minimization, the weights (i.e. parameters) of the neural network are
optimized (Hinton 2006, Hinton et al. 2006), and in this way, the network learns the
descriptors. Doren and coworkers (Blank et al. 1995, Lorenz et al. 2004, 2006) have
shown early examples of neural network potential energy surfaces. Hellström and
Behler describe recent advances in their chapter (Hellström and Behler 2018).
16
Concept c) is probably the most widely used approach. It is nicely described in the
chapter by Ceriotti, Willatt, and Csányi (Ceriotti et al. 2018).
A systematic understanding of the suitability of various machine-learning (ML)
models and thorough benchmarking studies are still lacking in materials science. It
was only recently addressed in terms of a public data-analytics competition that was
hosted on the internet platform Kaggle using a dataset of 3,000 (AlxGayInz)2O3
compounds (x+y+z =1), spanning 6 different crystal structures. The aim of this
challenge was to identify the best machine-learning model for the prediction of two
key physical properties that are relevant for optoelectronic applications: the
electronic band gap energy and the crystal formation energy. Impressively, 883
teams contributed, using many different methods (Kaggle/NOMAD2018). The
interested reader is referred to a recent publication (Sutton et al. 2018).
Some warnings may be appropriate. In general, an observed correlations will have
a causal reason – provided that it is supported by a large data set (Pearl 2009). Thus,
a correlation that is described by the function P(d1, d2, ...) may reflect that (d1, d2,
...) = d are the actuators: d → P. However, it could well be that the reverse is true:
P → d. Thirdly, it is possible that there is an “external master”, M, who controls
both d and P, with no direct relationship between d and P. And fourthly, the data
may be selected with a significant bias of the researcher or research community. We
fear that this may be happening much more frequently than realized. But then the
observed correlation may just reflect this bias. All this needs to be kept in mind
when tools of artificial intelligence are applied to big data and when we ask for
interpretability.
Let us add another warning about big data of materials science. The number of
possible materials is practically infinite, and we like to identify new materials that
have better performance or functionality than the materials that are used today.
Clearly, the amount of available data in materials science is getting big though from
the few (about 300,000) materials that have been synthesized up to now, we often
just know the atomic structure and hardly their electronic, elastic or other properties.
Getting more and more data, however, does not imply that all the data is relevant
for all properties of interest. Materials science is ruled by a significant number of
different properties and mechanisms, and experience seems to show that at the end,
the number of materials that are good for a certain group of functions is very small.
Thus, the amount of available data may be big but the number of relevant data is
small. For example, if we ask for a highly transparent materials with excellent heat
conductivity and scratch resistance there is probably nothing better than and nothing
even close to diamond. Thus, in materials science and engineering, we are looking
for “needles in a hay stack”. This is different to typical AI challenges in social
science and medicine where a 80% chance of being right is often considered a great
success. In materials science we need values as high as or even higher than 99.9%.
Alternatively, we need methods that identify the relevant subgroups in the large
amount of data right away.
17
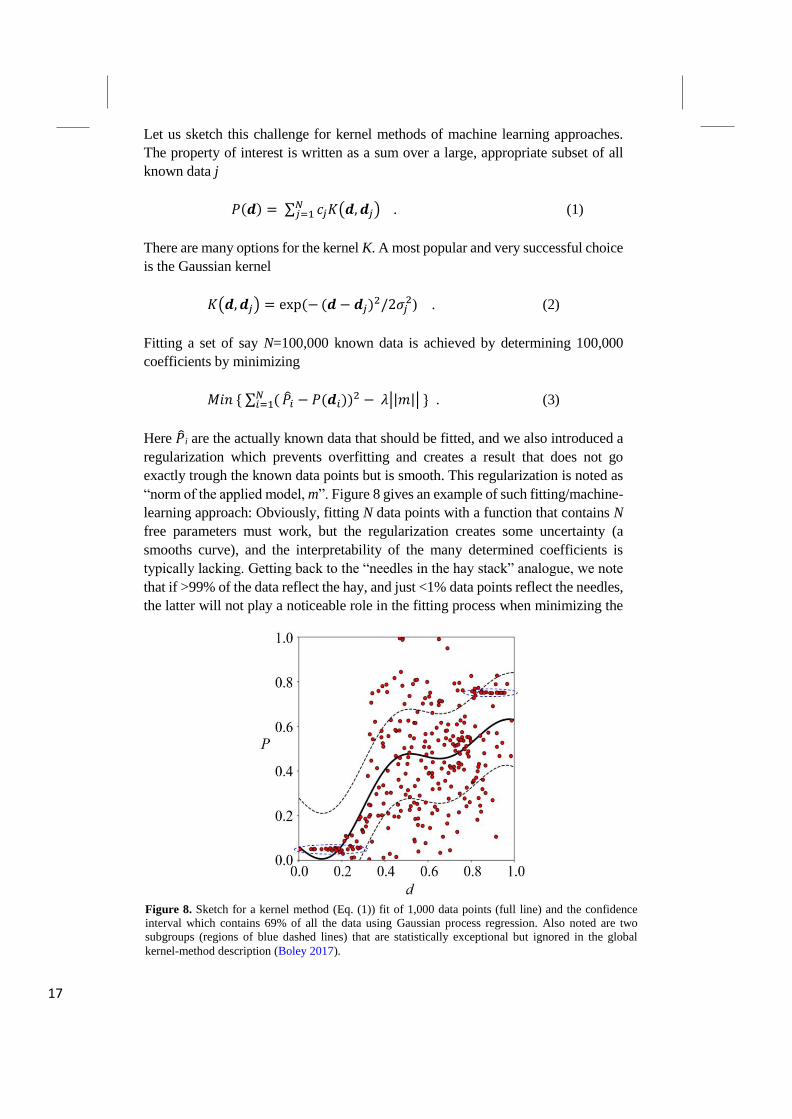
Let us sketch this challenge for kernel methods of machine learning approaches.
The property of interest is written as a sum over a large, appropriate subset of all
known data j
𝑃(𝒅) = ∑ 𝑐𝑗𝐾(𝒅, 𝒅𝑗) 𝑁𝑗=1 . (1)
There are many options for the kernel K. A most popular and very successful choice
is the Gaussian kernel
𝐾(𝒅, 𝒅𝑗) = exp(− (𝒅 − 𝒅𝑗)2/2𝜎𝑗2) . (2)
Fitting a set of say N=100,000 known data is achieved by determining 100,000
coefficients by minimizing
𝑀𝑖𝑛 { ∑ (𝑁𝑖=1 �̂�𝑖 − 𝑃(𝒅𝑖))2 − 𝜆||𝑚|| } . (3)
Here �̂�i are the actually known data that should be fitted, and we also introduced a
regularization which prevents overfitting and creates a result that does not go
exactly trough the known data points but is smooth. This regularization is noted as
“norm of the applied model, m”. Figure 8 gives an example of such fitting/machine-
learning approach: Obviously, fitting N data points with a function that contains N
free parameters must work, but the regularization creates some uncertainty (a
smooths curve), and the interpretability of the many determined coefficients is
typically lacking. Getting back to the “needles in the hay stack” analogue, we note
that if >99% of the data reflect the hay, and just <1% data points reflect the needles,
the latter will not play a noticeable role in the fitting process when minimizing the
Figure 8. Sketch for a kernel method (Eq. (1)) fit of 1,000 data points (full line) and the confidence
interval which contains 69% of all the data using Gaussian process regression. Also noted are two
subgroups (regions of blue dashed lines) that are statistically exceptional but ignored in the global
kernel-method description (Boley 2017).
18
regularized least square error (Eq. 3). In other words, the regularized least square
error minimization puts the overwhelming weight on the description of the hay.
Two subgroups (statistically exceptional regions) are also noted in Figure 9. These
are data parallel to the d axis but not described well by the employed kernel
approach. This example reveals that the general statement “more data provide a
better description” is wrong in ML for materials science. It essentially means: Add
more irrelevant information (more hay) to the information pool (the hay stack).
Obviously, this will not help to find the needles. Alternatively, could we turn this
around? Can we attempt to fit the hay and then consider, the few materials that are
distinguished by a high fitting error as an interesting subgroup that contains the
needles? The difficulty here is that materials are very heterogeneous, and this
heterogeneity is not just restricted to the direct hay-needle comparison. Also the
“hay” is heterogeneous. Obviously, the goal should be to optimize e.g. the
maximum error, but this requires new methods.
Nevertheless, whenever we attempt a global description, machine learning is a great
tool. The chapter by (Huang et al. 2018) gives an excellent description, and the
(Kaggle/NOMAD2018, Sutton et al. 2018) competition is a good example.
Two interpretability-driven approaches have recently been adopted by materials
science. These are subgroup discovery on the one hand and compressed sensing on
the other. Let us introduce them briefly.
Subgroup discovery
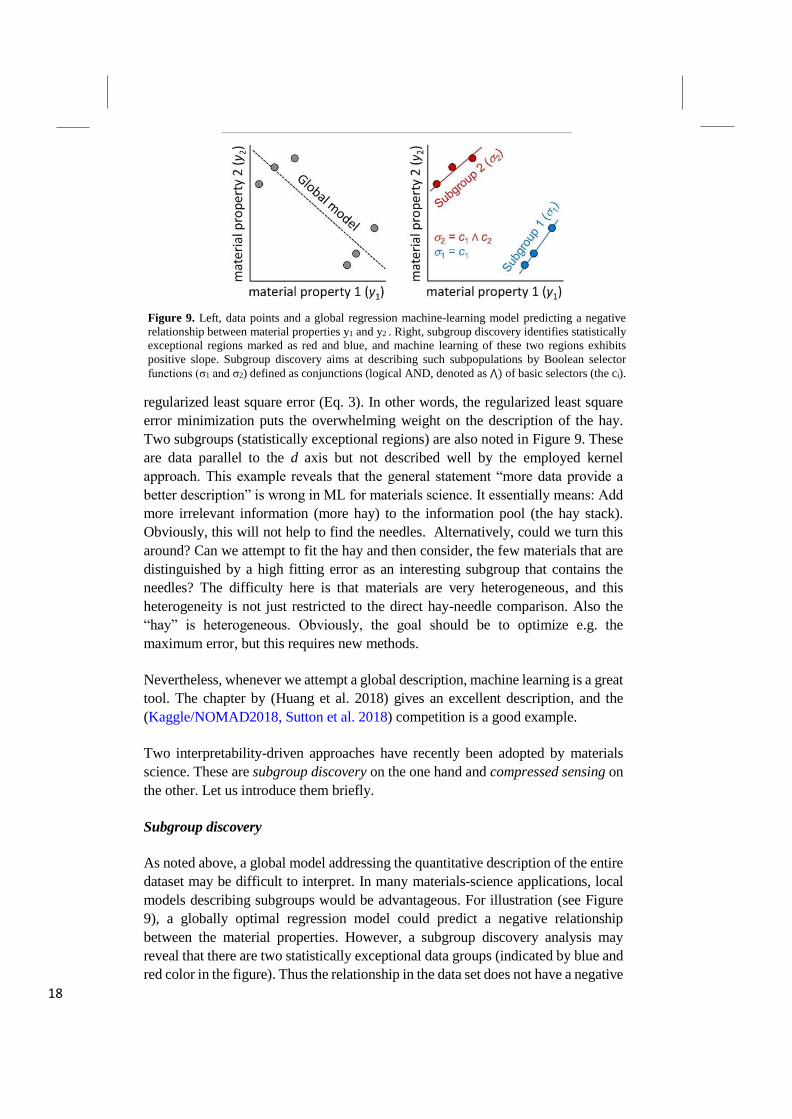
As noted above, a global model addressing the quantitative description of the entire
dataset may be difficult to interpret. In many materials-science applications, local
models describing subgroups would be advantageous. For illustration (see Figure
9), a globally optimal regression model could predict a negative relationship
between the material properties. However, a subgroup discovery analysis may
reveal that there are two statistically exceptional data groups (indicated by blue and
red color in the figure). Thus the relationship in the data set does not have a negative
Figure 9. Left, data points and a global regression machine-learning model predicting a negative
relationship between material properties y1 and y2 . Right, subgroup discovery identifies statistically
exceptional regions marked as red and blue, and machine learning of these two regions exhibits
positive slope. Subgroup discovery aims at describing such subpopulations by Boolean selector
functions (σ1 and σ2) defined as conjunctions (logical AND, denoted as ⋀) of basic selectors (the ci).
19
slope (the global model) but a positive slope (the two subgroups). As a physical
example, the transition metals of the Periodic Table are a subgroup, and the
actinides, lanthanides, and halogens are other subgroups. Thus, identification of
subgroups is useful to gain an understanding of similarities and differences between
systems.
The concepts of subgroup discovery (SGD) was introduced in the early 1990s, when
the advent of large databases motivated the development of explorative and
descriptive analytics tools as an interpretable complement to global modeling
(Duivesteijn et al. 2016, Klösgen 1996, Atzmueller 2015, Herrera et al. 2011,
Siebes 1995, Wrobel 1997, Friedman and Fisher 1999). Simply speaking, the
identification of subgroups is built on 3 components: i) The use of a description
language for identifying subpopulations within a given pool of data. These are
called selectors and typically Boolean expressions, e.g. “the ionization potential of
atom A minus the ionization potential of atom B should be smaller than X” where
X is a number that may be chosen iteratively. ii) The definition of utility functions
that formalize the interestingness (quality) of subpopulations. This may include
requests as “the band gap of the material should be in between 1.1 and 1.5 eV AND
the cohesive energy should be larger than 3 eV”; and iii) The design of a Monte
Carlo search algorithm to find selectors that describe the subpopulations of interest
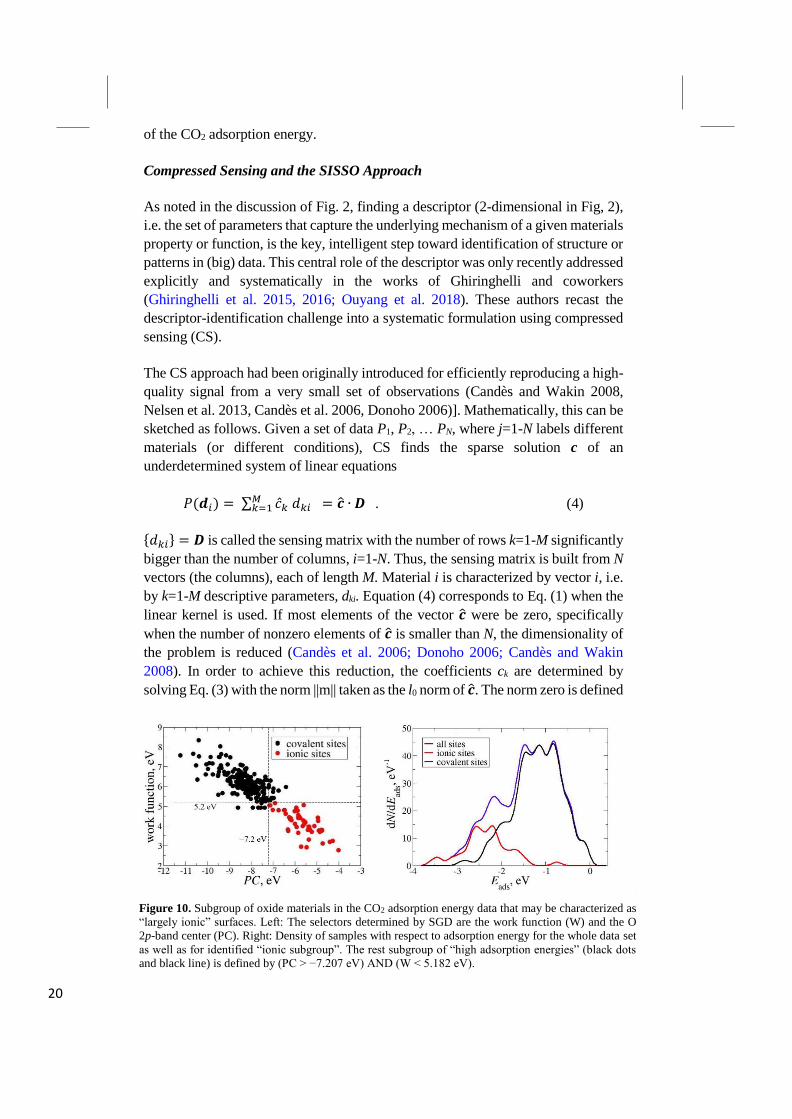
(Goldsmith et al. 2017). Figure 10 illustrates the idea for a recent study of
heterogeneous catalysis: Finding potential catalysts that can transform the
greenhouse gas CO2 into useful chemicals or fuels (Mazheika et al. 2018). This
study concentrated on metal oxides and realized that a global description (fitting all
the data at once) did to provide an accurate description. However, searching for
subgroups by considering many potentials selectors reveals that the adsorption
energies of CO2 , contain a subgroup that is statistically exceptional (marked in red
in Figure 10). The best selector is determined as follows: The center of the O 2p
density of states should be at an energy above 7.2 eV (relative to the vacuum level)
AND the work function of the surface should be smaller than 5.3 eV. These are
properties of the clean oxide surface, and the subgroup identified in this way
contains surface sites that are more ionic than those of the remaining (black)
systems.
The “interestingness (quality) of the subpopulation” was defined in this study in
terms of a quality function that simultaneously maximizes the size of the subgroup
and the deviation of the median of the target property distribution within the
subgroup from the median for the whole data set, and minimizes the width of the
target property distribution within the subgroup. For the example in Figure 10, the
target property is the CO2 adsorption energy. Details can be found the (Mazheika et
al 2018).
The identified red subgroup is characterized by the fact that the surface oxygen sites
of these materials are more strongly ionic than the oxygen sites for the remaining
systems (Mazheika et al. 2018). Fitting the identified subgroup (the red systems)
and the remainder (the black systems) independently, provides a good description
20
of the CO2 adsorption energy.
Compressed Sensing and the SISSO Approach
As noted in the discussion of Fig. 2, finding a descriptor (2-dimensional in Fig, 2),
i.e. the set of parameters that capture the underlying mechanism of a given materials
property or function, is the key, intelligent step toward identification of structure or
patterns in (big) data. This central role of the descriptor was only recently addressed
explicitly and systematically in the works of Ghiringhelli and coworkers
(Ghiringhelli et al. 2015, 2016; Ouyang et al. 2018). These authors recast the
descriptor-identification challenge into a systematic formulation using compressed
sensing (CS).
The CS approach had been originally introduced for efficiently reproducing a high-
quality signal from a very small set of observations (Candès and Wakin 2008,
Nelsen et al. 2013, Candès et al. 2006, Donoho 2006)]. Mathematically, this can be
sketched as follows. Given a set of data P1, P2, … PN, where j=1-N labels different
materials (or different conditions), CS finds the sparse solution c of an
underdetermined system of linear equations
𝑃(𝒅𝑖) = ∑ �̂�𝑘 𝑑𝑘𝑖𝑀𝑘=1 = �̂� ∙ 𝑫 . (4)
{𝑑𝑘𝑖} = 𝑫 is called the sensing matrix with the number of rows k=1-M significantly
bigger than the number of columns, i=1-N. Thus, the sensing matrix is built from N
vectors (the columns), each of length M. Material i is characterized by vector i, i.e.
by k=1-M descriptive parameters, dki. Equation (4) corresponds to Eq. (1) when the
linear kernel is used. If most elements of the vector �̂� were be zero, specifically
when the number of nonzero elements of �̂� is smaller than N, the dimensionality of
the problem is reduced (Candès et al. 2006; Donoho 2006; Candès and Wakin
2008). In order to achieve this reduction, the coefficients ck are determined by
solving Eq. (3) with the norm ||m|| taken as the l0 norm of �̂�. The norm zero is defined
Figure 10. Subgroup of oxide materials in the CO2 adsorption energy data that may be characterized as
“largely ionic” surfaces. Left: The selectors determined by SGD are the work function (W) and the O
2p-band center (PC). Right: Density of samples with respect to adsorption energy for the whole data set
as well as for identified “ionic subgroup”. The rest subgroup of “high adsorption energies” (black dots
and black line) is defined by (PC > −7.207 eV) AND (W < 5.182 eV).
21
as the number of non-zero elements. Thus, the regularization λ||c||0 can be also called
a constraint that favors solutions for �̂� where most elements of �̂� are zero. However,
using the norm zero poses a mathematical combinatorial problem, and it has been
shown that this is (asymptotically) NP hard. As a consequence it has been suggested
to approximate the norm zero by the norm l1, and a popular approach then is LASSO
(least absolute shrinkage and selection operator) (Tibshirani 1996). For materials
science this has been developed by Ghiringhelli and coworkers (Ghiringhelli et al.
2015, 2017).
Thus, the ideas is to offer many descriptor candidates and then let the optimization
approach (Eq. (3)) find out which of these candidates are really good. Since Eq. (4)
is linear, it is necessary that the offered descriptor candidates contain the potential
nonlinearities. As a consequence, different descriptors, i.e. different columns of the
sensing matrix, may become correlated. As a result, when e.g. more than about M
= 5,000 candidate descriptors are used, the LASSO approach is getting unstable.
The mentioned problems have been recently solved by Ouyang and coworkers
(Ouyang et al. 2018). These authors solve the l0 challenge in an iterative approach
called SISSO (sure independence screening and sparsifying operator). Interestingly,
the mentioned correlations are not causing problems, and the number of candidate
descriptors can be increased in SISSO to many billions and even trillions. From the
previously mentioned “basic descriptor” {RI, ZI}, Ne only ZI derived quantities were
used explicitly, e.g. the ionization potentials of the atoms, the electron affinities,
and information about the extension of the atomic wave functions. Then, a
combination of algebraic/functional operations is recursively performed for
extending the space. The operators set is defined as +,−,×, /, exp, log,| − |,√,−1 ,2 ,3 .
Details are described in (Ouyang et al. 2018). Clearly, when different structures are
considered or different charge states {RI}, Ne related features are needed as well.
Let us demonstrate the mentioned concept of building “maps of materials” by a
recent example that employed compressed sensing for the descriptor identification.
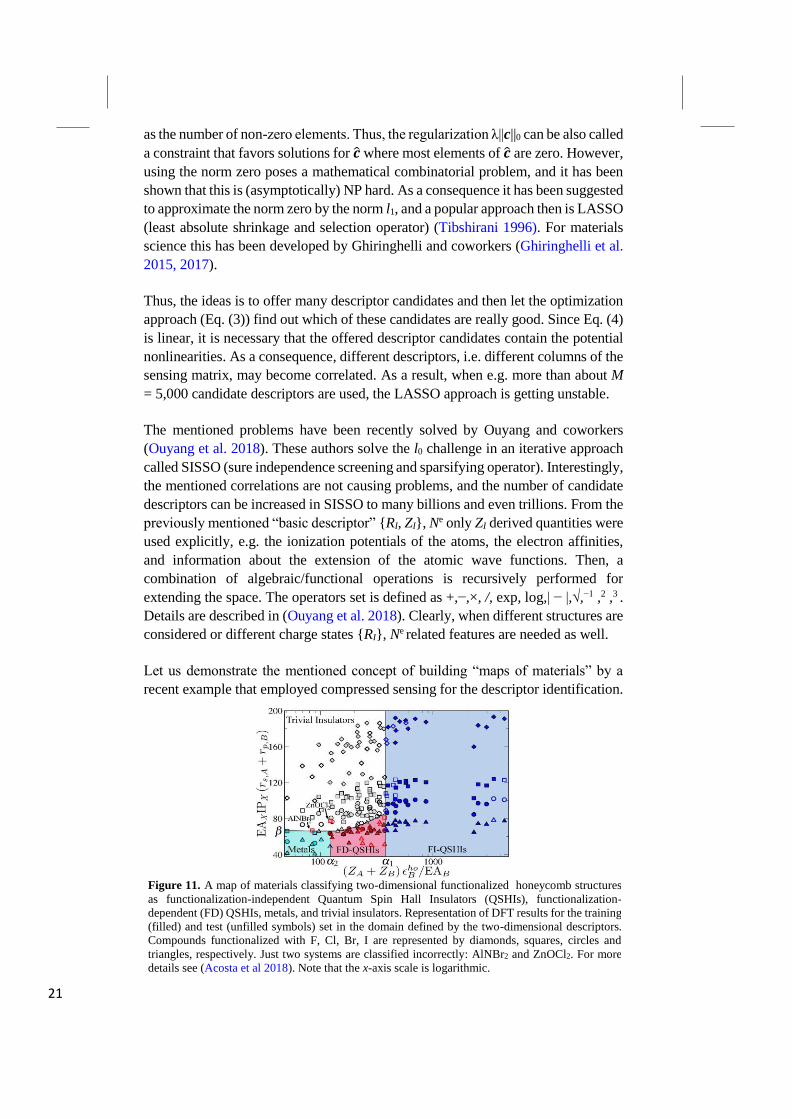
Figure 11. A map of materials classifying two-dimensional functionalized honeycomb structures
as functionalization-independent Quantum Spin Hall Insulators (QSHIs), functionalization-
dependent (FD) QSHIs, metals, and trivial insulators. Representation of DFT results for the training
(filled) and test (unfilled symbols) set in the domain defined by the two-dimensional descriptors.
Compounds functionalized with F, Cl, Br, I are represented by diamonds, squares, circles and
triangles, respectively. Just two systems are classified incorrectly: AlNBr2 and ZnOCl2. For more
details see (Acosta et al 2018). Note that the x-axis scale is logarithmic.
22
Specifically, we here summarize a recent work by Acosta and coworkers (Acosta et
al. 2018) who used the approach to build a materials map for two-dimensional
honeycomb structures in order to analyze and identify two-dimensional topological
insulators (also called quantum spin Hall insulators, QSHIs). The characteristic
symmetry-protected band inversion of QSHIs is characterized by the so-called
topological invariant, Z2. The authors calculated 220 functionalized honeycomb-
lattices that are isoelectronic to functionalized graphene. Specifically, these are built
of group IV, or III-V, or IV-VI, elements, and all atoms are bonded to
(functionalized by) a group VII element. Besides confirming the QSHI character of
well-known materials, the study revealed several other yet unreported QSHIs. In a
next step, the authors used the SISSO approach. They offered 10 million candidate
descriptors, and then SISSO identified the best low-dimensional descriptor. Figure
11 shows the map, created by the found two-dimensional descriptor. The
scientifically important point is which of the primary (atomic) features were
selected and which were not selected (see the formulas at the x- and y axis of the
figure). While these atomic properties are actuating the materials property, the
specific formulas have only limited scientific meaning as they largely reflect the
goal of a linear equation (Eq. 4). This study yields fundamental insights in the
mechanisms driving topological transitions, especially in the atypical case of
topological insulators with low spin-orbit coupling. Furthermore, the map predicts
several new QSHIs that were not part of the calculated materials. (Acosta et al.
2018)
6. Outlook
Computational materials science took off with impressive early work by Moruzzi,
Janak, and Williams (Moruzzi et al. 1978) on various properties of metals and by
Cohen and coworkers (Yin 1982) on the cohesion and phase transition of silicon
and germanium13. A number of computer codes for solving the Kohn-Sham
equations have been developed since them, initially involving approximations like
pseudopotentials (removing the core electrons, creating smooth potentials) or
introducing touching or even overlapping atom-centered spheres in which the
potential was sphericalized. During the 1980’s significant advancements in the
original pseudopotential approach have been made (see the work of Vanderbilt and
coworkers: Garrity 2014 and references therein), and all-electron codes now treat
the “full potentials” (e.g. Blaha et al. 1990, Gulans 2014, Blum 2009). The work by
(Lejaeghere et al. 2016) provides a nice overview of the precision of modern
electronic-structure codes for elemental bulk solids. Clearly, this kind of work is
important and needs to be extended to more complicated structures and
compositions, defects, surfaces, and interfaces. Work in this direction is underway,
as are studies for advanced electronic-structure methods, like e.g. the GW approach
(van Setten et al. 2015). Furthermore the field urgently needs benchmarks for the
various numerical approximations and for exchange-correlations potentials in order
to address also accuracy, not only numerical precision. The MSE (materials science
13 See the chapter by M. Cohen in this handbook, in particular Fig. 4 (Cohen 2018).
23
and engineering) project is a first step (Zhang et al. 2018).
Computational materials science is still dominated by the third paradigm (cf. Fig.
1), but advancements in AI methods has been significant in recent years, and the
fourth paradigm is playing an increasing role. Still, at present there is more hype
than realism in what AI can do. Much of this relates to the domain-specific standards
and requirements of materials science and engineering. Machine-learning
techniques can already now help a lot when general trends are of interest and when
one needs to fit and predict “the behavior of a big crowd” (see e.g. the methods used
in the Kaggle competition for predicting properties of transparent conductors
(Kaggle/NOMAD2018). Usually, the exciting questions in materials science and
engineering are, however, different: We are typically not looking for a crowd
behavior but we are searching for materials with extraordinary performance on
certain functions or properties, often even a combination of several properties.
There are typically just ten or a few hundred materials in the enormous number of
possible options. Thus, the number of relevant data is rather small, and the few
materials that we are searching for are statistically exceptional. How can we
distinguish which data / materials are relevant and which are not? Learning about
less than 0.01% relevant materials from thousands or millions of irrelevant data is
obviously problematic, and standard methods, that optimize the regularized root-
mean-square-error, even emphasize the importance of the irrelevant data, while
surpassing the special cases. Here advancements of subgroup discovery are urgently
needed.
The field is just developing the methods for the 4th paradigm. The learning curve
connecting paradigms 1, 2, 3 and 4 is apparently getting steep. Thus the next
paradigm may be close, even though the 4th has not been developed well. What
could be the next paradigm? Considering that “the future is already here – it's just
not very evenly distributed” (Gibson 1993), it may hintingly visible already today.
We guess that it may be virtual reality with direct and instantaneous connection to
new calculations or a merger of theory (predictions and analysis) and experiment.
What is urgently missing at present? Let us list some topics:
o Close coupling of materials property prediction with stability analysis and
prediction of routes towards synthesis;
o High-throughput studies of metastable materials and the lifetime of these
metastable states;
o Materials under real conditions (T, p, and reactive environment): stability
and properties. This very much concerns multiscale modeling with robust,
error-controlled links with knowledge of uncertainty between the various
simulation methodologies – often stated in the past but still not fully
realized;
o Error estimates of calculations in terms of numerical approximations (basis
sets, pseudopotentials, etc.) for specific properties (structure, elastic and
electronic properties, etc.);
24
o Computations beyond standard DFT: coupled cluster methods and
calculations for solids (possibly also getting prepared for quantum
computers) and quantum Monte Carlo approaches;
o Complete description of scientific results accounting for the heterogenity
of data: still metadata are missing. While significant progress has been
made toward transformation of computational data from the many
computer codes and the development of corresponding metadata
(Ghringhelli et al. 206, 2017, NOMAD Metainfo) the advantage will only
fully become apparent when the same will have been achieved also for
experimental data. The latter challenge is even bigger than the first. The
sample material used in the experimental study corresponds to the input file
of a calculation; the experimental condition (T, p, environment) and the
experimental equipment to the computer code. The not fully solved
challenge is the definition of the sample materials.
Clearly, the discovery of improved and novel – not just new – materials or unknown
properties of known materials to meet specific scientific or industrial requirements
is one of the most exciting and economically important applications of high-
performance computing (HPC). The prosperity and lifestyle, including important
developments in the health sector, of our society depend on materials to that enable
such developments. The field is very active to meet these challenges and indeed
experiences significant advances in the needed methodologies. There are exciting
times ahead of us.
Acknowledgements
We gratefully acknowledge helpful discussions with Luca Ghiringhelli, Mario
Boley, and Sergey Levchenko. This work received funding from the European
Union’s Horizon 2020 Research and Innovation Programme, Grant Agreement No.
676580, the NOMAD Laboratory CoE and No. 740233, ERC: TEC1P. Support
from the Einstein Foundation Berlin is appreciated. We thank P. Wittenburg for
clarification of the FAIR concept, and the whole NOMAD team (NOMAD) for the
invaluable effort to build the entire NOMAD infrastructure and its services.
References
Acosta CM, Panahian SJ, Ouyang R, Fazzio A, Scheffler M, Ghiringhelli LM, Carbogno C,
https://ArXiv....
AFLOW; Automatic FLOW for materials discovery, http://aflowlib.org/; see (Troher 2018)in this
handbook of materials modeling, and (Curtarolo 2012, Calderon 2015)
Agrawal A. and Choudhary A. (2016) Perspective: Materials informatics and big data: Realization of
the “fourth paradigm” of science in materials science. APL Materials 4:053208 (2016) doi:
10.1063/1.4946894
Alder BJ, Wainwright TE (1958) Molecular Dynamics by Electronic Computers. In: Prigogine I (ed)
International Symposium on Transport Processes in Statistical Mechanics, John Wiley Int.,
New York, 97-131
Alder BJ, Wainwright TE (1962) Phase Transition in Elastic Disks. Phys. Rev. 127:359-361
25
Alder BJ, Wainwright TE (1970) Decay of velocity autocorrelation function. Phys Rev A 1:18-21
Atzmueller M (2015) WIREs Data Min. Knowl. Discovery 5:35
Blaha P, Schwarz K, Sorantin P, Trickey S.B. (1990), Full-potential, linearized augmented plane wave
programs for crystalline systems. Comp Phys Commun. 59:399
Blum V, Gehrke R, Hanke F, Havu P, Havu V, Ren X, Reuter K, Scheffler M (2009) Ab initio
molecular simulations with numeric atom-centered orbitals. Comput. Phys Commun, 180:2175-
2196
Blank TB, Brown SD, Calhoun AW, Doren DJ (1995) Neural network models of potential energy
surfaces. J. Chem. Phys. 103:4129; doi: 10.1063/1.469597Blokhin E, Villars P (2018) The
PAULING FILE Project and Materials Platformfor Data Science: From Big Data Toward
Materials Genome. Chapter in this handbook of materials modeling
Boley (2017) Provite communications. In the figure, the Gaussian radial basis function (rbf) kernel
was used plus a 0.1 noise component: k(a,b)=rbf(a,b | scale=0.2) + 0.1 delta(a,b).
Candès EJ, Wakin MB (2008) An introduction to compressive sampling, IEEE Signal Proc. Mag.
25:21
Candro EJ, Romberg J, and Tao T (2006) Robust uncertainty principles: Exact signal reconstruction
from highly incomplete frequency information, IEEE Trans. Inf. Theory 52:489
CMR – Computational Materials Repository, https://cmr.fysik.dtu.dk/
Cohen ML (2018) Modeling Solids and Its Impact on Science and Technology. Chapter in this
handbook of materials modeling
Draxl C and Scheffler M (2018) NOMAD: The FAIR Concept for Big-Data-Driven Materials
Science. MRS Bulletin 43:676
Calderon CE, Plata JJ, Toher C, Oses C, Levy O, Fornari M, Natan A, Mehl MJ, Hart G, Nardelli
MB, Curtarolo S (2015) The AFLOW standard for high-throughput materials science
calculations. Comp. Mat. Sci. 108:233
Candès EJ, Wakin MB /2008) An introduction to compressive sampling, IEEE Signal Proc. Mag.
25:21
Candès EJ, Romberg J, Tao T (2006) Robust uncertainty principles: Exact signal reconstruction from
highly incomplete frequency information, IEEE Trans. Inf. Theory 52:489.Carbogno C,
Thygesen KS, Bieniek B, Drax C, Ghiringhelli LM, Gulans A, Hofmann OT, Jacobsen KW,
Lubeck S, Mortensen JJ, Strange M, Wruss E, and Scheffler M (2018) Numerical Quality
Control for DFT{based Materials Databases. https://.. ArXiV
Ceriotti M, Willatt MJ, Csányi G (2018) Machine Learning of Atomic-Scale Properties Based on
Physical Principles. Chapter in this handbook of materials modeling
Curtarolo S, Setyawan W, Hart GLW, Jahnatek M, Chepulskii RV (2012) AFLOW: An automatic
framework for high-throughput materials discovery. Comp. Mat. Sci. 58:218
Richard H. Taylor a, Shidong Wanga, Junkai Xue a, Kesong Yang a, Ohad Levy d, Michael J. Mehl e,
Harold T. Stokes c, Denis O. Demchenko f, Dane Morgan g
Donoho DL (2006), Compressed sensing. IEEETrans. Inform.Theory 52:1289
Duivesteijn W, Feelders AJ, Knobbe A (2016) Data Min. Knowl. Discovery 30:47
Draxl C, Illas F, Scheffler M (2017) Open data settled in materials theory. Nature 548:523
Friedman JH, Fisher NI (1999) Stat. Comput. 9:123
Garrity KF, Bennett JW, Rabe KM, Vanderbilt D (2014) Pseudopotentials for high-throughput DFT
calculations. Comput Mater Sci 81: 446-452
Ghiringhelli LM, Vybiral J, Levchenko SV, Draxl C, Scheffler M (2015) Big Data of Material
Science: Critical Role of The Descriptor. Phys Rev Lett 114:105503.
doi:10.1103/PhysRevLett.114.105503.
Ghiringhelli LM, Carbogno C, Levchenko S, Mohamed F, Huhs G, Lüder M, Oliveira M, Scheffler M
(2016) Towards a Common Format for Computational Materials Science Data. Psi-k Scientific
Highlight of the Month No. 131. http://psi-k.net/download/highlights/Highlight_131.pdf.
Accessed 30 Oct 2018
Ghiringhelli LM, Carbogno C, Levchenko S, Mohamed F, Hus G, Lüder M, Oliveira M, Scheffler M
(2017) Towards Efficient Data Exchange and sharing for Big-Data Driven Materials Science:
Metadata and Data Formats. npj Comput Mater 3:46. doi:10.1038/s41524-017-0048-5
26
Ghiringhelli LM, Vybiral J, Ahmetcik E, Ouyang R, Levchenko SV, Draxl C, Scheffler M (2017)
Learning physical descriptors for material science by compressed sensing. New J. Phys.
19:023017
Gibson WF (1999) “The Science in Science Fiction” on Talk of the Nation (30 November 1999,
Timecode 11:55). Available via NPR. https://www.npr.org/2018/10/22/1067220/the-science-in-
science-fiction or https://www.npr.org/programs/talk-of-the-nation/1999/11/30/12966633/
Goldsmith BR, Boley M, Vreeken J, Scheffler M, and Ghiringhelli LM (2017) Uncovering structure-
property relationships of materials by subgroup discovery. New J. Phys. 19:013031
Gray J (2007) The concept of a fourth paradigm was probably first discussed by J. Gray at a workshop
on 11. Januar 2007 before he went missing at the pacific on January 28, 2007. See: Hey T,
Tansley S, Tolle K (eds) (2009) The Fourth Paradigm, Data Intensive Discovery. Microsoft
Research, Redmond, Washington 2009, ISBN 978-0-9825442-0-4
Gražulis S, Merkys S, Vaitkus A (2018) Crystallography Open Database (COD). Chapter in this
handbook of materials modeling
Hedin L (1965) New Method for Calculating the One-Particle Green's Function with Application to
the Electron-Gas Problem. Phys. Rev. 139:A796
Hellström M, Behler J (2018) Neural Network Potentials in Materials Modeling. Chapter in this
handbook of materials modeling
Herrera F, Carmona CJ, González P, del Jesus MJ (2011) Knowl. Inf. Syst. 29:495
Hinton GE (2006) Reducing the Dimensionality of Data with Neural Networks. Sci. 313:504–507
http://www.sciencemag.org/cgi/doi/10.1126/science.1127647. DOI 10.1126/science.1127647
Hinton GE, Osindero, S. & Teh, Y.-W. (2006) A Fast Learning Algorithm for Deep Belief Nets.
Neural Comput. 18:1527; DOI 10.1162/neco.2006.18.7.1527
Hohenberg P, Kohn W (1964) Inhomogeneous Electron Gas. Phys Rev
136:B864doi:10.1103/PhysRev.136.B864.
Huang B, Symonds NO, von Lilienfeld OA (2018) Quantum Machine Learning in Chemistry and
Materials. Chapter in this handbook of materials modeling
Jain A, Ong SP, Hautier G, Chen W, Richards WD, Dacek S, Cholia S, Gunter D, Skinner D, Ceder
G, Persson KA (2013) The Materials Project: A materials genome approach to accelerating
materials innovation. APL Mater 1:011002. doi:10.1063/1.4812323
Jain A, Montoya J, Dwaraknath S, Zimmermann NER, Dagdelen J, Horton M, Huck P, Winston D,
Cholia S, Ong SP, Persson K (2018) TheMaterials Project: Accelerating Materials
Design Through Theory-Driven Data and Tools. Chapter in this handbook of materials modeling
Kaggle/Nomad2018 (2018), Predicting Transparent Conductors - Predict the key properties of novel
transparent semiconductors https://www.kaggle.com/c/nomad2018-predict-transparent-
conductors
Klösgen W (1996) Advanced Techniques in Knowledge Discovery and Data Mining (Menlo Park,
CA: American Association for Artificial Intelligence) pp 249
Kohn W, Sham LJ (1965) Self-Consistent Equations Including Exchange and Correlation Effects.
Phys Rev 140:A1133-A1138 doi:10.1103/PhysRev.140.A1133
Lejaeghere K, Bihlmayer G, Björkamn T, Blaha P, Blügel S, Blum V, Caliste D, Castelli IE, Clark SJ,
Corso AD, de Gironcoli S, Deutsch T, Dewhurst JK, Di Marco I, Draxl C, Dulak M, Eriksson O,
Flores-Livas JA, Garrity KF, Genovese L, Giannozzi P, Giantomassi M, Goedecker S, Gonze X,
Grånäs O, Gross EKU, Gulans A, Gygi F, Hamann DR, Hasnip PJ, Holzwarth NAW, Iuşan D,
Jochym DB, Jollet F, Jones D, Kresse G, Koepernik K, Küçükbenli E, Kvashnin YO, Locht
ILM, Lubeck S, Marsman M, Marzari N, Nitzsche U, Nordström L, Ozaki T, Paulatto L, Pickard
CJ, Poelmans W, Probert MIJ, Refson K, Richter M, Rignanese G-M, Saha S, Scheffler M,
Schlipf M, Schwarz K, Sharma S, Tavazza F, Thunström P, Tkatchenko A, Torrent M,
Vanderbildt D, van Setten MJ, Speyvroeck VV, Wills JM, Yates JR, Zhang G-X, Cottenier S
(2016) Reproducibility in density functional theory calculations of solids. Science 351:aad3000.
doi:10.1126/science.aad3000Li L, Burke K (2018) Recent Developments in Density Functional
Approximations. Chapter in this handbook of materials modeling
Lorenz S, Groß A, Scheffler M (2004) Representing high-dimensional potential-energy surfacesfor
reactions at surfaces by neural networks. Chem. Phys. Lett. 395:210Lorenz S, Scheffler M, Groß
27
A (2006) Descriptions of surface chemical reactions using a neural network representation of the
potential-energy surface. Phys. Rev. B 73:115431
Materials Project, https://materialsproject.org. Accessed 30 Oct 2018 see (Jain 2013) and the chapter
by (Jain 2018) in this handbook of materials modeling
Mazheika A, Wang Y, Ghiringhelli LM, Illas F, Levchenko SV, and Scheffler M (2018) Ab initio
data analytics study of carbon-dioxide activation on semiconductor oxide surfaces.
https://ArXiV
Metropolis N, Rosenbluth AW, Rosenbluth MN, Teller E (1953) Equation of state calculations by fast
computing machines. J Chem Phys 21:1087. doi:10.1063/1.1699114
Moruzzi VL, Janak JF, Williains AR (1978) Calculated Electronic Properties of Metals. Pergamon,
New York
Nature editorial (2017) Not-so-open data. NATURE 546:327; Empty rhetoric over data sharing slows
science https://www.nature.com/news/empty-rhetoric-over-data-sharing-slows-science-1.22133.
Nelson IJ, Hart GLW, Zhou F, Ozolins V (2013) Compressive sensing as a paradigm for building
physics models. Phys. Rev. B 87:035125NOMAD, The NOMAD (Novel Materials Discovery)
Center of Excellence (CoE) was launched in November 2015. https://nomad-coe.eu,
https://youtu.be/yawM2ThVlGw. Accessed 30 Oct 2018
NOMAD Meta Info, The metadata structure defined for the NOMAD Laboratory (called NOMAD
Meta Info) is a conceptual model to store results from ab initio and force-field atomistic
calculations. https://www.nomad-coe.eu/the-project/nomad-archive/archive-meta-info
OQMD, Open Quantum Materials Database. http://oqmd.org/. Accessed 30 Oct 2018 see (Saal et al.
2013)
Ouyang R, Curtarolo S, Ahmetcik E, Scheffler M, and Ghiringhelli LM (2018) SISSO: a
compressed-sensing method for identifying the best low-dimensional descriptor in an
immensity of offered candidates . Phys. Rev. Mat. 2:083802
Pearl J (2009) Causality: Models, Reasoning and Inference. Cambridge University Press; 2nd edition
(September 14, 2009)
Pizzi G (2018) Open-Science Platform for Computational Materials Science: AiiDA and theMaterials
Cloud. Chapter in this handbook of materials modelingPsi-k network, The Psi-k network is concerned
with ab initio (from electronic structure) calculations of complex processes in materials.
http://psi-k.net/. Accessed 30 Oct 2018
Pyykkö P (2012) The Physics behind Chemistry and the Periodic Table. Chem. Rev. 2012, 112, 371–
384. dx.doi.org/10.1021/cr200042e.
Rahman A (1964) Correlations in the Motion of Atoms in Liquid Argon. Phys Rev 136:A405-A411.
doi:10.1103/PhysRev.136.A405.
Reuter K, Stampfl C, Scheffler M (2005) Ab Initio Atomistic Thermodynamics and Statistical
Mechanics of Surface Properties and Functions. In: Yip S (ed) Handbook of Materials Modeling.
Springer, Dordrecht, p 149-194.
Saal J, Kirklin S Aykol M Meredig B, Wolverton C (2013) Materials Design and Discovery with
High-Throughput Density Functional Theory: The Open Quantum Materials Database (OQMD).
JOM 65:1501; DOI: 10.1007/s11837-013-0755-4
Scerri ER (2008) The Periodic Table: Its Story and Its Significance. Oxford University Press, Inc,
New York, USA, ISBN 978-0-19-530573-9.
Siebes A (1995) Data surveying foundations of an inductive query language KDD (Montreal, Canada:
AAAI Press) pp 269
Slater JC (1937) Wave Functions in a Periodic Potential. Phys Rev 51:846
Slater JC (1953) An Augmented Plane Wave Method for the Periodic Potential Problem. Phys Rev
92:603
Slater JC (1965) Quantum theory of molecules and solids. Vol. 2, Symmetry and energy bands in
crystals.McGraw-Hill, New York)
Slater JC (1967) Quantum theory of molecules and solids. Vol. 3, Insulators, semiconductors and
metals. McGraw-Hill, New York)
Slater JC, Johnson KH (1972) Self-Consistent-Field Xα Cluster Method for Polyatomic Molecules
and Solids. Phys Rev B 5:844
Sutton C, Ghiringhelli L.M., Yamamoto T, Lysogorskiy Y, Blumenthal L, Hammerschmidt T,
28
Golebiowski J, Liu X, Ziletti A, and Scheffler M (2018) NOMAD Kaggle Competition: Solving
Materials Science Challenges Through Crowd Sourcing
Tibshirani R (1996) Regression shrinkage and selection via the Lasso, J. R. Stat. Soc. Ser. B 58:267
Toher C, Oses C, Hicks D, Gossett E, Rose F, Nath P, Usanmaz P, Ford DC, Perim E, Calderon CE,
Plata JJ, Lederer Y, Jahnátek M, Setyawan W, Wang S, Xue J, Rasch K, Chepulskii RV, Taylor
RH, Gomez G, Shi H, Supka AR, Rabih Al Rahal Al Orabi, Gopal P, Cerasoli FT, Liyanage L,
Wang H, Siloi I, Agapito LA, Nyshadham C, Hart GLW, Carrete J, Legrain FL, Mingo N, Zurek
E, Isayev O, Tropsha A, Sanvito S, Hanson RM, Takeuchi I, Mehl MJ, Kolmogorov AN, Yang
K, D’Amico P, Calzolari A, Costa M, De Gennaro R, Nardelli MB (2018) The AFLOWFleet
forMaterials Discovery. Chapter in this handbook of materials modeling
van Setten MJ, Caruso F, Sharifzadeh S, Ren X, Scheffler M, Liu F, Lischner J, Lin L, Deslippe JR,
Louie SG, Yang C, Weigend F, Neaton JB, Evers F, Rinke P (2015) GW100: Benchmarking
G0W0 for Molecular Systems. J Chem Theory Comput 11:5665. doi:10.1021/acs.jctc.5b00453
Wilkinson MD, Dumontier M, Aalbersberg IJ, Appleton G, Axton M, Baak A, Blomberg N, Boiten
JW, da Silva Santos LB, Bourne PE, Bouwman J, Brookes AJ, Clark T, Crosas M, Dillo I,
Dumon O, Edmunds S, Evelo CT, Finkers R, Gonzalez-Beltran A, Gray AJG, Groth P, Goble C,
Grethe JS, Heringa J, ’t Hoen PAC, Hooft R, Kuhn T, Kok R, Kok J, Lusher SJ, Martone ME,
Mons A, Packer AL, Persson B, Rocca-Serra P, Roos M, van Schaik R, Sansone S-A, Schultes
E, Sengstag T, Slater T, Strawn G, Swertz MA, Thompson M, van der Lei J, van Mulligen E,
Velterop J, Waagmeester A, Wittenburg P, Wolstencroft K, Zhao J, Monsal B (2016) The FAIR
Guiding Principles for scientific data management and stewardship. Sci Data 3:160018
Wrobel S (1997) An algorithm for multi-relational discovery of subgroups inPrinciples of Data
Mining and Knowledge Discovery: First European Symp., PKDD‘97 (Trondheim, Norway, 24–
27 June 1997) ed J Komorowski and J Zytkow (Berlin: Springer) pp 78
Yin MT, Cohen ML (1982) Theory of static structural properties, crystal stability, and phase
transformations: Application to Si and Ge. Phys Rev B 26:5668
Zhang IY, Logsdail AJ, Ren X, Levchenko SV, Ghiringhelli L, Scheffler M (2018) Test set for
materials science and engineering with user-friendly graphic tools for error analysis: Systematic
benchmark of the numerical and intrinsic errors in state-of-the-art electronic-structure
approximations. Available via arxiv.org. https://arxiv.org/pdf/1808.09780.pdf. Accessed 30 Oct
2018; test set web page at http://mse.fhi-berlin.mpg.de/