ASSESSING THE SUSTAINABILITY OF CROP PRODUCTION IN …
12
© by PSP Volume 28 – No. 4/2019 pages 2511-2522 Fresenius Environmental Bulletin 2511 ASSESSING THE SUSTAINABILITY OF CROP PRODUCTION IN THE GEDIZ BASIN, TURKEY: A WATER, ENERGY, AND FOOD NEXUS APPROACH Adnan Degirmencioglu 1,* , Rabi H Mohtar 2,3 , Bassel T Daher 2 , Gulden Ozgunaltay-Ertugrul 4 , Omer Ertugrul 4 1 Ege University, Faculty of Agriculture, Department of Agricultural Engineering and Technology, Bornova, Izmir, Turkey 2 Texas A&M University, Department of Biological and Agricultural Engineering, College Station-Texas, 77843, USA 3 Faculty of Agriculture and Food Sciences, American University of Beirut, Beirut 1107 2020, Lebanon 4 KirsehirAhi Evran University, Faculty of Agriculture, Department of Biosystems Engineering, Kirsehir, 40100, Turkey ABSTRACT This study assesses the sustainability of crop production system in Gediz Basin, Turkey and develops forward-looking scenarios for optimal utilization and sustainable allocation of its re- sources using the water, energy, and food (WEF) Nexus holistic systems approach. Gediz basin data for the year 2014 are used to analyze the current situation and to develop future scenarios, including climate change, urbanization, changes in water sources, and technological developments in the field of agricultural production. The study results indicate that reduction in land availability as a con- sequence of urbanization and increased water scar- city due to climate change are inevitable. Moreover, sustainably maintaining current levels of agricultur- al production requires that serious consideration be given to the selection of drought resistant varieties and new farming practices, such as direct planting to reduce energy use and drip irrigation systems to save water. KEYWORDS: Crop production, water requirement, fuel consumption, climate change, land use, agricultural technologies INTRODUCTION Globally, agriculture accounts for about 70% of water use [1]. Agriculture is also an important input for energy production. With water and energy as inputs, it is possible to manufacture bio-energy products or to recycle energy through biomass [2, 3]. Thus, water, energy, and food resource systems are tightly interconnected and interdependent [4]. As it is increasingly apparent through sudden changes in weather patterns, rainfall amounts, and temperature increases, climate change will continue to affect agricultural production levels, bringing forward risks that cannot be overlooked: increased environmental awareness in agricultural operations necessitates the use of machinery and technologies with more intricate applications [5]. With growing pressures to produce food for growing populations globally, there is a need for better understanding and quantifying its interlink- ages with water and energy systems [6, 7, 8, 9]. Water assets vary around the world, even within regions of a given country [10]. With regard to quality, water can be categorized into three catego- ries: blue, green, and grey. As a result of this classi- fication, a map of water assets of 50 countries around the world was drawn and virtual water flow maps were created between countries. As sources of irrigation, blue and green water have an important role in agriculture. Blue water is defined as the rivers, lakes, underground, and aquifer water. Green water is accepted as rainfall water stored in the soil. Grey water is defined as water that is somewhat polluted, i.e. waste water, but which can be brought to utilizable standards by processing [11]. Through food trade, virtual water gets imported and export- ed: the export of water and the physical utilization of water resources by the exporting country saves water for the importing country [12]. In this sense, on a global scale, Japan has 134 Gm 3 /year (80% green, 9% blue, and 12% grey water). Mexico and Italy follow at 83 and 54 Gm 3 /year, respectively, as water saving countries [13]. Turkey, United States of America, India, Aus- tralia, Uzbekistan, and China, make up 49% of the virtual global blue water export [13]. It has been stated that these countries are, albeit partially, dis- tressed when it comes to water [14, 15, 16]. In light of this information, the sustainability and efficiency of using limited water resources in the face of such copious amounts of virtual water exports can be questioned [13]. Moving from a global context to the national level, countries need to identify poli- cies, which would ensure the optimal use of exist- ing natural resources as it plans for meeting food demands of its future populations [17]. According- ly, it is also needed to understand the regional and transboundary impact of such policies [18, 19].
Transcript of ASSESSING THE SUSTAINABILITY OF CROP PRODUCTION IN …

© by PSP Volume 28 – No. 4/2019 pages 2511-2522 Fresenius Environmental Bulletin
2511
ASSESSING THE SUSTAINABILITY OF CROP
PRODUCTION IN THE GEDIZ BASIN, TURKEY: A WATER,
ENERGY, AND FOOD NEXUS APPROACH
Adnan Degirmencioglu1,*, Rabi H Mohtar2,3, Bassel T Daher2,
Gulden Ozgunaltay-Ertugrul4, Omer Ertugrul4
1Ege University, Faculty of Agriculture, Department of Agricultural Engineering and Technology, Bornova, Izmir, Turkey
2Texas A&M University, Department of Biological and Agricultural Engineering, College Station-Texas, 77843, USA 3Faculty of Agriculture and Food Sciences, American University of Beirut, Beirut 1107 2020, Lebanon
4KirsehirAhi Evran University, Faculty of Agriculture, Department of Biosystems Engineering, Kirsehir, 40100, Turkey
ABSTRACT
This study assesses the sustainability of crop
production system in Gediz Basin, Turkey and
develops forward-looking scenarios for optimal
utilization and sustainable allocation of its re-
sources using the water, energy, and food (WEF)
Nexus holistic systems approach. Gediz basin data
for the year 2014 are used to analyze the current
situation and to develop future scenarios, including
climate change, urbanization, changes in water
sources, and technological developments in the
field of agricultural production. The study results
indicate that reduction in land availability as a con-
sequence of urbanization and increased water scar-
city due to climate change are inevitable. Moreover,
sustainably maintaining current levels of agricultur-
al production requires that serious consideration be
given to the selection of drought resistant varieties
and new farming practices, such as direct planting
to reduce energy use and drip irrigation systems to
save water.
KEYWORDS:
Crop production, water requirement, fuel consumption,
climate change, land use, agricultural technologies
INTRODUCTION
Globally, agriculture accounts for about 70%
of water use [1]. Agriculture is also an important
input for energy production. With water and energy
as inputs, it is possible to manufacture bio-energy
products or to recycle energy through biomass [2,
3]. Thus, water, energy, and food resource systems
are tightly interconnected and interdependent [4].
As it is increasingly apparent through sudden
changes in weather patterns, rainfall amounts, and
temperature increases, climate change will continue
to affect agricultural production levels, bringing
forward risks that cannot be overlooked: increased
environmental awareness in agricultural operations
necessitates the use of machinery and technologies
with more intricate applications [5].
With growing pressures to produce food for
growing populations globally, there is a need for
better understanding and quantifying its interlink-
ages with water and energy systems [6, 7, 8, 9].
Water assets vary around the world, even within
regions of a given country [10]. With regard to
quality, water can be categorized into three catego-
ries: blue, green, and grey. As a result of this classi-
fication, a map of water assets of 50 countries
around the world was drawn and virtual water flow
maps were created between countries. As sources of
irrigation, blue and green water have an important
role in agriculture. Blue water is defined as the
rivers, lakes, underground, and aquifer water. Green
water is accepted as rainfall water stored in the soil.
Grey water is defined as water that is somewhat
polluted, i.e. waste water, but which can be brought
to utilizable standards by processing [11]. Through
food trade, virtual water gets imported and export-
ed: the export of water and the physical utilization
of water resources by the exporting country saves
water for the importing country [12]. In this sense,
on a global scale, Japan has 134 Gm3/year (80%
green, 9% blue, and 12% grey water). Mexico and
Italy follow at 83 and 54 Gm3/year, respectively, as
water saving countries [13].
Turkey, United States of America, India, Aus-
tralia, Uzbekistan, and China, make up 49% of the
virtual global blue water export [13]. It has been
stated that these countries are, albeit partially, dis-
tressed when it comes to water [14, 15, 16]. In light
of this information, the sustainability and efficiency
of using limited water resources in the face of such
copious amounts of virtual water exports can be
questioned [13]. Moving from a global context to
the national level, countries need to identify poli-
cies, which would ensure the optimal use of exist-
ing natural resources as it plans for meeting food
demands of its future populations [17]. According-
ly, it is also needed to understand the regional and
transboundary impact of such policies [18, 19].
© by PSP Volume 28 – No. 4/2019 pages 2511-2522 Fresenius Environmental Bulletin
2512
The main objectives of this study were to
determine the sustainability of the current
agricultural system in the Gediz Basin, Turkey; and
develop sustainable allocation and forward-looking
scenarios for optimal utilization of its resources
using the WEF Nexus holistic system approach.
MATERIALS AND METHODS
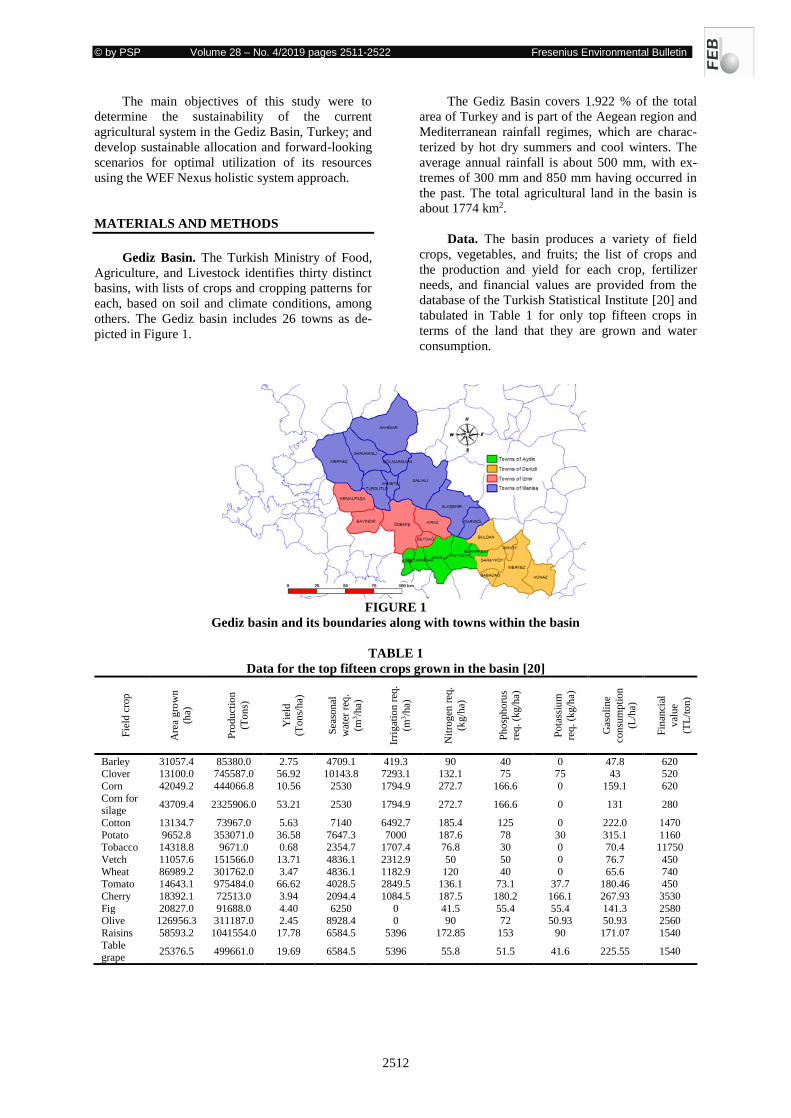
Gediz Basin. The Turkish Ministry of Food,
Agriculture, and Livestock identifies thirty distinct
basins, with lists of crops and cropping patterns for
each, based on soil and climate conditions, among
others. The Gediz basin includes 26 towns as de-
picted in Figure 1.
The Gediz Basin covers 1.922 % of the total
area of Turkey and is part of the Aegean region and
Mediterranean rainfall regimes, which are charac-
terized by hot dry summers and cool winters. The
average annual rainfall is about 500 mm, with ex-
tremes of 300 mm and 850 mm having occurred in
the past. The total agricultural land in the basin is
about 1774 km2.
Data. The basin produces a variety of field
crops, vegetables, and fruits; the list of crops and
the production and yield for each crop, fertilizer
needs, and financial values are provided from the
database of the Turkish Statistical Institute [20] and
tabulated in Table 1 for only top fifteen crops in
terms of the land that they are grown and water
consumption.
FIGURE 1
Gediz basin and its boundaries along with towns within the basin
TABLE 1
Data for the top fifteen crops grown in the basin [20]
Fie
ld c
rop
Are
a g
row
n
(ha)
Pro
du
ctio
n
(To
ns)
Yie
ld
(To
ns/
ha)
Sea
sonal
wat
er r
eq.
(m3/h
a)
Irri
gat
ion r
eq.
(m3/h
a)
Nit
rog
en r
eq.
(kg/h
a)
Ph
osp
ho
rus
req
. (k
g/h
a)
Po
tass
ium
req
. (k
g/h
a)
Gas
oli
ne
con
sum
pti
on
(L/h
a)
Fin
anci
al
val
ue
(TL
/ton
)
Barley 31057.4 85380.0 2.75 4709.1 419.3 90 40 0 47.8 620 Clover 13100.0 745587.0 56.92 10143.8 7293.1 132.1 75 75 43 520
Corn 42049.2 444066.8 10.56 2530 1794.9 272.7 166.6 0 159.1 620
Corn for silage
43709.4 2325906.0 53.21 2530 1794.9 272.7 166.6 0 131 280
Cotton 13134.7 73967.0 5.63 7140 6492.7 185.4 125 0 222.0 1470
Potato 9652.8 353071.0 36.58 7647.3 7000 187.6 78 30 315.1 1160
Tobacco 14318.8 9671.0 0.68 2354.7 1707.4 76.8 30 0 70.4 11750
Vetch 11057.6 151566.0 13.71 4836.1 2312.9 50 50 0 76.7 450
Wheat 86989.2 301762.0 3.47 4836.1 1182.9 120 40 0 65.6 740 Tomato 14643.1 975484.0 66.62 4028.5 2849.5 136.1 73.1 37.7 180.46 450
Cherry 18392.1 72513.0 3.94 2094.4 1084.5 187.5 180.2 166.1 267.93 3530
Fig 20827.0 91688.0 4.40 6250 0 41.5 55.4 55.4 141.3 2580 Olive 126956.3 311187.0 2.45 8928.4 0 90 72 50.93 50.93 2560
Raisins 58593.2 1041554.0 17.78 6584.5 5396 172.85 153 90 171.07 1540
Table grape
25376.5 499661.0 19.69 6584.5 5396 55.8 51.5 41.6 225.55 1540

© by PSP Volume 28 – No. 4/2019 pages 2511-2522 Fresenius Environmental Bulletin
2513
TABLE 2
Energy consumption for different sources of water
Energy need for water (kWh/m3)
Groundwater 0.4068
Surface water by GDSHW 0.209
Groundwater by Solar Energy Solar 0.406
TABLE 3
Carbon emissions of different sources
Carbon emissions of different sources
Diesel gasoline* 0.002357 tons CO2/L or 778 g CO2/kWh
N, P and K fertilizers** 0.0026 tons/ kg
Hydroelectric power*** 24 g CO2/kWh
Solar panel toproof*** 32 CO2/kWh
* and *** [25, 26]; **: [24]
This study also uses data provided by recent
studies [21] which include the water requirements
for all crops grown in a basin neighbouring the
Gediz basin, which has the climatic and soil
conditions. The study includes seasonal water
requirements along with the irrigation amounts for
crops, vegetables, and fruits using two different
methods: Penman-Monteith and Blaney-Criddle.
Fuel consumption is the only energy input
considered, which reflects the reality of the main
energy source for agriculture in Turkey. Data for
tractor use or time (hr/ha)spent using tractors and
fuel consumption for each crop, vegetable and fruit,
are determined and tabulated along with the tractor
use for farming operations [22, 23].
Water in the basin is provided from two
sources; it is either pumped from deep wells, or
drawn from the General Directorate of State
Hydraulic Works (GDSHW). GDSHW delivers
surface water to farmers through concrete channels,
mostly by flow of gravity. The energy consumption
for different sources of water in the basin was
calculated for per cubic meter (Table2). Carbon
emission values are given in Table3 [24, 25, 26].
Water-Energy-Food (WEF) Nexus Concept
and Methodology. Water, energy, and food are
inextricably linked to one another which require a
methodology for studying the tradeoffs between
decisions made within the three resource systems.
Water is the most important input for agricultural
crop production, but is also needed to produce
energy. On the other hand, energy is required for
many agricultural operations in the field, including
the transport of agricultural goods, and pumping
ground and surface water. The lack or intensive use
of any of these sources triggers decline in the others
and may jeopardize their security. Hence, a certain
balance among the three should be insured to
maintain the security level of each [4, 27, 28].
Consequently, to improve our understanding of the
three interconnected resources, there is a need to
quantify their interlinkages through data-driven and
quantitative modeling approaches [28, 29]. Much
research in recent years has focused on modelling
based on WEF Nexus Concept. Most of them
focused on management of a single resource such
as water resources, energy systems or planning of
agricultural production, or two resources such as
water-energy nexus [30, 31, 32, 33, 34, 35]. There
are also some studies focused on modeling of
resource allocation on water, energy and food
resources [36, 37, 38, 39, 40, 41].
WEF Nexus based modeling can increase
consistency of decision-making that put forth
sustainable resource allocation policies. In previous
studies, WEF Nexus Tool 2.0 has been developed
as a common platform to evaluate scenarios that
aim to identify strategies for sustainable resource
allocation [36, 39]. The tool provides ability to
create variable scenarios under different conditions
of water, energy and food resources. Although the
analyses of resources produce outputs as
requirements-consumptions of resources and
Carbon emissions at the national level, basin level
scenarios are needed to be created to obtain region
specific interactions of resources.
Scenarios are created to represent different
variations of water and energy inputs for products
grown in the basin and are able to calculate the
following outputs for each scenario;
• Water requirements
• Land requirements
• Energy requirements
• Carbon emissions
• Financial costs
For this purpose, a master excel sheet was
modified for each scenario by including possible
changes in land size resulting from urbanization,
water requirements affected by climate change
projections, expected changes in water portfolios
for agriculture (surface or ground water) and
technologies for pumping water from underground
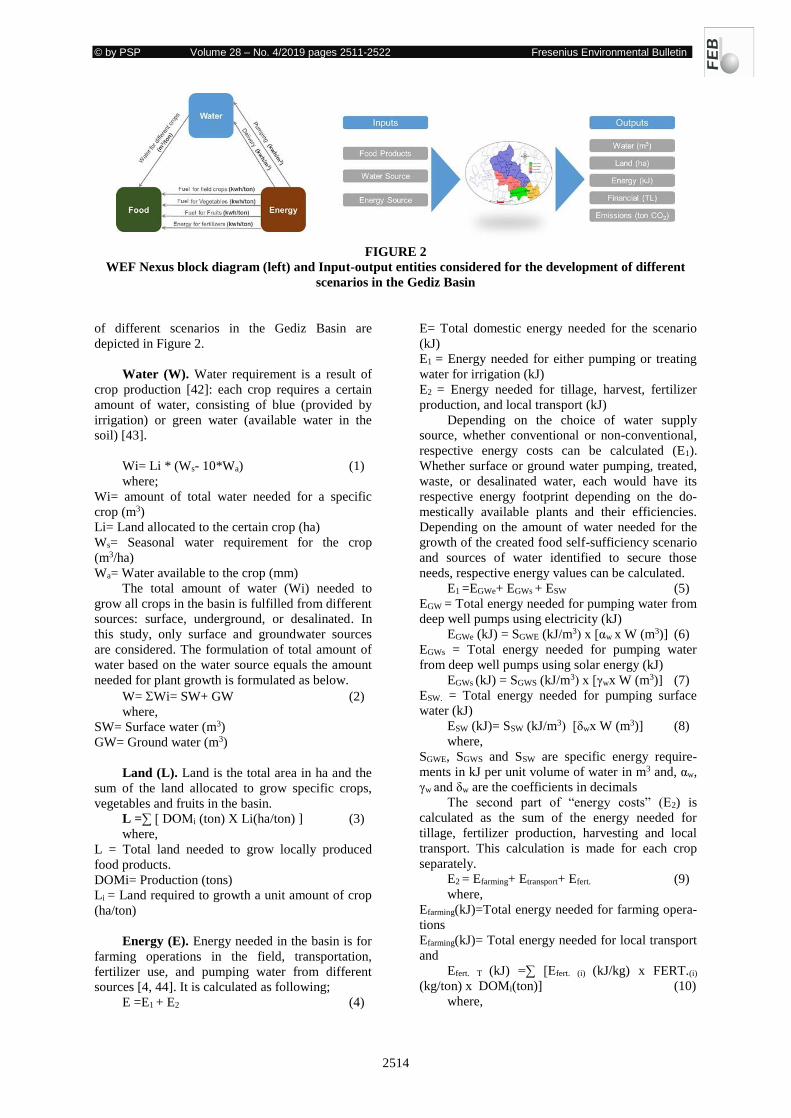
sources. The WEF Nexus block diagram, with the
input-output entities calculated for the development
© by PSP Volume 28 – No. 4/2019 pages 2511-2522 Fresenius Environmental Bulletin
2514
FIGURE 2
WEF Nexus block diagram (left) and Input-output entities considered for the development of different
scenarios in the Gediz Basin
of different scenarios in the Gediz Basin are
depicted in Figure 2.
Water (W). Water requirement is a result of
crop production [42]: each crop requires a certain
amount of water, consisting of blue (provided by
irrigation) or green water (available water in the
soil) [43].
Wi= Li * (Ws- 10*Wa) (1)
where;
Wi= amount of total water needed for a specific
crop (m3)
Li= Land allocated to the certain crop (ha)
Ws= Seasonal water requirement for the crop
(m3/ha)
Wa= Water available to the crop (mm)
The total amount of water (Wi) needed to
grow all crops in the basin is fulfilled from different
sources: surface, underground, or desalinated. In
this study, only surface and groundwater sources
are considered. The formulation of total amount of
water based on the water source equals the amount
needed for plant growth is formulated as below.
W= Wi= SW+ GW (2)
where,
SW= Surface water (m3)
GW= Ground water (m3)
Land (L). Land is the total area in ha and the
sum of the land allocated to grow specific crops,
vegetables and fruits in the basin.
L =∑ [ DOMi (ton) X Li(ha/ton) ] (3)
where,
L = Total land needed to grow locally produced
food products.
DOMi= Production (tons)
Li = Land required to growth a unit amount of crop
(ha/ton)
Energy (E). Energy needed in the basin is for
farming operations in the field, transportation,
fertilizer use, and pumping water from different
sources [4, 44]. It is calculated as following;
E =E1 + E2 (4)
E= Total domestic energy needed for the scenario
(kJ)
E1 = Energy needed for either pumping or treating
water for irrigation (kJ)
E2 = Energy needed for tillage, harvest, fertilizer
production, and local transport (kJ)
Depending on the choice of water supply
source, whether conventional or non-conventional,
respective energy costs can be calculated (E1).
Whether surface or ground water pumping, treated,
waste, or desalinated water, each would have its
respective energy footprint depending on the do-
mestically available plants and their efficiencies.
Depending on the amount of water needed for the
growth of the created food self-sufficiency scenario
and sources of water identified to secure those
needs, respective energy values can be calculated.
E1 =EGWe+ EGWs + ESW (5)
EGW = Total energy needed for pumping water from
deep well pumps using electricity (kJ)
EGWe (kJ) = SGWE (kJ/m3) x [αw x W (m3)] (6)
EGWs = Total energy needed for pumping water
from deep well pumps using solar energy (kJ)
EGWs (kJ) = SGWS (kJ/m3) x [γwx W (m3)] (7)
ESW. = Total energy needed for pumping surface
water (kJ)
ESW (kJ)= SSW (kJ/m3) [δwx W (m3)] (8)
where,
SGWE, SGWS and SSW are specific energy require-
ments in kJ per unit volume of water in m3 and, αw,
γw and δw are the coefficients in decimals
The second part of “energy costs” (E2) is
calculated as the sum of the energy needed for
tillage, fertilizer production, harvesting and local
transport. This calculation is made for each crop
separately.
E2 = Efarming+ Etransport+ Efert. (9)
where,
Efarming(kJ)=Total energy needed for farming opera-
tions
Efarming(kJ)= Total energy needed for local transport
and
Efert. T (kJ) =∑ [Efert. (i) (kJ/kg) x FERT.(i)
(kg/ton) x DOMi(ton)] (10)
where,
© by PSP Volume 28 – No. 4/2019 pages 2511-2522 Fresenius Environmental Bulletin
2515
Efert. T (kJ)=Total energy needed for producing the
required amount of fertilizer
Efert.(i) (kJ/kg) = Energy required for producing a
kg of fertilizer (depends on type of fertilizer)
FERT.(i) (kg/ton) = Amount of fertilizer applied per
ton of product (i) produced.
The total energy needed for farming is the sum
of the energy requirements for all crops in the
region and is calculated by finding the fuel
consumption to grow a given crop, for example
cotton, starting with soil tillage and ending with
harvest and transportation. Field operations vary
from one crop to another as each crop, vegetable
and fruit has its own characteristics that alter
farming operations. Vegetable and fruit production
in Turkey generally, and in the Gediz Basin
specifically, are mostly labor dependent; the
farming operations for field crops are mostly
mechanized. Fruits and vegetables are more labor
dependent and harvested by pickers or other special
harvesters. In this study, farming operations such as
tillage by plough, harrowing (seedbed preparation
equipment), planting or transplanting, spraying,
fertilizer distribution, hoeing and irrigation
operations, and harvesting for each crop, vegetable
and fruit are considered. In this respect, there are
different ways to calculate the fuel consumed by
tractors, which is based on the yearly use of tractors
for farming or transport operations, as in the
equation below.
Qavg = 0.223 .Ppto (11)
where Oavgis: average diesel fuel consumption
and Pptois: rated pto power
This equation is valid for tractors such as
those used in the Gediz basin, which run between
700 and 1000 hours per year. The rated Power take-
off (Ppto) is a factor of tractor power and usually
assumed to be 80% of tractor power, considering
losses in transmission systems, etc.
Calculation of fuel consumption uses equation
(11), the time spent for growing a specific crop
must be known, so that the multiplication of time
spent in total per unit area will result in total fuel
consumption per unit land in liters.
Cg= Qavg .Tfarming . L (12)
where,
Cg= Diesel fuel consumption for a specific crop (L)
Tfarming= Time spent per unit of land for farming
operations for a specific crop (h/ha)
L= Land allocated to specific crop (ha)
While the machinery parks of the farms in
towns of the Gediz basin are similar, average
tractor power varies from one town to another.
However, differences are not great: tractor power
distribution data obtained from the Turkish
Statistical Institute for the year 2014 were used to
calculate the fuel consumption. The rated Pto power
was matched with the crops grown in each town
and fuel consumption for each crop at a specific
town was calculated. The time spent (hours) per
hectare for each crop was obtained from a study
conducted in Turkey [45]. The data, in terms of
time spent per hectare using tractors, were updated
in accordance with the many technological
developments that have occurred, such as the use of
new equipment or machinery in farming operations
in the region, since the study was published.
Carbon footprint (C). Each of the mentioned
energies consumed, as noted above, have their
respective carbon footprints. Whether for energy
consumed to secure water for irrigation or for other
production and transportation practices, carbon is
emitted into the atmosphere [39]. The carbon emis-
sion calculations based on the activities are formu-
lated as in the following:
C = C1 + C2 (13)
C1 = CGWe+ CGWs + CSW (14)
C2 = Cfarming+ Ctransport+ Cfert (15)
As parallel to energy consumption, carbon
emissions are quantified as the following,
C1 = CGWe+ CGWs + CSW= EGW(kJ) x (ton
CO2/kJ)+EGWs (kJ) x (ton CO2/kJ)+ESW(kJ) x (ton
CO2/kJ) (16)
C2 = Etill. T (kJ) x (ton CO2/kJ)+Etransport (kJ) x
(ton CO2/kJ)+Efert. (kJ) x (ton CO2/kJ) (17)
Financial Value. LFV(TL) =Σ [ Prodi (ton) X
Prii (TL/ton) ] (18)
Prodi (ton) = Total production of a product (i) local-
ly.
Prii (TL/ton) = Selling market price of product (i).
LFV(TL) = Total value of production of locally
produced product
Sustainability Index. The sustainability of a
scenario to be developed in this study will be
defined by calculating its “sustainability index” as
follows:
Water Index =WI = Wi /Wa (19)
Land Index = LI = Li / La (20)
Local Energy Index = EI = Ei /Ea (21)
Local Carbon Index =CI = Ci /Ca (22)
Financial Index = FI =Fi /Fa (23)
Energy IMP Index = EIMP I = E IMPi /E IM-
Pa (24)
Carbon IMP Index = CIMP I = C IMPi / C
IMPa (25)
Wi = The total water needed for scenario i
Li = The total land area needed for scenario i
Ei = The total local energy needed for scenario i
Ci = The total local carbon emitted by scenario i
Fi = The total finances for scenario I = Flocal +
Fimport (local and import)
E IMPi=The total local energy needed for scenario i
C IMPi=The total local carbon emitted by scenario
i
Wa = Total max acceptable water extracted and
produced by available water resources for agricul-
tural production

© by PSP Volume 28 – No. 4/2019 pages 2511-2522 Fresenius Environmental Bulletin
2516
La = Max acceptable/arable local land use
Ea = Max acceptable energy use = a cap could be
put on max energy generation and use for agricul-
tural production. It is influenced by current capaci-
ties, and decision of upgrade.
Ca = Max acceptable carbon emissions = a cap put
by a government to cut carbon emitted
Fa = Max acceptable limits for expenditures to
supply food locally and through imports
E IMPa= Max energy consumed through transport-
ing imported food products
C IMPa = Max carbon emitted through transporting
imported food products
Therefore, the scenario with the lowest score
would be most sustainable, as defined by the deci-
sion maker.
Scenario i: S.I. i = [WIi(100-IW) + LIi(100-IL)
+ EIi (100-IE) + CIi (100-IC) + FIi (100-IF) + EIMP
Ii (100-IEIMP) + CIMP Ii (100-ICIMP)] /100 (26)
IW + IL + IE + IC + IF + IEIMP + ICIMP = 100 (27)
IW = Importance factor assigned for the water
assessment parameter
IL = Importance factor assigned for the land
assessment parameter
IE = Importance factor assigned for the energy
assessment parameter
IC = Importance factor assigned for the carbon
assessment parameter
IF = Importance factor assigned for the financial
assessment parameter
IEIMP = Importance factor assigned for ‘energy for
global transport’ assessment parameter
ICIMP = Importance factor assigned for ‘carbon
emissions due to global transport’ assessment
parameter
Crop related phenomena include land, water,
and fertilizer needs; energy used for farming
operations, transport and pumping water (from
surface or groundwater sources); and carbon
emissions, as obtained for the food production.
Hence, the effect of each crop on sources, energy,
and carbon emission is investigated separately and
using a special analysis called “parameter relative
sensitivity analysis.” The parameter relative
sensitivity analysis determines the effect of
changing each input parameter on different outputs
and for this purpose, using the equation:
b br
b b b
O O PS
P P O
−=
− (28)
In this equation, Sr is the relative sensitivity
value, O the new output, Ob the output of base
scenario, P the new parameter value, and Pb the
base parameter value in base scenario. “b” is the
base average value and Δ represents the change in
parameter value from base [46].
Development of Future Scenarios. Future
scenarios using the WEF Nexus concept were
created and then divided into two parts: near future
(present to the year 2020), and long term (years
2030, 2040 and 2050).
In the last two decades, the region survived
one drought and one rainy year: these were
considered the extremes and are assumed to happen
in the region in the future. The normal year data, in
terms of seasonal water and irrigation requirements,
were correlated to the data of extreme years, as
shown in Figure 3. For these scenarios, the water
requirement data of normal year were replaced
based on the regression models as shown in the
Figures.
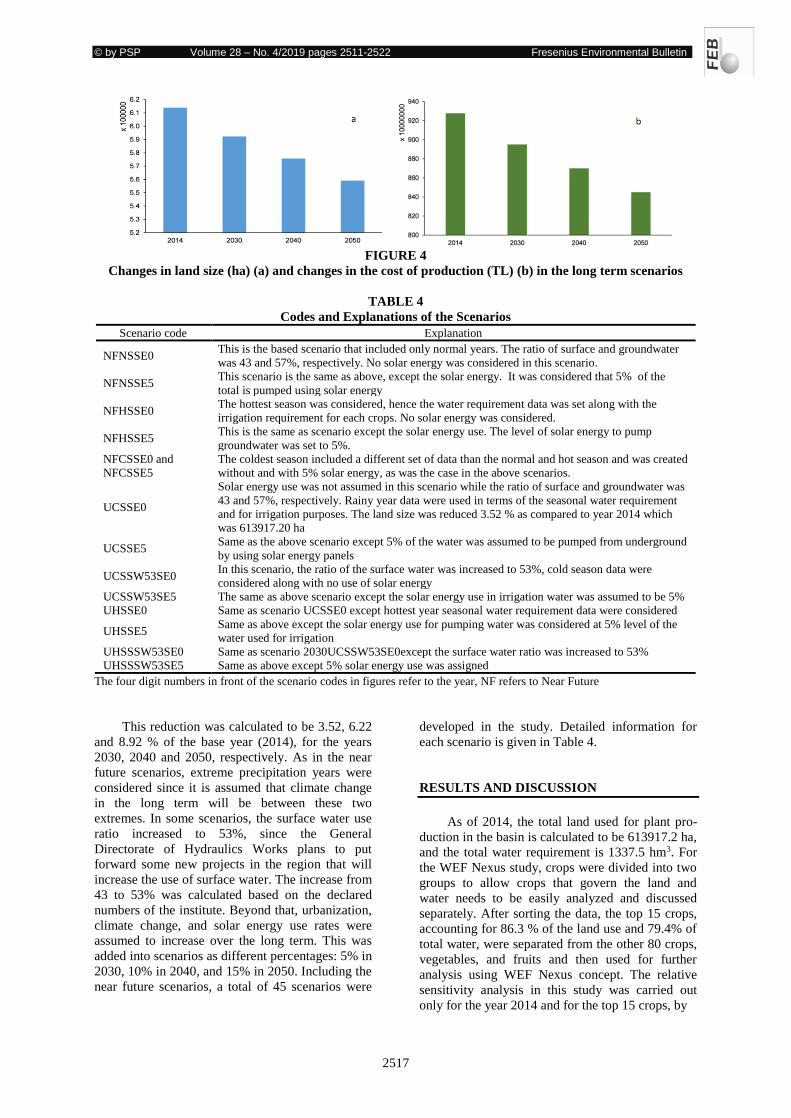
In the long term scenarios, urbanization,
climate change, and technological developments
were considered. The trend in urbanization was
calculated based on the data released by the Turkish
Statistical Institute and the total land used for
agriculture data from 2000 thru 2014. It was found
that the land area for agriculture, as a general trend,
decreases annually in the basin. The changes in
local costs are depicted for near future and long
term scenarios. As seen from the Figure, local costs
go down as a natural result of reduction in land.
This also means that self-sufficiency in each crop
declines and the export of some crops from the
basin will be jeopardized (Figure 4).
FIGURE 3
Relationship between normal year seasonal water requirement with the coldest and hottest year (a)
Relationship between normal year water available to the plant and with the coldest and hottest year (b)
© by PSP Volume 28 – No. 4/2019 pages 2511-2522 Fresenius Environmental Bulletin
2517
FIGURE 4
Changes in land size (ha) (a) and changes in the cost of production (TL) (b) in the long term scenarios
TABLE 4
Codes and Explanations of the Scenarios
Scenario code Explanation
NFNSSE0 This is the based scenario that included only normal years. The ratio of surface and groundwater
was 43 and 57%, respectively. No solar energy was considered in this scenario.
NFNSSE5 This scenario is the same as above, except the solar energy. It was considered that 5% of the
total is pumped using solar energy
NFHSSE0 The hottest season was considered, hence the water requirement data was set along with the
irrigation requirement for each crops. No solar energy was considered.
NFHSSE5 This is the same as scenario except the solar energy use. The level of solar energy to pump
groundwater was set to 5%.
NFCSSE0 and
NFCSSE5
The coldest season included a different set of data than the normal and hot season and was created
without and with 5% solar energy, as was the case in the above scenarios.
UCSSE0
Solar energy use was not assumed in this scenario while the ratio of surface and groundwater was
43 and 57%, respectively. Rainy year data were used in terms of the seasonal water requirement
and for irrigation purposes. The land size was reduced 3.52 % as compared to year 2014 which
was 613917.20 ha
UCSSE5 Same as the above scenario except 5% of the water was assumed to be pumped from underground
by using solar energy panels
UCSSW53SE0 In this scenario, the ratio of the surface water was increased to 53%, cold season data were
considered along with no use of solar energy
UCSSW53SE5 The same as above scenario except the solar energy use in irrigation water was assumed to be 5%
UHSSE0 Same as scenario UCSSE0 except hottest year seasonal water requirement data were considered
UHSSE5 Same as above except the solar energy use for pumping water was considered at 5% level of the
water used for irrigation
UHSSSW53SE0 Same as scenario 2030UCSSW53SE0except the surface water ratio was increased to 53%
UHSSSW53SE5 Same as above except 5% solar energy use was assigned
The four digit numbers in front of the scenario codes in figures refer to the year, NF refers to Near Future
This reduction was calculated to be 3.52, 6.22
and 8.92 % of the base year (2014), for the years
2030, 2040 and 2050, respectively. As in the near
future scenarios, extreme precipitation years were
considered since it is assumed that climate change
in the long term will be between these two
extremes. In some scenarios, the surface water use
ratio increased to 53%, since the General
Directorate of Hydraulics Works plans to put
forward some new projects in the region that will
increase the use of surface water. The increase from
43 to 53% was calculated based on the declared
numbers of the institute. Beyond that, urbanization,
climate change, and solar energy use rates were
assumed to increase over the long term. This was
added into scenarios as different percentages: 5% in
2030, 10% in 2040, and 15% in 2050. Including the
near future scenarios, a total of 45 scenarios were
developed in the study. Detailed information for
each scenario is given in Table 4.
RESULTS AND DISCUSSION
As of 2014, the total land used for plant pro-
duction in the basin is calculated to be 613917.2 ha,
and the total water requirement is 1337.5 hm3. For
the WEF Nexus study, crops were divided into two
groups to allow crops that govern the land and
water needs to be easily analyzed and discussed
separately. After sorting the data, the top 15 crops,
accounting for 86.3 % of the land use and 79.4% of
total water, were separated from the other 80 crops,
vegetables, and fruits and then used for further
analysis using WEF Nexus concept. The relative
sensitivity analysis in this study was carried out
only for the year 2014 and for the top 15 crops, by
© by PSP Volume 28 – No. 4/2019 pages 2511-2522 Fresenius Environmental Bulletin
2518
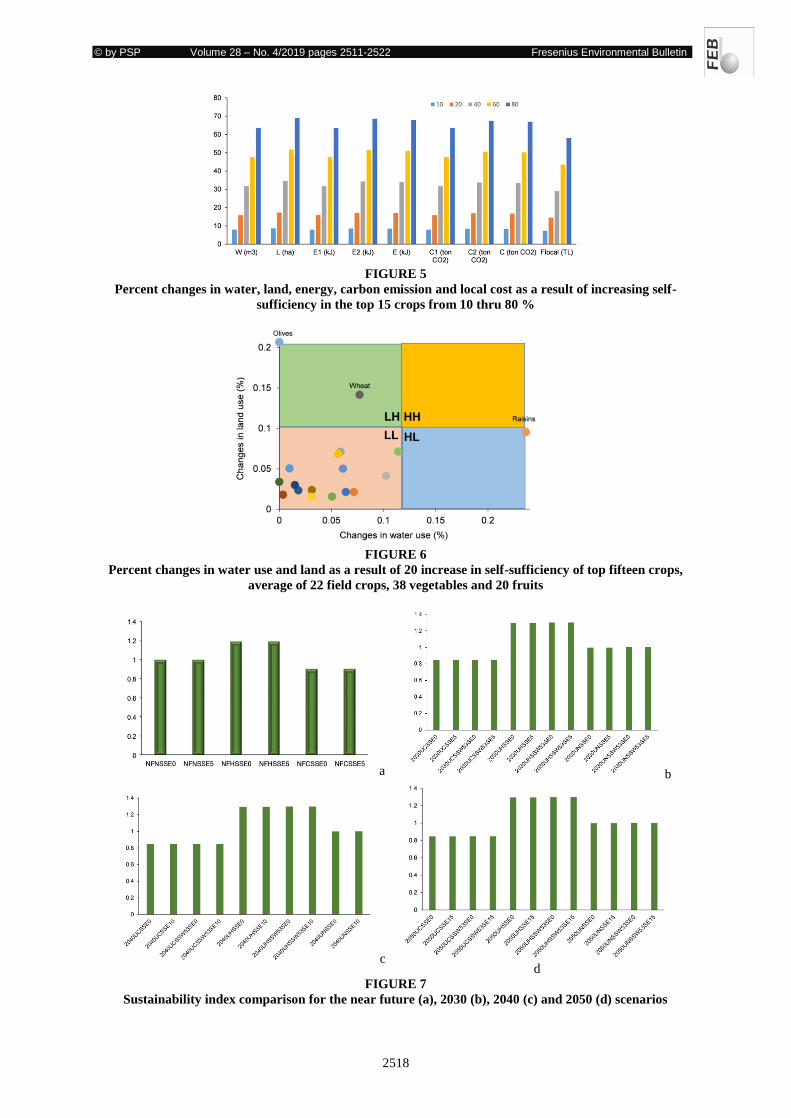
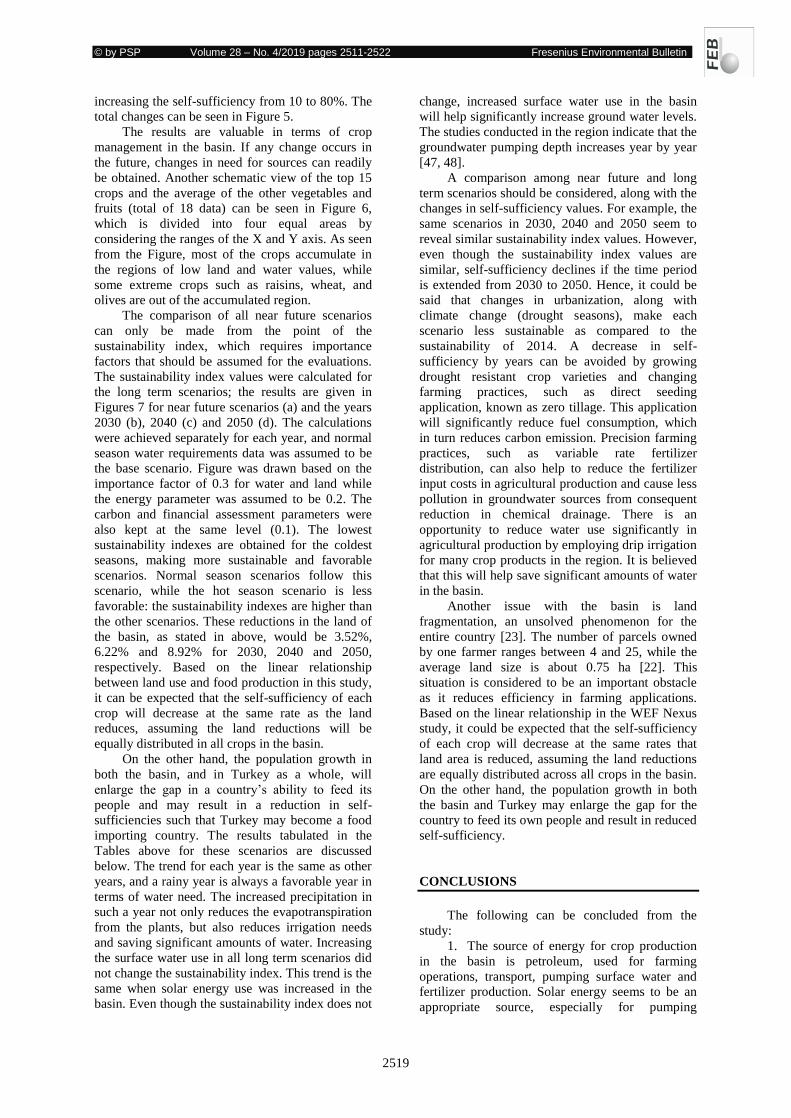
FIGURE 5
Percent changes in water, land, energy, carbon emission and local cost as a result of increasing self-
sufficiency in the top 15 crops from 10 thru 80 %
FIGURE 6
Percent changes in water use and land as a result of 20 increase in self-sufficiency of top fifteen crops,
average of 22 field crops, 38 vegetables and 20 fruits
a b
c d
FIGURE 7
Sustainability index comparison for the near future (a), 2030 (b), 2040 (c) and 2050 (d) scenarios
© by PSP Volume 28 – No. 4/2019 pages 2511-2522 Fresenius Environmental Bulletin
2519
increasing the self-sufficiency from 10 to 80%. The
total changes can be seen in Figure 5.
The results are valuable in terms of crop
management in the basin. If any change occurs in
the future, changes in need for sources can readily
be obtained. Another schematic view of the top 15
crops and the average of the other vegetables and
fruits (total of 18 data) can be seen in Figure 6,
which is divided into four equal areas by
considering the ranges of the X and Y axis. As seen
from the Figure, most of the crops accumulate in
the regions of low land and water values, while
some extreme crops such as raisins, wheat, and
olives are out of the accumulated region.
The comparison of all near future scenarios
can only be made from the point of the
sustainability index, which requires importance
factors that should be assumed for the evaluations.
The sustainability index values were calculated for
the long term scenarios; the results are given in
Figures 7 for near future scenarios (a) and the years
2030 (b), 2040 (c) and 2050 (d). The calculations
were achieved separately for each year, and normal
season water requirements data was assumed to be
the base scenario. Figure was drawn based on the
importance factor of 0.3 for water and land while
the energy parameter was assumed to be 0.2. The
carbon and financial assessment parameters were
also kept at the same level (0.1). The lowest
sustainability indexes are obtained for the coldest
seasons, making more sustainable and favorable
scenarios. Normal season scenarios follow this
scenario, while the hot season scenario is less
favorable: the sustainability indexes are higher than
the other scenarios. These reductions in the land of
the basin, as stated in above, would be 3.52%,
6.22% and 8.92% for 2030, 2040 and 2050,
respectively. Based on the linear relationship
between land use and food production in this study,
it can be expected that the self-sufficiency of each
crop will decrease at the same rate as the land
reduces, assuming the land reductions will be
equally distributed in all crops in the basin.
On the other hand, the population growth in
both the basin, and in Turkey as a whole, will
enlarge the gap in a country’s ability to feed its
people and may result in a reduction in self-
sufficiencies such that Turkey may become a food
importing country. The results tabulated in the
Tables above for these scenarios are discussed
below. The trend for each year is the same as other
years, and a rainy year is always a favorable year in
terms of water need. The increased precipitation in
such a year not only reduces the evapotranspiration
from the plants, but also reduces irrigation needs
and saving significant amounts of water. Increasing
the surface water use in all long term scenarios did
not change the sustainability index. This trend is the
same when solar energy use was increased in the
basin. Even though the sustainability index does not
change, increased surface water use in the basin
will help significantly increase ground water levels.
The studies conducted in the region indicate that the
groundwater pumping depth increases year by year
[47, 48].
A comparison among near future and long
term scenarios should be considered, along with the
changes in self-sufficiency values. For example, the
same scenarios in 2030, 2040 and 2050 seem to
reveal similar sustainability index values. However,
even though the sustainability index values are
similar, self-sufficiency declines if the time period
is extended from 2030 to 2050. Hence, it could be
said that changes in urbanization, along with
climate change (drought seasons), make each
scenario less sustainable as compared to the
sustainability of 2014. A decrease in self-
sufficiency by years can be avoided by growing
drought resistant crop varieties and changing
farming practices, such as direct seeding
application, known as zero tillage. This application
will significantly reduce fuel consumption, which
in turn reduces carbon emission. Precision farming
practices, such as variable rate fertilizer
distribution, can also help to reduce the fertilizer
input costs in agricultural production and cause less
pollution in groundwater sources from consequent
reduction in chemical drainage. There is an
opportunity to reduce water use significantly in
agricultural production by employing drip irrigation
for many crop products in the region. It is believed
that this will help save significant amounts of water
in the basin.
Another issue with the basin is land
fragmentation, an unsolved phenomenon for the
entire country [23]. The number of parcels owned
by one farmer ranges between 4 and 25, while the
average land size is about 0.75 ha [22]. This
situation is considered to be an important obstacle
as it reduces efficiency in farming applications.
Based on the linear relationship in the WEF Nexus
study, it could be expected that the self-sufficiency
of each crop will decrease at the same rates that
land area is reduced, assuming the land reductions
are equally distributed across all crops in the basin.
On the other hand, the population growth in both
the basin and Turkey may enlarge the gap for the
country to feed its own people and result in reduced
self-sufficiency.
CONCLUSIONS
The following can be concluded from the
study:
1. The source of energy for crop production
in the basin is petroleum, used for farming
operations, transport, pumping surface water and
fertilizer production. Solar energy seems to be an
appropriate source, especially for pumping
© by PSP Volume 28 – No. 4/2019 pages 2511-2522 Fresenius Environmental Bulletin
2520
groundwater. It is expected to become widespread
not only in the basin, but nationwide.
2. The crop pattern in the region is an
effective parameter for land allocation and water
demand. Olive, wheat, and raisin production are
considered the governing crops in the basin. Future
changes in crop patterns may cause a shift toward
increased water need and/or land allocations.
Hence, the management in the basin requires
acknowledgement of linkages between natural
resources and quantification of these linkages.
3. Self-sufficiency and sustainability in the
basin are likely to worsen in the long term,
compared to the year 2014.
4. The reduction in available land for
agriculture, as a consequence of urbanization and
water scarcity due to climate change, is inevitable.
In order to maintain sustainability at the current
level, varieties resistant to drought should be
selected and some new farming practices (direct
planting and drip irrigation systems) should be
seriously considered and adopted.
5. Environmentally friendly applications in
agriculture are believed to reduce energy inputs,
and result in less pollution. These applications
could be described as the implementation of
precision farming in agricultural operations along
with the use of solar energy to reduce carbon
emissions.
6. The WEF Nexus concept is well suited to
study the basins in Turkey. Applying the concept to
the other basins is of importance and the entire
country profile can be obtained and then WEF
Nexus concept, including importing materials from
other countries (virtual water), applied and
nationwide WEF study will be conducted.
7. Adding crop yields that reflect the use of
different amounts of water during their growth is
expected to bring non-linearity to the WEF Nexus
concept: many crops respond to water used in a
non-linear way. Excessive water use and water at
certain levels can result in the same yield, but with
differences in the amounts of water saved. The
reflection of this issue in WEF Nexus work will
also make other parameters non-linear. It is
believed that this issue is worth studying.
ACKNOWLEDGEMENTS
This research article has been produced from a
project titled “Strategic Planning of Natural Re-
sources: Dynamic Modelling of Water, Energy and
Food (WEF) Nexus for the Gediz Basin –Turkey”.
The project was carried out with the scholarship
award granted by the Scientific and Technological
Research Council of Turkey.
REFERENCES
[1] FAO (2016) Water withdrawal by sector,
around (2010)
http://www.fao.org/nr/water/aquastat/Tables/W
orldData-Withdrawal_eng.pdf. Last accessed:
04/20/2018
[2] Rosegrant, M.W., Ringler, C. and Zhu, T.
(2009)Water for Agriculture: Maintaining
Food Security under Growing Scarcity. Annual
Review of Environment and Resources. 34,
205-222.
[3] Yang, H., Zhou, Y., Liu, J. (2009) Land and
water requirements of biofuel and implications
for food supply and the environment in China.
Energy Policy. 37(5), 1876-1885.
[4] Mohtar, R.H., Daher, B. (2012) Water, Energy
and Food: The ultimate Nexus.Encylopedia of
Agricultural, Food, and Biological Engineer-
ing, Second ed. Taylor and Francis.
[5] Mohtar, R.H. (2011) An Integrated Sustainabil-
ity Index for Effective Water Policy. In:
Waughray, D. (ed.) Water security: the water-
food-energy-climate nexus World Economic
Forum Water Initiative. Island Press. Washing-
ton, Covelo, London.
[6] Bazilian, M., Rogner, H., Howells, M., Her-
mann, S., Arent, D., Gielen, D., Steduto,
P.,Mueller, A., Komor, P., Tol, R.S.J.,
Yumkella, K.K. (2011) Considering the ener-
gy, water and food nexus: Towards an integrat-
ed modeling approach. Energy Policy.39(12),
7896-7906.
[7] Daher, B., WEF Nexus Research Group, and
Texas A&M University (2017) IWRA Sustain-
ability in the Water-Energy-Food Nexus:
Bridging Science and Policy Making. Policy
Briefing Water International. Available
from:http://agrilife.org/wefnexus/files/2015/01/
IWRA.pdf
[8] FAO (2014)Walking the Nexus Talk: As-
sessing the Water-Energy-Food Nexus. Re-
trieved from http://www.fao.org/3/a-
i3959e.pdf. Last accessed: 04/20/2018.
[9] Flammini, A., Puri, M., Pluschke, L., Dubois,
O. (2014) Walking the Nexus Talk: Assessing
the Water-Energy-Food Nexus in the Context
of the Sustainable Energy for All Initiative.
Environment and Natural Resources Working
Paper No. 58 – FAO, Rome, ISSN 2226-6062.
Retrieved from: http://www.fao.org/3/a-
i3959e.pdf , Last accessed: 01/21/2018.
[10] Mekonnen, M.M., Hoekstra, A.Y. (2011a) The
green, blue and grey water footprint of crops
and derived crop products. Hydrology and
Earth System Sciences Discussions. 8, 763-
809.
© by PSP Volume 28 – No. 4/2019 pages 2511-2522 Fresenius Environmental Bulletin
2521
[11] Hoekstra, A.Y. and Chapagain, A.K. (2008)
Globalization of water: Sharing the planet’s
freshwater resources. Blackwell Publishing,
Oxford, UK.
[12] Lee, S.H., Mohtar, R.H., Choi, J.Y., Yoo, S.H.
(2016) Analysis of the characteristics of the
global virtual water tradenetwork using degree
and eigenvector centrality, with a focus onfood
and feed crops. Hydrology and Earth System
Science. 20, 4223-4235.
[13] Mekonnen, M.M. and Hoekstra, A.Y. (2011b)
National water footprint accounts: the green,
blue and grey water footprint of production and
consumption. Value of Water Research Report
Series No. 50, UNESCO-IHE, Delft, the Neth-
erlands.
[14] Alcamo, J., Henrichs, T. (2002) Critical re-
gions: A model-based estimation of world wa-
ter resources sensitive to global changes.
Aquatic Sciences. 64(4), 352-362.
[15] Alcamo, J., Döll, P., Henrichs, T., Kaspar, F.,
Lehner, B., Rösch, T., Siebert, S. (2003) Glob-
al estimates of water withdrawals and availabil-
ity under current and future “business-as-
usual” conditions. Hydrological Sciences Jour-
nal. 48(3), 339-348.
[16] Smakhtin, V., Revenga, C., Döll, P. (2004) A
pilot global assessment of environmental water
requirements and scarcity Water International.
29(3), 307-317.
[17] Ringler, C., Bhaduri, A. and Lawford, R.
(2013)The nexus across water, energy, land
and food (WELF): potential for improved re-
source use efficiency? Current Opinion in En-
vironmental Sustainability. 5, 617–624.
[18] Mohtar, R.H. (2016) The importance of the
Water-Energy-Food Nexus in the implementa-
tion of The Sustainable Development Goals
(SDGs).Policy Brief.PB-16/30.OCP Policy
Center, Morocco.
[19] Daher, B., Mohtar, R.H., Pistikopoulos, E.N.,
Portney, K.E., Kaiser, R., Saad, W.
(2018)Developing Socio-Techno-Economic-
Political (STEP) Solutions for Addressing Re-
source Nexus Hotspots. Sustainability.
10(512).
[20] TurkStat, (2014)Turkish Statistical Institute.
Crop Production Statistics.
www.tuik.gov.trLast accessed: 04/20/2017.
[21] Canli, S. (2014) Agricultural irrigation re-
quirement on Menemen plain and possible ef-
fects of irrigation water in terms of plant, soil
and irrigation systems. MSc Thesis. Ataturk
University, Institute of Natural and Applied
Sciences, Erzurum. (in Turkish).
[22] Özgünaltay-Ertuğrul, G. (2013) Values and
Key Relations on Tractor Use as in the Exam-
ple of Gediz Basin. PhD. Dissertation.Ege
University, Institute of Natural and Applied
Sciences, Bornova-Izmir, Turkey. (in Turkish).
[23] Evcim, H. Ü., Değirmencioğlu, A., Özgünal-
tayErtuğrul, G., Aygün, İ., (2012) Advance-
ments and transitions in technologies for sus-
tainable agricultural production. Economic and
Environmental Studies. 12(4), 459-466.
[24] Wood S. and Cowie, A., (2004) A Review of
Greenhouse Gas Emission Factorsfor Fertiliser
Production.IEA Bioenergy – Task
38.http://task38.org/publications/GHG_Emissi
on_Fertilizer_Production_July2004.pdf.
[25] Sovacool, B.K., (2008) Valuing the greenhouse
gas emissions from nuclear power: A critical
survey.Energy Policy. 36(2008) 2940– 2953.
[26] Schlömer S., Bruckner, T., Fulton, L.,
Hertwich, E., McKinnon, A., Perczyk, D., Roy,
J., Schaeffer, R., Sims, R., Smith, P. and Wiser,
R. (2014) Annex III: Technology-specific cost
and performance parameters. In: Edenhofer,
O., Pichs-Madruga, R., Sokona, Y., Farahani,
E., Kadner, S., Seyboth, K., Adler, A., Baum,
I., Brunner, S., Eickemeier, P., Kriemann, B.,
Savolainen, J., Schlömer, S., von Stechow, C.,
Zwickel, T. and Minx, J.C. (eds.) Climate
Change 2014: Mitigation of Climate Change.
Contribution of Working Group III to the Fifth
Assessment Report of the Intergovernmental
Panel on Climate Change Cambridge Universi-
ty Press/ Cambridge, United Kingdom and
New York, NY, USA.
[27] Ferroukhi, R., Nagpal, D., Lopez-Peña, A.,
Hodges, T., Mohtar, R.H., Daher, B., Mohtar,
S.,Keulertz, M. (2015)Renewable Energy in
the Water, Energy and Food Nexus. Interna-
tional Renewable Energy Agency, Abu Dhabi,
United Arab Emirates.
[28] Leck, H., Conway, D., Bradshaw, M., Rees, J.,
(2015)Tracing The Water–Energy–Food Nex-
us: Description, Theory and Practice. Geogra-
phy Compass. 9/8(2015), 445–460.
[29] Granit, J., Fogde, M., Holger Hoff, S.E.I.,
Joyce, J. (2013) Unpacking the water-energy-
food nexus: Tools for assessment and coopera-
tion along a continuum. Cooperation for a Wa-
ter Wise World, 45p.
[30] Rosegrant, M.W., Ringler, C., McKinney D.C.,
Cai, X., Keller, A. and Donoso, G. (2000) Inte-
grated economic–hydrologic water modelling
at the basin scale: the Maipo river basin. Agri-
cultural Economics. 24(2000) 33–46.
[31] Hightower, M., Pierce, S.A. (2008) The energy
challenge. Nature. 452, 285–286.
[32] Li, G.C., Huang, G.H., Lin, Q.G., Zhang, X.D.,
Tan, Q., Chen, Y.M. (2011) Development of a
GHG-mitigation oriented inexact dynamic
model for regional energy system management.
Energy. 36, 3388–3398.
© by PSP Volume 28 – No. 4/2019 pages 2511-2522 Fresenius Environmental Bulletin
2522
[33] Hu, Q., Huang, G., Cai, Y., Huang, Y. (2011)
Feasibility-based inexact fuzzy programming
for electric power generation systems planning
under dual uncertainties.Appl. Energy. 88,
4642–4654.
[34] Bernardi, A., Giarola, S. and Bezzo, F.
(2012)Optimizing the economics and the car-
bon and water footprints of bioethanol supply
chains. Biofuels, Bioprod. Bioref. 6, 656–672.
[35] Zhang, X., Vesselinov, V.V., (2016). Energy-
water nexus: Balancing the tradeoffs between
two-level decision makers. Appl. Energy. 183,
77–87.
[36] Mohtar, R. H., Daher, B. (2014) A Platform for
Trade-off Analysis and Resource Allocation:
The Water-Energy-Food Nexus Tool and its
Application to Qatar’s Food Security [part of
the ‘Valuing Vital Resources in the Gulf’ Se-
ries], Chatham
House.http://agrilife.org/wefnexus/files/2015/0
1/20141216WaterEnergyFoodNexusQatarMoh
tarDaher.pdf.
[37] Walker, R.V., Beck, M.B., Hall, J.W., Dawson,
R.J., Heidrich, O. (2014) The energy-water-
food nexus: Strategic analysis of technologies
for transforming the urban metabolism. Journal
of Environmental Management. 141(2014)
104-115.
[38] Biggs, E.M., Bruce, E., Boruff, B., Duncan,
J.M.A., Horsley, J., Pauli, N., McNeill, K.,
Neef, A., vanOgtrop, F., Curnow, J., Haworth,
B., Duce, S., Imanari, Y. (2015) Sustainable
development and the water–energy–food nex-
us: A perspective on livelihoods. Environmen-
tal Science and Policy. 54(2015) 389–397.
[39] Daher, B., Mohtar, R.H. (2015) Water–energy–
food (WEF) Nexus Tool 2.0: guiding integra-
tive resource planning and decision-making.
Water International. 40(5-6), 748-771.
[40] Rasul, G., Sharma, B. (2016) The nexus ap-
proach to water-energy-food security: an op-
tion for adaptation to climate change. Clim.
Policy.16, 682-702.
[41] Karan, E., Asadi, S., Mohtar, R., Baawain, M.
(2018)Towards the optimization of sustainable
food-energy-water systems: A stochastic ap-
proach. Journal of Cleaner Production.
171(2018), 662-674.
[42] Zhang, X. and Vesselinov V.V.
(2017)Integrated modeling approach for opti-
mal management of water, energy and food se-
curity nexus. Advances in Water Resources.
101(2017), 1–10.
[43] Siebert, S., Döll, P. (2010)Quantifying blue
and green virtual water contents in global crop
production as well as potential production loss-
es without irrigation. Journal of Hydrology.
384(3-4), 198–217.
[44] Garcia, D.J., You, F. (2016)The water-energy-
food nexus and process systems engineering: A
new focus. Computers and Chemical Engineer-
ing. 91, 49–67.
[45] Koral, A. I, Altun, A. (1998) A guide for the
production inputs of the crops grown in Tur-
key. T.C. Basbakanlik, Koy Hizmetleri Genel
Mudurlugu, APK Dairesi Baskanligi, Toprakve
Su Kaynaklari Arastirma Sube Mudurlugu
Yayin no:104, Rehber no: 16, Ankara, 360p.
(in Turkish).
[46] Daher, T.B. (2012)Water, energy and food
nexus: A basis for strategic planning of natural
resources. MSc. Thesis. Purdue University,
West Lafayette, IN, 200p.
[47] Simsek, C., Filiz, S. (2005) Hydrogeology and
vulnerability of Aquifer of the Torbali plain
and vicinity.DEU Muhendislik Fakultesi, Fen
veMuhendislikDergisi. 7(2), 21-37. (in Turk-
ish).
[48] Simsek, C., Demirkiran, Z., Cetiner, L.,
Gunduz, O., Ocal, G. (2009) Three dimension-
al interactive hydrogeological model of the
Kemalpasa Plain. DEU Muhendislik Fakultesi,
Fen ve Muhendislik Dergisi. 11(31), 10-21. (in
Turkish).
Received: 28.8.2018
Accepted: 18.02.2019
CORRESPONDING AUTHOR
Adnan Degirmencioglu
Ege University,
Faculty of Agriculture,
Department of Agricultural Engineering
and Technology
Bornova, Izmir – Turkey
e-mail: [email protected]