AROMA OF SOME PLANTS CULTIVATED IN LITHUANIA: …
183
AROMA OF SOME PLANTS CULTIVATED IN LITHUANIA: COMPOSITION, PROCESSING AND RELEASE Egle Bylaite
Transcript of AROMA OF SOME PLANTS CULTIVATED IN LITHUANIA: …
AROMA OF SOME PLANTS CULTIVATED IN LITHUANIA:
COMPOSITION, PROCESSING AND RELEASE
Egle Bylaite
Promotors: Dr. Ir. A.G.J. Voragen Hoogleraar in de levensmiddelenchemie
Co-promotoren: Dr. Ir. R.P. Venskutonis Universitair hoofddocent departement Levensmiddelentechnologie, Technische Universiteit Kaunas, Litouwen
Dr. Ir. J.P. Roozen Universitair hoofddocent departement Agrotechnologie and Voedingswetenschappen
AROMA OF SOME PLANTS CULTIVATED IN LITHUANIA:
COMPOSITION, PROCESSING AND RELEASE
Egle Bylaite
Proefschrift ter verkrijging van de graad van doctor
op gezag van de rector magnificus van Wageningen Universiteit
Dr CM. Karssen, in het openbaar te verdedigen
op vrijdag 9 Juni 2000 des namiddags te half twee in de Aula.
The research described in this thesis was performed at laboratory of Food Chemistry at the Department of Agrotechnology and Food Sciences, Wageningen University, The Netherlands; Department Food Technology, Kaunas University of Technology, Lithuania and Department Physical Chemistry 1, Lund University, Sweden. The studies described in this thesis were part of the research program of the Graduate School VLAG of cooperative Sandwich PhD Programme of Wageningen University.
BIBLIOTHVTK LANDSOllVVUN/VrKST
V/A'TNT,'-r;*;
Bylaite, Egle
Aroma of some plants cultivated in Lithuania: composition, processing and release
Thesis Wageningen University- With Summary in Dutch
ISBN: 90-5808-232-6
Printing: Ponsen & Looijen, Wageningen
Abstract
Bylaite, E. (2000). Aroma of some plants cultivated in Lithuania: composition, processing and
release. Ph.D. thesis, Wageningen University and Research Centre.
Keywords: aroma plants, essential oils, Umbelliferae, Asteraceae, harvesting time, dynamic
headspace, olfactometry, essential oil emulsification, microencapsulation, milk proteins,
flavour release, microstructure.
In this study, some factors affecting the aroma of some plants of the families Umbelliferae and
Asteraceae were evaluated. The composition of the aromas is influenced by several factors: plant
family, harvesting time, anatomical part of plant, method used to isolate volatiles, cultivar,
fertilisers used for the growing of plant, cultivation site. The yield of caraway fruits varies over
a wide range depending on fertiliser content, cultivation area and the cultivar itself. The trends
for the accumulation of essential oils differ between the families in yield and composition.
Seeds and flowers of lovage (Umbelliferae) possess the highest yields of oil. In the leaves of
lovage seasonal changes are less significant than in the stems. In leaves and flowers of costmary
(Asteraceae) the highest oil content is obtained before full flowering, while their stems possess
only negligible amount of volatiles. Various anatomical parts of lovage showed differences in
flavour release measured by the dynamic headspace method. The effluents from a gas
chromatography column were characterised by a sniffing panel, which attributed descriptors to
the recognised constituents.
Liquid essential oils can be processed by emulsification and encapsulation with milk proteins.
Stability of essential oil-in-water emulsions can be improved either by adding soybean
phosphatidylcholine and/or by increasing its protein concentration. Adsorption of the protein
from the aqueous phase at the oil/water interface was studied by applying ellipsometry. Essential
oil of caraway was encapsulated by milk derivatives either alone or combined with
carbohydrates. Partial replacement of whey protein concentrate increases the retention of
volatiles during spray drying and enhances the protective properties of solidified capsules
against oxidation and the release of volatiles during the timed period. The structural features of
spray- dried capsules indicated that good physical protection is provided to the caraway essential
oil.
CONTENTS
Chapter Page
1 General introduction 1
2 Characterisation of the essential oils of some Umbelliferous plants grown in 29 Lithuania
3 Influence of harvesting time on the composition of volatile components in 49 different anatomical parts of lovage (Levisticum officinale Koch.)
4 Composition of essential oil of costmary [Balsamita major (L.) Desf.] at 67 different growth phases
5 Dynamic headspace-gas chromatography - olfactometry analysis of different 81 anatomical parts of lovage (Levisticum officinale Koch.) at eight growth phases
6 Emulsification of caraway essential oil in water using lecithin and P- 101 lactoglobulin: emulsion stability and properties of the resulting oil-aqueous interface
7 Properties of caraway essential oil encapsulated into milk protein-based 125 matrices
8 General discussion 155
Summary 165
Samenvatting 171
Acknowledgement 177
List of publications 179
Curriculum Vitae 181
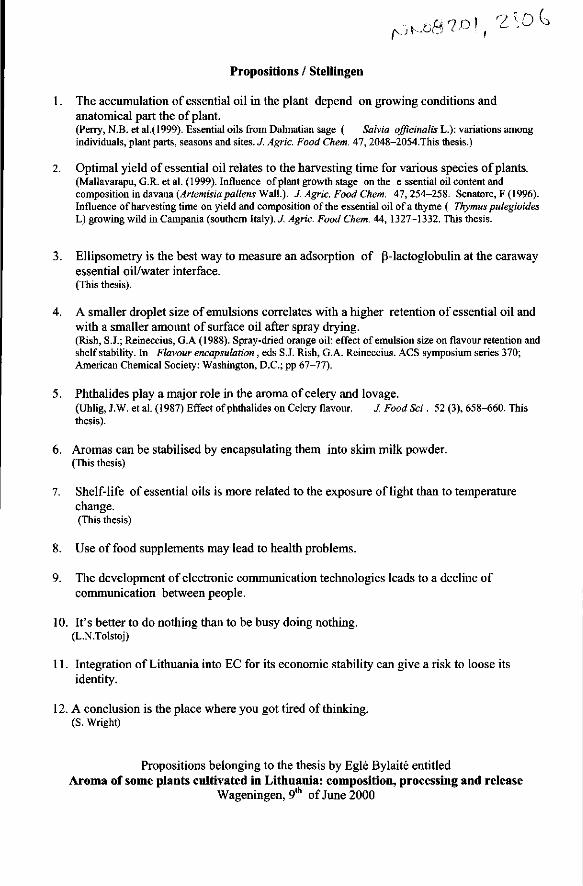
Propositions / Stellingen
1. The accumulation of essential oil in the plant depend on growing conditions and anatomical part the of plant. (Perry, N.B. etal.(1999). Essential oils from Dalmatian sage ( Salvia officinalis L.): variations among individuals, plant parts, seasons and sites. J. Agric. Food Chem. 47, 2048-2054.This thesis.)
2. Optimal yield of essential oil relates to the harvesting time for various species of plants. (Mallavarapu, G.R. etal. (1999). Influence of plant growth stage on the e ssential oil content and composition in davma (Artemisia pallens Wall.). J. Agric. Food Chem. 47,254-258. Senatore, F (1996). Influence of harvesting time on yield and composition of the essential oil of a thyme ( Thymus pulegioides L) growing wild in Campania (southern Italy). J. Agric. Food Chem. 44, 1327-1332. This thesis.
3. Ellipsometry is the best way to measure an adsorption of P-lactoglobulin at the caraway essential oil/water interface. (This thesis).
4. A smaller droplet size of emulsions correlates with a higher retention of essential oil and with a smaller amount of surface oil after spray drying. (Rish, S.J.; Reineccius, G.A (1988). Spray-dried orange oil: effect of emulsion size on flavour retention and shelf stability. In Flavour encapsulation , eds S.J. Rish, G.A. Reineccius. ACS symposium series 370; American Chemical Society: Washington, D.C.; pp 67-77).
5. Phthalides play a major role in the aroma of celery and lovage. (Uhlig, J.W. et al. (1987) Effect of phthalides on Celery flavour. J. Food Sci. 52 (3), 658-660. This thesis).
6. Aromas can be stabilised by encapsulating them into skim milk powder. (This thesis)
7. Shelf-life of essential oils is more related to the exposure of light than to temperature change. (This thesis)
8. Use of food supplements may lead to health problems.
9. The development of electronic communication technologies leads to a decline of communication between people.
10. It's better to do nothing than to be busy doing nothing. (L.N.Tolstoj)
11. Integration of Lithuania into EC for its economic stability can give a risk to loose its identity.
12. A conclusion is the place where you got tired of thinking. (S. Wright)
Propositions belonging to the thesis by Egle Bylaite entitled Aroma of some plants cultivated in Lithuania: composition, processing and release
Wageningen, 9th of June 2000
CHAPTER 1
GENERAL INTRODUCTION
Chapter 1
FLAVOUR
The flavour of food can be defined as a complex sensation primarily composed of aroma and
taste but also complemented by tactile and temperature stimuli (Heath and Reineccius, 1986).
Taste is concerned with sensations of the tongue in response to salty, sweet, sour and bitter. The
tongue surface also reacts to tactile and temperature stimuli, which include the cooling of
menthol and the heat of red pepper. There is a tactile response to texture, astringency, etc. - all
of which contribute to the overall perception of food flavour. Aroma is a much broader
sensation, coming from a small area in the nasal passage and encompassing an estimated 10 000
or more different odours (Reineccius, 1994).
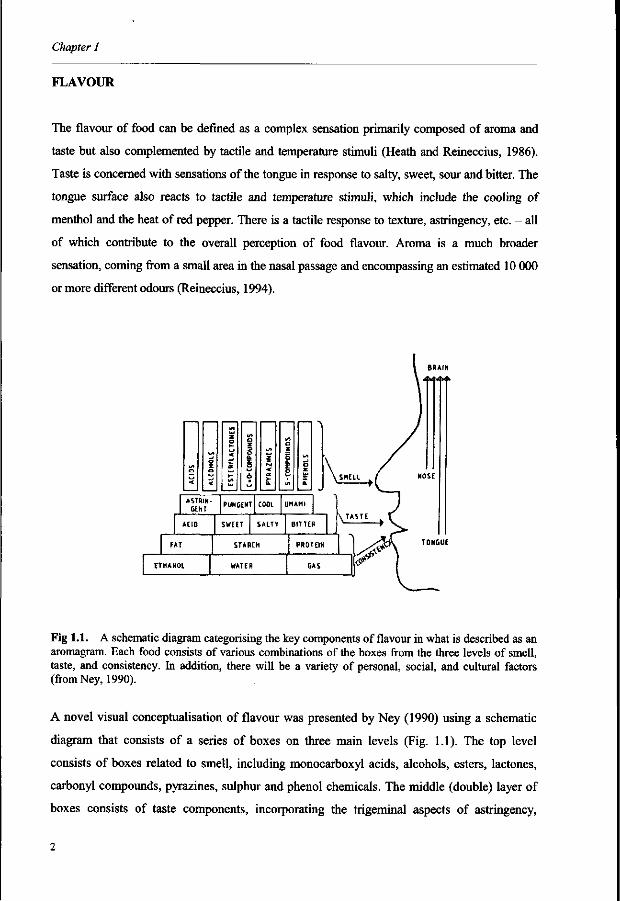
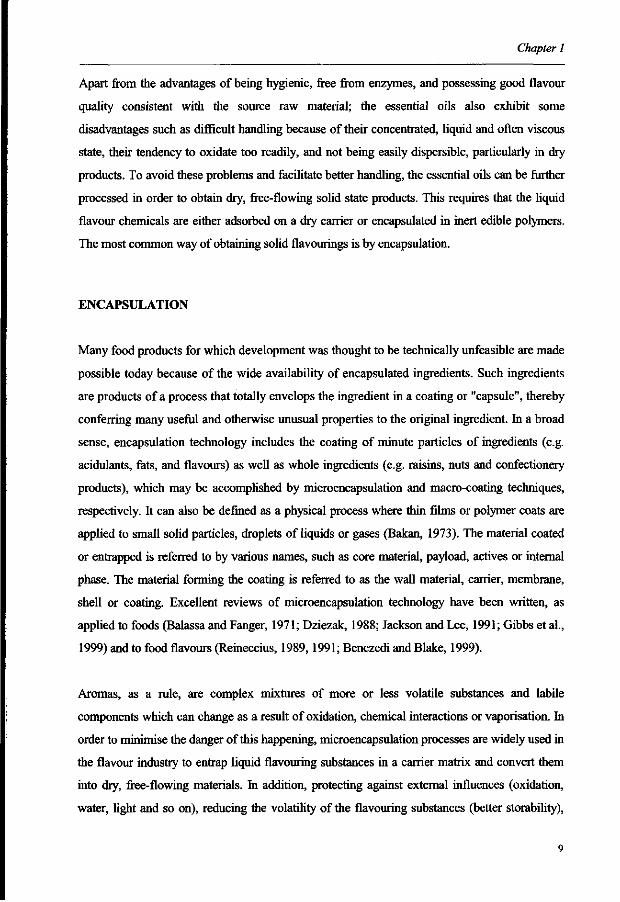
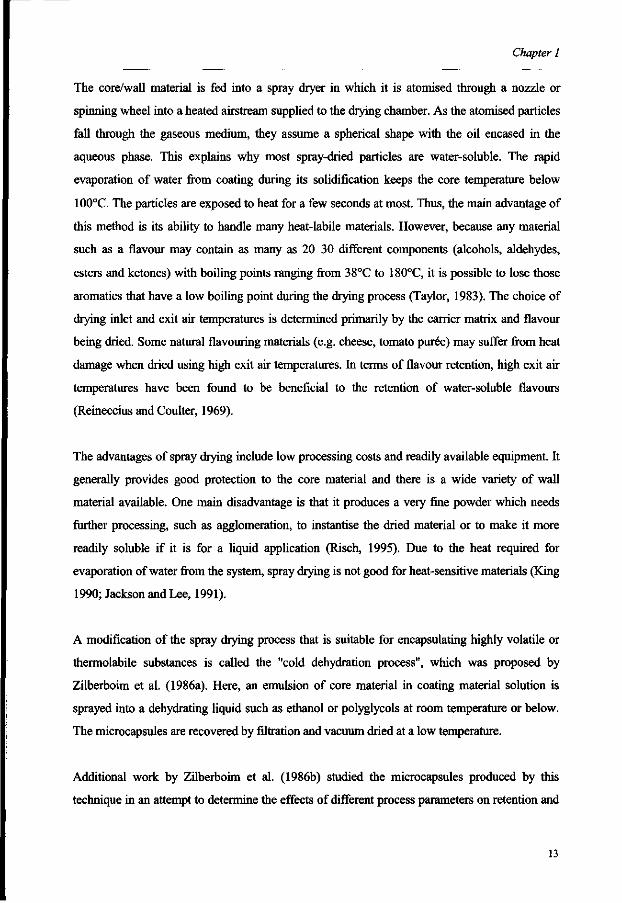
Fig 1.1. A schematic diagram categorising the key components of flavour in what is described as an aromagram. Each food consists of various combinations of the boxes from the three levels of smell, taste, and consistency. In addition, there will be a variety of personal, social, and cultural factors (from Ney, 1990).
A novel visual conceptualisation of flavour was presented by Ney (1990) using a schematic
diagram that consists of a series of boxes on three main levels (Fig. 1.1). The top level
consists of boxes related to smell, including monocarboxyl acids, alcohols, esters, lactones,
carbonyl compounds, pyrazines, sulphur and phenol chemicals. The middle (double) layer of
boxes consists of taste components, incorporating the trigeminal aspects of astringency,
Chapter I
pungency, coolness and umami in the uppermost row and acid, sweet, salty, bitter in the lower
row. Along the bottom (also double) layers Ney has a series of boxes with the overall label
"consistency". The upper boxes of the bottom layer are fat, starches and proteins. The lower
layer consists of ethanol, water and gases (mainly CO2) which are the media in which the
above components will be found.
NATURAL FLAVOURS: PLANTS AS A SOURCE OF NATURAL FLAVOURINGS
Flavours are considered to be natural if they are obtained exclusively by physical or fermentative
methods from natural original materials (Jones, 1982). Examples of physical methods are
pressing, distillation, extraction, concentration and chromatography. Fermentative methods are
understood to cover the formation of flavouring agents by enzyme catalysis, microorganisms and
plant cell cultures. The fermentative methods are also known as biotechnological methods.
Flavouring materials of natural origin can be defined as follows (Heath and Reineccius, 1986):
• Natural aromatic raw materials. Plants, vegetable and /or animal products used for
their flavouring properties, either as such or as processed for human consumption
• Natural flavours. Concentrated preparations obtained exclusively by physical
means from natural aromatic raw materials
• Natural flavouring substances. Substances isolated from natural aromatic raw
materials exclusively by physical means.
Even now, plants still remain the main universal source for making natural flavourings of food
grade. Besides their flavourful properties, they also contain nutrients. With careful choice, plants
can provide a quite adequate balance of the protein, carbohydrates, fats, vitamins and mineral
acids required for a healthy diet (Heath, 1981). However, many plants are more valuable for
their aromatic properties, the spectrum of which is immense. Some must be regarded as
fragrances, whereas others are primarily of value as flavourants, but in the creation of imitation
flavourings and fragrance compounds the demarcation is very imprecise. Hodge and Bailey
(1975) reviewed the history and botanical classification of flavour-producing plants, the broad
Chapter 1
extent of which emphasises the problems of classification of sensory attributes and the difficulty
of selecting those of major interest to the flavourist.
Plant material contains both volatile and non-volatile constituents, which affect their odour
and/or flavour profile as well as their sensory impact. The volatile constituents give the plant its
distinctive odour whereas the non-volatile constituents are either inert (e.g. cellulose) or
influence some gustatory reaction (e.g. bitterness, pungency, astringency, etc.) sometimes
coupled with a physiological effect, e.g. coffee, cocoa leaves (Fisher and Scott, 1997). The
intensity and quality of these effects show very wide variations between plant families and
species. Although, the specific aromatic profiles remain recognisable and within acceptable
limits, a quantitative variation is often observed between different crops and batches of the same
plant material and also between the several parts of the plant that may be used (Huopalahti and
Linko, 1983; Bylaite et al.; 1996; Fiorini et al.; 1997; Arganosa et al., 1998; Perry et al., 1999;
Munne-Bosch et al., 2000).
PROCESSING OF AROMA PLANTS
The excessively wetness of freshly harvested herbs makes their shelf life and application as
flavouring material rather limited. To extend their seasonal availability and to have them in the
most convenient form for handling, most of this plant material requires further processing. The
degree of finesse of the processed aroma of herbs and spices is determined by its ultimate use
(e.g. distillation, extraction, blended seasonings) (Heath and Reineccius, 1986).
The most common ways to process plant material are the following:
Drying
Domestically, fresh herbs are widely used in the form of a bouquet garni, fines herbes, etc., as
these have a better aroma and flavour than the dried forms. However, on a commercial scale, the
dried form is much easier to handle.
Chapter 1
To achieve a stable product, the water content must be reduced from about 60-80% in the fresh
herb to 5-10% in the dried. If this is carried out under optimum conditions the colour of the herb
is retained and flavour losses are reduced to a minimum (Jaganmohan-Rao et al., 1998; Bartley
and Jacobs, 2000). Excessive heat results in an unacceptable degree of browning, the loss of
freshness and the imposition of off-odour which detracts from the overall profile (Masanetz and
Grosch, 1998; Masanetz et al., 1998). Most herbs are dried naturally in the shade but artificial
drying at a maximum temperature of 40°C and also freeze-drying are increasingly being used.
Comminution
To make herbs and spices easier to incorporate directly into food products, most of them require
processing such as commination, which is also an essential first stage in the extraction or
distillation process. The reduction in particle size enables solvent or steam to penetrate and come
into close contact with the cellular tissues containing the active constituents (Murthy et al.,
1999). Comminution can directly affect the quality and keeping properties of the resulting
material in the following ways:
• by exposing the material to high temperature during the grinding process
• by exposing the volatile oil in ruptured cellular tissues to losses by evaporation
and/or oxidative changes
• by altering the physical character of the product, thereby affecting its subsequent
shelf life and value as a flavouring material.
Elimination of microbiological spoilage
Herbs and spices are particularly susceptible to bacteria, spores, moulds and yeasts, some of
which may be pathogenic or toxigenic (Krischnaswamy et al., 1973). For food processing,
microbiological spoilage can be significantly alleviated or eliminated by the following processes:
• exposure of herbs to sterilant gases or gamma-irradiation
• sterilisation by heat processing
• distillation and/or extraction techniques to isolate the flavouring components of the
spice: obtaining essential oils and extracts.
Chapter 1
ESSENTIAL OILS
Essential oils, also known as essences or volatile oils, are complex mixtures of volatile
substances located in the plant within distinctive oil cells (Lawrence, 1995). Resulting from the
distillation essential oils are basically free of bacterial contamination and form the basis of a
whole range of products for direct incorporation into food mixes. Moreover, some of them
possess antimicrobiological activity (Rafiq-Siddiqui et al., 1996; Sivropoulu et al., 1997; Lis-
Balchin et al., 1998; Mazzanti et al., 1998; Delaquis et al., 1999).
Constituents of essential oils include hydrocarbons and their oxygenated derivatives which
comprise alcohols, acids, esters, aldehydes, ketones, amines, sulphur compounds, etc. Mono-,
sesqui- and even diterpenes constitute the composition of a majority of essential oils. In addition,
the phenyl propanoids, fatty acids and their esters are also encountered in a number of essential
oils. These products give to the plant its distinctive and often diagnostic odour (Fisher and Scott,
1997). Their nature and relative proportions are determined by the plant species and agricultural
factors such as environment, climate, soil conditions, time of harvesting and post-harvesting
handling prior to distillation (Heath, 1981; Hussien, 1995; Chalcat et al., 1997; Chang-Hwan-
Cho et al., 1997; Mallavarapu et al., 1999; Miraldi, 1999; Sefidkon et al., 1999; Schaller and
Schnitzler, 2000).
Essential oils used in flavourings can be categorised as follows (Lawrence and Shu, 1993):
• Common herbs (sage, rosemary, marjoram, basil, oregano, thyme, parsley,
spearmint, peppermint)
• Spices (black pepper, nutmeg, clove bud, ginger, cardamom)
• Aromatic seeds/fruit (anise, caraway, cumin, coriander, carrot, celery, dill, parsley)
• Aromatic roots (angelica, lovage, valerian)
• Citrus (orange, lemon, lime, grapefruit, bergamot, mandarin)
• Conifers (balsam fir, pine needle, cedar leaf)
• Fragrant herbs (lavender, melissa, hyssop, geranium, tagetes, Roman camomile)
• Tree leaves (clove, cinnamon, laurel, eucalyptus, lemon, mandarin)
• Bark (massoia, cascarilla)
• Wood (rosewood, sandalwood, cedar)
Chapter 1
• Florals (rose, jasmine, mimosa, cassie)
• Grass (lemongrass, palmarosa, citronella)
• Buds/seeds/fruits and other organs star anise, clove stem, juniper berry,
blackcurrant bud, hop)
Another way of looking at these oils is to categorise them according to whether they are rich or
poor in monoterpene hydrocarbons, sesquiterpene hydrocarbons, oxygenated constituents,
phenols or phenol esters. Finally they can be grouped together according to their major
component (Lawrence and Shu, 1993):
• 1,8-cineole rich oils
• Eugenol rich
• Anethole rich
• Linalool/linalyl acetate rich
• Carvone rich
• Methyl chavicol rich
• Carvacrol/thymol
They define four classification systems depending on the application:
• Botanical (depending either upon plant form or on botanical family associations)
• Agronomic (based on the nature and extent of cultivation)
• Physiological (based on the tradition and widespread use of natural plant materials
as remedies)
• Organoleptic (based on sensory attributes which are related to the prime aromatic
constituents or in some cases non-volatile components,)
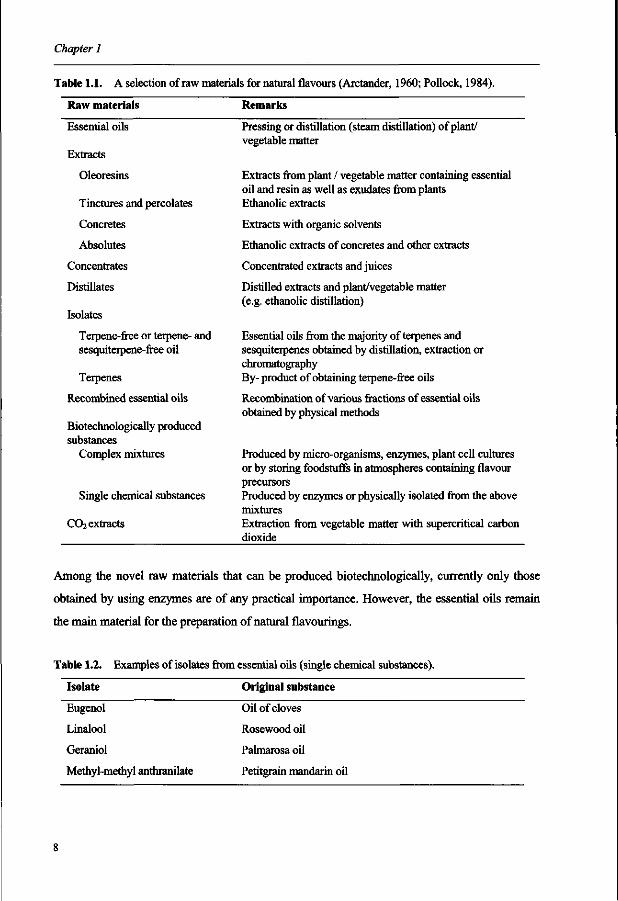
Table 1.1 shows a selection of raw materials used for natural flavours. They are obtained by
physical or fermentative methods.
Among the traditional raw materials, the isolates are growing increasingly more important. Table
1.2 shows some examples of isolates from essential oils. These are single chemical substances.
Chapter 1
Table 1.1. A selection of raw materials for natural flavours (Arctander, 1960; Pollock, 1984).
Raw materials Remarks
Essential oils
Extracts
Oleoresins
Tinctures and percolates
Concretes
Absolutes
Concentrates
Distillates
Isolates
Terpene-free or terpene- and sesquiterpene-free oil
Terpenes
Recombined essential oils
Biotechnologically produced substances
Complex mixtures
Single chemical substances
CO2 extracts
Pressing or distillation (steam distillation) of plant/ vegetable matter
Extracts from plant / vegetable matter containing essential oil and resin as well as exudates from plants Ethanolic extracts
Extracts with organic solvents
Ethanolic extracts of concretes and other extracts
Concentrated extracts and juices
Distilled extracts and plant/vegetable matter (e.g. ethanolic distillation)
Essential oils from the majority of terpenes and sesquiterpenes obtained by distillation, extraction or chromatography By- product of obtaining terpene-free oils
Recombination of various fractions of essential oils obtained by physical methods
Produced by micro-organisms, enzymes, plant cell cultures or by storing foodstuffs in atmospheres containing flavour precursors Produced by enzymes or physically isolated from the above mixtures Extraction from vegetable matter with supercritical carbon dioxide
Among the novel raw materials that can be produced biotechnologically, currently only those
obtained by using enzymes are of any practical importance. However, the essential oils remain
the main material for the preparation of natural flavourings.
Table 1.2. Examples of isolates from essential oils (single chemical substances).
Isolate Original substance
Eugenol
Linalool
Geraniol
Methyl-methyl anthranilate
Oil of cloves
Rosewood oil
Palmarosa oil
Petitgrain mandarin oil
Chapter 1
Apart from the advantages of being hygienic, free from enzymes, and possessing good flavour
quality consistent with the source raw material; the essential oils also exhibit some
disadvantages such as difficult handling because of their concentrated, liquid and often viscous
state, their tendency to oxidate too readily, and not being easily dispersible, particularly in dry
products. To avoid these problems and facilitate better handling, the essential oils can be further
processed in order to obtain dry, free-flowing solid state products. This requires that the liquid
flavour chemicals are either adsorbed on a dry carrier or encapsulated in inert edible polymers.
The most common way of obtaining solid flavourings is by encapsulation.
ENCAPSULATION
Many food products for which development was thought to be technically unfeasible are made
possible today because of the wide availability of encapsulated ingredients. Such ingredients
are products of a process that totally envelops the ingredient in a coating or "capsule", thereby
conferring many useful and otherwise unusual properties to the original ingredient. In a broad
sense, encapsulation technology includes the coating of minute particles of ingredients (e.g.
acidulants, fats, and flavours) as well as whole ingredients (e.g. raisins, nuts and confectionery
products), which may be accomplished by microencapsulation and macro-coating techniques,
respectively. It can also be defined as a physical process where thin films or polymer coats are
applied to small solid particles, droplets of liquids or gases (Bakan, 1973). The material coated
or entrapped is referred to by various names, such as core material, payload, actives or internal
phase. The material forming the coating is referred to as the wall material, carrier, membrane,
shell or coating. Excellent reviews of microencapsulation technology have been written, as
applied to foods (Balassa and Fanger, 1971; Dziezak, 1988; Jackson and Lee, 1991; Gibbs et al.,
1999) and to food flavours (Reineccius, 1989,1991; Benczedi and Blake, 1999).
Aromas, as a rule, are complex mixtures of more or less volatile substances and labile
components which can change as a result of oxidation, chemical interactions or vaporisation. In
order to minimise the danger of this happening, microencapsulation processes are widely used in
the flavour industry to entrap liquid flavouring substances in a carrier matrix and convert them
into dry, free-flowing materials. In addition, protecting against external influences (oxidation,
water, light and so on), reducing the volatility of the flavouring substances (better storability),
Chapter 1
microencapsulated dry products facilitate easier handling in the application and, by selection of
the correct carrier matrix, they play a crucial role in making some applications possible at all.
With some encapsulation techniques, the product can be designed to either release slowly over
time or to release at a certain point (Reineccius, 1995; Tuley, 1998; Benczedi and Blake, 1999).
Encapsulation can be also used to separate components of a flavouring that react with each other
such as acetaldehyde and methyl anthranilate.
Overall flavouring costs can be reduced in comparison to "liquid applications" as a result of
clearly improved storability and a certain amount of control over the release of flavour in the
application.
To select the "right" microencapsulation process, the following points should be examined and
taken into account from the outset (Eckert, 1995):
• type of raw materials employed (natural, nature-identical, artificial)
• what auxiliary substances are incorporated (solvents, carrier substances)
• solubility of the liquid flavour (water soluble, oil soluble)
• world-wide legislation, food regulations, requirements and legality; application-
specific processing parameters which the microencapsulated flavour must withstand
• when and how aromatisation takes place
• flavour-release mechanism
• requirements regarding particle size, bulk density and storability
• dosage guidelines for the selection of the optimal flavour loading
• price guidelines/aromatising costs.
Principles and techniques
There are many techniques that can be used to microencapsulate food ingredients. The selection
of the method depends on economics, sensitivity of core, size of microcapsules desired,
physical/chemical properties of both core and coating, applications for the food ingredient and
the release mechanism.
10
Chapter 1
While the encapsulation techniques used in the industry are numerous, spray drying and
extrusion are the two major commercial processes in terms of product volume. Minor techniques
would include freeze drying, coacervation, fat or wax encapsulation and inclusion in
cyclodextrins.
Spray drying
Spray drying is the oldest commercial technique for producing encapsulated flavourings
(Reineccius, 1988). Food ingredients entrapped by this method also include fats, oils and flavour
compounds (Re-Mi, 1998). In addition to being an encapsulation process, spray drying is also a
dehydration process and is used in the preparation of dried materials such as powdered milk. The
spray-drying process involves three basic steps:
1. Preparation of dispersion or emulsion to be processed
2. Homogenisation of the dispersion
3. Atomisation of the mass into a drying chamber.
A typical system used in spray drying is displayed in Fig. 1.2.
Homogenizer
^J^VUo Mix tank Surge
tank Feed pump
Fig. 1.2: Typical system used in spray -drying.
11
Chapter I
The material to be atomised is prepared by dispersing an active (core) material, usually a flavour
or oil, into a solution of the coating (wall) with which it is immiscible. The most generally used
wall materials for the encapsulation of food flavours by spray drying are vegetable gums (gum
acacia, gum traganth), starches, modified starches, dextrins, proteins and sugars (Balassa and
Fanger, 1971). A typical ratio of carrier to core material is 4:1; however, in some applications
higher flavour loads can be used.
Following the addition of an emulsifier, the mixture is homogenised to give an oil-in-water type
of emulsion and to create small droplets of flavour or ingredient within the carrier solution.
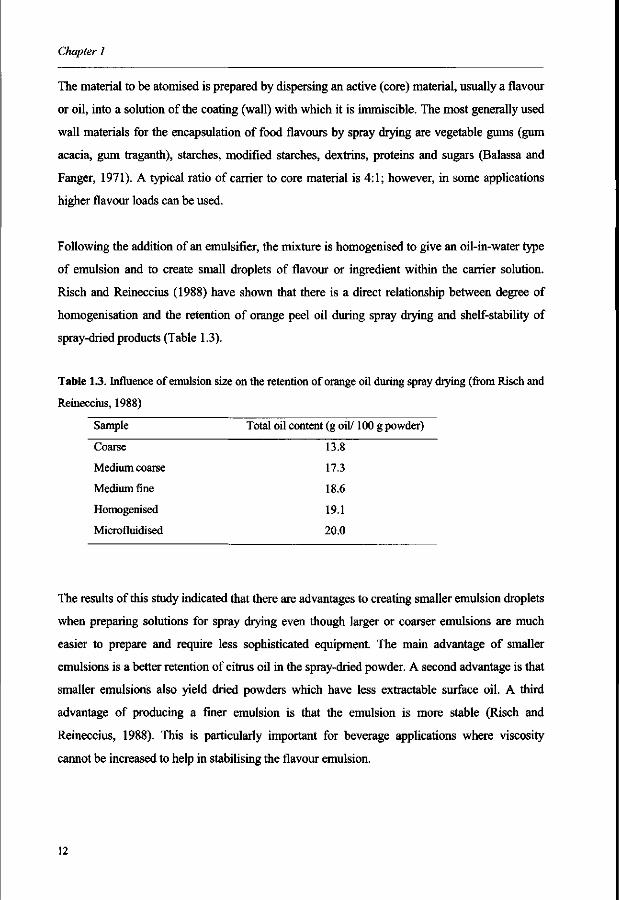
Risch and Reineccius (1988) have shown that there is a direct relationship between degree of
homogenisation and the retention of orange peel oil during spray drying and shelf-stability of
spray-dried products (Table 1.3).
Table 1.3. Influence of emulsion size on the retention of orange oil during spray drying (from Risch and
Reineccius, 1988)
Sample Total oil content (g oil/ 100 g powder)
Coarse 13.8
Medium coarse 17.3
Medium fine 18.6
Homogenised 19.1
Microfluidised 20.0
The results of this study indicated that there are advantages to creating smaller emulsion droplets
when preparing solutions for spray drying even though larger or coarser emulsions are much
easier to prepare and require less sophisticated equipment. The main advantage of smaller
emulsions is a better retention of citrus oil in the spray-dried powder. A second advantage is that
smaller emulsions also yield dried powders which have less extractable surface oil. A third
advantage of producing a finer emulsion is that the emulsion is more stable (Risch and
Reineccius, 1988). This is particularly important for beverage applications where viscosity
cannot be increased to help in stabilising the flavour emulsion.
12
Chapter 1
The core/wall material is fed into a spray dryer in which it is atomised through a nozzle or
spinning wheel into a heated airstream supplied to the drying chamber. As the atomised particles
fall through the gaseous medium, they assume a spherical shape with the oil encased in the
aqueous phase. This explains why most spray-dried particles are water-soluble. The rapid
evaporation of water from coating during its solidification keeps the core temperature below
100°C. The particles are exposed to heat for a few seconds at most. Thus, the main advantage of
this method is its ability to handle many heat-labile materials. However, because any material
such as a flavour may contain as many as 20-30 different components (alcohols, aldehydes,
esters and ketones) with boiling points ranging from 38°C to 180°C, it is possible to lose those
aromatics that have a low boiling point during the drying process (Taylor, 1983). The choice of
drying inlet and exit air temperatures is determined primarily by the carrier matrix and flavour
being dried. Some natural flavouring materials (e.g. cheese, tomato puree) may suffer from heat
damage when dried using high exit air temperatures. In terms of flavour retention, high exit air
temperatures have been found to be beneficial to the retention of water-soluble flavours
(Reineccius and Coulter, 1969).
The advantages of spray drying include low processing costs and readily available equipment. It
generally provides good protection to the core material and there is a wide variety of wall
material available. One main disadvantage is that it produces a very fine powder which needs
further processing, such as agglomeration, to instantise the dried material or to make it more
readily soluble if it is for a liquid application (Risch, 1995). Due to the heat required for
evaporation of water from the system, spray drying is not good for heat-sensitive materials (King
1990; Jackson and Lee, 1991).
A modification of the spray drying process that is suitable for encapsulating highly volatile or
thermolabile substances is called the "cold dehydration process", which was proposed by
Zilberboim et al. (1986a). Here, an emulsion of core material in coating material solution is
sprayed into a dehydrating liquid such as ethanol or polyglycols at room temperature or below.
The microcapsules are recovered by filtration and vacuum dried at a low temperature.
Additional work by Zilberboim et al. (1986b) studied the microcapsules produced by this
technique in an attempt to determine the effects of different process parameters on retention and
13
Chapter I
shelf life. This method does provide an alternative to the high temperatures encountered in spray
drying; however, the lack of easily available equipment to accomplish it in a continuous flow
instead of as a batch operation makes it much more costly than spray drying. There are no
significant commercial applications of this procedure; however, it does provide an alternative for
expensive, heat-labile materials where the additional cost might be justified.
A modification of spray drying - the Leaflash spray dryer - has been proposed by Bhandari et al
(1992). In this drying technique, the hot air flowing at a very high velocity in the converging
section of the dryer head atomises and simultaneously dries the resulting atomised droplets. The
vibration and turbulent rotational motion of the droplets caused by impact of whirling hot air
during atomisation enhances the transfer rate. Thus, drying time is reduced and it is possible to
use a much higher inlet air temperature (i.e. 450°C). The enhanced drying rate also permits the
use of a dryer chamber of reduced volume. Moreover, this atomising system is capable of
atomising the liquid at relatively high viscosities, which permits an increase in the total solids
content in the feed (Bhandari et al., 1992).
Extrusion
Extrusion is the second most frequently used process, after spray drying, for encapsulating
flavours (Reineccius, 1989; Gunning et al., 1999). Encapsulation by extrusion involves
dispersion of the core material in a molten carbohydrate mass (Risch and Reineccius, 1988).
This mixture is forced through a die into a dehydrating liquid which hardens the coating to trap
the core material. The strands or filaments of hardened material are broken into small pieces,
separated and dried. A typical process involves mixing flavour materials with hot corn syrup or
modified starch (120°C) and extruding the mixture as pellets into a cold solvent bath such as
isopropanol. The cold solvent solidifies the syrup into an amorphous solid and washes residual
flavour oil from the surface. Capsules obtained by this technique give a good protection of the
flavour, which usually represents 10-25% of the product mass
Coacervation
Microencapsulation by coacervation is not extensively used by the food industry since it is
complicated and expensive. However, most scientists consider it the true microencapsulation
14
Chapter 1
process in that the wall material completely surrounds the core with a continuous coating of wall
material (Soper, 1995). Very few food grade polymers are available (gum arabic, gelatin) for use
as coatings. Microencapsulation by coacervation involves three steps. First, three immiscible
phases: the continuous phase (water), the material to be encapsulated and the coating material
are mixed (Blenford, 1986). In the second step, the coating is deposited on the core material.
This is accomplished by changing pH, temperature or ionic strength which results in a phase
separation (coacervation) of the coating and its entrapment of dispersed core (Bakan, 1973).
Finally, the coating is solidified by thermal, crosslinking or desolvant techniques.
Inclusion complexation
Inclusion complexation is the only method of encapsulation that takes place on a molecular
level. It uses p-cyclodextrin to complex and entrap molecules (Hedges et al., 1995; Bhandari et
al., 1998, 1999; Yoshii et al., 1998). Cyclodextrins were used to stabilise emulsions and foams
and to protect sensitive food ingredients from light, heat and oxygen. Cyclodextrins consist of 7
glucose units linked 1-4 and are formed by enzymatic degradation of corn starch with alpha
amylase, followed by treatment with the enzyme cyclodextrin transglycosylase. The functional
properties of cyclodextrins are conferred by the difference in the hydrophobicities between the
centre and outside of the molecule. The outer surface of cylodextrin is hydrophilic in nature due
to hydroxyl groups. The centre of cyclodextrin is hydrophobic as it is lined with glycosidic
oxygen bridges. Compounds able to form inclusion complexes with cyclodextrins are
hydrophobic or have hydrophobic side groups. The hydrophobic portion of the guest molecule
forms stable non-covalent interactions with the centre of the cyclodextrins. This complex
becomes less soluble and will precipitate out of solution. (Saenger, 1980).
Summarising the description of microencapsulation processes for flavours and their applications
in the food industry, it becomes clear, that there are still many starting points for further
intensive research and development in this field. These will be aimed at improving existing
processes and making new ones available, thus being able better to adapt and optimise the
additive "flavour" for both existing and new uses.
15
Chapter 1
Table 1.4: Examples of applications of microencapsulated flavours
Products Applications
Lemon flavour emulsified
Lemon compound
Punch-cloudicol flavouring
Strawberry flavour spray-dried
Condensed milk flavour spray-dried
Rum flavour spray-dried
Red wine flavour natural spray-dried
White wine flavour natural spray-dried
Nutmeg extract natural spray-dried
Black pepper extract natural spray-dried
Thyme extract natural spray-dried
Banana-Neorome fruit powder spray-dried
Strawberry-Neorome fruit powder spray-dried
Orange-Neorome fruit powder spray-dried
Amaretto flavour vacuum dried
Green soup vegetable extract mixture,
vacuum dried
Cyclodextrin products
(e.g. garlic oil in cyclodextrin)
Colouring foodstuffs
Spray-dried spinach
Spray-dried turbidifying solids (food colour)
+Tang type orange-flavour, spray-dried
Expanded sugar goods, gums
Drinks
Expanded sugar goods
Desserts
Instant sauces
Instant sauces
Instant soups
Instant baby foods
Diet products
Waffle fillings
Instant coffees
Instant soups
At present pharmaceutical products
Pasta
Drinks powders
FLAVOUR ISOLATION AND ANALYSIS
Normally the concentration of aromatic compounds in food is very low. Only in such aroma-rich
products as spices, herbs, distilled alcoholic beverages and coffee does the sum of volatiles
exceed 0.1% (Rothe, 1988). The techniques applied for the recovery of volatiles have to meet
the following important criteria: (1) all compounds making an important contribution to a certain
flavour should be extracted in the correct proportions, (2) the techniques applied should not alter
16
Chapter 1
the structure of key aromatic compounds and (3) non-volatile compounds which could interfere
with the gas chromatographic separation should be removed completely (Engel et al., 1999).
The method most often applied to recover volatiles from plant material is distillation, which uses
the high volatility of aromatic compounds and dates back to the ninth century. Although the
actual process has not changed much over the centuries, the method used has been refined and
modified to give optimum yields under conditions which can be controlled. Actual yields and
quality depend on the nature of the feed materials, the methods used in their handling, pre-
treatment and speed of processing after comminution. Modern distillation techniques comprise
water, steam, water and steam categories. Generally water distillation gives the finest quality oils
as with this technique there is less chance of damage to sensitive components of the essential oil
and giving a burnt character which can result from internal condensation and flowback of an
aqueous extract onto the exposed steam injection coils (Heath and Reineccius, 1986). The
advantage of distillation is complete separation of all non-volatile components. They are
normally present in higher amounts than the volatiles, which would be expected to interfere with
component isolation and subsequent identification (Lawrence and Shu, 1993).
To ensure that all volatiles are recovered, the combined simultaneous steam and organic solvent
distillation using Likens-Nickerson apparatus or similar can be used. However each distillation
technique has its disadvantage. Steam distilled samples are boiling, so destruction of
components as well as formation of artefacts is possible (Weurman, 1969; Fisher et al., 1988;
Schieberle, 1995). Recently, a compact and versatile distillation unit has been developed for the
fast and safe isolation of volatiles from complex food matrices (Engel et al., 1999). In
connection with a high vacuum pump, the new technique, designated solvent assisted flavour
evaporation (SAFE), allows the isolation of volatiles from either solvent extracts, aqueous foods
or even matrices with a high oil content free from non-volatile matrix compounds. Thus, the
method of isolating volatiles has to be chosen very carefully.
Steam or water distilled essential oils do not necessarily reflect the composition of the actual
odour of an aromatic plant. Essential oils are mostly artefacts formed during the distillation
(Baser, 1995). The headspace technique aims at capturing the real odoriferous compounds of a
plant material. It can be applied to live or cut flowers and to anything that smells. Static
17
Chapter 1
headspace provides an equilibrium of compounds which are perceived by odour and contributes
to the identification of volatile constituents which are detected by a human nose above the food
(Guth and Grosch, 1993). However, the method is limited to the level of detection and
identification of organic volatiles and especially semi-volatiles (Arino et al., 1999). Relatively
low sensitivity is achieved with this method due to the limited volume of headspace gas to be
injected into the gas chromatograph. The detection threshold capabilities of GC detectors and
mass spectrometers prevent the detection of trace levels of odours often present in headspace
despite the fact that these compounds are often odour-significant even at low concentrations.
Attempts to increase sensitivity by injecting larger amounts of headspace gas result in loss of
chromatographic resolution due to the inability to focus the large injection volume in a relatively
narrow chomatographic zone. This invariably results in severe peak broadening and loss of
sensitivity (Hartman et al., 1993). To concentrate volatiles prior to the injection into the gas
chromatograph, the dynamic headspace technique DHS is currently being used. This technique
is more sensitive and permits a wider range of analysis of volatiles. It involves sweeping of the
volatiles released from the food with a stream of purified carrier gas such as helium or nitrogen
and trapping them onto adsorbents such as Tenax, charcoal or by cryogenic means (Morton and
MacLeod, 1982). The volatiles trapped onto adsorbents can be injected to GC by thermal
desorption or by eluting them with proper solvent from the adsorbent. In this way, the sensitivity
of recovering volatiles can be increased, permitting the analysis of volatiles present at the parts
per billion (ppb) level routinely.
The identities of many of the individual volatile components present in food aroma isolates
can be established rapidly by GC-MS analysis. However, the complexity of the volatiles from
many foodstuffs is such that important components, especially those present in trace amounts,
are often either poorly separated from or totally masked by other compounds. Consequently,
the interpretation of their mass spectra may be very difficult. It is possible to apply a variety of
procedures, of which some serve to reduce the complexity of the sample and facilitate final
identification by GC-MS while others provide a great deal of independent information not
readily obtained by other means.
18
Chapter 1
The GC technique is very important for aroma analysis and the power of both spectroscopic
and chemical methods of identification is most effectively exploited when allied to its high
separating power and sensitivity.
Progress in instrumental analysis has led to a long list of volatiles. Unfortunately, the sensory
relevance of these volatile compounds has not been extensively evaluated by identifying
impact compounds. Therefore, one of the major problems in aroma research is to select those
compounds, which significantly contribute to the aroma of a food. In general, the aroma of a
food consists of many volatile compounds, and only a few them are sensorially relevant
(Blank, 1997). GC in combination with olfactometric techniques (GC-O) is a valuable method
for the selection of aroma-active components from a complex mixture (Grosch, 1993).
Experiments based on characterising the odours of single compounds emerging from the GC
sniffing ports by volunteers, are described as GC-O or GC sniffing. This technique helps to
detect potent odorants without knowing their chemical structures. Experience shows that
many key aroma compounds occur at very low concentrations; their sensory relevance is due
to low odour thresholds. Thus, the peak profile obtained by GC-FID does not necessarily
reflect the aroma profile of a food (Blank, 1997). In GC-O, the human nose is the detector
used for evaluating the effluent of the GC.
FLAVOUR RELEASE
The driving force for the flavour release of volatile compounds is the deflection from the
thermodynamic equilibrium between the product phase and the gas phase. Equilibrium exists if
the concentration in the respective phases obey the relation:
Kg, — Cg/Cp
where Kg, is the equilibrium partition coefficient between gas and product phase, which is
determined by the volatility and solubility of the flavour compound. Cg and Cp represent the
concentrations in the gas and product phase, respectively. As flavour compounds are usually
presented in highly diluted solutions, Cg and Cp are related by Henry's law when equilibrium
19
Chapter 1
exists. If the actual partition coefficient is smaller than Kg,, flavour will be released (Overbosch
etal., 1991).
Besides the partition coefficient, the resistance to mass transfer is a major factor determining the
rate and extent of flavour release. Partitioning of flavour compounds is affected by the
composition of the food (Druaux and Voilley, 1997). Non-equilibrium is the driving force for
mass transport and the rate at which equilibrium is achieved, is determined by the resistance to
mass transfer (De Roos and Wolswinkel, 1994). Most studies in this area dealt with partition
phenomena; in particular with the effect of medium composition on the equilibrium headspace
concentrations, but they were limited to simplified food models. The first studies on the
partitioning of volatile compounds between air and water were conducted by Buttery et al.
(1969, 1971). They reported that, of all food components, lipids affect equilibrium headspace
concentrations most. Consequently, the investigations on the threshold concentrations of
aromatic compounds have showed that aroma efficacy is lower in a fat medium than in aqueous
systems (Guadagni et al., 1972). A mathematical model developed by Harrison and Hills (1997)
to describe flavour release from aqueous solutions containing flavour-binding polymers
suggested that in most experimental situations, the rate-limiting step for flavour release is not the
chemical binding step but the transport of aroma across the liquid/gas interface. Bakker et al.
(1998) confirmed that transfer of diacetyl flavour molecules across the liquid-gas interface is
rate limiting and is adequately described by the penetration theory of mass transfer.
Tyszkiewicz and Jackowska (1982) have demonstrated a relationship between concentration and
odour intensity of caraway extract in different media. They found large differences in the
threshold values. In comparison with lipids, hydrophilic food components revealed frequently a
limited effect on the concentrations of flavour compounds in the headspace over aqueous
solutions. The presence of proteins (Overbosch, 1991) resulted in weak unspecific hydrophobic
interactions only. Studies on the interactions occurring between volatile compounds and
hydrocolloids showed that the addition of xanthan and guar gum lowered flavour release
compared to that from water (Yven et al., 1998).
It is clear that flavour release from certain products depends not only on the interactions between
different aroma components but also on the medium of the product. So, one should expect that
20
Chapter 1
products with a different state (dried herbs, essential oils, oils encapsulated to different media),
even though they possess the same flavour constituents, will exhibit different dynamics and rates
of flavour release. This aspect should be taken into account for prediction of odour perception
and control of aroma in the final products.
SCOPE OF THE THESIS
The objective of the study described in this thesis was to evaluate the flavour of aromatic plants
grown and cultivated in Lithuania and to examine some aspects of flavour release and
processing, i.e. emulsification and encapsulation.
For this purpose, a number of plants with different chemical composition were selected for the
isolation and investigation of their volatile constituents. Furthermore, some factors such as
harvesting time, fertilisation, variety and anatomical part of the plant were also investigated
because of their influence on yield, and on the qualitative and quantitative composition of
essential oils in plants.
Investigations into the chemical composition of volatiles of different plants and the factors that
have an influence on volatile composition are described in Chapters 2, 3 and 4. Two plants
(lovage and caraway) were chosen for further examination: lovage because of conflicting data on
its odorant characteristics; and caraway because of the suitability of its chemical composition for
modelling studies. Chapter 5 deals with comparisons of flavour composition and release in
different isolation conditions: the isolation of volatiles was achieved by DHS. In addition to gas
chromatography and mass spectrometry, olfactometric analysis (gas chromatography-snifTing
port) has also been used to determine the aroma of lovage. Chapters 6 and 7 present studies on
the application of caraway essential oil for preparing and obtaining flavourings. The formation
of oil-in-water emulsions with flavour substances and the properties of the caraway oil-in-water
interfaces thus formed are described in Chapter 6. Finally, in Chapter 7, the complex
behaviour and properties of encapsulated caraway oil products are described, together with the
microstructural features of capsules.
21
Chapter 1
REFERENCES
Acree, T. E.; Barnard, J. Gas chromatography-olfactometry and Charm Analysis. In Trends in
Flavour Research; Maarse, H., Van der Heij, D. G., Eds.; Elsevier Science Publishers B.
V.: Amsterdam, 1994; pp 211-220.
Arctander, S. Perfume and flavour materials of natural origin. Arctander Publication,
Elizabeth, NJ, USA, 1960.
Arganosa, G.C.; Sosulski, F.W.; Slikard, A.E. Seed yields and essential oil of northern-grown
coriander {Coriandrum sativum L.). J. Herbs Spices Med. Plants 1998, 6, 23-32.
Arino, A.; Arberas, I.; Renobales, G.; Dominguez, J.B. Influence of extraction method and
storage conditions on the volatile oil of wormwood {Artemisia absinthium L.). Eur.
Food Res. Technol. 1999, 209, 126-129.
Bakan, J. A. Microencapsulation of foods and related products. Food Technol. 1973, 27, 11-
44.
Bakker, J.; Boudaud, N.; Harrison, M. Dynamic release of diacetyl from liquid gelatin in the
headspace. J. Agric. Food Chem. 1998, 46, 2714-2720.
Balassa, L.L.; Fanger, G.O. Microencapsulation in the food industry. CRC Critical Reviews in
Food Technology 1971, July, 245-263.
Bartley, J.P.; Jacobs, A. Effects of drying on flavour compounds in Australian-grown ginger
(Zingeber officinale). J. Sci. Food Agric. 2000, 80, 209-215.
Baser, H.C.K. Analysis and quality assessment of essential oils. In A manual on the essential
oil industry, Tuley de Silva (ed.); United Nations industrial development organization,
Vienna, 1995; pp 155-178.
Benczedi, D.; Blake, A. Encapsulation and the controlled release of flavours. Leatherhead
FoodRA Foodlnd. J. 1999, 2, 36^7.
Bhandari, B.R.; Dumoilin, E.D.; Richard, H.M.J.; Noleau, I.; Lebert, A.M. Flavour
encapsulation by spray drying: application to citral and linalyl acetate. J. Food Sci.
1992,57,217-221.
Bhandari, B.R.; D'Arcy, B.R.; Bich, L.L.T. Lemon oil to P-cyclodextrin ratio effect on the
inclusion efficiency of p-cyclodextrin and the retention of oil volatiles in the complex. J.
Agric. Food Chem. 1998, 46, 1494-1499.
22
Chapter 1
Bhandari, B.R.; D'Arcy B.R.; Padukka, I. Encapsulation of lemon oil by paste method using
(3-cyclodextrin: encapsulation efficiency and profile of oil volatiles. J. Agric. Food
Chem. 1999,47, 5194-5197.
Blank, I. Gas chromatography - olfactometry in food aroma analysis. In Techniques for
analyzing food aroma; Marsili, R. (ed.), Marcel Dekker, Inc. New York, 1997; pp 293-
330.
Blenford, D. Fully protected. Food Flavor Ingred. Proc. Pckg. 1986, July, 43.
Buttery, R.G.; Ling, L.C.; Guadagni, D.G. Food volatiles: volatilities of aldehydes, ketones
and esters in dilute water solution. J. Agric. Food Chem. 1969, 17, 385-389.
Buttery, R.G.; Bomben, J.L.; Guadagni, D.G; Ling, L.C. Some considerations of the
volatilities of organic flavour compounds in foods. J. Agric. Food Chem. 1971, 19,
1045-1048.
Bylaite, E.; Legger, A.; Roozen, J. P.; Venskutonis, P. R. Dynamic headspace gas
chromatography of different botanical parts of lovage (Levisticum officinale Koch.). In
Developments in flavour science; Taylor, A. J., Mottram, D. S. (eds.); The Royal Society
of Chemistry, UK, 1996; pp 66-69.
Chalcat, J.C.; Michet, A.; Pasquier, B. Influence of harvesting time on chemical composition
of Mentha piperita L. essential oil. Perfum. Flavor. 1997, 22, 17-21.
Chang-Hwan-Cho; Jong-Chul-Lee; Young-Hyun-Choi; Ouk-Kyu-Han. Effects of temperature,
light intensity and soil moisture on growth, yield and essential oil content in valerian
(Valeriana fauriei var. dasycarpa Hara). Korean J. Crop Sci. 1997, 42, 22-32.
Delaquis, P.J.; Ward, S.M.; Holley, R.A.; Cliff, M.C.; Mazza, G. Microbiological, chemical
and sensory properties of pre-cooked roast beef preserved with horseradish essential oil.
J. Food Sci. 1999, 64, 519-524.
De Roos K.B.; Wolswinkel K. Non-equilibrium partition model for predicting flavour release
in the mouth. In Trends in flavour research, eds. H. Maarse, D.G. van der Heij. Elsevier
Science, Amsterdam, The Netherlands, 1994; pp 15-32.
Druaux, C; Voilley, A. Effect of food composition and microstructure on volatile flavour
release. Trends Food Sci. Technol. 1997, 8, 364-368.
Dziezak, J.D. Microencapsulation and encapsulated ingredients. Food Technol. 1988, 42,
136-151.
23
Chapter 1
Eckert, M. Microencapsulated flavours: manufacture and possible applications. Dragoco
Report. Flavouring Information Service 1995,1, 5-19.
Engel, W.; Bahr, W.; Schieberle, P. Solvent assisted flavour evaporation - a new and versatile
technique for the careful and direct isolation of aroma compounds from complex food
matrices. Eur. Food Res. Technol. 1999, 209, 237-241.
Fiorini, C; Fouraste, I.; David, B.; Bessiere, J.M. Composition of the flower, leaf and stem
essential oils from Laurus nobilis L. Flavour Fragrance J. 1997, 12, 91-93.
Fisher, C; Scott, T.R. Food flavours: biology and chemistry. The Royal Society of Chemistry,
1997.
Fisher, N.; Nitz, S.; Drawert, F. Original flavour compounds of marjoram flavour and its
changes during processing. J. Agric. Food Chem. 1988, 36, 996-1003.
Gibbs, B.F.; Kermasha, S.; Alii, L; Mulligan, C.N. Encapsulation in the food industry: a
review. Int. J. Food Sci. Nutr. 1999, 50, 213-224.
Grosch, W. Detection of potent odorants in foods by aroma extract dilution analysis. Trends
Food Sci. Technol. 1993,4-68.
Guadagni, D.G; Buttery, R.G.; Turnbaugh, J.G. Odour thresholds and similarity ratings of
some potato chip components. J. Sci. Food Agric. 1972,23,1435-1444.
Gunning, Y.M.; Gunning, P.; Kemsley, E.K.; Parker, R.; Ring, S.G.; Wilson, R.H.; Blake, A.
Factors affecting the release of flavor encapsulated in carbohydrate matrixes. J. Agric.
Food Chem. 1999, 47, 5198-5205.
Guth, H.; Grosch, W. Identification of potent odourants in static headspace samples of green
and black tea powders on the basis of aroma extract dilution analysis (AEDA). Flavour
Fragrance J. 1993, 8, 173-178.
Harrison, M.; Hills, B.P. Mathematical model of flavor release from liquids containing aroma
binding macromolecules. J. Agric. Food Chem. 1997, 45, 1883-1890.
Hartman, T.G.; Lech, J.; Karmas, K.; Salinas, J.; Rosen, R.T.; Ho, C.T. Flavour
characterization using adsorbent trapping-thermal desorption or direct thermal
desorption-gas chromatography and gas chromatography-mass spectrometry. In
Flavour measurement; Ho, C; Manley, CM. (eds.); Marcel Dekker Inc., New York,
1993; pp 267-328.
Heath, H.B.; Reineccius, G.A. Flavour chemistry and technology. Macmillan Publishers USA
1986.
24
Chapter 1
Heath, H.B. Source book of flavours. AVI Publishing Company Inc., USA, 1981.
Hedges, A.R.; Shieh, W.J.; Sikorski, C.T. Use of cyclodextrins for encapsulation in the use
and treatment of food products. In Encapsulation and controlled release of food
ingredients, eds S.J. Risch, G.A. Reineccius. ACS symposium series 590; American
Chemical Society: Washington, D.C., 1995; pp 60-71.
Hodge, W.H; Bailey, L.H. Survey of flavour producing plants. Flavour Ind. 1975, 6, 244-245.
Huopalahti, R.; Linko, R.R. Composition and content of aroma compound in dill, Anethum
graveolens L., at three different growth stages. J. Agric. Food Chem. 1983, 31, 331—
333.
Hussien, M.S. Response of growth, yield and essential oil of coriander and dill to different
nitrogen sources. Egyptian J. Horticulture 1995, 22, 1-10.
Jackson, L.S.; Lee, K. Microencapsulation in food industry. Lebensm.-Wiss. u.-Technol. 1991,
24, 289-297.
Jaganmohan-Rao, L.; Meenakshi, S.; Raghavan, B.; Abraham, K.O. Rosemary {Rosmarinus
officinalis L.): impact of drying on its flavor quality. J. Food Quality 1998, 21, 107-
115.
Jones, K. Verordnung zur Neuordnung lebensmittelrechtlicher Kennzeichnungsvorschriften.
Dragoco Bericht 1982, 27, 31-36.
King, C.J. Spray drying food liquids and the retention of volatiles. Chem. Eng. Prog. 1990,
86, 33-39.
Krischnaswamy, M.A.; Patel, J.D.; Parthasarathy, N.J.; Nair, K.K. Microbiological quality of
certain spices. J. Plantation Crops 1973, 1 (Suppl.), 200.
Lawrence, B.M. The isolation of aromatic materials from natural plant products. In A manual
on the essential oil industry; Tuley de Silva (ed.); United Nations Industrial
Development Organization, Vienna, 1995; pp 57-154.
Lawrence, B.M.; Shu, Ch. Essential oils as components of mixtures: analysis and
differentiation. In Flavour measurement; Ho, C; Manley, CM. (eds.); Marcel Dekker
Inc., New York, 1993; pp 267-328.
Lis-Balchin, M.; Buchbauer, G.; Hirtenlehner, T.; Resch, M. Antimicrobial activity of
Pelargonium essential oils added to a quiche filling as a model food system. Letters in
Applied Microbiology 1998, 27, 207-210.
25
Chapter 1
Mallavarapu, G.R.; Kulkarni, R.N.; Baskaran, K.; Rao, L.; Ramesh, S. Influence of plant
growth stage on the essential oil content and composition in davana {Artemisia pollens
Wall). J. Agric. Food Chem. 1999, 47, 254-258.
Masanetz, C; Grosch, W. Hay-like off flavour of dry parsley. Z. Lebensm.-Unters. Forsch.
1998,206, 114-120.
Masanetz, C; Guth, H.; Grosch, W. Fishy and hay-like off flavours of dry spinach. Z.
Lebensm.-Unters. Forsch. 1998, 206, 108-113.
Mazzanti, G.; Battinelli, L.; Salvatore, G. Antimicrobial properties of the linalol-rich essential
oil of Hyssopus officinalis L. var decumbens (Lamiaceae). Flavour Fragrance J. 1998,
13, 289-294.
Miraldi, E. Comparison of the essential oils from ten Foeniculum vulgare Miller samples of
fruits of different origin. Flavour Fragrance J. 1999, 14, 379-382.
Morton, I.D.; MacLeod, A.J. Food flavours. Part A. Introduction. Elsevier Scientific
Publishing Company, 1982.
Munne-Bosch, S.; Alegre, L.; Schwarz, K. The formation of phenolic diterpenes in
Rosmarinus officinalis L. under Mediterranean climate. Eur. Food Res. Technol. 2000,
210, 263-267.
Murthy, C.T.; Meenakshi, R.; Srinivasa, R.P.N. Optimal grinding characteristics of black
pepper for essential oil yield. J. Food Process Eng. 1999, 22, 161-173.
Ney, K.H. Aromagrams: a new approach to flavour classification and description. In Flavours
and Off-Flavours, Charalambours, G. (Ed.), Elsevier Science, Amsterdam, 1992.
Overbosch, P.; Achterof, W.G.M.; Haring, P.G.M. Flavour release in the mouth. Food Rev.
Int. 1991,7, 137-187.
Perry, N.B.; Anderson, R.E.; Brennan, N.J.; Douglas, M.H.; Heaney, A.J.; McGimpsey, J.A.;
Smallfield, B.M. Essential oils from Dalmatian sage {Salvia officinalis L.): variations
among individuals, plant parts, seasons and sites. J. Agric. Food Chem. 1999, 47, 2048-
2054.
Pollock, C.L. Natural raw materials. What they are; how they are used in flavour creation. In
The development and application of natural and artificial flavour systems. Allured
Publishing, Wheaton IL, USA, 1984; pp 47-63.
26
Chapter 1
Rafiq-Siddiqui, R.; Hamid-Ahmad; Sultan-Shakoor, C; Ehteshamuddin, A.F.M.; Safina-
Shireen. Antimicrobial activity of essential oils. II. Pakistan J. Scient. Ind. Res. 1996,
39, 43-47.
Reineccius, G.A. Spray drying of food flavours. In Flavour encapsulation, eds S.J. Risch,
G.A. Reineccius. ACS symposium series 370; American Chemical Society:
Washington, D.C., 1988; pp 57-66.
Reineccius, G. A. Flavour encapsulation. Food Rev. Int. 1989, 5, 147-176.
Reineccius, G.A. Carbohydrates for flavor encapsulation. Food Technol. 1991, March, 144-
149.
Reineccius, G. A. Source book of flavors. Chapman and Hall, New York, 1994.
Reineccius, G.A. Controlled release techniques in the food industry. In Encapsulation and
controlled release of food ingredients, eds S.J. Risch, G.A. Reineccius. ACS
symposium series 590; American Chemical Society: Washington, D.C., 1995; pp 9-25.
Reineccius, G. A.; Coulter, S.T. Flavour retention during drying. J. Dairy Sci. 1969, 52, 12-
19.
Re - Mi. Microencapsulation by spray drying. Drying Technol. 1998, 1195-1236.
Risch, S.J.; Reineccius, G.A. Spray-dried orange oil: effect of emulsion size on flavour
retention and shelf stability. In Flavour encapsulation, eds S.J. Risch, G.A. Reineccius.
ACS symposium series 370; American Chemical Society: Washington, D.C., 1988; pp
67-77.
Risch, S.J. Encapsulation: overview of uses and techniques. In Encapsulation and controlled
release of food ingredients, eds S.J. Risch, G.A. Reineccius. ACS symposium series
590; American Chemical Society: Washington, D.C., 1995; pp 2-7.
Rothe, M. In Introduction to aroma research. Rothe, M. (ed.) Kluwer Academic Publishers,
Dordrecht, The Netherlands, 1988; pp 30-35.
Saenger, W. Cyclodextrin inclusion compounds in research and industry. Angew Chem. Int.
Ed. Engl. 1980,19, 344-362.
Schaller, R.G.; Schnitzler, W.H. Nitrogen nutrition and flavour compounds of carrots (Daucus
carota L) cultivated in Mitscherlich pots. J. Sci. FoodAgric. 2000, 80, 49-56.
Schieberle, P. Quantitation of important roast-smelling odorants in popcorn by stable isotope
dilution assays and model studies on flavor formation during popping. J. Agric. Food
Chem. 1995,43,2442-2448.
27
Chapter 1
Sefidkon, F.; Dabiri, M.; Rahimi-Bidgoly, A. The effect of distillation methods and stage of
plant growth on the essential oil content and composition of Thymus kotschyanus Boiss.
& Hohen. Flavour Fragrance J. 1999, 14, 405^108.
Sivropoulu, A.; Nikolaou, C; Papanikolaou, E.; Kokkini, S.; Lanaras, T.; Arsenakis, M.
Antimicrobial, cytotoxic and antiviral activities of Salvia fructicosa essential oil. J.
Agric. Food Chem. 1997,45, 3197-3201.
Soper, J.C. Utilization of coacervated flavors. In Encapsulation and controlled release of food
ingredients, eds S.J. Risch, G.A. Reineccius. ACS symposium series 590; American
Chemical Society: Washington, D.C., 1995; pp 104-112.
Tyszkiewicz, I.; Jackowska, A. Technological applications of the results of odour stimulus
threshold determination in the example of caraway. Nahrung 1982, 26, 649-652.
Taylor, A.H. Encapsulation systems and their applications in the flavour industry. Food
Flavours, Ingredients, Packaging and Processing 1983, 5,48^19, 51-52.
Tuley, L. Flavour in a bubble. Food Manufacture 1998, 73, 26-28.
Weurman, C. Isolation and concentration of volatiles in food odor research. J. Agric. Food
Chem. 1969, 17, 370-384.
Yoshii, H.; Furuta, T.; Okita, E.; Toyomi, A.; Linko, Y.Y.; Linko, P. The increased effect of
kneading on the formation of inclusion complexes between d-limonene and (3-
cyclodextrin at low water content. Biosci. Biotech. Biochem. 1998, 62, 464-468.
Yven, C; Guichard, E.; Giboreau, A.; Roberts, D. Assessment of interactions between
hydrocolloids and flavor compounds by sensory, headspace, and binding methodologies.
J. Agric. Food Chem. 1998, 46, 1510-1514.
Zilberboim, R.; Kopelman, I.J.; Talmon, Y.J. Microencapsulation by a dehydrating liquid:
retention of paprika oleoresin and aromatic esters. J. FoodSci. 1986a, 51, 1301-1306.
Zilberboim, R.; Kopelman, I.J.; Talmon, Y.J. Microencapsulation by a dehydrating liquid: a
microstructural study by scanning electron microscopy. J. Food Sci. 1986b, 51, 1307-
1310.
28
CHAPTER 2
CHARACTERISATION OF THE ESSENTIAL OILS OF SOME
UMBELLIFEROUS PLANTS GROWN IN LITHUANIA
This chapter is based on the following articles:
1. Bylaite, E.; Venskutonis, R. Essential oils of parsley and celery from Lithuania. Scientific works "Food Chemistry and Technology", Vilnius "Academia", 1994, 69-74.
2. Bylaite, E.; Venskutonis, R. Volatile constituents of dill. Proceedings of the conference "Maisto chemija ir technologija" , Kaunas , "Technologya", 1994, 15-18.
3. Venskutonis, R.; Kvietkauskaite, D.; Bylaite, E.; Suliauskas, A. Characterization of caraway (Carum carvi L.) cultivated in Lithuania. Horticulture and Vegetable Growing. Scientific Works of the Lithuanian Institute of Horticulture and Lithuanian University of Agriculture, 1999, 18 (3), 85-92.
Chapter 2
ABSTRACT
The essential oils of parsley, celery, dill and caraway (family Umbelliferae) grown in
Lithuania were characterised using GC and GC/MS analyses. The chemical composition of
the aroma of locally grown parsley, celery and dill plants shows that the amounts of the major
constituents are in agreement with the published data (Kasting et al., 1972; MacLeod et al.,
1985; Halva et al., 1988; Cu et al., 1989; Badoc and Lamarti, 1991; Bouwmeester et al.,
1995a,b,c). The most abundant components in locally grown parsley were found to be 0-
phellandrene (21%), myristicin (20%), myrcene (11%) and a, />-dimethylstyrene (11%). In
terms of quantity, the main constituent of celery essential oil was limonene (63%) and 3-w-
butylphthalide (6%) was the major phthalide. The dill herb could be ascribed to chemotype II
(dillapiole), which is distinguishable by its high concentrations of limonene (27%), dill ether
(21%) and D-carvone (14%), and the absence of myristicin.
The yield from seeds of different caraway cultivars, their essential oil content and chemical
composition, were examined as well as the influence of fertilisers on those characteristics.
Twelve batches of caraway fruits commercially produced in 1994, 1995 and 1996 in different
regions of Lithuania were also characterised. Total concentration of essential oil in the fruits
varied from 2 to 4 ml 100 g_1. The yield of caraway fruits grown in the experimental fields
varied over a wide range (from 984 to 2673 kg ha ') depending on fertiliser content and
cultivation area and on the cultivar itself. Percentage concentrations of the main caraway
compounds, limonene and carvone, varied in the ranges of 38-52% and 45-59%, respectively.
These two compounds constituted more than 96% of the total essential oils in all samples.
Some minor compounds were also identified and assessed quantitatively.
INTRODUCTION
Parsley, celery, dill and caraway (family Umbelliferae) are most popular aromatic plants in
Lithuania and are widely used for flavouring and seasoning various foods. They can be used
as fresh or frozen herbs, dried (herbs and seeds) or processed into more concentrated products
30
Chapter 2
like essential oils. The essential oils of these plants are used in baked goods, pickled products,
confectionery, chewing gums, condiments and beverages.
The chemical composition of the essential oil from parsley {Petroselinum sativum Hoffrn.)
leaves has previously been reported (Kasting et al., 1972; MacLeod et al., 1985). Fifty
volatile compounds were identified in the headspace vapours of concentrates obtained by
steam distillation and isopentane extraction from parsley leaves (Kasting et al., 1972). The
main constituents were found to be myristicin, 1,3,8-p-menthatriene, P-phellandrene and
myrcene. MacLeod et al. (1985) identified 45 compounds, of which 14 were present in
amounts exceeding 1% of the total peak area: a-pinene, P-pinene, myrcene, limonene, P-
phellandrene, ;?-cymene, a-terpinolene, 1,3,8-p-menthatriene, 4-isopropenyl-l-
menthylbenzene, a-terpineol, ^-methylacetophenone, a-elemene, apiol and myristicin. The
presence of the unusual sesquiterpenes, crispanone and crispane, in parsley has been
described by Appendino et al. (1998).
The volatiles of celery (Apium graveolens L.) leaves and seeds were first studied by Wilson
(1969). Using GC/MS, Cu et al. (1989) detected 50 compounds, 27 of which were identified.
Phthalides have been considered as substantial celery flavour constituents, but there is some
confusion about their identification and quantification, especially of sedanolide and
sedanenolide. Bjeldanes and Kim (1977) isolated two major phthalides from celery essential
oil: 3-w-butylphthalide and 3-w-butyl-4,5-dihydrophthalide (sedanenolide). Later
butylphthalide, sedanolide and sedanenolide were separated by HPLC (Uhlig et al., 1987) and
by two-dimensional capillary GC (Van Wassenhove et al., 1988). Nine phthalides were found
and fr-aws-neocnidilide, sedanolide and butylphthalide were the main representatives. In 1997,
Bartschat et al., using enantioselective multidimensional GC, achieved the simultaneous
analysis of the three butylphthalide enantiomers, and their distributions in celery and celery
seed extracts were elucidated.
Aroma composition of dill (Anethum graveolens L.) has been the subject of numerous
investigations which, however, have resulted in rather controversial conclusions (Baslas and
Baslas, 1972; Gockeritz et al., 1979; Lawrence, 1980b; Schreier et al., 1981). The amounts of
the three main constituents (D-carvone, a-phellandrene, limonene) were reported to vary
widely. Dill ether (3,6-dimethyl-2,3,3a,4,5,7a-hexahydrobenzofuran) was found to be a key
31
Chapter 2
compound with respect to the aroma of dill (Brunke et al., 1991). The amounts of the main
aroma compounds in dill at three different vegetative periods were found to vary within the
following ranges: a-phellandrene 26-34%; limonene 4-10%; dill ether 11-32%; and D-
carvone 0-3% (Huopalahti and Linko, 1983). The influence of the area of cultivation was
studied by Halva et al. (1988) and it was determined that the contents of a-phellandrene, dill
ether and myristicin can vary in ranges of 37-59%, 22-38% and 0.3-2% respectively. Badoc
and Lamarti (1991) investigated the composition and the content of volatile compounds in
essential oil depending on the chemotype of the herb. They reported that three broad
chemotypes could be distinguished by the amount of D-carvone and the presence of myristicin
and dill ether.
Caraway {Carum carvi L.) is the most important commercially cultivated spice in Lithuania.
However, the effect of different factors on the yield of locally cultivated caraway seeds, the
influence of different factors on the accumulation of essential oil and its chemical composition
in this country have not yet been comprehensively examined. It is well established that the
composition of caraway seed essential oil is very simple. Carvone (approx. 55% in the total
oil) and limonene (approx. 45% in the total oil) are the major constituents, while the other
components of the oil do not exceed 1% (Lawrence, 1980a; Formacek and Kubeczka, 1982;
Halva et al., 1986; Analytical Methods Committee, 1988; Chalcat et al., 1991; Puschmann et
al., 1992; Bouwmeester and Smid, 1995; Bouwmeester et al., 1995a,b, 1999). Puschmann et
al. (1992) analysed caraway seeds from 16 different regions of origin and found that the
content of essential oil was about 5%, of which carvone about 50% and limonene content
about 45%. However, some exceptions have been observed, for example, El-Wakeil et al.
(1986) determined 80% of carvone and only 9.8% of limonene in the essential oil of Carum
carvi fruits from Egypt.
Carvone content in caraway essential oil is regulated by the standards: e.g., according to
Hungarian regulations (Hungarian Standard, 1981) it has to be more than 50%; ISO standard
(ISO, 1987) requires caraway oil to have not less than 48% of carbonyl compounds expressed
as carvone; and in the British Pharmacopoeia (British Pharmacopoeia, 1988) the content of
ketones is said to constitute 53-63% (w/w) calculated as carvone. The influence of different
factors on caraway seed yield, the content of essential oil and its main constituents has been
32
Chapter 2
studied thoroughly by Bouwmeester and Kuijpers (1993) and Bouwmeester et al. (1995a,b,c,
1998). For gas chromatographic (GC) analysis, caraway essential oil is usually isolated by
hydrodistillation; however, Kallio et al. (1994) and Baysal and Starmans (1999) used the
supercritical carbon dioxide extraction-GC method. In the study of Kallio et al. (1994) some
differences in the concentrations of carvone and limonene as compared with those obtained
with hydrodistillation were found. The ratio carvone:limonene in the CO2 extracts obtained
from three cultivars from different provenances used in the above mentioned study was
greater than that obtained with hydrodistilled essential oils, while this ratio in the fourth
cultivar was higher in the hydrodistilled oil than in the CO2 extract. The composition of the
hexane extracts was also different than that of hydrodistilled oils: the content of limonene was
approximately 10-20% higher in the extracts than in the oils, whereas the content of carvone
was higher in the oils (Bouwmeester et al., 1995a).
The chemical composition of plant aromas depends on various factors, such as harvest date
(i.e. the state of maturity), geographical origin, chemotype, and isolation procedure of the
aroma compounds (Heath, 1981). In general, the data published on the volatile composition
of aromatic plants, particularly parsley, celery, dill and caraway, show that flavour profiles
can differ significantly depending on the country of origin and conditions of cultivation of the
plant (Haelvae et al., 1992a,b, 1993; Jirovetz et al., 1994; Hussien, 1995; Pino et al., 1995;
Evers et al., 1997; Arganosa et al. 1998; Zawirska-Wojtasiak et al., 1998). Therefore, studies
on the aromatic herbs and spices grown in different countries and/or climatic zones are
always of interest. This research was undertaken for the aroma characterisation of most
popular herbs grown in Lithuania: parsley, celery, dill and caraway.
MATERIALS AND METHODS
Steam distilled commercial essential oils of parsley, celery and dill leaves were obtained from
a local company "Meta". The essential oils were stored in a refrigerator before analysis. For
direct GC/MS analysis the essential oils were dissolved in distilled ether: parsley and dill
0.2% (v/v), celery 0.1% (v/v). Commercially grown samples of caraway seeds (Skemiai-
1'1994, Skemiai-2'1994, Skemiai' 1995, MeskuiCiai' 1994, Panevezys' 1995, Agrolitpa-
33
Chapter 2
1'1995, Agrolitpa-2'1995, Agrolitpa-1'1996, Agrolitpa-2'1996, Vilkija' 1995, Kupiskis'
1996, Alytus' 1996) were obtained from different suppliers in different areas of Lithuania.
Experimental samples of four different cultivars (Gintaras, Rekord, Chmelnickij and
Prochana) were grown in experimental fields at the Lithuanian Agricultural University in
Kaunas region (fertilisation = 30 kg ha-1 NaNCb). Fertilisation experiments were carried out
for the cultivar Rekord in experimental fields in Klausuciai, Jurbarkas region. Nitrogen
fertilisers were applied ranging in amount from 0 to 120 kg ha-1. The fruits were harvested by
hand in the first half of July and dried at 40°C to about 10% moisture and stored in paper bags
at ambient temperature protected from light. Essential oils were isolated from 20 g of ground
seeds by hydrodistillation (3-4 times) in a modified European Pharmacopoeia apparatus for
2h (the essential oil collecting tube was surrounded by a water cooling jacket) (Richard et al.,
1992).
GC analyses
Essential oils from caraway samples were diluted in ether 0.2% (v/v) and analysed on two
instruments:
1. For identification purposes on a dual column HP 5890A chromatograph with FID: split
inlet 1:100; helium as carrier gas at inlet pressure 138 kPa and linear velocity 35 cm s_1;
fused silica dimethylpolysiloxane DB-1 and PEG DB-WAX columns, both 60 m length,
0.25 mm i.d. and 0.25 |jm film thickness; temperature programming from 50 to 238°C (8
min hold) increasing at 4°C min-1; injector temperature 220°C, detector temperature
260°C.
2. For quantification on a Fisons chromatograph with FID: split inlet 1:20; helium as carrier
gas at inlet pressure 138 kPa and linear velocity 35 cm s1; fused silica
dimethylpolysiloxane DB-1 60 m length, 0.25 mm i.d. and 0.25 urn film thickness;
temperature programming from 50 to 238°C (8 min hold) increasing at 4°C min-1;
injector temperature 220°C, detector temperature 260°C.
34
Chapter 2
GC/MS analyses
For the analysis of commercial essential oils of parsley, celery and dill, GC/MS (Hewlett
Packard: HP 5890) conditions were as follows: inlet - split 1:25, carrier gas - helium 1 ml
min-1, columns-fused silica RSL-150, 40 m, i.d. = 0.32 mm, film thickness 0.2 \xm; DB-5, 40
m, i.d. = 0.30 mm; temperature programming 35-220°C rising at 3°C/min, 220°C isothermal
(20 min); detector - quadrupole type MS, no. 5970 series: MSD, temperature 250°C, injection
lul.
GC/MS analyses of caraway essential oils were performed on a HP 5890 with a 5970 series
MSD in the EI ionisation mode at 70eV, and the following GC parameters: split inlet 1:10;
helium as carrier gas at a flow rate of 2 ml min1; fused silica (50% phenyl)
methylpolysiloxane DB-17 column, 30 m length, 0.25mm i.d., 0.25 um film thickness, 50-
250°C increasing at 3°C min"1.
The identification of essential oil constituents was based on comparison of their spectra with
reference spectra recorded under similar conditions with the same instrument, and with
published spectra. Retention times expressed as Kovats indices were also used for
identification (homologous series of C6-Ci8 as standards). All GC analyses were replicated 4-
5 times.
RESULTS AND DISCUSSION
Parsley
The list of the compounds identified in parsley essential oil and their relative amounts
expressed as a percentage of the total area of the detected GC peaks are presented in Table
2.1. It is obvious that the application of two different columns enables us to show some
additional data, especially for the compounds present in minor amounts. Thus, terpinolene,
trans-p-ocimene and 1,3,8-p-menthatriene were detected only on the DB-5 column, and
cuminaldehyde only on the RSL-150 column. The amounts of most compounds were very
close for both columns. An exception was the cryptone peak, where the percentage area
35
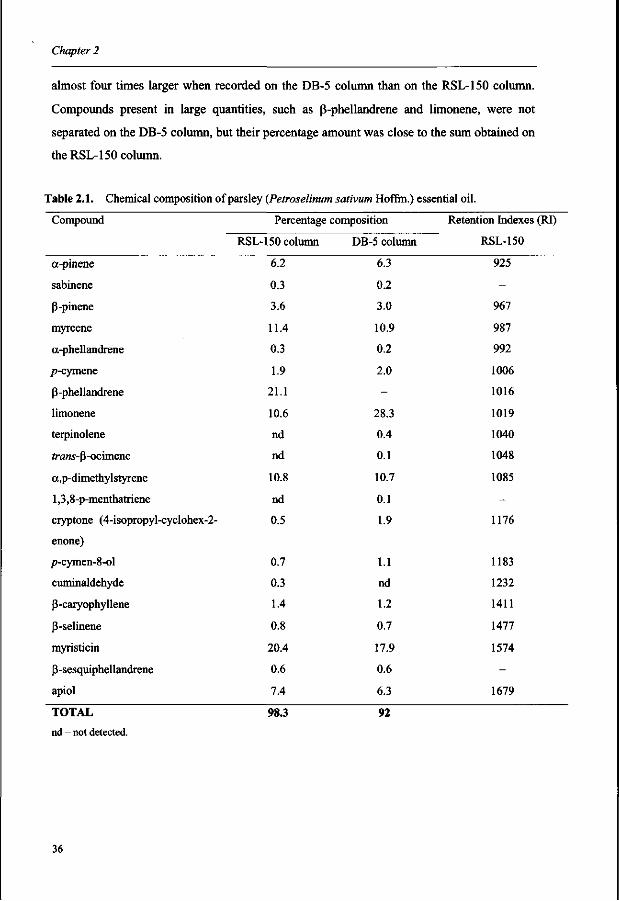
Chapter 2
almost four times larger when recorded on the DB-5 column than on the RSL-150 column.
Compounds present in large quantities, such as p-phellandrene and limonene, were not
separated on the DB-5 column, but their percentage amount was close to the sum obtained on
the RSL-150 column.
Table 2.1. Chemical composition of parsley {Petroselinum sativum Hoffm.) essential oil.
Compound
a-pinene
sabinene
P-pinene
myrcene
a-phellandrene
/>-cymene
P-phellandrene
limonene
terpinolene
frww-p-ocimene
a,p-dimethylstyrene
1,3,8-p-menthatriene
cryptone (4-isopropyl-cyclohex-2-
enone)
/?-cymen-8-ol
cuminaldehyde
P-caryophyllene
P-selinene
myristicin
P -sesquiphellandrene
apiol
Percentage composition
RSL-150 column
6.2
0.3
3.6
11.4
0.3
1.9
21.1
10.6
nd
nd
10.8
nd
0.5
0.7
0.3
1.4
0.8
20.4
0.6
7.4
DB-5 column
6.3
0.2
3.0
10.9
0.2
2.0
-
28.3
0.4
0.1
10.7
0.1
1.9
1.1
nd
1.2
0.7
17.9
0.6
6.3
Retention Indexes (RI)
RSL-150
925
-
967
987
992
1006
1016
1019
1040
1048
1085
-
1176
1183
1232
1411
1477
1574
-
1679
TOTAL
nd - not detected.
98.3 92
36
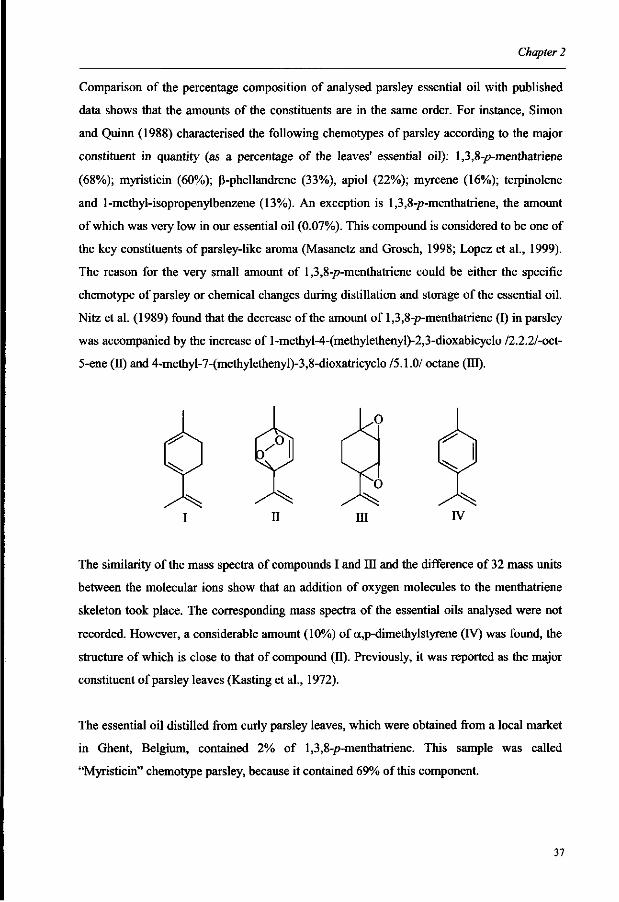
Chapter 2
Comparison of the percentage composition of analysed parsley essential oil with published
data shows that the amounts of the constituents are in the same order. For instance, Simon
and Quinn (1988) characterised the following chemotypes of parsley according to the major
constituent in quantity (as a percentage of the leaves' essential oil): 1,3,8-p-menthatriene
(68%); myristicin (60%); p-phellandrene (33%), apiol (22%); myrcene (16%); terpinolene
and 1-methyl-isopropenylbenzene (13%). An exception is 1,3,8-p-menthatriene, the amount
of which was very low in our essential oil (0.07%). This compound is considered to be one of
the key constituents of parsley-like aroma (Masanetz and Grosch, 1998; Lopez et al., 1999).
The reason for the very small amount of 1,3,8-p-menthatriene could be either the specific
chemotype of parsley or chemical changes during distillation and storage of the essential oil.
Nitz et al. (1989) found that the decrease of the amount of 1,3,8-p-menthatriene (I) in parsley
was accompanied by the increase of l-methyl-4-(methylethenyl)-2,3-dioxabicyclo /2.2.2/-oct-
5-ene (IT) and 4-methyl-7-(methylethenyl)-3,8-dioxatricyclo /5.1.0/ octane (HI).
The similarity of the mass spectra of compounds I and III and the difference of 32 mass units
between the molecular ions show that an addition of oxygen molecules to the menthatriene
skeleton took place. The corresponding mass spectra of the essential oils analysed were not
recorded. However, a considerable amount (10%) of a,p-dimethylstyrene (IV) was found, the
structure of which is close to that of compound (II). Previously, it was reported as the major
constituent of parsley leaves (Kasting et al., 1972).
The essential oil distilled from curly parsley leaves, which were obtained from a local market
in Ghent, Belgium, contained 2% of 1,3,8-p-menthatriene. This sample was called
"Myristicin" chemotype parsley, because it contained 69% of this component.
37
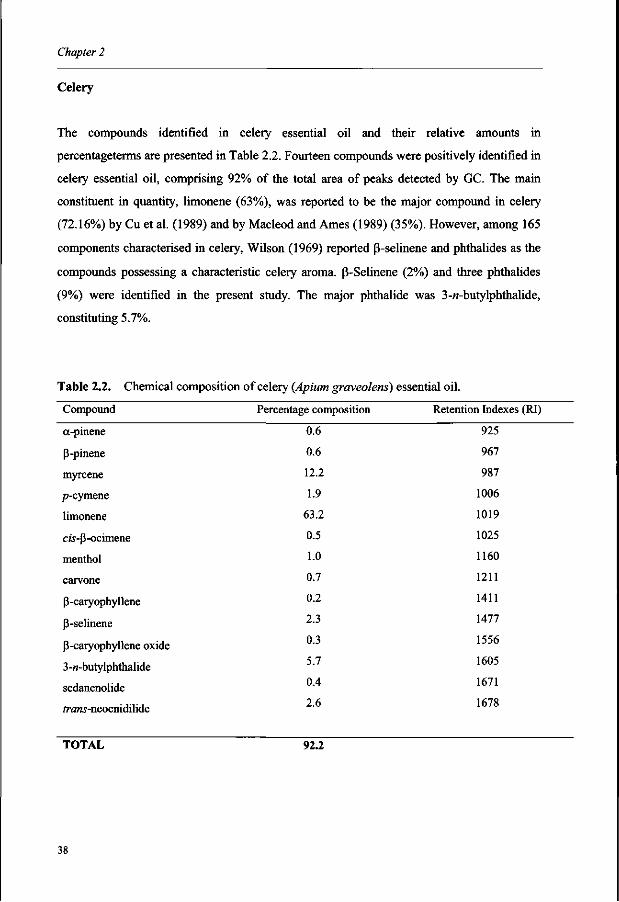
Chapter 2
Celery
The compounds identified in celery essential oil and their relative amounts in
percentageterms are presented in Table 2.2. Fourteen compounds were positively identified in
celery essential oil, comprising 92% of the total area of peaks detected by GC. The main
constituent in quantity, limonene (63%), was reported to be the major compound in celery
(72.16%) by Cu et al. (1989) and by Macleod and Ames (1989) (35%). However, among 165
components characterised in celery, Wilson (1969) reported p-selinene and phthalides as the
compounds possessing a characteristic celery aroma. P-Selinene (2%) and three phthalides
(9%) were identified in the present study. The major phthalide was 3-w-butylphthalide,
constituting 5.7%.
Table 2.2. Chemical composition of celery (Apium graveolens) essential oil.
Compound Percentage composition Retention Indexes (RI)
a-pinene 0.6 925
p-pinene 0.6 967
myrcene
p-cymene
limonene 63.2 1019
12.2 987
1.9 1006
cw-P-ocimene 0.5 1025
menthol 1 0 1 1 6 0
carvone
P-caryophyllene
P-selinene
P-caryophyllene oxide
3 -H-butylphthalide
sedanenolide
?ra«5-neocnidilide
0.7 1211
0.2 1411
2.3 1477
0.3 1556
5.7 1605
0.4 1671
2.6 1678
TOTAL 92.2
38
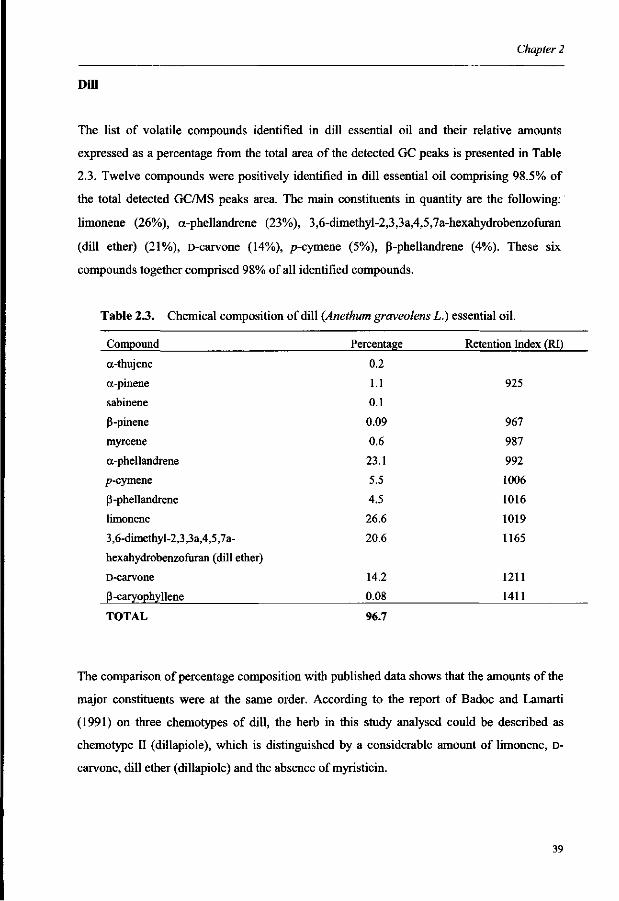
Chapter 2
Dill
The list of volatile compounds identified in dill essential oil and their relative amounts
expressed as a percentage from the total area of the detected GC peaks is presented in Table
2.3. Twelve compounds were positively identified in dill essential oil comprising 98.5% of
the total detected GC/MS peaks area. The main constituents in quantity are the following:
limonene (26%), a-phellandrene (23%), 3,6-dimethyl-2,3,3a,4,5,7a-hexahydrobenzofuran
(dill ether) (21%), D-carvone (14%), p-cymene (5%), (3-phellandrene (4%). These six
compounds together comprised 98% of all identified compounds.
Table 2.3. Chemical composition of dill (Anethum graveolens L.) essential oil.
Compound
a-thujene
a-pinene
sabinene
P-pinene
myrcene
a-phellandrene
p-cymene
P-phellandrene
limonene
3,6-dimethyl-2,3,3a,4,5,7a-
hexahydrobenzofuran (dill ether)
D-carvone
p-caryophyllene
TOTAL 96.7
The comparison of percentage composition with published data shows that the amounts of the
major constituents were at the same order. According to the report of Badoc and Lamarti
(1991) on three chemotypes of dill, the herb in this study analysed could be described as
chemotype II (dillapiole), which is distinguished by a considerable amount of limonene, D-
carvone, dill ether (dillapiole) and the absence of myristicin.
rcentage
0.2
1.1
0.1
0.09
0.6
23.1
5.5
4.5
26.6
20.6
14.2
0.08
Retention Index (RI)
925
967
987
992
1006
1016
1019
1165
1211
1411
39
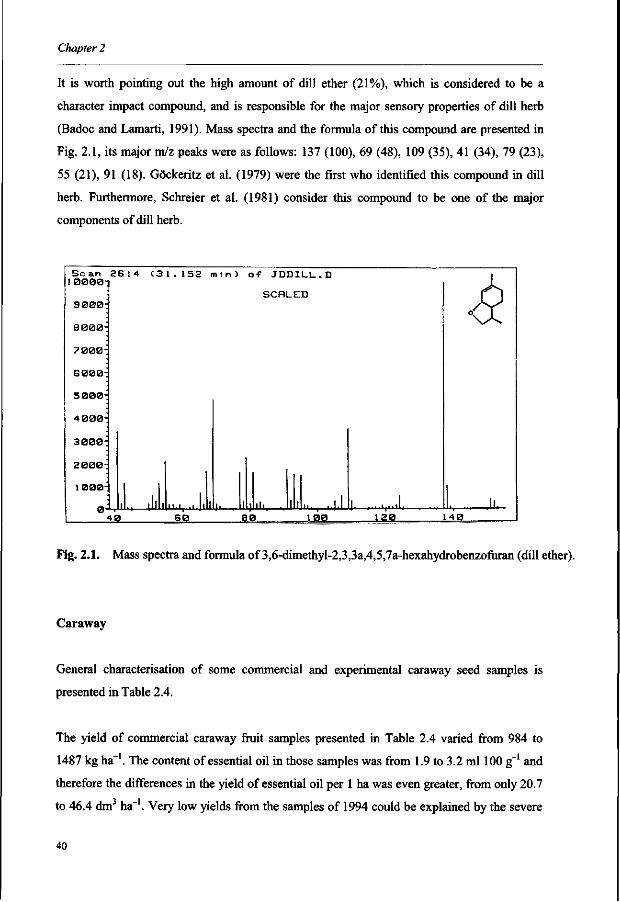
Chapter 2
It is worth pointing out the high amount of dill ether (21%), which is considered to be a
character impact compound, and is responsible for the major sensory properties of dill herb
(Badoc and Lamarti, 1991). Mass spectra and the formula of this compound are presented in
Fig. 2.1, its major m/z peaks were as follows: 137 (100), 69 (48), 109 (35), 41 (34), 79 (23),
55 (21), 91 (18). Gockeritz et al. (1979) were the first who identified this compound in dill
herb. Furthermore, Schreier et al. (1981) consider this compound to be one of the major
components of dill herb.
Scan 2614 (31.152 mln) of JDDILL.D 100001
9000
8000
7000-j
6 000
5000:
4 000
3 000
2000
1000-
0 40
SCALED
^ 01 60 B0 10B 120 140
Fig. 2.1. Mass spectra and formula of 3,6-dimethyl-2,3,3a,4,5,7a-hexahydrobenzofuran (dill ether).
Caraway
General characterisation of some commercial and experimental caraway seed samples is
presented in Table 2.4.
The yield of commercial caraway fruit samples presented in Table 2.4 varied from 984 to
1487 kg ha"1. The content of essential oil in those samples was from 1.9 to 3.2 ml 100 g"1 and
therefore the differences in the yield of essential oil per 1 ha was even greater, from only 20.7
to 46.4 dm ha"1. Very low yields from the samples of 1994 could be explained by the severe
40
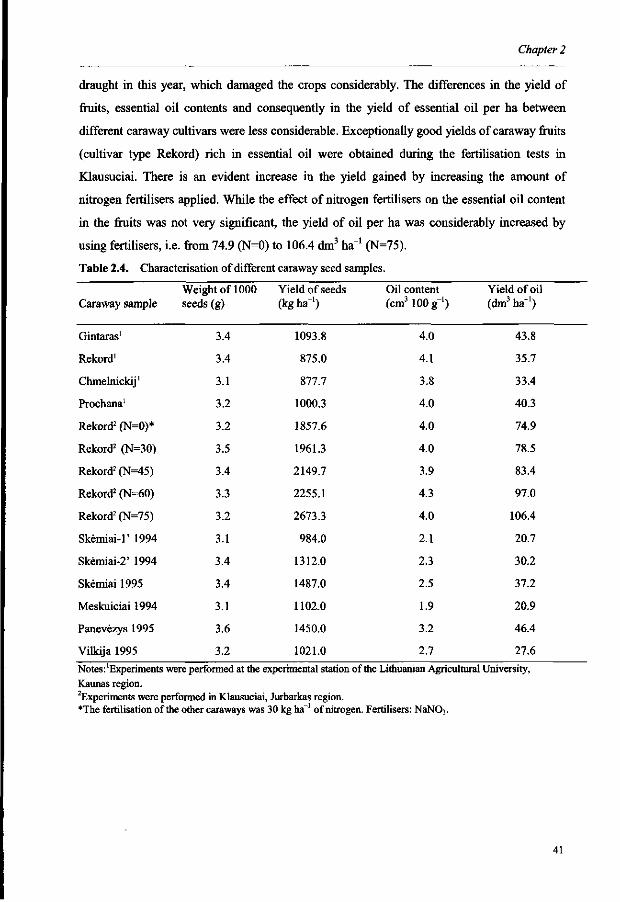
Chapter 2
draught in this year, which damaged the crops considerably. The differences in the yield of
fruits, essential oil contents and consequently in the yield of essential oil per ha between
different caraway cultivars were less considerable. Exceptionally good yields of caraway fruits
(cultivar type Rekord) rich in essential oil were obtained during the fertilisation tests in
Klausuciai. There is an evident increase in the yield gained by increasing the amount of
nitrogen fertilisers applied. While the effect of nitrogen fertilisers on the essential oil content
in the fruits was not very significant, the yield of oil per ha was considerably increased by
using fertilisers, i.e. from 74.9 (N=0) to 106.4 dm3 ha"1 (N=75).
Table 2.4. Characterisation of different caraway seed samples.
Caraway sample
Gintaras1
Rekord1
Chmelnickij1
Prochana1
Rekord2 (N=0)*
Rekord2 (N=30)
Rekord2 (N=45)
Rekord2 (N=60)
Rekord2 (N=75)
Skemiai-1' 1994
Skemiai-2' 1994
Skemiai 1995
Meskuiciai 1994
Panevezys 1995
Vilkija 1995
Weight of 1000 seeds (g)
3.4
3.4
3.1
3.2
3.2
3.5
3.4
3.3
3.2
3.1
3.4
3.4
3.1
3.6
3.2
Yield of seeds (kg ha1)
1093.8
875.0
877.7
1000.3
1857.6
1961.3
2149.7
2255.1
2673.3
984.0
1312.0
1487.0
1102.0
1450.0
1021.0
Oil content (cm3 100 g"1)
4.0
4.1
3.8
4.0
4.0
4.0
3.9
4.3
4.0
2.1
2.3
2.5
1.9
3.2
2.7
Yield of oil (dm3 ha*1)
43.8
35.7
33.4
40.3
74.9
78.5
83.4
97.0
106.4
20.7
30.2
37.2
20.9
46.4
27.6
Notes: Experiments were performed at the experimental station of the Lithuanian Agricultural University, Kaunas region. Experiments were performed in Klausuciai, Jurbarkas region. *The fertilisation of the other caraways was 30 kg ha"' of nitrogen. Fertilisers: NaN03.
41
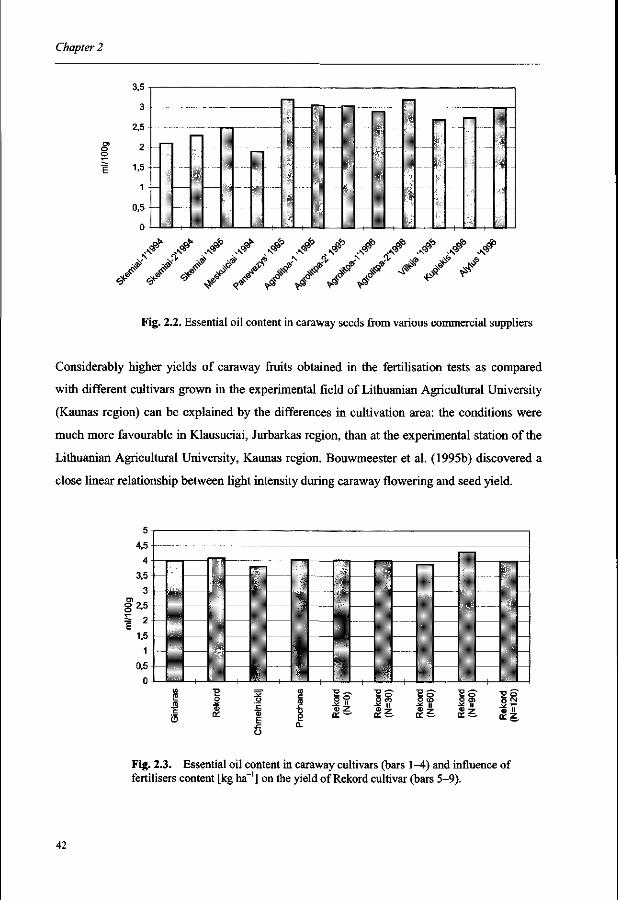
Chapter 2
3,5
3
2,5
2
1,5
1
0,5
0
J* .^ J* '/s//////*s* Fig. 2.2. Essential oil content in caraway seeds from various commercial suppliers
Considerably higher yields of caraway fruits obtained in the fertilisation tests as compared
with different cultivars grown in the experimental field of Lithuanian Agricultural University
(Kaunas region) can be explained by the differences in cultivation area: the conditions were
much more favourable in Klausuciai, Jurbarkas region, than at the experimental station of the
Lithuanian Agricultural University, Kaunas region. Bouwmeester et al. (1995b) discovered a
close linear relationship between light intensity during caraway flowering and seed yield.
5
4,5
4
3,5
3
1 2 1,5
1
0,5
E SZ
o
g a.
o n o <o •S " •£ »
o o> (U T
•g o a n
Fig. 2.3. Essential oil content in caraway cultivars (bars 1-4) and influence of fertilisers content [kg ha1] on the yield of Rekord cultivar (bars 5-9).
42
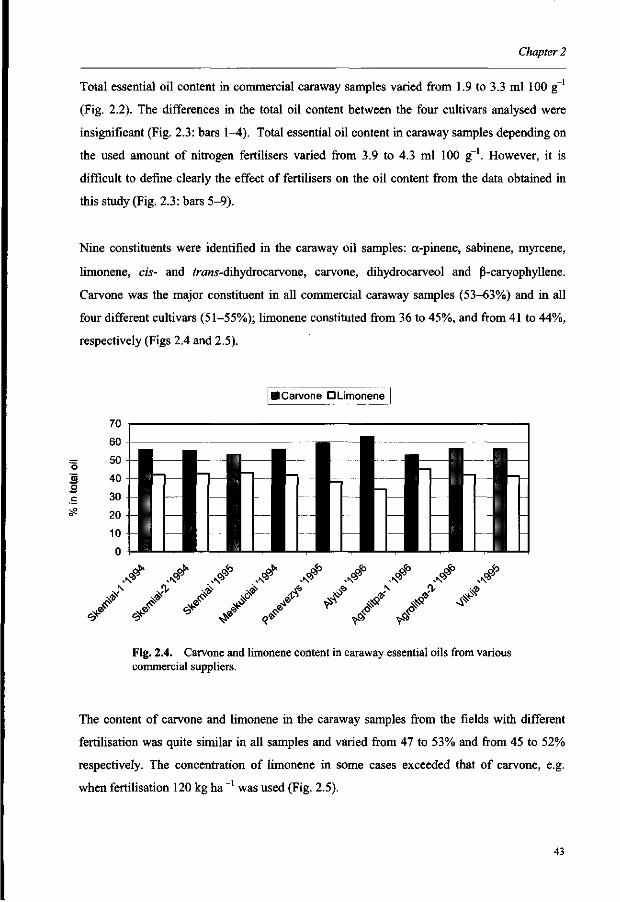
Chapter 2
Total essential oil content in commercial caraway samples varied from 1.9 to 3.3 ml 100 g '
(Fig. 2.2). The differences in the total oil content between the four cultivars analysed were
insignificant (Fig. 2.3: bars 1—4). Total essential oil content in caraway samples depending on
the used amount of nitrogen fertilisers varied from 3.9 to 4.3 ml 100 g '. However, it is
difficult to define clearly the effect of fertilisers on the oil content from the data obtained in
this study (Fig. 2.3: bars 5-9).
Nine constituents were identified in the caraway oil samples: a-pinene, sabinene, myrcene,
limonene, cis- and ?raw-dihydrocarvone, carvone, dihydrocarveol and P-caryophyllene.
Carvone was the major constituent in all commercial caraway samples (53-63%) and in all
four different cultivars (51-55%); limonene constituted from 36 to 45%, and from 41 to 44%,
respectively (Figs 2.4 and 2.5).
I Carvone D Limonene
ro 40
J* ^ J> J? J* J* J* J* , #
^
Fig. 2.4. Carvone and limonene content in caraway essential oils from various commercial suppliers.
The content of carvone and limonene in the caraway samples from the fields with different
fertilisation was quite similar in all samples and varied from 47 to 53% and from 45 to 52%
respectively. The concentration of limonene in some cases exceeded that of carvone, e.g.
when fertilisation 120 kg ha _1 was used (Fig. 2.5).
43
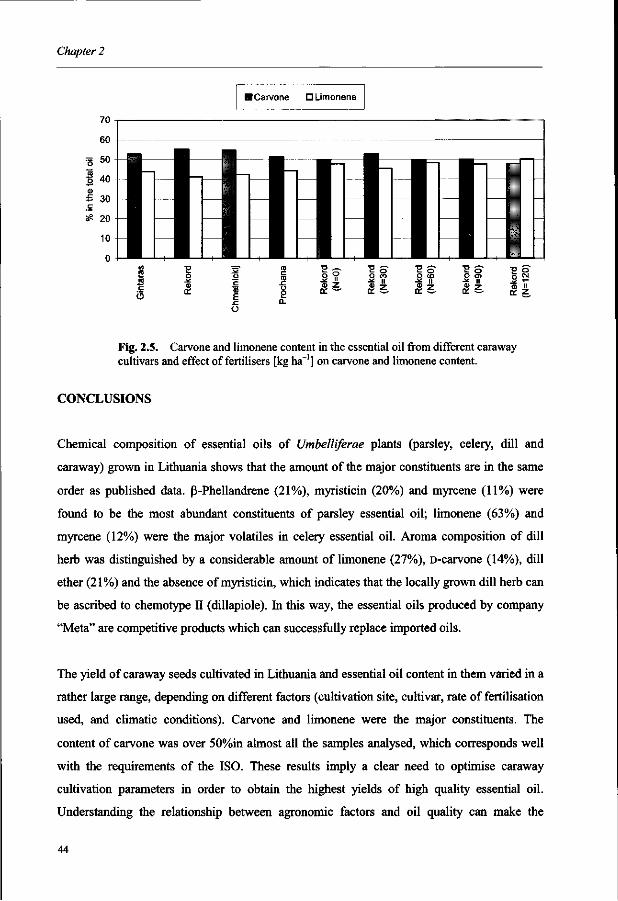
Chapter 2
2 Q_
_ n ffi z
= O O CO • * II
^ o t o E o g to p o> o ^
• * it - ^ 1 1 . 2 ^
a £• ore- J z
Fig. 2.5. Carvone and limonene content in the essential oil from different caraway cultivars and effect of fertilisers [kg ha'1] on carvone and limonene content.
CONCLUSIONS
Chemical composition of essential oils of Umbelliferae plants (parsley, celery, dill and
caraway) grown in Lithuania shows that the amount of the major constituents are in the same
order as published data. P-Phellandrene (21%), myristicin (20%) and myrcene (11%) were
found to be the most abundant constituents of parsley essential oil; limonene (63%) and
myrcene (12%) were the major volatiles in celery essential oil. Aroma composition of dill
herb was distinguished by a considerable amount of limonene (27%), D-carvone (14%), dill
ether (21%) and the absence of myristicin, which indicates that the locally grown dill herb can
be ascribed to chemotype II (dillapiole). In this way, the essential oils produced by company
"Meta" are competitive products which can successfully replace imported oils.
The yield of caraway seeds cultivated in Lithuania and essential oil content in them varied in a
rather large range, depending on different factors (cultivation site, cultivar, rate of fertilisation
used, and climatic conditions). Carvone and limonene were the major constituents. The
content of carvone was over 50%in almost all the samples analysed, which corresponds well
with the requirements of the ISO. These results imply a clear need to optimise caraway
cultivation parameters in order to obtain the highest yields of high quality essential oil.
Understanding the relationship between agronomic factors and oil quality can make the
44
Chapter 2
difference between a good yield of a high quality oil and a poor yield of an inferior oil and to
produce reliable management guidelines for commercial growers.
REFERENCES
Analytical Methods Committee. Application of gas-liquid chromatography to the analysis of
essential oils. Part XIV. Monograph for five essential oils. Analyst 1988, 113, 1125—
1136.
Appendino, G.; Jakupovic, J.; Bossio, E. Structural revision of the parsley sesquiterpenes
crispanone and crispane. Phytochemistry 1998, 49, 1719-1722.
Arganosa, G.C.; Sosulski, F.W.; Slinkard, A.E. Seed yields and essential oils of annual and
biennial caraway {Carum carvi L.) grown in Western Canada. J. Herbs Spices & Med.
Plants 1998, 6, 9-17.
Badoc, A.; Lamarti, A.A. Chemotaxonomic evaluation of Anethum graveolens L. (Dill) of
various origins. J. Essent. Oil. Res. 1991, 3,269-278.
Bartschat, D.; Beck, T.; Mosandl, A. Stereoisomeric flavor compounds. 79. Simultaneous
enantioselective analysis of 3-butylphthalide and 3-butylhexahydrophthalide
stereoisomers in celery, celeriac and fennel. J. Agric. Food Chem. 1997, 45, 4554-
4557.
Baslas, B.K.; Baslas, R.K. Aromen, Korperpflegem. 1972, 22,155.
Baysal, T.; Starmans, D.A.J. Supercritical CO2 (SC-CO2) extraction of carvone and limonene
from caraway seed. J. Supercrit. Fluids 1999, 14, 225-234.
Bjeldanes, L.F., Kim I-S. Phthalide components of Celery essential oil. J. Org. Chem. 1977,
42, 2333-2335.
Bouwmeester, H.J.; Kuijpers, A.M. Relationship between assimilate supply and essential oil
accumulation in annual and biennial caraway (Carum carvi L.). J. Essent. Oil. Res.
1993,5,143-152.
Bouwmeester, H.J.; Smid, H.G. Seed yield in caraway (Carum carvi). 1. Role of pollination.
J. Agric. Sci. 1995, 124, 235-244.
Bouwmeester, H.J.; Davies, J.A.R.; Toxopeus, H. Enantiomeric composition of carvone,
limonene and carveols in seeds of dill and annual and biennial caraway varieties. J.
Agric. Food Chem. 1995a, 43, 3057-3064.
45
Chapter 2
Bouwmeester, H.J.; Smid, H.G.; Loman, E. Seed yield in caraway (Carum carvi). 1. Role of
assimilate availability. J. Agric. Sci. 1995b, 124, 245-251.
Bouwmeester, H.J.; Davies, J.A.R., Smid, H.G.; Welten, R.S.A. Physiological limitations to
carvone yield in caraway {Carum carvi L.). Ind. Crops Prod. 1995c, 4, 39-51.
Bouwmeester, H.J.; Gershenzon, J.; Konings, M.C.J.M.; Croteau, R. Biosynthesis of the
monoterpenes and carvone in the fruit of caraway. Plant Physiol. 1998, 117, 901-912.
Bouwmeester, H.J.; Konings, M.C.J.M.; Gershenzon, J.; Karp, F.; Croteu, R. Cytochrome P-
450 dependent (+) - limonene-6-hydroxylation in fruits of caraway (Carum carvi).
Phytochemistry 1999, 50, 243-248.
British Pharmacopoiea. Vol. 1, HMSO: London, 1988.
Brunke, E.J.; Hammerschmidt, F.I.; Koester, F.H.; Mair, P. Constituents of Dill (Anethum
graveolens L.) with sensory importance. J. Essent. Oil. Res. 1991, 3, 257-267.
Chalcat, J.C.; Garry, R.Ph.; Michet, A.; Gorunovic, M. Huiles essentielles de Carum carvi de
Yougoslavie. Rivistaltal. EPOS 1991, Special Issue, 466-470.
Cu, J.; Zhang, Z.; Pu, F.; Perineau, F.; Delmas, M.; Gaset, A. GC/MS and GC/FTIR analysis
of the essential oil of celery seed. J. Essent. Oil Res. 1989, 2(1), 1-5.
El-Wakeil, F.; Morsi, M.K.S.; Farag, R.S.; Shihata, A.A.; Badei, A.Z.N.A. Effects of various
storage conditions on the quality of some spice essential oils. Seifen Ole Fette Wachse
1986, 112,348-353.
Evers, A.M.; Ketoja, E.; Hagg, M.; Plaami, S.; Hakkinen, U.; Pessala, R. Decreased nitrogen
rates and irrigation effect on celery yield and internal quality. Plant Foods for Human
Nutr. 1997, 51, 173-186.
Formacek, V.; Kubeczka, K.H.; Essential Oils Analysis by Capillary Gas Chromatography
and Carbon-13 NMR Spectroscopy. John Wiley & Sons, Chichester, 1982.
Gockeritz, D.; Poggendorf, A.; Schmidt, W.; Schubert, D.; Pohloudek-Fabini, R. Detection of
3,6-dimethyl-2,3,3a,4,5,7a-hexahydrobenzofuran in the essential oil dill. Pharmazie
1979, 34, 846-847.
Haelvae, S.; Craker, L.E.; Simon, J.E.; Charles, D.J. Light levels, growth and essential oil in
dill (Anethum graveolens L.). J. Herbs Spices & Med. Plants 1992a, 1, 47-58.
Haelvae, S.; Craker, L.E.; Simon, J.E.; Charles, D.J. Light quality, growth, and essential oil in
dill (Anethum graveolens L.). J. Herbs Spices & Med. Plants 1992b, 1, 59-69.
46
Chapter 2
Haelvae, S.; Craker, L.E.; Simon, J.E.; Charles, D.J. Growth and essential oil in dill, Anethum
graveolens L., in response to temperature and photoperiod. J. Herbs Spices & Med.
Plants 1993, 1,47-56.
Halva, S.; Hirvi, T.; Makinen, S.; Honkanen, E. Yield and glucosinolate of mustard seeds and
volatile oils of caraway seeds and coriander fruit. II. Yield and volatile oils of caraway
seeds (Carum carvi L.). J. Agric. Set Finland 1986, 58, 163-167.
Halva, S.; Huopalahti, R.; Franz, R.; Makinen, S. Herb yield and essential oil of dill {Anethum
graveolens L.) at different locations. J. Agric. Sci. Finland 1988, 60, 93-100.
Heath H.B. Source book offlavours.AVI Publishing Company Inc USA, 1981.
Hungarian Standard MSZ 9265, Caraway Essential Oil. 1981, 3 pp
Huopalahti, R.; Linko, R.R. Composition and content of aroma compound in Dill, Anethum
graveolens L., at three different growth stages. J. Agric. Food Chem. 1983, 31, 331-
333.
Hussien, M.S. Response of growth, yield and essential oil of coriander and dill to different
nitrogen sources. Egyptian J. Horticulture 1995, 22, 1-10.
ISO Oil of Caraway (Carum carvi L.). ISO-8896-87, 1987.
Jirovetz, L.; Buchbauer, G.; Nikiforov, A. Comparative analysis of different dill herb and dill
seed oil constituents by means of GC/FID and GC/MS. Vergleichende
Inhaltsstoffanalyse verschiedener Dillkraut- und Dillsamenoele mittels GC/FID und
GC/MS. Ernaehrung 1994, 18, 534-536.
Kallio, H.; Kerrola, K.; Alhonmaki, P. Carvone and limonene in caraway fruits (Carum carvi
L.) analyzed by supercritical carbon dioxide extraction-gas chromatography. J. Agric.
Food. Chem. 1994, 42, 2478-2485.
Kasting, R.; Andersson, J.; von Sydow, E. Volatile constituents in leaves of parsley.
Phytochemistry 1972, 11, 2277-2282.
Lawrence, B.M. New trends in essential oils. Perfum. Flavor. 1980a, 5, 6-16.
Lawrence, B.M. Dill oil. In: Progress in essential oils. Perfum. Flavor. 1980b, 5 , 49-50.
Lopez, M.G.; Sanchez-Mendoza, I.R.; Ochoa-Alejo, N. Comparative study of volatile
components and fatty acids of plants and in vitro cultures of parsley (Petroselinum
crispum (Mill) Nym ex Hill). J. Agric. Food Chem. 1999, 47, 3292-3296.
Macleod, G.; Ames, J.M. Volatile components of Celery and Celeriac. Phytochemistry 1989,
28, 1817-1824.
47
Chapter 2
MacLeod, A.J.; Snyder, C.H.; Subramanian, G. Volatile aroma constituents of parsley leaves.
Phytochemistry 1985,24, 2623-2627.
Masanetz, C; Grosch, W. Key odorants of parsley leaves (Petroselinum crispum [Mill.] ssp.
crispum) by odour - activity values. Flavour Fragrance J. 1998, 13, 115-124.
Nitz, S; Kollmannsberger, H; Spraul, M.H; Drawert, F. Oxygenated derivatives of
menthatriene in parsley leaves. Phytochemistry 1989, 28, 3051-3054.
Pino, J.A.; Roncal, E.; Rosado, A.; Goire, I. Herb oil of dill (Anethum graveolens L.) grown in
Cuba. J. Essent. Oil Res. 1995, 7, 219-220.
Puschmann, G.; Stephani, V.; Fritz, D. Untersuchungen zur Variabilitat von Ktimmel (Carum
carvi L.). Gartenbauwissenschaft 1992, 57, 275-277.
Richard, H.; Noleau, I.; Giampaoli, P. Techniques d'analyse des epices et aromates. In: Epices
et Aromates; Richard, H. (Coordinateur), Tec & Doc-Lavoisier Apria, 1992; pp 192-
213.
Schreier, P.; Drawert, F.; Heindze, I. Quantitative composition of natural and technologically
modified plant aromas. IX. Freeze concentration of an extract from fresh dill herb. Z.
Lebensm. Unters. Forsch. 1981, 172, 257-263.
Simon, J.E.; Quinn, J. Characterization of essential oil of parsley. J. Agric. Food Chem. 1988,
Vol. 36,467^172.
Uhlig, J.W.; Chang, A.; Jen, J.J. Effect of phthalides on Celery flavour. J. FoodSci. 1987, 52
(3), 658-660.
Van Wassenhove, F.; Dirinick, P.; Schamp, N. Analysis of the key components of Celery by
two dimensional gas chromatography. In: Bioflavour 87; Schreier P., ed.; Analysis-
Biochemistry-Biotechnology. Berlin: Walter de Gruyter, 1988; pp 137-144.
Wilson, C.W. Terpene and sesquiterpene hydrocarbons in the essential oil from fresh celery.
J. Food Sci. 1969,34,521.
Zawirska-Wojtasiak, R.; Wasowicz, E.; Jelen, H.; Rudzinska, M.; Kaminski, E.; Blazczak, P.
Aroma characteristics of dill seeds varieties grown in Poland. Polish J. FoodNutr. Sci.
1998,7,181-192.
48
CHAPTER 3
INFLUENCE OF HARVESTING TIME ON THE
COMPOSITION OF VOLATILE COMPONENTS IN
DIFFERENT ANATOMICAL PARTS OF LOVAGE
(LEVISTICUM OFFICINALE KOCH.)
This chapter is based on the following article:
E. Bylaite, R.Venskutonis, J.P.Roozen . "Influence of harvesting time on the composition of volatile components in different anatomical parts of lovage (Levisticum officinale Koch.)". J. Agric. FoodChem. 1998,46, 3735-3740.
Chapter 3
ABSTRACT
The essential oils from different botanical parts (leaves, stems, flowers and seeds) of lovage
(Levisticum officinale Koch.) were analysed at various phases of plant growth. The seasonal
changes in leaves were less considerable than in the stems. Seeds and flowers possessed the
highest yield of oil. a-Terpinyl acetate was found to be dominating compound in leaves and
stems (up to 70%), P-phellandrene in seeds and flowers (61.5 % and 40.8 % respectively); Z-
ligustilide was confirmed as a major lovage phthalide constituting from 4.4% to 11.7% in
leaves and from 4.8% to 13.8% in the stems essential oils depending on the harvesting time.
INTRODUCTION
Lovage (Levisticum officinale Koch.) is a tall perennial aromatic plant, cultivated in numerous
European countries. The essential oils from leaves, seeds and roots of lovage are used in food,
beverage, perfumery, and tobacco industry (Cu et al., 1993). The root of lovage has also been
known for centuries as a medicine possessing carminative and spasmolytic activity
(Segebrecht and Scilcher, 1989).
The composition of volatile compounds of lovage has been the subject of numerous
investigations (Gijbels et al., 1982; De Pooter et al., 1985; Toulemonde et al., 1987;
Toulemonde and Noleau, 1988; Segebrecht and Scilcher, 1989; Cu et al., 1990; Stahl-Biskup
and Wichtmann, 1991; Blank and Schieberle, 1993; Venskutonis, 1995; Bylaite et al., 1996).
Different anatomical parts of lovage have been analysed, however, most of the studies were
focused on the root. Their specific flavour is characterised as medium aromatic (Heath and
Reineccius, 1986) or as strong impact warmly aromatic with sweet, yeasty, musky, lemon
like, celery-like notes (Heath, 1981). The phthalides are believed to play a major role in the
aroma of lovage. Seven phthalides have been identified in lovage roots constituting from 22%
to 71% (Toulemonde and Noleau, 1988; Cu et al., 1990) in the total essential oil. Different
isolation procedures (dynamic headspace, distillation, and extraction with different solvents)
were used to obtain lovage aroma concentrates and the content of phthalides in them was
highly dependent on the method applied. However, only a few studies on the assessment of
odour active components of lovage were performed in recent years (Blank and Schieberle,
1993; Bylaite et al., 1996) and none of them demonstrated the significant contribution of
50
Chapter 3
phthalides to the aroma of lovage. On the contrary, the investigation of celery aroma
compounds revealed a significant correlation between sensory evaluation of flavour scores
with the individual and total phthalide contents (Uhlig et al., 1987; MacLeod and Ames,
1989).
Toulemonde and Noleau (1988) performed a detailed study of lovage leaf, seed and root
essential oils as well as root and leaf solvent extracts in 1988, and identified 191 compounds.
Quantitative analysis of seed and root essential oil showed that P-phellandrene was a major
component in the seed essential oil (63%) whilst cw-3-«-butylidene-4,5-dihydrophthalide was
a dominating constituent in the root oil (67%). It should be noted that the number of detected
compounds significantly depended on the method of isolation, e. g., 116 compounds were
detected in the leaves by using simultaneous distillation-extraction in the Likens-Nickerson
apparatus, whereas only 31 constituents were found in dichloromethane extract. De Pooter et
al. (1985) also performed comparison of different isolation procedures and their effects on
aroma composition of lovage. They found that the headspace of fresh lovage constituted
almost exclusively of mono- and sesquiterpenes, while phthalides appeared among volatiles
only when hydrodistillation was used.
The variation of aroma composition depends on different factors, such as the isolation
procedure, the botanical part of the plant, harvesting time and state of maturity. A survey of
the literature reveals that a detailed investigations of the variations of yield and changes of
aroma compounds in different botanical parts of lovage during the growth period have not
been the subject of any detailed study. An exception was the study by Stahl-Biskup and
Wichtmann (1991), in which the composition of the essential oil from the lovage roots in
relation to the development of their oil duct systems was analysed and phthalides were found
in considerable amounts only after many secondary oil ducts had been developed.
Thus it was considered that the studies of the seasonal variations in the composition of
volatiles in different botanical parts of lovage cultivated in Lithuania would be of some
interest.
51
Chapter 3
MATERIALS AND METHODS
Plant material and isolation of volatile compounds
Plant material was collected in the experimental garden of Lithuanian Institute of Horticulture
in 1995. The whole herb was harvested every second week, total in 8 times from the middle of
May untill the end of September. The plants were sorted by botanical part (leaves, stems,
flowers, seeds, and roots) depending on the growth period and air-dried at 30° in the
laboratory oven with active ventilation. Volatiles were isolated by hydrodistillation in a
Clevenger type apparatus during 2 hr. Triplicate analysis was carried out for every sample.
Simultaneously the content of moisture in air-dried herb was determined by distilling 5 g of
the sample with toluene for 1.5 hr (AOAC, 1995). The yields of oil were presented in %
(w/w) of dry wt.
Identification and quantification of volatile compounds
The essential oils were diluted with Et20 (1% v/v) and analysed on a dual column Carlo Erba
Vega 6000 gas chromatograph with FID heated at 260°C. Four GC analyses were carried out
for each essential oil. Two different polarity fused silica capillary columns were used: DB-1
(dimethylpolysiloxane) and DB-WAX (polyethylene glycol) both 60 m length, 0.25 mm i. d.,
0.25 |am film thickness. The oven temperature was programmed from 50°C (5 min hold) to
250°C at a rate of 3°C min"1 with a final hold of 10 min. Helium was used as a carrier gas
with a flow rate of 2 ml min"1. Injector temperature was set up at 230°C.
Gas chromatography-mass spectrometry analyses were performed on a combined GC-MS
(Varian 3400, Finnigan MAT 95) instrument with a mass selective detector by using BP-5
(5% phenyl-methylpolysiloxane) capillary column (25 m length, 0.25 mm i. d., 0.25um film
thickness); GC oven temperature was programmed from 60°C to 260°C at the increase of 3°C
min"1. Mass spectra were obtained with 70 eV electron impact ionisation and scanned from
m/z=24 to 300 at 0.5 s dec"1.
Identification was based mainly on the comparison of retention indices (RI) and mass spectra
(Adams, 1995). Also the results obtained were thoroughly compared with the published ones
52
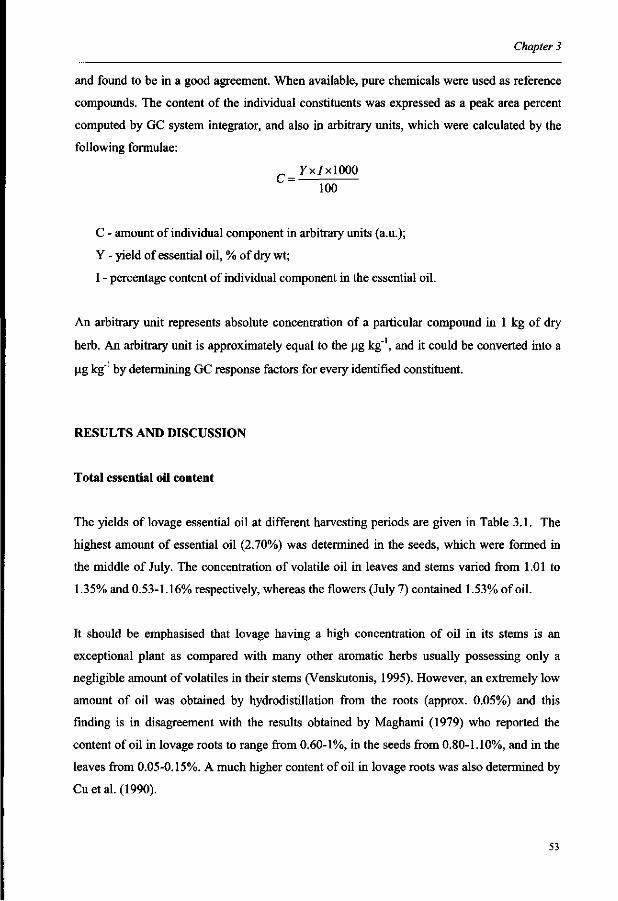
Chapter 3
and found to be in a good agreement. When available, pure chemicals were used as reference
compounds. The content of the individual constituents was expressed as a peak area percent
computed by GC system integrator, and also in arbitrary units, which were calculated by the
following formulae:
7x7x1000 C = -
100
C - amount of individual component in arbitrary units (a.u.);
Y - yield of essential oil, % of dry wt;
I - percentage content of individual component in the essential oil.
An arbitrary unit represents absolute concentration of a particular compound in 1 kg of dry
herb. An arbitrary unit is approximately equal to the |ag kg"1, and it could be converted into a
(ig kg"1 by determining GC response factors for every identified constituent.
RESULTS AND DISCUSSION
Total essential oil content
The yields of lovage essential oil at different harvesting periods are given in Table 3.1. The
highest amount of essential oil (2.70%) was determined in the seeds, which were formed in
the middle of July. The concentration of volatile oil in leaves and stems varied from 1.01 to
1.35% and 0.53-1.16% respectively, whereas the flowers (July 7) contained 1.53% of oil.
It should be emphasised that lovage having a high concentration of oil in its stems is an
exceptional plant as compared with many other aromatic herbs usually possessing only a
negligible amount of volatiles in their stems (Venskutonis, 1995). However, an extremely low
amount of oil was obtained by hydrodistillation from the roots (approx. 0.05%) and this
finding is in disagreement with the results obtained by Maghami (1979) who reported the
content of oil in lovage roots to range from 0.60-1%, in the seeds from 0.80-1.10%, and in the
leaves from 0.05-0.15%. A much higher content of oil in lovage roots was also determined by
Cuetal. (1990).
53
Chapter 3
Table 3.1. Yields % (w/w of dry wt) of essential oils from different botanical parts of lovage at different harvesting periods Growth phase and date of
harvesting
1. Shoot up, May 15
2. Growing, May 25
3. Growing, June 9
4. Formation of buds, June 16
5. Beginning of flowering,
June 28
6. End of flowering, July 7
7. Formation of seeds, July 19
8. 2nd shoot up (newly grown plant),
Sept 21
Leaves
1.1410.04
1.21+0.05
1.35±0.04
1.12+0.06
1.01+0.04
1.10+0.05
1.09+0.04
1.10+0.03
Anatomical part
Stems
0.53+0.04
0.6810.04
0.9710.04
1.16+0.06
0.6510.04
0.5310.03
0.73+0.03
1.16+0.03
Flowers Seeds Roots
1.53+0.06
2.710.05
0.0510.04
The content of essential oil in the leaves was almost constant during the whole period of plant
vegetation with a peak (1.30%) just before the formation of buds (the phase of intensive
growing, beginning of June). From a previous harvest in 1992 the yield of essential oil from
the leaves of lovage on June 17 (beginning of blossom) and July 8 (full bloom) was
significantly higher, 1.47 and 1.98% respectively, than the yield on 1995 most likely due to
different climatic conditions, because the cultivars of the plant, growing and drying conditions
were the same (Venskutonis, 1995).
The concentration of the essential oil in the stems was steadily increasing from 0.53% in May
15 (initial growing) to 1.16% in June 16 (buds formation), however, afterwards dropped
again. In general, it is accepted that most of the herbs accumulate the highest amount of
volatile oil during the anthesis period, however numerous studies show that every particular
aromatic plant can possess its own peculiarities. For instance, the study of aroma compounds
in dill by Huopalahti and Linko (1983) showed their highest value at the initial stage of
growth, whilst the thyme was richest in essential oil during or immediately after the full
bloom (Senatore, 1996).
Composition of essential oils
54
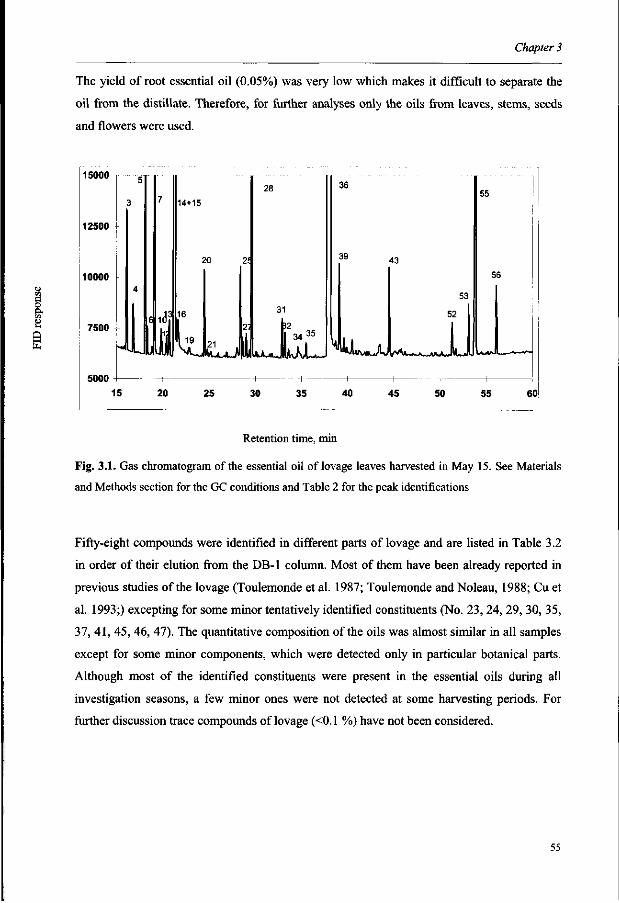
Chapter 3
The yield of root essential oil (0.05%) was very low which makes it difficult to separate the
oil from the distillate. Therefore, for further analyses only the oils from leaves, stems, seeds
and flowers were used.
a o p,
s
15000
12500
10000
7500
5000
14+15
20 2!
i d 3 1 6
28
31
34 35
36
39 43
53
52
"HMjUtAu^^uJllU
55
56
15 20 25 30 35 40 45 50 55 60
Retention time, min
Fig. 3.1. Gas chromatogram of the essential oil of lovage leaves harvested in May 15. See Materials
and Methods section for the GC conditions and Table 2 for the peak identifications
Fifty-eight compounds were identified in different parts of lovage and are listed in Table 3.2
in order of their elution from the DB-1 column. Most of them have been already reported in
previous studies of the lovage (Toulemonde et al. 1987; Toulemonde and Noleau, 1988; Cu et
al. 1993;) excepting for some minor tentatively identified constituents (No. 23, 24, 29, 30, 35,
37, 41, 45, 46, 47). The quantitative composition of the oils was almost similar in all samples
except for some minor components, which were detected only in particular botanical parts.
Although most of the identified constituents were present in the essential oils during all
investigation seasons, a few minor ones were not detected at some harvesting periods. For
further discussion trace compounds of lovage (<0.1 %) have not been considered.
55
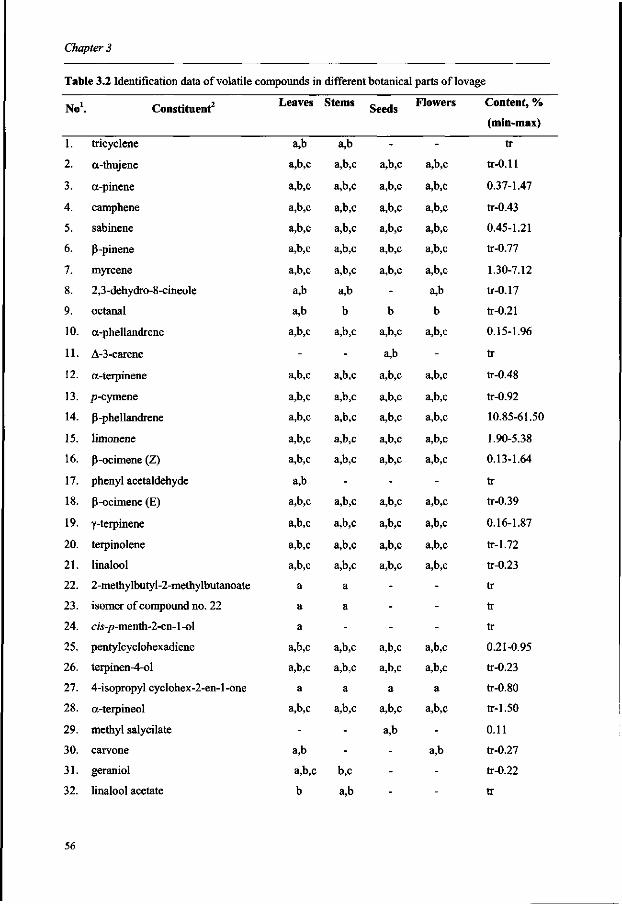
Chapter 3
Table 3.2 Identification data of volatile compounds in
No1
1.
2.
3.
4.
5.
6.
7.
8.
9.
10.
11.
12.
13.
14.
15.
16.
17.
18.
19.
20.
21.
22.
23.
24.
25.
26.
27.
28.
29.
30.
31.
32.
Constituent2
tricyclene
a-thujene
a-pinene
camphene
sabinene
P-pinene
myrcene
2,3 -dehydro-8-cineole
octanal
a-phellandrene
A-3-carene
a-terpinene
/j-cymene
P-phellandrene
limonene
P-ocimene (Z)
phenyl acetaldehyde
P-ocimene (E)
y-terpinene
terpinolene
linalool
2-methylbutyl-2-methylbutanoate
isomer of compound no. 22
c«-p-menth-2-en-1 -ol
pentylcyclohexadiene
terpinen-4-ol
4-isopropyl cyclohex-2-en-l-one
a-terpineol
methyl salycilate
carvone
geraniol
linalool acetate
Leaves
a,b
a,b,c
a,b,c
a,b,c
a,b,c
a,b,c
a,b,c
a,b
a,b
a,b,c
-
a,b,c
a,b,c
a,b,c
a,b,c
a,b,c
a,b
a,b,c
a,b,c
a,b,c
a,b,c
a
a
a
a,b,c
a,b,c
a
a,b,c
-
a,b
a,b,c
b
different botanical parts of lovage
Stems
a,b
a,b,c
a,b,c
a,b,c
a,b,c
a,b,c
a,b,c
a,b
b
a,b,c
-
a,b,c
a,b,c
a,b,c
a,b,c
a,b,c
-
a,b,c
a,b,c
a,b,c
a,b,c
a
a
-
a,b,c
a,b,c
a
a,b,c
-
-
b,c
a,b
Seeds
-
a,b,c
a,b,c
a,b,c
a,b,c
a,b,c
a,b,c
-
b
a,b,c
a,b
a,b,c
a,b,c
a,b,c
a,b,c
a,b,c
-
a,b,c
a,b,c
a,b,c
a,b,c
-
-
-
a,b,c
a,b,c
a
a,b,c
a,b
-
--
Flowers
-
a,b,c
a,b,c
a,b,c
a,b,c
a,b,c
a,b,c
a,b
b
a,b,c
-
a,b,c
a,b,c
a,b,c
a,b,c
a,b,c
-
a,b,c
a,b,c
a,b,c
a,b,c
-
-
-
a,b,c
a,b,c
a
a,b,c
-
a,b
--
Content, %
(min-max)
tr
tr-0.11
0.37-1.47
tr-0.43
0.45-1.21
tr-0.77
1.30-7.12
tr-0.17
tr-0.21
0.15-1.96
tr
tr-0.48
tr-0.92
10.85-61.50
1.90-5.38
0.13-1.64
tr
tr-0.39
0.16-1.87
tr-1.72
tr-0.23
tr
tr
tr
0.21-0.95
tr-0.23
tr-0.80
tr-1.50
0.11
tr-0.27
tr-0.22
tr
56
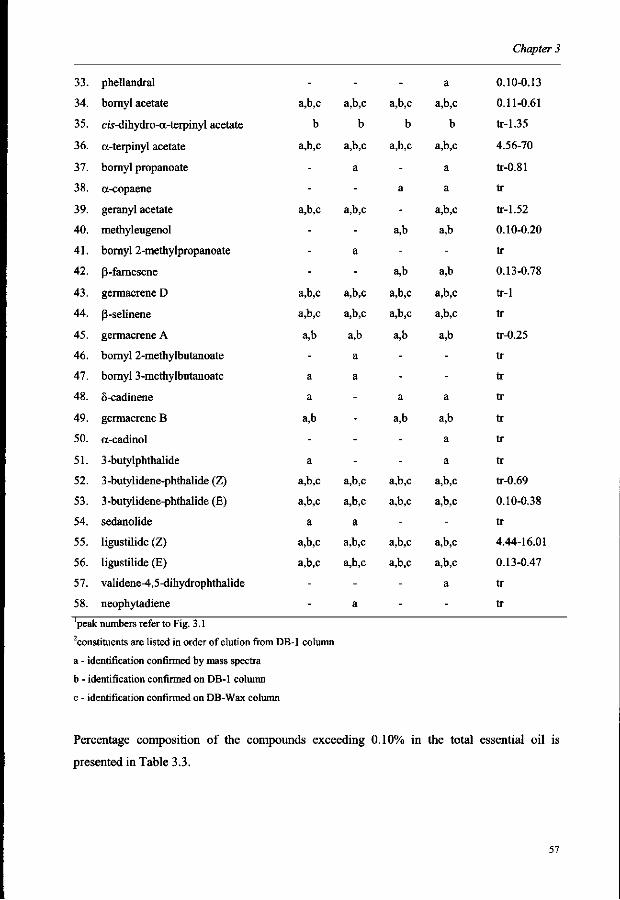
Chapter 3
33.
34.
35.
36.
37.
38.
39.
40.
41.
42.
43.
44.
45.
46.
47.
48.
49.
50.
51.
52.
53.
54.
55.
56.
57.
58.
phellandral
bornyl acetate
a's-dihydro-a-terpinyl acetate
a-terpinyl acetate
bomyl propanoate
a-copaene
geranyl acetate
methyleugenol
bomyl 2-methylpropanoate
P-farnesene
germacrene D
P-selinene
germacrene A
bornyl 2-methylbutanoate
bornyl 3-methylbutanoate
8-cadinene
germacrene B
a-cadinol
3-butylphthalide
3-butylidene-phthalide (Z)
3-butylidene-phthalide (E)
sedanolide
ligustilide (Z)
ligustilide (E)
validene-4,5-dihydrophthalide
neophytadiene
-
a,b,c
b
a,b,c
-
-
a,b,c
-
-
-
a,b,c
a,b,c
a,b
-
a
a
a,b
-
a
a,b,c
a,b,c
a
a,b,c
a,b,c
-
-
-
a,b,c
b
a,b,c
a
-
a,b,c
-
a
-
a,b,c
a,b,c
a,b
a
a
-
-
-
-
a,b,c
a,b,c
a
a,b,c
a,b,c
-
a
-
a,b,c
b
a,b,c
-
a
-
a,b
-
a,b
a,b,c
a,b,c
a,b
-
-
a
a,b
-
-
a,b,c
a,b,c
-
a,b,c
a,b,c
-
-
a
a,b,c
b
a,b,c
a
a
a,b,c
a,b
-
a,b
a,b,c
a,b,c
a,b
-
-
a
a,b
a
a
a,b,c
a,b,c
-
a,b,c
a,b,c
a
-
0.10-0.13
0.11-0.61
tr-1.35
4.56-70
tr-0.81
tr
tr-1.52
0.10-0.20
tr
0.13-0.78
tr-1
tr
tr-0.25
tr
tr
tr
tr
tr
tr
tr-0.69
0.10-0.38
tr
4.44-16.01
0.13-0.47
tr
tr
peak numbers refer to Fig. 3.1
Constituents are listed in order of elution from DB-1 column
a - identification confirmed by mass spectra
b - identification confirmed on DB-1 column
c - identification confirmed on DB-Wax column
Percentage composition of the compounds exceeding 0.10% in the total essential oil is
presented in Table 3.3.
57
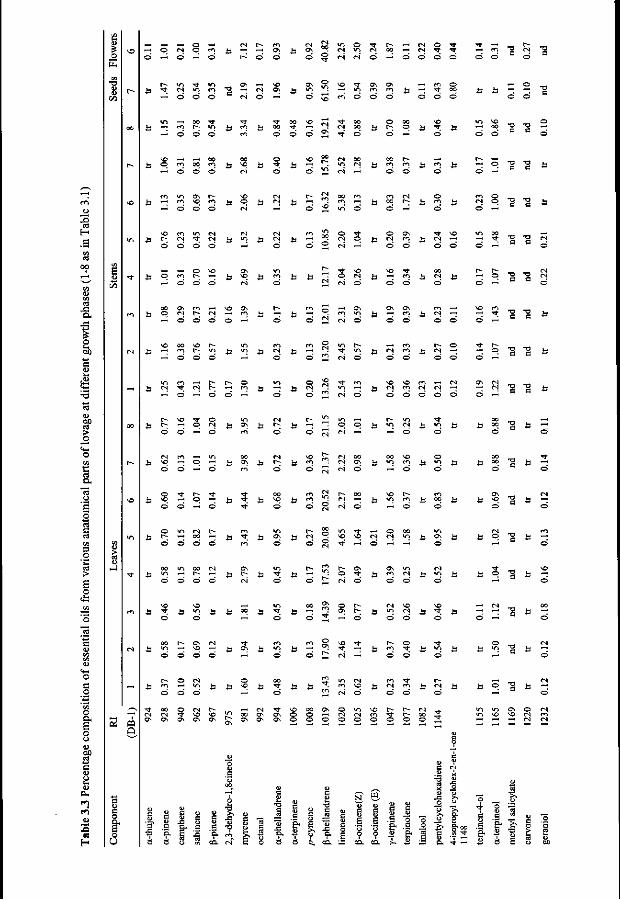
•8
!
e
o
o
PL,
H
2 m
o
,-« ,-H - ^ O - ^ —< O fN O en © —; © — d
—< —< ON
ON - H \ o CN m m "2 —< <N
t " : <*! -H o
V£> ~-, ^ O m 00 -H" d d
is ^ U
^O m u O £
^> m »n cs
—< - H o o tn r-^ © ©
- d
-H o — - : -b
— o d —
<N m >—• i n ^O —i o —• d d -^ d
_ o — d —J d
r- ~^ oo —
oo ^ so N m —• r- —• t> £-
i3 i ! °° *! ^ i
i n ~ - \£> - H
ON ON 0 \ ON ON
ON J3
00 ON ON \o OO O O O O
N ^ fS oo (N <N O —
- ^ i n m m
© 2
H 4" fc- -^ O ^ M —
d 2
•a =5 -S g =
3 &, -H
o t ^ i:
m ^ m fc
m ±3 (N —
irt ^ . (S M J- M - ^
-: £ vO vo m CN m cs
o t- <ri (N
« « N (S r f _ ; o _ ;
ON t-- ^3 i n r s £
^ 1 £
m ^o £ cN m j3
—' (N fN
% - * 1 1 & i ^
— < • *
d ^
— © © —i
© —3
d —;
_H ^3 -O
>n i n ON © r s •n ^o ^o (N m ,-H —I - ^ (Nl CN
3 & CL, CCL ^2 o a c a
m - 7 —i ^3 P , "<t - H
.a & -2 a
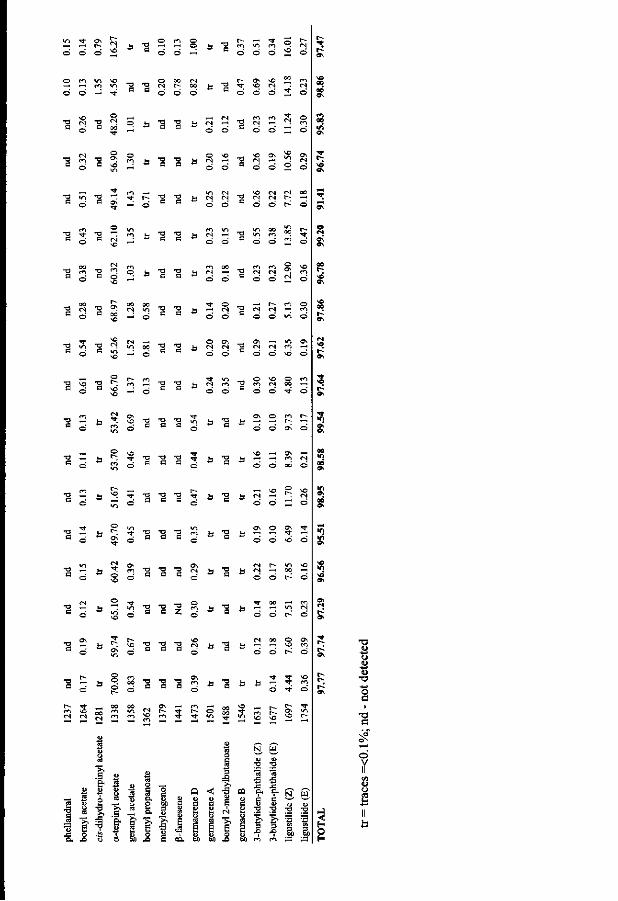
o © © 2
m «n >o
>- o o —< £ 3 ° d d «
d 2
^ *2 (N —
o 2
\D (N (N 00 CN (N f - —
rr is
o\ —• w os <N <N m - -
m <N OO -^
s£> - H ON —' £3 - ^ - ^ rn (S
(S -H OO - H
TT „« 00 00 Os —
43 is - 1 ^
£ - c-Ss ^ ^ **> \Q \0
& 3 •3 -3
•s 8
•s. --s "w S
•?, T- •€ S
a 1
-§ s
( N
^ e o
CQ <u s 1 -
8
0)
& C u 31 % s
tx
a u 3 % 3
N
o> 3 f2
1
ST <D
3 r3
1 d w 00 £ » m m 3 3
<0
u T3
T3
a
O V
8
Chapter 3
All identified constituents were divided into the three groups: major constituents (the mean
content higher than 9%), compounds of low-medium concentration (constituting
approximately 1-5%), and minor constituents (less than 1%). Three major components were
common for all analysed lovage parts, namely, P-phellandrene, a-terpinyl acetate and cis-
ligustilide. This finding is in agreement with the results published in the literature
(Toulemonde and Noleau, 1988; Venskutonis, 1995). However the differences in the ratio and
seasonal variations in the content of these components in separate parts of the plant were quite
considerable (Table 3.2).
Major constituents of lovage
A monoterpene ester, a-terpinyl acetate, was the major constituent in the essential oils from
stems and leaves at all harvesting periods: its peak constituted 48.20-68.97% and 49.70-70%
respectively in the total GC peak area. The highest content of this compound (70%) was
determined in the leaves collected during the first harvesting in May 15; in the stems it was
also high at this vegetation phase and exceeded 65% in the period from May 15 till June 9.
Some reduction in the percentage (Table 3.3) and absolute (Fig. 3.2) concentration of a-
terpinyl acetate in the leaves and stems can be observed during the flowering period of the
plants. In the flowers it constituted only 16.27% (July 7) but the smallest amount of a-terpinyl
acetate was determined in the seeds 4.56%. These results are in agreement with published
data by Toulemonde and Noleau (1988) who found essential oil from seeds containing
63.15% and 3.07% of P-phellandrene and a-terpinyl acetate respectively. The impact of a-
terpinyl acetate on the aroma profile of lovage was not studied in the surveyed literature. The
odour of this compound is characterised as "fresh bergamot-lavender" (Bauer et al., 1990),
and it would be interesting to establish its role in the lovage aroma profile. Recently in a gas
chromatography-sniffing panel technique only 3 out of 10 panellists detected a-terpinyl
acetate in the headspace vapour concentrate from lovage stems and flowers by attributing
floral, sweet odour tones to it (Bylaite et al., 1996).
The content of the major monoterpene hydrocarbon P-phellandrene varied from 13.43 to
21.37% of the total essential oil of leaves and from 10.85 to 19.21% in stems. It is interesting
to notice that it increased during flowering both in leaves (5l harvesting, June 28) and stems
(6th harvesting, July 7). During this phase the percentage content of a-terpinyl acetate
60
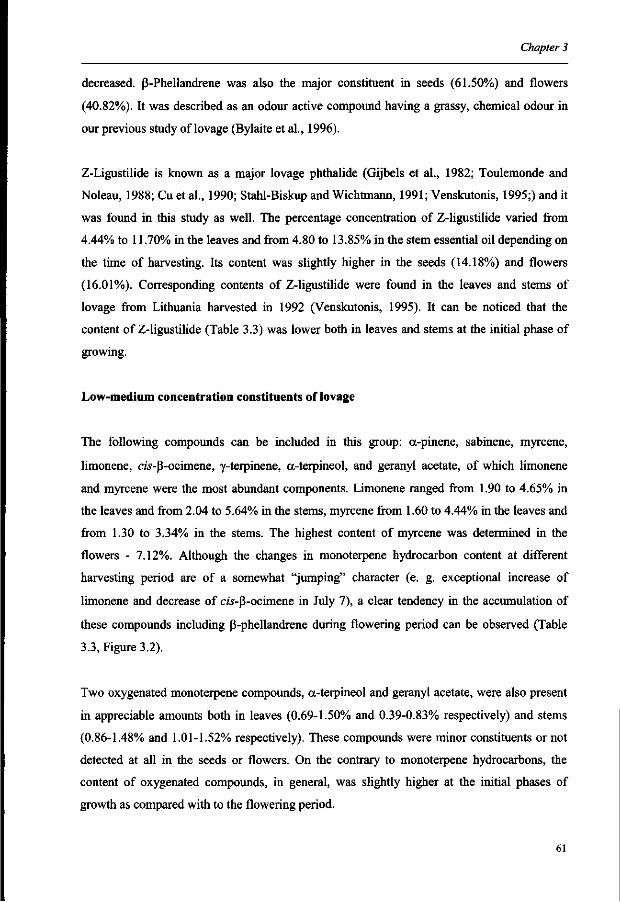
Chapter 3
decreased. P-Phellandrene was also the major constituent in seeds (61.50%) and flowers
(40.82%). It was described as an odour active compound having a grassy, chemical odour in
our previous study of lovage (Bylaite et al., 1996).
Z-Ligustilide is known as a major lovage phthalide (Gijbels et al., 1982; Toulemonde and
Noleau, 1988; Cu et al., 1990; Stahl-Biskup and Wichtmann, 1991; Venskutonis, 1995;) and it
was found in this study as well. The percentage concentration of Z-ligustilide varied from
4.44% to 11.70% in the leaves and from 4.80 to 13.85% in the stem essential oil depending on
the time of harvesting. Its content was slightly higher in the seeds (14.18%) and flowers
(16.01%). Corresponding contents of Z-ligustilide were found in the leaves and stems of
lovage from Lithuania harvested in 1992 (Venskutonis, 1995). It can be noticed that the
content of Z-ligustilide (Table 3.3) was lower both in leaves and stems at the initial phase of
growing.
Low-medium concentration constituents of lovage
The following compounds can be included in this group: a-pinene, sabinene, myrcene,
limonene, cw-p-ocimene, y-terpinene, a-terpineol, and geranyl acetate, of which limonene
and myrcene were the most abundant components. Limonene ranged from 1.90 to 4.65% in
the leaves and from 2.04 to 5.64% in the stems, myrcene from 1.60 to 4.44% in the leaves and
from 1.30 to 3.34% in the stems. The highest content of myrcene was determined in the
flowers - 7.12%. Although the changes in monoterpene hydrocarbon content at different
harvesting period are of a somewhat "jumping" character (e. g. exceptional increase of
limonene and decrease of cis-P-ocimene in July 7), a clear tendency in the accumulation of
these compounds including p-phellandrene during flowering period can be observed (Table
3.3, Figure 3.2).
Two oxygenated monoterpene compounds, a-terpineol and geranyl acetate, were also present
in appreciable amounts both in leaves (0.69-1.50% and 0.39-0.83% respectively) and stems
(0.86-1.48% and 1.01-1.52% respectively). These compounds were minor constituents or not
detected at all in the seeds or flowers. On the contrary to monoterpene hydrocarbons, the
content of oxygenated compounds, in general, was slightly higher at the initial phases of
growth as compared with to the flowering period.
61
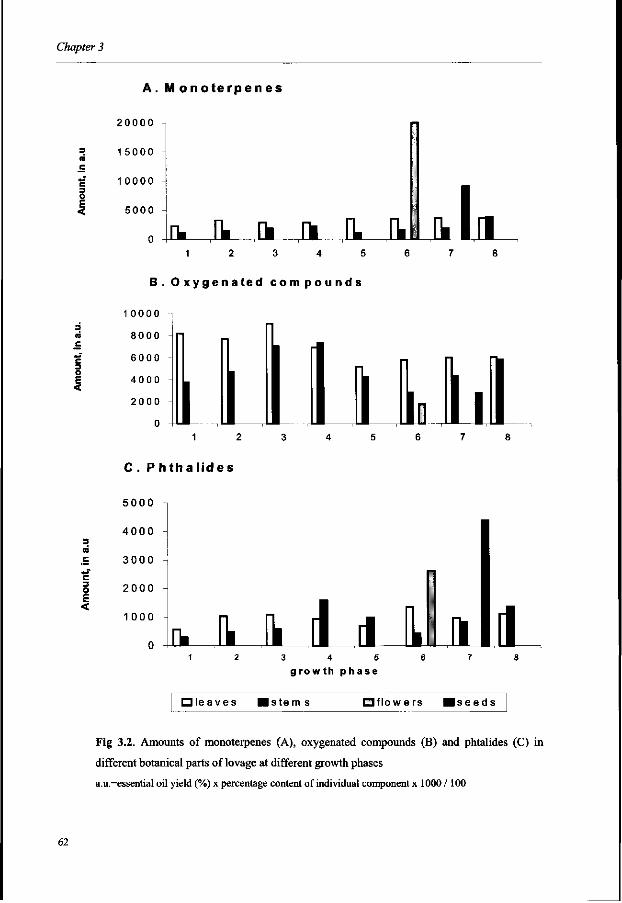
Chapter 3
o E <
o £ <
c 3 o E <
A. M o n o t e r p e n e s
20000
15000 -
1 0000
Sh-Jk H TLll Tb
B . O x y g e n a t e d c o m p o u n d s
C . P hth a l ides
5000
4000
3000 -
2 0 0 0
1000 • • I I I , I N
L L 6 7 8
LLJLIL 6 7 8
g rowth phase
• l e a v e s I s t e m s • f l ow e rs I s e e d s
Fig 3.2. Amounts of monoterpenes (A), oxygenated compounds (B) and phtalides (C) in
different botanical parts of lovage at different growth phases
a.u.=essential oil yield (%) x percentage content of individual component x 1000 / 100
62
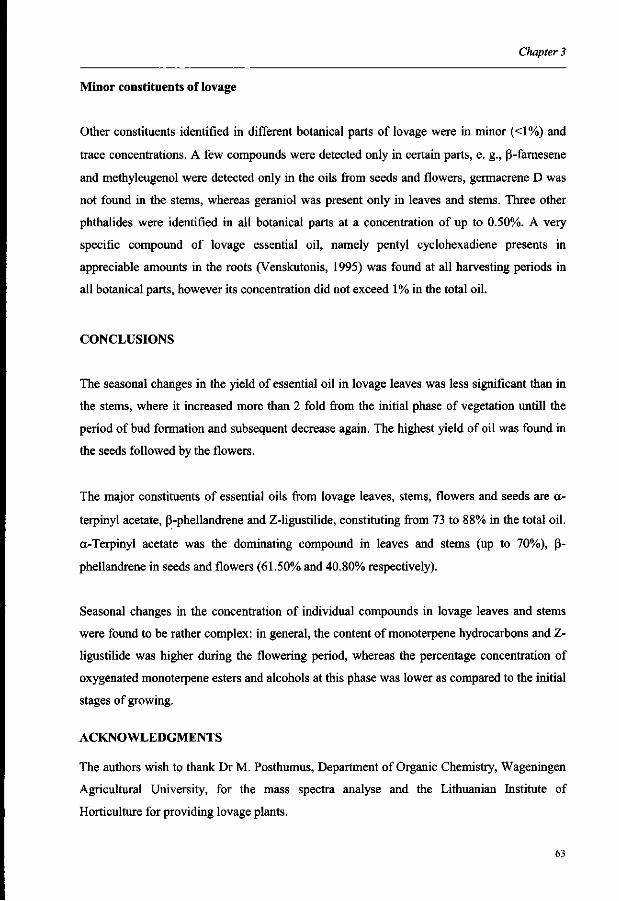
Chapter 3
Minor constituents of lovage
Other constituents identified in different botanical parts of lovage were in minor (<1%) and
trace concentrations. A few compounds were detected only in certain parts, e. g., p-farnesene
and methyleugenol were detected only in the oils from seeds and flowers, germacrene D was
not found in the stems, whereas geraniol was present only in leaves and stems. Three other
phthalides were identified in all botanical parts at a concentration of up to 0.50%. A very
specific compound of lovage essential oil, namely pentyl cyclohexadiene presents in
appreciable amounts in the roots (Venskutonis, 1995) was found at all harvesting periods in
all botanical parts, however its concentration did not exceed 1% in the total oil.
CONCLUSIONS
The seasonal changes in the yield of essential oil in lovage leaves was less significant than in
the stems, where it increased more than 2 fold from the initial phase of vegetation untill the
period of bud formation and subsequent decrease again. The highest yield of oil was found in
the seeds followed by the flowers.
The major constituents of essential oils from lovage leaves, stems, flowers and seeds are a-
terpinyl acetate, (J-phellandrene and Z-ligustilide, constituting from 73 to 88% in the total oil.
a-Terpinyl acetate was the dominating compound in leaves and stems (up to 70%), p-
phellandrene in seeds and flowers (61.50% and 40.80% respectively).
Seasonal changes in the concentration of individual compounds in lovage leaves and stems
were found to be rather complex: in general, the content of monoterpene hydrocarbons and Z-
ligustilide was higher during the flowering period, whereas the percentage concentration of
oxygenated monoterpene esters and alcohols at this phase was lower as compared to the initial
stages of growing.
ACKNOWLEDGMENTS
The authors wish to thank Dr M. Posthumus, Department of Organic Chemistry, Wageningen
Agricultural University, for the mass spectra analyse and the Lithuanian Institute of
Horticulture for providing lovage plants.
63
Chapter 3
REFERENCES
Adams, R. P. Identification of Essential Oil Components by GC/MS. Allured Publ. Carol
Stream, 111., USA, 1995.
Bauer, K.; Garbe, D.; Surburg, H. Common Fragrance and Flavour Materials. Preparation,
Properties and Uses. VCH Verlagsgesellschaft GmbH Weiw/ze/m, 1990.
Blank, I.; Schieberle, P. Analysis of the seasoning-like flavour substances of a commercial
lovage extract (Levisticum officinale Koch.). Flavour Fragrance J. 1993, 8, 191-195.
Bylaite, E.; Legger, A.; Roozen, J. P.; Venskutonis, P. R. Dynamic headspace gas
chromatography of different botanical parts of lovage (Levisticum officinale Koch.). In
Developments in Flavour Science; Taylor, A. J., Mottram, D. S., Eds.; The Royal
Society of Chemistry, UK, 1996; pp 66-69.
De Pooter, H. L.; Coolsaet, B. A.; Dirinck, P. J.; Schamp, N. M. GLC of the headspace after
concentration on Tenax GC and of the essential oils of apples, fresh celery, fresh
lovage, honeysuckle and ginger powder. In Essential Oils and Aromatic Plants;
Baerheim-Svendsen, A., Scheffer, J. J. C, Eds.; Publisher: Nijhoff/Junk Dordrecht, The
Netherlands, 1985; pp 67-77.
Gijbels, M. J. M.; Scheffer, J. J. C; Baerheim-Svendsen, B. Phthalides in the essential oil
from roots of Levisticum officinale. Planta Medica 1982, 44, 207-211.
Heath, H. B. Source book of flavors. AVI Publishing Compamy Inc USA, 1981.
Heath, H. B.; Reineccius, G. Flavor Chemistry and Technology. Macmillan Publishers USA,
1986.
Huopalahti, R.; Linko, R. R. Composition and content of aroma compounds in dill, Anethum
graveolens L., at three different growth stages. J. Agric. Food Chem. 1983, 31, 331-
333.
Cu, J-Q.; Pu, F.; Shi, Y.; Perineu, F.; Delmas, M.; Gaset, A. The chemical composition of
lovage headspace and essential oil produced by solvent extraction with various solvents.
J. Essent. Oil. Res. 1990, 2, 53-59.
MacLeod, G.; Ames, J. M. Volatile components of celery and celeriac. Phytochemistty 1989,
28, 1817-1824.
Maghami, P. Culture et cueillette desplantes medicinales. Hachette Paris, 1979.
64
Chapter 3
Official Methods of Analysis of the Association of Official Analytical Chemists; Helrich, K.,
Ed., publ. by AOAC Inc. USA, 1990, Vol.2, Chapter "Spices and Other Condiments"
method 986.21, 999.
Segebrecht, S.; Schilcher, H. Ligustilide: guiding component for preparation of Levisticum
officinale roots. Planta Medica, 1989, 55, 572-573.
Senatore, F. Influence of harvesting time on yield and composition of the essential oil of a
thyme {Thymus pulegioides L) growing wild in Campania (southern Italy). J. Agric.
FoodChem. 1996,44, 1327-1332.
Stahl-Biskup, E.; Wichtmann, E.-M. Composition of the essential oils from roots of some
Apiaceae in relation to the development of their oil duct systems. Flavour Fragrance J.
1991, 6,249-255.
Toulemonde, B.; Noleau, I. Volatile constituents of lovage {Levisticum officinale Koch.) In
Flavour* and Fragrances: a World Perspective; Lawrence, B. M., Mookherjee, B. D.,
Willis, B. J., Eds; Elsevier Science Publishers B. V. Amsterdam, 1988; pp 641-657.
Toulemonde, B.; Paul, F.; Noleau, I. Phthalides from lovage {Levisticum officinale Koch.) In
Flavour Science and Technology; Martens, M., Dalett, A., Russwurm, H. Eds.; John
Wiley & Sons, 1987; pp 89-94.
Uhlig., J.; Chang, A.; Jen, J. J. Effect of phthalides on celery flavor. J. FoodSci. 1987, 52 (3)
658-660.
Venskutonis, P. R. Essential oil composition of some herbs cultivated in Lithuania. In
Flavours, Fragrances and Essential Oils; vol. 2, Baser, K. H. C. Ed.; Publisher: AREP,
Istanbul, 1995; pp 108-123.
65
CHAPTER 4
COMPOSITION OF ESSENTIAL OIL OF COSTMARY
[BALSAMITA MAJOR (L.) DESF.] AT DIFFERENT GROWTH
PHASES
This chapter is based on the following article:
E.Bylaite, R.Venskutonis, J.P.Roozen and M.A.Posthumus. "Composition of essential oil of costmary [Balsamita major (L.) Desf.] at different growth phases." J. Agric. Food Chem. 2000, in press.
Chapter 4
ABSTRACT
The essential oils from leaves and flowers of costmary, Balsamita major (L.) Desf. (syn.
Chrysanthemum balsamita L.) were analysed at various phases of plant growth. The highest
content of oil both in leaves and flowers was determined before full blooming, 1.15 and 1. 34
% (w/w) respectively. 78 volatile compounds have been identified in the oils of Balsamita
major, of which 58 (19 tentatively, 39 positively) have not been reported in this plant
previously. Carvone and a-thujone were found to be dominating compounds constituting
from 51.8 to 68.0% and 9.0-16.1% in the total oil respectively. Seasonal variations in the oil
compositions were not considerable except for the starting phase (May 25), when the content
of carvone was lower and the content of a-thujone and sesquiterpenes higher. The content of
sesquiterpenes was about two times higher in flowers than in the leaves. Absolute amount of
most components was highest at buds formation period.
INTRODUCTION
Costmary, Balsamita major (L.) Desf. (syn. Chrysanthemum balsamita L.) Asteraceae, is a
large perennial plant of Asian origin with yellow flowers grown in Europe and Asia from the
Middle Ages. Fresh and dried leaves of costmary possess strong mint-like aroma and
astringent taste. On a domestic scale they have been used to flavour different dishes including
fatty minced meat, game, poultry, lamb, fish, curd, potato, soups, sauces, beverages, and
cakes. Essential oil of costmary together with some other volatile products was successfully
used in creation of flavouring compositions for confectionery (Dapkevicius et al., 1992).
However, to our knowledge, commercial cultivation, processing and application of costmary
are not widely developed. The publications on essential oils composition of this plant are
rather scanty.
Gockeritz (1968) defined two chemotypes of B. major according to the dominant terpene in
the essential oil: camphor-type, Balsamita major (L.) Desf. subsp. majus (Desf.) Asch. and
carvone-type, Balsamita major (L.) Desf. var. tanacetoi'des (Boiss.) Fiori. In their literature
survey on costmary Bestmann et al. (1984) suggest to distinguish a third chemotype, with
camphor and thujone as prevailing components in the essential oil. Gockeritz (1968),
Zielinska-Sowicka and Wolbis (1970) have studied the essential oils of camphor chemotype
68
Chapter 4
B. major. They found that the content of oil varied from 0.31% to 1.25% in leaves, and that
camphor acts as a major component constituting 72-91% of the total oil content.
Several authors studied the essential oil composition of carvone chemotype B. major. Voigt et
al. (1938) determined the essential oil content in this costmary chemotype, which varied from
0.38% to 0.64% in dry matter. Jukneviciene et al. (1973) investigated separate anatomical
parts of B. major at different plant growth phases and found that essential oil content varied
from 0.06 to 2.20 ml 100 g"1 of dry matter. Three years later Paris et al. (1976) determined
1.3% of essential oil in the flowers of B. major and 0.7% in its aerial parts. In both studies
carvone showed to be a dominating compound, because it constituted 65-80% of the total oil
depending on the growth stage of the plant.
Lukic et al. (1965) and Bestmann et al. (1984) studied the insecticide activity of costmary
essential oil. They identified and quantified more than 20 constituents in the essential oil of
Chrysanthemum balsamita and found each of them possessing insecticide properties against
aphids.
Other published studies were focused on particular components of B. major, e. g, five
compounds were identified in o-dihydroxyphenolic fraction of Chrysanthemum Balsamita L.
var. tanaceto'ides, which included caffeic, chlorogenic and ferrulic acids (Tamas et al., 1989).
Todourova and Ognyanov (1989) isolated seven C-9 P-hydroxylated or esterified
germacranolides from the flowers of B. major population cultivated in Bulgaria and found
these lactones differ from the presently known eudesmanolides in a B. major population
cultivated in Poland.
A study on the seasonal dependence of oil content and composition of main constituents of
Chrysanthemum balsamita L. was carried out by Strobel et al. (1987), who identified 29
compounds with carvone (55-60%) and thujone (10%) as the major ones. This study showed
that the composition of the oil from Chrysanthemum balsamita L leaves changes more
distinctly during the season than the oil from flower head.
Agrotechnological studies of B. major in Lithuanian Institute of Horticulture (Baranauskiene,
1995) showed that the crop of fresh costmary leaves varies from 30 to 45 t ha"1, of which the
69
Chapter 4
yield of dry herb was 16.8%. Therefore, the plant seems to be of interest as a source of natural
flavourings. On the other hand, published data on B. major essential oil composition and its
seasonal changes are rather scarce. Considering these points, the present work was undertaken
to study seasonal changes of essential oil composition of B. major grown in Lithuania.
MATERIALS AND METHODS
Plant material and isolation of volatile compounds
Plant material was grown in the experimental garden of Lithuanian Institute of Horticulture,
Babtai in 1995. The whole herb was harvested every second week, totally 6 times from the
end of May till the middle of August as follows: blossoms at the beginning and during full
flowering, and leaves at different times of growing phase of the plant. The plants were sorted
by botanical part (leaves, stems, flowers), depending on the growth period and naturally dried
at room temperature. The oils were obtained by hydrodistillation of the different raw materials
in a Clevenger type European Pharmacopoeia apparatus during 2 hrs (Richard et al., 1992).
Three replicate analyses were carried out for every oil sample. Simultaneously the content of
moisture in air-dried herb was determined by distilling 5 g of the sample with toluene for 1.5
hrs (AOAC, 1990). The yields of oil were expressed in % (w/w) of dry wt.
Identification and quantification of volatile compounds
The essential oils were diluted with Et20 (1% v/v) and analysed on a Fisons 8160 series gas
chromatograph with the FID heated at 250 °C using a DB-5 (J&W, Folsom, CA) (5%
phenyldimethyl polysiloxane) fused silica capillary column (30 m length, 0.32 mm i. d., 0.25
um film thickness). The oven temperature was programmed from 50 °C (5 min hold) to 250
°C at a rate of 3 °C/min with a final hold of 10 min. Helium was used as carrier gas with a
linear velocity 35 cm/s. Injector temperature was set up at 260 °C. Four replicate GC analyses
were carried out for each essential oil.
Gas chromatography-mass spectrometry (GC/MS) analyses were performed on a combined
GC-MS instrument (Varian 3400, Finnigan MAT 95) using BP-5 (Ringwood, Australia) (5%
70
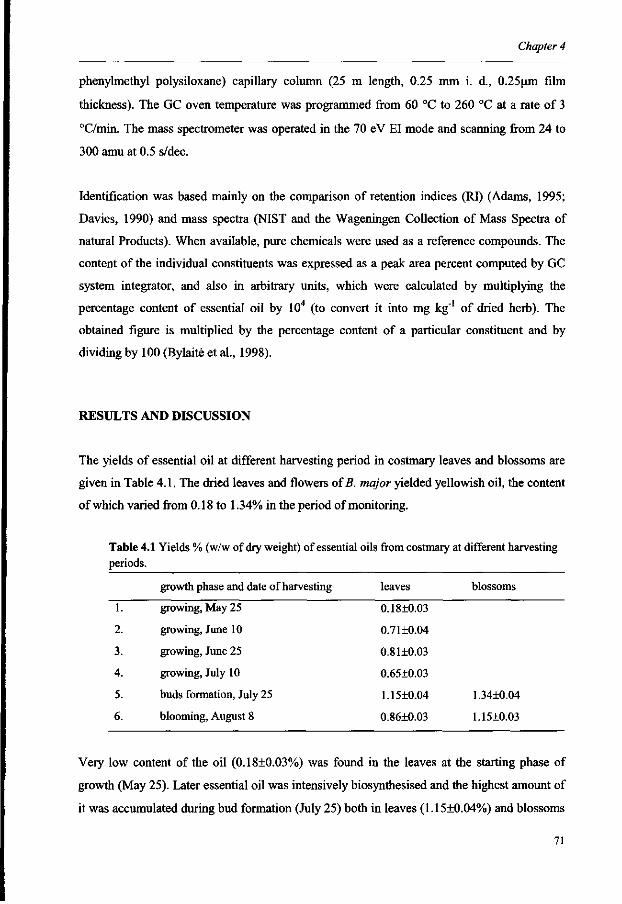
Chapter 4
phenylmethyl polysiloxane) capillary column (25 m length, 0.25 mm i. d., 0.25um film
thickness). The GC oven temperature was programmed from 60 °C to 260 °C at a rate of 3
°C/min. The mass spectrometer was operated in the 70 eV EI mode and scanning from 24 to
300 amu at 0.5 s/dec.
Identification was based mainly on the comparison of retention indices (RI) (Adams, 1995;
Davies, 1990) and mass spectra (NIST and the Wageningen Collection of Mass Spectra of
natural Products). When available, pure chemicals were used as a reference compounds. The
content of the individual constituents was expressed as a peak area percent computed by GC
system integrator, and also in arbitrary units, which were calculated by multiplying the
percentage content of essential oil by 104 (to convert it into mg kg"1 of dried herb). The
obtained figure is multiplied by the percentage content of a particular constituent and by
dividing by 100 (Bylaite et al., 1998).
RESULTS AND DISCUSSION
The yields of essential oil at different harvesting period in costmary leaves and blossoms are
given in Table 4.1. The dried leaves and flowers of B. major yielded yellowish oil, the content
of which varied from 0.18 to 1.34% in the period of monitoring.
Table 4.1 Yields % (w/w of dry weight) of essential oils from costmary at different harvesting periods.
growth phase and date of harvesting
1.
2.
3.
4.
5.
6.
growing, May 25
growing, June 10
growing, June 25
growing, July 10
buds formation, July 25
blooming, August 8
leaves
0.18±0.03
0.71±0.04
0.81±0.03
0.65±0.03
1.15±0.04
0.86±0.03
blossoms
1.34+0.04
1.15+0.03
Very low content of the oil (0.18+0.03%) was found in the leaves at the starting phase of
growth (May 25). Later essential oil was intensively biosynthesised and the highest amount of
it was accumulated during bud formation (July 25) both in leaves (1.15±0.04%) and blossoms
71
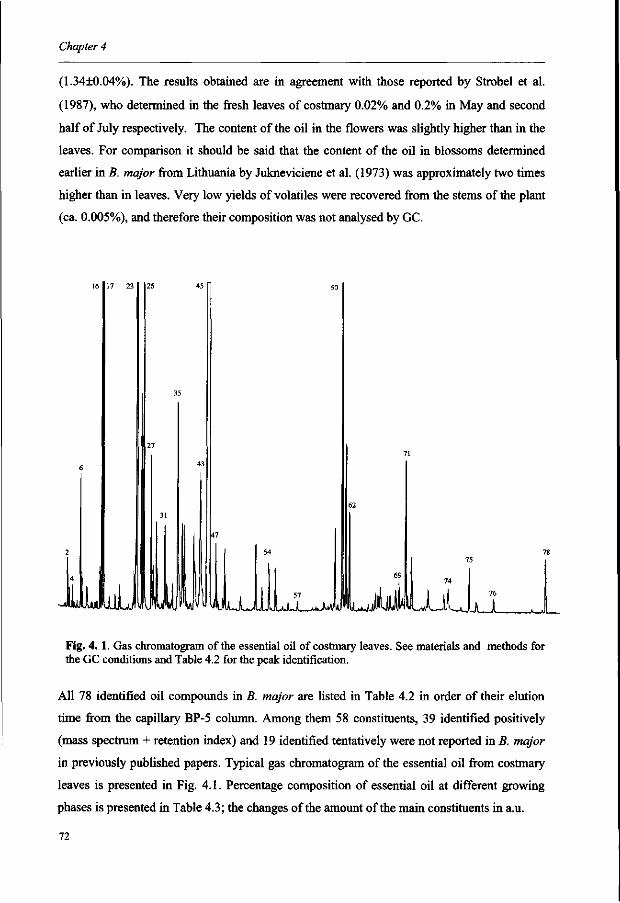
Chapter 4
(1.34+0.04%). The results obtained are in agreement with those reported by Strobel et al.
(1987), who determined in the fresh leaves of costmary 0.02% and 0.2% in May and second
half of July respectively. The content of the oil in the flowers was slightly higher than in the
leaves. For comparison it should be said that the content of the oil in blossoms determined
earlier in B. major from Lithuania by Jukneviciene et al. (1973) was approximately two times
higher than in leaves. Very low yields of volatiles were recovered from the stems of the plant
(ca. 0.005%), and therefore their composition was not analysed by GC.
m A_JLwJuJ 57 wiiil LLiL, JUL
Fig. 4. 1. Gas chromatogram of the essential oil of costmary leaves. See materials and methods for the GC conditions and Table 4.2 for the peak identification.
All 78 identified oil compounds in B. major are listed in Table 4.2 in order of their elution
time from the capillary BP-5 column. Among them 58 constituents, 39 identified positively
(mass spectrum + retention index) and 19 identified tentatively were not reported in B. major
in previously published papers. Typical gas chromatogram of the essential oil from costmary
leaves is presented in Fig. 4.1. Percentage composition of essential oil at different growing
phases is presented in Table 4.3; the changes of the amount of the main constituents in a.u.
72
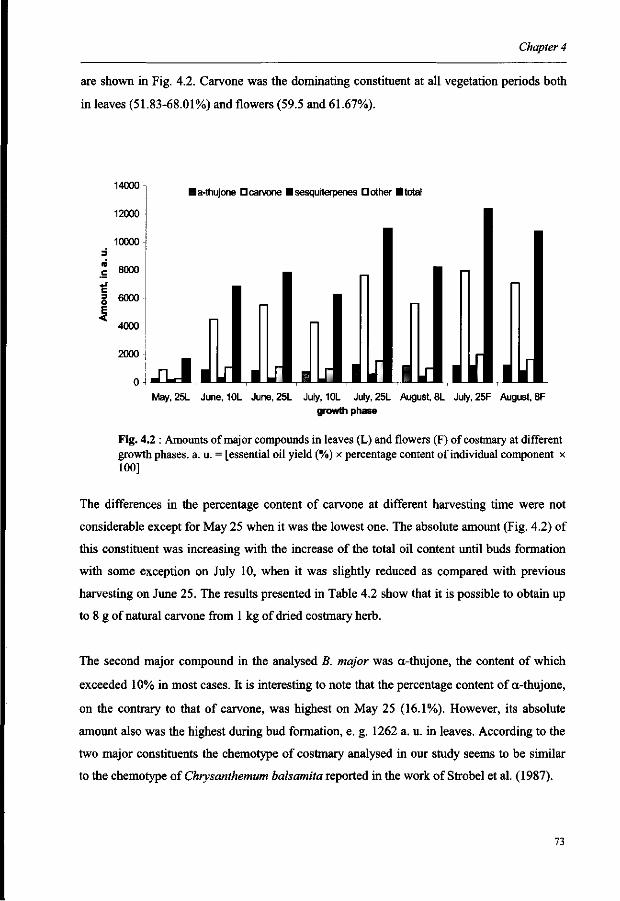
Chapter 4
are shown in Fig. 4.2. Carvone was the dominating constituent at all vegetation periods both
in leaves (51.83-68.01%) and flowers (59.5 and 61.67%).
14000
12000
10000
la-thujone • carvone • sesquiterpenes D other • total
o E <
May, 25L June, 10L June, 25L July, 10L July, 25L August, 8L July, 25F August, 8F
growth phase
Fig. 4.2 : Amounts of major compounds in leaves (L) and flowers (F) of costmary at different growth phases, a. u. = [essential oil yield (%) x percentage content of individual component x 100]
The differences in the percentage content of carvone at different harvesting time were not
considerable except for May 25 when it was the lowest one. The absolute amount (Fig. 4.2) of
this constituent was increasing with the increase of the total oil content until buds formation
with some exception on July 10, when it was slightly reduced as compared with previous
harvesting on June 25. The results presented in Table 4.2 show that it is possible to obtain up
to 8 g of natural carvone from 1 kg of dried costmary herb.
The second major compound in the analysed B. major was a-thujone, the content of which
exceeded 10% in most cases. It is interesting to note that the percentage content of a-thujone,
on the contrary to that of carvone, was highest on May 25 (16.1%). However, its absolute
amount also was the highest during bud formation, e. g. 1262 a. u. in leaves. According to the
two major constituents the chemotype of costmary analysed in our study seems to be similar
to the chemotype of Chrysanthemum balsamita reported in the work of Strobel et al. (1987).
73
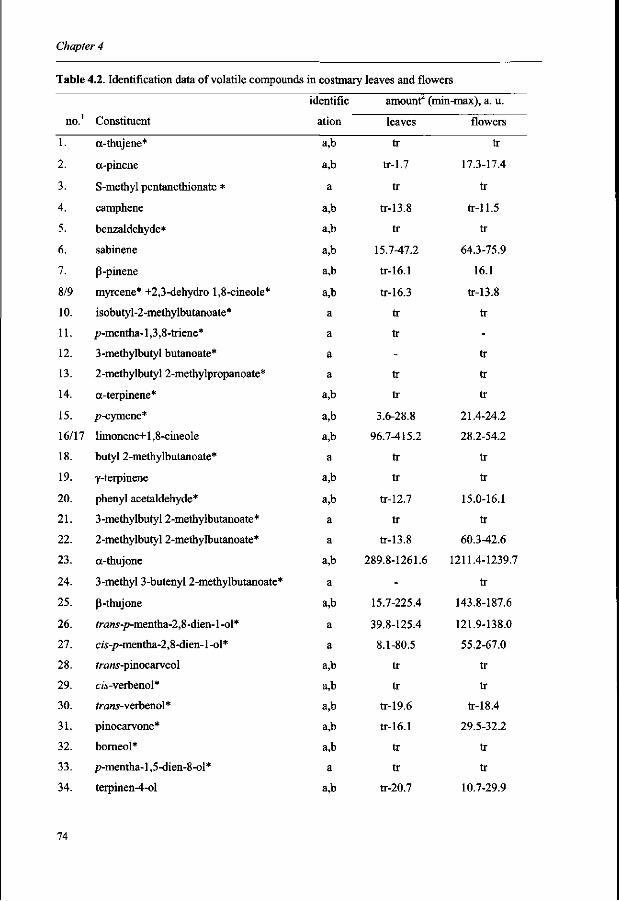
Chapter 4
Table 4.2. Identification data of volatile compounds in costmary
no.1
1.
2.
3.
4.
5.
6.
7.
8/9
10.
11.
12.
13.
14.
15.
16/17
18.
19.
20.
21.
22.
23.
24.
25.
26.
27.
28.
29.
30.
31.
32.
33.
34.
Constituent
a-thujene*
a-pinene
S-methyl pentanethionate *
camphene
benzaldehyde*
sabinene
P-pinene
myrcene* +2,3-dehydro 1,8-cineole*
isobutyl-2-methylbutanoate*
p-mentha-1,3,8-triene*
3-methylbutyl butanoate*
2-methylbutyl 2-methylpropanoate*
a-terpinene*
p-cymene*
limonene+1,8-rineole
butyl 2-methylbutanoate*
y-terpinene
phenyl acetaldehyde*
3-methylbutyl 2-methylbutanoate*
2-methylbutyl 2-methylbutanoate*
a-thujone
3-methyl 3-butenyl 2-methylbutanoate*
P-thujone
fr<my-p-mentha-2,8-dien-1 -ol*
cw-/»-mentha-2,8-dien-1 -ol*
/raws-pinocarveol
cw-verbenol*
trans-vevbenol*
pinocarvone*
bomeol*
p-mentha-1,5-dien-8-ol*
terpinen-4-ol
identific
ation
a,b
a,b
a
a,b
a,b
a,b
a,b
a,b
a
a
a
a
a,b
a,b
a,b
a
a,b
a,b
a
a
a,b
a
a,b
a
a
a,b
a,b
a,b
a,b
a,b
a
a,b
leaves and flowers
amount2 (min-max), a. u.
leaves
tr
tr-1.7
tr
tr-13.8
tr
15.7-47.2
tr-16.1
tr-16.3
tr
tr
-tr
tr
3.6-28.8
96.7-415.2
tr
tr
tr-12.7
tr
tr-13.8
289.8-1261.6
-
15.7-225.4
39.8-125.4
8.1-80.5
tr
tr
tr-19.6
tr-16.1
tr
tr
tr-20.7
flowers
tr
17.3-17.4
tr
tr-11.5
tr
64.3-75.9
16.1
tr-13.8
tr
-
tr
tr
tr
21.4-24.2
28.2-54.2
tr
tr
15.0-16.1
tr
60.3-42.6
1211.4-1239.7
tr
143.8-187.6
121.9-138.0
55.2-67.0
tr
tr
tr-18.4
29.5-32.2
tr
tr
10.7-29.9
74
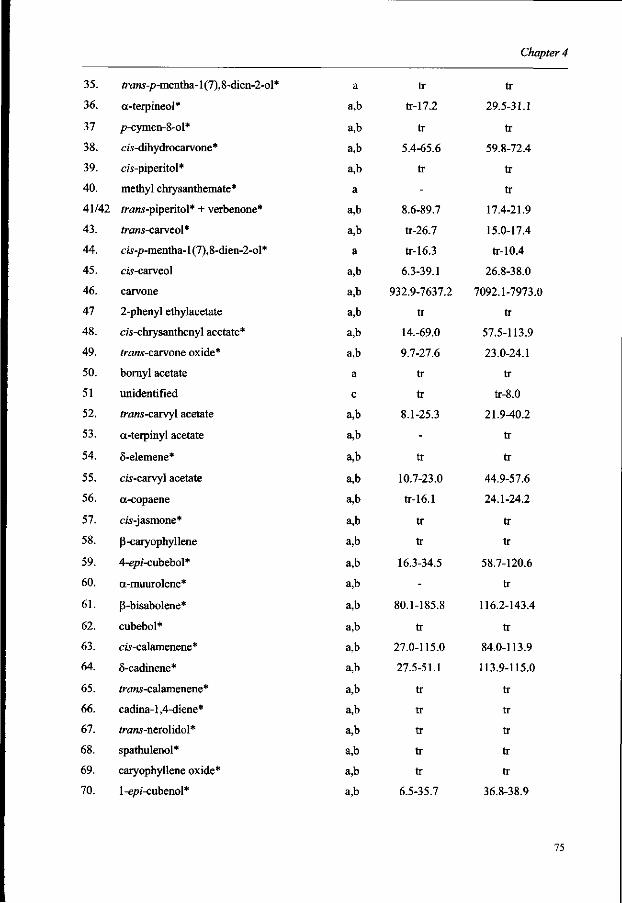
Chapter 4
35.
36.
37
38.
39.
40.
41/42
43.
44.
45.
46.
47
48.
49.
50.
51
52.
53.
54.
55.
56.
57.
58.
59.
60.
61.
62.
63.
64.
65.
66.
67.
68.
69.
70.
ft-<ms-p-mentha-l(7),8-dien-2-ol*
a-terpineol*
p-cymen-8-ol*
cw-dihydrocarvone*
cw-piperitol*
methyl chrysanthemate*
trans-piperitol* + verbenone*
frww-carveol*
cw-p-mentha-1 (7),8-dien-2-ol*
cw-carveol
carvone
2-phenyl ethylacetate
cw-chrysanthenyl acetate*
trans-carvone oxide*
bomyl acetate
unidentified
trans-carvyl acetate
a-terpinyl acetate
S-elemene*
cw-carvyl acetate
a-copaene
ciy-jasmone*
P-caryophyllene
4-epj-cubebol*
a-muurolene*
P-bisabolene*
cubebol*
cis-calamenene*
8-cadinene*
frww-calamenene*
cadina-l,4-diene*
/nms-nerolidol*
spathulenol*
caryophyllene oxide*
l-epj'-cubenol*
a
a,b
a,b
a,b
a,b
a
a,b
a,b
a
a,b
a,b
a,b
a,b
a,b
a
c
a,b
a,b
a,b
a,b
a,b
a,b
a,b
a,b
a,b
a,b
a,b
a,b
a,b
a,b
a,b
a,b
a,b
a,b
a,b
tr
tr-17.2
tr
5.4-65.6
tr
-
8.6-89.7
tr-26.7
tr-16.3
6.3-39.1
932.9-7637.2
tr
14.-69.0
9.7-27.6
tr
tr
8.1-25.3
-
tr
10.7-23.0
tr-16.1
tr
tr
16.3-34.5
-
80.1-185.8
tr
27.0-115.0
27.5-51.1
tr
tr
tr
tr
tr
6.5-35.7
tr
29.5-31.1
tr
59.8-72.4
tr
tr
17.4-21.9
15.0-17.4
tr-10.4
26.8-38.0
7092.1-7973.0
tr
57.5-113.9
23.0-24.1
tr
tr-8.0
21.9-40.2
tr
tr
44.9-57.6
24.1-24.2
tr
tr
58.7-120.6
tr
116.2-143.4
tr
84.0-113.9
113.9-115.0
tr
tr
tr
tr
tr
36.8-38.9
75
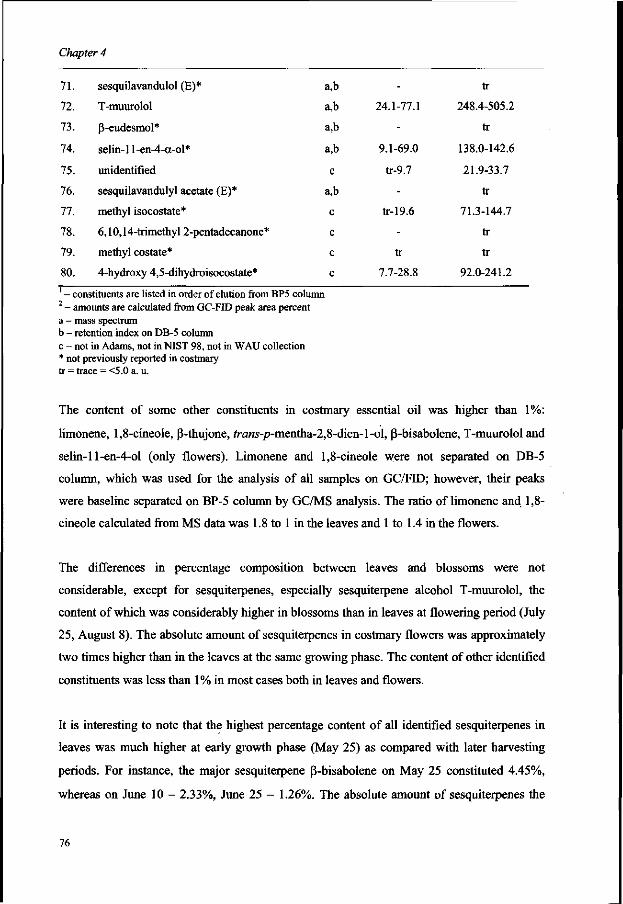
Chapter 4
71.
72.
73.
74.
75.
76.
77.
78.
79.
80.
sesquilavandulol (E)*
T-muurolol
P-eudesmol*
selin-1 l-en-4-a-ol*
unidentified
sesquilavandulyl acetate (E)*
methyl isocostate*
6,10,14-trimethyl 2-pentadecanone*
methyl costate*
4-hydroxy 4,5-dihydroisocostate*
a,b
a,b
a,b
a,b
c
a,b
c
c
c
c
-
24.1-77.1
-
9.1-69.0
tr-9.7
-
tr-19.6
-
tr
7.7-28.8
tr
248.4-505.2
tr
138.0-142.6
21.9-33.7
tr
71.3-144.7
tr
tr
92.0-241.2
- constituents are listed in order of elution from BP5 column - amounts are calculated from GC-FID peak area percent
a - mass spectrum b - retention index on DB-5 column c - not in Adams, not in NIST 98, not in WAU collection * not previously reported in costmary tr = trace = <5.0 a. u.
The content of some other constituents in costmary essential oil was higher than 1%:
limonene, 1,8-cineole, (J-thujone, fr-am-p-mentha-2,8-dien-l-ol, (3-bisabolene, T-muurolol and
selin-1 l-en-4-ol (only flowers). Limonene and 1,8-cineole were not separated on DB-5
column, which was used for the analysis of all samples on GC/FH); however, their peaks
were baseline separated on BP-5 column by GC/MS analysis. The ratio of limonene and 1,8-
cineole calculated from MS data was 1.8 to 1 in the leaves and 1 to 1.4 in the flowers.
The differences in percentage composition between leaves and blossoms were not
considerable, except for sesquiterpenes, especially sesquiterpene alcohol T-muurolol, the
content of which was considerably higher in blossoms than in leaves at flowering period (July
25, August 8). The absolute amount of sesquiterpenes in costmary flowers was approximately
two times higher than in the leaves at the same growing phase. The content of other identified
constituents was less than 1% in most cases both in leaves and flowers.
It is interesting to note that the highest percentage content of all identified sesquiterpenes in
leaves was much higher at early growth phase (May 25) as compared with later harvesting
periods. For instance, the major sesquiterpene (3-bisabolene on May 25 constituted 4.45%,
whereas on June 10 - 2.33%, June 25 - 1.26%. The absolute amount of sesquiterpenes the
76
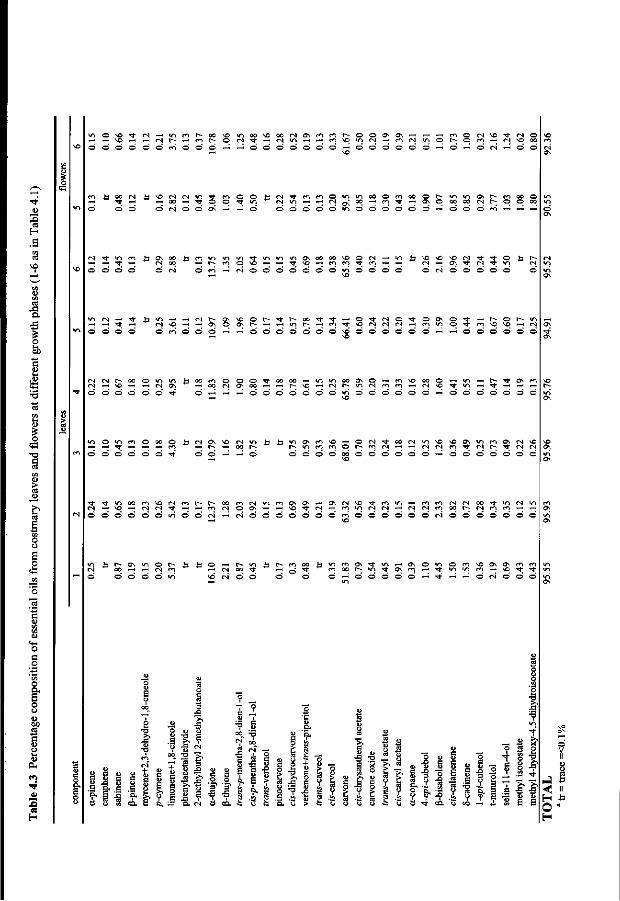
•s
o « T3
£
00
B
Xi a H
© O O O O O f ^ O O
*3- m O O £3 — " O O — < T t © O T j - i n © < N © d < > — ^ — ^ O
CN <n ^ m ^H
O u ^ r
"•> >n r, *
on
- O CI
m TT
00
- O ON
r-o
v-i 00
m 00
ON <N
O Csl I-H o o
i > m oo o r- o o oo
o o o o o > n o o o o o o — o o o m —• — —
o o o o
o o o o
m m i n i n —; r- m O © rn - H «N o o o o o o o > n o o o o O CN O O O O O
O N ^ o o r ~ ^ t r - o o ^ ^ r - ^ O T j - ( N O T r o o \ O T t - H t - - o r - ' n ON O O \ r- - ^ —• *n ^D (N <N (N —
o m o o o — — O O O O O O O v O O O O O O CI »n
o - ^ —
TJ- m ^O vO - H rN o o d o o o
o o o © o o * * o —< — ^ - o o o o o o o » n o o o o o o — o o o o o o o
© » n r * i © o o © H < N O N ^ O < N i n
~ © © d © © TJ-' © © - ^ - ^ © O O O O O O O O O O O O - H O O O O O O O
O O O O O O W - J O O f N —i C S O O O O O O O m O O O O O O C N O O O O O O O
o o © o »n
© - H r -—; Csl 0 0 N© <N © '
•n is r- m oo £ in
© 00 •-•
ON
© in ©
in
© ON ©
ON
©
©
— i
<n
Tt
© »n — i
to in
•—>
NO
©
ON
<N
ON
© © •<* ©
.9 c. ,g
o u u
1 * ?
g I | § §
rt 1. —-•3 3 -
•s . . S -a o s o
ih ¥ S f 5
(N cs
U u 1U (U 21 *** A
S -a o c a. -s -s ,2 e o a ~ — —
O •"? J3 ? •§
d ^t co. u «) -H - i a s
o V
< II
O" H
Chapter 4
increased with accumulation of essential oil, however, less considerably as compared with the
major compound carvone (Fig. 4.2). Strobel et al. (1987) identified (3-cubebene as one of the
major sesquiterpenes in costmary, percentage content of which was also decreasing in the
period of May-June. We have not identified P-cubebene in our work and its presence in B.
major seems rather doubtful, because in the chromatogram provided in the paper above
mentioned the peak of p-cubebene is shown eluting after p-caryophyllene and p-farnesene
peaks. However, retention data obtained from different sources using different polarity
capillary columns demonstrate that p-cubebene always elutes earlier than p-caryophyllene
and p-farnesene (Davies, 1990; Adams, 1995; Boelens, 1995).
CONCLUSIONS
The highest amount of essential oil in B. major leaves and blossoms was accumulated during
bud formation. The knowledge about costmary essential oil composition was significantly
extended by identifying 58 previously not reported in this plant compounds.
The plants of B. major analysed in this study can be defined as belonging to the carvone
chemotype, and producing considerable amounts of a-thujone as well.
In general, the compositions of essential oils were quite similar for all harvesting periods
except for early growing phase in May when carvone content was lower, while the contents of
a-thujone and sesquiterpene higher.
ACKNOWLEDGMENTS
We wish to thank Dr. M. Baranauskiene and Dr. P. ViSkelis from Lithuanian Institute of
Horticulture for providing costmary plants.
REFERENCES
Adams, R. P. Identification of Essential Oil Components by GC/MS; Allured Publishing
Corp.: Carol Stream, IL, 1995.
78
Chapter 4
AOAC. Official Methods of Analysis of the Association of Official Analytical Chemists;
Herlich, K., Ed.; AOAC, Inc.: Arlington VA, 1990; Vol. 2, Chapter "Spices and other
Condiments", method 986.21, 999.
Baranauskiene, M. Spicy Plants (Lithuanian); Ukininko patarejas: Kaunas, 1995.
Bestmann, H. J.; Clafien, B.; Kobold, U.; Vostrowsky, O.; Klingauf, F.; Strobel, H.;
Knobloch, K. Pflanzliche Insektizide II [1]. Das atherishe Ol aus Blattern des
Balsamkrautes, Chrysanthemum balsamita L. Insektizide Wirkung und
Zusammensetzung. Z Naturforsch. 1984, 39c, 543-547.
Boelens, M. H. The complete database of essential oils; BACIS, The Netherlands, 1991-1995.
Bylaite, E.; Venskutonis, R. P.; Roozen, J. P. Influence of harvesting time on the composition
of volatile components in different anatomical parts of lovage (Levisticum officinale
Koch.). J. Agric. Food Chem. 1998, 46, 3735-3740.
Dapkevicius, A.; Venskutonis, P. R.; Sudziene, S.; Brazaite R. Use of local aromatic plants in
the flavouring of confectionery. In Chemistry and Technology of Organic Materials and
Food (Lithuanian); Technologija: Kaunas (Lithuania), 1992; pp 54-57.
Davies, N. W. Gas chromatographic retention indices of monoterpenes and sesquiterpenes on
methyl silicone and Carbowax 20M phases. J. Chromatogr. 1990, 503, 1-24.
Gockeritz, D. Das atherishe 01 von Chrysanthemum balsamita L. var balsamita. Pharmazie
1968,23, 515-518.
Jukneviciene, G.; Morkunas, A.; Stankeviciene, N. Some biological characteristics and
essential oil content of costmary. In Usefull Plants in Baltic Countries and Belorus,
Proc. 2ndSci. Conf. (Russian): Vilnius, 1973; pp 299-303.
Lukic, P.; Savin, K.; Gorunovic, M. Pharmacognostic study of the Chrysanthemum balsamita.
Ark Farm. 1965, 15, 249-252.
Paris, M.; Clair, G.; Tillequin, F. Contribution a l'etude chimique de l'huile essentielle de
balsamite. Rivista Ital. Eppos. 1976, 58, 473-476.
Richard, H; Noleau, I; Giampoli, P. Techniques d'analyse des epices et aromates. In Epices et
Aromates; H. Richard (coordonnateur), Tec & Lavoisier: APRIA, 1992; pp 191-211.
Strobel, H.; Knobloch, K.; Ziegler, E. Uber die atherishen Ole von Chrysanthemum balsamita
L. Z Naturforsch. 1987, 42c, 502-506.
Tamas, M.; Sincraian, A.; Rusu, D. Compusi o-dihidroxifenolici in Chrysanthemum
balsamita L. var. Tanaceto'ides. Farmacia (Bucharest) 1989, 37, 83-92.
79
Chapter 4
Todourova, M.; Ognyanov, I. V. Sesquiterpene lactones in a population of Balsamita major
cultivated in Bulgaria. Phytochemistry 1989, 28, 1115-1117.
Voigt, R. F.; Rogers, C. H.; Fischer, E. B. A pharmacognostic study of Chrysanthemum
balsamita L. var. tanaceto'ides Boiss. together with a study of its volatile oil. J. Am.
Pharm. Ass. 1938, 27, 643-654.
Zielinska-Sowicka, R.; Wolbis, M. Etude de la feuille de Chrysanthemum balsamita L.
Herbapolonica. 1970, 16, 286-295.
80
CHAPTER 5
DYNAMIC HEADSPACE-GAS CHROMATOGRAPHY -
OLFACTOMETRY ANALYSIS OF DIFFERENT
ANATOMICAL PARTS OF LOVAGE {LEVISTICUM
OFFICINALE KOCH.) AT EIGHT GROWTH PHASES
This chapter is based on the following articles/manuscripts:
l.Bylaite, E.; Legger, A.; Roozen, J.P.; Venskutonis, R. "Dynamic headspace gas chromatography of different botanical parts of lovage (Levisticum officinale Koch.)". In "Flavour Science: Recent developments ", eds. A.J.Taylor, D.S.Mottram, The Royal Society of Chemistry, UK, 1996, pp 66-69.
2.Bylaite, E.; Legger, A.; Roozen, J.P.; Venskutonis, R.; Posthumus, M.A. "Dynamic headspace-gas chromatography-olfactometry analysis of different anatomical parts of Lovage (Levisticum Officinale Koch.) at eight growth phases." Submitted to the J. Agric. Food Chem.
Chapter 5
ABSTRACT
Volatiles of five different parts of lovage (leaves, stems, flowers, seeds, and roots) were
isolated by dynamic headspace method (DHS) and characterised by GC-FID and GC-
olfactometry (GC-O) techniques. Totally, 98 compounds were identified in the samples, 41
of which are reported among lovage volatiles for the first time. Qualitative differences in the
composition of DHS constituents in various anatomical parts of the plants were not
significant, whereas the amounts of a number of identified volatile compounds were different
in leaves, stems, flowers, seeds and roots. Seasonal variations in the composition of
headspace volatiles were also determined. Except for roots, (3-phellandrene was found to be
the most abundant headspace component in all anatomical parts of lovage constituting from
36.50% to 79.28% in the total GC peak area. The sniffing panel characterised effluents from
GC column and odour descriptors were attributed to the recognized constituents. a-Pinene
and a-phellandrene+myrcene were the most frequently recognized constituents among 11
fractions constituting of 12 identified and 1 unknown compound, which were detected by the
members of the sniffing panel. None of the detected constituents was recognized as a lovage
key aroma compound.
INTRODUCTION
Studies on the lovage {Levisticum officinale Koch.) volatiles obtained by different isolation
procedures, such as distillation, solvent extraction, dynamic headspace (DHS) techniques
have resulted in the identification of approximately 200 compounds. Most detailed
investigations (Toulemonde and Noleu, 1988; Venskutonis, 1995; Bylaite et al., 1998) were
performed on the volatiles collected by solvent extraction and distillation. However, the most
important goal in aroma analysis is the identification of volatile compounds, which are
perceived by the human olfactory system in the gas space above a food (Guth and Grosch,
1993). This can be achieved by using headspace-gas chromatography technique. Static
headspace (SHS) provides accurate composition of volatile compounds, which are perceived
as a wholesome odour of the product, but it is limited to the level of detection and
identification of organic constituents, particularly less volatile substances. DHS techniques
82
Chapter 5
permit to collect bigger amounts of volatile compounds for their qualitative and quantitative
characterization by instrumental methods. Nevertheless, many widely used detectors, such as
flame ionization (FID), flame photometric (FPD), electron capture (ECD) and mass
spectrometric (MS) in numerous cases are not as sensitive for the detection of odourants as
the human olfactory system (Acree and Barnard, 1994). For this reason, gas
chromatography-olfactometry (GC-O) analysis by using sniffing ports for column effluents
seems to be an interesting approach in obtaining important information about the qualitative
contribution of individual compounds to the overall flavour of the product. This technique in
many cases could be successfully used in determination of so-called key aroma compounds.
In agriculture it may also contribute to important decisions concerning selection of cultivars,
cultivation and harvesting techniques and storage conditions (Dirinck and De Winne, 1994).
DHS composition of lovage volatiles was reported earlier. Nine components were identified
in DHS of fresh lovage (De Pooter et al., 1985) constituting mainly of mono- and
sesquiterpenes, while roots composition was dominating by ligustilide and p- phellandrene
(Cu et al., 1990). Blank and Schieberle in 1993 reported odourants of the acidic fraction of a
commercial lovage extract. Sotolon was the key aroma compound of the acidic fraction due to
its characteristic seasoning-like flavour. In our previous report (Bylaite et al., 1996) among 25
volatiles identified in different anatomical parts (leaves, stems, blossoms and seeds) of the
plant, some aldehydes and terpenes were considered contributing to lovage flavour.
The present study on DHS-GC and GC-0 analysis of volatiles isolated from 5 anatomical
parts of plant at different growth stages is aimed at providing a better understanding of the
formation of lovage aroma during the vegetation period and to look for the volatile
constituents which could have a sensorial contribution to overall odour of lovage.
MATERIALS AND METHODS
Plant material and isolation of volatile compounds
Plant material was harvested in the experimental garden of the Lithuanian Institute of
Horticulture from the middle of May until the end of September at 8 different growth phases:
1 = May 15; 2 = May 25; 3 = June 9; 4 = June 16; 5 = June 28; 6 = July 7; 7 = July 19; 8 =
83
Chapter 5
September 21. Raw material was air-dried at 30 °C, packed in glass containers and stored at
room temperature in the absence of light.
Essential oils were hydrodistilled in a Clevenger apparatus for 2 h. Isolation of volatile
compounds by DHS technique was performed by flushing purified nitrogen gas in order to
trap released compounds on a Tenax TA, as described previously (Bylaite et al., 1996).
Identification and quantification of volatile compounds
Volatile compounds were desorbed from Tenax by a thermal desorption (210 °C, 5 min)/cold
trap (-120 °C/240 °C) device (Carlo Erba TDAS 5000). The compounds were analyzed on a
Carlo Erba MEGA 5300 gas chromatograph equipped with a FID heated at 275 °C by using
Supelcowax 10 column (Supelco Inc., Bellefonte, PA), 60 m length, 0.25 mm i.d. and 0.25
|am film thickness. The oven temperature was programmed from 40 °C (4 min hold) to 92 °C
at a rate of 2 °C min"1 and then to 272 °C at a rate of 6 °C min"1 with a final hold of 5 min.
The GC effluents were split by the ratio of 1 : 2 : 2 for the FID and for the two sniffing ports
respectively, and assessed by a sniffing panel consisting of ten assessors (Linssen et al.,
1993). GC-MS analyses were performed on a Varian 3400-Finnigan MAT 95 instrument
equipped with a thermal desorption/cold trap device (TCT injector 16200) at 70 ev electron
impact ionization mode and scanned from m/z=24 to 300 at 0.5 s decade"1. GC conditions for
MS were the same as in GC-FID-0 analysis.
Identification was based mainly on the comparison of retention indices (RI) (Adams, 1995;
Davies, 1990) and mass spectra (NIST and the Wageningen Collection of Mass Spectra of
Natural Products).
RESULTS AND DISCUSSION
Totally, 98 compounds were identified in different anatomical parts of lovage, which are
listed in Table 5.1 in order of their elution from Supelcowax 10 column; 41 of them are
reported as constituents of lovage aroma for the first time. The amounts of DHS constituents
in GC peak area units are presented in Table 5.2.
84
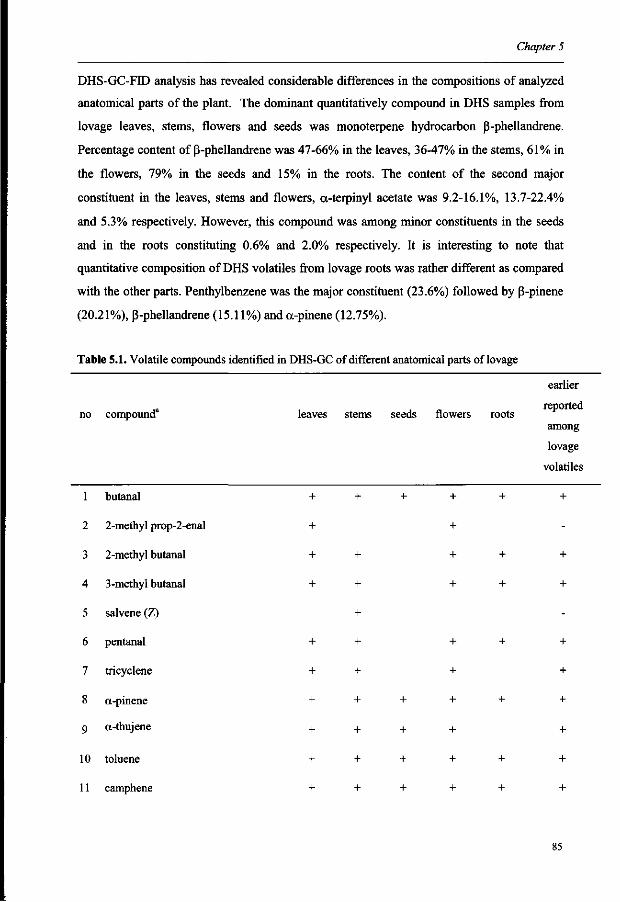
Chapter 5
DHS-GC-FE) analysis has revealed considerable differences in the compositions of analyzed
anatomical parts of the plant. The dominant quantitatively compound in DHS samples from
lovage leaves, stems, flowers and seeds was monoterpene hydrocarbon p-phellandrene.
Percentage content of p-phellandrene was 47-66% in the leaves, 36-47% in the stems, 61% in
the flowers, 79% in the seeds and 15% in the roots. The content of the second major
constituent in the leaves, stems and flowers, a-terpinyl acetate was 9.2-16.1%, 13.7-22.4%
and 5.3% respectively. However, this compound was among minor constituents in the seeds
and in the roots constituting 0.6% and 2.0% respectively. It is interesting to note that
quantitative composition of DHS volatiles from lovage roots was rather different as compared
with the other parts. Penthylbenzene was the major constituent (23.6%) followed by p-pinene
(20.21%), p-phellandrene (15.11%) and a-pinene (12.75%).
Table 5.1. Volatile compounds identified in DHS-GC of different anatomical parts of lovage
earlier
reported
among
lovage
volatiles
no compound8 leaves stems seeds flowers roots
1 butanal
2 2-methyl prop-2-enal
3 2-methyl butanal
4 3-methyl butanal
5 salvene (Z)
6 pentanal
7 tricyclene
8 a-pinene
9 a-thujene
10 toluene
11 camphene
85
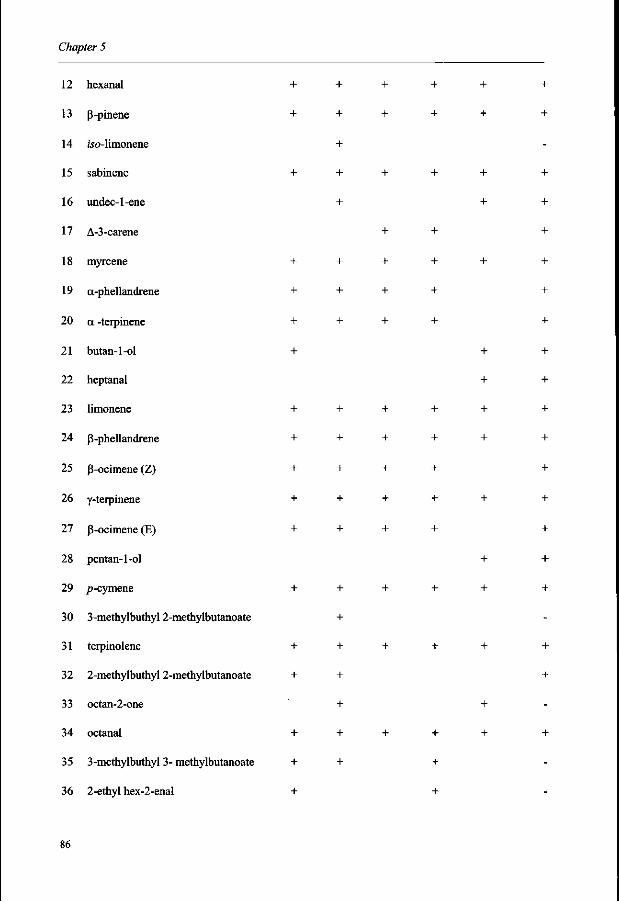
Chapter 5
12 hexanal
13 p-pinene
14 wo-limonene
15 sabinene
16 undec-1-ene
17 A-3-carene
18 myrcene
19 a-phellandrene
20 a -terpinene
21 butan-1-ol
22 heptanal
23 limonene
24 p-phellandrene
25 p-ocimene (Z)
26 y-terpinene
27 p-ocimene (E)
28 pentan-1-ol
29 />-cymene
30 3-methylbuthyl 2-methylbutanoate
31 terpinolene
32 2-methylbuthyl 2-methylbutanoate
33 octan-2-one
34 octanal
35 3-methylbuthyl 3- methylbutanoate
36 2-ethyl hex-2-enal
86
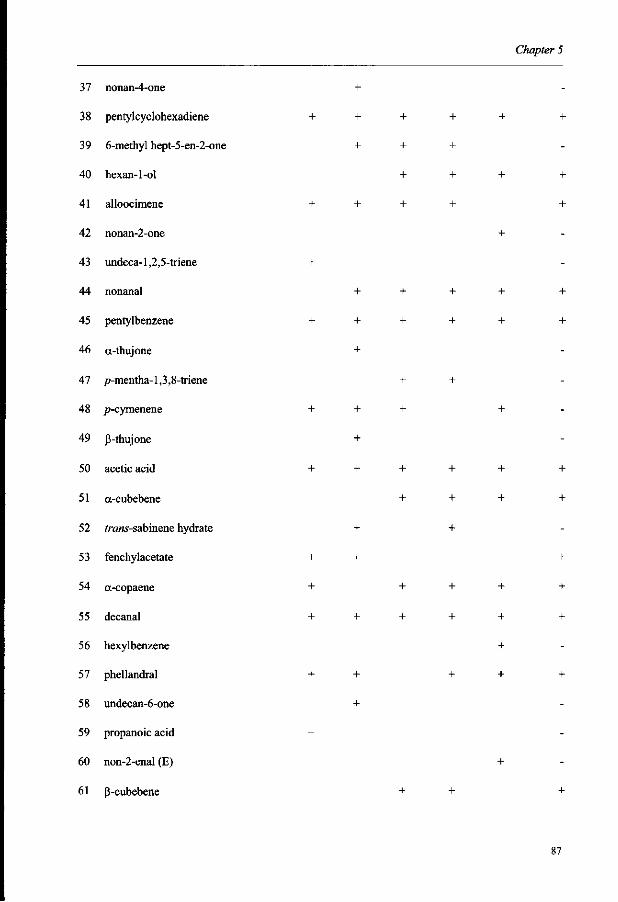
Chapter 5
37 nonan-4-one
38 pentylcyclohexadiene
39 6-methyl hept-5-en-2-one
40 hexan-1-ol
41 alloocimene
42 nonan-2-one
43 undeca-l,2,5-triene
44 nonanal
45 pentylbenzene
46 a-thujone
47 /)-mentha-l,3,8-triene
48 p-cymenene
49 (3-thujone
50 acetic acid
51 a-cubebene
52 trans-sabinene hydrate
53 fenchylacetate
54 a-copaene
55 decanal
56 hexylbenzene
57 phellandral
58 undecan-6-one
59 propanoic acid
60 non-2-enal (E)
61 p-cubebene
+ + +
87
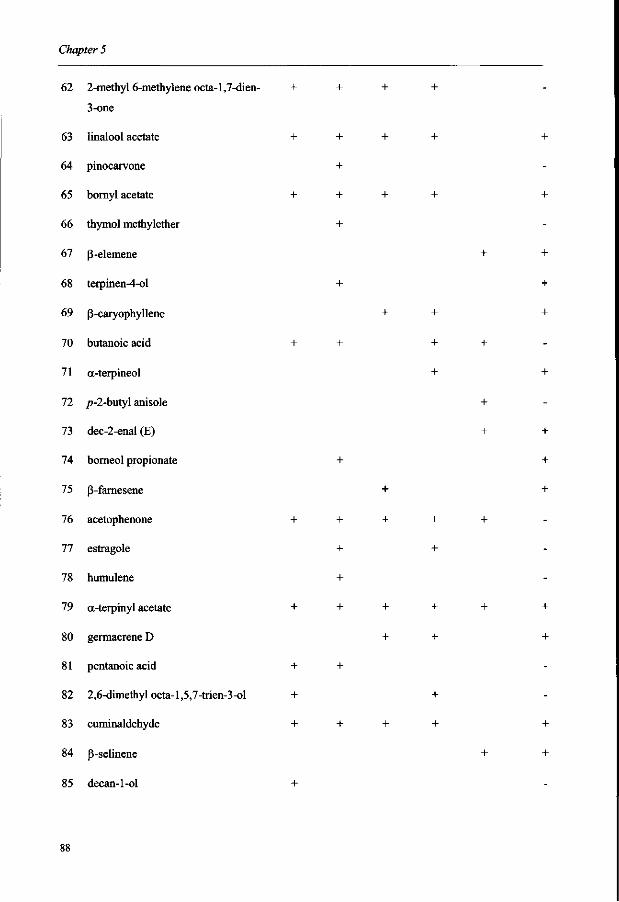
Chapter 5
62 2-methyl 6-methylene octa-l,7-dien-
3-one
63 linalool acetate
64 pinocarvone
65 bornyl acetate
66 thymol methylether
67 p-elemene
68 terpinen-4-ol
69 p-caryophyllene
70 butanoic acid
71 a-terpineol
72 />-2-butyl anisole
73 dec-2-enal (E)
74 bomeol propionate
75 p-farnesene
76 acetophenone
77 estragole
78 humulene
79 a-terpinyl acetate
80 germacrene D
81 pentanoic acid
82 2,6-dimethyl octa-l,5,7-trien-3-ol
83 cuminaldehyde
84 p-selinene
85 decan-1-ol
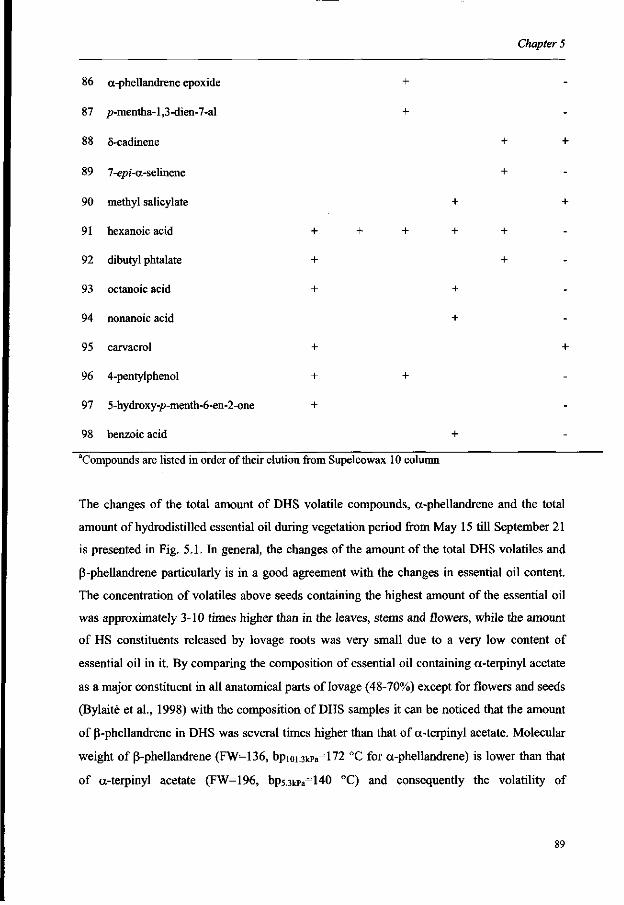
Chapter 5
86 a-phellandrene epoxide
87 p-mentha-l,3-dien-7-al
88 5-cadinene
89 7-ep/-a-selinene
90 methyl salicylate
91 hexanoic acid
92 dibutyl phtalate
93 octanoic acid
94 nonanoic acid
95 carvacrol
96 4-pentylphenol
97 5-hydroxy-p-menth-6-en-2-one
98 benzoic acid
"Compounds are listed in order of their elution from Supelcowax 10 column
The changes of the total amount of DHS volatile compounds, a-phellandrene and the total
amount of hydrodistilled essential oil during vegetation period from May 15 till September 21
is presented in Fig. 5.1. In general, the changes of the amount of the total DHS volatiles and
P-phellandrene particularly is in a good agreement with the changes in essential oil content.
The concentration of volatiles above seeds containing the highest amount of the essential oil
was approximately 3-10 times higher than in the leaves, stems and flowers, while the amount
of HS constituents released by lovage roots was very small due to a very low content of
essential oil in it. By comparing the composition of essential oil containing cc-terpinyl acetate
as a major constituent in all anatomical parts of lovage (48-70%) except for flowers and seeds
(Bylaite et al., 1998) with the composition of DHS samples it can be noticed that the amount
of P-phellandrene in DHS was several times higher than that of a-terpinyl acetate. Molecular
weight of p-phellandrene (FW=136, bpioi.3kpa=172 °C for a-phellandrene) is lower than that
of a-terpinyl acetate (FW=196, bp5.3kpa=140 °C) and consequently the volatility of
89
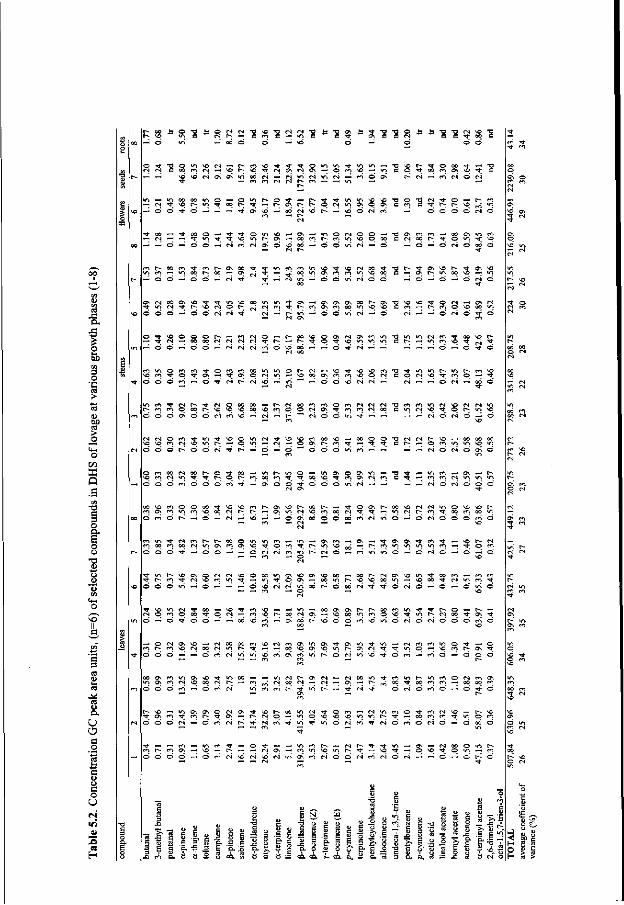
o
> o o a Q c
o
o
II «
•s CD
u o
is c <D O S3 O
U
CS
H
o o © t - o o
r» oo £3 o "O £s o •a so *o CN r-i -o i 3 * o o \ T r - O T 3 0 i 3 i -o -O N ^ T3
o o c n r - ) ^ s q t ^ s q ^ r N O N C N O N - ^ © c n
**• - H m c n c N c N r — cn — —• v i
VN V) -H - o ^O t O » ^ t H T )
—' ©' O ^f O — — r r — r - OS , _ , _ _ . , , .
v i c p l ; » m fl\ « ' t c i (N d N
• o o T J N y f O ' H r - f n c cn a ^ - r- r- so ^ v i
—' O O © ©" CN ©
oo — • -$• r-i — — -J © —
o « t- t o m >o vi ^f Tf SO i/-j f- ON
6 H d rn ri o\ -H N h
v> o r-i © o — -a
t~~ cn VN so © 00 C
© ©' vi r-i — ©'
1^ Cl m H (N oo r- •* — © — © CN © 00 ©
"t n h ON » T oo r- oo —• ON ^ o © — (N •*'
^ r - H ^ ° ° , ' " ; O N c n c n v i v £ > o o
^ t - ^ ( S v i - - c i d i r i ( N ' c > d
-^ r- •«fr ON S© r-
O N C N o o o N s o T r ^ - v i s o c o v i v i ^ t - a N — o s o N O N O o r - O N - o s o s o
o ' o © - ^ © o ' r - i ( N ' 5 j : r- i —' r^ v i — © ' © ' i r i r-i - - © ' r-i — © r-i © ^ r ©
o • * so ©
—. 4 (N —
— © ©' —
so © © © O O O O r - I C N C N C N ' t r r ^
(N o —i t- oo so o
© ^- CN — —.
vi rN cn Tf oo SO
H V) ^ »0 t ^
^ —; © -^ © TT
so cn "t; © © ' © ' © ' cn
c n T j - o c n c n o o v i v N C J Tf O; O (N CN t-" CN SO
•rt so SO f> "O rf
m so o (N C © © © SO (N CN —<
vi r- VN t— cn so "•0 -^ cn © —; T -H O CS —' 00 ©"
vi m •* r-i r- T
t - ; r n cn O oo E- © ' © © O N © ' © C - i c n s o — r-i — f ^
Vl Tfr SO © v ) - H < N - - © o \ r - m T } - - *
— — CN ©
- H 0 0 © © - o r - i f N r -
oo r - © ^ r oo . . , • ^ - ' 3 - r - © r ^ m o o c n , < t
— © ' — ©
i n r - v i
• * ^ c t > © ' © ' © ' v i m* —i — - i ^ H d ( N 6 o ^ 6
o \ o o ^ r © © o v i f s — — © © © cn © © ©
en © © OO rr so so cn vi en so oo CN r-©' l> — © — CN —
c n v ) ^ - r - i c n r - - r - - o o © v ) > o c n - - v t — o s m — O N - H
d d o ' r r t d d ' - ^ o r i n ' m ^ i ^ r i o - n v i H - H m —i © —
—i — C N © C N © O O
5 r--1 CN i ON - (N
00
so oo
e'en
©' 00
©' CN
22 ©
ci
ON
(N
r-
vi VN
© IN
^ o r-i • *
o
© 00 © ©'
*0 00 rn so
VI
o
v i w - i m v i m - H - ^ - © 0 - ^ © ' ( N © - ^ © - ^
t~^ SD ON © (N CS s o w 1 ; N >o m <n t © v i —I © ' - ^ - ^ —'
o o v i O N ^ O N ^ o o o - H O o r - r s v ) ^ - © O N ^ H O O » n t - v q \ q o q s O f N r i v i o d r ^ c ' o o r - i ' ^ - ' * en ~t © - H
i n - H s O 0 0 T t ( N v > m ©' o i © ' ^ - o — ©* v i
© -^ © f ©'
T f O ( N ^ H m v o r - o o < N O N ^ - ' o
o — ' — ' o d s d r n — ' o N o d r - ^ s d o
en so CN en ON vi ON
t -^ -; » O ON ^ vi >o fi oi cn vi r
os t- r- oo
© cn so* vi ©' o so TJ- in r-
© r-i © ' © ' © ' m' ©
© -^ © o ©
o o o N c n v i o s s o ^ r v N o o
: d 6 m « d f O M * r ~ - ^ - v i r - ^ — " • ^ J - C N ^ J -
^ • c n v i r ^ V ) r n © ( N c n O N „ - c c T ] - o o c n c n - H Q O o o c n
o ' c N O ' c n ' © ' — © T T ©
I ON t j - so r - oo v . (N . - H r - CN © - - v> ©
© ' © ' © ' r - i — ' © ' c n ' r - i r ^ - ^ ' c N c n ^ r v i ' t f T f ' r - i © c n © r - i © - - © o d o
m ^ f - ^ © ^ - — v i m r ^ * — i r - i r ^ ^ } - ' ^ -
r-i cn r-i
v i —i ON - H r-i oo o ^ j - M © so ^ r © v i
©' (N --" - ^ O «-* ©'
^ c A & s s 2 S m . 8
g e-E B ;
= = S c a CTJ W J i U C
= : c c e u « • - " P . - a E D. o « o o
* > 3 c c n N P x ) o
1 = a, o -S °
(3
a & u a
at
CN O
3 0
s o 00
>
c?
c 'C
>
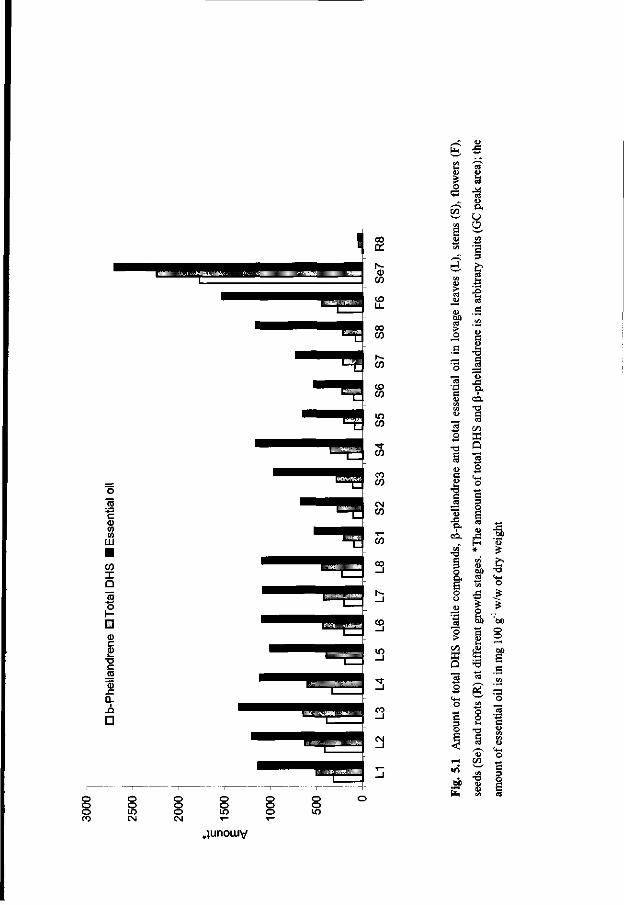
UH rg
$ •
o <3 w VI
h « ^
5 <D
en > o
M
<L>
O CO VI
a 3 £-£
-§ fl <ZJ
<L>
•*-»
c 4>
(L>
, , trt O
T l
s 0)
c 3 c CO r 1 4>
•
„ CM
T )
^ o
H o
« o >
1/3
a a
<4H
o 4 ^
e -s o
& • ca -a a a)
CO
X a 3 o
o c 3 o
J 3 H
* CM
Bp aj w
J 3
2
feb a
& s— o o i-i
T3
i u :* fr
<4H
o < £ 'so o o
S a
^ o ,—i
a
o o o CO
o o in CM
o o o CM
o o to T—
o o o T—
o o l O
rt CO ^
^unouiv
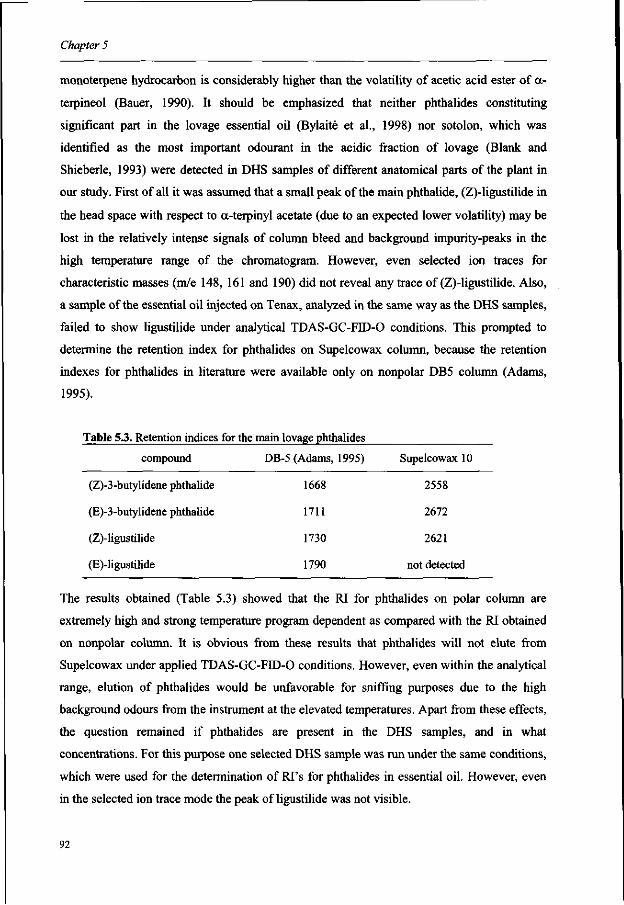
Chapter 5
monoterpene hydrocarbon is considerably higher than the volatility of acetic acid ester of a-
terpineol (Bauer, 1990). It should be emphasized that neither phthalides constituting
significant part in the lovage essential oil (Bylaite et al., 1998) nor sotolon, which was
identified as the most important odourant in the acidic fraction of lovage (Blank and
Shieberle, 1993) were detected in DHS samples of different anatomical parts of the plant in
our study. First of all it was assumed that a small peak of the main phthalide, (Z)-ligustilide in
the head space with respect to a-terpinyl acetate (due to an expected lower volatility) may be
lost in the relatively intense signals of column bleed and background impurity-peaks in the
high temperature range of the chromatogram. However, even selected ion traces for
characteristic masses (m/e 148, 161 and 190) did not reveal any trace of (Z)-ligustilide. Also,
a sample of the essential oil injected on Tenax, analyzed in the same way as the DHS samples,
failed to show ligustilide under analytical TDAS-GC-FID-O conditions. This prompted to
determine the retention index for phthalides on Supelcowax column, because the retention
indexes for phthalides in literature were available only on nonpolar DB5 column (Adams,
1995).
Table 5.3. Retention indices for the main lovage phthalides
compound
(Z)-3-butylidene phthalide
(E)-3-butylidene phthalide
(Z)-ligustilide
(E)-ligustilide
DB -5 (Adams, 1995)
1668
1711
1730
1790
Supelcowax 10
2558
2672
2621
not detected
The results obtained (Table 5.3) showed that the RI for phthalides on polar column are
extremely high and strong temperature program dependent as compared with the RI obtained
on nonpolar column. It is obvious from these results that phthalides will not elute from
Supelcowax under applied TDAS-GC-FID-0 conditions. However, even within the analytical
range, elution of phthalides would be unfavorable for sniffing purposes due to the high
background odours from the instrument at the elevated temperatures. Apart from these effects,
the question remained if phthalides are present in the DHS samples, and in what
concentrations. For this purpose one selected DHS sample was run under the same conditions,
which were used for the determination of RI's for phthalides in essential oil. However, even
in the selected ion trace mode the peak of ligustilide was not visible.
92
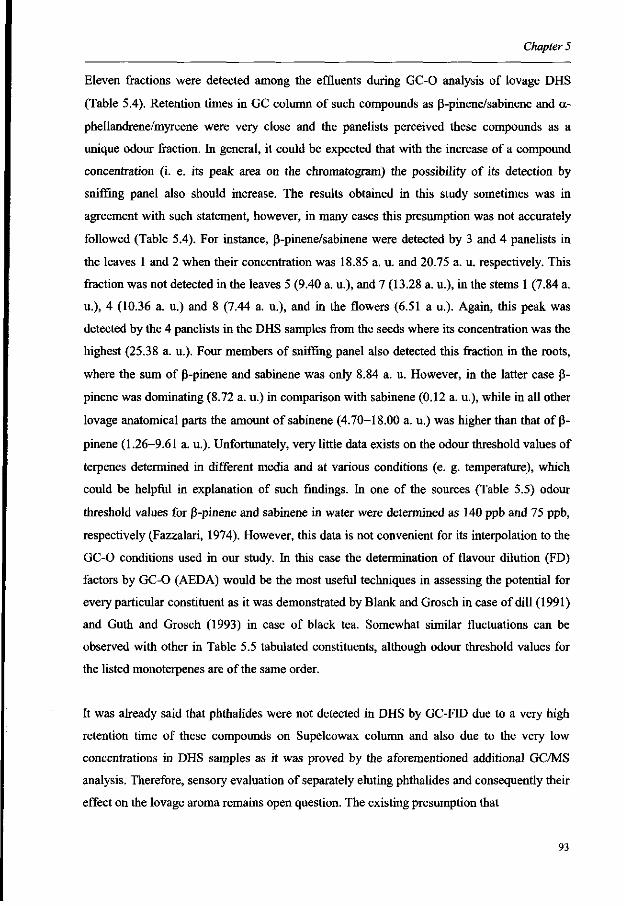
Chapter 5
Eleven fractions were detected among the effluents during GC-0 analysis of lovage DHS
(Table 5.4). Retention times in GC column of such compounds as (3-pinene/sabinene and a-
phellandrene/myrcene were very close and the panelists perceived these compounds as a
unique odour fraction. In general, it could be expected that with the increase of a compound
concentration (i. e. its peak area on the chromatogram) the possibility of its detection by
sniffing panel also should increase. The results obtained in this study sometimes was in
agreement with such statement, however, in many cases this presumption was not accurately
followed (Table 5.4). For instance, p-pinene/sabinene were detected by 3 and 4 panelists in
the leaves 1 and 2 when their concentration was 18.85 a. u. and 20.75 a. u. respectively. This
fraction was not detected in the leaves 5 (9.40 a. u.), and 7 (13.28 a. u.), in the stems 1 (7.84 a.
u.), 4 (10.36 a. u.) and 8 (7.44 a. u.), and in the flowers (6.51 a u.). Again, this peak was
detected by the 4 panelists in the DHS samples from the seeds where its concentration was the
highest (25.38 a. u.). Four members of sniffing panel also detected this fraction in the roots,
where the sum of P-pinene and sabinene was only 8.84 a. u. However, in the latter case p-
pinene was dominating (8.72 a. u.) in comparison with sabinene (0.12 a. u.), while in all other
lovage anatomical parts the amount of sabinene (4.70-18.00 a. u.) was higher than that of P-
pinene (1.26-9.61 a. u.). Unfortunately, very little data exists on the odour threshold values of
terpenes determined in different media and at various conditions (e. g. temperature), which
could be helpful in explanation of such findings. In one of the sources (Table 5.5) odour
threshold values for P-pinene and sabinene in water were determined as 140 ppb and 75 ppb,
respectively (Fazzalari, 1974). However, this data is not convenient for its interpolation to the
GC-O conditions used in our study. In this case the determination of flavour dilution (FD)
factors by GC-0 (AEDA) would be the most useful techniques in assessing the potential for
every particular constituent as it was demonstrated by Blank and Grosch in case of dill (1991)
and Guth and Grosch (1993) in case of black tea. Somewhat similar fluctuations can be
observed with other in Table 5.5 tabulated constituents, although odour threshold values for
the listed monoterpenes are of the same order.
It was already said that phthalides were not detected in DHS by GC-FID due to a very high
retention time of these compounds on Supelcowax column and also due to the very low
concentrations in DHS samples as it was proved by the aforementioned additional GC/MS
analysis. Therefore, sensory evaluation of separately eluting phthalides and consequently their
effect on the lovage aroma remains open question. The existing presumption that
93
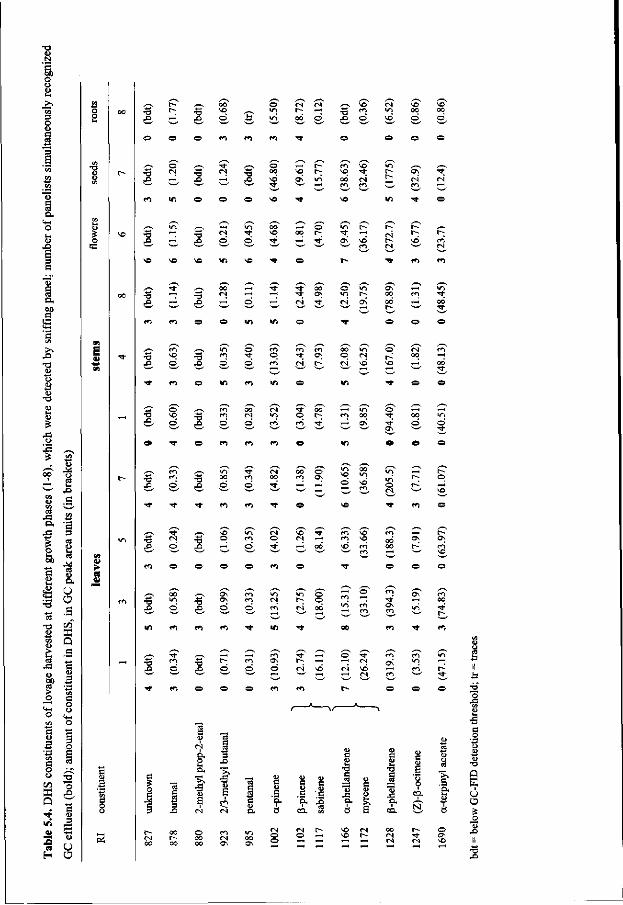
S>
3 O
a,
•a
f
.a a.
CO - j 3
o o
t / 5
ffi a . • *
i/i cu
3 H
• r 2 "o . O
" a « 3
S3 « a> O o
•a a> a. O O .g co « Q .a
« CD
T 3 X i
o CO vq
a^ vS
en vq CO
m <N en
c--c -
a\* CN en
^ CN r-1, r°. ^
/-^, >n " ,~, i-«' «n oo -—i o >n r-' r~- b- /-v
X> ^ X> O O "^ — ^t CTs \D r- ^6 m W ^ W W W W W W W < H - > CN s — ' CN
v « ^ O V © v i ^ ^ © t-v ^ (?) <*)
,—, ** ,—v CO »-< -*t rT OO o " > 0 C\ £^ v> •S ^ *3 **i '"I *•; " ° "if": °°. ^ ^t ,0 ,-! Xt *-<" O *-H (N ":fr CN ON 00 *-3 CO w w w w w w w **• W 0 t , w 3,
fi r*i © © v> vi o TT o o o
,—s m .—v v-i o m m m oo v^ o CN en ^ \ o ^ m ^ t o ^ o s o CN ^ oo --; • o O - O O O m r i K CN ^ VD .-3 co '*-"' S—' S~~' "—' ***' !-!_ S*" ' S ~ ^ S —' •—'_ J - ^ S _ ^ ^ ;
m m m >rj VI
x^
o
o oo o
i n
o
—' - H ' O VO
1 8 3 X I
P. O
O .
•?> 5 (D S
CN
3 J 2
">. •3
6 m CN
a ~ c
o —i —
•g IS
t - -
~*
J ! Q .
8
>o »o --"
p
s. B CN r-~ H
4 3 a
CQ
oo CN CN
-« r-
— r-
N
">, w & u
a o
^
Q E u o £ o
II •6 .£>
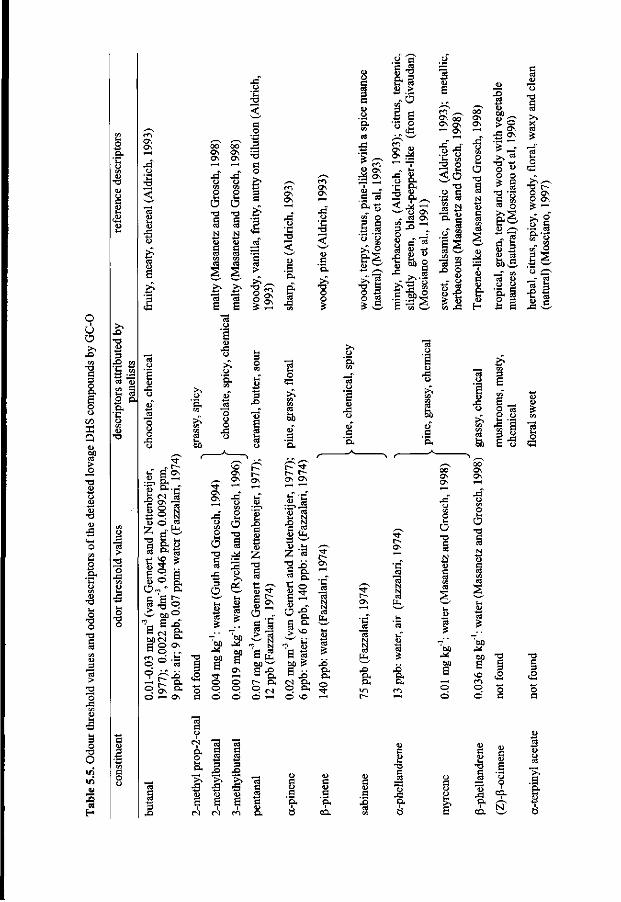
o I o a
X> CO
13 C 3 O
I o o
C/3 X Q a> 8P > o
o a,
o T3 o •a c
_3 "3 >
"o
3 -§ o
3
x> T3
£ 3 v-« cS
ft
.a a
S
I
,—v 00 ON ON r - H
J3 o CO
p 1-1
o T3
s a cS CO cS
s "3 a
,—s 00 ON ON ^ H
X i o CO
p o T3
4> a cS CO cS
§,
I* "3 S
•a < a ,2 _3 ^ a o £ 3 S3
1 of
"g
12
m ON ON
43 O
g 'EL
£ X ! co
m ON ON
X i " o
D a 'El T3 O O is
o a m §
S -2 &i4 <D >
-o
ca x :
Sa ON 0 0 ON O
> ^ ON ^ 9
f ST - -T 3 8 " "
.. xi
ft ft O 13
a
2 o S 9
Js ft. s—'' <J ON
* « ON
3 * „
e "g g>s
<o ^ T 3
^ re
CT) - — ' (L>
xl » -^ a 3 3
o o (5
"3
a X !
"3 o
X I o
• *
- j - •"" u S3 ON
.Si. s.—
mbr
ei
392
p al
ari,
S 9
ndN
e ip
m, 0
:e
r (Fa
Gem
ert a
'3, 0
.046
p pp
m: w
a1
(van
ig
dm
,0.0
7
03 m
g m"
0.00
22 m
ai
r; 9
ppb,
.01-
0.
977)
; pp
b:
O « ON
>> O
'ft CO
CO CO
ca &
T3
a o a
5-
5 0 u 0
X !
- ON ON
X? CO
a o T3
u J3
O CD
(i
1° 0 0 0
f—s NO ON ON
O CO O 1-1
O T3
§ ^ 3 !> ^ •3
>
1° ON
O O O
3 O CO
i-T (L>
•El
"o3
a 1-1 CM O
1 ^
t~-[ - -
ON
'£
1>
T3
a u 0 s
"a 60
a r-0 0
?r 1^-ON
3 "3
N N CS
X I
ft ft <N
'—'
"3 u 0
CO CO
aj &
'ft S~\
f~ t~~ ON
1-1
•§
e
T3
a 0 9
"a
a <N O O
^ , • *
t~-ON
"3
fc-1-1
'3 J6 ft ft 0
ft ft NO
u
i i ft ft
NO
f
^^
ON
1 N N CS
(D
a
ft ft 0
^
'a. CO
"3 0
0 ,13 0
c 'ft
ft 0
ft > N
43
(N
9 +^ 3
">> (D
a <N
9 5 X )
u» a
m
ca c C3
C
ft
3 }
c c
a
W c a 'E. ci.
5 o +x
S 60 ^ S =1
feb
a 'E ,
ON
00 ON ON
O •O
a
N
ca MH
X
ft ft i n
i i i
5 (S
X )
ft ft M
Hi 13 O 8
2 13
<u a u •S S3 ca
sp-^
1 ts 60 _
£ ° X j ON
o « o o ^ 9 "S'S re o
<D S
ft 3 o 3 to a
60
a T3
60
60
a 0 0
60 J * 60
a NO m 0 0
9
o 53
a_ 2 «8 •S a § s a -a a o
O ON
E?8
IS 3 3
-e •§ S a
o
T3
, 0
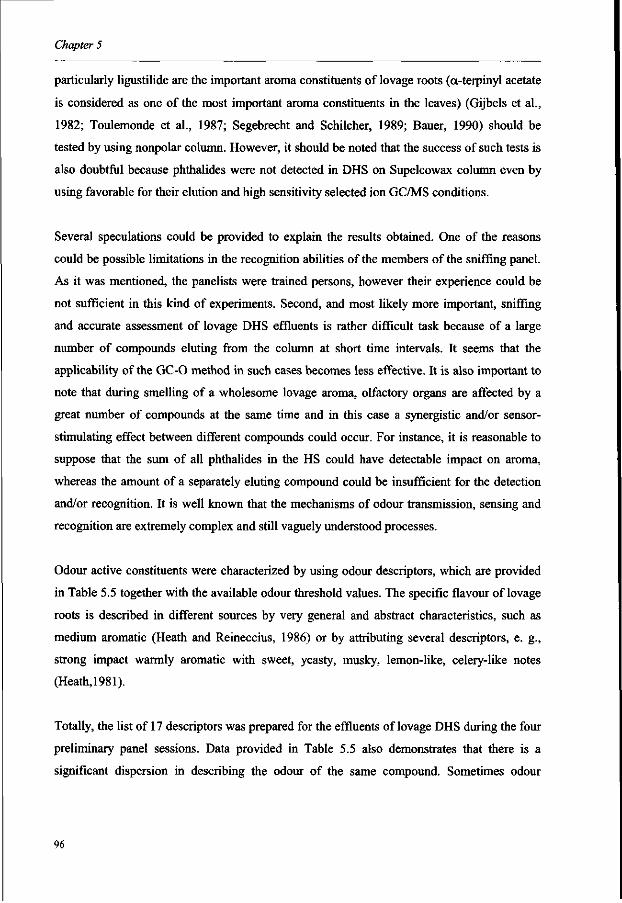
Chapter 5
particularly ligustilide are the important aroma constituents of lovage roots (a-terpinyl acetate
is considered as one of the most important aroma constituents in the leaves) (Gijbels et al.,
1982; Toulemonde et al, 1987; Segebrecht and Schilcher, 1989; Bauer, 1990) should be
tested by using nonpolar column. However, it should be noted that the success of such tests is
also doubtful because phthalides were not detected in DHS on Supelcowax column even by
using favorable for their elution and high sensitivity selected ion GC/MS conditions.
Several speculations could be provided to explain the results obtained. One of the reasons
could be possible limitations in the recognition abilities of the members of the sniffing panel.
As it was mentioned, the panelists were trained persons, however their experience could be
not sufficient in this kind of experiments. Second, and most likely more important, sniffing
and accurate assessment of lovage DHS effluents is rather difficult task because of a large
number of compounds eluting from the column at short time intervals. It seems that the
applicability of the GC-0 method in such cases becomes less effective. It is also important to
note that during smelling of a wholesome lovage aroma, olfactory organs are affected by a
great number of compounds at the same time and in this case a synergistic and/or sensor-
stimulating effect between different compounds could occur. For instance, it is reasonable to
suppose that the sum of all phthalides in the HS could have detectable impact on aroma,
whereas the amount of a separately eluting compound could be insufficient for the detection
and/or recognition. It is well known that the mechanisms of odour transmission, sensing and
recognition are extremely complex and still vaguely understood processes.
Odour active constituents were characterized by using odour descriptors, which are provided
in Table 5.5 together with the available odour threshold values. The specific flavour of lovage
roots is described in different sources by very general and abstract characteristics, such as
medium aromatic (Heath and Reineccius, 1986) or by attributing several descriptors, e. g.,
strong impact warmly aromatic with sweet, yeasty, musky, lemon-like, celery-like notes
(Heath, 1981).
Totally, the list of 17 descriptors was prepared for the effluents of lovage DHS during the four
preliminary panel sessions. Data provided in Table 5.5 also demonstrates that there is a
significant dispersion in describing the odour of the same compound. Sometimes odour
96
Chapter 5
descriptors provided in various sources are very controversial. For instance, the odour of
butanal was characterized with such strikingly different descriptors as fruity, meaty and
ethereal (Aldrich, 1993), that of a-phellandrene - minty, herbaceous, (Aldrich, 1993), citrus,
terpenic, slightly green, black-pepper-like (Mosciano et al., 1991).
An interesting observation could be made concerning (Z)-p-ocimene, which among others
was attributed such descriptor as "mushroom-like". Mushroom-like odour has also been
attributed to the different anatomical parts of lovage (Baranauskiene, 1995). Odour threshold
values also can vary in a wide range depending on testing media, conditions and other factors.
All these aspects make accurate assessment of such complex flavours as lovage rather
difficult.
CONCLUSIONS
GC/MS analysis of a great number of DHS samples from different anatomical parts of lovage
has lead to the identification of 41 constituent previously not reported in this plant. The
dominant constituent was (3-phellandrene in the most of DHS samples, however, its impact on
the lovage aroma does not seem to be the most significant. In general, DHS-GC-0 analysis of
all anatomical parts of lovage did not reveal specific key aroma compounds, which could be
unambiguously used for the characterization of lovage aroma. It seems, that according to the
proposed classification of the foods into the four aroma complexity groups (Belitz and
Grosch, 1987), lovage, on the contrary to many other aromatic and spicy plants (e. g. mints,
dill, caraway, cinnamon, etc.), which odour can be fully characterized by 1-3 constituents (1st
or 2nd group), belongs to the 3rd or even 4th group, when a great number of different
compounds is needed to simulate original aroma.
ACKNOWLEDGMENTS
We wish to thank Mr. J. Cozijnsen from Department of Food Technology and Nutritional
Sciences, Wageningen Agricultural University for excellent technical assistance during
97
Chapter 5
experiments and Dr. M. Baranauskiene and Dr. P. Viskelis from Lithuanian Institute of
Horticulture for providing lovage plants.
REFERENCES
Acree, T. E.; Barnard, J. Gas chromatography-olfactometry and Charm Analysis. In Trends in
Flavour Research; Maarse, H., Van der Heij, D. G., Eds.; Elsevier Science Publishers
B. V.: Amsterdam, 1994; pp 211-220.
Adams, R. P. Identification of Essential Oil Components by GC/MS. Allured Publising Corp.:
Carol Stream, IL., 1995.
Aldrich Flavours & Fragrances. International Edition, 1993.
Baranauskiene, M. Spicy Plants (Lithuanian) Ukininko patarejas: Kaunas, 1995.
Bauer, K.; Garbe, D.; Surburg, H. Common Fragrance and Flavour Materials. Preparation,
Properties and Uses. VCH Verlagsgesellschaft GmbH: Weinheim, 1990.
Belitz, H.-D; Grosh, W. Food Chemistry. Springer-Verlag: Berlin, Heidelberg, 1987.
Blank, I.; Grosch, W. Evaluation of potent odourants in dill seed and dill herb (Anethum
graveolens L.) by aroma extract dilution analysis. J. FoodSci. 1991, 56, 63-67.
Blank, I.; Schieberle, P. Analysis of the seasoning-like flavour substances of a commercial
lovage extract (Levisticum officinale Koch.). Flavour Fragrance J. 1993, 8, 191-195.
Bylaite, E.; Legger, A.; Roozen, J. P.; Venskutonis, P. R. Dynamic headspace gas
chromatography of different botanical parts of lovage (Levisticum officinale Koch.) In
Developments in Flavour Science; Taylor, A. J., Mottram, D. S., Eds.; The Royal
Society of Chemistry: UK, 1996; pp 66-69.
Bylaite, E.; Venskutonis, P. R.; Roozen, J. P. Influence of harvesting time on the composition
of volatile components in different anatomical parts of lovage (Levisticum officinale
Koch.;. J. Agric. Food Chem. 1998, 46, 3735-3740.
Compilation of Odour and Taste Threshold values Data. Fazzalari, F. A., Ed.; ASTM Data
Series DS 48A, American Society for Testing and Materials: Philadelphia, Pa.
Cu, J-Q.; Pu, F.; Shi, Y.; Perineu, F.; Delmas, M; Gaset, A. The chemical composition of
lovage headspace and essential oil produced by solvent extraction with various solvents.
J. Essent. Oil. Res. 1990, 2, 53-59.
Davies, N. W. Gas chromatographic retention indices of monoterpenes and sesquiterpenes on
methyl silicone and Carbowax 20M phases. J. Chromatogr. 1990, 503, 1-24.
98
Chapter 5
De Pooter, H. L.; Coolsaet, B. A.; Dirinck, P. J.; Schamp, N. M. GLC of the headspace after
concentration on Tenax GC and of the essential oils of apples, fresh celery, fresh
lovage, honeysuckle and ginger powder. In Essential Oils and Aromatic Plants;
Baerheim-Svendsen, A., Scheffer, J. J. C , Eds.; Publisher: Nijhoff/Junk Dordrecht, The
Netherlands, 1985; pp 67-77.
Dirinck, P.; De Winne, A. Advantages of instrumental procedures for measurement of
flavours characters. In Trends in Flavour Research; Maarse, H., Van der Heij, D. G.,
Eds; Elsevier Science Publishers B. V.: Amsterdam, 1994; pp 249-258.
van Gemert, L. J.; Nettenbreijer, A. H. Compilation of Odour Threshold Values in Air and
Water. CTVO-TNO: Zeist, The Netherlands, 1977.
Gijbels, M. J. M; Scheffer, J. J. C; Baerheim-Svendsen, B. Phthalides in the essential oil
from roots of Levisticum officinale. Planta Medico 1982,44, 207-211.
Guth, H.; Grosch W. Identification of potent odourants in static headspace samples of green
and black tea powders on the basis of aroma extract dilution analysis (AEDA). Flavour
Fragrance. J., 1993, 8, 173-178.
Guth, H.; Grosch W. Identification of the character impact odourants of stewed beef juice by
instrumental analyses and sensory studies. /. Agric. Food Chem., 1994, 42, 2862-2866.
Heath, H. B. Source book of flavours. AVI Publishing Co., Inc.: New York, 1981.
Heath, H. B.; Reineccius, G. Flavour Chemistry and Technology. Macmillan Publishers:
Riverside, NJ, 1986.
Linssen, J. P. H.; Janssens, J. L. G. M.; Roozen, J. P.; Posthumus, M. A. Combined gas
chromatography and sniffing port analysis of volatile compounds of mineral water
packed in laminated packages. Food Chem., 1993, 46, 367-371.
Masanetz, C; Grosch, W. Hay-like off-flavour of dry parsley. Z. Lebensm. Unters. Forsch. A,
1998,206, 114-120.
Mosciano, G. Organoleptic characteristics of flavour materials, Perfum. Flavour., 1997, 22,
75-78.
Mosciano G.; Fasano M.; Cassidy J.; Connelly C; Mazeiko P.; Montenegro A.; Michalski, J.;
Sadural S. Organoleptic characteristics of flavour materials. Perfum.Flavour. 1993, 18,
43-45.
Mosciano, G.; Fasano, M.; Michalski, J.; Sadural S. Organoleptic characteristics of flavour
materials. Perfum. Flavour. 1990, 15, 69-73.
99
Chapter 5
Mosciano, G.; Fasano, M.; Michalski, J.; Sadural S. Organoleptic characteristics of flavour
materials. Perfum. Flavour. 1991, 16, 49-55.
Rychlik, M; Grosch W. Lebensm. Wiss. Technol, 1996, 29, 515-525.
Segebrecht, S.; Schilcher, H. Ligustilide: guiding component for preparation of Levisticum
officinale roots. Planta Medica 1989, 55, 572-573.
Toulemonde, B.; Noleau, I. Volatile constituents of lovage {Levisticum officinale Koch.) In
Flavours and Fragrances: a World Perspective; Lawrence, B. M., Mookherjee, B. D.,
Willis, B. J., Eds; Elsevier Science Publishers B. V.: Amsterdam, 1988; pp 641-657.
Toulemonde, B.; Paul, F.; Noleau, I. Phthalides from lovage (Levisticum officinale Koch.) In
Flavour Science and Technology; Martens, M., Dalett, A., Russwurm, H. Eds.; John
Wiley & Sons: New York, 1987; pp 89-94.
Venskutonis, P. R. Essential oil composition of some herbs cultivated in Lithuania. In
Flavours, Fragrances and Essential AREP, Istanbul, 1995; pp 108-123
100
CHAPTER 6
EMULSIFICATION OF CARAWAY ESSENTIAL OIL IN
WATER USING LECITHIN AND (3-LACTOGLOBULIN:
EMULSION STABILITY AND PROPERTIES OF THE
RESULTING OIL/AQUEOUS INTERFACE
This chapter is based on the following manuscript:
Bylaite, E.; Nylander, T.; Venskutonis, R. Emulsification of caraway essential oil in water by lecithin and P-lactoglobulin - emulsion stability and properties the formed oil-aqueous interface. Submitted to the Int. J. Dairy Sci.
Chapter 6
ABSTRACT
The stability and droplet size of protein- and lipid-stabilised emulsions of caraway essential
oil and the amount of protein on the emulsion droplets were both investigated. The amounts
of added protein (P-lactoglobulin) and lipid (phosphatidylcholine from soyabean (sb-PC))
were varied and the results were compared with those obtained from emulsions of a purified
olive oil. In general, emulsions with triglyceride oil proved to be more stable than those made
with caraway essential oil as the dispersed phase. However, the stability of the emulsions can
be improved considerably by adding sb-PC. An increase in the protein concentration also
promoted emulsion stability. The use of ellipsometry to measure both the adsorption of the
lipid from the oil and the protein from the aqueous phase at the oil/water interface was
introduced in this study. Independently of the concentration used, a monolayer coverage of
sb-PC was almost achieved at the caraway oil/aqueous interface. However, at the olive
oil/aqueous interface, the presence of only a small amount of sb-PC led to an exponential
increase in layer thickness with time to beyond a monolayer coverage. The amount of p-
lactoglobulin adsorbed at the caraway oil/aqueous interface was the same as at the olive
oil/aqueous interface and corresponded roughly to a protein monolayer.
INTRODUCTION
Whey proteins are frequently used as functional and nutritional ingredients in food systems
(Morr, 1982: De Wit, 1989; Kinsella et al., 1989). One of the novel applications of whey
proteins is to use them as a coating or "wall" material in micro-encapsulation. This process
involves entrapping droplets or particles of sensitive or bioactive material into thin films of
coating material (Rosenberg and Young, 1993; Sheu and Rosenberg, 1993; Faldt and
Bergenstahl, 1996a,b; Kim and Morr, 1996; Kim et al., 1996; Moreau and Rosenberg, 1996).
Food ingredients such as aroma and flavour compounds, oils and fats, vitamins and essential
oils are commonly encapsulated by spray drying (Dziezak, 1988; Jackson and Lee, 1991). The
emulsification process, when liquid material (core) is dispersed into a solution of
encapsulating (wall) material, is one of the key factors that controls the retention of flavour
during the drying process (Rish and Reineccius, 1988). To our knowledge the emulsification
of flavouring substances, and essential oils in particular, has not been thoroughly investigated.
This work therefore focuses on protein- and lipid-stabilised emulsions of caraway essential
oil. The stability and droplet size of the resulting emulsion as well as the amount of protein on
the emulsion droplets were investigated. The amounts of added protein (p-lactoglobulin) and
lipid (phosphatidylcholine from soyabean (sb-PC)) were varied and the results were compared
with those obtained from emulsions of a triglyceride oil, i. e. purified olive oil (-74%
triolein). Further information on the properties of the oil/aqueous interface and how it is
102
Chapter 6
affected by the presence of protein and lipid was obtained using ellipsometry. This technique
was used to determine the adsorption of the lipid from the oil and the protein from the
aqueous phase at the oil/aqueous interface. It was found that some useful information can be
obtained from the ellipsometry data. The protein used, P-lactoglobulin, is known to bind a
number of hydrophobic compounds (Sawyer et al., 1998) and it has been suggested that it has
a biological function as a transport protein (Brownlow et al., 1997). In combination with
phosphatidic acid, the protein is capable of masking bitter tastes (Kurihara and Katsuragi,
1993) and therefore it is very suitable for encapsulating essential oils.
The good functional properties of proteins, i. e. their solubility, viscosity, emulsification, as
well as their ability to interact with water, small ions and other polymers at the oil/water
interface, make them particularly suitable for stabilising the emulsion droplets formed during
homogenisation (Walstra, 1988; Kinsella, 1990; Morr and Ha, 1993). The ability of whey
protein to adsorb at the oil/water interface and stabilise emulsions has been investigated
extensively (Pearce and Kinsella, 1978; Shimizu et al., 1985; Kinsella and Whitehead, 1989).
However, during or after emulsification some of the initially adsorbed proteins may be
displaced from the interface by other (less abundant) more surface-active components, such as
other proteins, lipids or surfactants (Courthaudon et al., 1991a,c; Chen and Dickinson, 1993;
Tomas et al., 1994). The competitive adsorption of different surface-active components, and
thus the composition of the stabilising layer of the dispersed phase, is affected by the strength
of the interaction between surface-active species, the ratio between the total emulsifier present
and the area of the fat surface formed. No preferential adsorption of one of the proteins at the
newly made oil/water interface was found when a mixture of a-lactalbumin and p-
lactoglobulin was used as an emulsifier (Courthaudon et al., 1991c). Even after storage,
almost no displacement of one protein by the other occurred (Dalgleish et al., 1991). The
presence of oil-soluble surfactants in p-lactoglobulin-stabilised emulsions increased the
surface coverage of protein at low surfactant concentration, while the protein surface
concentration was reduced at high surfactant concentration (Dickinson et al., 1993). This is in
contrast with the results from a similar study, where instead a water-soluble surfactant was
added during the preparation of p-lactoglobulin-stabilised emulsions (Courthaudon et al.,
199Id). It was found that the protein was completely displaced by the surfactant at an
emulsifier-to-protein molar ratio of 8:1. In general, surfactants or lipids that have the optimal
balance between hydrophilic and hydrophobic properties to be a good emulsifiers also form a
lamellar crystalline phase (Bergenstahl and Claesson, 1990). Lecithin from egg yolk or
soyabean, where the main constituent is phosphatidylcholine (PC), is such an emulsifier and is
therefore one of the most commonly used ones. It is also one of the few food emulsifiers in
common use which is accepted by consumers and legislators as being genuinely natural
(Dickinson and Iveson, 1993). The purity of lecithin and the way it is added (e.g. to the oil or
103
Chapter 6
to the water phase) are certain to affect the interaction with proteins, which in turn affects the
emulsion stability. This has been studied by Yamamoto and Araki (1997), who compared the
interfacial behaviour of P-lactoglobulin, in the presence of lecithin in the water or in the oil
phase, with the stability of the corresponding emulsions. In the presence of protein, crude
lecithin was found to increase the stability of the emulsion and lower the interfacial tension
more effectively than a pure lecithin preparation. When (crude) lecithin was added to the oil
phase, the interfacial tension was found to decrease, and the emulsion stability increased in
comparison with an emulsion which had the lecithin dispersed in the water phase.
MATERIALS AND METHODS
Materials
The P-lactoglobulin sample (DFIblgl, containing 90.2% P-lactoglobulin, 4.7% moisture,
3.1% ash, 0.4% a-lactalbumin and 0.4% fat) was kindly provided by Borculo Domo
Ingredients, The Netherlands, and was used without further purification. The olive oil was a
highly purified sample (SS-1018 CPO olive oil, lot no 8070:2 from Larodan Fine Chemicals,
Sweden) and was shown to be free of monoglyceride, diglycerides and free fatty acids by
HPLC. The fatty acid composition expressed as peak area percentage was 10.6% C16:0, 3.5%
C18:0, 73.8% C18:l, 8.1% C18:2 and 0.6% C18:3. Commercial caraway essential oil was
purchased from Frey & Lauhenstedtulzburg, Germany. Gas chromatography analysis of
caraway essential oil has shown that it is mainly (~98% of total oil) composed of two
hydrocarbons: limonene and carvone in a 1:1 ratio. Soyabean phosphatidylcholine (sb-PC)
was a high purity grade sample (Batch 1-7-9027, containing 94.2% phosphatidylcholine, 1.2%
lysophosphatidylcholine) Epikuron 200 obtained from Lucas Meyer, Germany. Epikuron 200
has previously been found to have the following fatty acid composition: C16:0 = 13.3%,
C18:0 = 3.0%, C18:l = 10.2%, C18:2 = 66.9% and C18:3 = 6.6% (Shinoda et al., 1991).
Buffer solutions were prepared from analytical grade reagents in double distilled water passed
through a Milli-Q water purification system (Millipore Corporation).
Methods
Preparation of emulsions
The aqueous phase was prepared by dissolving 1.17% or 2.35% P-lactoglobulin in 60 mM
phosphate buffer at pH 6.7, the solution then being extensively dialysed against the same
buffer for 24 hours. Sodium azide was added to each emulsion (0.01%) as a preservative.
Different quantities of phosphatidylcholine (PC) were dissolved in the oil phase (caraway and
104
Chapter 6
olive oils) before homogenisation to give a concentration range of 0.2-0.8% in the final
emulsion. This corresponds approximately to a molar ratio (Mr) of lipid to protein ranging
from 5 to 22. Oil-in-water emulsions, containing 1 or 2% P-lg, 15% oil and 0-0.8% sb-PC,
were prepared at room temperature. The initial emulsification was done at 31 000 rpm for 7
min using a Heidolph Diax 900 Homogenizer (Heidolph, Germany), fitted with a 10G
Homogenizer Tool. Homogenisation was completed by sonicating the emulsions for 100 s at
40 W output effect in a Vibra Cell sonicator (Sonics & Materials Inc., CO, USA) with a
micro-tip Mod No VIA.
Average size of emulsion droplets
Average droplet size in freshly made and diluted (1:20) emulsions was determined by light
microscopy with a Zeiss Axioplan Microscope (Carl Zeiss, Jena, Germany) using an ocular
with a magnification of x40. The images were collected with a video camera (total
magnification about *400) and the particle sizes were later calculated manually from the
images.
Protein load on emulsion droplets
In order to determine the amounts of protein adsorbed at the oil/water interfaces, the
emulsions were first centrifuged at 3500 rpm (-2800 g) for 30 min at 25°C to separate the oil
droplets from the aqueous phase. Serum was then withdrawn with a syringe and the protein
content was analysed using a modified Lowry method (Lowry et al., 1951). The total amount
of adsorbed protein was estimated from the amount of protein in serum after centrifugation
and the amount used to make the original emulsions.
Emulsion stability (creaming)
Emulsion stability was evaluated by measuring the extent of gravitational phase separation.
This method has been suggested as an adequate predictor of short-term emulsion stability of
emulsions made with milk proteins (Fligner et al., 1990). For the measurements, emulsion
samples were transferred into test tubes with an inner diameter of 5.75 mm and a length of 22
cm. The tubes were tightly capped and stored at room temperature. When the creaming
process was complete, we measured the thickness of the cream layer in the test tubes.
105
Chapter 6
Properties of the oil/water interface
The properties of the oil/water interface were characterised in situ by ellipsometry (Azzam
and Bashara, 1987). When (elliptically) polarised light is reflected against a surface, the
change in the state of polarisation, expressed as amplitude ratio, x¥, and phase shift, A, can be
measured with an ellipsometer. For a clean interface between a solid and a liquid, liquid and
air or between two liquids, *P and A will give the refractive index of the material. When a film
is present at the interface, the measured *F and A values are also dependent on the thickness
and refractive index of the film. We used ellipsometry here to characterise the interface
between two oils (caraway oil and olive oil) and water with and without the presence of
phosphatidylcholine in the oil phase and a protein dissolved in the aqueous phase. Our
measurements were performed in a simple circular glass cuvette (diameter 55 mm) to which
20 ml of buffer had been added. A Teflon cylinder (wall thickness 2 mm) was fitted into the
glass cell until it touched the aqueous surface. The oil (10 ml ) was then added on top of the
aqueous phase, giving an oil/aqueous interface area of about 20 cm2. This ensured that the
meniscus at the oil/water interface was as flat as possible. The ellipsometer (Optrel
Multiskop; Optrel, Berlin, Germany), described in detail by Harke et al. (1997), was arranged
in such a way that the incident light was reflected at the air/oil and oil/aqueous interfaces as
shown in Fig. 6.1. With this setup it is possible to measure the properties of both the air/oil
interface and the oil/aqueous interface. In this study we only considered the oil/water interface
and, as the oil film was thick enough, it was easy to separate out the reflected light from this
interface. To facilitate the addition of protein to the aqueous phase, a smaller glass beaker was
connected to the glass cell via a Teflon stopcock. Before 2 ml of the protein stock solution
was added, the same volume of buffer was withdrawn from the glass cell via the connected
vessel. Thus the interface was disturbed as little as possible.
Calculation of the optical properties of the interfaces
To justify the analysis of the data and to demonstrate the power of the method, the basic
theory of the method is presented. Ellipsometry is based on the measurements of changes in
ellipticity of polarised light upon reflection at a surface. Polarised light in general can be
described as two superimposed light waves, the p and s components, where each of the two
waves resides in a plane perpendicular to the other. For plane-polarised light, the phase shift
between these two light waves is either zero or multiples of 180°. In the general case of
elliptically polarised light, the phase shift is different. The reflection of light at each interface
can be described by the Fresnel reflection coefficients, rp and rs for the p and s components,
respectively. Similarly, transmission coefficients tp and ts can be described. These coefficients
depend on the angles of incidence and refraction and the refractive indices of the media on
106
Chapter 6
both sides of the interface. For an interface between two dielectric media, the reflection
coefficients are real quantities, while they become complex for a semiconductor, a metal or
any material that absorbs light at the wavelength used. For an interface the ratio p = r,/rs is
related to the ellipsometer angles A and ¥ as
[6.1]
The optical layer model used to evaluate our data is shown in Fig. 6.1. For each of the
interfaces a reflection coefficient can be derived. They can be expressed as
n cos$ +n fcos0.
n, cos^ - nt cos <jij rg 31
** «,. cos0, + ny cos (j
t 2n,cosd [6.4] w n, cos fa+ n, cos faf
r = _ _ 2 ^ c o s J _ _ [6.5] '•' n,cos^ + nj, cos0,
Here the refractive index and angle of reflection (or refraction) for medium (i) are n; and <|>„
respectively. The reflection coefficients between two dielectric media are real numbers and
thus from equation [6.1] it follows that A can only assume the values 0° (or 360° depending
on the definition of the angles) or 180°. For such an interface we will only measure a change
in *P when the refractive indices of the media or the angle of incidence is changed. The value
of A will be 180° degrees below and 0° or 360° above the Brewster angle. At the Brewster
angle the reflection coefficients are zero. It can be shown that the largest sensitivity of the
measured angles A and i|/ is closest to the Brewster angle (Azzam and Bashara, 1987). We
then introduced a dielectric thin film (less than the wavelength of the light) between the two
dielectric media. Now the reflection coefficients have to take into account the multiple
reflection that occurs within the film (cf. McCrackin et al., 1963). The reflection coefficients
can, for this case, be expressed using the notation in Fig. 6.1, as:
[6.6]
107
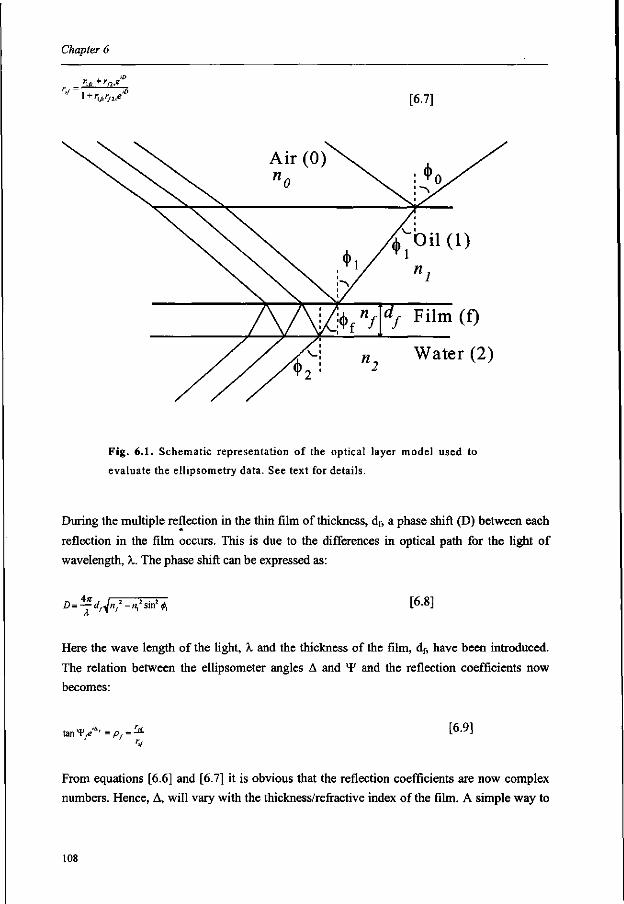
Chapter 6
V i i <D [6.7]
Watei
Fig. 6.1. Schematic representation of the optical layer model used to
evaluate the ellipsometry data. See text for details.
During the multiple reflection in the thin film of thickness, df, a phase shift (D) between each
reflection in the film occurs. This is due to the differences in optical path for the light of
wavelength, X. The phase shift can be expressed as:
i f D=-±- df^nf2 - n,' sin2 0, [6.8]
Here the wave length of the light, X and the thickness of the film, df, have been introduced.
The relation between the ellipsometer angles A and *¥ and the reflection coefficients now
becomes:
tanf^'4 ' = pf- [6.9]
From equations [6.6] and [6.7] it is obvious that the reflection coefficients are now complex
numbers. Hence, A, will vary with the thickness/refractive index of the film. A simple way to
108
Chapter 6
illustrate the expected changes is to use the first order approximation for pf expressed as the
relative change when the thickness/refractive index of the film increases (Wang et al., 1990)
dp, ^tan^P, iAm,dfcosd), n2(n2 -n2)(n2 -n2) - " - = L + WAf=
LX - • , 2 , ' ' , 2 , r , [6.10] pr t a n ^ ' X n / \ n 2 -n2){n2cot2 <p,-n2)
From equation [6.10] it follows that for dielectric films and media; that is, when the refractive
indices assume real values, the right hand side of equation [6.10] is the imaginary part of the
left-hand side. From this it follows that the formation of a film will only be reflected in a
change in A. Any measured changes in *F must depend on changes of the refractive index of
the media or of the angle of incidence. The changes of angles of incidence can arise from
changes in the curvature of the liquid interface. Such changes can occur due to changes in the
wetting of the measuring cell and/or changes in the interfacial tension due to the adsorption of
surface-active molecules. However, as A reflects the build up of the film essentially
independently of x¥, we can use changes in ¥ to correct for changes in the angle of incidence,
e. g. due to changes in the curvature of the liquid interface. We also note from equation [6.10]
that for <(>! ~45°(cot<|>1 ~1), which is approximately the angle of incidence we have used, and
for n] > nf > n2 we would expect an increase in A as the film is built up. On the other hand, if
nf > ni then a decrease in A from 180 degrees is expected. As the build up of film, for the
system used, only changes one of the parameters, we can either determine the thickness and
fix the refractive index or vice versa. Since the refractive index of the film determines whether
A should increase or decrease, we chose to fix the thickness of the film and adjusted the
refractive index of the film until the measured values of A were obtained. From the thickness
and refractive index values we can obtain the amount of, for instance, a protein in the film (De
Feijter et al., 1978; Cuypers et al., 1983). We used the formula derived by Cuypers et al.
(1983), where the surface excess (or adsorbed amount), T, can be obtained as:
0.3rf,(«/-«„2)
" ( n / + 2)[r(«/„2 + 2)-v('!/.2-1)]
Here, r is the specific refractivity and v the partial specific volume of the adsorbing/deposited
substance (e.g. protein) in the film and nro is the refractive index of the solvent in the film. In
all the calculations, nro was set to be equal to the buffer value. For p-lactoglobulin an r value,
obtained from the molar refractivity, of 0.249 ml g"1 and a v value of 0.749 mg ml"1 (Nylander
and Wahlgren, 1994) were used. The corresponding values for sb-PC were set to r = 0.274 ml
g"' and v = 0.980 ml g"1 as reported by Kop et al. (1984). The expression for A and ¥ given in
equation [6.9] is not complete for the optical system used in this study as depicted in Fig. 6.1.
The ellipsometry data were recorded in air, which means that the light had to pass through the
109
Chapter 6
air/oil and oil/air interfaces. We then have to introduce the transmission coefficients for these
interfaces and arrive at the following expression for the measured A and y¥:
tan *¥0!e Coi'V^u
[6.12]
The refractive index data was taken from Handbook of Chemistry of Physics (1974). The
value for the buffer was the water value of 1.3332, for caraway essential oil the value (1.4730)
reported for one of its major constituents (limonene) was used and for the olive oil, the value
for triolein (1.4621) was used. It should be noted these values were recalculated to X = 5320
A, from the reported values for sodium light X = 5893 as described by Mahanty and Ninham
(1974) and Bottcher and Bordewijk (1978). Hence the refractive indices used for X = 5320 A
were 1.33494, 1.47569, and 1.46473 for buffer, caraway and olive oil, respectively. In the
evaluation of the ellipsometry data, first the angle of incidence was determined by varying the
<j>0 value until the experimental *Fwas obtained. In the next step we assumed a df-value,
entered it in equation [6.12] and varied the refractive index of the film until the calculated
value of A matched the experimentally obtained one. The calculations were done using
Mathematica 3.0 (Wolfram Research, Champaign, IL) on a Macintosh Power PC. The df-
value was chosen so that it matched the molecular dimensions of the adsorbing molecules;
that is, for sb-PC half the thickness of a PC bilayer, -18 A (cf. the value reported by LeNeveu
et al. (1976) for PC from egg yolk) and for p-lactoglobulin, 20 A. The latter value is based on
dynamic light scattering measurements of the thickness of adsorbed p-lactoglobulin layers (20
A) on latex particles, reported by Dalgleish and Leaver (1991). Home et al. (1998) and
Mackie et al. (1991) reported layer thickness of P-lactoglobulin of 18 A at the air/water
interface from neutron reflectivity measurements and on polystyrene latex particles using X-
ray scattering. This is slightly less than the diameter of the monomer, which is about 36 A
(Green and Aschaffenburg, 1959). It is reasonable to assume that the thickness of the layer
should be a little less than the molecular dimensions, as one would expect that the protein is
partly unfolded at the interface. Furthermore, the ellipsometer measures3 an average
thickness, which is expected to be less than the protrusion of protein segments into the bulk
solution (for a more detailed discussion see Kull et al., 1997).
RESULTS AND DISCUSSION
Emulsification experiments
Fig. 6.2 shows the average emulsion droplet diameter as a function of the sb-PC content in the
two types of emulsions, one based on a triglyceride (olive oil) and the other based on
hydrocarbon (caraway essential oil). With the emulsification procedure used, the average
no
Chapter 6
emulsion droplet size was smaller in emulsions made with caraway essential oil than when
olive oil was used as the dispersed phase. A difference between hydrocarbon (n-tetradecane)
and triglyceride oil-in-water emulsions in systems containing mixtures of protein (P-casein)
and sb-PC has also been reported by Courthaudon et al. (1991a). They found that much more
lecithin is associated with n-tetradecane than with soy oil droplets. At low sb-PC/protein
molar ratios, substantially more P-casein was adsorbed at the hydrocarbon/aqueous interface
than at the triglyceride/aqueous interface.
0 4 0,2 0,4 0,6
PC content in emulsion (wt %) 0,8
F ig . 6.2. Effect of sb-PC on droplet size of emulsions formed from olive and caraway oil emulsions stabilized by pMg
- Olive oil, 2% b-lg; Caraway oil, 2% b-lg;
- O - Olive oil,l% b-lg; —A— Caraway oil, 1 % b-lg;
The reason for this difference is certainly associated with the much lower interfacial tension at
the triglyceride/water interface than at the hydrocarbon/water interface (Fisher et al., 1985).
The droplet size also decreases with increasing protein concentration as well as with
increasing sb-PC content for both types of emulsions In the emulsions without sb-PC, an
increased protein concentration from 1 to 2% leads to a reduction in the average particle size
by 6.9 and 13% in olive and caraway oil emulsions, respectively. The addition of sb-PC leads
to an even larger decrease in the droplet size of 20-47%, depending on the oil, protein
concentration and sb-PC content. It is clear that the effect of sb-PC is more pronounced in the
emulsions with the higher protein concentration (2%). Here it is important to remember that a
111
Chapter 6
decrease in emulsion droplet size means an increase in total surface area of the oil/aqueous
interface. For instance a decrease in the radius of 20% gives a surface area which is 1.25 times
larger and a 50% reduction gives twice the area to cover. This means that more molecules are
needed in order to form a stable emulsion. Since we observed a reduction in droplet size as an
effect of an increase in protein concentration, we can be confident that a mixed protein/lipid
film is formed at the oil/aqueous interface. It is also obvious from the protein adsorption data
shown in Table 6.1, that sb-PC is unable to replace the protein completely. This is in
agreement with earlier studies, where lecithin was found to be less efficient than other
surfactants in displacing milk proteins from the oil/water interface (Courthaudon et al., 1991a;
Dickinson and Iveson, 1993). Even at high phospholipid:protein ratios, protein and sb-PC
coexist at the interface (Courthaudon et al., 1991b; Fang and Dalgleish, 1993). If we again
consider the adsorption data in Table 6.1, we observe that the maximum reduction in the
adsorbed amount is by a factor of three for the caraway oil. We know that the average
diameter decreases up to a maximum of about 50%. This corresponds to an area increase by a
factor of two as mentioned above.
Table 6.1. Adsorbed amount of protein at the caraway essential oil (EO)/water and olive oil (00)/water interfaces in emulsions stabilised by 1 and 2% P-lactoglobulin (BLG). The data obtained from measurements of the depletion of protein in solution and droplet size measurements are given as a function of sb-PC content in the oil.
sb-PC content (%) in emulsions
0.0
0.2
0.4
0.6
0.8
OO emulsions (mgjT1)1
1 % BLG
28.24 (7.91)
25.33 (6.59)
22.20 (5.55)
16.33 (3.53)
15.88 (3.54)
2 % BLG
32.42 (8.44)
27.35 (6.72)
25.20 (5.66)
19.13(3.44)
18.60(3.85)
EO emulsions (mg g"1)
1 % BLG
37.77 (5.04)
29.06 (3.48)
25.07 (2.74)
20.66 (2.06)
17.33(1.82)
2 % BLG
46.57 (6.45)
32.23(3.18)
29.13(2.45)
21.88(1.54)
20.83 (2.22)
'Adsorbed amount of P-lactoglobulin is expressed in mg for lg of dispersed phase (oil). The values in parentheses are given in mg nf2 based on area calculated from droplet size.
Thus we can conclude that sb-PC is likely to replace some of the protein at the oil/aqueous
interface. It is interesting to note that a minimum particle average diameter is reached at 0.6%
sb-PC for both types of oil. One might speculate that at this particular protein/lipid ratio the
mixed layer is able to cover the largest surface area at the oil/aqueous interface; and thus there
is enough surface-active material to form these small droplets.
Figures 6.3-6.6 show the effects of sb-PC and P-lactoglobulin on the stability of caraway and
olive oil emulsions in terms of cream layer thickness. It is clear that the stability of oil-in-
water emulsions is strongly dependent on protein and phospholipid concentrations. In general,
emulsions with triglyceride oil were shown to be more stable than those made with caraway
112
Chapter 6
essential oil as the dispersed phase. However, the stability of the emulsions can be improved
considerably by adding sb-PC. This effect is substantially larger for caraway oil than for olive
oil. In fact, the cream layer from caraway oil after 5 days at the highest sb-PC content was
substantially thinner than that formed from olive oil. If we look at the different oils separately,
we see that the increase in emulsion stability follows the decrease in emulsion droplet size,
which is what one would expect. On the other hand, if we compare caraway oil emulsions
with those formed from olive oil, the olive oil emulsions seem to be more stable in spite of
their larger droplet size. As discussed above, this is probably partly due to the lower
interfacial tension of the triglyceride/aqueous interface compared with the caraway
oil/aqueous interfacial tension. Another effect might be differences in surface coverage. The
higher total surface area of the caraway oil emulsions might not be completely covered with
lipids or proteins, which in turn would lead to an increased coalescence of the emulsion
droplets. Judging from the adsorption data presented in Table 6.1, almost 50% of the available
protein from a 1% solution was adsorbed at the droplet surface of the caraway oil emulsion in
the absence of sb-PC. In the emulsions containing 2% P-lactoglobulin, only about 30% of
added protein is depleted from the solution during emulsification. We also observed a greater
stability for both oils, which is further increased if sb-PC is added. Thus, one might speculate
that the gaps in the coverage of protein are filled in with sb-PC. The only aspect which does
not fit in with this view is the high protein surface load we recorded, and this will be
discussed elsewhere.
The properties of the oil/water interface were further investigated by in situ ellipsometry and
the experimental data are summarised in Table 6.2. The values given here were measured 1 h
after adding the oil (with or without sb-PC) or injecting the protein. The measured A-values
for both the olive oil and the caraway oil/aqueous interfaces were around 180°. This means
that no layer is present between the oil/water interface or if a layer is present it must have the
same refractive index as either the water or the oil. It should be noted that very pure oils were
used. When sb-PC is added to the oil we see marked changes in the A-values. If we first
consider the caraway/sb-PC mixture, the amount adsorbed seems to be independent of the sb-
PC concentration used within the given concentration range (1-5% in the oil). No time
dependence of the adsorption could be detected. The value -1.4 mg m"2 compares well with
113
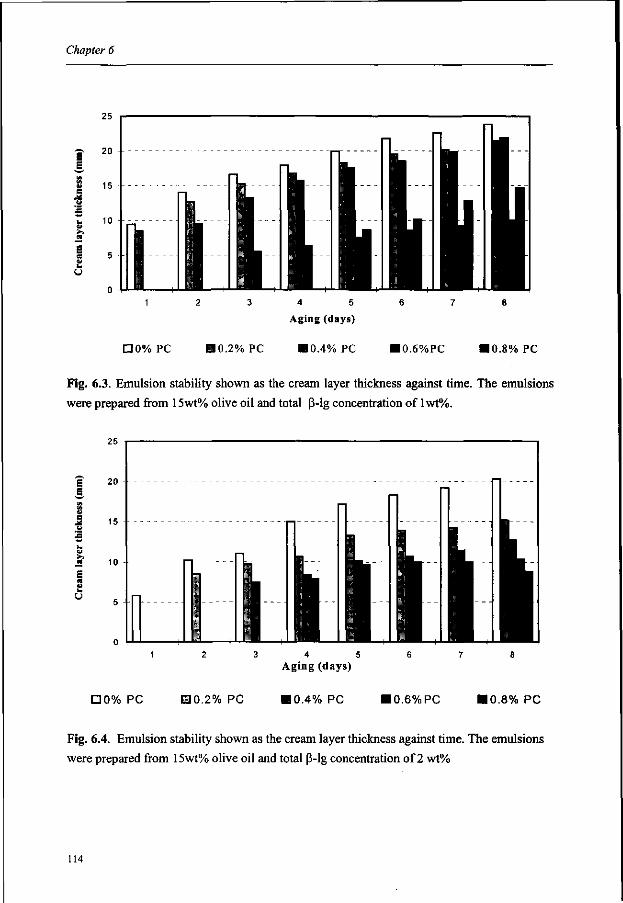
Chapter 6
-P 20 4-
D0% PC 10.2% PC
Aging (days)
• 0.4% PC I0.6%PC 10.8% PC
Fig. 6.3. Emulsion stability shown as the cream layer thickness against time. The emulsions
were prepared from 15wt% olive oil and total p-lg concentration of lwt%.
• 0% PC 10.2% PC
4 5
Aging (days)
• 0.4% PC 10.6% PC 10.8% PC
Fig. 6.4. Emulsion stability shown as the cream layer thickness against time. The emulsions
were prepared from 15wt% olive oil and total P-lg concentration of 2 wt%
114
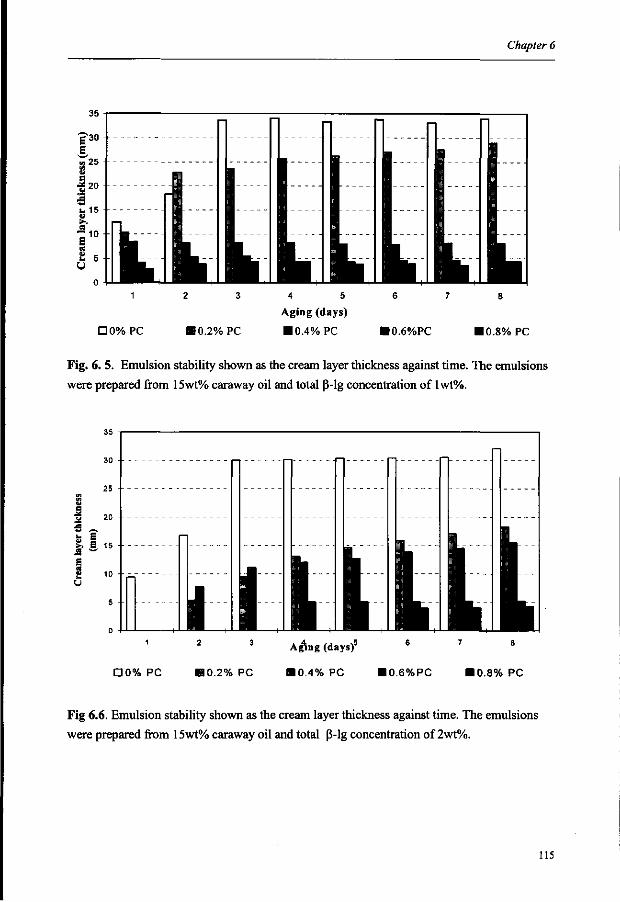
Chapter 6
• 0% PC 10.2% PC
4 5
Aging (days)
• 0.4% PC I0.6%PC 10.8% PC
Fig. 6. 5. Emulsion stability shown as the cream layer thickness against time. The emulsions
were prepared from 15wt% caraway oil and total P-lg concentration of lwt%.
D 0 % PC 10.2% PC
Aging (days)5
10.4% PC I0.6%PC 10.8% PC
Fig 6.6. Emulsion stability shown as the cream layer thickness against time. The emulsions
were prepared from 15wt% caraway oil and total P-lg concentration of 2wt%.
115
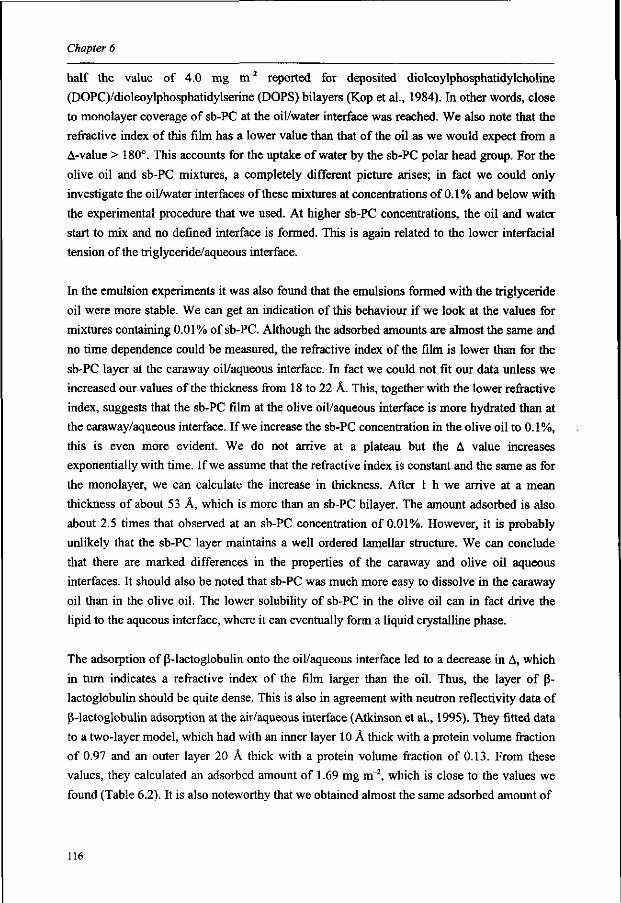
Chapter 6
half the value of 4.0 mg nT2 reported for deposited dioleoylphosphatidylcholine
(DOPC)/dioleoylphosphatidylserine (DOPS) bilayers (Kop et al., 1984). In other words, close
to monolayer coverage of sb-PC at the oil/water interface was reached. We also note that the
refractive index of this film has a lower value than that of the oil as we would expect from a
A-value > 180°. This accounts for the uptake of water by the sb-PC polar head group. For the
olive oil and sb-PC mixtures, a completely different picture arises; in fact we could only
investigate the oil/water interfaces of these mixtures at concentrations of 0.1% and below with
the experimental procedure that we used. At higher sb-PC concentrations, the oil and water
start to mix and no defined interface is formed. This is again related to the lower interfacial
tension of the triglyceride/aqueous interface.
In the emulsion experiments it was also found that the emulsions formed with the triglyceride
oil were more stable. We can get an indication of this behaviour if we look at the values for
mixtures containing 0.01% of sb-PC. Although the adsorbed amounts are almost the same and
no time dependence could be measured, the refractive index of the film is lower than for the
sb-PC layer at the caraway oil/aqueous interface. In fact we could not fit our data unless we
increased our values of the thickness from 18 to 22 A. This, together with the lower refractive
index, suggests that the sb-PC film at the olive oil/aqueous interface is more hydrated than at
the caraway/aqueous interface. If we increase the sb-PC concentration in the olive oil to 0.1%,
this is even more evident. We do not arrive at a plateau but the A value increases
exponentially with time. If we assume that the refractive index is constant and the same as for
the monolayer, we can calculate the increase in thickness. After 1 h we arrive at a mean
thickness of about 53 A, which is more than an sb-PC bilayer. The amount adsorbed is also
about 2.5 times that observed at an sb-PC concentration of 0.01%. However, it is probably
unlikely that the sb-PC layer maintains a well ordered lamellar structure. We can conclude
that there are marked differences in the properties of the caraway and olive oil aqueous
interfaces. It should also be noted that sb-PC was much more easy to dissolve in the caraway
oil than in the olive oil. The lower solubility of sb-PC in the olive oil can in fact drive the
lipid to the aqueous interface, where it can eventually form a liquid crystalline phase.
The adsorption of (3-lactoglobulin onto the oil/aqueous interface led to a decrease in A, which
in turn indicates a refractive index of the film larger than the oil. Thus, the layer of |J-
lactoglobulin should be quite dense. This is also in agreement with neutron reflectivity data of
P-lactoglobulin adsorption at the air/aqueous interface (Atkinson et al., 1995). They fitted data
to a two-layer model, which had with an inner layer 10 A thick with a protein volume fraction
of 0.97 and an outer layer 20 A thick with a protein volume fraction of 0.13. From these
values, they calculated an adsorbed amount of 1.69 mg m"2, which is close to the values we
found (Table 6.2). It is also noteworthy that we obtained almost the same adsorbed amount of
116
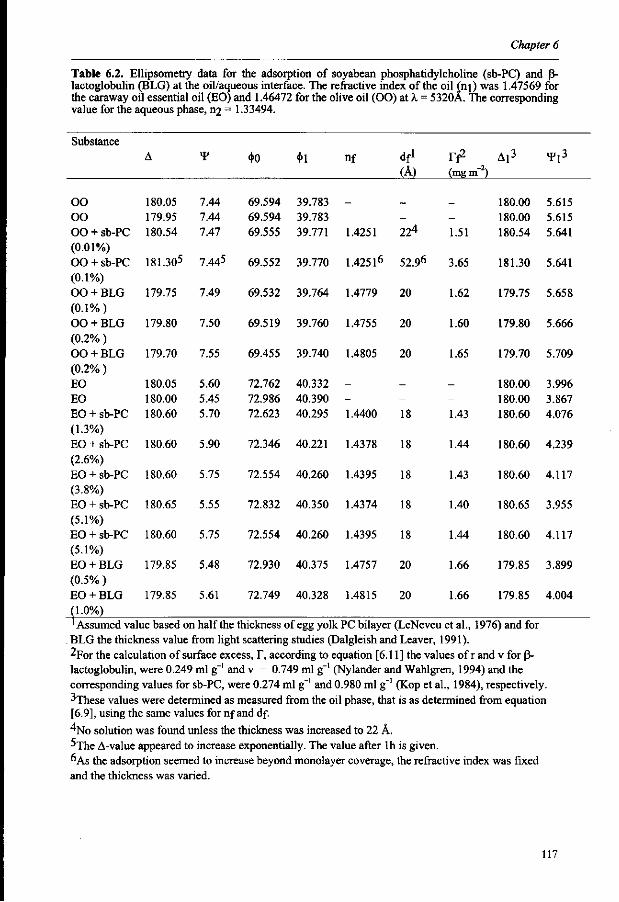
Chapter 6
Table 6.2. Ellipsometry data for the adsorption of soyabean phosphatidylcholine (sb-PC) and p-lactoglobulin (BLG) at the oil/aqueous interface. The refractive index of the oil (nj) was 1.47569 for the caraway oil essential oil (EO) and 1.46472 for the olive oil (00) at X = 5320A. The corresponding value for the aqueous phase, n2 = 1.33494.
Substance
OO
oo OO + sb-PC (0.01%) OO + sb-PC (0.1%) OO + BLG (0.1%) OO + BLG (0.2% ) 0 0 + BLG (0.2% ) EO EO EO + sb-PC (1.3%) EO + sb-PC (2.6%) EO + sb-PC (3.8%) EO + sb-PC (5.1%) EO + sb-PC (5.1%) EO + BLG (0.5%) EO + BLG (1.0%)
A
180.05 179.95 180.54
181.305
179.75
179.80
179.70
180.05 180.00 180.60
180.60
180.60
180.65
180.60
179.85
179.85
¥
7.44 7.44 7.47
7.445
7.49
7.50
7.55
5.60 5.45 5.70
5.90
5.75
5.55
5.75
5.48
5.61
<t>0
69.594 69.594 69.555
69.552
69.532
69.519
69.455
72.762 72.986 72.623
72.346
72.554
72.832
72.554
72.930
72.749
< ( > 1
39.783 39.783 39.771
39.770
39.764
39.760
39.740
40.332 40.390 40.295
40.221
40.260
40.350
40.260
40.375
40.328
nf
-1.4251
1.42516
1.4779
1.4755
1.4805
-1.4400
1.4378
1.4395
1.4374
1.4395
1.4757
1.4815
df1
(A)
-224
52.96
20
20
20
-18
18
18
18
18
20
20
F f 2 (mg m 2)
-1.51
3.65
1.62
1.60
1.65
-1.43
1.44
1.43
1.40
1.44
1.66
1.66
Al3
180.00 180.00 180.54
181.30
179.75
179.80
179.70
180.00 180.00 180.60
180.60
180.60
180.65
180.60
179.85
179.85
xj/j3
5.615 5.615 5.641
5.641
5.658
5.666
5.709
3.996 3.867 4.076
4.239
4.117
3.955
4.117
3.899
4.004
1 Assumed value based on half the thickness of egg yolk PC bilayer (LeNeveu et al., 1976) and for BLG the thickness value from light scattering studies (Dalgleish and Leaver, 1991). ^For the calculation of surface excess, T, according to equation [6.11] the values of r and v for [3-lactoglobulin, were 0.249 ml g~' and v = 0.749 ml g"1 (Nylander and Wahlgren, 1994) and the corresponding values for sb-PC, were 0.274 ml g"' and 0.980 ml g"1 (Kop et al., 1984), respectively. ^These values were determined as measured from the oil phase, that is as determined from equation [6.9], using the same values for nf and df.
^No solution was found unless the thickness was increased to 22 A. ->The A-value appeared to increase exponentially. The value after lh is given. °As the adsorption seemed to increase beyond monolayer coverage, the refractive index was fixed and the thickness was varied.
117
Chapter 6
P-lactoglobulin at the olive oil/aqueous as at the caraway oil/aqueous interface. There was
also no dependence of the protein concentration within the limited protein concentration range
investigated (from 0.1 to 1%). Elofsson et al (1997) determined the adsorption isotherms for
the (3-lactoglobulin variants A and B on hydrophobised silica surfaces using ellipsometry.
They found large differences in the adsorption isotherms, which could be directly correlated
with the self-association of the protein. However, at about 0.1% a plateau in the adsorption
isotherms was reached for both genetic variants, where both gave an adsorbed amount of
about 2.5 mg m"2. This is only slightly higher than that observed for the air/water and
oil/water interfaces, but larger conformational changes are expected to occur when the protein
adsorbs at a liquid interface rather than a solid surface. In this case, the area per molecule will
be larger and the amount adsorbed will be less.
The protein surface concentrations on both types of droplet surface, as determined from
solution depletion measurements, are substantially higher (Table 6.1). In olive oil emulsions,
surface concentrations of 7.91 and 8.44 mg m"2 were recorded for 1 and 2% P-lactoglobulin,
respectively. For the caraway oil emulsions, these values were lower (5.04 and 6.45 mg m~2,
respectively), due to smaller droplet sizes and thus higher surface area created during the
homogenisation. Dickinson et al. (1989) reported values of 3.0 mg m"2 for P-lactoglobulin
surface coverage on n-tetradecane emulsion droplets. However, they used a larger amount of
oil (20%) and a lower protein concentration (0.5%). It should be noted that determining the
absolute surface excess by the solution depletion method is enough complicated thing and our
purpose was mainly to record the trends. When separating the oil from the serum,
proportionally more of the protein might be associated with the oil droplets, thus leading to an
overestimation of the amount adsorbed. One way to overcome this problem is to wash the
separated cream and determine its protein concentration. However, the risk then is that some
of the protein might desorb. The other source of error is the determination of droplet size.
With the method used we can only measure droplets in the um-scale. Any smaller droplets,
which will contribute proportionally more to the surface area than larger particles of the same
total volume, are not taken into account. Thus it is likely that we will underestimate the total
surface area and hence overestimate the amount adsorbed. It is also possible that some of the
protein will denature and precipitate out from the solution during the harsh mechanical
treatment involved in the emulsification process. This will also lead to an overestimation of
the amount adsorbed. The fact that our ellipsometry data indicate that the same amount of P-
lactoglobulin is adsorbed on the olive oil/aqueous as on the caraway oil/aqueous interface
does not necessarily contradict the results obtained from the solution depletion measurements.
The significantly larger protein surface excess determined for the olive oil/aqueous interface
may have to do with differences in surface-to-volume ratio. In the ellipsometry experiment,
we found a constant surface area-to-oil volume ratio of 20 cm2:10 cm3 (or about 2 cm"1). The
118
Chapter 6
corresponding value for the olive oil/aqueous emulsion is 4n(1.75 10^*)2/((4/3)7t(l .75 10" 4)3) = 3/1.75 10"4 -1.7 104 cm"1 and for the caraway oil/aqueous emulsion it is about 2.9 104
cm"1. Thus, in the ellipsometry experiments, the bulk solution has to supply an area about
9000-15000 times smaller than in the emulsion experiments. The ellipsometry measurements
show that P-lactoglobulin has the same affinity to the two types of oil interfaces, provided that
it is not limited by the amount of available protein. The larger amount adsorbed obtained from
the solution depletion measurements on the olive oil/aqueous interface compared with the
caraway oil/aqueous interface correlates with the large surface area-to-volume ratio of the
latter interface. As suggested above, the adsorption at the caraway oil/aqueous interface is
limited by the amount of protein available relative the adsorption at the olive oil/aqueous
interface.
Finally we did some measurements of the P-lactoglobulin adsorption at the interface between
buffer and the caraway oil containing sb-PC (data not shown). Here the presence of the
protein did not have any effect on the ellipsometry angles. This means that the protein does
not become adsorbed to the sb-PC coated oil/water interface. Malmsten (1994) reported that
the adsorption of serum proteins is generally significantly less on a phosphatidylcholine-
coated solid surface compared with a hydrophobic surface. It must also be borne in mind that
ellipsometry only measures the effective amount at the interfaces. Thus, the composition of
the interface layer might change (e. g. a mixed protein layer may be formed), while the total
amount adsorbed is the same. The solution depletion measurements of the amount adsorbed
on emulsion droplets suggest that some protein remains at the interface even at the highest sb-
PC concentration. We again stress that the surface area in the emulsification experiments was
several orders of magnitude larger.
ACKNOWLEDGEMENTS
We wish to thank Bengt Jonsson and Bjorn Bergenstahl for useful suggestions and fruitful
discussions. Christel Timmer-Keetels of Borculo Domo Ingredients, The Netherlands, is
thanked for supplying the P-lactoglobulin sample. Financial support was obtained from the
Nordic Academy for Advanced Studies (NorFA) (Project no 9915033-0, Milk Protein
Structure and Functional Properties), the Swedish Research Council for Engineering Sciences
(TFR) and EU-FAIR Concerted Action (MADGELAS, Contract No. CT961202).
119
Chapter 6
REFERENCES
Atkinson, P.J.; Dickinson, E.; Home, D.S.; Richardson, R.M. Neutron reflectivity of adsorbed
P-casein and (}-lactoglobulin at the air/water interface. J. Chem. Soc. Faraday Trans.
1995,91,2847-2854.
Azzam, R.M.A.; Bashara, N.M. Ellipsometry and Polarized Light. North Holland Elsevier
Science Publishers, Amsterdam, 1987.
Bergenstahl, B.A.; Claesson, P.M. Surface forces in emulsions. In Food Emulsions. 3rd ed.,
Eds. Larsson, K.; Friberg, S.E.; Marcel Dekker, New York, NY, 1997; pp57-109.
Brownlow, S.; Morais Cabral, J.H.; Cooper, R.; Flower, D.R.; Yewdall, S.J.; Polikarpov, I.;
North, A.C.T.; Sawyer, L. Bovine P-lactoglobulin at 1.8 A resolution - still an enigmatic
lipocalin. Structure, 1997, 5, 481-495.
Bottcher, C.J.F.; Bordewijk, P. Theory of electric polarization. Volume 2. Time-dependent
fields, Elsevier, Amsterdam, 1978.
Chen, J.; Dickinson, E Time-dependent competitive adsorption of milk proteins and
surfactants in oil-in-water emulsions. J. Sci. FoodAgric. 1993, 62, 283-289.
Courthaudon, J.L.; Dickinson, E.; Christie, W.W. Competitive adsorption of lecithin and P-
casein in oil-in-water emulsions. J. Agric. Food Chem. 1991a,. 39, 1365-1368.
Courthaudon, J.L.; Dickinson, E.; Dalgleish, D.G. Competitive adsorption of p-casein and
nonionic surfactants in oil-in-water emulsions. J. Coll. Int. Sci. 1991b, 145, 390-395.
Courthaudon, J.L.; Dickinson, E.; Matsumura, Y.; Williams, A. Influence of emulsifier on the
competitive adsorption of whey proteins in emulsions. Food Struct. 1991c, 10,109-115.
Courthaudon, J.L.; Dickinson, E.; Matsumura, Y.; Clark, D.C. Competitive adsorption of P-
lactoglobulin + Tween 20 at the oil- water interface. Colloids Surf. 1991d, 56, 293-300.
Cuypers, P. A.; Corsel, J. W.; Janssen, M. P.; Kop, J. M. M.; Hermens, W. Th.; Hemker, H.
C. The adsorption of prothrombin to phosphatidylserine multilayers quantitated by
ellipsometry. J. Biol. Chem. 1983, 258, 2426-2431.
Dalgleish, D.G.; Euston, S.E.; Hunt, J.A.; Dickinson, E. Competitive adsorption of _-
lactoglobulin in mixed protein emulsions. In: Food polymers, gels and colloids; ed.
E.Dickinson. Royal Society of Chemistry, Cambridge, 1991; pp 485-489.
Dagleish, D. G.; Leaver, J. Dimensions and possible structures of milk proteins at oil-water
interfaces. In Food Polymers, Gels and Colloids, ed. E. Dickinson. Royal Society of
Chemistry, Cambridge, UK, 1991; pp 113-122.
De Feijter, J.A.; Benjamins, J.; Veer, F. A. Ellipsometry as a tool to study the adsorption
behaviour of synthetic and bioploymers at the air-water interface. Biopolymers 1978, 17,
1759-1772.
De Wit, J.N. Functional properties of whey proteins. In Developments in Food Chemistry 4,
ed. P.F. Fox. Elsevier Applied Science, London, 1989, pp 285-321.
120
Chapter 6
Dickinson, E.; Owusu, R.K.; Sze Tan; Williams, A. Oil - soluble surfactants have little effect
on competitive adsorption of a-lactalbumin and p-lactoglobulin in emulsions. J. Food
Sci. 1993, 58, 295-598.
Dickinson, E.; Iveson, G. Adsorbed films of P-lactoglobulin + lecithin at the hydrocarbon-
water and triglyceride - water interfaces. Food Hydrocolloids, 1993, 6, 533-541.
Dickinson, E.; Tanai, S. Protein displacement from the emulsion droplet surface by oil-
soluble and water soluble surfactants". J. Agric. Food Chem. 1992, 40,179-183.
Dziezak, J.D. Microencapsulation and encapsulated ingredients. Food Techn. 1988, 42, 136-
151.
Elofsson, U. M.; Paulsson, M. A.; Arnebrant, T. Adsorption of p-lactoglobulin A and B in
relation to self-association: Effect of concentration and pH. Langmuir 1997, 13, 1695-
1700.
Faldt, P.; Bergenstahl, B. Spray-dried whey protein/lactose/soybean oil emulsions. 1. Surface
composition and particle structure. Food Hydrocolloids, 1996a, 10, 421-429.
Faldt, P.; Bergenstahl, B. Spray-dried whey protein/lactose/soybean oil emulsions.
2.Redispersibility, wettability and particle structure. Food Hydrocolloids, 1996b, 10,
431-439.
Fang, Y.; Dalgleish, D.G. Casein adsorption on the surfaces of oil-in-water emulsions
modified by lecithin. Coll. Surf. B: Biointerfaces, 1993, 1, 357-364.
Fisher, L.R.; Mitchell, E.E.; Parker, N.S. Interfacial tensions of commercial vegetable oils
with water. J. Food Sc. 1985, 50, 1201-1202.
Fligner, K.L.; Fligner, M.A.; Mangino, M.E. The effects of compositional factors on the
short-term physical stability of a concentrated infant formula. Food Hydrocolloids, 1990,
4, 95-104.
Green, D.W.; Aschaffenburg, R. Two fold symmetry of the P-lactoglobulin molecule in
crystals. J. Molec. Biol. 1959, 1, 54-64.
Handbook of Chemistry and Physics, CRC Press, Cleveland, 1974.
Harke, M.; Teppner, R.; Schulz, O.; Motschmann, H.; Orendi, H. Description of a single
modular optical setup for ellipsometry, surface plasmons, waveguide modes, and their
corresponding imaging techniques including Brewster angle microscopy. Review of
Scientific Instruments 1997, 68, 3130-3134.
Home, D.S.; Atkinson, P J.; Dickinson, E.; Pinfield, V.J.; Richardson, R. M. Neutron
reflectivity study of competitive adsorption of P-lactoglobulin and nonionic surfactant at
the air-water interface. Int. Dairy J. 1998, 8, 73-77.
Jackson, L. S.; Lee, K. Microencapsulation in the food industry. Lebensm. - Wiss. Technol.
1991, 24, 289-297.
121
Chapter 6
Kim,Y.D.; Morr, C.V.; Schenz, T.W. Microencapsulation properties of gum arabic and
several food proteins: liquid orange oil emulsion particles. J. Agric.Food Chem. 1996, 44,
1308-1313.
Kim,Y.D.; Morr, C.V. Microencapsulation properties of gum arabic and several food proteins:
spray-dried orange oil emulsion particles. J. Agric.Food Chem. 1996, 44, 1314-1320.
Kinsella, J.E. Milk proteins: physicochemical and functional properties. Crit. Rev. Food Sci.
Nutr. 1990,21,197-262.
Kinsella, J.E.; Whitehead, D.M. Proteins in whey: chemical, physical and functional
properties. Adv. Food Nutr.Res. 1989, 33, 343-438.
Kinsella, J.E.; Whitehead, D.M.; Brady J.; Bringe N.A. Milk proteins: possible relationships
of structure and function. In Developments in Food Chemistry 4. Functional Milk
proteins; ed. P.F. Fox, Elsevier Applied Science Publishers: London, 1989; pp 55-95.
Kop, J.M.M.; Cuypers, P.A.; Lindhout, T.; Hemker, H. C; Hermens, W.Th. The adsorption of
prothrombin to phospholipid monolayers quantitated by ellipsometry. The J. Biol. Chem.,
1984,259,13993-13998.
Kull, T.; Nylander, K.; Tiberg, F.; Wahlgren, N.M. Effect of surface properties and added
electrolyte on the structure of p-casein layers adsorbed at the solid/aqueous interface.
Langmuir 1997, 13, 5141-5147.
Kurihara, K.; Katsuragi, Y. Specific inhibitor for bitter taste. Nature, 1993,365, 213-214.
LeNeveu, D.M.; Rand, R.P.; Parsegian, A.V. Measurements of forces between lecithin
bilayers. Nature 1976, 259, 601-603.
Lowry, O.H.; Rosebrough, N.J.; Farr, A.L.; Randall, R.J. Protein measurement with the folin
phenol reagent. The J.Biol. Chem. 1951, 193,265-275.
Mackie, A.K.; Mingins, J.; Dann, R.; North, A.N. Preliminary studies of p-lactoglobulin
adsorbed on polystyrene latex. In Food Polymers, Gels and Colloids, ed. E. Dickinson.
Royal Society of Chemistry, Cambridge, UK, 1991; pp 96-112.
Mahanty, J.; Ninham, B. W. Dispersion forces. Academic Press, London, 1976.
Malmsten, M. Ellipsometry studies of protein adsorption at lipid surfaces. J. Colloid Inter/.
Sci., 1994,168,247-254.
McCrackin, F.L.; Passaglia, E.; Stromberg, R.R.; Steinberg, H.L. Measurements of the
thickness and refractive index of very thin films and the optical properties of surfaces by
ellipsometry. J.Res.National Bureau Stand. -A. Phys.Chem. 1963, 67A, 363-377.
Moreau, D.L.; Rosenberg, M. Oxidative stability of anhydrous milkfat microencapsulated in
whey proteins. J.Food Sci. 1996, 61, 39-43.
Morr, C.V. Functional properties of milk proteins an their use as food ingredients. In
Developments in Dairy Chemistry, ed. P.F.Fox. Applied Sci., London, United Kingdom,
1982;p.375
122
Chapter 6
Morr, C.V.; Ha, E.Y.W. Whey protein concentrates and isolates: processing and functional
properties. CRC Crit.Rev. FoodSci. Nutr., 1993,33,431-476.
Nylander, T.; Wahlgren, N. M. Competitive and sequential adsorption of (J-casein and (}-
lactoglobulin on hydrophobic surfaces and the interfacial structure of (3-casein. J.Colloid
Inter/. Sci. 1994,162, 151-162.
Pearce, K.N.; Kinsella, J.E. Emulsifying properties of proteins: evaluation of a turbidimetric
technique. J. Agric. Food Chem, 1978, 26, 716-723.
Rish, S.J.; Reineccius, G.A. Spray-dried orange oil: effect of emulsion size on flavor retention
and shelf stability. In Flavor encapsulation, eds.. Rish, S.J.; Reineccius, G.A.; ACS
symposium series 370; American Chemical Society: Washington, D.C., 1988; pp 67-77.
Rosenberg, ML; Young, S.L. Whey proteins as microencapsulating agents.
Microencapsulation of anhydrous milkfat-structure evaluation. Food Struct. 1993,12, 31-
41.
Sawyer, L.; Brownlow, S.; Polikarpov, I.; Wu, S.-Y. P-Lactoglobulin: Structural studies,
biological clues. Int. Dairy J. 1998, 8, 65-72.
Sheu, T.Y.; Rosenberg, M. Microencapsulation of volatiles by whey proteins. J.Dairy Sci.
1993, 76 (Suppl.l), 28.
Shimizu, M.; Saito, M.; Yamauchi, K. Emulsifying and structural properties of (3-
lactoglobulin at different pHs. Agric. Biol. Chem. 1985, 49, 189-194.
Shinoda, K.; Araki, M.; Sadaghiani, A.; Khan, A.; Lindman, B. Lecithin-based
microemulsions: Phase behavior and microstructure. J.Physical Chem. 1991, 95, 989-
993.
Tomas, A.; Courthaudon, J.C.; Paquet, D.; Lorient, D. Effect of surfactant on some physico-
chemical properties of dairy oil-in-water emulsions. Food Hydrocolloids, 1994, 8, 543-
553.
Walstra, P. The role of proteins in the stabilisation of emulsions. In Gums and Stabilisers for
the Food Industry. Eds. G.O.Phillips, P.A.Williams. IRL Press: Washington, DC, 1988;
pp 323-336.
Wang, J.; Andrade, J.D.; Lin, J.; Christensen, D.A. Improved sensitivity in ellipsometry of
thin biochemical films by employing sublayers. In Modeling of Optical Thin Films II, ed.
M. R. Jacobson. Proceedings ofSPIE—The International Society for Optical Engineering
1990; pp 72-78.
Yamamoto, Y.; Araki, M. Effects of lecithin addition in oil or water phase on the stability of
emulsions made with whey proteins. Bioscience Biotechn. Biochem. 1997, 61, 1791-
1795.
123
CHAPTER 7
PROPERTIES OF CARAWAY ESSENTIAL OIL
ENCAPSULATED INTO MILK PROTEIN-BASED MATRICES
This chapter is based on the following articles/manuscripts:
1. Venskutonis, R.; Bylaite, E.; Narkevicius, R. Optimisation of encapsulation conditions of caraway (Carum carvi L.) essential oil. In Proceedings of the 2nd main meeting of EC Copernicus Concerted Action "Process Optimisation and Minimal Processing of Foods" 1996, Vol. 3 "Drying", ed. J.C. Oliveira, pp 95-101.
2. Bylaite, E.; Venskutonis, R.; Kvietkauskaite, D. Encapsulation of caraway {Carum carvi L.) essential oil in different matrices. In Proceedings of the International Workshop on Bioencapsulation VI "From Fundamentals to Industrial Applications", eds. F.Godia, D.Poncelet, Universitat Autonoma de Barcelona, talk 5.1,1997.
3. Bylaite, E.; Venskutonis, R. Stability of microencapsulated caraway {Carum carvi L.) essential oil during storage. In Proceedings of the 3r main meeting of EC Copernicus Concerted Action "Process Optimisation and Minimal Processing of Foods", Vol. 3 "Drying", eds. J.C. Oliveira and F.A.R. Oliveira, 1997, pp 81-87.
4. Bylaite, E.; Venskutonis, R.; Mazdzieriene, R. Properties of encapsulated caraway essential oil into milk proteins based matrices. Submitted to J. Agric. Food Chem.
Chapter 7
ABSTRACT
The encapsulating properties of whey protein concentrate (WPC), skimmed milk powder
(SMP) and their mixtures with maltodextrines (MD) for the encapsulation of caraway
essential oil by spray drying were evaluated. Encapsulation efficiency (EE) was higher in
WPC-based than in SMP-based matrices. Partial replacement of WPC by different MD
increased the retention of volatiles during spray drying and enhanced the protective properties
of solidified capsules to oxidation and the release of volatiles during storage. The opposite
tendency was shown by SMP matrices: adding MD to the wall composition resulted in a lower
retention of volatiles during drying and lower stability of oxidation compared with sole SMP
and all WPC matrices. Dynamic headspace analysis (DHS) was applied to determine the
release rate of volatiles from the microencapsulated caraway oil particles. The results revealed
that combined matrices of SMP and carbohydrates had the highest volatile release rate. Partial
replacement of WPC by MD significantly reduced the release of volatiles from capsules as
determined by DHS. The flavour profile of caraway oil entrapped in the matrices was similar
to that in pure essential oil: a slight decrease in limonene content was recorded in some
matrices. Scanning electron microscopy (SEM) results for microencapsulated particles
showed WPC-based matrices to have fewer visible cracks and holes compared with SMP-
based matrices. More dented surfaces could be observed on particles with MD as compared to
sole WPC.
It was concluded that WPC-based matrices were more effective as caraway oil encpsulating
agents than those using SMP. On the basis of the results for EE, DHS, and stability against
oxidation, it was shown that the incorporation of carbohydrates into WPC results in the
production of more effective microencapsulants.
INTRODUCTION
Flavour compounds are rather volatile liquids and generally thermally or chemically labile in
native conditions. Microencapsulation has become an attractive approach to converting liquid
food flavourings into a dry, free-flowing powder form which is easy to handle and incorporate
into a dry food system (Jackson and Lee, 1991). The process is defined as a physical one
where thin films or polymer coats are applied to small solid particles, droplets of liquids or
126
Chapter 7
gases (Bakan, 1973). Besides the change in the physical characteristics of the original
material, food flavours are encapsulated for several other reasons: (1) to retain them in a food
product during storage; (2) to protect the flavour from undesirable interactions with the food;
(3) to minimise flavour/flavour interactions within a mixture; (4) to guard against light, heat,
moisture or air induced reactions or oxidation; (5) to deliver the controlled or delayed release
of flavour; and (6) to mask objectionable flavours (Reineccius, 1991). Microencapsulation can
be accomplished by different techniques: spray drying, spray chilling and spray cooling,
extrusion, air suspension coating, multi-orifice centrifugal extrusion, coacervation/phase
separations, liposome entrapment, inclusion complexion, co-crystallisation, and interfacial
polymerisation (Dziezak, 1988; Jackson and Lee, 1991). However, spray drying remains the
preferred method for encapsulating flavours due to its low cost and readily available
equipment, although there are disadvantages to this method, e.g. the loss of volatiles,
degradation of sensitive compounds and the need for further fine powder processing such as
agglomeration to instantise the dried material or make it more readily soluble if it is for a
liquid application (Reineccius, 1988; Rish, 1995). Leaflash spray drying modification has
been proposed in which the drying air is at very high temperature (300^100°C) and flows at a
very high velocity (Bhandari et al., 1992). It was found that citral and linalyl acetate could be
spray dried with little impact on the compounds themselves.
Different types of coating materials have been used to produce microcapsules, including
gums, carbohydrates, celluloses, lipids, inorganic materials and proteins. However,
carbohydrate-based matrices (gums, maltodextrins, modified starch, and corn syrup solids)
predominate in flavour encapsulation (Beatus et al., 1985; Chang et al., 1988; Rish and
Reineccius, 1988; Trubiano and Lacourse, 1988; Bangs and Reineccius, 1990; Rosenberg et
al., 1990; Reineccius, 1991; Bhandari et al., 1992, 1998, 1999; Thevenet, 1995; Kollengode
and Hanna, 1997; Chattopadhyayja et al., 1998; Che Man et al., 1999; Zeller et al., 1999). The
main disadvantage of most carbohydrate coating materials is their low emulsifying capacity
and marginal retention of volatiles. Various functional properties of food proteins, i.e.
solubility, viscosity, emulsification, film formation, the ability to interact with water, small
ions and other polymers, groupings at the oil/water interface allowing emulsion droplets to
stabilise (Kinsella, 1990; Morr and Ha, 1993; Walstra, 1988), represent many of the
characteristics that are desirable for a wall material. However, the literature on the use of food
127
Chapter 7
proteins as coating materials for flavourings is rather scanty. Studies of interactions between
various food proteins and volatile compounds have shown that proteins usually possess a high
binding capacity for the flavour constituents (O'Neil, 1996). It was found that the flavour
binding mechanism to proteins depends on the relationships between conformational states of
proteins (Kinsella and Damodaran, 1980; 1981; O'Neil and Kinsella, 1987) and the nature of
the aromatic compounds (Dufour and Haertle, 1990; Landy et al., 1995). Special attention has
been given to p-lactoglobulin, the most abundant protein in whey. Papiz et al. (1986)
postulated that it belongs to the superfamily of proteins involved in strong interactions with
small hydrophobic molecules. Other studies have focused on the binding of selected flavour
compounds, such as aldehydes, ketones, esters, acids, pyrazines, aromatic compounds or
terpenes (O'Neil and Kinsella, 1987; Dufour and Haertle, 1990; Boudaud and Dumont, 1994;
Charles et al, 1996; Jouenne and Crouzet, 1996; Pelletier et al., 1998). Hydrophobic
interactions were found for ketones, esters and alcohols and covalent or hydrogen binding was
found with aldehydes (Jasinski and Kilara, 1985; O'Neil and Kinsella, 1987; Dufour and
Haertle, 1990; Charles et al., 1996; Pelletier et al., 1998). However, the data obtained often
differed between these authors, due to different experimental conditions and methodologies
being used. Some investigations have proved that milk proteins function well for
encapsulating anhydrous milk fat, soybean, palm-based oils and methyl linoleate (Moreau and
Rosenberg, 1993, 1996, 1998, 1999; Rosenberg and Young, 1993; Young et al., 1993a,b;
Onwulata et al., 1994, 1996; Faldt and Bergenstahl, 1996a,b; Noor Lida Habi Mat Dian et al.,
1996; Minemoto et al., 1997; McNamee et al., 1998; Sheu and Rosenberg, 1998; Pauletti and
Amestoy, 1999). Nevertheless, on the basis of the chemical and physico-chemical properties
of the investigated proteins, it is likely that they are suitable for being used as wall material for
flavour encapsulation via spray drying. To our knowledge, flavour encapsulation into protein-
based matrices has been comparatively little investigated. Also no reports have been found on
the microencapsulation of many of the less commercially important essential oils (i.e. other
than citrus, mint, onion and garlic). In 1996 the microencapsulation properties of gum arabic
and several food proteins (whey protein isolate (WPI), soy protein isolate (SPI) and sodium
caseinate (SC)) were investigated by Kim and Morr (1996) and Kim et al (1996). It was found
that SPI was the most effective matrix for retaining orange oil during spray drying of the
liquid orange oil emulsions (encapsulation effectiveness was 85.7%), followed by SC
(81.7%), gum arabic (GA) (75.9%) and WPI (72.2%). Results of scanning electron
128
Chapter 7
microscopy (SEM) and confocal scanning laser microscopy (CSLM) revealed that spray dried
GA-microencapsulated orange oil particles had undergone more shrinkage during drying than
the protein microencapsulated products.
This study investigates the encapsulating properties of milk proteins and some maltodextrins
for the encapsulation of caraway (Carum carvi L.) essential oil, which is one of the most
popular flavourings used in Lithuania. Evaluation of the effectiveness of the encapsulation
process, resistance to oxidation, flavour profile and release by microencapsulated products, as
well as the outer structure of the spray dried particles, were investigated.
MATERIALS AND METHODS
Materials
Whey protein concentrate (WPC) and skimmed milk powder (SMP) obtained from the local
dairy; maltodextrins (MD): N-Lok (produced from waxy maize), Encaps-855 (produced from
waxy maize) and Capsul-E (produced from tapioca) from National Starch & Chemical, USA;
dried yeast autolysate (YA) and dried yeast extract (YE) from SEMA, Lithuania; corn starch
(CS) and modified starch (MS) Ctex 06205 (an acetyled distarch adipate on waxy maize
starch) from Cerestar; were used as encapsulating agents. Caraway essential oil was purchased
from Frey+Lauhenstedtulzburg, Germany.
Emulsion preparation and drying
Solutions of the coating matrices, 30% concentration (w/w), were prepared by reconstituting
dried powders of WPC and SMP in 50°C deionised water. Maltodextrins were added to
protein matrices in the ratio 1:9 after being dissolved at 80°C. Solutions were allowed to cool
to room temperature and were mixed overnight to enhance hydration. Caraway essential oil
(15% w/w of matrix solids) was warmed to 40°C and emulsified into the hydrated coating
material. Homogenisation was accomplished by Ultra Turrax Ika 25 basic homogeniser (Janke
& Kunkel GmbH & Co. kg) operating at 20 000 rpm for 5 min. Emulsions were spray dried in
129
Chapter 7
a Buchi 190 Mini Spray Dryer under the following conditions: spray nozzle (inlet)
temperature 180±5°C, outlet air temperature 90±5°C; pressure 750-800 mm/T^O. Dried
products were packed into the glass containers and stored in laboratory freezer until
evaluation.
Determination of total oil retained
The content of total oil retained after spray drying was determined by distilling lOg of
encapsulated, dried powders for 3 h in a Clevenger-type apparatus (European Pharmacopoeia).
The weight of oil recovered from the sample and collected in the trap was calculated by
multiplying by a density factor of 0.88 g ml-1. All samples were analysed in duplicate.
Determination of surface oil
Surface oil was washed for 4 h from 10 g samples of powder in a Soxhlet extraction apparatus
using pentane. One millilitre of pentane containing 0.3% (v/v) decane as internal standard was
added to the obtained extract prior to evaporation under nitrogen. Each extract was evaporated
to a final volume of approximately 2 ml under a stream of nitrogen at room temperature. The
amount of oil in the sample was determined by gas chromatography using a Fisons 8000 series
chromatograph with FID under the following conditions: fused silica capillary column DB-5, 30
m length, 0.32 mm i.d. and 0.25 urn film thickness; helium as carrier gas with a linear velocity
35 cm s_1; temperature programming from 50°C with 5 min hold to 220°C increasing at 4°C
min"1; injector temperature 230°C, detector 260°C.
Determination of moisture
Moisture was determined using the toluene distillation method. A 10 g sample of encapsulated
caraway oil was refluxed with 100 ml toluene for 2.5 h in a boiling 250 ml flask fitted with a
Bidwell-Sterling trap and a water-cooled condenser. The volume of the collected water was
read directly from the trap.
130
Chapter 7
Storage stability evaluation
Five g samples of each spray dried microencapsulated product were washed with pentane to
remove the surface oil and were placed in separate 40 ml bottles, tightly capped and stored at
50°C in the dark, and at room temperature both in the presence and absence of light. For
comparison, non-encapsulated caraway essential oil was stored in identical conditions.
Samples for gas chromatographic analysis were prepared according to the method of Risch
and Reineccius (1988). A 0.15g sample of powder was dissolved in 0.85g distilled water.
Then 4 ml acetone containing 0.3% (v/v) decane as internal standard was slowly added.
Solutions were continuously shaken for 2 h, and then the sample was allowed to settle and 1
(j.1 aliquot of the liquid phase was injected into the GC for limonene oxide content analysis
without any further preparation. GC operating conditions were as described in the surface oil
determination section.
Release of volatiles by dynamic headspace analysis (DHS)
The release of caraway oil volatiles from the microencapsulated product was determined by
dynamic headspace analysis (DHS). Five g samples which had been extracted with pentane for
the surface oil determination were placed into a 200 ml sample flask and flushed for 30-240
min with nitrogen carrier gas at a flow rate of 450 ml min_1 to recover the volatiles
accumulated in the headspace during the timed interval. The volatiles trapped in 0.4g Tenax,
TA 35/60 mesh, were desorbed with 15 ml of dimethyl ether. After adding 1 ml of internal
standard (0.3% (v/v) 4-methyl-l-pentanol in dimethyl ether) to the desorbed volatiles, they
were evaporated to a final volume of 1 ml under a stream of nitrogen and analysed by gas
chromatography under the conditions described above.
Scanning electron microscopy (SEM)
A JEOL 840-A model scanning electron microscope was used to investigate the microstructural
properties of spray dried microencapsulated products. Specimens were coated with gold with a
131
Chapter 7
Balzers SCD 004 sputter coater. The operating conditions for the electron microscope were as
follows: working distance 39 mm, acceleration voltage 10 kV.
RESULTS AND DISCUSSION
Retention of volatiles and encapsulation efficiency
Nine constituents were identified in caraway essential oil: a-pinene, sabinene, myrcene,
limonene, cis- and frww-dihydrocarvone, carvone, dihydrocarveol and P-caryophyllene. It is
well known that caraway essential oil consists mainly of limonene and carvone. The first
compound is a hydrocarbon which is also the main constituent of citrus oils, the second is a
terpene ketone, which is an important constituent of such aromatic plants as spearmint and
dill. The main characteristics (total amount of retained oil, surface oil, effectiveness of
encapsulation process and moisture) of the investigated spray dried encapsulated products are
presented in Table 7.1. It should be noted that only traces of oil were hydrodistilled from corn
starch (CS) and modified starch (MS) matrices after spray drying. Only a slight improvement
was achieved by adding some maltodextrins (MD) to CS. Retention of oil in the MD was also
low, up to 25% from the oil added to emulsion. The result shows that these matrices retained
only small amounts of essential oil following the emulsification processes which were used
here. Reineccius (1989) demonstrated that emulsion particle size has a significant effect on
the retention of orange oil in some carbohydrate matrices: the coarser the emulsion (i.e. the
larger the particle size), the poorer is the flavour retention. Since maltodextrins and corn
starch have no good emulsification properties, they produce coarse emulsions and therefore
poor flavour retention during drying. Fine homogenisation at elevated pressures was not
applied to the preparation of emulsions in our study and this factor could be crucial to the
losses of oil during spray drying. Because of their poor capacity to retain volatiles, the
carbohydrate-based matrices were not considered for further investigation. Protein-based
matrices were quite efficient in their retention of caraway essential oil during spray drying.
WPC-based matrices retained more than 80% of the oil added to the emulsion. Among the
two milk derivatives, SMP and WPC, the latter showed a higher retention capacity for
microencapsulation of caraway essential oil. The retained amounts of volatiles in SMP and
132
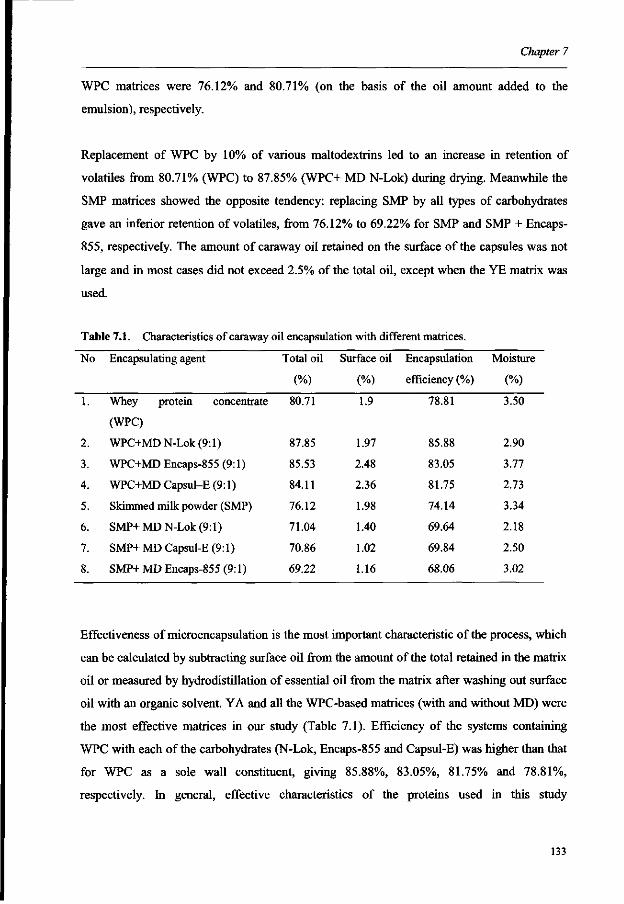
Chapter 7
WPC matrices were 76.12% and 80.71% (on the basis of the oil amount added to the
emulsion), respectively.
Replacement of WPC by 10% of various maltodextrins led to an increase in retention of
volatiles from 80.71% (WPC) to 87.85% (WPC+ MD N-Lok) during drying. Meanwhile the
SMP matrices showed the opposite tendency: replacing SMP by all types of carbohydrates
gave an inferior retention of volatiles, from 76.12% to 69.22% for SMP and SMP + Encaps-
855, respectively. The amount of caraway oil retained on the surface of the capsules was not
large and in most cases did not exceed 2.5% of the total oil, except when the YE matrix was
used.
Table 7.1. Characteristics of caraway oil encapsulation with different matrices.
No
1.
2.
3.
4.
5.
6.
7.
8.
Encapsulating agent
Whey protein concentrate
(WPC)
WPC+MDN-Lok(9:l)
WPC+MD Encaps-855 (9:1)
WPC+MD Capsul-E (9:1)
Skimmed milk powder (SMP)
SMP+MDN-Lok(9:l)
SMP+MD Capsul-E (9:1)
SMP+ MD Encaps-855 (9:1)
Total oil
(%)
80.71
87.85
85.53
84.11
76.12
71.04
70.86
69.22
Surface oil
(%)
1.9
1.97
2.48
2.36
1.98
1.40
1.02
1.16
Encapsulation
efficiency (%)
78.81
85.88
83.05
81.75
74.14
69.64
69.84
68.06
Moisture
(%)
3.50
2.90
3.77
2.73
3.34
2.18
2.50
3.02
Effectiveness of microencapsulation is the most important characteristic of the process, which
can be calculated by subtracting surface oil from the amount of the total retained in the matrix
oil or measured by hydrodistillation of essential oil from the matrix after washing out surface
oil with an organic solvent. YA and all the WPC-based matrices (with and without MD) were
the most effective matrices in our study (Table 7.1). Efficiency of the systems containing
WPC with each of the carbohydrates (N-Lok, Encaps-855 and Capsul-E) was higher than that
for WPC as a sole wall constituent, giving 85.88%, 83.05%, 81.75% and 78.81%,
respectively. In general, effective characteristics of the proteins used in this study
133
Chapter 7
corresponded to the total oil retained in the matrices, because the major part of the essential
oil retained was entrapped in the capsules. Among other factors, the retention of the core
material during microencapsulation by spray drying is affected by the properties and
composition of the emulsion and by the drying conditions (Rosenberg et al., 1990). In light of
the relatively high hydrophobicity of whey proteins, the addition of carbohydrates enhances
the hydrophilic nature of the wall system, which might limit the accessibility of
microencapsulated essential oil to the diffusion process during the distillation. In previously
reported work (Young et al., 1993b), it was also demonstrated that the yield and efficiency of
microencapsulation of anhydrous milk fat (AMF) might be enhanced by selection of wall
components exhibiting different functional properties, e.g. carbohydrates combined with whey
proteins. They demonstrated that micronencapsulation efficiency of systems containing whey
protein isolate (WPI) and each of the surface-active carbohydrates NAT46 and ENC855 was
higher (ca 87% and 89%, respectively) than those obtained for WPI or either of NAT 46 or
ENC 855 carbohydrates as a sole wall material (respectively 35%, 31% and 35%).
However, the addition of MD to SMP did not increase the efficiency of the
microencapsulation process. The efficiency values decreased from 76.12% for SMP to
71.04%, 70.86% and 70.86% for SMP+ N-Lok, SMP+Capsul-E and SMP+Encaps-855,
respectively. Results suggest that in these systems adverse effects were introduced by the
surface-active carbohydrates. The complexity of the properties of the encapsulating materials
used and the processes involved produce rather complex results. Several theories have been
developed to explain the retention of volatiles during the drying of food materials. Volatile
losses during spray drying are associated not only with the interaction between the drying
droplets and the hot air but also with the process of droplet formation-atomisation (Thijssen
and Rulkens, 1968). In 1967, Menting and Hoogstad postulated that volatile materials can
leave drying droplets until the termination of the first stage of drying process, i.e. until a crust
forms around the droplets. Further losses can occur only if the volatiles can pass through the
crust by means of diffusion in the solid or through pores or channels. On the basis of this
explanation, the type of solids, their concentration and drying temperature are very important
for their effect on crust formation. According to "selective diffusion theory", presented by
Brooks (1965) and Rulkens and Thijssen (1967), the diffusion coefficients of water and
volatiles are reduced as water concentration decreases due to drying. As a result of differences
134
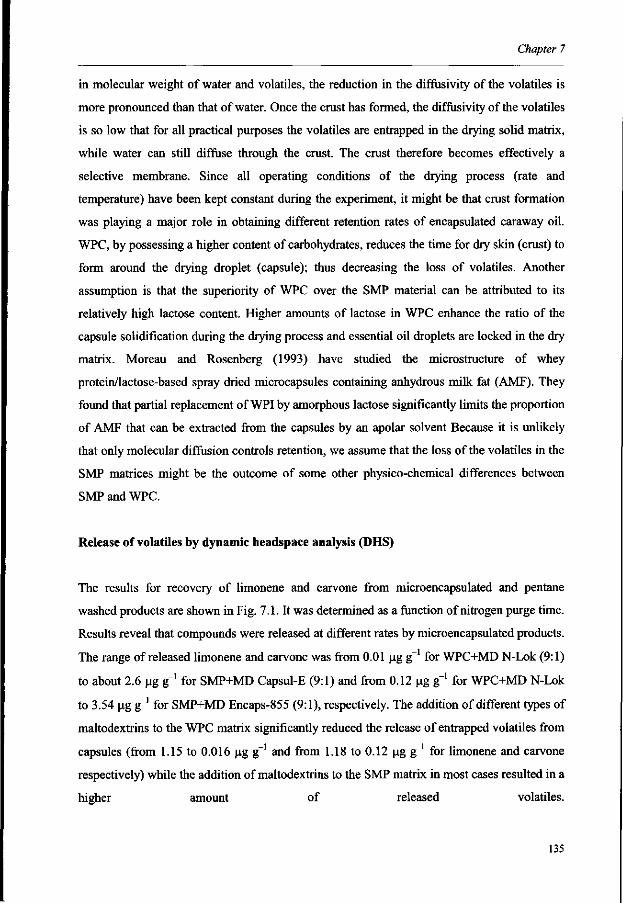
Chapter 7
in molecular weight of water and volatiles, the reduction in the diffusivity of the volatiles is
more pronounced than that of water. Once the crust has formed, the diffusivity of the volatiles
is so low that for all practical purposes the volatiles are entrapped in the drying solid matrix,
while water can still diffuse through the crust. The crust therefore becomes effectively a
selective membrane. Since all operating conditions of the drying process (rate and
temperature) have been kept constant during the experiment, it might be that crust formation
was playing a major role in obtaining different retention rates of encapsulated caraway oil.
WPC, by possessing a higher content of carbohydrates, reduces the time for dry skin (crust) to
form around the drying droplet (capsule); thus decreasing the loss of volatiles. Another
assumption is that the superiority of WPC over the SMP material can be attributed to its
relatively high lactose content. Higher amounts of lactose in WPC enhance the ratio of the
capsule solidification during the drying process and essential oil droplets are locked in the dry
matrix. Moreau and Rosenberg (1993) have studied the microstructure of whey
protein/lactose-based spray dried microcapsules containing anhydrous milk fat (AMF). They
found that partial replacement of WPI by amorphous lactose significantly limits the proportion
of AMF that can be extracted from the capsules by an apolar solvent Because it is unlikely
that only molecular diffusion controls retention, we assume that the loss of the volatiles in the
SMP matrices might be the outcome of some other physico-chemical differences between
SMP and WPC.
Release of volatiles by dynamic headspace analysis (DHS)
The results for recovery of limonene and carvone from microencapsulated and pentane
washed products are shown in Fig. 7.1. It was determined as a function of nitrogen purge time.
Results reveal that compounds were released at different rates by microencapsulated products.
The range of released limonene and carvone was from 0.01 ug g ' for WPC+MD N-Lok (9:1)
to about 2.6 ug gx for SMP+MD Capsul-E (9:1) and from 0.12 ug g"1 for WPC+MD N-Lok
to 3.54 ug g_1 for SMP+MD Encaps-855 (9:1), respectively. The addition of different types of
maltodextrins to the WPC matrix significantly reduced the release of entrapped volatiles from
capsules (from 1.15 to 0.016 ug g"1 and from 1.18 to 0.12 ug g ' for limonene and carvone
respectively) while the addition of maltodextrins to the SMP matrix in most cases resulted in a
higher amount of released volatiles.
135
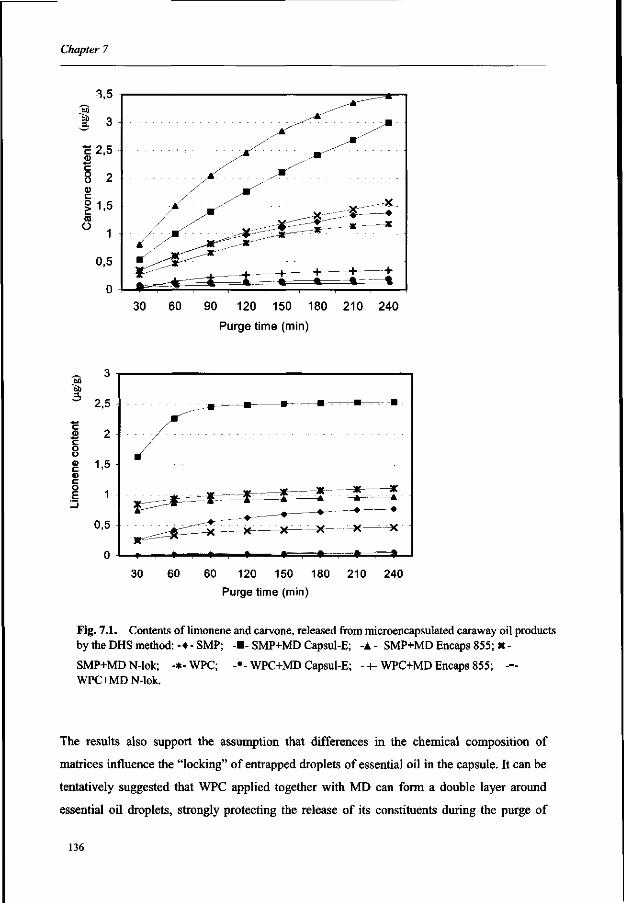
Chapter 7
90 120 150 180 210 240
Purge time (min)
c £ c o o <B c 0) c o E
30 60 60 120 150 180
Purge time (min)
210 240
Fig. 7.1. Contents of limonene and carvone, released from microencapsulated caraway oil products by the DHS method: -•-SMP; -•-SMP+MD Capsul-E; -A - SMP+MDEncaps 855; K-
SMP+MD N-lok; -*-WPC; -•-WPC+MD Capsul-E; -+-WPC+MD Encaps 855; - -WPC+MD N-lok.
The results also support the assumption that differences in the chemical composition of
matrices influence the "locking" of entrapped droplets of essential oil in the capsule. It can be
tentatively suggested that WPC applied together with MD can form a double layer around
essential oil droplets, strongly protecting the release of its constituents during the purge of
136
Chapter 7
nitrogen. Another assumption could be that lactose acts in its amorphous state as a hydrophilic
filler or sealant that significantly limits diffusion of the volatiles through the walls of the
capsule. However, further investigations with model systems consisting of separate fractions
of WPC would be needed to prove or disprove this suggestion.
Flavour profile
The profile depends on the qualitative and quantitative composition of volatile constituents in
the product. Therefore, it is important to measure the changes in these compounds during
processing. Percentage concentrations of the principal constituents of caraway flavour
(limonene and carvone), in pure non-encapsulated essential oil and hydrodistilled from the
matrices after spray drying are shown in Fig. 7.2.
Matrix
Fig. 7.2. Contents of limonene and carvone in pure caraway essential oil (EO) compared to
retention in different matrices.
In general, the ratio of limonene to carvone in the matrices was similar to that in pure essential
oil. A small decrease of limonene content in encapsulated oils has been recorded. This could
137
Chapter 7
be a result of volatile losses during the drying process when emulsion droplets are in contact
with high temperature air. Being more volatile, limonene is expected to be lost first. However,
some increase in the percentage content of limonene was observed in two matrices.
Storage stability evaluation
The formation of oxidation compounds (limonene oxide isomers and tentatively identified as
cis-para-menth-2-en-ol) was measured as a function of time for determining the protective
properties of capsules during storage. Monitoring was carried out in different environmental
conditions, i.e. 50°C and room temperature, and in the presence and absence of light. In
parallel, samples of pure, non-encapsulated caraway essential oil were also exposed for the
monitoring of formation of oxidation products.
Among eight different samples, SMP, SMP+N-Lok and WPC+N-Lok appeared to be least
resistant to oxidation. The results of the storage stability test are shown in Figs 7.3-7.5. As
expected, oxidation products were first recorded among the samples stored at 50°C. SMP and
SMP+N-Lok encapsulated caraway essential oil products exhibited an induction period of 8
weeks during which no limonene oxide had been produced. By week 26, the value of cis-
limonene oxide had reached levels of 2.13 and 1.89 mg g_1 oil for SMP and SMP+N-Lok
samples, respectively. A similar content of fra/w-limonene oxide was produced by week 26 in
SMP and SMP+N-Lok matrices - 2.22 and 2.34 mg g"1 oil. A WPC-based matrix with MD N-
Lok contained cis- and frvms-limonene oxides after 15 and 13 weeks, respectively. However,
the amount of limonene oxides in WPC+N-Lok at the end of monitoring time was
approximately four times less than in SMP and SMP+N-Lok, corresponding with 0.54 and
0.45 mg g_1 oil of cis- and ?ra/w-limonene oxide. Samples stored at room temperature showed
longer times of resistance to oxidation. By week 20 of storage, 0.12 and 0.18 mg g_1 oil of cis-
and frwK-limonene oxides were recorded in SMP samples stored in the light. It seems that the
oxidation process is influenced not only by temperature but also by the presence/absence of
light. The same sample of SMP stored at room temperature without light exhibited a 3 week
138
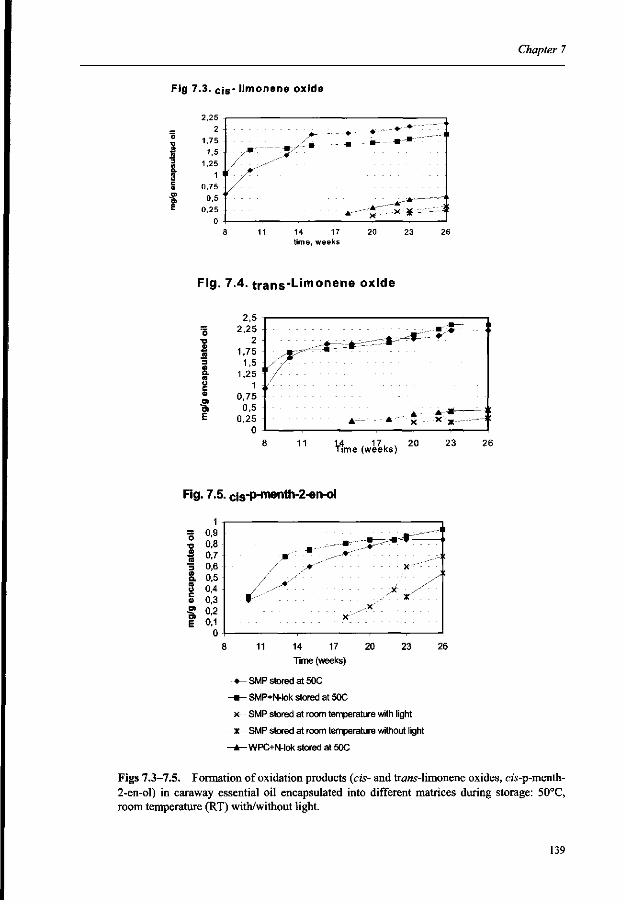
Chapter 7
Fig 7 .3. cis" l imonene ox ide
14 17 time, weeks
Fig. 7.4. trans'l-inionene oxide
• D
3
a. n o c <3> D)
fc
2,5 2,25
2 1,75
1,5
1,25 1
0,75 0,5
0,25 0
Fig. 7.5. cjs-p-menth-2-en-ol
o •o
E
8 11 14 17 20 23 26
Time (weeks)
+- SMP stored at 50C
- • - SMP+N-lok stored at 50C
x SMP stored at room temperature with light
—x— SMP stored at room temperature without light
- * - WPC+N-lok stored at 50C
Figs 7.3-7.5. Formation of oxidation products (cis- and trans-limonene oxides, cw-p-menth-2-en-ol) in caraway essential oil encapsulated into different matrices during storage: 50°C, room temperature (RT) with/without light.
139
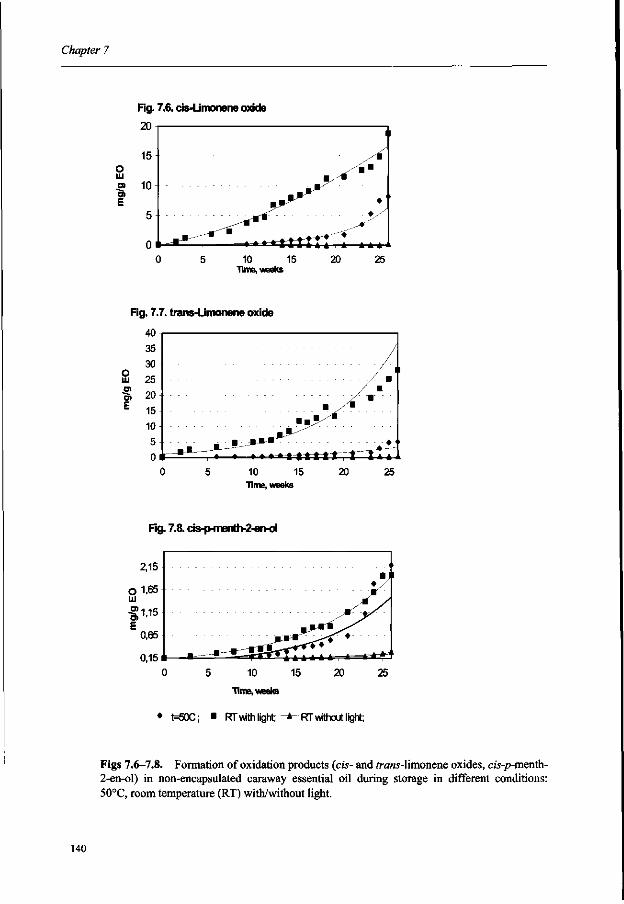
Chapter 7
Fig. 7.6. cis-Limonene oxide
20
10 15 Time, weeks
Fig. 7.7. trans-Limonene oxide
40 35
2 25
E
10 15 Time, weeks
Fig. 7.8. cis-p-merrth-2-en-ol
oL65 HI
• t=50C; • RT with light; - * -RT without light;
Figs 7.6-7.8. Formation of oxidation products (cis- and /rans-limonene oxides, cu-p-menth-2-en-ol) in non-encapsulated caraway essential oil during storage in different conditions: 50°C, room temperature (RT) with/without light.
140
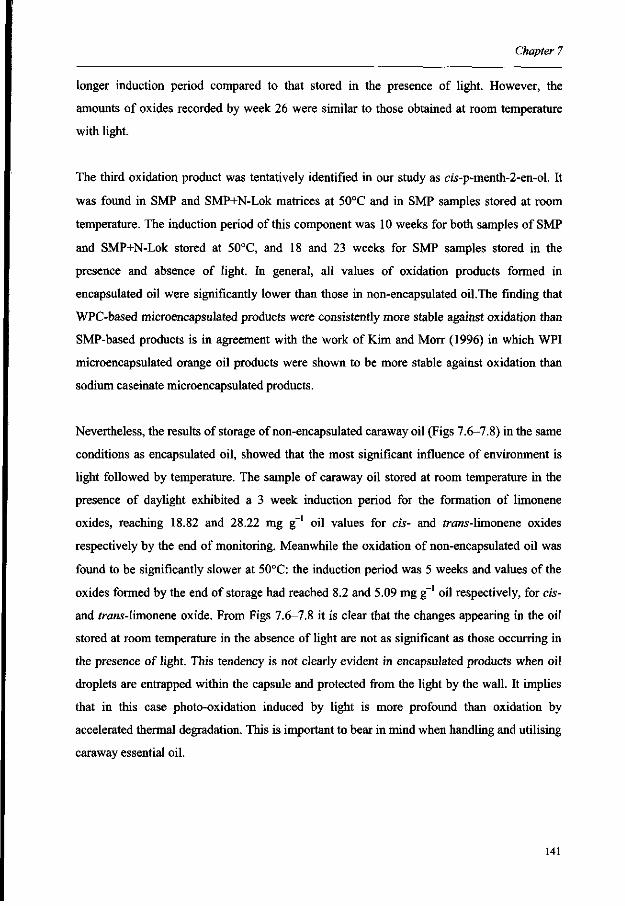
Chapter 7
longer induction period compared to that stored in the presence of light. However, the
amounts of oxides recorded by week 26 were similar to those obtained at room temperature
with light.
The third oxidation product was tentatively identified in our study as cw-p-menth-2-en-ol. It
was found in SMP and SMP+N-Lok matrices at 50°C and in SMP samples stored at room
temperature. The induction period of this component was 10 weeks for both samples of SMP
and SMP+N-Lok stored at 50°C, and 18 and 23 weeks for SMP samples stored in the
presence and absence of light. In general, all values of oxidation products formed in
encapsulated oil were significantly lower than those in non-encapsulated oil.The finding that
WPC-based microencapsulated products were consistently more stable against oxidation than
SMP-based products is in agreement with the work of Kim and Morr (1996) in which WPI
microencapsulated orange oil products were shown to be more stable against oxidation than
sodium caseinate microencapsulated products.
Nevertheless, the results of storage of non-encapsulated caraway oil (Figs 7.6-7.8) in the same
conditions as encapsulated oil, showed that the most significant influence of environment is
light followed by temperature. The sample of caraway oil stored at room temperature in the
presence of daylight exhibited a 3 week induction period for the formation of limonene
oxides, reaching 18.82 and 28.22 mg g_1 oil values for cis- and fr-a/w-limonene oxides
respectively by the end of monitoring. Meanwhile the oxidation of non-encapsulated oil was
found to be significantly slower at 50°C: the induction period was 5 weeks and values of the
oxides formed by the end of storage had reached 8.2 and 5.09 mg g_1 oil respectively, for cis-
and fram-limonene oxide. From Figs 7.6-7.8 it is clear that the changes appearing in the oil
stored at room temperature in the absence of light are not as significant as those occurring in
the presence of light. This tendency is not clearly evident in encapsulated products when oil
droplets are entrapped within the capsule and protected from the light by the wall. It implies
that in this case photo-oxidation induced by light is more profound than oxidation by
accelerated thermal degradation. This is important to bear in mind when handling and utilising
caraway essential oil.
141
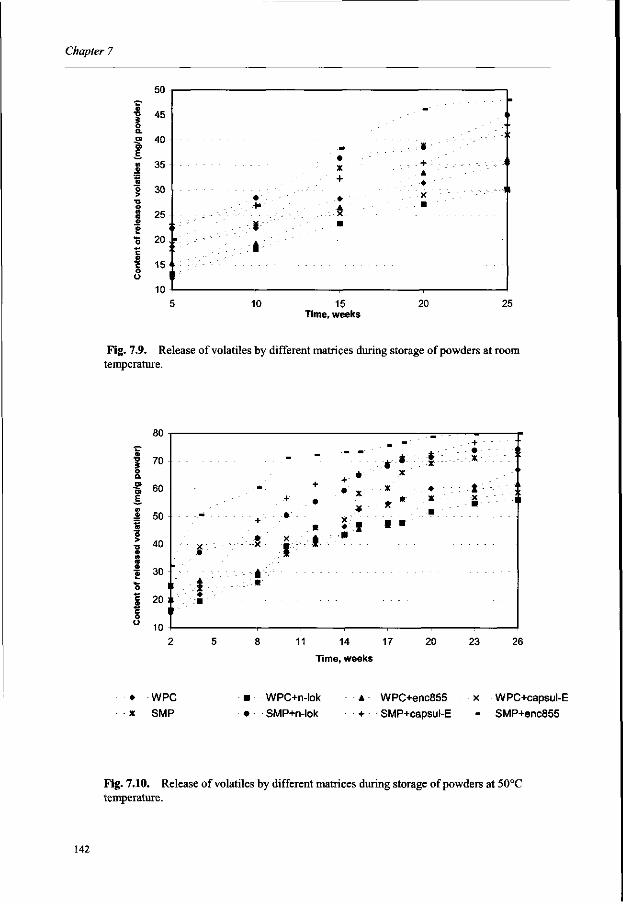
Chapter 7
•D
o Q. O) O)
E W
n o > « V
5 0>
c o o
50
4b
40
35
30
25 i
20 ; <
15 • !
10
• . -
; • • ' . • • ' . . - . - • » - "
r ' : . - - - • ; ; • - - v ' ; ; - | - : ' -
, . -. . . . . . . . i
5 10
• +
•
15 Time, weeks
- - - • ' • - - - - - - - - . - < '
,, . -. • '
. . . + •- - - - - . - , •< i A
•
20 25
Fig. 7.9. Release of volatiles by different matrices during storage of powders at room temperature.
•
X
2
WPC
SMP
5 8 11 14 17 20
Time, weeks
• WPC+n-lok A WPC+enc855
• SMP+n-lok + SMP+capsul-E
23
X
--
26
WPC+capsul-E
SMP+enc855
Fig. 7.10. Release of volatiles by different matrices during storage of powders at 50°C temperature.
142
Chapter 7
Considering that there was no antioxidant in the encapsulated products, the storage stability is
quite good for most of the products. Generally, the rate of formation of limonene oxide and
other oxidation products may have been influenced by many factors such as matrix porosity to
oxygen, absolute density, pro-oxidants, trace minerals or other compounds present. The role
of entrained air (i.e. air included or trapped within the particle) in determining the storage
stability of spray dried products has not been studied.
Release of volatiles during storage
Figures 7.9-7.10 represent the dynamics of the release of the aromatic volatiles from
encapsulated powders as a function of time. A comparison was made between powders stored
at 50°C and room temperature. As expected, lower losses of volatiles were found in the
powders stored at room temperature than at 50° C. However, qualitative results of aroma
losses during storage follow the same tendency as the analysis of volatile release by DHS and
as monitoring of storage stability: SMP-based matrices exhibit higher volatile release and
losses during storage time than WPC.
Microstructure
The outer topography of spray dried microcapsules was revealed by electron microscopy and
is presented in Figs 7.11-7.16. In order to study the effect of the wall composition on the
microstructural features of the spray dried microcapsules containing caraway oil, the same
atomisation and drying conditions were consistently maintained in this study. SEM results for
spray dried WPC-based matrices (Figs 7.11-7.12) revealed spherical particles with smooth
surfaces and large variations in size. However, the surface of a few WPC capsules (Fig. 7.11)
exhibited some holes. The matrices of WPC combined with carbohydrates (Fig. 7.12) did not
differ greatly from sole WPC matrices, they contained fewer visible cracks although more
dented surfaces could be observed in them compared to sole WPC. Wall composition,
atomisation and drying parameters, and uneven shrinkage at the early stages of drying were
attributed to factors affecting the formation of surface indentations in spray dried particles
(Buma and Henstra, 1972; Rosenberg et al., 1988; Mistry et al., 1992; Rosenberg and Young,
1993). In 1998, Sheu and Rosenberg studied how the structure of spray dried microcapsules
143
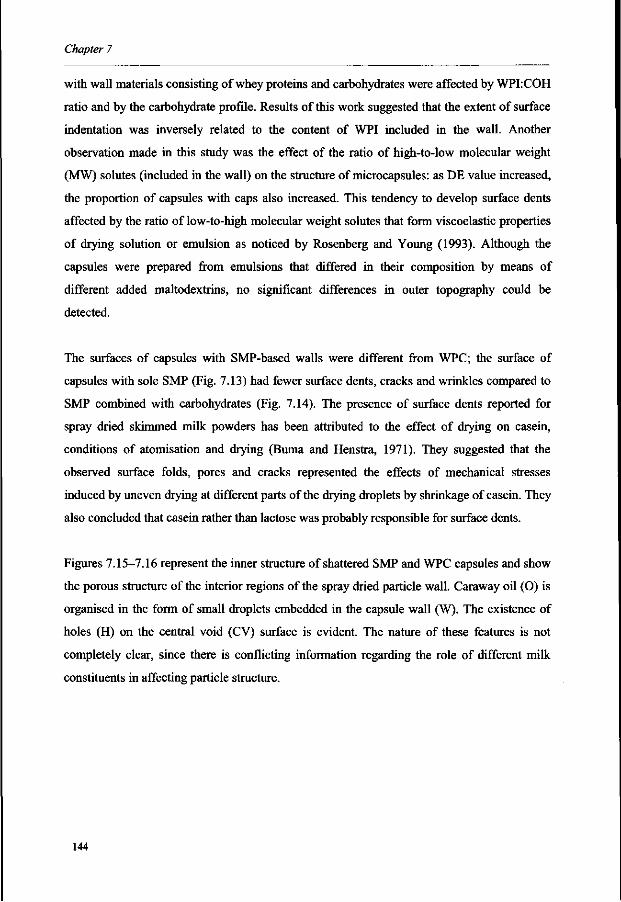
Chapter 7
with wall materials consisting of whey proteins and carbohydrates were affected by WPLCOH
ratio and by the carbohydrate profile. Results of this work suggested that the extent of surface
indentation was inversely related to the content of WPI included in the wall. Another
observation made in this study was the effect of the ratio of high-to-low molecular weight
(MW) solutes (included in the wall) on the structure of microcapsules: as DE value increased,
the proportion of capsules with caps also increased. This tendency to develop surface dents
affected by the ratio of low-to-high molecular weight solutes that form viscoelastic properties
of drying solution or emulsion as noticed by Rosenberg and Young (1993). Although the
capsules were prepared from emulsions that differed in their composition by means of
different added maltodextrins, no significant differences in outer topography could be
detected.
The surfaces of capsules with SMP-based walls were different from WPC; the surface of
capsules with sole SMP (Fig. 7.13) had fewer surface dents, cracks and wrinkles compared to
SMP combined with carbohydrates (Fig. 7.14). The presence of surface dents reported for
spray dried skimmed milk powders has been attributed to the effect of drying on casein,
conditions of atomisation and drying (Buma and Henstra, 1971). They suggested that the
observed surface folds, pores and cracks represented the effects of mechanical stresses
induced by uneven drying at different parts of the drying droplets by shrinkage of casein. They
also concluded that casein rather than lactose was probably responsible for surface dents.
Figures 7.15-7.16 represent the inner structure of shattered SMP and WPC capsules and show
the porous structure of the interior regions of the spray dried particle wall. Caraway oil (O) is
organised in the form of small droplets embedded in the capsule wall (W). The existence of
holes (H) on the central void (CV) surface is evident. The nature of these features is not
completely clear, since there is conflicting information regarding the role of different milk
constituents in affecting particle structure.
144
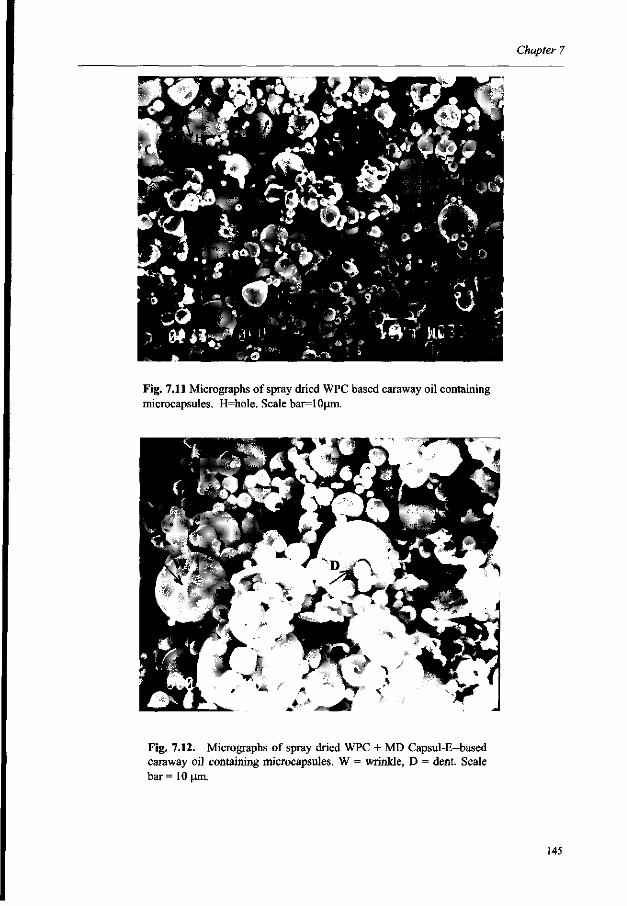
Chapter 7
Fig. 7.11 Micrographs of spray dried WPC based caraway oil containing microcapsules. H=hole. Scale bar=10|xm.
Fig. 7.12. Micrographs of spray dried WPC + MD Capsul-E-based caraway oil containing microcapsules. W = wrinkle, D = dent. Scale bar = 10 (im.
145
Chapter 7
Fig. 7.13. Micrographs of spray dried SMP based caraway oil containing microcapsules. Scale bar=10|am.
Fig. 7.14. Micrographs of spray dried SMP+MD Encaps 855 based caraway oil containing microcapsules. W=wrinkle. Scale bar=10um.
146
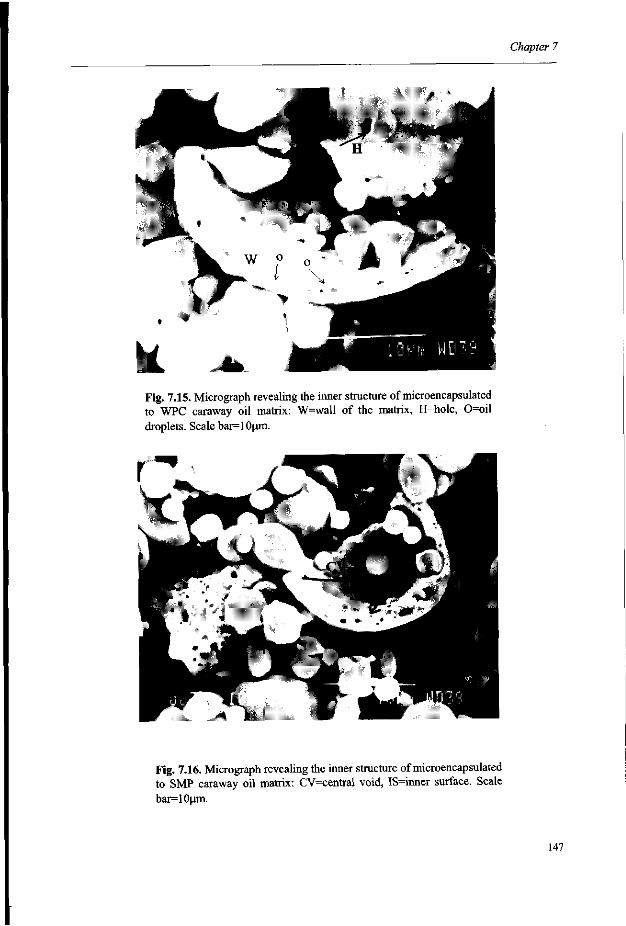
Chapter 7
Fig. 7.15. Micrograph revealing the inner structure of microencapsulated to WPC caraway oil matrix: W=wall of the matrix, H=hole, 0=oil droplets. Scale bar=10|xm.
Fig. 7.16. Micrograph revealing the inner structure of microencapsulated to SMP caraway oil matrix: CV=central void, IS=inner surface. Scale bar=10|xm.
147
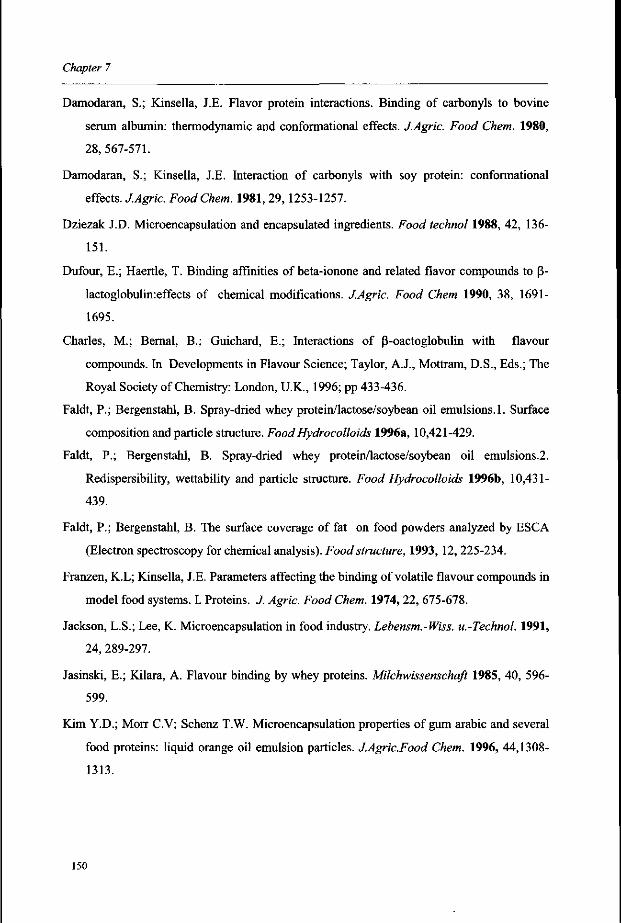
Chapter 7
Damodaran, S.; Kinsella, J.E. Flavor protein interactions. Binding of carbonyls to bovine
serum albumin: thermodynamic and conformational effects. J.Agric. Food Chem. 1980,
28,567-571.
Damodaran, S.; Kinsella, J.E. Interaction of carbonyls with soy protein: conformational
effects. J.Agric. Food Chem. 1981, 29, 1253-1257.
Dziezak J.D. Microencapsulation and encapsulated ingredients. Food technol 1988, 42, 136-
151.
Dufour, E.; Haertle, T. Binding affinities of beta-ionone and related flavor compounds to (3-
lactoglobulin:effects of chemical modifications. J.Agric. Food Chem 1990, 38, 1691-
1695.
Charles, M.; Bernal, B.; Guichard, E.; Interactions of P-oactoglobulin with flavour
compounds. In Developments in Flavour Science; Taylor, A.J., Mottram, D.S., Eds.; The
Royal Society of Chemistry: London, U.K., 1996; pp 433-436.
Faldt, P.; Bergenstahl, B. Spray-dried whey protein/lactose/soybean oil emulsions. 1. Surface
composition and particle structure. Food Hydrocolloids 1996a, 10,421-429.
Faldt, P.; Bergenstahl, B. Spray-dried whey protein/lactose/soybean oil emulsions.2.
Redispersibility, wettability and particle structure. Food Hydrocolloids 1996b, 10,431-
439.
Faldt, P.; Bergenstahl, B. The surface coverage of fat on food powders analyzed by ESCA
(Electron spectroscopy for chemical analysis). Food structure, 1993, 12, 225-234.
Franzen, K.L; Kinsella, J.E. Parameters affecting the binding of volatile flavour compounds in model food systems. I. Proteins. J. Agric. Food Chem. 1974, 22, 675-678.
Jackson, L.S.; Lee, K. Microencapsulation in food industry. Lebensm.-Wiss. u.-Technol. 1991,
24, 289-297.
Jasinski, E.; Kilara, A. Flavour binding by whey proteins. Milchwissenschaft 1985, 40, 596-
599.
Kim Y.D.; Morr C.V; Schenz T.W. Microencapsulation properties of gum arabic and several
food proteins: liquid orange oil emulsion particles. J.Agric.Food Chem. 1996, 44,1308-
1313.
150
Chapter 7
Kim, Y.D.; Morr, C.V. Microencapsulation properties of gum arabic and several food
proteins: spray-dried orange oil emulsion particles. J. Agric. Food Chem. 1996, 44, 1314-
1320.
Kollengode, A.N.R.; Hanna, M.A. Flavor retention in pregelatinized and internally flavored
starch extrudates. Cereal Chem. 1997, 74, 396-399.
Kinsella, J.E. Milk proteins: physicochemical and functional properties.Crit. Rev. Food Sci.
Nutr. 1990, 21,197-262
Landy P., Druaux C, Voilley A. Retention of aroma compounds by proteins in aqueous
solution. Food Chem. 1995, 54, 387-392.
McNamee, B.F.; O'Riordan, E.D.; O'Sullivan, M. Emulsification and microencapsulation
properties of gum arabic. J. Agric. Food Chem. 1998, 46, 4551-4555.
Menting, L.C.; Hoogstad, B. Volatile retention during the drying of aqueous carbohydrate
solutions. J.Food Sci. 1967, 32, 87-90.
Minemoto, Y.; Adachi, S.; Matsuno, R. Comparison of oxidation of methyl linoleate
encapsulated with gum arabic by hot-air-drying and freeze-drying. J. Agric. Food Chem.
1997, 45, 4530-4534.
Mistry, V.V.; Hassan, H.N.; Robinson, D.J. Effect of lactose and protein on microstructure of
dried milk. Food Struct. 1992, 11, 73-82.
Moreau, D.L.; Rosenberg, M. Oxidative stability of anhydrous milkfat microencapsulated in
whey proteins. J. Food Sci. 1996, 61, 39-43.
Moreau, D.L.; Rosenberg, M. Microstructure and fat extractability in microcapsules based on
whey proteins or mixtures of whey proteins and lactose. Food structure, 1993, 12, 457-
468.
Moreu, D.L.; Rosenberg, M. Porosity of whey protein-based microcapsules containing anhydrous milkfat measured by gas displacement pycnometry. J. Food Sci. 1998, 63, 819-
823.
Moreu, D.L.; Rosenberg, M. Porosity of microcapsules with wall systems consisting of whey proteins and lactose measured by gas displacement pycnometry. J. Food Sci. 1999, 64, 405-409.
151
Chapter 7
Noor Lida Habi Mat Dian, Nor'aini Sudin; Mohd Suria Affandi Yusoff. Characteristics of
microencapsulated palm-based oil as affected by type of wall material. J.Sci Food Agric,
1996, 70,422-426.
O'Neil, T.E. Flavour binding by food proteins: an overview. In Flavor Food Interaction;
McGorrin, R.J., Leland, J.V., Eds., ACS Symposium Series 633; American Chemical
Society: Washington, DC, 1996; pp59-74.
O'Neil, T.E.; Kinsella J.E. Binding of alkanone flavors to p-lactoglobulin: effects of
conformational and chemical modification. J.Agric. Food Chem. 1987, 35,110-11 A.
Onwulata, C.I.; Smith, P.W.; Craig, Jr.J.C; Holsinger, V.H. Physical properties of
encapsulated spray-dried milkfat. J. FoodSci. 1994, 59, 316-320.
Onwulata, C.I.; Smith, P.W.; Cooke, P.H.; Holsinger V.H. Particle structures of encapsulated
milkfat powders. Lebensm.- Wiss. u. - Technol., 1996, 29, 163-172.
Papiz, M.Z.; Sawyer, L.; Eliopoulos, E.E.; North, A.C.T.; Findlay, J.B.C.; Sivaprasadarao, R.;
Jones, T.A.; Newcomer, M.E.; Kraulis, P.J. The structure of P-lactoglobulin and its
similarities to plasma retinol binding protein. Nature 1986, 324, 383-385.
Pauletti, M.S.; Amestoy, P. Butter microencapsulation as affected by composition of wall and
fat. J. FoodSci. 1999, 64, 279-282.
Pelletier, E.; Sostmann, K.; Guichard, E. Measurement of interactions between p-
lactoglobulin and flavor compounds (esters, acids and pyrazines) by affinity and
exclusion size chromatography. J.Agric.Food Chem. 1998,46, 1506-1509.
Reineccius, G.A. Carbohydrates for flavor encapsulation. Food Technol. 1991, March, 144-
149.
Reineccius, G. A. Flavor encapsulation. Food Reviews International 1989, 5, 147-176.
Reineccius, G.A. Spray drying of food flavors. In Flavor encapsulation, eds S.J. Rish, G.A.
Reineccius. ACS symposium series 370; American Chemical Society: Washington, D.C.,
1988; pp 57-66.
Rish, S.J.; Reineccius, G.A. Spray-dried orange oil: effect of emulsion size on flavor retention
and shelf stability. In Flavor encapsulation, eds S.J. Rish, G.A. Reineccius. ACS
symposium series 370; American Chemical Society: Washington, D.C., 1988; pp 67-77.
152
Chapter 7
Rish, S.J. Encapsulation: overview of uses and techniques. In Encapsulation and controlled
release of food ingredients, eds S.J. Rish, G.A. Reineccius. ACS symposium series 590;
American Chemical Society: Washington, D.C., 1995; pp 2-7.
Rosenberg, M.; Kopelman, I.J.; Talmon, Y. Factors affecting in spray-drying
microencapsulation of volatile materials. J.Agric.Food Chem. 1990, 38, 1288-1294.
Rosenberg, M.; Talmon, Y.; Kopelman, I.J. The microstructure of spray- dried microcapsules.
FoodMicrostruc. 1988, 7, 15-23.
Rosenberg, M.; Young, S.L. Whey proteins as microencapsulating agents. Microencapsulation
of anhydrous milkfat - structure evaluation. Food Structure 1993, 12, 31-41.
Rulkens, W.H.; Thijssen, H.A.C.; The retention of organic volatiles in spray drying aqueous
carbohydrate solutions. J.Food Technol. 1967, 7, 95-105.
Sheu, T.Y.; Rosenberg, M. Microencapsulation of volatiles by whey proteins. J, Dairy Sci.
1993, 76 (Suppl. 1), 106.
Sheu, T.Y.; Rosenberg, M. Microstructure of microcapsules consisting of whey proteins and
carbohydrates. J. Food Sci. 1998, 63,491-494.
Thenevet, F.Acacia gums. Natural encapsulation agent for food ingredients. In Encapsulation
and controlled release of food ingredients, eds S.J. Rish, G.A. Reineccius. ACS
symposium series 590; American Chemical Society: Washington, D.C., 1995, pp 51-59.
Thijssen, H.A.C.; Rulkens, W.H. Retention of aromas in drying food liquids. Ingenieur 1968,
80, Chapter 45.
Trubiano, P.C.; Lacourse, N.L. Emulsion-stabilizing starches. Use in flavor encapsulation. In
Flavor encapsulation, eds S.J. Rish, G.A. Reineccius. ACS symposium series 370;
American Chemical Society: Washington, D.C., 1988; pp 45-54.
Young, S.L.; Sarda, X.; Rosenberg, M. Microecpasulating properties of whey proteins.
1 .Microencapsulation of anhydrous milk fat. J.Dairy Sci. 1993a, 76, 2868-2877.
Young, S.L.; Sarda, X.; Rosenberg, M. Microencapsulating properties of whey proteins. 2.
Combination of whey proteins with carbohydrates. J.Dairy Sci. 1993b, 76, 2878-2885.
Zeller, B.L.; Saleeb, F.Z.; Ludescher R.D. Trends in development of porous carbohydrate food ingredients for use in flavor encapsulation. Trends Food Sci. Technol. 1999, 9, 389-394
153

Chapter 7
154
Chapter 8
GENERAL DISCUSSION
Chapter 8
This thesis deals with research into aroma with regard to some plants of the Umbelliferae and
Asteraceae families. The following investigations were included within the framework of the
experimental design:
• A study of aroma composition in plants using instrumental analysis. The following factors
influencing the aroma composition of essential oils from particular plants were examined:
cultivar, fertilisation rate, harvesting time, and anatomical part of the plant used for the
isolation of volatiles (Chapters 2, 3, 4 and 5).
• Flavour release from dried plant and microencapsulated products with respect to
harvesting time, anatomical part of plant, the effect of different matrices being used for
encapsulation, and the detection of odour-active components by sniffing port analysis
(Chapters 5 and 7).
• The processing of essential oils by emulsification and microencapsulation (Chapters 6 and
7).
AROMA COMPOSITION OF PLANTS
In this study, the composition of essential oils from aromatic plants grown in Lithuania was
shown to be influenced by cultivar, fertilisation rate, plant harvesting time and the anatomical
part of the plant exploited for the isolation of volatile compounds.
Essential oils are the odorous principles found in various plant parts as compounds of
secondary plant metabolism. Depending on the plant family, volatile oils are secreted in oil
cells, in secretion ducts or in cavities or glandular hairs (Trease and Evans, 1983).
Compositional variation within a species appears to be the rule rather than the exception in
essential oil crops (Franz, 1993). It involves the study of at least three factors: (1) individual
genetic variability; (2) variation among different plant parts and different developmental
stages; and (3) modifications due to the environment.
Plants grown at different locations and in different climatic conditions differ in their aroma
composition (Halva et al., 1988; Galambosi and Peura, 1996; Perry et al., 1999).
Accumulation of essential oil increases with light and temperature (Haelvae et al, 1992,
1993). There is an established positive relationship between the intensity of solar radiation
156
Chapter 8
and the quantity of phenolic formation by the plant (Waterman and Mole, 1994). However,
the concentration of diterpenes in plants decreases in response to light and water stress
(Lewinsohn et al., 1993; McGarvey and Croteau, 1995). Using nitrogen fertilisers during
plant cultivation can increase the yield of essential oils (Hussien, 1995; Muni Ram et al.,
1997).
Different yields of the essential oils with variations in their composition can be obtained from
aromatic plants by harvesting them during their vegetative period (Senatore, 1996; Chalcat et
al., 1997; Mallavarapu et al., 1999; Sefidkon et al., 1999). The trends for the accumulation of
essential oil with optimal yield and composition in the glands of the plant can differ between
species, so each particular crop requires investigation in order to obtain the desired aromatic
compounds (Faber et al., 1997; Perry et al., 1999; Munne-Bosch, 2000).
The yield and composition of volatiles can vary significantly according to which botanical
part of the plant is selected (Fiorini et al., 1997). Depending on the family, volatiles may
occur in secretory structures such as glandular hairs (Labiatae), oil-tubes called vittae
(Umbelliferae) or lysigenous passages {Pinaceaae) (Tyler et al., 1981). Some plants possess
secretory ducts only in particular organs and this is why the formation of volatile oils differs
according to which part of the plant is used.
In the present work the qualitative composition of essential oils obtained from plants grown in
the Lithuanian climate was shown to be similar to those grown in other locations except for
some minor components (Chapters 2, 3 and 4). However, the differences in quantitative
composition of volatiles were more evident. The time of harvesting appeared to be most
significant factor for the yield of essential oil accumulated in the plant (Chapters 3 and 4) or
the amount of volatiles released by plant material in certain conditions (Chapter 5).
Differences in the yields of essential oil were also influenced by cultivar and fertilisation rate
(Chapter 2).
Seasonal changes were found to have an important influence on quantitative composition,
whereas qualitative characteristics remained the same during the whole vegetative period for
the plants analysed (Chapters 3 and 4). A similar tendency of plants to accumulate highest
amount of volatiles at the stage of flower-head emergence or at full flowering was observed
157
Chapter 8
by Senatore (1996) and Mallavarapu et al. (1999) for thyme and davane essential oils,
respectively. In general it is accepted that the most herbs accumulate the highest amounts of
volatile oil during the anthesis period; however, numerous studies show that each particular
aromatic plant possesses its own peculiarities.
Different yields and composition of volatiles were obtained from different botanical parts of
the plants (Chapters 3, 4 and 5). As expected, the highest amounts of essential oils were
accumulated by seeds and flowers, followed by leaves and stems. Remarkable differences
appeared between representatives of the Umbelliferae and Asteraceae. Umbellifers were
found to possess significant amounts of volatiles in all above-ground anatomical parts of the
plant (Chapters 3 and 5), whereas only traces of volatiles were discovered in the stems of
Asteraceae plants (Chapter 4).
FLAVOUR RELEASE
One of the methods most often applied in order to recover volatiles from plant material is
distillation, which generally gives the finest quality oils and complete separation of non
volatile components (Heath and Reineccius, 1986). However, steam- or water-distilled
essential oils do not necessarily reflect the composition of the actual odour of an aromatic
plant. Essential oils are mostly artefacts formed during the distillation process (Baser, 1995).
The identification of volatile compounds which are perceived by the human nose in the air
above the food is a goal of flavour analysis (Guth and Grosch, 1993). The headspace
techniques aim to capture the real odoriferous characteristics of the product. Static headspace
provides an accurate composition of the volatile compounds which are perceived as the
wholesome odour of the product, but it is limited to the level of detection and identification of
organic constituents, particularly less volatile substances (Arino et al., 1999). Dynamic
headspace (DHS) techniques permit the collection of larger amounts of volatile components
for their qualitative and quantitative characterisation by instrumental methods. Besides the
widely used instrumental detectors, the human olfactory system can be successfully used to
obtain important information about the qualitative contribution of individual compounds to
the overall flavour of the product (Acree and Barnard, 1994).
158
Chapter 8
However, the release of volatiles depends not only on the method of isolation but on the
structure and properties of the matrix in which the aroma compounds are presented:
availability of the odorants to the vapour phase, and therefore on their affinity for the product
(Druaux and Voilley, 1997).
In the present work, dynamic headspace-gas chromatography (DHS-GC) and dynamic
headspace-gas chromatography-sniffing port (DHS-GC-SP) techniques were applied for the
characterisation of flavour release from dried plant material and flavour-encapsulated
matrices. The results revealed that the release of aroma compounds was influenced by the
structure and composition of the plant material or the matrices of microencapsulated products
(Chapters 5 and 7). The structure of the anatomical parts of plant had a significant influence
on the amount and profile of released volatiles (Chapter 5). Roots exhibited the lowest
amounts of released volatiles, whilst seeds appeared to possess the highest. In general,
seasonal changes in the amount of volatiles determined by DHS (Chapter 5) are in a good
agreement with the changes in the content of essential oils (Chapter 3). As expected by
comparing composition of essential oils with those of DHS samples, the latter were
dominated by compounds of higher volatility. The limited capture and detection of less
volatile compounds by the DHS method was evident in this work (Chapter 5).
Characterisation of effluents by GC-SP gave additional information on the components
contributing to the flavour of lovage plants (Chapter 5).
Different microencapsulated products exhibited different rates of release of aroma compounds
from the protein-based matrices (Chapter 7). Results imply that the mechanism of flavour
release is a sum of factors. However, by making a proper selection of encapsulating matrix,
flavour release and losses under certain conditions or storage can be controlled and reduced
(Chapter 7).
FLAVOUR PROCESSING
Besides the advantages of being natural and possessing a flavour quality corresponding with
the source raw material, the essential oils are volatile and labile compounds that are difficult
to handle in their liquid, concentrated state and which are prone to oxidation. In order to
159
Chapter 8
minimise the danger of this happening, to retain and protect volatile compounds and facilitate
easier handling, flavours are converted to free-flowing powders by emulsification and
encapsulation for use in numerous formulated products on the market.
In the present work, investigations into the properties of essential oils in water emulsions
stabilised by protein and lipid showed that the stability of essential oil emulsion is lower than
those obtained with emulsions of a purified olive oil as dispersed phase (Chapter 6). The
stability of emulsions with essential oil can be promoted by increasing protein concentration
and adding emulsifier to provide a decrease in particle size and a lower rate of creaming. The
advantages of creating smaller emulsion droplets when preparing solutions for spray drying
were reported by Rish and Reineccius (1988). Creation of a fine emulsion increased the
retention of essential oil in the spray-dried powders which then yielded less extractable
surface oil. Our investigation of the properties of microencapsulated products showed that by
making a careful choice of carrier or combining wall materials with different functional
properties, the efficiency of the microencapsulation process can be improved and subsequent
flavour loss during storage can be minimised (Chapter 7). This is in agreement with Young et
al. (1993) who also demonstrated that the yield and efficiency of microencapsulation of
anhydrous milk fat might be enhanced by selection of wall components exhibiting different
functional properties. Other factors such as environmental conditions also influence the
retention of flavour during storage and the formation of oxidation products.
However, it is important to note that a flavour profile can undergo certain changes during its
processing. A small decrease in the more volatile components has been recorded in
encapsulated oils, which could be the result of volatile losses during the drying process.
Finally the study of the oxidation process occurring in essential oils during storage revealed
that the formation of oxidation products is significantly slower in microencapsulated than in
non-encapsulated oils.
160
Chapter 8
CONCLUSIONS
The following conclusions can be drawn from the thesis "Aroma of some plants cultivated in
Lithuania: composition, processing and release":
• In general, the chemical composition of locally grown aromatic plants (parsley, celery,
dill, caraway) shows that the amounts of the major constituents were arranged in the
same order as that reported in the literature. The yield and chemical composition of the
essential oils (caraway, lovage, costmary) are influenced by factors such as type of
cultivar, cultivation site, rate of fertilisation, anatomical part of plant used, and
harvesting time. Essential oils produced from locally grown plants can successfully
replace imported oils.
• Different detection techniques for the effluents of a GC column, for instance the DHS-
GC-SP technique, can provide additional information about the contribution of the
individual volatiles to the flavour of a plant. The method used to isolate the volatiles
has a significant influence on their composition: 98 compounds were identified in the
samples, 41 of which are reported among lovage volatiles for the first time.
• Emulsions made with triglyceride oil are more stable than those made with caraway
essential oil as the dispersed phase. The stability of the essential oil-in-water
emulsions can be improved considerably by adding soyabean phosphatidylcholine (sb-
PC) and increasing the protein concentration. Adsorption of the lipid from the oil and
the protein from the aqueous phase at the oil/water interface can be studied by
applying ellipsometry.
• The essential oil of caraway can successfully be encapsulated in milk derivatives
either alone or in combination with carbohydrates. The yield and efficiency of
microencapsulation of essential oils could be enhanced by the selection of wall
components exhibiting different functional properties.
161
Chapter 8
REFERENCES
Acree, T. E.; Barnard, J. Gas chromatography-olfactometry and Charm Analysis. In Trends in
Flavour Research; Maarse, H., Van der Heij, D. G„ Eds.; Elsevier Science Publishers B.
V.: Amsterdam, 1994; pp 211-220.
Arino, A.; Arberas, I.; Renobales, G.; Dominguez, J.B. Influence of extraction method and
storage conditions on the volatile oil of wormwood {Artemisia absinthium L.). Eur.
Food Res. Technol. 1999, 209, 126-129.
Baser, H.C.K. Analysis and quality assessment of essential oils. In A manual on the essential
oil industry, Tuley de Silva (ed.); United Nations industrial development organization,
Vienna, 1995; pp 155-178.
Chalcat, J.C.; Michet, A.; Pasquier, B. Influence of harvesting time on chemical composition
of Mentha piperita L. essential oil. Perfum. Flavor. 1997, 22, 17-21.
Druaux, C; Voilley, A. Effect of food composition and microstructure on volatile flavour
release. Trends Food Sci. Technol. 1997, 8, 364-368.
Faber, B.; Bangert, K.; Mosandl, A. GC-IRMS and enantioselective analysis in biochemical
studies in dill {Anethum graveolens L.). Flavour Fragrance J. 1997, 12, 305-314.
Fiorini, C ; Fouraste, I.; David, B.; Bessiere, J.M. Composition of the flower, leaf and stem
essential oils from Laurus nobilis L. Flavour Fragrance J. 1997, 12, 91-93.
Franz, Ch. Genetics. In Volatile oil crops: their biology, biochemistry and production; Hay,
R.K.M., Waterman, P.G.; Eds.; Longman: Harlow, U.K., 1993; pp 63-96.
Galambosi, B.; Peura, P. Agrobotanical features and oil content of wild and cultivated forms of
caraway (Carum carvi L.). J. Essent. Oil Res. 1996, 8, 389-397.
Guth, H.; Grosch, W. Identification of potent odourants in static headspace samples of green
and black tea powders on the basis of aroma extract dilution analysis (AEDA). Flavour
Fragrance J. 1993, 8, 173-178.
Halva, S.; Huopalahti, R.; Franz, R.; Makinen, S. Herb yield and essential oil of dill {Anethum
graveolens L.) at different locations. J. Agric. Sci. Finland 1988, 60, 93-100.
Haelvae, S.; Craker, L.E.; Simon, J.E.; Charles, D.J. Light levels, growth and essential oil in
dill {Anethum graveolens L.). J. Herbs Spices & Med. Plants 1992, 1, 47-58.
Haelvae, S.; Craker, L.E.; Simon, J.E.; Charles, D.J. Growth and essential oil in dill, Anethum
graveolens L., in response to temperature and photoperiod. J. Herbs Spices & Med. Plants
1993,1,47-56.
162
Chapter 8
Heath H.B.; Reineccius G.A. Flavour chemistry and technology. Macmillan Publishers, USA,
1986.
Hussien, M.S. Response of growth, yield and essential oil of coriander and dill to different
nitrogen sources. Egyptian J. Horticulture 1995, 22, 1-10.
Lewinsohn, E.; Gijzen, M.; Muzika, R.M.; Barton, K; Croteau, R. Oleoresins in grand fir
{Abies grandis) saplings and mature trees. Modulation of this wound response by light
and water stresses. Plant Physiol. 1993, 101, 1021-1028.
Mallavarapu, G.R.; Kulkarni, R.N.; Baskaran, K.; Rao, L.; Ramesh, S. Influence of plant
growth stage on the essential oil content and composition in davana {Artemisia pollens
Wall.). J. Agric. FoodChem. 1999, 47, 254-258.
McGarvey, D.J.; Croteau, R. Terpenoid metabolism. Plant Cell 1995, 7, 1015-1026.
Muni Ram; Patra, D.D.; Sushil Kumar. Nitrogen fertilization of palmarosa in continuous
cropping. J. Herbs Spices Med. Plants 1997, 5, 53-61.
Munne-Bosch, S.; Alegre, L.; Schwarz, K. The formation of phenolic diterpenes in
Rosmarinus officinalis L. under Mediterranean climate. Eur. Food Res. Technol. 2000,
210,263-267.
Perry, N.B.; Anderson, R.E.; Brennan, N.J.; Douglas, M.H.; Heaney, A.J.; McGimpsey, J.A.;
Smallfield, B.M. Essential oils from Dalmatian sage {Salvia officinalis L.): variations
among individuals, plant parts, seasons and sites. J. Agric. Food Chem. 1999, 47, 2048-
2054.
Rish, S.J.; Reineccius, G.A. Spray-dried orange oil: effect of emulsion size on flavour
retention and shelf stability. In Flavour encapsulation, eds S.J. Rish, G.A. Reineccius.
ACS symposium series 370; American Chemical Society: Washington, D.C., 1988; pp
67-77.
Sefidkon, F.; Dabiri, M.; Rahimi-Bidgoly, A. The effect of distillation methods and stage of
plant growth on the essential oil content and composition of Thymus kotschyanus Boiss.
& Hohen. Flavour Fragrance J. 1999, 14, 405^08.
Senatore, F. Influence of harvesting time on yield and composition of the essential oil of a
thyme {Thymus pulegioides L) growing wild in Campania (southern Italy). J. Agric. Food
Chem. 1996, 44, 1327-1332.
Trease, G.E.; Evans, W.C. Pharmacognosy. Bailliere Tindall, 1983.
Tyler, V.E.; Brady, L.R.; Robbers, J.E. Pharmacognosy. Philadelphia: Lea & Febiger, 1981.
Waterman, P.G.; Mole, S. Analysis of phenolic plant metabolites. Blackwell, Oxford, 1994.
163
Chapter 8
Young, S.L.; Sarda, X.; Rosenberg, M. Microencapsulating properties of whey proteins. 2.
Combination of whey proteins with carbohydrates. J. Dairy Sci. 1993, 76, 2878-2885.
164

SUMMARY
Summary
This thesis deals with research into the aromatic constituents of some plants of the families
Umbelliferae and Asteraceae. The aim of the research was to elucidate the aroma composition
of plants growing in Lithuania and to describe some aspects of flavour processing and release.
The composition of the aroma of the following plants was investigated: caraway, lovage,
parsley, celery, dill and costmary. The aroma of these plants was analysed using various
techniques, including gas chromatography combined with mass spectrometry and sniffing
port detection (in the case of lovage). The investigation of the chemical composition of
aromatic plants was focused on several factors influencing their aroma: such as harvesting
time, anatomical part of plant, method used to isolate the volatiles, cultivar, and the fertilisers
used in crop cultivation. The further processing and release of aromatic volatiles was also
investigated. The properties of emulsions produced with essential oils were examined and the
oil/water interface formed was characterised with regard to the adsorption of proteins and
lipids. Encapsulated flavours were analysed and described. The ability of milk proteins to
function well as encapsulating agents for essential oils was demonstrated in this study.
In Chapter 1, various aspects of flavour perception, the use of plants as a source of natural
flavours, and the preservation of flavour by processing and encapsulation are discussed.
Flavour isolation and analysis, and factors affecting flavour release, are briefly presented
(including a literature review). The aims and objectives of the work are outlined at the end of
the chapter.
An investigation into the chemical composition of the essential oils of locally grown parsley,
celery, dill and caraway plants is described in Chapter 2. The results show that the amounts
of the major constituents were ranked in the same order as described in the published data.
The dill herb analysed could be assigned to chemotype II (dillapiole). The seed yield,
essential oil content and chemical composition of four different caraway cultivars and the
influence of fertilisers on these characteristics were also examined and described in this
chapter. The investigation showed that total concentration of essential oil in the fruits varied
from 1.9 to 4.3 ml 100 g_1. The yield of caraway fruits grown in the experimental fields varied
over a wide range (from 984 to 2673 kg ha-1) depending on fertiliser content, cultivation area
and the cultivar itself.
166
Summary
Chapter 3 deals with the analysis of essential oils from different plant parts (leaves, stems,
flowers and seeds) of lovage {Levisticum officinale Koch.) at different stages of plant growth.
It was shown that the seasonal changes in leaves were less noticeable than in the stems. Seeds
and flowers possessed the highest yields of oil. Leaves exhibited their highest oil content
before the stage of bud formation. a-Terpinyl acetate was found to be the predominant
compound in leaves and stems (up to 70%), and P-phellandrene in seeds and flowers (61.5%
and 40.8%, respectively); Z-ligustilide was confirmed as a major lovage phthalide,
constituting from 4.4% to 11.7% of the essential oils in leaves and from 4.8% to 13.8% of the
essential oils in the stems, depending on the time of harvesting.
In Chapter 4, a study of the essential oils from leaves and flowers of costmary, Balsamita
major (L.) Desf. (syn. Chrysanthemum balsamita L.) at different plant growth stages showed
that the highest oil content in both leaves and flowers is obtained before full flowering; 1.15%
and 1.34% (w/w) respectively. Seventy-eight volatile compounds were identified in the oils of
Balsamita major, of which 58 (19 tentatively, 39 positively) have not been reported
previously in this plant. Carvone and cc-thujone were found to be the predominant
compounds. Seasonal variations in the oil compositions were negligible except for the initial
phase (May 25), when the content of carvone was lower and the contents of a-thujone and
sesquiterpenes higher. Absolute amounts of most components were highest during the bud-
formation stage.
Flavour release measured by the dynamic headspace (DHS) method from different anatomical
parts of lovage (leaves, stems, flowers, seeds and roots) at various plant growth stages is
described in Chapter 5. Volatiles were isolated by DHS and characterised by GC-FID and
GC-olfactometry (GC-O) techniques. Ninety-eight compounds were identified in the
samples, 41 of which are reported among lovage volatiles for the first time. Qualitative
differences in the composition of DHS constituents in various anatomical parts of the plants
were not significant, whereas the quantities of a number of identified volatile compounds
were different in leaves, stems, flowers, seeds and roots. Seasonal variations in the
composition of headspace volatiles were also detected. Except for roots, P-phellandrene was
found to be the most abundant headspace component in all anatomical parts of lovage.
167
Summary
The sniffing panel characterised effluents from a GC column and odour descriptors were
attributed to the recognised constituents. None of the detected constituents was recognised as
a lovage key aroma compound.
The stability and properties of oil-in-water emulsions with caraway and olive oils as dispersed
phases were described in Chapter 6. It was shown that emulsions made with triglyceride oil
are more stable than those made with caraway essential oil as the dispersed phase. Emulsion
stability can be improved considerably by adding soyabean phosphatidylcholine (sb-PC) and
increasing the protein concentration. Adsorption of the lipid from the oil and the protein from
the aqueous phase at the oil/water interface can be studied by applying ellipsometry.
Independently of the concentration used, close to monolayer coverage of sb-PC is reached at
the caraway oil/aqueous interface. However, at the olive oil/aqueous interface, the presence of
only a small amount of sb-PC leads to an exponential increase in the layer thickness with time
beyond monolayer coverage. The amount of p-lactoglobulin adsorbed at the caraway
oil/aqueous interface was the same as at the olive oil/aqueous interface and corresponded
roughly to a protein monolayer.
Chapter 7 deals with the encapsulation of caraway essential oil into milk protein-based
matrices. Essential oil of caraway can successfully be encapsulated by milk derivatives either
alone or combined with carbohydrates. In a comparison between two milk derivatives, SMP
and WPC, the latter exhibited better encapsulating properties. Partial replacement of WPC by
carbohydrates increases the retention of volatiles during spray drying and enhances the
protective properties of solidified capsules against oxidation and the release of volatiles
during the timed period. SMP-based matrices showed the opposite tendency. The inner and
outer structural features of spray-dried capsules indicated that good physical protection is
afforded to the caraway essential oil.
The main results of the study are discussed in Chapter 8. It can be concluded that many
factors affect the yield and composition of volatile compounds in plants: these include
cultivar, climatic and agronomic conditions (fertilisation rate, cultivation site), harvesting
time, anatomical part of the plant, and the method used to isolate and characterise volatiles.
However, essential oils can be successfully processed by emulsifying and encapsulating them
168
Summary
in milk proteins, which helps to minimise losses from the oxidation of volatiles during storage
and also improves handling of the flavouring material during technological applications.
169
SAMENVATTING
Samenvatting
In dit proefschrift wordt een onderzoek beschreven naar de aromastoffen die voorkomen in
enkele planten van de families Umbelliferae en Asteraceae. Het doel van het onderzoek was
het ophelderen van de samenstelling van de aroma's van planten, die in Litouwen groeien, en
het beschrijven van enkele aspecten van hun verwerking en de daarbij optredende verliezen.
De samenstelling van het aroma van de volgende planten werd onderzocht: karwij, maggi,
peterselie, selderie, dille, balsemwormkruid. Het aroma van deze planten werd geanalyseerd
met verschillende technieken, zoals gaschromatografie in combinatie met massaspectrometrie
en snuffelpoort detectie (in het geval van de maggiplant). Het onderzoek naar de chemische
samenstelling van het plantaardige aroma was gericht op verschillende factoren, zoals het
moment van oogsten, het anatomische gedeelte van de plant, de gebruikte methode om de
vluchtige verbindingen te isoleren, het ras en de kunstmestgift tijdens de groei. De verdere
verwerking tot aroma en de daarbij optredende verliezen werd ook bestudeerd. Er werden
emulsies gemaakt van essentiele olien, waarvan de eigenschappen werden onderzocht,
evenals de adsorptie van eiwitten en vetten aan het olie/ water grensvlak. Ook werden
aromastoffen in capsules geanalyseerd en beschreven. In deze studie werd aangetoond dat
melkeiwitten goed kunnen functioneren als grondstoffen voor capsules van essentiele olien.
In Hoofdstuk 1 worden verschillende aspecten besproken van de geur- en smaak-
waarneming, evenals het gebruik van planten als bron van natuurlijk aroma en het behoud van
aromastoffen tijdens verwerking (o.a. in capsules). In het literatuuroverzicht wordt kort
ingegaan op isolatie en analyse van aroma en de factoren, die aromaverliezen bei'nvloeden. De
doelstellingen van de studie worden uiteengezet aan het einde van het hoofdstuk.
Een onderzoek naar de chemische samenstelling van de essentiele olien van lokaal verbouwde
gewassen van peterselie, selderie, dille en karwij wordt beschreven in Hoofdstuk 2. De
resultaten laten zien dat de hoeveelheden van de belangrijkste bestanddelen in dezelfde
volgorde en orde van grootte voorkwamen als beschreven in de literatuur. De geanalyseerde
dille kon ondergebracht worden bij het chemotype II (dilleapiole). De zaadopbrengst, het
essentiele oliegehalte en de chemische samenstelling van vier verschillende karwij-rassen, en
de invloed van de kunstmestgift daarop, werden onderzocht en als zodanig beschreven in dit
hoofdstuk. Het onderzoek toonde aan dat totale concentratie aan essentiele olie in de vruchten
schommelde tussen 1,9 en 4,3 ml per 100 g. De opbrengst aan vruchten van de karwij, die op
172
Samenvatting
de experimentele velden groeiden, gaf flinke verschillen te zien (van 84 kg tot 2673 kg per ha)
in samenhang met de kunstmestgift, de standplaats tijdens de groei en het ras zelf.
Hoofdstuk 3 gaat over de analyse van essentiele olien van verschillende delen van de maggi-
plant (blad, Stengel, bloem en zaad) bij verschillende stadia van de groei van de plant. Er werd
aangetoond dat seizoensinvloeden minder duidelijk waren voor het blad dan voor de Stengel.
Zaden en bloemen gaven de hoogste opbrengsten aan olie. Het blad had het hoogste
oliegehalte voor het stadium van de knopvorming. Er werd vastgesteld, dat a-terpinyl acetate
de belangrijkste verbinding was van het blad en de Stengel (tot 70%), en (3-phellandreen van
het zaad en de bloem (respectievelijk 61,5% en 40,8%). 2-Ligustilide werd ook in dit
onderzoek gezien als een belangrijk ftalide van maggi, de essentiele olie van het blad bevatte
4,4 tot 11,7% en dat van de Stengel 4,8 tot 13,8%, beide afhankelijk van het moment van
oogsten.
In een onderzoek naar verschillende groeistadia (Hoofdstuk 4) werd aangetoond, dat de
grootste hoeveelheid essentiele olie vlak voor de bloei van balsemwormkruid voorkwam,
namelijk in het blad en de bloem respectievelijk 1,15% en 1,34%. De vluchtige verbindingen
van de olie van balsemwormkruid werden gei'dentificeerd, waarvan er 58 (19 voorlopig en 39
definitief) niet eerder waren gerapporteerd over deze plant. Carvon en a-thujon waren de
belangrijkste verbindingen. Seizoensinvloeden op de oliesamenstelling waren te verwaarlozen
behalve voor de beginfase (25 mei), toen de gehalten van a-thujon en sesquiterpenen hoger en
het carvongehalte lager was. De absolute hoeveelheden van de meeste verbindingen waren het
hoogst tijdens de knopvorming.
Het vrijmaken van aromastoffen met behulp van de dynamische headspace methode (DHS)
uit verschillende anatomische delen van de maggiplant (blad, Stengel, bloem, zaad en wortel)
en bij verschillende groeistadia van de plant wordt beschreven in Hoofdstuk 5. Vluchtige
verbindingen worden geisoleerd met behulp van DHS en nader gespecificeerd met GC-FID en
GC-olfactometrische technieken. In de monsters werden 98 verbindingen gei'dentificeerd,
waarvan er 41 voor het eerst als verbindingen van de maggiplant worden gerapporteerd.
Kwalitatieve verschillen in de samenstelling van de DHS isolaten van verschillende
anatomische delen van de planten waren niet significant. Terwijl er wel verschillen gevonden
waren voor de hoeveelheden van een aantal gei'dentificeerde vluchtige verbindingen van het
173
Samenvatting
blad, de Stengel, de bloem, het zaad en de wortel. Seizoensinvloeden op de samenstelling van
de DHS isolaten werden ook waargenomen. Behalve bij de wortel was P-phellandreen de
meest voorkomende DHS verbinding in alle anatomische delen van de maggiplant. Het
snuffelpanel gaf een beschrijving van de vrijkomende gassen van een monster op een GC
kolom en kende attributen toe aan de bekende geurstoffen. Geen enkele hiervan werd herkend
als een kenmerkende geur van de maggiplant.
De stabiliteit en andere eigenschappen van olie-in-water emulsies met karwij en olijfolie als
gedispergeerde fase worden beschreven in Hoofdstuk 6. Er werd aangetoond dat emulsies
met een triglyceride olie als gedispergeerde fase stabieler zijn dan die met een karwij
essentiele olie. Emulsie stabiliteit kan aanzienlijk verbeterd worden door toevoeging van soja
fosfatidylcholine (SFC) en door verhoging van de eiwitconcentratie. De adsorptie van lipiden
uit de oliefase en van eiwit uit de waterfase aan het olie/ water grensvlak kan bestudeerd
worden met behulp van ellipsometrie. Vrijwel een monolaag bedekking van het karwij olie/
water grenslak werd verkregen met SFC, en wel onafhankelijk van de gebruikte concentratie.
Echter, bij het olijfolie/ water grensvlak, gaf de aanwezigheid van een klein beetje SFC
gedurende een bepaalde tijd een exponentiele toename van de laagdikte bovenop de monolaag
bedekking. De hoeveelheid (3-lactoglobuline, dat adsorbeerde aan het karwij olie/ water
grensvlak was hetzelfde als dat aan het olijfolie/ water grensvlak, en dat kwam globaal
overeen met een eiwit monolaag.
In Hoofdstuk 7 worden de karwij essentiele olie capsules gemaakt van matrixen van
melkeiwit. De essentiele olie van karwij kan met succes in capsules van melkpreparaten
worden opgenomen, zowel op zich als in combinatie met koolhydraten. In een vergelijking
van 2 melkpreparaten, met name een magere-melk eiwit en een weieiwit concentraat, bleken
de capsules van laatstgenoemde de betere eigenschappen te bezitten. Gedeeltelijke vervanging
van het weieiwit concentraat door koolhydraten verhoogt de retentie van vluchtige stoffen
tijdens het sproeidrogen en wordt door de vaste stof van de capsules de beschermende
werking (tegen aromaverliezen) voor een bepaalde tijd verhoogt. Matrixen van magere-melk
eiwitten lieten een tegengestelde tendens zien. De opbouw van de binnen- en buiten-struktuur
van de gesproeidroogde capsules toonde aan, dat een goede fysische bescherming van de
essentiele olie van karwij mogelijk moest zijn.
174
Samenvatting
De belangrijkste resultaten van de studie worden ter discussie gesteld in Hoofdstuk 8. De
conclusie is, dat veel factoren de opbrengst en samenstelling van vluchtige componenten in
planten bei'nvloeden Deze zijn het ras, het klimaat en de landbouwkundige omstandigheden
(kunstmestgift, plaats van de groei), het moment van oogsten, het anatomische deel van de
plant, de gebraikte methode voor de isolatie en de analyse van de vluchtige stoffen. Essentiele
olien kunnen met succes verwerkt worden door emulgatie met melkeiwitten om er daarna
capsules van te maken. Dit laatste helpt bij het tegengaan van verliezen door oxidatie van het
aroma tijdens opslag en ook bij het gemakkelijker hanteerbaar maken van aromapreparaten
voor technologische toepassingen.
175
ACKNOWLEDGEMENTS
First I am grateful to and want to thank to my co-promoters Jacques Roozen and Rimantas
Venskutonis. Without their support this thesis would never have been completed.
I would also like to thank Tommy Nylander for his never - ending enthusiasm and always
being willing to share his spare time during my work with the most unstable thing in the
world - emulsions. Big thank to Marie Paulsson for enormous optimism and the hospitality
in Lund.
All personnel at Kaunas University of Technology, particularly department of Food
Technology, Department Food Technology & Nutritional Sciences,WAU and Physical
Chemistry 1, Lund University are thanked for creating such friendly atmosphere. I would
especially like to mention and thank Ramute Mazdzieriene, Aagje Legger, Jan Cozijnsen,
Ingegerd Lind and Harold Bult for the skillful laboratory assistance and help with details.
All my colleagues who became more than colleagues for me are thanked for the cooperation
and friendship, scientific and personal support I have obtained during these years: Sonia,
Kristina, Elodie, Nicoleta, Yuliya, Sergey, Ruggero, Irina.
Aciu visiems!

178
List of publications
Bylaite, E.; Venskutonis, R.; Roozen, J.P. and Posthumus, M.A. (2000). "Composition of
essential oil of costmary [Balsamita major (L.) Desf] at different growth phases." J.
Agric. Food Chem., in press.
Bylaite, E.; Venskutonis, R. and Mazdzieriene, R. (2000). "Properties of encapsulated caraway
essential oil into milk proteins based matrices". J. Agric. Food Chem.,submitted.
Bylaite, E.; Nylander, T. and Venskutonis, R. (1999). "Emulsification of caraway essential oil
in water by lecithin and P-lactoglobulin - emulsion stability and properties the formed
oil-aqueous interface". J. Dairy Science, submitted.
Bylaite, E.; Roozen, J.P.; Legger, A.; Venskutonis, R.P. and Posthumus, M.A. (1999).
"Dynamic headspace-gas chromatography-olfactometry analysis of different anatomical
parts of Lovage (Levisticum Officinale Koch.) at eight growth phases." J. Agric. Food
Chem., submitted.
Venskutonis, R.P.; Kvietkauskaite, D.; Bylaite, E. and Suliauskas, A. (1999). "Characterization
of caraway {Carum Carvi L.) cultivated in Lithuania". Horticulture and Vegetable
Growing. Scientific Works of the Lithuanian Institute of Horticulture and Lithuanian
University of Agriculture, 18 (3), 85-92.
Bylaite, E.; Venskutonis, R.P.; and Roozen, J.R. (1998). "Influence of harvesting time on the
composition of volatile components in different anatomical parts of lovage {Levisticum
officinale Koch.)". J. Agric. Food Chem.. 46 (9), 3735-3740.
Bylaite, E. and Venskutonis, R.P. (1997). "Stability of microencapsulated caraway {Carum
carvi L.) essential oil during storage". In Proceedings of the 3rd main meeting of EC
Copernicus Concerted Action "Process optimisation and minimal processing of foods ",
Vol. 3 "Drying", eds. J.C.Oliveira and F.A.R. Oliveira, pp. 81-87.
Bylaite, E.; Legger, A.; Roozen, J.P. and Venskutonis, R.P. (1996). "Dynamic headspace gas
chromatography of different botanical parts of lovage {Levisticum officinale Koch.)". In
179
"Flavour Science: Recent developments", eds. A.J.Taylor, D.S.Mottram, The Royal
Society of Chemistry, UK, p.66-69.
Venskutonis, R.P.; Bylaite, E. and Narkevicius, R. (1996). "Optimisation of Encapsulation
Conditions of Caraway (Carum carvi L.) essential oil". In Proceedings of the 2nd main
meeting of EC Copernicus Concerted Action "Process optimisation and minimal
processing of foods", Vol. 3 "Drying", ed. J.C.Oliveira, pp. 95-101.
Bylaite, E. and Venskutonis, R. (1994). "Essential oils of parsley and celery from Lithuania".
Scientific works "Food chemistry and technology", Vilnius, Academia, p. 69-74.
Bylaite, E. and Venskutonis, R. (1994). "Composition of commercial peppermint (Mentha
piperita) essential oil from Lithuania". Proceedings of the conference "Maisto chemija ir
technologija". Kaunas, "Technologya", p. 12-14
Bylaite E., Venskutonis, R. (1994). "Volatile constituents of dill". Proceedings of the
conference "Maisto chemija ir technologija". Kaunas, "Technologija", p. 15-18.
180
CURRICULUM VITAE
Egle Bylaite was born on 22 July, 1969 in Birstonas, Lithuania. In 1987 she obtained high
school diploma in Raseiniai and started her studies of Food Technology at Kaunas University
of Technology. During these studies she carried out research at the Department of Organic
Chemistry, Gent University, Belgium which was sponsored by Tempus program and in 1993
graduated with an MSc in Food Science. From 1995 she was a doctoral student of the
cooperative PhD program between laboratories of Food Science of Kaunas University of
Technology, Lithuania and Wageningen University, The Netherlands. In the period of
1995/1996 she was working at the Department of Agrotechnology and Food Sciences,
Wageningen University. Later research work was continued at the Department of Food
Technology, Kaunas University of Technology. In 1998 Egle carried out research at the
Department Physical Chemistry 1, Lund University, Sweden sponsored by Nordic Academy
for Advanced Studies (NorFA). Since Jan 2000 she stayed at the Department of the
Agrotechnology and Food Sciences for the completing of her PhD thesis by writing this book.
All research that has taken place during her doctoral studies is described in this thesis.
181

182