
Application of MIR Spectroscopy to the Evaluation of ...
16
foods Article Application of MIR Spectroscopy to the Evaluation of Chemical Composition and Quality Parameters of Foal Meat: A Preliminary Study Marta Ruiz 1 , María José Beriain 1 , Miguel Beruete 2 , Kizkitza Insausti 1, * , José Manuel Lorenzo 3 and María Victoria Sarriés 1, * 1 Research Institute for Innovation and Sustainable Development in Food Chain (IS-FOOD), Universidad Pública de Navarra, Campus de Arrosadía, 31006 Pamplona, Spain; [email protected] (M.R.); [email protected] (M.J.B.) 2 Multispectral Biosensing Group, Navarrabiomed, Complejo Hospitalario de Navarra (CHN), Instituto de Investigación Sanitaria de Navarra (IdiSNA), Universidad Pública de Navarra (UPNA), Irunlarrea 3, 31008 Pamplona, Navarra, Spain; [email protected] 3 Centro Tecnológico de la Carne de Galicia (CTC), Rúa Galicia 4, Parque Tecnológico de Galicia, San Cibrao das Viñas, 32900 Ourense, Spain; [email protected] * Correspondence: [email protected] (K.I.); [email protected] (M.V.S.) Received: 30 March 2020; Accepted: 30 April 2020; Published: 5 May 2020 Abstract: The aim of this work was to study the potential of mid-infrared spectroscopy to evaluate the chemical composition and quality parameters of foal meat according to differences based on slaughter ages and finishing diets. In addition, the wavelength ranges which contribute to this meat quality differentiation were also determined. Important characteristics as moisture and total lipid content were well predicted using Mid-Infrared Spectroscopy (MIR)with Rv 2 values of 82% and 66%, respectively. Regarding fatty acids, the best models were obtained for arachidonic, vaccenic, docosapentaenoic acid (DPA), and docosahexaenoic acid (DHA) with Rv 2 values over 65%. Quality parameters, as instrumental colour and texture and sensory attributes did not reach high prediction coefficients (R 2 ). With the spectra data of the region 2198–1118 cm -1 , samples were accurately classified according to slaughter age (78%) and finishing diet (72%). This preliminary research shows the potential of MIR spectroscopy as an alternative tool to traditional meat chemical composition methods. Finally, the wavelength range of the spectrum from 2198 to 1118 cm -1 showed good results for classification purposes. Keywords: MIR spectroscopy; foal meat; chemical composition; quality parameters 1. Introduction Nowadays, high assurance of quality and safety during food production is being extremely demanded. Thus, strict controls both throughout the production and during the marketing process are required [1]. This demand and the agricultural industries supervision make highly desirable, food analysis methods which are speed, ease to use, with non-preparation or minimum sample preparation, with non-destruction of samples, low cost, and environmentally sustainable [2,3]. In this way, the Near-Infrared Spectroscopy (NIR) and Attenuated Total Reflectance-Fourier Transform Mid-Infrared Spectroscopy (ATR-FT/MIR) are practical options, as they fulfil the requirements aforementioned. MIR spectroscopy applications in food analysis are diverse although its current use is limited. Especially for meat, several topics have been studied: (1) determination of chemical composition, (2) detection of microbiological spoilage, (3) authentication of products or (4) detection of meat adulterations [1]. Nevertheless, there is a lack of knowledge regarding the use of MIR spectroscopy to evaluate meat Foods 2020, 9, 583; doi:10.3390/foods9050583 www.mdpi.com/journal/foods
Transcript of Application of MIR Spectroscopy to the Evaluation of ...
foods
Article
Application of MIR Spectroscopy to the Evaluation ofChemical Composition and Quality Parameters ofFoal Meat: A Preliminary Study
Marta Ruiz 1, María José Beriain 1 , Miguel Beruete 2 , Kizkitza Insausti 1,* ,José Manuel Lorenzo 3 and María Victoria Sarriés 1,*
1 Research Institute for Innovation and Sustainable Development in Food Chain (IS-FOOD), UniversidadPública de Navarra, Campus de Arrosadía, 31006 Pamplona, Spain; [email protected] (M.R.);[email protected] (M.J.B.)
2 Multispectral Biosensing Group, Navarrabiomed, Complejo Hospitalario de Navarra (CHN), Instituto deInvestigación Sanitaria de Navarra (IdiSNA), Universidad Pública de Navarra (UPNA), Irunlarrea 3,31008 Pamplona, Navarra, Spain; [email protected]
3 Centro Tecnológico de la Carne de Galicia (CTC), Rúa Galicia 4, Parque Tecnológico de Galicia, San Cibraodas Viñas, 32900 Ourense, Spain; [email protected]
* Correspondence: [email protected] (K.I.); [email protected] (M.V.S.)
Received: 30 March 2020; Accepted: 30 April 2020; Published: 5 May 2020�����������������
Abstract: The aim of this work was to study the potential of mid-infrared spectroscopy to evaluatethe chemical composition and quality parameters of foal meat according to differences based onslaughter ages and finishing diets. In addition, the wavelength ranges which contribute to this meatquality differentiation were also determined. Important characteristics as moisture and total lipidcontent were well predicted using Mid-Infrared Spectroscopy (MIR)with Rv2 values of 82% and66%, respectively. Regarding fatty acids, the best models were obtained for arachidonic, vaccenic,docosapentaenoic acid (DPA), and docosahexaenoic acid (DHA) with Rv2 values over 65%. Qualityparameters, as instrumental colour and texture and sensory attributes did not reach high predictioncoefficients (R2). With the spectra data of the region 2198–1118 cm−1, samples were accuratelyclassified according to slaughter age (78%) and finishing diet (72%). This preliminary research showsthe potential of MIR spectroscopy as an alternative tool to traditional meat chemical compositionmethods. Finally, the wavelength range of the spectrum from 2198 to 1118 cm−1 showed good resultsfor classification purposes.
Keywords: MIR spectroscopy; foal meat; chemical composition; quality parameters
1. Introduction
Nowadays, high assurance of quality and safety during food production is being extremelydemanded. Thus, strict controls both throughout the production and during the marketing process arerequired [1]. This demand and the agricultural industries supervision make highly desirable, foodanalysis methods which are speed, ease to use, with non-preparation or minimum sample preparation,with non-destruction of samples, low cost, and environmentally sustainable [2,3]. In this way,the Near-Infrared Spectroscopy (NIR) and Attenuated Total Reflectance-Fourier Transform Mid-InfraredSpectroscopy (ATR-FT/MIR) are practical options, as they fulfil the requirements aforementioned.MIR spectroscopy applications in food analysis are diverse although its current use is limited. Especiallyfor meat, several topics have been studied: (1) determination of chemical composition, (2) detectionof microbiological spoilage, (3) authentication of products or (4) detection of meat adulterations [1].Nevertheless, there is a lack of knowledge regarding the use of MIR spectroscopy to evaluate meat
Foods 2020, 9, 583; doi:10.3390/foods9050583 www.mdpi.com/journal/foods
Foods 2020, 9, 583 2 of 16
quality, concerning not only chemical composition, but also texture, colour parameters, or evensensory attributes. Regarding this last group, Yancey et al. [4] were able to predict the tendernessand overall appraisal evaluated by a consumer panel by the employment of non-invasive techniquessuch as NIR spectroscopy. In addition, Ripoll et al. [5], obtained successful results predicting somechemical parameters (moisture, fat, water holding capacity), the shear force and sensory tenderness byNIR spectroscopy.
According to world consumption of foal meat, Mongolia (5.81 kg) is the country with the highesthorsemeat supply per capita followed by Kazakhstan (4.92 kg), Kyrgyzstan (3.50 kg), Iceland (2.19 kg),Switzerland (0.73 kg) and Italy (0.70 kg) [6]. Currently, studies on foal meat have noticeably arisenbecause of its healthy properties and sustainable production, which make it an alternative meat forconsumers, whose demand for healthy and safe products is continuously increasing [7]. Nevertheless,this kind of meat must be more exhaustively defined according to different factors as slaughter ageor feeding, which play an important role in meat quality [8,9]. In this way, rapid, non-destructivetechniques such as MIR spectroscopy would be helpful to differentiate foal meat regarding thementioned factors. Besides, NIR spectroscopy has been widely applied in the food industry, but newwavelengths of the spectrum should be studied in order to try and overcome the current limitationsthat the near-infrared spectrum has.
Thus, the general objective of the present work was to investigate the potential of MIR spectroscopyto evaluate the chemical composition and quality parameters of foal meat from animals of differentages and feeding regimes. In addition, the wavelength ranges which contribute to this meat qualitydifferentiation were also determined.
2. Materials and Methods
2.1. Animal Management and Meat Sampling
Forty-six foals obtained by crossing Galician Mountain mares with a Burguete stallion wereused. The animals were reared under semi-extensive conditions. A fuller description of the animalmanagement has been published in Ruiz et al. [10]. Twenty-two foals were slaughtered at 13 months(13M) and another 24 at 26 months of age (26M). Prior to slaughter, all the foals were supplemented fora fattening period of about 104 days. Two study groups were formed by randomly assigning 11 foalsfrom the 13M group and 12 foals from the 26M group to be supplemented on pasture with a standardconcentrate (SC) (2 kg per foal and day) and pasture; and 11 foals from the 13M group and 12 foalsfrom the 26M group to be supplemented on pasture with a linseed-enriched concentrate (5%) (LC)(2 kg per foal and day) and pasture.
Foals were slaughtered and dressed according to the specifications outlined in the Europeanlegislation (Council Regulation 1099/2009).
Immediately after slaughter, hot carcass weight was determined, and once chilled for 24 h at4 ± 1 ◦C, cold carcass weight (kg) and dressing percentage (%) were determined 10]. At this point, theleft half-carcasses were transported under refrigeration to the research center pilot plant at 4 ± 1 ◦C.Longissimus thoracis (LDT) muscle was removed from the left half-carcasses. This muscle was employedbecause it is the reference muscle in meat science studies, and it is one of the most commerciallyvaluable muscles with respect to foal meat. Twenty-four hours after removal, 46 LDT samples wereanalysed. In order to carry out the analyses, the LDT section ranging between the seventh and thetwelfth rib was employed, following the same cutting order for all the analyses. They were thensliced into five 20 mm (±0.2) thick steaks (FIRMAQ, V-900, Lorca, Spain) simulating the standardcutting thickness at the sale point. Then, they were vacuum-packaged and frozen at −18 ◦C (±2) to betransported to the Public University of Navarra where samples were frozen-preserved for ninety daysand then, prior to each analysis, samples were thawed overnight in a fridge at 4 + 1 ◦C.
Foods 2020, 9, 583 3 of 16
2.2. Meat Physicochemical Analysis
2.2.1. Chemical Composition
The moisture, protein, ash, total lipids content, pH, and water holding capacity were performedfollowing the procedure of Dominguez et al. [11]. Total and soluble collagen content were determinedfrom the hydroxyproline content [12].
2.2.2. Meat Colour Evaluation
The spectral reflectance of the samples, provided by a Minolta CM2002 spectrophotometer with aD65 illuminant and a 10◦ standard observer, was used to calculate the proportion of each pigment form.Relative myoglobin (DMb) (%), metmyoglobin (MMb) (%) and oxymyoglobin (OMb) (%) contents wereobtained from the reflex attenuance at the isobestic points 572, 525, 473, and 700 nm [13]. Reflectancevalues were converted into absorbance values according to the formula:
A = 2−log10R (1)
where A is absorbance and R is reflectance [14].To assess meat colour by Image Analyses, RGB colour values were determined for each sample
(R, G, and B) individually. Where R stands for red colour, B means blue, and G stands for green.The colour range varies from 0 to 225. The value “0” means: 100% of the light is reflected, and value“225” means: 100% of the light is absorbed. Samples were examined under the microscope and bothsides photographed. The microscope images obtained were digitised by the employment of an imageanalysis software (ImageJ 1.47, LOCI, University of Wisconsin, WI, USA). The average red, greenand blue values were obtained. The CIEL*a*b* system was also employed. Lightness (L*), redness(a*), yellowness (b*), chromaticity (C*) and hue (h*) [15] were assessed following the methodologyestablished by Mendizabal et al. [16].
2.2.3. Intramuscular Fatty Acids Analysis
Fatty acid profile was determined as it is shown in Domínguez et al. [14]. But, for this study,the most remarkable fatty acids from the nutritional point of view were selected. These are: stearic(C18:0), oleic (C18:1n9c), linoleic (C18:2n6c), linolenic (C18:3n3), arachidonic (C20:4n6) and vaccenic(CLA precursor) (C18:1n11t) acids. Finally, eicosapentaenoic (EPA, C20:5n3), docosapentaenoic (DPA,C22:5n3), docosahexaenoic (DHA, C22:6n3) and n-6 total PUFA content were studied as well.
2.2.4. Texture Analysis
The maximum shear force was assessed using a Warner–Bratzler shear force (WBSF) (N) device.Eight replicates per sample of 1 cm2 (square cross-section), with muscle fibres parallel to thelongitudinal axis of the sample were analysed. A TA-XT2i texturometer (Stable Micro Systems, Surrey,United Kingdom) was used connected to an IBM-compatible Foxen computer, with microprocessorAutenticAMD-K6™ 3D processor. The program employed was “Texture Expert” version 1.22 toWindows (Stable Micro Systems, Surrey, UK).
2.3. Consumer Panel Evaluation
A consumer panel integrated by 247 panelists from Pamplona (Navarra, Spain) was employed.The demographic distribution of consumers for the experiment was as follows: according to gender(50.3 vs. 49.7% for male and female, respectively), age (36.9 vs. 35.2 vs. 19.7 vs. 8.3%, for age ranges of20–34, 35–50, 51–65, and >65 respectively), and education (73.2 vs. 20.5 vs. 6.3%, for degree, secondary,and elementary studies, respectively) and incomes (3.2 vs. 12.1 vs. 45.0 vs. 36.0%, for incomeranges of < 900€/month, 900€–1.500€/month, 1.500€–3.000€/month, and >3.000 €/month, respectively).The methodology used for consumer taste panels was previously described by Beriain et al. [17].
Foods 2020, 9, 583 4 of 16
Nine sessions integrated by 27/28 consumers per session took place. The frozen steaks were thawedat 2 ◦C for approximately 24 h and cooked on a grill (Magefesa, Spain) according to the AMSAguidelines [18] until they reached 70 ◦C of internal temperature. Four steak-pieces (one from each ageand diet combination) were presented to the consumers one by one in a random order [19]. Panelistswere asked to rate their liking for tenderness, juiciness, and their overall appraisal of the samples.A 9-point hedonic scale was used, being 1 = “Dislike extremely”, 2 = “Dislike very much”, 3 = “Dislikemoderately”, 4 = “Dislike slightly”, 5 = “Neither like nor dislike”, 6 = “Like slightly”, 7 = “Likemoderately”, 8 = “Like very much” and 9 = “Like extremely”.
Statistical analysis was conducted using the IBM SPSS Statistics 25 for Windows (SPSS Inc.Corporation, NY, USA) to obtain the descriptive statistics of the physical, chemical, and consumerevaluation of the samples. The mean plus standard deviation and the coefficient of variation (%)were obtained.
2.4. Mid-Infrared Spectra Measurements and Spectral Acquisition
All the samples were thawed overnight in a fridge at 4 ± 1 ◦C, prior to the analysis with theATR-FT/MIR spectroscopy. The measuring instrument used in this research was a FTIR Vertex 80vspectrometer (Bruker, Ettlingen, Germany). This equipment allows to work under vacuum conditionsin the optical system which reduces the possible interferences produced by the water vapor or thecarbon dioxide in the measurements. This device is located in a clean room certified accordingto ISO 14644-1:2015. There, the concentration of particles present in the air and the temperature(constantly maintained at 22 ◦C) were controlled. The measurements were made with an accessoryA225 / QPlatinum-ATR (Bruker, Germany) made of a diamond crystal.
Firstly, a reference spectrum was taken with the ATR device empty, and then the spectrum of eachof the samples was measured. It was necessary to place the meat sample on the crystal, ensuring theentire crystal surface was completely covered and that there was a perfect contact between the sampleand the crystal. In total, 6 replicates were performed per sample. For each sample, 32 scans in the4000–400 cm−1 spectral range were recorded with a resolution of 4 cm−1.
2.5. Selection of Optimal Wavenumber Region and Spectral Pre-Treatment Method
Different wavenumber ranges and pre-treatment methods (first/ second derivative, standardnormal variate, maximum/ minimum or vector normalisation, multiplicative scatter correction orremoval of constant slope) were studied to find models with better performance. These pre-treatmentswere employed on the performance of PLS as a previous step before being evaluated. The selection ofpre-treatments and spectral ranges supplied by models represents a key parameter to be taken intoaccount in a multivariate analysis according to a specific program of chemometrics, OPUS Quant 2(Bruker, Ettlingen, Germany).
2.6. Data processing and Calibration Models
2.6.1. Regression Model
Partial least squares (PLS) regression is a supervised analysis based on the relation betweenspectral intensity and sample characteristics [20]. In the present study, PLS technique was used toobtain quantitative prediction of the parameters of interest and it is generally carried out in two steps.To construct a model, the first step is to collect a calibration set of samples for establishing a multiplelinear regression between the Mid-Infrared Region (MIR) spectra and the various parameters of thesample set in order to perform a calibration. The second step consists in testing developed calibrationmodels on validation sets so as to verify model accuracy and robustness.
Foods 2020, 9, 583 5 of 16
The chemical bonds associated with each peak of the FTIR spectra were determined by analyzingthe physicochemical composition and sensory properties of the samples, by correlations among thebands with larger intensity, and by comparing the wavenumbers with the literature [3].
Then, the analysis was particularised to the physical, chemical, and sensory properties of thesamples, and prediction models were built using the results obtained by the described methods asreference values. Spectral data pre-treatments such as standard normal variate (SNV), multiplicativescatter correction (MSC) and first or second order derivatives were applied to the spectra to reducescattering effects and to correct peak overlap and baseline drifts. The models were built using a specificprogram of chemometrics, OPUS Quant 2 (Bruker, Ettlingen, Germany).
2.6.2. Validation Model
The calibration models were developed using the Partial Least Square (PLS) regression methodand validated by cross-validation. The main advantage of cross-validation is that a small number ofsamples are required because the same set of samples is used to calibrate and validate the method.The optimum number of factors in the PLS calibration models was indicated by the lowest number thatgave the minimum value of the root mean square error (RMSE) in cross-validation, in order to avoidoverfitting of the models. In each variable analysed, the range of wavenumbers with more informationin their absorbance and the best pre-treatment method were selected using the OPUS Quant 2 program.During the calibration and prediction stages, the outliers were detected and kept out of the predictionmodels. The models were tested to predict the different parameters in the independent validationset and the best calibration models were selected based on the highest determination coefficient ofcalibration (Rc2), determination coefficient of cross-validation (Rv2) and the lowest root mean squareerror of calibration (RMSEC), root mean square error of cross-validation (RMSECV) and the ratio ofprediction to deviation (RPD). These models enable a quantitative estimation of the physicochemicalcomposition, colour parameters, and sensory attributes of the different samples depending on theabsorbance intensity.
2.7. Multivariate Analysis
2.7.1. Pearson’s (r) coefficients of correlation
Pearson’s (r) coefficients of correlation between the meat quality response variables weredetermined. In addition, correlations between the most relevant wavelengths found throughoutthe spectra were studied. A positive correlation coefficient close to 1 indicates that when band intensityincreases, the signal of the other band increases as well. This means that the same link or structuralunit is in different bands with different modes of vibration. A negative correlation coefficient nearby to−1 reflects that an increase in a signal coincides with the decrease in the other compared signal. In nocase, correlation must be understood as synonymous with causality.
2.7.2. Principal Component Analysis (PCA)
With the most representative wavelength range obtained by the models, principal componentanalysis (PCA) was applied to reduce the number of variables. PCA determines linear combinationsof the original variables to summarise the data with minimal loss of information. Varimax rotationwas applied to the factors to facilitate interpretation and maximise the explained variance. Once thePC variables were obtained, canonical discriminant analysis was carried out to classify the samples.A stepwise model analysis using a significance level of 0.05 as the variable entry criterion was appliedfor the discriminant procedure. The leave-one-out cross-validation method was used to validatethe model.
Foods 2020, 9, 583 6 of 16
2.7.3. Canonical Discriminant Analysis
Canonical discriminant analysis method was developed to classify the animals into the differentslaughter ages and finishing diets. Discriminant analysis was developed including the mediumspectroscopy wavelengths, and it was conducted using stepwise model analysis, which performed thebest-subset selection of the quantitative predictor by a procedure of entrance-remove of variables inthe model. The significant level of a variable to enter in the model was 0.05.
3. Results
3.1. Physicochemical and Sensory Description of Longissimus Thoracis Et Lumborum Muscle of Foal Meat
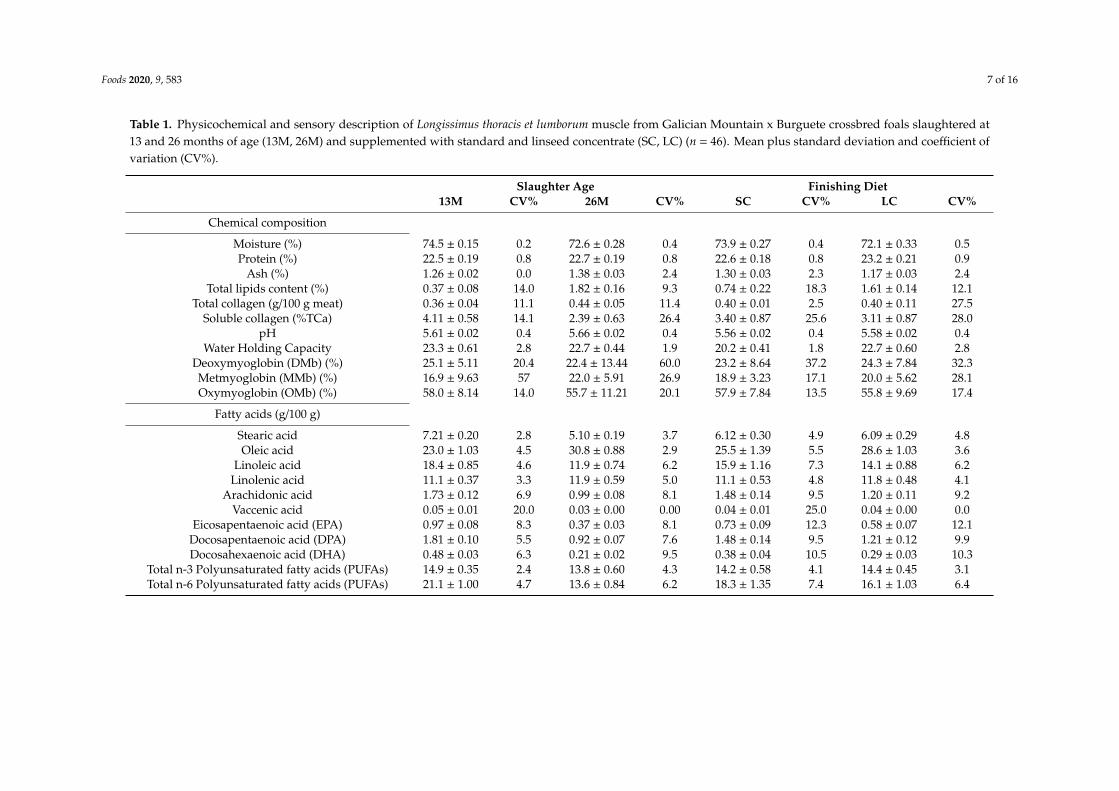
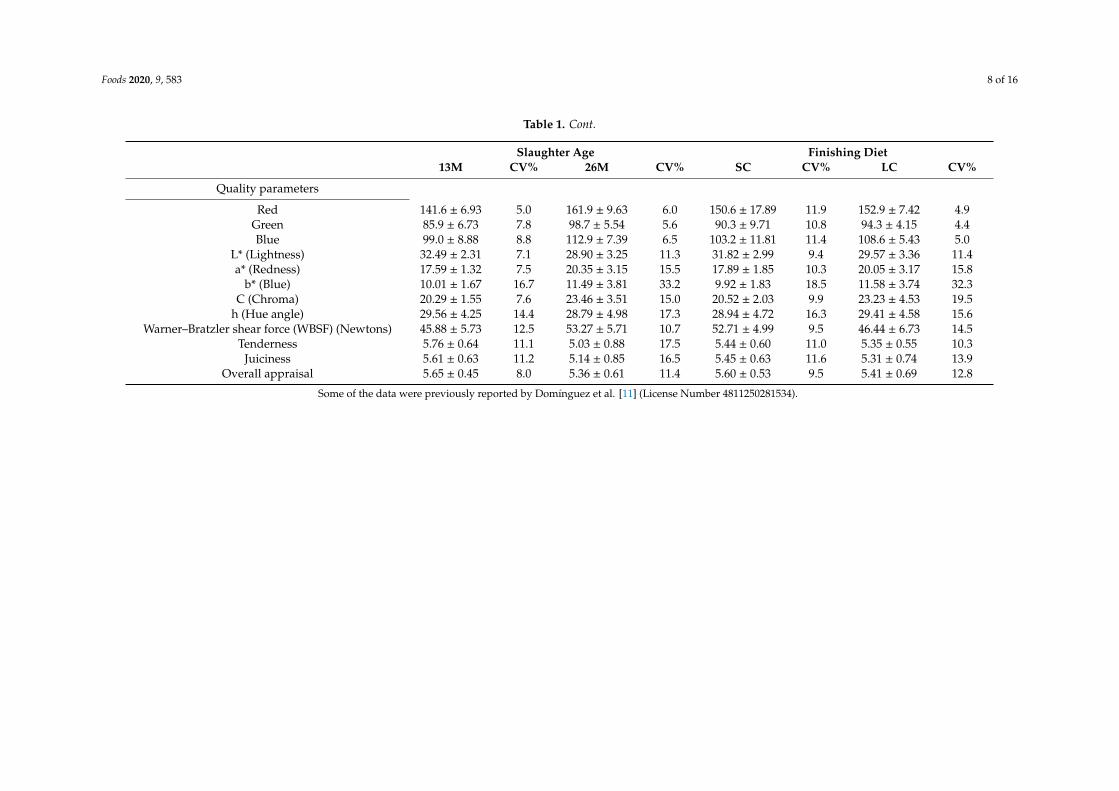
Table 1 shows a description of foal meat in terms of composition and quality according to theslaughter age (SA) and finishing diet (FD). No interactions (SAxFD) were found (p < 0.05) on any ofthe parameters evaluated, except for ash, L*, b*, C*, h* and WHC as reported by Domínguez et al. [11]in these same animals. In terms of chemical composition, the most noteworthy point is the lowermoisture and more than twice the total lipids content presented by the 26M samples in contrast tothe 13M samples (p < 0.001; p < 0.001; respectively). Fatty acids are generally different depending onslaughter age (p < 0.001), but not on finishing diet (p > 0.05). According to RGB values, all of themwere higher in 26M and LC than in 13M samples and SC samples (p < 0.001; respectively). RegardingCIELab colour space, the 26M samples showed lower L* (p < 0.001) and higher a* (p < 0.001) andC* values (p < 0.001) than the 13M samples. With regard to the FD effect, the SC samples seemed tohave higher L* and lower a*, b* values than the LC samples (p < 0.01; p < 0.01; p < 0.05, respectively).Regarding WBSF, the 26M samples presented higher shear force (N) than the 13M samples (p < 0.05).As for the FD effect, the meat from the SC group showed higher values of shear force (N) than thatfrom the LC group (p < 0.05). Sensory attributes evaluated by consumers showed that meat from 13Mfoals showed higher tenderness (p < 0.001) and juiciness (p < 0.05) values than 26M samples. Thus,it can be stated that the differences due to finishing diet were less relevant than the differences due toslaughter age.
Regarding the relationship between physicochemical and sensory variables, the most remarkablecorrelations were found between the overall appraisal with tenderness and juiciness (r = 0.89, r = 0.87,respectively; p > 0.01). Moisture was positively correlated to tenderness (r = 0.38; p > 0.01) and overallappraisal (r = 0.31; p > 0.05), whereas total lipids content was negatively correlated to tenderness(r = −0.40; p > 0.01) and juiciness (r = −0.35; p > 0.05). All colour variables from the image analyses(RGB) and the CIELab system were negatively correlated to overall appraisal (p > 0.05).
Foods 2020, 9, 583 7 of 16
Table 1. Physicochemical and sensory description of Longissimus thoracis et lumborum muscle from Galician Mountain x Burguete crossbred foals slaughtered at13 and 26 months of age (13M, 26M) and supplemented with standard and linseed concentrate (SC, LC) (n = 46). Mean plus standard deviation and coefficient ofvariation (CV%).
Slaughter Age Finishing Diet13M CV% 26M CV% SC CV% LC CV%
Chemical composition
Moisture (%) 74.5 ± 0.15 0.2 72.6 ± 0.28 0.4 73.9 ± 0.27 0.4 72.1 ± 0.33 0.5Protein (%) 22.5 ± 0.19 0.8 22.7 ± 0.19 0.8 22.6 ± 0.18 0.8 23.2 ± 0.21 0.9
Ash (%) 1.26 ± 0.02 0.0 1.38 ± 0.03 2.4 1.30 ± 0.03 2.3 1.17 ± 0.03 2.4Total lipids content (%) 0.37 ± 0.08 14.0 1.82 ± 0.16 9.3 0.74 ± 0.22 18.3 1.61 ± 0.14 12.1
Total collagen (g/100 g meat) 0.36 ± 0.04 11.1 0.44 ± 0.05 11.4 0.40 ± 0.01 2.5 0.40 ± 0.11 27.5Soluble collagen (%TCa) 4.11 ± 0.58 14.1 2.39 ± 0.63 26.4 3.40 ± 0.87 25.6 3.11 ± 0.87 28.0
pH 5.61 ± 0.02 0.4 5.66 ± 0.02 0.4 5.56 ± 0.02 0.4 5.58 ± 0.02 0.4Water Holding Capacity 23.3 ± 0.61 2.8 22.7 ± 0.44 1.9 20.2 ± 0.41 1.8 22.7 ± 0.60 2.8
Deoxymyoglobin (DMb) (%) 25.1 ± 5.11 20.4 22.4 ± 13.44 60.0 23.2 ± 8.64 37.2 24.3 ± 7.84 32.3Metmyoglobin (MMb) (%) 16.9 ± 9.63 57 22.0 ± 5.91 26.9 18.9 ± 3.23 17.1 20.0 ± 5.62 28.1Oxymyoglobin (OMb) (%) 58.0 ± 8.14 14.0 55.7 ± 11.21 20.1 57.9 ± 7.84 13.5 55.8 ± 9.69 17.4
Fatty acids (g/100 g)
Stearic acid 7.21 ± 0.20 2.8 5.10 ± 0.19 3.7 6.12 ± 0.30 4.9 6.09 ± 0.29 4.8Oleic acid 23.0 ± 1.03 4.5 30.8 ± 0.88 2.9 25.5 ± 1.39 5.5 28.6 ± 1.03 3.6
Linoleic acid 18.4 ± 0.85 4.6 11.9 ± 0.74 6.2 15.9 ± 1.16 7.3 14.1 ± 0.88 6.2Linolenic acid 11.1 ± 0.37 3.3 11.9 ± 0.59 5.0 11.1 ± 0.53 4.8 11.8 ± 0.48 4.1
Arachidonic acid 1.73 ± 0.12 6.9 0.99 ± 0.08 8.1 1.48 ± 0.14 9.5 1.20 ± 0.11 9.2Vaccenic acid 0.05 ± 0.01 20.0 0.03 ± 0.00 0.00 0.04 ± 0.01 25.0 0.04 ± 0.00 0.0
Eicosapentaenoic acid (EPA) 0.97 ± 0.08 8.3 0.37 ± 0.03 8.1 0.73 ± 0.09 12.3 0.58 ± 0.07 12.1Docosapentaenoic acid (DPA) 1.81 ± 0.10 5.5 0.92 ± 0.07 7.6 1.48 ± 0.14 9.5 1.21 ± 0.12 9.9Docosahexaenoic acid (DHA) 0.48 ± 0.03 6.3 0.21 ± 0.02 9.5 0.38 ± 0.04 10.5 0.29 ± 0.03 10.3
Total n-3 Polyunsaturated fatty acids (PUFAs) 14.9 ± 0.35 2.4 13.8 ± 0.60 4.3 14.2 ± 0.58 4.1 14.4 ± 0.45 3.1Total n-6 Polyunsaturated fatty acids (PUFAs) 21.1 ± 1.00 4.7 13.6 ± 0.84 6.2 18.3 ± 1.35 7.4 16.1 ± 1.03 6.4
Foods 2020, 9, 583 8 of 16
Table 1. Cont.
Slaughter Age Finishing Diet13M CV% 26M CV% SC CV% LC CV%
Quality parameters
Red 141.6 ± 6.93 5.0 161.9 ± 9.63 6.0 150.6 ± 17.89 11.9 152.9 ± 7.42 4.9Green 85.9 ± 6.73 7.8 98.7 ± 5.54 5.6 90.3 ± 9.71 10.8 94.3 ± 4.15 4.4Blue 99.0 ± 8.88 8.8 112.9 ± 7.39 6.5 103.2 ± 11.81 11.4 108.6 ± 5.43 5.0
L* (Lightness) 32.49 ± 2.31 7.1 28.90 ± 3.25 11.3 31.82 ± 2.99 9.4 29.57 ± 3.36 11.4a* (Redness) 17.59 ± 1.32 7.5 20.35 ± 3.15 15.5 17.89 ± 1.85 10.3 20.05 ± 3.17 15.8
b* (Blue) 10.01 ± 1.67 16.7 11.49 ± 3.81 33.2 9.92 ± 1.83 18.5 11.58 ± 3.74 32.3C (Chroma) 20.29 ± 1.55 7.6 23.46 ± 3.51 15.0 20.52 ± 2.03 9.9 23.23 ± 4.53 19.5
h (Hue angle) 29.56 ± 4.25 14.4 28.79 ± 4.98 17.3 28.94 ± 4.72 16.3 29.41 ± 4.58 15.6Warner–Bratzler shear force (WBSF) (Newtons) 45.88 ± 5.73 12.5 53.27 ± 5.71 10.7 52.71 ± 4.99 9.5 46.44 ± 6.73 14.5
Tenderness 5.76 ± 0.64 11.1 5.03 ± 0.88 17.5 5.44 ± 0.60 11.0 5.35 ± 0.55 10.3Juiciness 5.61 ± 0.63 11.2 5.14 ± 0.85 16.5 5.45 ± 0.63 11.6 5.31 ± 0.74 13.9
Overall appraisal 5.65 ± 0.45 8.0 5.36 ± 0.61 11.4 5.60 ± 0.53 9.5 5.41 ± 0.69 12.8
Some of the data were previously reported by Domínguez et al. [11] (License Number 4811250281534).
Foods 2020, 9, 583 9 of 16
3.2. Calibration and Validation Models to Predict the Chemical Composition and Quality Parameters ofFoal Meat
In order to look into the intrinsic properties of foal meat, regression models were built based onthe two spectrum ranges (3200–2500 cm−1 and 2300–980 cm−1) to estimate the chemical compositionand quality parameters of the samples analysed from the spectral information.
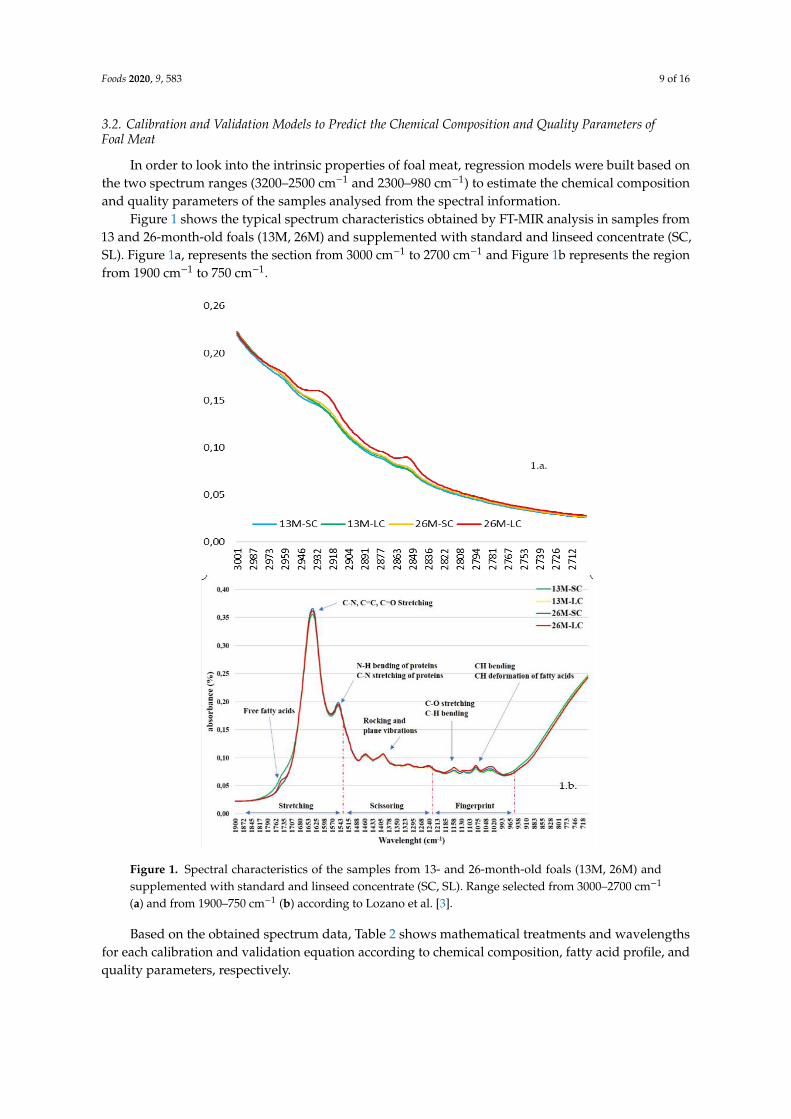
Figure 1 shows the typical spectrum characteristics obtained by FT-MIR analysis in samples from13 and 26-month-old foals (13M, 26M) and supplemented with standard and linseed concentrate (SC,SL). Figure 1a, represents the section from 3000 cm−1 to 2700 cm−1 and Figure 1b represents the regionfrom 1900 cm−1 to 750 cm−1.Foods 2020, 9, x FOR PEER REVIEW 2 of 19
Figure 1. Spectral characteristics of the samples from 13- and 26-month-old foals (13M, 26M) and
supplemented with standard and linseed concentrate (SC, SL). Range selected from 3000–2700 cm−1 (a)
and from 1900–750 cm−1 (b) according to Lozano et al. [3].
Based on the obtained spectrum data, Table 2 shows mathematical treatments and wavelengths for
each calibration and validation equation according to chemical composition, fatty acid profile, and
quality parameters, respectively.
Figure 1. Spectral characteristics of the samples from 13- and 26-month-old foals (13M, 26M) andsupplemented with standard and linseed concentrate (SC, SL). Range selected from 3000–2700 cm−1
(a) and from 1900–750 cm−1 (b) according to Lozano et al. [3].
Based on the obtained spectrum data, Table 2 shows mathematical treatments and wavelengthsfor each calibration and validation equation according to chemical composition, fatty acid profile, andquality parameters, respectively.

Foods 2020, 9, 583 10 of 16
Table 2. Results of the PLS regression models for the MIR data matrix of meat composition and quality from 13- and 26-month-old Galician Mountain x Burguetecrossbred foals (13M, 26M) supplemented with standard and linseed concentrate.
Calibration Validation
n a p b Rc2 (%) c RMSEC d RPD Rv2 (%) e RMSECV f RPD g Treatment Selected Regions (cm−1)
Chemical Composition
Moisture 41 9 93.67 0.34 3.97 81.57 0.53 2.33 Max. and min. normalisation 3278–2918; 1839–1478; 1119–759Protein 42 1 30.36 0.75 1.20 22.71 0.78 1.14 Max. and min. normalisation 3998–3637; 1839–1478; 1119–399
Ash 42 5 97.92 0.02 6.36 40.55 0.09 1.30 2nd derivate 3278–2918; 2198–1838Total lipids content 38 5 26.30 0.85 1.16 65.99 0.46 1.72 2nd derivate 2559–1838; 1479–1118
Total collagen 40 8 98.12 0.01 7.39 70.65 0.04 1.85 1st derivate + MSCh 3638–3277; 1479–1118Soluble collagen 45 1 9.78 2.67 1.05 0.615 2.72 1.00 MSC 2198–1838
pH 40 1 31.19 0.07 1.21 22.39 0.07 1.14 Removal of constant slope 1479–1118Water Holding Capacity (WHC) 37 1 29.88 1.56 1.19 20.03 1.60 1.13 Removal of constant slope 759–399
Deoxymyoglobin DMb 46 10 97.88 6.88 1.55 25.78 8.02 1.16 2nd derivate 3278–2918; 1839–1118Metmyoglobin (MMb) 45 3 35.31 5.21 1.24 21.63 5.48 1.13 1st derivate + MSC 1839–1478Oxymyoglobin (OMb) 46 3 29.23 8.27 1.19 16.25 8.58 1.09 MSC 1839–1118; 759–399
Fatty acids
Stearic acid 42 10 97.73 0.23 6.63 61.77 0.79 1.62 1st derivate + SNV 3638–3277; 2559–2198; 1839–1118Oleic acid 43 10 96.70 0.28 5.51 60.07 0.83 1.59 1st derivate + SNV 3638–3277; 2559–2198; 1839–1118
Linoleic acid 38 8 88.13 1.83 2.90 55.49 3.15 1.50 1st derivate + SNV 3638–3277; 1839–1118Linolenic acid 43 7 98.47 0.32 8.07 38.36 1.82 1.27 2nd derivate 3278–2918; 2559–2198; 1119–759
Arachidonic acid 40 9 97.03 0.12 5.80 77.67 0.29 2.12 MSC 2919–2558; 1119–759Vaccenic acid 43 5 93.70 0.01 3.98 67.11 0.01 1.74 1st derivate + SNVi 2559–2199
Docosapentaenoic acid (DPA) 43 10 97.03 0.12 5.80 76.39 0.29 2.06 1st derivate + SNV 3638–3277; 2919–2558; 1839–1118Eicosapentaenoic acid (EPA) 42 10 87.47 0.13 2.83 54.64 0.22 1.50 None 3104–2501; 2130–893Docosahexaenoic acid (DHA) 43 3 97.03 0.12 5.80 76.39 0.03 2.06 1st derivate + SNV 3638–3277; 2919–2558; 1839–1118
Total n-3 Polyunsaturated fatty acids (PUFAs) 39 4 90.73 0.58 3.29 41.19 1.37 1.30 2nd derivate 3278–2918; 2559–2198Total n-6 Polyunsaturated fatty acids (PUFAs) 40 8 94.87 1.46 4.42 73.89 2.90 1.96 MSC 2919–2558; 1119–759
Quality parameters
Red 42 7 98.06 2.53 7.18 58.47 10.5 1.55 1st derivate + MSC 3998–3637; 1119–759Green 43 7 91.65 3.24 3.46 70.32 5.55 1.84 1st derivate + MSC 3998–3637; 2198–1118Blue 39 8 96.03 2.77 5.02 73.63 6.26 1.95 1st derivate + MSC 3998–3637; 2198–1118
L* (Lightness) 46 1 6.80 2.59 1.04 5.28 2.69 1.00 Max. and min. normalisation 3090–2497; 2300–980a* (Redness) 46 1 25.70 1.76 1.16 15.85 1.83 1.09 Max. and min. normalisation 3200–2500; 2300–980
b* (Blue) 46 1 31.01 2.16 1.20 21.55 2.25 1.13 Max. and min. normalisation 3200–2500; 2300–980C (Chroma) 46 1 36.74 1.78 1.26 22.60 1.93 1.14 Max. and min. normalisation 3200–2500; 2300–980
h (Hue angle) 46 1 11.71 4.06 1.06 4.49 4.13 1.02 Max. and min. normalisation 3200–2500; 2300–980Warner–Bratzler shear force (WBSF) 40 3 44.62 10.3 1.34 25.7 11.6 1.60 1st derivate + SNV 1119–759
Tenderness 46 1 36.17 0.49 1.24 27.41 0.50 1.17 Max. and min. normalisation 3200–2500Juiciness 46 1 18.91 0.56 1.12 8.04 0.58 1.04 Max. and min. normalisation 3200–2500
Overall appraisal 46 1 29.49 0.39 1.19 23.89 0.39 1.05 1st derivate 3200–2500
MSC: Multiplicative Scatter Correction; SNV: Vectorial Normalization; h multiplicative scattering correction; i standard normal variate. a: number of samples used in calibration, b:number of terms included in the equation, c: coefficient of determination for calibration, d: root mean square error of calibration, e: coefficient of determination for cross-validation; f: rootmean square error of cross-validation; g: ratio of prediction to deviation;
Foods 2020, 9, 583 11 of 16
In Table 2, it is shown that moisture and total collagen showed coefficient of determination forvalidation (Rv2) higher than 70%, Total lipids content reached higher coefficient of determination forvalidation (Rv2) (66%) (Rc2) compared to calibration (76.30%). With regard to pigment content (%),oxymyoglobin (OMb), deoxymyoglobin (DMb), and metmyoglobin (MMb) reached low validationcoefficients (Rv2<26%). Nevertheless, the three of them seemed to be related to, at least, the wavelengthrange 1839–1478 cm−1. Finally, the rest of the variables did not reach 26%, except for ash content(40.55%). According to the fatty acids, Rv2 for linoleic, linolenic, EPA and omega-3 polyunsaturatedfatty acids did not reach 60%, in spite of reaching Rc2 values over 88%. The best prediction models,with Rv2 over 75%, were obtained for arachidonic, DPA, DHA (with RPD values over 2), and omega-6polyunsaturated fatty acids (with an RPD value close to 2). The most repeated selected wavelengthranges were 3838–3277, 2919–2558, and 1839–1118 cm−1. The best treatments were first derivate plusstandard normal variate (SNV) and multiplicative scatter correction (MSC).
Regarding colour, RGB variables reached high values for Rc2 (over 90%) and Rv2 (over 60%,with the exception of red), whereas the most commonly studied colour coordinates (L*, a*, b*, C*,h*) reached both calibrations and validation coefficients below 40% and 22%, respectively, being h*the worst predicted variable (4.49%). The selected wavelength ranges for RGB colour variables were3998–3637 and 2198–1118 cm−1, and the first derivate + MSC was used as prediction treatment for mostof the cases. On the other hand, no enclosed wavelength range were described for L*, a*, b*, C* and h*.
For WBSF, the prediction results were poor (Rv2=25.70%). Likewise, predictability for all sensoryattributes were poor with the highest Rv2 and Rc2 values being 27.21% and 36.17%, respectively.The three sensory variables were negatively correlated to WBSF (tenderness; r=−0.82, p < 0.01; juiciness;r=−0.89, p < 0.01; overall appraisal; r=−0.66, p < 0.05) and the low accuracy of WBSF predictioncould be reflected in the sensory attributes. Besides, WBSF was positively correlated with cookinglosses [11], and meat moisture was also highly and negatively related to intramuscular fat content(r=−0.89; p < 0.01).
3.3. Principal Component and Discriminant Analyses
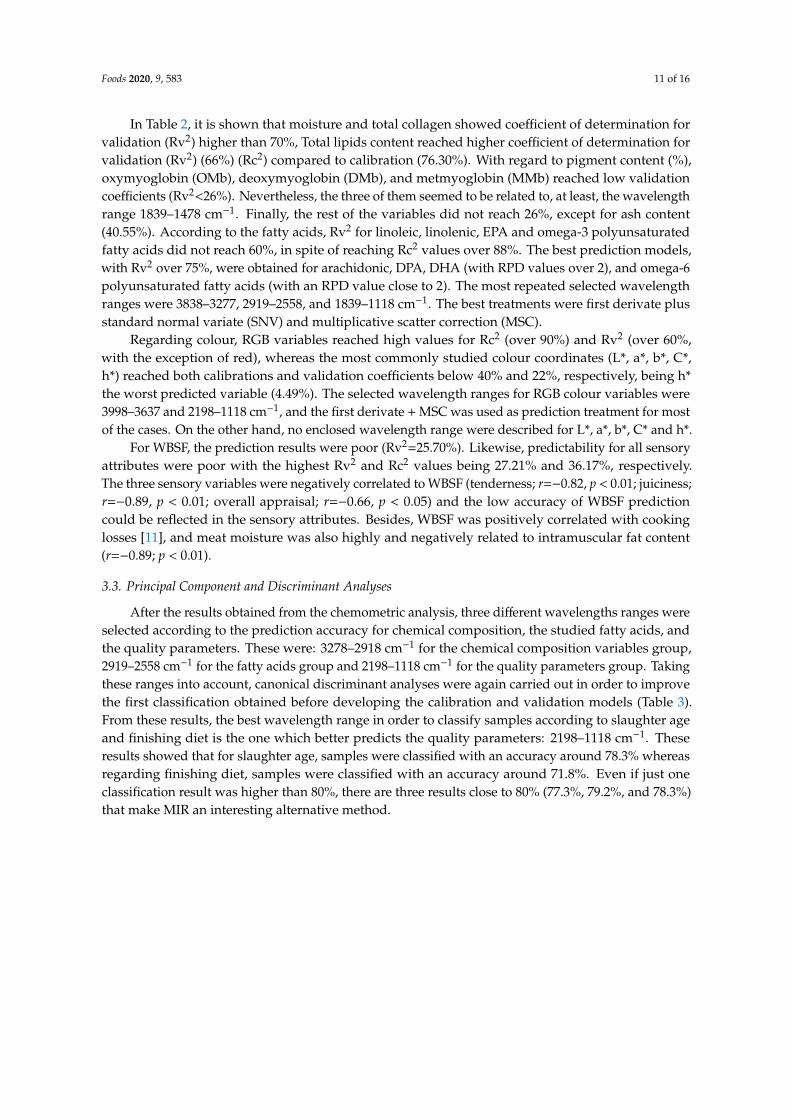
After the results obtained from the chemometric analysis, three different wavelengths ranges wereselected according to the prediction accuracy for chemical composition, the studied fatty acids, andthe quality parameters. These were: 3278–2918 cm−1 for the chemical composition variables group,2919–2558 cm−1 for the fatty acids group and 2198–1118 cm−1 for the quality parameters group. Takingthese ranges into account, canonical discriminant analyses were again carried out in order to improvethe first classification obtained before developing the calibration and validation models (Table 3).From these results, the best wavelength range in order to classify samples according to slaughter ageand finishing diet is the one which better predicts the quality parameters: 2198–1118 cm−1. Theseresults showed that for slaughter age, samples were classified with an accuracy around 78.3% whereasregarding finishing diet, samples were classified with an accuracy around 71.8%. Even if just oneclassification result was higher than 80%, there are three results close to 80% (77.3%, 79.2%, and 78.3%)that make MIR an interesting alternative method.
Foods 2020, 9, 583 12 of 16
Table 3. Classification matrix from MIR spectrum of 13- and 26-month-old Galician Mountain x Burguetecrossbred foals (13M, 26M) and supplemented with standard and linseed concentrate (SC, LC).Discriminant analyses results after selecting the most suitable wavelength range from theprediction models.
Spectral Wavelength Classify Into
Range 3278–2918 cm−1
13M 26M
13-month-old (%) 63.6 36.426-month-old (%) 29.2 70.8
SC LC
Standard Concentrate (%) 56.5 43.5Linseed Concentrate (%) 34.8 65.2
Range 2919–2558 cm−1
13M 26M
13-month-old (%) 86.4 13.626-month-old (%) 37.5 62.5
SC LC
Standard Concentrate (%) – –Linseed Concentrate (%) – –
Range 2198–1118 cm−1
13M 26M
13-month-old (%) 77.3 22.726-month-old (%) 20.8 79.2
SC LC
Standard Concentrate (%) 78.3 21.7Linseed Concentrate (%) 34.8 65.2
–: Any possible samples’ classification according to finishing diet with that selected range.
4. Discussion
Regarding the spectra characteristics of the samples in the medium infrared, Lozano et al. [3]described the two most important spectra ranges as far as foal meat is concerned: 3200–2500 cm−1 and2300–980 cm−1. These two sections are shown in Figure 1a and in Figure 1b for meat samples from13M and 26M foals supplemented with SC and LC concentrate samples (13M-SC, 13M-LC, 26M-SC,26M-LC). Both ranges have been slightly widened not to lose possible wavelength which could showsome differences between each group. The region from 3000 cm−1 to 2700 cm−1 (Figure 1a) is theone of hydrogen’s stretching related to -C-H stretching vibration, involving double bounds =C-Hand aliphatic CH3 and CH2 [21,22]. It is shown that 26M-LC samples described higher absorbancepeaks than 13M-SC/LC and 26M-SC between 2990 and 2800 cm−1. This means that asymmetric andsymmetric stretching vibrations of -C-H of aliphatic CH3 at 2959 and 2873 cm−1 were taking place moreintensely than in the other groups. Moreover, the absorbance difference at 2925 and 2851 cm−1 (peaksrelated to asymmetric and symmetric stretching vibrations of -C-H of aliphatic CH2) between 26M-LCand the others 3 groups, was even higher, and thus more intense. Domínguez et al. [11] showed that26M foals’ samples and those from foals supplemented with linseed concentrate presented a higheramount of monounsaturated fatty acids and reached higher total lipids content (Table 2). This higheramount of aliphatic CH3 and CH2 compounds define larger fatty acids chains, indirectly representedwith a higher absorbance.
The region showed in Figure 1b, involves double bond’s stretching (1750–1650 cm−1), otherdeformations and bendings (1500–1200 cm−1) and the called “fingerprint range” (1200–950 cm−1) [3,21,22].
Foods 2020, 9, 583 13 of 16
The 13M-SC samples, which presented a higher percentage of saturated and polyunsaturated fatty acids(35.2 g/100 g vs. 33.4 g/100 g) [14] and higher lipid oxidation than the rest of groups (0.40 vs. 0.36 mgMDA/kg fresh meat) (data not shown), showed a higher absorbance from 1800 to 1700 cm−1. Bands at1742 cm−1 are related to triglycerides and free fatty acids. Vlachos et al. [23] explained that an oxidationof fatty acids is likely to happen close to 1700 cm−1, and that the accurate peak position and intensitywould depend on the fatty acid composition. Thus, it might be possible that the higher absorbanceobtained for 13M-SC samples, was linked to the high amount of polyunsaturated fatty acids and apossible lipid oxidation.
Bonds of N-H, C=C, C-N, and the combination of N-H with C-H (Amides II) are typical of proteinamino acids and appear at bands 1657 and 1542 cm−1 [3]. Figure 1 does not show any difference in theabsorbance although it seems to be slightly higher in 26M-SC foal meat samples. Along the fingerprintrange, a smooth absorbance increase can be seen in the 26M-LC foal meat samples, but not determinant.This region is related to stretching vibrations of the C-O bond stretching vibration and the C-H bondbending vibration and the peak at 1117 cm−1 is assigned to bending and twisting vibration of thefatty acids [24]. Correlations help to better understand the bands’ changes due to different vibrations.The absorbance ~ 2959 cm−1 was positively correlated to the peak ~2925 cm−1 (0.78), ~2837 cm−1
(0.94), ~2851 cm−1 (0.74), ~1658 cm−1 (0.81), ~1542 cm−1 (0.67) and ~1117 cm−1 (0.73). And thesewavenumbers are related to typical vibration modes of the lipids’ fatty acids and proteins (C-H bonds).A weak and negative correlation between 2959 and 1742 cm−1 was found (−0.38**). This means that thestretching vibration of carbonyl bond of esters and free fatty acids [3] related to this peak is differentfrom the vibration way at 2959 cm-1. Another example of different vibration is better understoodby the positive correlation found between the peak at ~1117 cm−1 and ~2925 (0.88**), ~2873 (0.88**)and ~2851 cm−1 (0.90**). All these peaks are related to vibration of the fatty acids. But ~1117 cm−1 isassigned to bending and twisting vibration whereas the other ones are related to stretching vibrations.
The lack of MIR spectroscopy studies dealing with meat composition and meat quality makesnecessary the comparison of the obtained results with studies of NIR spectroscopy, although the spectrarange is not the same. It should be explained that the ratio of prediction to deviation (RPD) is noticeablypoor with regard to validation results, except for moisture (2.33). High quality moisture models havebeen reported in the literature, with coefficients of determination higher than 0.70 in NIR [5] This meansthat the regression models have a low accuracy to predict different chemical composition parametersof foal meat. The prediction model for protein had a low Rv2 (22.71%). Difficulties in predictingmeat protein content have been previously reported in beef [6,25] with NIR spectroscopy. One of thecauses of the low accuracy of protein prediction in meat could be related to the analytical differencesbetween the Kjeldahl determination (which measures nitrogen) and the MIR/NIR techniques (whichmeasures protein bonds) [26]. Another reason could be related to the MIR spectra record fundamentalmolecular vibrations, which can be more easily affected by multiple interferences [27]. Nevertheless,better results were obtained when applying MIR to the prediction of fat and protein in beef [3]. On thecontrary, when comparing the results with Ripoll et al. [5] similar results were observed for chemicalcomposition with NIR spectroscopy. This fact could be due to the more developed beef productionsystems compared to foal production systems, which could favour better regression results. For bothmoisture and protein content, the maximum and minimum normalisation treatment were used, being1839–1478 cm−1 and 1119–759 cm−1 the wavelength ranges employed.
Higher validation values were reported in beef (76%) [5] or lamb (73%) [28] with NIR spectroscopy.This could be due to the fact that measurements were taken on the intact sample instead of on ahomogenised sample. Total collagen content showed also high Rv2 (70.65%), far from those reported byother authors with NIR spectroscopy in beef [29]. For both total lipids and total collagen content, it mustbe mentioned that RPD values (1.72 and 1.85, respectively) were close to 2, threshold which defines anacceptable regression model. In addition, in both cases the wavelength selected was 1479–1118 cm−1.These models are in concordance with the obtained spectra results and with the literature mentionedaccording to fatty acids [23,24]. Therefore, these results are of great practical importance and they make
Foods 2020, 9, 583 14 of 16
in evidence the usefulness of MIR spectroscopy technique and the need of gaining deeper knowledgeon this research field. It must be mentioned as well, that the vaccenic acid (precursor of conjugatedlinoleic acid, CLA), reached Rv2 of 67.11% and an RPD value of 1.74. The potential properties of CLAfor human health [30] support the need of developing further studies to be able to detect it, qualitativeand quantitatively.
The lack of references dealing with the estimation of colour parameters with both NIR and MIRspectroscopy makes a deeper discussion of the results more difficult.
Regarding meat texture, as stated by Ripoll et al. [5], the strong relationships between moisture,fat, and cooking losses with WBSF could explain the WBSF behaviour better than its own calibrationmodel. Geesink et al. [31] did not obtain useful models for WBSF, owing to limited muscle variance(CV: 21%). This fact could be another reason for the weak prediction result in the present research(ranged 10–14%).
As reported by Ripoll et al. [5] and Andrés et al. [32] for sensory traits in beef and lamb respectively,tenderness, juiciness, and overall appraisal are hard to estimate as they are subjective judgements andtheir correlations to other instrumental determinations are weak. The low prediction values obtainedfor most of the quality parameters and consumer evaluation results could be explained by the lownumber of samples employed. Perhaps, these prediction models would be better with a higher numberof samples [3]. Besides, foal meat is characterised by its heterogeneity, and, what is more, it suffersrapid internal composition changes [10] that could highly affect the spectra results. These results couldbe also due to the interferences related to the homogeneity and particle size of the sample and itsperformance [33].
After applying discriminant analysis based on the spectra ranges 3200–2500 cm−1 and2300–980 cm−1 for classifying the samples according to slaughter age or finishing diet, the obtainedresults showed lower values in the present study than those found by Xing et al. [34] in intact porkmeat (85% accuracy) and Juárez et al. [35] who classified six sheep breeds (83% accuracy) by visiblespectroscopy. These results may let infer that the variables obtained from the multivariate statisticaltreatment, which involved the most relevant spectra data, are mainly related to different characteristicsdue to the slaughter age than due to finishing diet. Moreover, according to the relationship appreciatedin the spectra between different wavelengths and the fatty acids, it could be highlighted that the totallipid contents would be one of the most evident causes why 13M and 26M foals are different.
5. Conclusions
The MIR spectra obtained in the present research showed some remarkable differences mainlydue to the fat and the fatty acid composition. Prediction models were accurate for moisture, collagen,and lipids, most of the fatty acids (chemical composition) and for the RGB colour coordinates (qualityparameters). Classifications by discriminant analysis showed good results after the use of regressiontreatments delimiting the range of the spectrum to 2198–1118 cm−1 and coinciding with the wavelengthsin which a large number of protein and fatty acid bonds are recognised.
From a commercial point of view, and based on the obtained results, the use of MIR spectroscopycould be used to sort out meat from “old vs young” foals. Less precision was achieved according to thefoals feeding. Anyway, due to the low accuracy to predict different chemical composition and sensoryparameters of foal meat, and considering the potential of this technique, more studies are needed inorder to improve the estimation of meat characteristics.
Since the present study intends to be a preliminary approach to know the possibilities of theapplication of MIR spectroscopy to the study of meat quality, for future researches it would be necessaryto use a larger sample number and study other physical characteristics such as protein denaturation orsarcomere length which could help to understand changes in the bonds.
Summarising, MIR spectroscopy could be a potential alternative to traditional meat compositionanalytical methods but, at the present study, the obtained accuracies are low for industry applicationand still need to be improved.
Foods 2020, 9, 583 15 of 16
Author Contributions: Conceptualization, M.J.B.; Methodology K.I., M.V.S., and M.R.; Software, M.B.; Formalanalysis, M.J.B. and K.I.; Investigation, M.J.B. and M.V.S.; Resources, M.B. and J.M.L.; Writing—original draftpreparation, M.R.; Writing—review and editing, M.V.S., M.J.B., K.I., and J.M.L.; Project administration, M.V.S.,M.J.B. and J.M.L. All authors have read and agreed to the published version of the manuscript.
Funding: This research was funded by INIA Instituto Nacional de Investigación y Tecnología Agraria y Alimentaria,grant number RTA 2012-00090-C03-01 and by the Spanish Ministerio de Ciencia, Innovación y Universidades,Project RTI2018-094475-B-I00 (MCIU/AEI/FEDER, UE).
Acknowledgments: Authors want to acknowledge Susana García from the UPNA for her support in samplingpreparation and analysis.
Conflicts of Interest: The authors declare no conflict of interest.
References
1. Karoui, R.; Downey, G.; Blecker, C. Mid-Infrared Spectroscopy Coupled with Chemometrics: A Tool for theAnalysis of Intact Food Systems and the Exploration of Their Molecular Structure-Quality Relationships-AReview. Chem. Rev. 2010, 10, 6144–6168. [CrossRef] [PubMed]
2. de Oliveira, G.A.; de Castilhos, F.; Renard, C.M.G.C.; Bureau, S. Comparison of NIR and MIR spectroscopicmethods for determination of individual sugars, organic acids and carotenoids in passion fruit. Food Res. Int.2014, 60, 154–162. [CrossRef]
3. Lozano, M.; Rodríguez-Ulibarri, P.; Echeverría, J.C.; Beruete, M.; Sorolla, M.; Beriain, M.J. Mid-InfraredSpectroscopy (MIR) for Simultaneous Determination of Fat and Protein Content in Meat of Several AnimalSpecies. Food Anal. Method. 2017, 10, 3462–3470. [CrossRef]
4. Yancey, J.W.S.; Applea, J.K.; Meullenetb, F.F.; Sawyer, J.T. Consumer responses for tenderness and overallimpression can be predicted by visible and near-infrared spectroscopy, Meullenet–Owens razor shear, andWarner–Bratzler shear force. Meat Sci. 2010, 85, 487–492. [CrossRef]
5. Ripoll, G.; Albertí, P.; Panea, B.; Olleta, J.L.; Sañudo, C. Near-infrared reflectance spectroscopy for predictingchemical, instrumental and sensory quality of beef. Meat Sci. 2008, 80, 697–702. [CrossRef]
6. Belaunzaran, X.; Bessa, R.J.; Lavín, P.; Mantecón, A.R.; Kramer, J.K.; Aldai, N. Horse-meat for humanconsumption—Current research and future opportunities. Meat Sci. 2015, 108, 74–81. [CrossRef]
7. Lorenzo, J.M.; Crecente, S.; Franco, D.; Sarriés, M.V.; Gómez, M. The effect of livestock production systemand concentrate level on carcass traits and meat quality of foals slaughtered at 18 months of age. Animal2014, 8, 494–503. [CrossRef]
8. Franco, D.; Lorenzo, J.M. Effect of muscle and intensity of finishing diet on meat quality of foals slaughteredat 15 months. Meat Sci. 2014, 96, 327–334. [CrossRef]
9. Sarriés, M.V.; Beriain, M.J. Colour and texture characteristics in meat of male and female foals. Meat Sci.2006, 74, 738–745. [CrossRef]
10. Ruiz, M.; Sarriés, M.V.; Beriain, M.J.; Crecente, S.; Domínguez, R.; Lorenzo, J.M. Relationship betweencarcass traits, prime cuts and carcass grading from foals slaughtered at the age of 13 and 26 months andsupplemented with standard and linseed-rich feed. Animal 2017, 12, 1084–1092. [CrossRef]
11. Domínguez, R.; Pateiro, M.; Crecente, S.; Ruiz, M.; Sarriés, M.V.; Lorenzo, J.M. Effect of linseedsupplementation and slaughter age on meat quality of grazing cross-bred Galician x Burguete foals.J. Sci. Food Agr. 2018, 98, 266–273. [CrossRef] [PubMed]
12. Bonnet, M.; Kopp, J. Dosage du collagène dans les tissus conjonctifs, la viande et les produits carnés.Viandes Produits Carnés 1986, 7, 263–266.
13. The American Meat Science Association (AMSA). Meat color measurement guidelines. In American MeatScience Association; The American Meat Science Association (AMSA): Champaign, IL, USA, 2012.
14. Karamucki, T.; Jakubowska, M.; Rybarczyk, A.; Gardzielewska, J. The influence of myoglobin on the colourof minced pork loin. Meat Sci. 2013, 94, 234–238. [CrossRef] [PubMed]
15. Commission Internationale de l’Eclairage. Colorimetry—Part 4: CIE 1976 L*a*b* Colour Spaces; PublicationCIE: Vienna, Austria, 2008.
16. Mendizabal, J.; Purroy, A.; Indurain, G.; Insausti, K. Medida del grado de veteado de la carne medianteanálisis de imagen. In Estandarización de las Metodologías para Evaluar la Calidad del Producto (Animal Vivo,Canal, Carne y Grasa) en los Ruminates; MEC-INIA Series Ganaderas: Madrid, Spain, 2005; Volume 3.
Foods 2020, 9, 583 16 of 16
17. Beriain, M.J.; Sánchez, M.; Carr, T.R.A. Comparison of consumer sensory acceptance, purchase intention,and willingness to pay for high quality United States and Spanish beef under different information scenarios.J. Anim. Sci. 2014, 87, 3392–3402. [CrossRef]
18. The American Meat Science Association (AMSA). Research Guidelines for Cookery, Sensory Evaluation,and Instrumental Tenderness Measurements of Meat. In Research Guidelines for Cookery, Sensory Evaluation,and Instrumental Tenderness Measurements of Meat. American Meat Science Association, 2nd ed.; Version 1.0;The American Meat Science Association (AMSA): Champaign, IL, USA, 2015.
19. Macfie, H.J.; Bratchell, N.; Greenhoff, K.; Vallis, L.V. Designs to Balance the Effect of Order of Presentationand First-Order Carry-Over Effects in Hall Tests. J. Sens. Stud. 1989, 4, 129–148. [CrossRef]
20. Martens, H.; Naes, T. Multivariate Calibration; Wiley: Chichester, UK, 1989.21. Jovic, O.; Smolic, T.; Jurišic, Z.; Meic, Z.; Hrenara, T. Chemometric Analysis of Croatian Extra Virgin Olive
Oils from Central Dalmatia Region. Croat. Chem. Acta 2013, 86, 335–344. [CrossRef]22. Lucarini, M.; Durazzo, A.; Sánchez del Pulgar, J.; Gabrielli, P.; Lombardi-Boccia, G. Determination of Fatty
Acid Content in Meat and Meat products: The FTIR-ATR approach. Food Chem. 2018, 223–230. [CrossRef]23. Vlachos, N.; Skopelitis, Y.; Psaroudaki, M.; Konstantinidou, K.; Chatzilazarou, A.; Tegou, E. Applications of
Fourier transform-infrared spectroscopy to edible oils. Anal. Chim. Acta 2006, 573, 459–465. [CrossRef]24. Rohman, A.; Sismindari, E.Y.; Che Man, Y.B. Analysis of pork adulteration in beef meatball using Fourier
transform infrared (FTIR) spectroscopy. Meat Sci. 2011, 88, 91–95. [CrossRef]25. Oliván, M.; de La Roza, B.; Mocha, M.; Martínez, M.J. Prediction of physico-chemical and texture characteristics
of beef by near infrared transmittance spectroscopy. In Proceedings of the 10th International Conference onNear Infrared Spectroscopy, Kyongju, Korea, 10–15 June 2001; pp. 197–202.
26. Lanza, E. Determination of moisture, protein, fat and calories in raw pork and beef by near infraredspectroscopy. J. Food Sci. 1983, 48, pp–471. [CrossRef]
27. Shi, H.T.; Lei, Y.G.; Prates, L.L.; Yu, P.Q. Evaluation of near-infrared (NIR) and Fourier transform mid-infrared(ATRFT/MIR) spectroscopy techniques combined with chemometrics for the determination of crude proteinand intestinal protein digestibility of wheat. Food Chem. 2019, 272, 507–513. [CrossRef] [PubMed]
28. Cozzolino, D.; Murray, I.; Scaife, J.R.; Paterson, R. Study of dissected lamb muscles by visible and nearinfrared reflectance spectroscopy for composition assessment. Anim. Sci. 2000, 70, 417–423. [CrossRef]
29. Weeranantanaphan, J.; Downey, G.; Allen, P.; Sun, D.-W. A review of near infrared spectroscopy in musclefood analysis: 2005–2010. J. Near Infrared Spectrosc. 2011, 19, 61–104. [CrossRef]
30. Dilzer, A.; Park, Y. Implication of Conjugated Linoleic Acid (CLA) in Human Health. Crit. Rev. Food Sci.Nutr. 2012, 52, 488–513. [CrossRef] [PubMed]
31. Geesink, G.H.; Schreutelkamp, F.H.; Frankhuizen, R.; Vedder, H.W.; Faber, N.M.; Kranen, R.W.; Gerritzen, M.A.Prediction of pork quality attributes from near infrared reflectance spectra. Meat Sci. 2003, 65, 661–668.[CrossRef]
32. Andrés, S.; Murray, I.; Navajas, E.A.; Fisher, A.V.; Lambe, N.R.; Bünger, L. Prediction of sensory characteristicsof lamb meat samples by near infrared reflectance spectroscopy. Meat Sci. 2007, 76, 509–516. [CrossRef]
33. Hell, J.; Prückler, M.; Danner, L.; Henniges, U.; Apprich, S.; Rosenau, T.; Kneifel, W.; Bohmdorfer, S.A comparison between near-infrared (NIR) and mid-infrared (ATR-FTIR) spectroscopy for the multivariatedetermination of compositional properties in wheat bran samples. Food Control 2016, 60, 365–369. [CrossRef]
34. Xing, J.; Ngadi, M.; Gunenc, A.; Prasher, S.; Gariepy, C. Use of visible spectroscopy for quality classificationof intact pork meat. J. Food Eng. 2007, 82, 135–141. [CrossRef]
35. Juárez, M.; Alcalde, M.J.; Horcada, A.; Molina, A. Southern Spain lamb types discrimination by using visiblespectroscopy and basic physicochemical traits. Meat Sci. 2008, 80, 1249–1253. [CrossRef]
© 2020 by the authors. Licensee MDPI, Basel, Switzerland. This article is an open accessarticle distributed under the terms and conditions of the Creative Commons Attribution(CC BY) license (http://creativecommons.org/licenses/by/4.0/).


![arXiv:0803.4170v1 [physics.ins-det] 28 Mar 2008 · neutron spin echo techniques, a large fraction of slow neutron scattering spec-trometers of interest for neutron spectroscopy can](https://static.fdocuments.fr/doc/165x107/6001651b431a684e12181272/arxiv08034170v1-28-mar-2008-neutron-spin-echo-techniques-a-large-fraction.jpg)