
Advancing a Gateway Infrastructure for Wind Turbine Data ...
14
Journal of Grid Computing manuscript No. (will be inserted by the editor) Advancing a Gateway Infrastructure for Wind Turbine Data Analysis Alvaro Aguilera · Richard Grunzke · Dirk Habich · Johannes Luong · Dirk Schollbach · Ulf Markwardt · Jochen Garcke the date of receipt and acceptance should be inserted later Abstract The increasing amount of data produced in many scientific and engineering domains creates as many new challenges for an efficient data analysis, as possi- bilities for its application. In this paper, we present one of the use cases of the project VAVID, namely the con- dition monitoring of sensor information from wind tur- bines, and how a data gateway can help to increase the usability and security of the proposed system. Starting by briefly introducing the project, the paper presents the problem of handling and processing large amount of sensor data using existing tools in the context of wind turbines. It goes on to describe the innovative ap- proach used in VAVID to meet this challenge, covering the main goals, numerical methods used for analysis, the storage concept, and the architectural design. It concludes by offering a rational for the use of a data gateway as the main entry point to the system and how this is being implemented in VAVID. Keywords HPC · Big Data · VAVID · Wind turbine Alvaro Aguilera · Richard Grunzke · Ulf Markwardt Center for Information Services and High Performance Computing (ZIH), Technische Universit¨ at Dresden, 01062 Dresden, Germany. E-mail: [email protected] Dirk Habich · Johannes Luong Database Systems Group, Technische Universit¨at Dresden, 01062 Dresden, Germany. Dirk Schollbach Bosch Rexroth Monitoring Systems GmbH Else-Sander-Str. 8, 01099 Dresden, Germany. Jochen Garcke Fraunhofer SCAI Schloss Birlinghoven, 53754 Sankt Augustin, Germany and Institut f¨ ur Numerische Simulation Universit¨ at Bonn, 53115 Bonn, Germany. 1 Introduction Immensely growing volumes of data in a variety of engi- neering areas generate new challenges for efficient data handling. Novel analytical approaches can be applied to extract new and useful knowledge from these large data sets. In particular, comparative data analyzes can help to uncover relationships, similarities, and differ- ences in the underlying, ultimately parameter depen- dent objects. Comparative data analysis is the focus of the VAVID project 1 , where participating partners con- sider data from numerical simulation and sensor mea- surement with applications in the automotive industry and the wind energy sector. Besides developing novel comparative analytical techniques, we are also develop- ing improved techniques for data compression as well as new methods for data management and interactive data visualization to better support the comparative data analysis. Generally, the holistic approach of VAVID re- duces the cost of data storage and creates the trans- parency needed by engineers to monitor and optimize processes, and therefore ultimately also products. One objective is the support of product development, which nowadays depends on numerical simulations both in the area of vehicle crashes and the system simulation of wind turbines, where increasingly accurate simulations generate a growing amount of data. At the same time, an exponential rise in data vol- umes is also being seen due to the acquisition of sensor data during the operation of machines and factories. These measurements allow engineers to draw impor- tant conclusions about how well control systems are working and how they can further optimize production. Additionally, measurement data is more and more be- 1 Project homepage - http://www.vavid.de
Transcript of Advancing a Gateway Infrastructure for Wind Turbine Data ...

Journal of Grid Computing manuscript No.(will be inserted by the editor)
Advancing a Gateway Infrastructure for Wind Turbine DataAnalysis
Alvaro Aguilera · Richard Grunzke · Dirk Habich · Johannes Luong ·Dirk Schollbach · Ulf Markwardt · Jochen Garcke
the date of receipt and acceptance should be inserted later
Abstract The increasing amount of data produced in
many scientific and engineering domains creates as many
new challenges for an efficient data analysis, as possi-
bilities for its application. In this paper, we present one
of the use cases of the project VAVID, namely the con-
dition monitoring of sensor information from wind tur-
bines, and how a data gateway can help to increase the
usability and security of the proposed system. Starting
by briefly introducing the project, the paper presents
the problem of handling and processing large amount
of sensor data using existing tools in the context of
wind turbines. It goes on to describe the innovative ap-
proach used in VAVID to meet this challenge, covering
the main goals, numerical methods used for analysis,
the storage concept, and the architectural design. It
concludes by offering a rational for the use of a data
gateway as the main entry point to the system and how
this is being implemented in VAVID.
Keywords HPC · Big Data · VAVID · Wind turbine
Alvaro Aguilera · Richard Grunzke · Ulf MarkwardtCenter for Information Services and High PerformanceComputing (ZIH), Technische Universitat Dresden,01062 Dresden, Germany.E-mail: [email protected]
Dirk Habich · Johannes LuongDatabase Systems Group, Technische Universitat Dresden,01062 Dresden, Germany.
Dirk SchollbachBosch Rexroth Monitoring Systems GmbHElse-Sander-Str. 8, 01099 Dresden, Germany.
Jochen GarckeFraunhofer SCAISchloss Birlinghoven, 53754 Sankt Augustin, Germanyand Institut fur Numerische SimulationUniversitat Bonn, 53115 Bonn, Germany.
1 Introduction
Immensely growing volumes of data in a variety of engi-
neering areas generate new challenges for efficient data
handling. Novel analytical approaches can be applied
to extract new and useful knowledge from these large
data sets. In particular, comparative data analyzes can
help to uncover relationships, similarities, and differ-
ences in the underlying, ultimately parameter depen-
dent objects. Comparative data analysis is the focus of
the VAVID project1, where participating partners con-
sider data from numerical simulation and sensor mea-
surement with applications in the automotive industry
and the wind energy sector. Besides developing novel
comparative analytical techniques, we are also develop-
ing improved techniques for data compression as well as
new methods for data management and interactive data
visualization to better support the comparative data
analysis. Generally, the holistic approach of VAVID re-
duces the cost of data storage and creates the trans-
parency needed by engineers to monitor and optimize
processes, and therefore ultimately also products. One
objective is the support of product development, which
nowadays depends on numerical simulations both in the
area of vehicle crashes and the system simulation of
wind turbines, where increasingly accurate simulations
generate a growing amount of data.
At the same time, an exponential rise in data vol-
umes is also being seen due to the acquisition of sensor
data during the operation of machines and factories.
These measurements allow engineers to draw impor-
tant conclusions about how well control systems are
working and how they can further optimize production.
Additionally, measurement data is more and more be-
1 Project homepage - http://www.vavid.de

2 Aguilera et al.
ing used together with simulation results for new prod-
uct releases. However, plain archival of these amounts
of data pose significant challenges to companies. The
next step, which is the extraction of insights out of the
available data, is often out of reach due to the lack
of adequate processing technology. Therefore, we are
developing novel methodologies for efficient data anal-
ysis and data management in combination with high
performance computing (HPC) systems. These meth-
ods and techniques contribute to the creation of a high
performance data management system that will enable
centralized access to data storage, control of analysis
workloads, as well as retrieval of results data.
One of the main challenges arising from the use of
complex HPC infrastructures in the context of indus-
trial data processing is the usually limited expertise of
the intended user base with regard to such systems.
Relying on command line interfaces and dealing with
batch systems is often found to be tedious and some-
times challenging. VAVID works around this issue by:
(1) using a high-level workflow engine to take care of the
execution and monitoring of different algorithmic com-
positions created by the users to analyze the data, and
(2) offering a data gateway as the central entry point
to the system, with which the users can create, launch,
and evaluate such compositions in a user-friendly man-
ner.
This paper is conceived as an extension of [1], in
which we presented the general goals and approach taken
by VAVID. It extends the previous publication in sev-
eral ways. Firstly, we introduce a workflow and meth-
ods for the automatic detection of ice formation on
rotor blades from sensor measurements as part of the
wind turbine use case. The description of the numerical
methods has been revised, and the presentation of our
in-memory database concept now includes an in-depth
explanation of its functioning. Additionally, a new sec-
tion has been added about the challenges and impor-
tance of data provenance in the context of VAVID. Fi-
nally, we provide the example of fault detection of rotor
blades to demonstrate the viability of our approach.
The paper is structured as follows:
– Section 2 presents related previous work.
– Then, we introduce a major use case: the handling
and analysis of wind turbine monitoring data
– Based on this use case, we describe our HPC-aware
infrastructure in Section 4. In particular, we show
how the different algorithms and technologies are
interacting with a HPC infrastructure.
– In Section 5, we discuss important numerical algo-
rithms that are essential in our system.
– Section 6 introduces our implementation concept
for the mentioned algorithms, which is based on
an HPC-aware in-memory database and its flexible
API.
– Data provenance considerations and the approach
taken is the subject of Section 7.
– The last section offers an example of rotor blade
fault detection using the VAVID approach.
2 Related Work
Science and data gateways [24] are built to efficiently
integrate complex underlying infrastructures to enable
novel research methods and make these available in
a user-friendly way. The data gateway described here
is integrating the UNICORE middleware [4] that man-
ages computing and data resources. It is mature, flex-
ible, continuously being developed, and used in ma-
jor research infrastructures such as PRACE [37], XSE-
DE [46], and the Human Brain Project [21]. UNICORE
consists of the target system, middleware, and client
layers. The first integrates underlying HPC systems,
the second contains services that manage jobs and data,
and the third offers various client interfaces. The li-
braries of the command line client are used in gUSE
(grid User Support Environment) [25,17], in particular
as a DCI-bridge [29], to provide access to HPC systems
via UNICORE. gUSE is a high-level middleware that
provides web services for workflow management, exe-
cution and sharing, and integrates with cloud and dis-
tributed computing infrastructures. WS-PGRADE [25,
17] provides graphical user interfaces to gUSE for work-
flow [2] creation, modification, execution, monitoring,
and related data management. Together, gUSE and WS-
PGRADE form a science gateway framework that runs
within the open source Liferay portal framework [33].
By virtue of providing web portals, Liferay only re-
quires a web browser and internet connection, and is
widely used in industry and research projects.
The MoSGrid (Molecular Simulation Grid) [30,16]
science gateway was built by integrating and extending
the above technologies. It enables complex molecular
simulations via workflows and HPC resources for the
three major chemical application domains (molecular
dynamics, quantum chemistry, and docking) via easy-
to-use graphical user interfaces. By logging in once, the
user gains access to all underlying systems while avoid-
ing the need to re-authenticate [15]. Furthermore, work-
flows and data is annotated with metadata based on
MSML (Molecular Simulation Markup Language) [18]
and thus, improving reproducibility and usability. Vari-
ous other science gateways based on gUSE/WS-PGRA-
DE exist [7,3,41,42,45]. The VAVID data gateway de-
scribed in this manuscript is based on the MoSGrid ex-
Advancing a Gateway Infrastructure for Wind Turbine Data Analysis 3
periences and architecture and extends it to facilitate
the VAVID wind energy turbine use case.
3 Use Case: Monitoring of Wind Turbines
The adequate simulation of wind turbines plays an im-
portant role when designing and certifying new instal-
lations [14], as well as when determining the optimal lo-
cation where to place them. Moreover, simulations are
also applied to fine-tune the installations and explore
the effect of possible upgrades. In order to evaluate a
wind turbine, a series of thousands of transient simula-
tions are conducted using data from hundreds of sen-
sors. The gigabytes of data produced in this way, model
the behavior of the installation for a time window in the
order of minutes, using only one of hundreds of possible
configurations. Given the amount of data produced and
the number of configurations that have to be explored,
the use of numerical simulations for the design and opti-
mization of wind turbines is very complicated. Existing
computer-aided engineering (CAE) tools are based on
models derived from fundamental laws, which in addi-
tion exploit engineering knowledge to further simplify
the computations. They only allow punctual compar-
isons of time series or parameters from a small number
of configurations. HPC approaches to obtain 3D compu-
tational fluid dynamics solutions of the Navier-Stokes
equation might arise during the development of the
CAE tools, but not necessarily during the actual design
process of a wind turbine. To investigate structural be-
havior, e. g. in regard to failures, the manufacturers rely
on Finite Element Models (FEM) in comparison with a
real prototype. The downside of FEM-approaches is the
cumbersome analysis of cause and effects, furthermore
many manufacturers never make the models available,
which prohibits external service providers from exploit-
ing their structural information.
Condition monitoring systems (CMS) on the other
hand rely on empirical models derived from sensor data.
Applied to wind turbines, they have the goal of deter-
mining the health of the components, ensuring safety
(e. g. by detecting ice build-ups on rotor blades), and
reducing the wear of the mechanical parts [31]. Diag-
nosis and fine-tuning are made available thanks to the
condition information of hundreds of sensors collected
by the turbine control station. Precise control strate-
gies can be derived from this information in order to
reduce wear, hence prolonging the healthy state of the
installation. The condition monitoring of rotating ma-
chine parts has a long tradition, whereas the monitor-
ing of rotor blades with oscillation analysis has been
studied far less deeply up until now. Therefore, VAVID
will concentrate its effort on the analysis of rotor blade
oscillation data enriched with operational data of the
wind turbine. The operational data includes for exam-
ple the meteorological conditions and the operational
modes of the wind turbine.
The analysis of the rotor blade oscillation data has
to be based on robust behavioral models of the rotor
blade. This means that these models need to be gen-
erally applicable for different wind turbine types, and
also valid for a broad range of operational modes and
meteorological conditions. Since in condition monitor-
ing the models themselves are deduced from historical
data, it is necessary to examine the data from a vast
amount of wind turbines over a broad range of opera-
tional conditions in order to validate these behavioral
models. Various kinds of analysis methods are used for
this task, especially signal analysis and statistical meth-
ods for regression, clustering, and optimization. Since
the approach is empirical, the results are fraught with
statistical uncertainty. VAVID will guide the users to
evaluate those uncertainties. For example, the system
will produce a warning when no cross-validation data
is selectable, e. g. when the user initially selected to
process all available data. Otherwise, data for cross-
validation shall be suggested or the user will be guided
to make different but comparable model hypotheses.
Since parameters and the selection of data varies for
every analysis, it is necessary to store these parame-
ters and selections of data, thus linking the analysis’
results to the algorithms that produced them and the
data they were applied to. This enables VAVID to make
the results comparable, even with metrics not exist-
ing during early experiments, which can then be repro-
duced. Cross-validation will be supported by running
parametrized workflows on different data sets. These
features guide the user to find the best analysis methods
for their particular goal and to evaluate the robustness
of a behavioral model.
In the context of the VAVID project, the sensor in-
formation coming from up to 600 wind turbines is to
be analyzed, each of them producing a data stream of
about 100 MiB per hour. This data is typically highly
fragmented, consisting of millions of single measure-
ments structured in individual files and databases. The
sensor data is to be kept at least as long as the wind
turbine remains operational, which is in the order of 20
years.
VAVID builds a data gateway for massive data anal-
ysis with a user interface designed for the day-to-day
use by engineers, enabling them to execute empirical
analysis of the data and gain results with an educated
trial-and-error approach comparable to physical exper-
iments.
4 Aguilera et al.
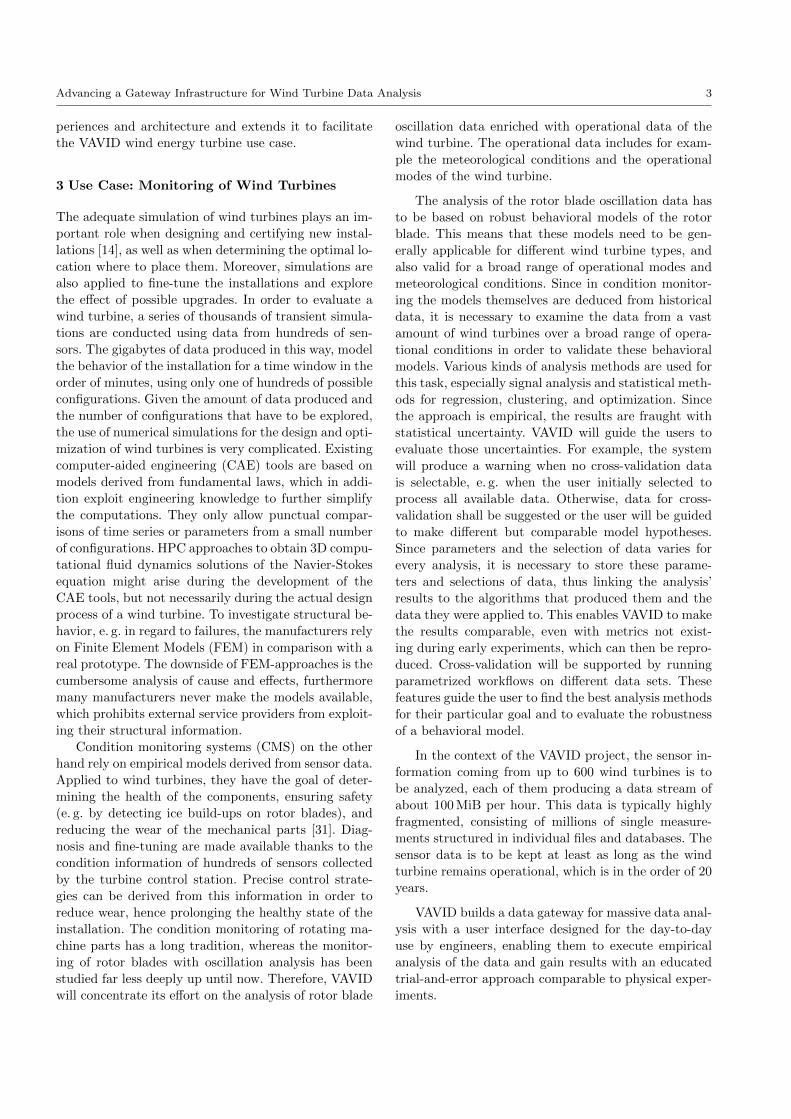
Table 1 Comparison of two data analysis experiments fordetermining an ice formation model.
Step Method I Method II
Dataselection
Time series selection. Mappings of envi-ronmental conditions and labels.
Single time series per data set.
Featurespace trans-formation
Hann window anddiscrete Fouriertransformation.
Empirical mode
decomposition.
Single spectrumper data set.
Modal separatedtime series perdata set.
Featureextraction
Determine max-ima for frequencyrange.
Determine periodlengths and conver-sion to peak fre-quency.
Peak frequencies per data set.
Featurereduction
Selection of single peak frequency perdata set.
Single peak frequency per data set.
Analysismethod
Linear regression oforder one.
Kernel regression.
Regression model.
Characte-ristic gene-ration andvisualization
Distance between peak and model pre-diction. Comparison of certain limit andmapped labels.
Using the gateway, following just-in-time wind tur-
bine data evaluations for ice detection becomes possi-
ble. Especially in cold climates, the rotor blades of wind
turbines are prone to ice formation. Depending on the
location of the turbine site, the ice on the rotor blades
pose a serious threat to the safety of nearby people,
creatures, and objects when the ice falls off from the ro-
tating blades. Therefore, it is often necessary to stop the
wind turbine when a certain amount of ice has formed
on the rotor blades. Ice formation can be detected by
frequency shifts in the rotor blade oscillations. Since
these oscillations are also dependent on environmental
conditions and the operation mode of the turbine, it is
necessary to find models that exactly predict the oscil-
lation frequencies in order to distinguish the frequency
shifts based on ice formation from the frequency shifts
produced due to changes in the environmental condi-
tions or the operation mode.
Table 1 lists two different data analysis experiments
that could be used to determine such a model. The
description of the general steps is shown on the left col-
umn. The experiments are executed from top to bot-
tom. The actual experiment steps correspond to the
columns Method I and Method II. The intermediate
rows in italic mark additional data produced by the
previous workflow step that serve as input for the sub-
sequent step. The data selection phase is the same for
both experiments as well as the final generation of char-
acteristics that are used for the comparison or visual-
ization of the results. Such a setup makes the work-
flows themselves comparable. Both workflows have to
be understood as templates for data analysis experi-
ments, since each step can be parametrized separately.
To achieve the goal of creating an adequate behavioral
model for ice formation, it is necessary to execute the
experiments with multiple different parameter sets.
The main differences between both workflows are in
the feature transformation and the analysis steps. In the
standard workflow (Method I), the time series are trans-
formed to a frequency space using Fast Fourier Trans-
formations (FFT), whereas in the alternative workflow
(Method II), empirical mode decomposition [22] is used
to separate the time series into its modal components.
This makes it necessary to use different feature extrac-
tion procedures for each method since the resulting fea-
ture space is different. Together with the corresponding
feature extraction, these parts of the workflow are in-
terchangeable. Both feature extraction methods have
in common that their output length may vary for each
processed data set. To address this issue, a feature re-
duction step is introduced. This step simply selects one
of the available peak frequencies per data set. The dif-
ferent parameter sets of this selection will lead to the
behavioral models for the different oscillation modes of
the rotor blade.
The analysis algorithms for both workflows are based
on regression methods: a linear regression in case of
Method I, and a non-parametric regression for Method
II. Both steps can be parametrized, although non-parametric
regression suggests otherwise. The main parameter for
linear regression is a polynomial model whose coeffi-
cients are determined by the analysis method. The non-
parametric regression doesn’t need a pre-defined model,
but may be parametrized with different kernels. The
result of both analysis methods is a predictor of peak
frequencies which takes environmental conditions as in-
put.
To determine the quality of the model, we calculate
the distance between the actual peak frequencies calcu-
lated in the steps before the analysis and the predicted
frequencies for each data set. These differences are then
compared against an arbitrary limit. Each distance ex-
ceeding the limit is labeled as ice formation. Comparing
these labels to the mapped labels for each data set lets
us determine the true-positive and false-positive rate of
the predictor subject to the chosen limit.

Advancing a Gateway Infrastructure for Wind Turbine Data Analysis 5
4 VAVID Infrastructure
The VAVID data gateway is responsible for providing
the end users with a friendly way of controlling the
processes and interactions taking place within the dif-
ferent components of the VAVID architecture. Thus,
it’s aimed at enabling a high overall user acceptance
of the system. The overview of the data life cycle in
VAVID is illustrated in Figure 1. On the left side, data
coming from the wind turbines is collected in a cen-
tral repository for analysis and long term storage. In
order to efficiently analyze the data, a smaller subset
of the arriving data is generated using pre-processing
algorithms for data anonymization, compression, and
pattern extraction. This subset of data is kept and man-
aged in the in-memory database presented in Section 6
and serves as input for the different numerical analy-
ses described in Section 5. Both the pre-processing and
the numerical analysis are multi-step processes involv-
ing many tools with different levels of parallelization,
performance, and system requirements. These building-
blocks are in modular form following a general conven-
tion. This way, all modules will be available to the user
when creating workflow compositions using the data
gateway. The resulting workflows are controlled by a
workflow orchestration and mapping system, which in
turn is accessed by the users through the data gateway.
The advantage of this approach is that the users do not
have to spend time creating and maintaining orchestra-
tion and mapping scripts, or dealing with the different
batch systems of HPC clusters. Additionally, the data
gateway possesses extensible visualization capabilities
that users can employ to inspect the data and the re-
sults of the analyses.
ModelsSimulationsMeasurements
Extracted DataDerived DataMeta-Data
Data management
User interface Visualization
Pre-processingCompressionData extraction
Complex Analyses
Big Data
Simple Analyses
Storage & Database System
Interactive Big Data Analysis
Server side
User side
Fig. 1 Overview of the data life cycle in VAVID.
The technical realization of this concept is illus-
trated in Figure 2. At the lowest level, a cluster file
system is responsible for storing the bulk of data com-
dCache
Lustre In-Memory DB
UNICORE
Science Gateway Portal Users
Computingnodes
Fig. 2 Architecture of the VAVID system.
ing from the geographically distributed wind turbines.
In order to keep up with the data inflow, as well as to
provide enough bandwidth for an effective data anal-
ysis on HPC clusters, a parallel file system like Lus-
tre [35] or GPFS [39] is the most sensible choice. In
VAVID, Lustre is the natural choice since it is the paral-
lel file system used on the available HPC systems at the
ZIH. Even though parallel file systems offer unmatched
bandwidths, they often lack in areas such as fault tol-
erance, replication, federated identity, advanced data
management, and client support. To improve the data
management functionality in these areas, the VAVID
data gateway will access the parallel file system indi-
rectly through a dCache [39] layer that allows end users
a more comfortable interaction with the underlying file
system without hindering the HPC components from
directly accessing the parallel file system to maximize
performance. The HPC cluster Taurus [6] located at the
ZIH is the primary HPC system used to power the dif-
ferent data analyses during development and evalua-
tion. However, given the site-replication capabilities of
dCache, other remote HPC clusters could be seamlessly
integrated into the data gateway.
Processing wind turbine data is a multi-step process
involving data compression, pre-processing, dimension-
ality reduction as well as different analyses based on
numerical methods that generate characteristic values.
These values are then evaluated by scientists and engi-
neers in order to optimize the setup of the turbines and
improve their models. VAVID will provide its users with
an effective way of creating, executing and monitoring
such workflows. Building on the experience of the MoS-
Grid collaboration, the responsibility of managing the
workflows is shared amongst two state of the art tech-
nologies: UNICORE and gUSE. Given that the wind
turbines continuously generate large amounts of files
that have to be processed, the transmission and launch
of the pre-processing workflow will be fully automatic.
This automation is achieved by creating adequate inter-

6 Aguilera et al.
faces for the transmission of the data, coupled with the
data-oriented processing capabilities of UNICORE [40].
Science and data gateways offer different ways of
workflow composition that range from text-based de-
scriptions to various graphical paradigms [10]. In VAVID,
workflows are composed graphically using the web in-
terface of the data gateway. As part of the project,
the Java-based workflow editor available in gUSE/WS-
PGRADE has been substituted by a modern one that
relies solely on HTML and Javascript to function. This
was achieved thanks to a collaboration between the
University of Edinburgh and the MTA SZTAKI. The
new editor has replaced the former one in the official
version of gUSE to profit the whole gUSE community.
A vital aspect for VAVID is securing the access to
the measurement and simulation data. The requirement
of strict confidentiality is a result of the industrial con-
text in which this data is produced. Ensuring the seam-
less integration of all the components present in VAVID
in a secure way while keeping the user acceptance high
is a complex and challenging task. With the help of dig-
ital certificates, VAVID will tackle both issues at once.
Certificate-based encryption of network transmissions
is widely supported by the components used in VAVID,
so certificates will be used to increase the security this
way. On the other hand, certificate-based single sign-
on protocols also enjoy a high level of support in most
of the VAVID components and they help the users by
removing the burden of having to separately authenti-
cate with each of the different components in the sys-
tem. The overall challenge is to enable a high usabil-
ity, especially from the users point of view. This goal
will be significantly facilitated by freeing users from
having to apply for, configure, and manage user cer-
tificates. The identity management solution Unity [43]
will be deployed and integrated with the system to en-
able certificate-free usage of the VAVID data gateway.
Thanks to this, users are able to log into the system us-
ing a traditional username/password without compro-
mising security, since Unity generates SAML-assertions
for the users on-the-fly when they need them (e. g. to
start the workflow or encrypt communication).
5 Numerical Algorithms
A main requirement for the analysis of the wind tur-
bine data is to be able to compare the measurements
from the different situations, e. g. change of wind tur-
bine type, of operational mode or in the weather con-
ditions, see Section 3. Roughly speaking, four different
kind of algorithms will be involved.
The first step involves the computation of suitable
features derived from the raw time-dependent data [26],
for example with the typical representation of the aris-
ing data in the frequency domain, which involves the
fast Fourier transform. In the course of the project,
a large range of algorithms will be studied, including
Hilbert transform or Cepstrum, both based on Fourier
transforms, or wavelet analysis. Another aspect in the
study of such time-dependent data are signal decom-
positions to allow the extraction of unwanted effects or
noise, for these exists a range of established so-called
filters, which for example allow the decomposition into
low and high frequency signals [26]. As an alternative, in
the last twenty years empirical mode decomposition [22]
was successfully used in many applications. It allows
to reduce time series data into a collection of intrinsic
mode functions. But also new approaches from recent
years, e. g. shapelets [47], will be investigated to allow
the data analyst the utilization of a range of algorithms
for the development and identification of suitable fea-
tures for the task at hand.
In the second step (dimensionality reduction) we
employ methods to obtain a low dimensional embed-
ding of the data which still describes most of their
characteristics. The standard dimensionality reduction
method is principal component analysis (PCA), which
gives a low-dimensional representation of data which
are assumed to lie in a linear subspace. But if the data
resides in a nonlinear structure, PCA gives an inefficient
representation with too many dimensions.
Therefore, and particularly in recent years, algo-
rithms for nonlinear dimensionality reduction, or man-
ifold learning, have been introduced, see e. g. [32]. The
goal consists in obtaining a low-dimensional represen-
tation of the data, i. e. in two or three dimensions,
which respects the intrinsic nonlinear geometry in high
dimensions, so that nearby points in the high dimen-
sional space stay nearby in the low dimensional em-
bedding. One can describe several practically relevant
approaches for nonlinear dimensionality reduction as a
generalization of metric multidimensional scaling (MDS),
where now a distance matrix is computed which is not
based on the Euclidean distance, but a suitable different
one. Examples are among others Isomap, locally linear
embeddings, or maximum variance unfolding. The em-
bedding is then obtained by a spectral decomposition
of the distance matrix [32].
To allow the latter, different distance measures for
the raw high dimensional time series data will be inves-
tigated, so that the embedding can provide an efficient
and truthful comparison for an interactive navigation of
bundles of sensor measurement data. Furthermore, for
such time series data one needs to consider the prob-
lem of temporal shifts or lags. Here a simple shift, i. e.
two time series show the same behavior, but with a

Advancing a Gateway Infrastructure for Wind Turbine Data Analysis 7
slight overall shift, can be handled by a transformation
into the Fourier frequency domain. A time lag on the
other hand, i. e. the same effect takes place later in one
time series in comparison to the other, is more diffi-
cult to handle. Here, dynamic time warping is one of
the approaches which provide distance measures which
can adapt to time lags and shifts [23]. These three steps
need to connect in a suitable fashion. See [12] for results
on real life data from time series from wind energy ap-
plications. Generally speaking, the signals need to be
“clean” enough for the embedding, which requires the
extraction of unwanted parts of the spectrum. Depend-
ing on the specific analysis goal, time lags are either
signals to detect, or are to be ignored, since the essen-
tial behavior is the same. Here the data analyst needs to
be able to easily apply different distance measures for
time series data in the overall analysis workflow. Fur-
thermore, the identification of suitable distance mea-
sures for this kind of data will give insight into the
choice of features. For a large scale data analysis, the
fast computation of the pairwise distances is one im-
portant building block in the overall workflow, an effi-
cient and parallel numerical data processing inside the
database as described in Section 6 is therefore very im-
portant.
Based on the derived features and exploiting dimen-
sionality reduction, supervised algorithms for classifi-
cation or regression will be used. The aim is to obtain
characteristic values, which then can be provided to
the controller for decision making. A linear regression
will likely not be enough, so nonlinear classification or
regression methods like support vector machines, logis-
tic regression, random forests, or neural networks will
be studied [20]. In particular for the latter, HPC com-
puting capabilities can nowadays be exploited, for in-
stance, using GPU setups for so called deep learning
algorithms. Since in the application domain the aspect
of data set shift likely occurs, we will also investigate
our approaches for covariate shift [44] or transfer learn-
ing [13]. Also relevant are machine learning algorithms
for anomaly detection.
In the overall data life cycle in Figure 1, the user
needs to be have a range of data analysis tools avail-
able on the server side. This involves different feature
constructions, different distance measures, different em-
beddings approaches, and different supervised learning
algorithms. Automatic testing tools will be provided
to be able to automatically evaluate the different ap-
proaches and streamline the process to an usable data-
driven model for the behavior of the wind turbine, as
explained in Section 3 for the case of ice detection.
6 Exploratory HPC Data Processing
Exploratory data analysis is a core requirement of the
VAVID user community as outlined in sections 3 and 5.
On the one hand, this requirement encompasses tasks
like data selection and mapping of additional informa-
tion which are traditionally accomplished using rela-
tional database systems. On the other hand, a major
focus is on numerical processing of time series data that
is collected from various virtual and physical sensors.
Users compose and parametrize a large variety of exist-
ing methods to transform, filter, aggregate and model
said time series. Another group of users tries to develop
novel analytical tools which have to be integrated into
the existing ecosystem to allow realistic evaluation and
eventually application.
To support these use cases from a specification as
well as execution perspective, we rely on ERIS [27],
a data management and processing engine for HPC
systems that enables the creation, composition, and
parametrization of efficient general purpose data anal-
ysis tools for both relational and linear algebra process-
ing. Linear algebra operations form the compute inten-
sive core of most modern numerical algorithms and an
efficient implementation of these operations will allow
us to implement standard numerical tools as well as al-
low the development and integration of new approaches.
ERIS is a pure in-memory storage engine for HPC
systems that provides data analysis programs with effi-
cient parallel access to large structured data sets. The
development of ERIS began with the investigation of in-
dexing data structures that are optimized for in mem-
ory use [5,28]. It was shown that prefix trees (tries)
can avoid the inherent drawbacks of hash- or tree-based
approaches, which can suffer from poor caching perfor-
mance due to frequent memory access to random loca-
tions. When ERIS was introduced in 2014 [27], it en-
compassed a set of efficient low-level data formats and
data access primitives, but lacked an easy to use pro-
gramming environment for the development of useful
data processing applications. To address that shortcom-
ing, a high-level programming model that is based on
flexible data-parallel database operators was proposed
in 2015 [19]. In an article that has been accepted for pre-
sentation recently [34], the programming environment
was extended to include a set of high-level, domain-
specific programming models for relational and linear
algebra processing.
ERIS relies on a set of optimized physical data for-
mats to provide excellent low-level performance for both
relational and linear algebra workloads. In the con-
text of VAVID, users will be able to integrate ERIS
processing tasks into UNICORE workflows. The work-
8 Aguilera et al.
flow manager configures ERIS to load data sets from
disk, execute arbitrary processing tasks, and eventually
dump results back to disk, where they can be retrieved
by subsequent workflow steps.
Historically, database systems were considered soft-
ware components that provide a comprehensive SQL
language interface. However, current applications, as
considered in VAVID, demand a new approach to data-
base programming. SQL’s limited set of operations, in-
flexible syntax, as well as lacking support for user-defined
abstractions make it a bad language for application de-
velopment in VAVID. The use of SQL as an interme-
diate language that is generated and executed as part
of an external program is insufficient as well. The SQL
approach limits the database’s ability to apply global
optimizations and implies an expensive transfer of inter-
mediate results between the database and the control
program. What’s more, SQL’s relational model, opti-
mizations, and data structures are simply not geared
for use cases like high-performance numerical process-
ing.
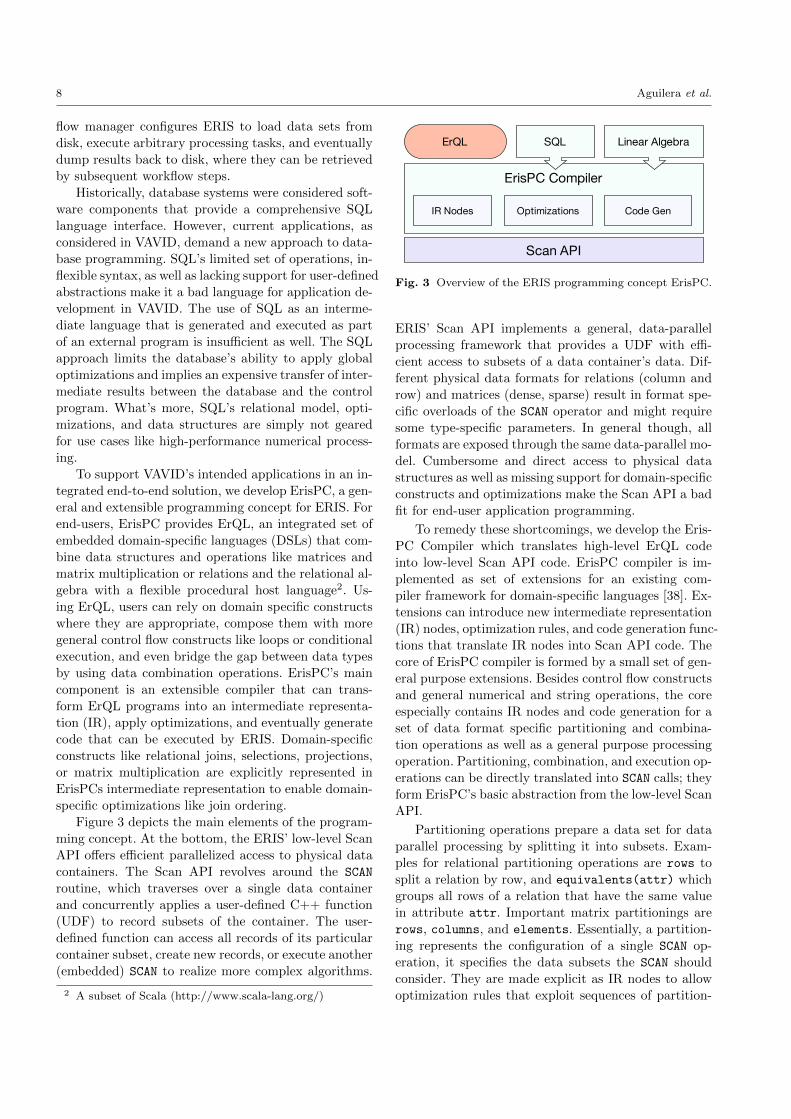
To support VAVID’s intended applications in an in-
tegrated end-to-end solution, we develop ErisPC, a gen-
eral and extensible programming concept for ERIS. For
end-users, ErisPC provides ErQL, an integrated set of
embedded domain-specific languages (DSLs) that com-
bine data structures and operations like matrices and
matrix multiplication or relations and the relational al-
gebra with a flexible procedural host language2. Us-
ing ErQL, users can rely on domain specific constructs
where they are appropriate, compose them with more
general control flow constructs like loops or conditional
execution, and even bridge the gap between data types
by using data combination operations. ErisPC’s main
component is an extensible compiler that can trans-
form ErQL programs into an intermediate representa-
tion (IR), apply optimizations, and eventually generate
code that can be executed by ERIS. Domain-specific
constructs like relational joins, selections, projections,
or matrix multiplication are explicitly represented in
ErisPCs intermediate representation to enable domain-
specific optimizations like join ordering.
Figure 3 depicts the main elements of the program-
ming concept. At the bottom, the ERIS’ low-level Scan
API offers efficient parallelized access to physical data
containers. The Scan API revolves around the SCAN
routine, which traverses over a single data container
and concurrently applies a user-defined C++ function
(UDF) to record subsets of the container. The user-
defined function can access all records of its particular
container subset, create new records, or execute another
(embedded) SCAN to realize more complex algorithms.
2 A subset of Scala (http://www.scala-lang.org/)
Scan API
ErisPC Compiler
ErQL SQL
IR Nodes Optimizations Code Gen
Linear Algebra
Fig. 3 Overview of the ERIS programming concept ErisPC.
ERIS’ Scan API implements a general, data-parallel
processing framework that provides a UDF with effi-
cient access to subsets of a data container’s data. Dif-
ferent physical data formats for relations (column and
row) and matrices (dense, sparse) result in format spe-
cific overloads of the SCAN operator and might require
some type-specific parameters. In general though, all
formats are exposed through the same data-parallel mo-
del. Cumbersome and direct access to physical data
structures as well as missing support for domain-specific
constructs and optimizations make the Scan API a bad
fit for end-user application programming.
To remedy these shortcomings, we develop the Eris-
PC Compiler which translates high-level ErQL code
into low-level Scan API code. ErisPC compiler is im-
plemented as set of extensions for an existing com-
piler framework for domain-specific languages [38]. Ex-
tensions can introduce new intermediate representation
(IR) nodes, optimization rules, and code generation func-
tions that translate IR nodes into Scan API code. The
core of ErisPC compiler is formed by a small set of gen-
eral purpose extensions. Besides control flow constructs
and general numerical and string operations, the core
especially contains IR nodes and code generation for a
set of data format specific partitioning and combina-
tion operations as well as a general purpose processing
operation. Partitioning, combination, and execution op-
erations can be directly translated into SCAN calls; they
form ErisPC’s basic abstraction from the low-level Scan
API.
Partitioning operations prepare a data set for data
parallel processing by splitting it into subsets. Exam-
ples for relational partitioning operations are rows to
split a relation by row, and equivalents(attr) which
groups all rows of a relation that have the same value
in attribute attr. Important matrix partitionings are
rows, columns, and elements. Essentially, a partition-
ing represents the configuration of a single SCAN op-
eration, it specifies the data subsets the SCAN should
consider. They are made explicit as IR nodes to allow
optimization rules that exploit sequences of partition-
Advancing a Gateway Infrastructure for Wind Turbine Data Analysis 9
ing, preserving operations or certain compositions of
partitionings and combinations.
Combination operations enable joint processing of
multiple data sets. Classical operations that require joint
processing include relational joins and all binary lin-
ear algebra operations. The most general combine op-
eration is cross, which creates the cartesian product
of two, possibly partitioned, data sets. To compute a
matrix-vector multiplication one could for example cross
a rows-partitioned matrix and an unpartitioned column
vector and then process each of the resulting (row
vector, column vector) combinations to perform the
actual multiplication. equi(attr1, attr2) is a more
specialized combination operation that combines only
elements that have the same value in one of their at-
tributes. Combination operations can also be used to
join data elements of different types: a cross of a rows-
partitioned relation and an unpartitioned matrix com-
bines each row of the relation with the complete matrix
and allows a subsequent process operation to access
(row, matrix) combinations. Combinations can be ap-
plied to different storage formats and each of these con-
figurations can be targeted individually by optimization
rules and can be backed by special code generation. In
general, code generation for combinations is more in-
volved than for partitionings as it takes two interleaved
SCANs to combine data from different sources.
The final base operation is process which applies
a user-defined function to the subsets of a partitioned
data set. The UDF has to accept a data subset as its in-
put, can access and process all contained data elements,
and eventually has to return a data set. process col-
lects the outputs of all UDF calls and returns them
as a partitioned data set for further processing. Each
process is compiled into a Scan API UDF and em-
bedded into the last SCAN operation of the preceding
partitioning or combine operations.
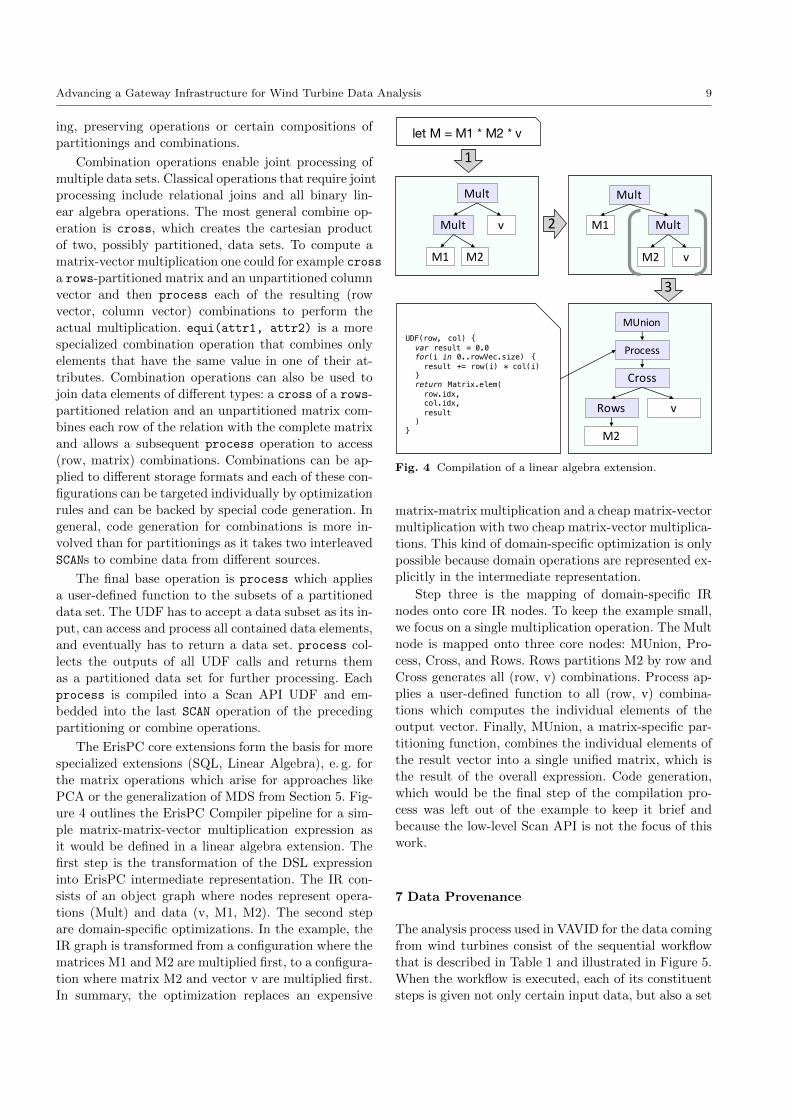
The ErisPC core extensions form the basis for more
specialized extensions (SQL, Linear Algebra), e. g. for
the matrix operations which arise for approaches like
PCA or the generalization of MDS from Section 5. Fig-
ure 4 outlines the ErisPC Compiler pipeline for a sim-
ple matrix-matrix-vector multiplication expression as
it would be defined in a linear algebra extension. The
first step is the transformation of the DSL expression
into ErisPC intermediate representation. The IR con-
sists of an object graph where nodes represent opera-
tions (Mult) and data (v, M1, M2). The second step
are domain-specific optimizations. In the example, the
IR graph is transformed from a configuration where the
matrices M1 and M2 are multiplied first, to a configura-
tion where matrix M2 and vector v are multiplied first.
In summary, the optimization replaces an expensive
let M = M1 * M2 * v
Mult
vMult
M1 M2
Mult
M1 Mult
M2 v
1
2
Cross
Rows v
M2
Process
3
UDF(row, col) {var result = 0.0for(i in 0..rowVec.size) {result += row(i) * col(i)
}return Matrix.elem(row.idx,col.idx,result
)}
MUnion
Fig. 4 Compilation of a linear algebra extension.
matrix-matrix multiplication and a cheap matrix-vector
multiplication with two cheap matrix-vector multiplica-
tions. This kind of domain-specific optimization is only
possible because domain operations are represented ex-
plicitly in the intermediate representation.
Step three is the mapping of domain-specific IR
nodes onto core IR nodes. To keep the example small,
we focus on a single multiplication operation. The Mult
node is mapped onto three core nodes: MUnion, Pro-
cess, Cross, and Rows. Rows partitions M2 by row and
Cross generates all (row, v) combinations. Process ap-
plies a user-defined function to all (row, v) combina-
tions which computes the individual elements of the
output vector. Finally, MUnion, a matrix-specific par-
titioning function, combines the individual elements of
the result vector into a single unified matrix, which is
the result of the overall expression. Code generation,
which would be the final step of the compilation pro-
cess was left out of the example to keep it brief and
because the low-level Scan API is not the focus of this
work.
7 Data Provenance
The analysis process used in VAVID for the data coming
from wind turbines consist of the sequential workflow
that is described in Table 1 and illustrated in Figure 5.
When the workflow is executed, each of its constituent
steps is given not only certain input data, but also a set

10 Aguilera et al.
of parameters that establish the global configuration of
the analysis process. The execution of a workflow can
be repeated multiple times using different combinations
of input data sets and parameters both for algorithmic
exploration and production use. Every step of the work-
flow produces intermediate results that can be useful to
the analysts, adding to the complexity and scale of the
data that has to be managed.
Data Gateway
UNICORE
Windturbine
Data selection
Space transformation
Feature extraction
Feature reduction
Data analysis
Visualization
Archive
Fig. 5 Analysis workflow for wind energy installation data.
One of the problems the analysts experience in an
scenario like this is the increasing difficulty of answering
questions like: who created this data set and when?
which methods, parameters, and input data were used
to generate the results? have they been modified? by
whom? etc. Keeping a rigorous record of all this actions
is known as providing data provenance.
A well-known problem in the workflow approach is
that most of the time only partial information is kept
about how the workflow steps were executed. Moreover,
there is a notorious lack of adequate data provenance
support in the state of the art workflow management
systems [8]. Data provenance support is essential for
VAVID to be able to not only compare and reproduce
experiments, but also to trace optimal results back to
the responsible configuration and input data set.
There are four kinds of provenance information that
should be collected when working with scientific work-
flows like the ones used in VAVID [9]. They are:
– Prospective provenance,
– Retrospective provenance,
– Causality provenance, and
– User-defined provenance
Prospective provenance is the general specification
of the workflow that is needed in order to produce a
certain data. This information is usually produced by
workflow systems like UNICORE and gUSE. It is kept
in the same directory where the data is produced.
Retrospective provenance is the log of all actions and
execution environments that were made to produce the
data. In VAVID, we use the Hierarchical Data Format
Version 5 (HDF5) [11] to store persistent results. HDF5
is a self-describing format with extensive support for
metadata. The choice of HDF5 in VAVID relied not
only on the fact that it’s a proven and widespread soft-
ware, but also because UNICORE is capable of scan-
ning HDF5 files and indexing their metadata [36]. More-
over, it also provides ways of querying this metadata
and use the results for automatic decision-making be-
fore or during the workflow execution.
Each independent step in a VAVID workflow is re-
sponsible for augmenting the retrospective provenance
of its input data and store it as metadata amongst its in-
termediate output in HDF5 files. This ensures the com-
pleteness of the retrospective provenance of each output
data set. Since the provenance information is now an in-
trinsic part of the output data residing inside the same
files, the complexity of managing the coherency of the
metadata is greatly reduced.
Causality provenance describes the dependency re-
lationships between data and the processes that cre-
ated it. Normally, and in the case of VAVID, it can be
derived by analyzing the prospective and retrospective
provenances.
Finally, user-defined provenance comprises informa-
tion that cannot be automatically derived by the system
but plays an important role during execution. This in-
formation can also be stored as metadata annotations
inside the HDF5 files and its inclusion is left at the
discretion of the user starting the workflow.
8 Example
To illustrate a typical usage of the infrastructure, we
consider a condition monitoring use case for fault detec-
tion of a rotor blade. This is based on non-confidential
data analysis procedures, as opposed to the ice forma-
tion case described in Section 3, but it involves similar
steps in the analysis workflow. See [12] for a detailed
description, we present here the basic ingredients. The
data set contains around 4,000 data points taken over
the course of seven months. The occurrence of damage
in this data set is approximately known and its date
was estimated by a proprietary method of BRMS.
Advancing a Gateway Infrastructure for Wind Turbine Data Analysis 11
We concentrate on the analysis of rotor blade oscil-
lation data, enriched with operational data of the wind
turbine. The vibrational data from the rotor blades are
collected by two acceleration sensors per blade, mounted
in different angles. Data points stem from hourly mea-
surements, where in each measurement cycle the vibra-
tion from the sensors is captured over the course of 100
seconds and afterward transformed into the frequency
domain. Additionally, the following operational param-
eters are saved: timestamp of measurement, rotation
number of rotor, power output of the turbine, wind
velocity, pitch angle of the rotor blades, and environ-
mental temperature, where the instationary values are
averaged over the time window.
Since in condition monitoring the models themselves
are deduced from historical data, it is in general neces-
sary to examine the data from a vast amount of wind
turbines over a broad range of operational conditions
in order to validate these behavioral models. We use
anomaly detection, also called novelty detection, where
one builds a model from existing data of the undamaged
turbine. Additional data points, i. e. measured during
the normal operation, are checked for conformity with
this model. When such current data deviates from the
model, the occurrence of damage is assumed and fur-
ther investigations are triggered.
We illustrate the workflow for an approach based
on dimensionality reduction, namely we utilize princi-
pal component analysis (PCA) on vibrational sensor
measurements of a wind turbine, given in the form of
frequency spectra, to compute a baseline by way of a
low-dimensional basis [20]. Further measurement sam-
ples are projected into this basis to detect deviation of
the coefficients from those of the baseline, indicating
anomalies.
Before one computes the actual analysis algorithm
on data, some pre-processing steps are needed. For ex-
ample, the data points are divided into different classes
according to their operational parameters. These classes
represent different operational modes, e. g. grouped by
rotational speed or similar wind velocities. Such a selec-
tion is performed by the analyst based on engineering
knowledge and directly results in different analysis runs
for the different behavioral classes. In the next step the
variables to be examined are selected. These are cer-
tain frequency bands which are associated with dam-
age features. In the development of a specific analysis
approach, the user will investigate several choices of fre-
quency bands, perform the computational analysis, and
evaluate the results.
In this example, the data originate from turbines
which are essentially operated with constant rotational
speeds, therefore it is advisable to separate data classes
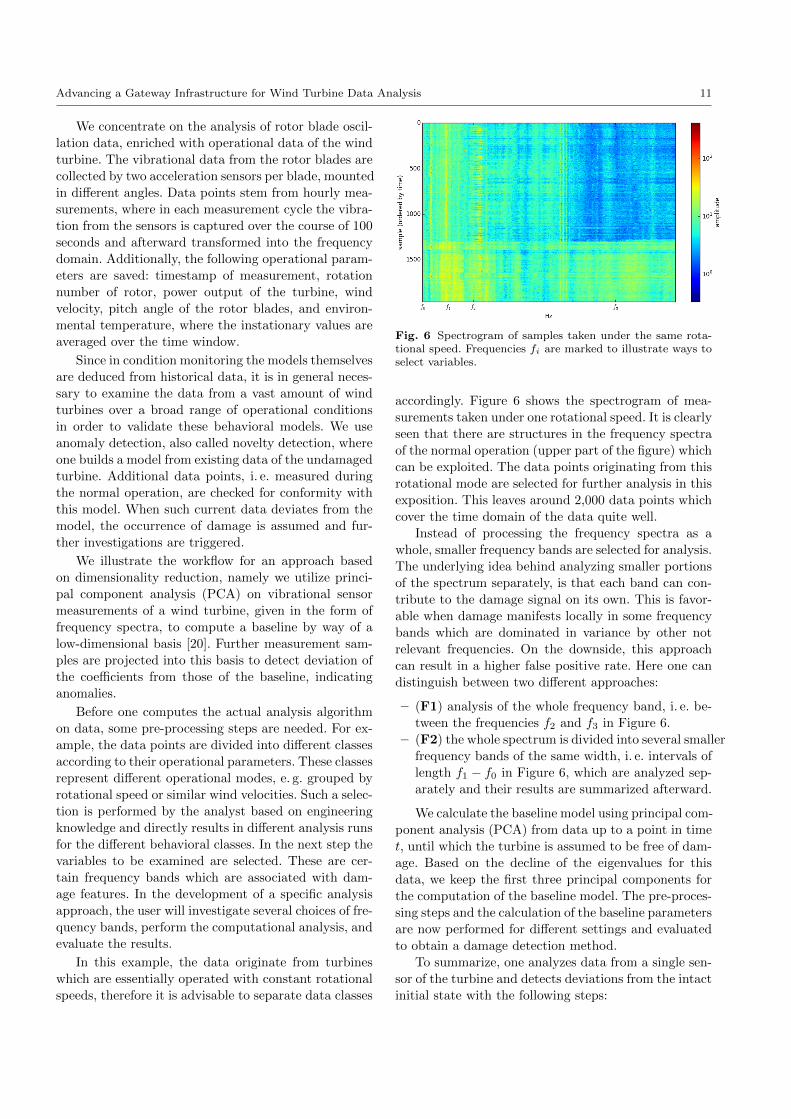
Fig. 6 Spectrogram of samples taken under the same rota-tional speed. Frequencies fi are marked to illustrate ways toselect variables.
accordingly. Figure 6 shows the spectrogram of mea-
surements taken under one rotational speed. It is clearly
seen that there are structures in the frequency spectra
of the normal operation (upper part of the figure) which
can be exploited. The data points originating from this
rotational mode are selected for further analysis in this
exposition. This leaves around 2,000 data points which
cover the time domain of the data quite well.
Instead of processing the frequency spectra as a
whole, smaller frequency bands are selected for analysis.
The underlying idea behind analyzing smaller portions
of the spectrum separately, is that each band can con-
tribute to the damage signal on its own. This is favor-
able when damage manifests locally in some frequency
bands which are dominated in variance by other not
relevant frequencies. On the downside, this approach
can result in a higher false positive rate. Here one can
distinguish between two different approaches:
– (F1) analysis of the whole frequency band, i. e. be-
tween the frequencies f2 and f3 in Figure 6.
– (F2) the whole spectrum is divided into several smaller
frequency bands of the same width, i. e. intervals of
length f1 − f0 in Figure 6, which are analyzed sep-
arately and their results are summarized afterward.
We calculate the baseline model using principal com-
ponent analysis (PCA) from data up to a point in time
t, until which the turbine is assumed to be free of dam-
age. Based on the decline of the eigenvalues for this
data, we keep the first three principal components for
the computation of the baseline model. The pre-proces-
sing steps and the calculation of the baseline parameters
are now performed for different settings and evaluated
to obtain a damage detection method.
To summarize, one analyzes data from a single sen-
sor of the turbine and detects deviations from the intact
initial state with the following steps:

12 Aguilera et al.
0
5
10
15
20
25
flap_101
0
5
10
15
20
25
flap_102
0 1 2 3 4 5 6months
0
5
10
15
20
25
flap_103
T2-s
tati
stic/m
T
baselinedamage
Fig. 7 Damage signal from evaluation of frequency band F1.The signal from rotor blade 3 increases after date td, theassumed date of the damage occurrence.
1. Pre-processing
- Divide data points into operational classes
- Select frequency ranges to be analyzed
2. Select data points describing the intact initial state
3. Compute baseline model using PCA
4. Measure statistical deviations the baseline model
For a given collection of frequency spectra and a
baseline model, the analysis procedure returns the cor-
responding damage signal s. The data points occurring
after time stamp t can be interpreted as a continuous
data feed in real time. Therefore, after the computation
of a baseline model, this data feed can be directly eval-
uated and a continuous signal feed is generated in real
time.
In Figure 7, we show exemplary results for a selected
frequency band. The three plots in one figure show thevalues of the damage signal over time. The left vertical
line indicates the point in time for which the baseline
was selected. The dashed line represents the approxi-
mate date td, at which the damage is first detected by
the proprietary method of BRMS, and evaluated for the
stored sensor data.
The first rotor blade does not show significant devi-
ations, but small deviations shortly after the assumed
date of damage occurrence. The second blade, on the
other hand, shows small deviations before the assumed
date of damage occurrence td. It is unknown whether
this is an indicator for damage or not. Nevertheless,
one can see clearly that the damage signal from the
third rotor blade increases after date td, so the purely
data-driven procedure obtains results very similar to
the proprietary approach.
After re-activation of the turbine in month 5, the
deviations persist and even increase in blade 1 and 2,
which indicates a change of operational or environmen-
tal conditions due to the repair of the rotor blades and
other maintenance efforts. For the purpose of condition
monitoring, a new baseline would need to be derived in
such a situation.
9 Conclusion and Outlook
In this paper, we introduce the novel VAVID architec-
ture to provide a platform for big data analysis in dif-
ferent industrial domains. Here, the focus is on the use
case of the condition monitoring of wind energy tur-
bines, for which a motivation was provided explaining
the current situation as well as the need for the VAVID
platform. We describe the central concept of a novel
big data gateway serving as the main entry point to
the system in order to improve both its usability and
overall security. Furthermore, we describe the general-
ities of the numerical methods used for data analysis
and presented our concept for the in-memory process-
ing of hot data. Lastly, we portray the need for rigorous
data provenance when dealing with scientific data and
workflows and outline our approach in VAVID. We con-
clude the paper by demonstrating the usability of our
approach by investigating fault detection of rotor blades
using models derived from real data.
Amongst the things deserving further studies are
the performance and scalability of the numerical meth-
ods and storage subsystem, the interoperability and in-
terfaces of the different components, production work-
flows and their aggregated performance, as well as to
further improve the data gateway in order to maximize
user acceptance.
Acknowledgment
The authors would like to thank the German Federal
Ministry of Education and Research (BMBF) for the
opportunity to do research in the VAVID project un-
der grant 01IS14005. Furthermore, financial support by
the German Research Foundation (DFG) for the MASi
project (NA711/9-1) is gratefully acknowledged. The
research leading to these results has partially been sup-
ported by the LSDMA project of the Helmholtz Asso-
ciation of German Research Centres.
References
1. Aguilera, A., Grunzke, R., Markwardt, U., Habich, D.,Schollbach, D., Garcke, J.: Towards an industry datagateway: An integrated platform for the analysis of windturbine data. 7th International Workshop on ScienceGateways pp. 62–66 (2015)

Advancing a Gateway Infrastructure for Wind Turbine Data Analysis 13
2. Balasko, A.: Workflow concept of WS-PGRADE/gUSE.In: P. Kacsuk (ed.) Science Gateways for DistributedComputing Infrastructures, pp. 33–50. Springer (2014)
3. Becciani, U., Sciacca, E., Costa, A., Massimino, P.,Pistagna, C., Riggi, S., Vitello, F., Petta, C., Bandier-amonte, M., Krokos, M.: Science gateway technologiesfor the astrophysics community. Concurrency and Com-putation: Practice and Experience 27(2), 306–327 (2015)
4. Benedyczak, K., Schuller, B., Petrova, M., Rybicki, J.,Grunzke, R.: UNICORE 7 - middleware services for dis-tributed and federated computing. In: InternationalConference on High Performance Computing Simulation(HPCS) (2016, accepted)
5. Boehm, M., Schlegel, B., Volk, P.B., Fischer, U., Habich,D., Lehner, W.: Efficient in-memory indexing with gener-alized prefix trees. In: BTW, vol. 180, pp. 227–246 (2011)
6. Center for Information Services and High PerformanceComputing of the TU Dresden: HPC cluster Tau-rus (2015). URL https://doc.zih.tu-dresden.de/
hpc-wiki/bin/view/Compendium/SystemTaurus7. Costa, A., Massimino, P., Bandieramonte, M., Bec-
ciani, U., Krokos, M., Pistagna, C., Riggi, S., Sciacca,E., Vitello, F.: An innovative science gateway for theCherenkov telescope array. Journal of Grid Computingpp. 1–13 (2015)
8. Davidson, S.B., Cohen-Boulakia, S., Eyal, A., Ludascher,B., McPhillips, T.M., Bowers, S., Anand, M.K., Freire, J.:Provenance in scientific workflow systems. IEEE DataEng. Bull. 30(4), 44–50 (2007)
9. Davidson, S.B., Freire, J.: Provenance and scientificworkflows: Challenges and opportunities. In: Proceed-ings of the 2008 ACM SIGMOD International Confer-ence on Management of Data, SIGMOD ’08, pp. 1345–1350. ACM, New York, NY, USA (2008). DOI 10.1145/1376616.1376772
10. Deelman, E., Gannon, D., Shields, M., Taylor, I.: Work-flows and e-science: An overview of workflow system fea-tures and capabilities (2008)
11. Folk, M., Cheng, A., Yates, K.: HDF5: A file format andI/O library for high performance computing applications.In: Proceedings of Supercomputing, vol. 99 (1999)
12. Garcke, J., Iza-Teran, R., Marks, M., Pathare, M., Scholl-bach, D., Stettner, M.: Data analysis for time series datafrom wind turbines. In: Industrial Mathematics at Fraun-hofer SCAI. Springer (2016). Preprint
13. Garcke, J., Vanck, T.: Importance weighted inductivetransfer learning for regression. In: T. Calders, F. Es-posito, E. Hullermeier, R. Meo (eds.) ECMLPKDD2014, Nancy, Lecture Notes in Computer Science, vol.8724, pp. 466–481. Springer (2014). DOI 10.1007/978-3-662-44848-9 30
14. Gasch, R., Twele, J. (eds.): Wind Power Plants. SpringerBerlin Heidelberg, Berlin, Heidelberg (2012). DOI 10.1007/978-3-642-22938-1
15. Gesing, S., Grunzke, R., Kruger, J., Birkenheuer, G.,Wewior, M., Schafer, P., Schuller, B., Schuster, J.,Herres-Pawlis, S., Breuers, S., Balasko, A., Kozlovszky,M., Fabri, A.S., Packschies, L., Kacsuk, P., Blunk, D.,Steinke, T., Brinkmann, A., Fels, G., Muller-Pfefferkorn,R., Jakel, R., Kohlbacher, O.: A single sign-on infras-tructure for science gateways on a use case for structuralbioinformatics. Journal of Grid Computing 10(4), 769–790 (2012). DOI 10.1007/s10723-012-9247-y
16. Gesing, S., Kruger, J., Grunzke, R., de la Garza, L.,Herres-Pawlis, S., Hoffmann, A.: Molecular simulationgrid (MoSGrid): A science gateway tailored to themolecular simulation community. In: Science Gateways
for Distributed Computing Infrastructures, pp. 151–165.Springer International Publishing (2014). DOI 10.1007/978-3-319-11268-8 11
17. Gottdank, T.: Introduction to the WS-PGRADE/gUSEscience gateway framework. In: P. Kacsuk (ed.) ScienceGateways for Distributed Computing Infrastructures, pp.19–32. Springer (2014)
18. Grunzke, R., Breuers, S., Gesing, S., Herres-Pawlis, S.,Kruse, M., Blunk, D., de la Garza, L., Packschies, L.,Schafer, P., Scharfe, C., Schlemmer, T., Steinke, T.,Schuller, B., Muller-Pfefferkorn, R., Jakel, R., Nagel,W.E., Atkinson, M., Kruger, J.: Standards-based meta-data management for molecular simulations. Con-currency and Computation: Practice and Experience26(10), 1744–1759 (2014). DOI 10.1002/cpe.3116
19. Habich, D., Schad, J., Kissinger, T., Lehner, W.: Towardsprogrammability of a NUMA-aware storage engine (2015)
20. Hastie, T., Tibshirani, R., Friedman, J.: The Elements ofStatistical Learning, Second Edition. Springer (2001)
21. HBP: The human brain project (2015). URL https://
www.humanbrainproject.eu22. Huang, N.E., Shen, Z., Long, S.R., Wu, M.C., Shih, H.H.,
Zheng, Q., Yen, N.C., Tung, C.C., Liu, H.H.: The empir-ical mode decomposition and the Hilbert spectrum fornonlinear and non-stationary time series analysis. Pro-ceedings of the Royal Society A: Mathematical, Physi-cal and Engineering Sciences 454(1971), 903–995 (1998).DOI 10.1098/rspa.1998.0193
23. Itakura, F.: Minimum prediction residual principle ap-plied to speech recognition. IEEE Transactions on Acous-tics, Speech, and Signal Processing 23(1), 67 – 72 (1975).DOI 10.1109/TASSP.1975.1162641
24. Kacsuk, P.: Science Gateways for Distributed ComputingInfrastructures. Springer (2014)
25. Kacsuk, P., Farkas, Z., Kozlovszky, M., Hermann,G., Balasko, A., Karoczkai, K., Marton, I.: WS-PGRADE/gUSE generic DCI gateway framework fora large variety of user communities. Journal of GridComputing 10(4), 601–630 (2012). DOI 10.1007/s10723-012-9240-5
26. Kammeyer, K.D., Kroschel, K.: Digitale Signalverar-beitung. Springer Vieweg (2012)
27. Kissinger, T., Kiefer, T., Schlegel, B., Habich, D., Molka,D., Lehner, W.: ERIS: A NUMA-aware in-memory stor-age engine for analytical workloads. Proceedings of theVLDB Endowment 7(14) (2014)
28. Kissinger, T., Schlegel, B., Habich, D., Lehner, W.: KISS-Tree: Smart latch-free in-memory indexing on modernarchitectures. In: Proceedings of the Eighth InternationalWorkshop on Data Management on New Hardware, pp.16–23. ACM (2012)
29. Kozlovszky, M., Karoczkai, K., Marton, I., Kacsuk, P.,Gottdank, T.: DCI bridge: Executing WS-PGRADEworkflows in distributed computing infrastructures. In:P. Kacsuk (ed.) Science Gateways for Distributed Com-puting Infrastructures, pp. 51–67. Springer (2014)
30. Kruger, J., Grunzke, R., Gesing, S., Breuers, S.,Brinkmann, A., de la Garza, L., Kohlbacher, O., Kruse,M., Nagel, W.E., Packschies, L., Muller-Pfefferkorn, R.,Schafer, P., Scharfe, C., Steinke, T., Schlemmer, T.,Warzecha, K.D., Zink, A., Herres-Pawlis, S.: The MoS-Grid science gateway – a complete solution for molecularsimulations. Journal of Chemical Theory and Computa-tion 10(6), 2232–2245 (2014). DOI 10.1021/ct500159h
31. Kusiak, A., Zhang, Z., Verma, A.: Prediction, operations,and condition monitoring in wind energy. Energy 60, 1–12 (2013). DOI 10.1016/j.energy.2013.07.051
14 Aguilera et al.
32. Lee, J.A., Verleysen, M.: Nonlinear dimensionality reduc-tion. Springer (2007)
33. Liferay: Enterprise open source portal and collaborationsoftware (2015). URL http://www.liferay.com/
34. Luong, J., Habich, D., Kissinger, T., Lehner, W.: Archi-tecture of a multi-domain processing and storage engine(2016)
35. Lustre: The Lustre parallel file system (2015). URL http:
//lustre.org
36. Noor, W., Schuller, B.: MMF: A flexible framework formetadata management in UNICORE. In: UNICORESummit 2010 Proceedings, vol. 5, pp. 51–60 (2010)
37. PRACE: PRACE research infrastructure (2015). URLhttp://www.prace-ri.eu
38. Rompf, T., Odersky, M.: Lightweight modular staging:a pragmatic approach to runtime code generation andcompiled DSLs. In: Acm Sigplan Notices, vol. 46, pp.127–136. ACM (2010)
39. Schmuck, F.B., Haskin, R.L.: GPFS: A shared-disk filesystem for large computing clusters. In: FAST, vol. 2,p. 19 (2002)
40. Schuller, B., Grunzke, R., Giesler, A.: Data oriented pro-cessing in UNICORE. In: UNICORE Summit 2013 Pro-ceedings, IAS Series, vol. 21, pp. 1–6 (2013)
41. Shahand, S., Benabdelkader, A., Jaghoori, M.M., Moura-bit, M.a., Huguet, J., Caan, M.W., Kampen, A.H.,Olabarriaga, S.D.: A data-centric neuroscience gateway:design, implementation, and experiences. Concurrencyand Computation: Practice and Experience 27(2), 489–506 (2015)
42. Shahand, S., Santcroos, M., van Kampen, A.H., Olabar-riaga, S.D.: A grid-enabled gateway for biomedical dataanalysis. Journal of Grid Computing 10(4), 725–742(2012)
43. Unity: Unity - Cloud identity and federation management(2014). URL http://unity-idm.eu
44. Vanck, T., Garcke, J.: Using hyperbolic cross approxima-tion to measure and compensate covariate shift. In: C.S.Ong, T.B. Ho (eds.) ACML 2013, Canberra, pp. 435–450(2013)
45. Wu, J., Siewert, R., Hoheisel, A., Falkner, J., Strauß, O.,Berberovic, D., Krefting, D.: The Charite grid portal:User-friendly and secure access to grid-based resourcesand services. Journal of Grid Computing 10(4), 709–724(2012)
46. XSEDE: Extreme science and engineering discovery en-vironment (2015). URL https://www.xsede.org
47. Ye, L., Keogh, E.: Time series shapelets. In: KDD 2009,pp. 947–956. ACM Press (2009). DOI 10.1145/1557019.1557122