ACCA-6 RFI Surveillance Nesbitt
16
© 2010 Doble Engineering Company -77 th Annual International Doble Client Conference All Rights Reserved HV SUBSTATION SURVEILLANCE USING RFI: ISOLATOR FAULT DETECTION AND CHARACTERIZATION A. Nesbitt, B.G. Stewart, S.G. McMeekin, S. Conn er, J.C. Gamio School of Engineering and Computing, Glasgow Caledonian University, Glasgow, UK. L. Moodley, K. Govender Doble Engineering Africa, Durban, South Africa K. Liebech-Lien, H.O. Kristiansen Doble TransiNor AS, Trondheim, Norway ABSTRACT A substation asset management strategy is key to ensuring that critical substation apparatus operate reliably, meet availability requirements and provide adequate capacity for the future. This depends heavily on predictive maintenance asses sments conducted periodi cally on the apparat us for signs of det erioration. Radio frequency interference (RFI) measurement offers a front line non-invasive technique to assess the condition of individual high voltage (HV) apparatus as part of a substation surveillance program. This paper presents a case study that demonstrates the precautions and procedures to record and map the RFI emissions observed within a strategically important 400kV substation switchyard and assess for RFI disturbances that are characteristic of potential insulation degradation. The results were recorded to allow future trending and therefore facilitate an assessment of individual HV apparatus insulation over time. In the course of conducting the survey, three sites of potential insulation degradation were discovered, the more serious of which was localised, characterised and identified as a fault condition b y analysing and correlating the measured frequency spectrum with the observed pulsed behaviour of the RFI emissions. INTRODUCTION High-voltage (HV) substation apparatus is subjected to electrical, mechanical, and thermal stresses as well as environmental conditions. These stresses act to accelerate the deterioration of the insulation and hence the electrical integrity of the HV equipment eventually leading to failure. A substation asset management strategy is key to ensuring that critical substation apparatus operate reliably, meet availability requirements and provide adequate capacity for the future. In order to use the existing equipment most efficiently, system operators need better operation and diagnostic support tools to identify developing or incipient problems, and for longer-term asset management. An asset management strategy depends heavily on predictive maintenance assessments conducted periodically on the equipment. This approach adds value to the maintenance work that is actually conducted on each asset by ensuring that the asset actually needs the service. This approach has the effect of limiting the overall work scope accomplished on each asset and ensures that only necessary work is accomplished. The deployment of radio frequency interference (RFI) measurement has gained increasing acceptance as a front line, non-invasive technique allowing engineers to assess the condition of individual HV electrical apparatus as part of a substation surveillance program [1]. It has long been observed that corona discharge pulses and micro-gap discharges occurring on high-voltage power transmission and distribution lines could disrupt radio and television reception [2, 3,4]. This noise was frequently the result of a defect in the system, which, unchecked, sooner or later could result in an outage. RFI scanning can alert the engineer to the presence of possible sites of insulation
-
Upload
irfan-akhtar -
Category
Documents
-
view
224 -
download
0
Transcript of ACCA-6 RFI Surveillance Nesbitt
8/8/2019 ACCA-6 RFI Surveillance Nesbitt
http://slidepdf.com/reader/full/acca-6-rfi-surveillance-nesbitt 1/16
© 2010 Doble Engineering Company -77th Annual International Doble Client ConferenceAll Rights Reserved
HV SUBSTATION SURVEILLANCE USING RFI:
ISOLATOR FAULT DETECTION AND CHARACTERIZATION
A. Nesbitt, B.G. Stewart, S.G. McMeekin, S. Conner, J.C. GamioSchool of Engineering and Computing, Glasgow Caledonian University, Glasgow, UK.
L. Moodley, K. Govender
Doble Engineering Africa, Durban, South Africa
K. Liebech-Lien, H.O. Kristiansen
Doble TransiNor AS, Trondheim, Norway
ABSTRACT
A substation asset management strategy is key to ensuring that critical substation apparatus operate reliably, meetavailability requirements and provide adequate capacity for the future. This depends heavily on predictive
maintenance assessments conducted periodically on the apparatus for signs of deterioration. Radio frequency
interference (RFI) measurement offers a front line non-invasive technique to assess the condition of individual high
voltage (HV) apparatus as part of a substation surveillance program.
This paper presents a case study that demonstrates the precautions and procedures to record and map the RFI
emissions observed within a strategically important 400kV substation switchyard and assess for RFI disturbances
that are characteristic of potential insulation degradation. The results were recorded to allow future trending and
therefore facilitate an assessment of individual HV apparatus insulation over time. In the course of conducting the
survey, three sites of potential insulation degradation were discovered, the more serious of which was localised,
characterised and identified as a fault condition by analysing and correlating the measured frequency spectrum with
the observed pulsed behaviour of the RFI emissions.
INTRODUCTION
High-voltage (HV) substation apparatus is subjected to electrical, mechanical, and thermal stresses as well as
environmental conditions. These stresses act to accelerate the deterioration of the insulation and hence the electrical
integrity of the HV equipment eventually leading to failure. A substation asset management strategy is key to
ensuring that critical substation apparatus operate reliably, meet availability requirements and provide adequate
capacity for the future.
In order to use the existing equipment most efficiently, system operators need better operation and diagnostic
support tools to identify developing or incipient problems, and for longer-term asset management. An asset
management strategy depends heavily on predictive maintenance assessments conducted periodically on the
equipment. This approach adds value to the maintenance work that is actually conducted on each asset by ensuringthat the asset actually needs the service. This approach has the effect of limiting the overall work scope
accomplished on each asset and ensures that only necessary work is accomplished.
The deployment of radio frequency interference (RFI) measurement has gained increasing acceptance as a front line,
non-invasive technique allowing engineers to assess the condition of individual HV electrical apparatus as part of a
substation surveillance program [1]. It has long been observed that corona discharge pulses and micro-gap
discharges occurring on high-voltage power transmission and distribution lines could disrupt radio and television
reception [2, 3,4]. This noise was frequently the result of a defect in the system, which, unchecked, sooner or later
could result in an outage. RFI scanning can alert the engineer to the presence of possible sites of insulation
8/8/2019 ACCA-6 RFI Surveillance Nesbitt
http://slidepdf.com/reader/full/acca-6-rfi-surveillance-nesbitt 2/16
© 2010 Doble Engineering Company -77th Annual International Doble Client ConferenceAll Rights Reserved
2
deterioration from the range of frequencies where an uplift in signal strength from background levels is observed.
However, successful detection and discrimination of low-repetition rate discharges that typically accompany
electrical deterioration is constrained by the measurement process and requires specific understanding of signal and
instrument characteristics in order to ensure the RFI signals are accurately represented [5].
RFI signals from discharge phenomena are considered to be broadband and impulsive in nature with low repetition
rates [6, 7]. Spectrum analysers and EMI scanning receivers are widely available and used in the detection and
measurement of RFI signals. However, their use for measuring low repetition rate broadband signals presents
particular challenges for reliable and repeatable detection and measurement [11, 12].
This paper focuses on a case study that demonstrates the precautions and procedures to record and map the RFI
emissions observed within a strategically important 400kV substation switchyard and assess for RFI disturbances
that are characteristic of potential insulation degradation. The results were recorded to allow future trending and
therefore facilitate an assessment of individual HV apparatus insulation over time. In the course of conducting the
survey, three sites of potential insulation degradation were discovered, the more serious of which was localized,
characterised and identified as a fault condition by analysing and correlating the measured frequency spectrum with
the observed pulsed behaviour of the RFI emissions.
CHARACTERISTICS AND DETECTION OF RFI EMISSIONS
Surveillance of RFI emissions from PD phenomena involves the measurement of complex waveforms varying
considerably and often erratically in amplitude and time. RFI signals from such phenomena are considered to be
broadband and impulsive in nature with low repetition rates [6, 7].
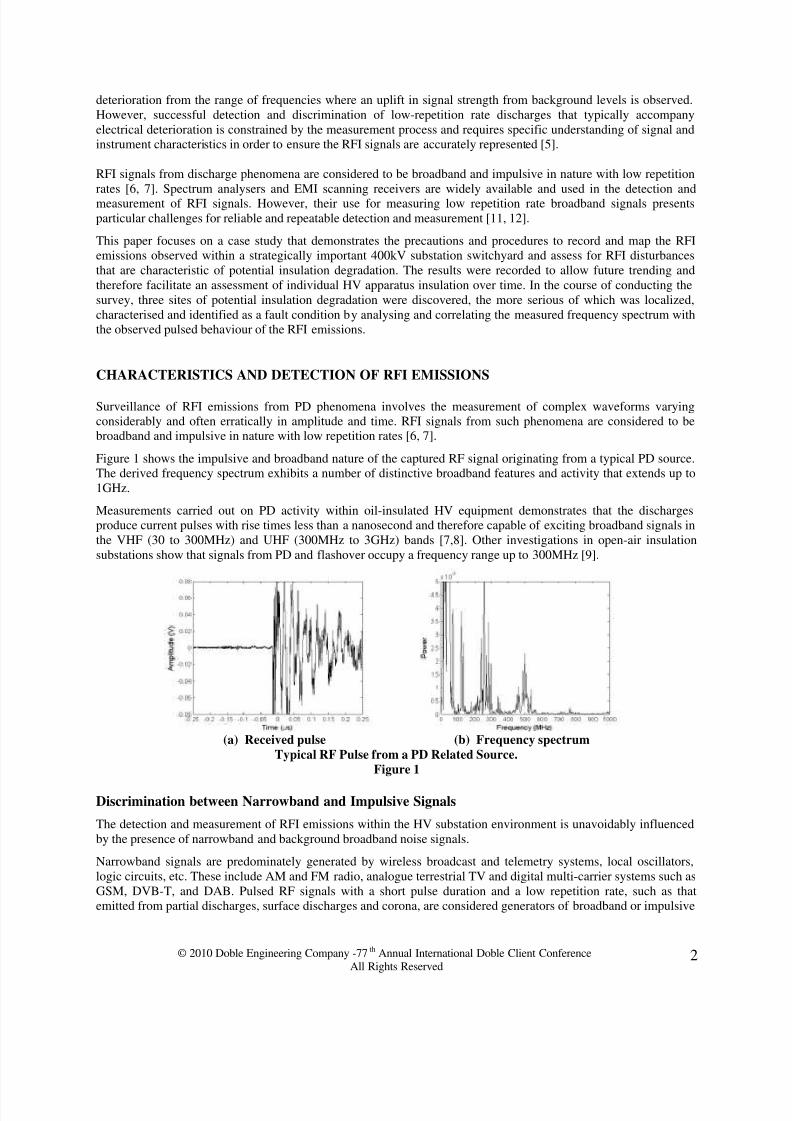
Figure 1 shows the impulsive and broadband nature of the captured RF signal originating from a typical PD source.
The derived frequency spectrum exhibits a number of distinctive broadband features and activity that extends up to
1GHz.
Measurements carried out on PD activity within oil-insulated HV equipment demonstrates that the discharges
produce current pulses with rise times less than a nanosecond and therefore capable of exciting broadband signals in
the VHF (30 to 300MHz) and UHF (300MHz to 3GHz) bands [7,8]. Other investigations in open-air insulation
substations show that signals from PD and flashover occupy a frequency range up to 300MHz [9].
(a) Received pulse (b) Frequency spectrum
Typical RF Pulse from a PD Related Source.
Figure 1
Discrimination between Narrowband and Impulsive Signals
The detection and measurement of RFI emissions within the HV substation environment is unavoidably influenced
by the presence of narrowband and background broadband noise signals.
Narrowband signals are predominately generated by wireless broadcast and telemetry systems, local oscillators,
logic circuits, etc. These include AM and FM radio, analogue terrestrial TV and digital multi-carrier systems such as
GSM, DVB-T, and DAB. Pulsed RF signals with a short pulse duration and a low repetition rate, such as that
emitted from partial discharges, surface discharges and corona, are considered generators of broadband or impulsive
8/8/2019 ACCA-6 RFI Surveillance Nesbitt
http://slidepdf.com/reader/full/acca-6-rfi-surveillance-nesbitt 3/16
© 2010 Doble Engineering Company -77th Annual International Doble Client ConferenceAll Rights Reserved
3
signals. The discrimination of these signals from the narrowband sources is crucial to the process of recognising the
presence of a discharging source. Average detection in an EMI instrument is intended to recover and measure the
amplitudes of narrowband signals in the presence of impulsive broadband noise.
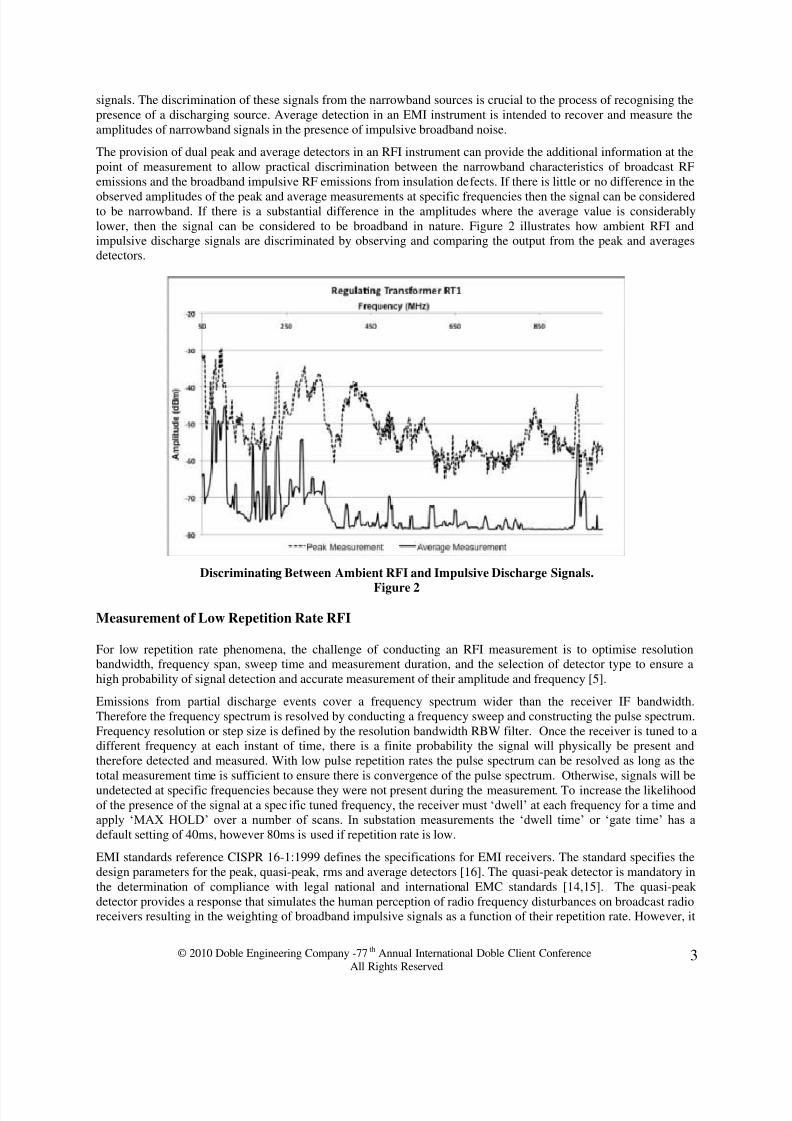
The provision of dual peak and average detectors in an RFI instrument can provide the additional information at the
point of measurement to allow practical discrimination between the narrowband characteristics of broadcast RF
emissions and the broadband impulsive RF emissions from insulation defects. If there is little or no difference in the
observed amplitudes of the peak and average measurements at specific frequencies then the signal can be consideredto be narrowband. If there is a substantial difference in the amplitudes where the average value is considerably
lower, then the signal can be considered to be broadband in nature. Figure 2 illustrates how ambient RFI and
impulsive discharge signals are discriminated by observing and comparing the output from the peak and averages
detectors.
Discriminating Between Ambient RFI and Impulsive Discharge Signals.
Figure 2
Measurement of Low Repetition Rate RFI
For low repetition rate phenomena, the challenge of conducting an RFI measurement is to optimise resolution
bandwidth, frequency span, sweep time and measurement duration, and the selection of detector type to ensure a
high probability of signal detection and accurate measurement of their amplitude and frequency [5].
Emissions from partial discharge events cover a frequency spectrum wider than the receiver IF bandwidth.
Therefore the frequency spectrum is resolved by conducting a frequency sweep and constructing the pulse spectrum.
Frequency resolution or step size is defined by the resolution bandwidth RBW filter. Once the receiver is tuned to a
different frequency at each instant of time, there is a finite probability the signal will physically be present and
therefore detected and measured. With low pulse repetition rates the pulse spectrum can be resolved as long as the
total measurement time is sufficient to ensure there is convergence of the pulse spectrum. Otherwise, signals will be
undetected at specific frequencies because they were not present during the measurement. To increase the likelihoodof the presence of the signal at a spec ific tuned frequency, the receiver must „dwell‟ at each frequency for a time and
apply „MAX HOLD‟ over a number of scans. In substation measurements the „dwell time‟ or „gate time‟ has a
default setting of 40ms, however 80ms is used if repetition rate is low.
EMI standards reference CISPR 16-1:1999 defines the specifications for EMI receivers. The standard specifies the
design parameters for the peak, quasi-peak, rms and average detectors [16]. The quasi-peak detector is mandatory in
the determination of compliance with legal national and international EMC standards [14,15]. The quasi-peak
detector provides a response that simulates the human perception of radio frequency disturbances on broadcast radio
receivers resulting in the weighting of broadband impulsive signals as a function of their repetition rate. However, it
8/8/2019 ACCA-6 RFI Surveillance Nesbitt
http://slidepdf.com/reader/full/acca-6-rfi-surveillance-nesbitt 4/16
© 2010 Doble Engineering Company -77th Annual International Doble Client ConferenceAll Rights Reserved
4
does not provide optimum sensitivity to low repetition rate impulsive RFI signals. Emissions with a higher
repetition rate get more emphasis than emissions with a lower repetition rate because they have a higher annoyance
effect on radio reception. The quasi-peak response approaches that of the peak detector for repetition rates greater
than 1000Hz but is 30 – 40dB down at 1Hz [5]. Provided the EMI receiver dwells on each frequency for long
enough to capture the maximum signal, the peak detector will always give the maximum output level of low
repetition rate impulsive signals – characteristic of PD related events.
RFI EMISSIONS CASE-STUDY
The following describes a case study that demonstrates the precautions and procedures to record and map the RFI
emissions observed within a strategically important 400kV substation switchyard and the assessment carried for RFI
disturbances that are characteristic of potential insulation degradation. The results were recorded to allow future
trending and therefore facilitate an assessment of individual HV apparatus insulation over time.
Substation Site Detail
The specific substation discussed was commissioned in 1995 with a capacity of 2000MW. The substation‟s strategic
importance is underlined by the commissioning of a neighbouring aluminum smelter in 1995, receiving 1200MW
from the substation. The substation is a major part of the national grid and will shortly be upgraded to include 765
kV lines to increase the capacity by 500MW.
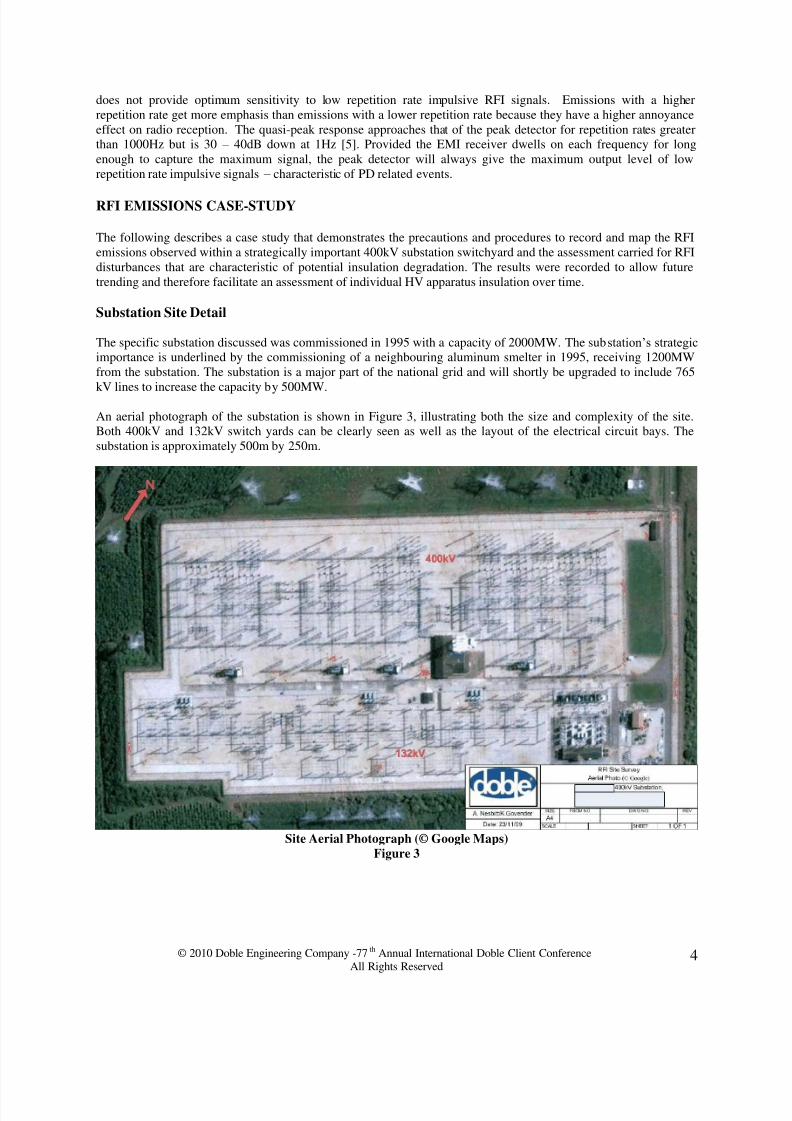
An aerial photograph of the substation is shown in Figure 3, illustrating both the size and complexity of the site.
Both 400kV and 132kV switch yards can be clearly seen as well as the layout of the electrical circuit bays. The
substation is approximately 500m by 250m.
Site Aerial Photograph (© Google Maps)
Figure 3
8/8/2019 ACCA-6 RFI Surveillance Nesbitt
http://slidepdf.com/reader/full/acca-6-rfi-surveillance-nesbitt 5/16
© 2010 Doble Engineering Company -77th Annual International Doble Client ConferenceAll Rights Reserved
5
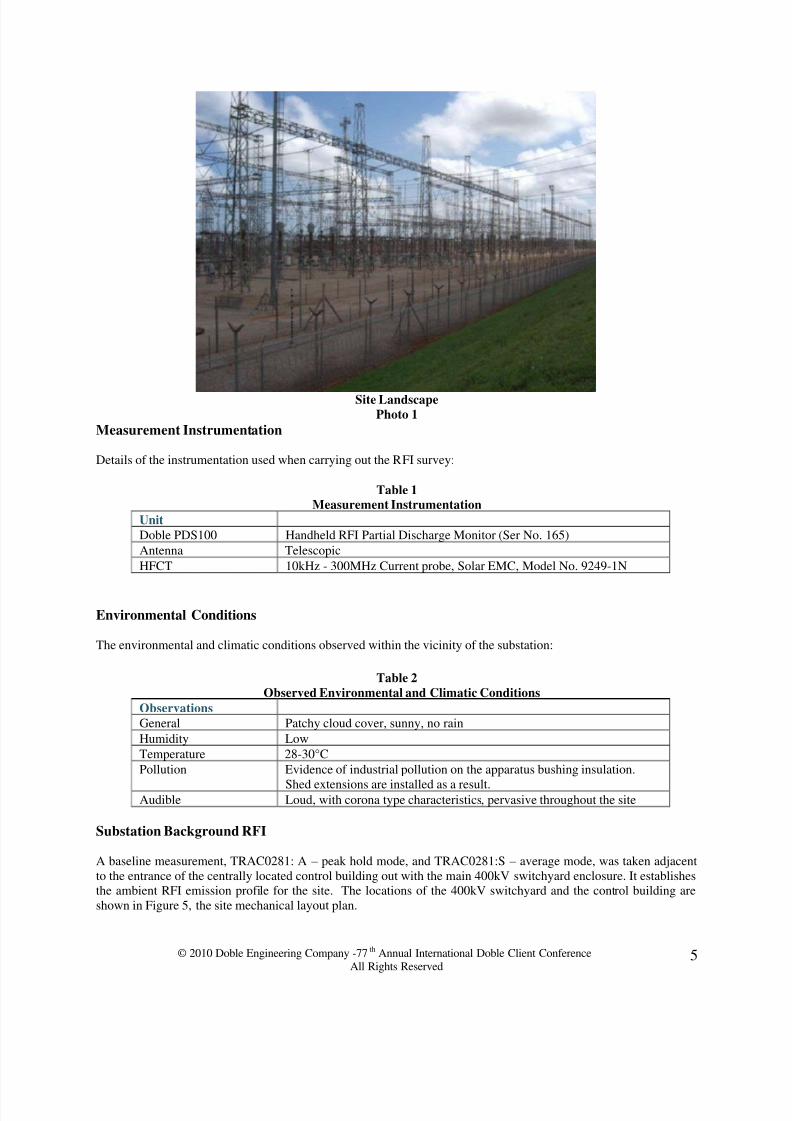
Site Landscape
Photo 1
Measurement Instrumentation
Details of the instrumentation used when carrying out the RFI survey:
Table 1
Measurement Instrumentation
Unit
Doble PDS100 Handheld RFI Partial Discharge Monitor (Ser No. 165)
Antenna Telescopic
HFCT 10kHz - 300MHz Current probe, Solar EMC, Model No. 9249-1N
Environmental Conditions
The environmental and climatic conditions observed within the vicinity of the substation:
Table 2
Observed Environmental and Climatic Conditions
Observations
General Patchy cloud cover, sunny, no rain
Humidity Low
Temperature 28-30°C
Pollution Evidence of industrial pollution on the apparatus bushing insulation.
Shed extensions are installed as a result.Audible Loud, with corona type characteristics, pervasive throughout the site
Substation Background RFI
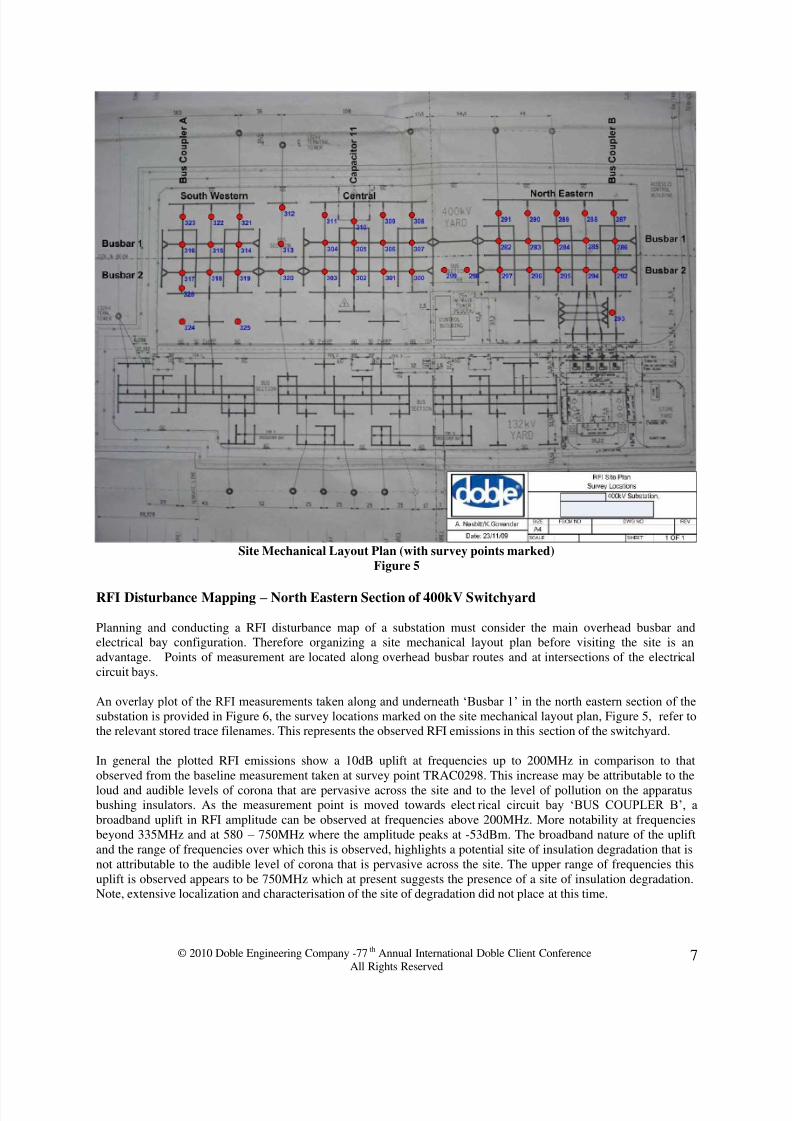
A baseline measurement, TRAC0281: A – peak hold mode, and TRAC0281:S – average mode, was taken adjacent
to the entrance of the centrally located control building out with the main 400kV switchyard enclosure. It establishes
the ambient RFI emission profile for the site. The locations of the 400kV switchyard and the control building are
shown in Figure 5, the site mechanical layout plan.
8/8/2019 ACCA-6 RFI Surveillance Nesbitt
http://slidepdf.com/reader/full/acca-6-rfi-surveillance-nesbitt 6/16
© 2010 Doble Engineering Company -77th Annual International Doble Client ConferenceAll Rights Reserved
6
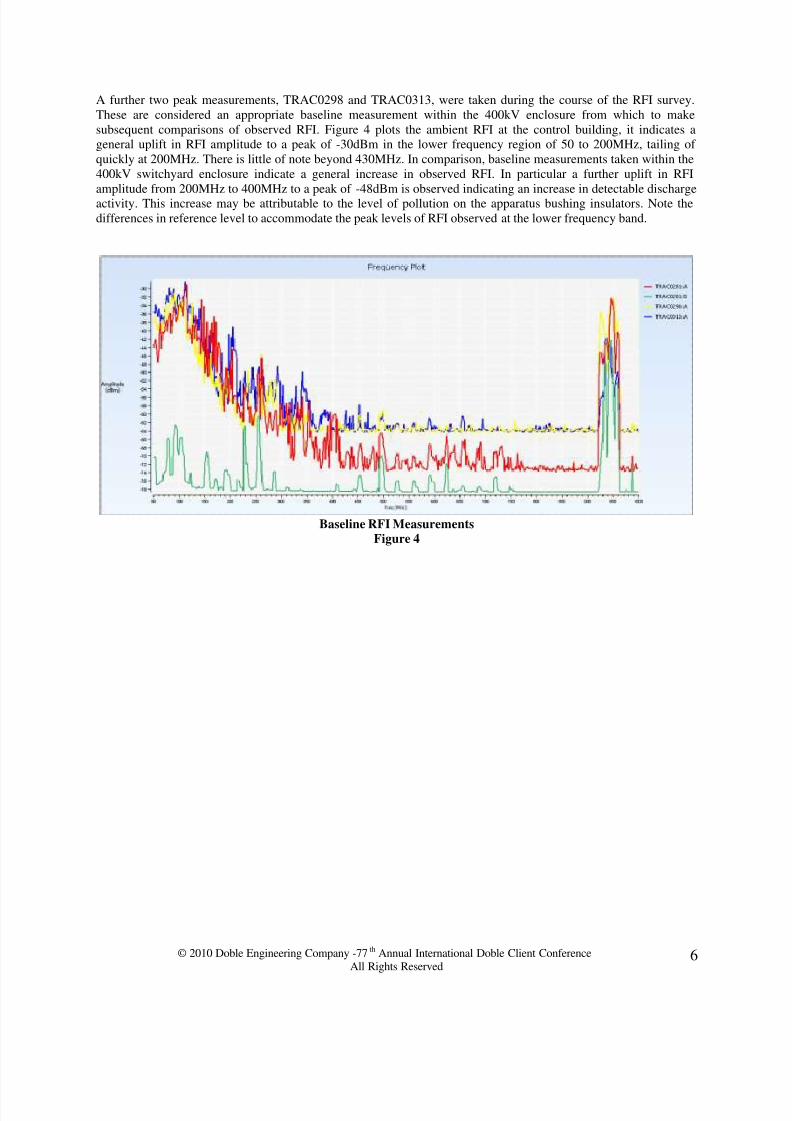
A further two peak measurements, TRAC0298 and TRAC0313, were taken during the course of the RFI survey.
These are considered an appropriate baseline measurement within the 400kV enclosure from which to make
subsequent comparisons of observed RFI. Figure 4 plots the ambient RFI at the control building, it indicates a
general uplift in RFI amplitude to a peak of -30dBm in the lower frequency region of 50 to 200MHz, tailing of
quickly at 200MHz. There is little of note beyond 430MHz. In comparison, baseline measurements taken within the
400kV switchyard enclosure indicate a general increase in observed RFI. In particular a further uplift in RFI
amplitude from 200MHz to 400MHz to a peak of -48dBm is observed indicating an increase in detectable discharge
activity. This increase may be attributable to the level of pollution on the apparatus bushing insulators. Note the
differences in reference level to accommodate the peak levels of RFI observed at the lower frequency band.
Baseline RFI Measurements
Figure 4
8/8/2019 ACCA-6 RFI Surveillance Nesbitt
http://slidepdf.com/reader/full/acca-6-rfi-surveillance-nesbitt 7/16
© 2010 Doble Engineering Company -77th Annual International Doble Client ConferenceAll Rights Reserved
7
Site Mechanical Layout Plan (with survey points marked)
Figure 5
RFI Disturbance Mapping – North Eastern Section of 400kV Switchyard
Planning and conducting a RFI disturbance map of a substation must consider the main overhead busbar and
electrical bay configuration. Therefore organizing a site mechanical layout plan before visiting the site is an
advantage. Points of measurement are located along overhead busbar routes and at intersections of the electrical
circuit bays.
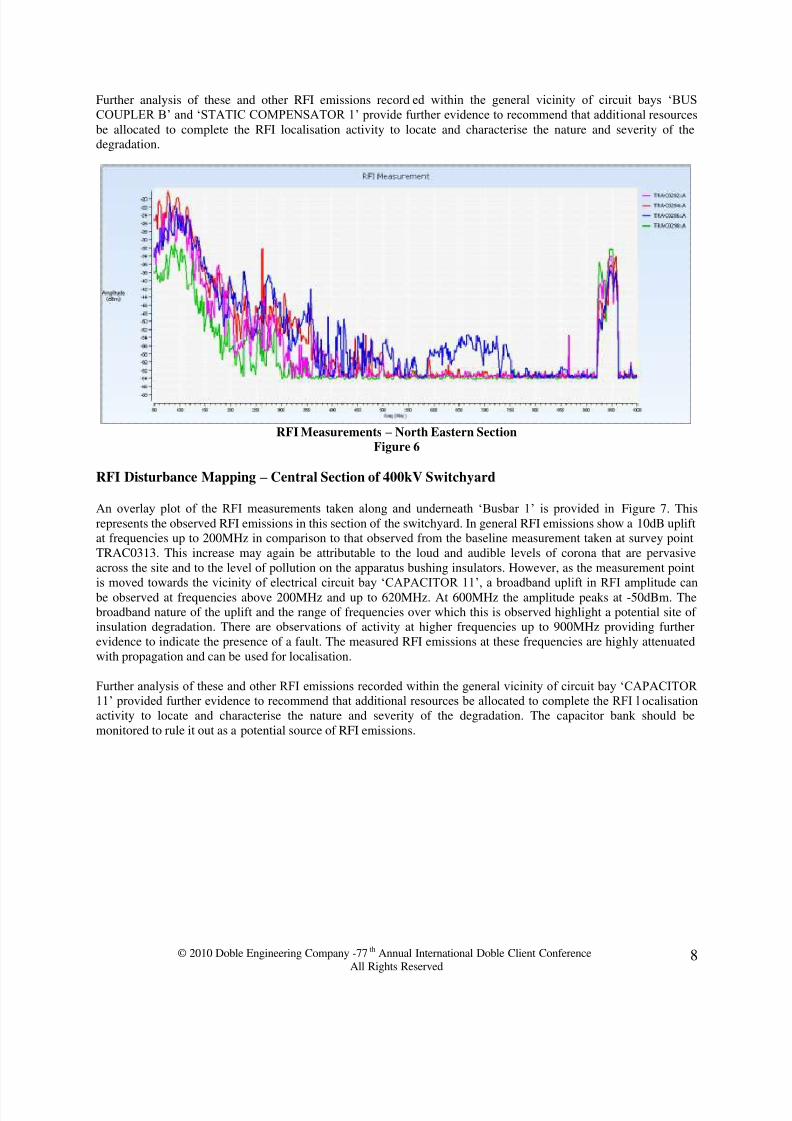
An overlay plot of the RFI measurements taken along and underneath „Busbar 1‟ in the north eastern section of the
substation is provided in Figure 6, the survey locations marked on the site mechanical layout plan, Figure 5, refer to
the relevant stored trace filenames. This represents the observed RFI emissions in this section of the switchyard.
In general the plotted RFI emissions show a 10dB uplift at frequencies up to 200MHz in comparison to that
observed from the baseline measurement taken at survey point TRAC0298. This increase may be attributable to the
loud and audible levels of corona that are pervasive across the site and to the level of pollution on the apparatusbushing insulators. As the measurement point is moved towards electrical circuit bay „BUS COUPLER B‟, a
broadband uplift in RFI amplitude can be observed at frequencies above 200MHz. More notability at frequencies
beyond 335MHz and at 580 – 750MHz where the amplitude peaks at -53dBm. The broadband nature of the uplift
and the range of frequencies over which this is observed, highlights a potential site of insulation degradation that is
not attributable to the audible level of corona that is pervasive across the site. The upper range of frequencies this
uplift is observed appears to be 750MHz which at present suggests the presence of a site of insulation degradation.
Note, extensive localization and characterisation of the site of degradation did not place at this time.
8/8/2019 ACCA-6 RFI Surveillance Nesbitt
http://slidepdf.com/reader/full/acca-6-rfi-surveillance-nesbitt 8/16
© 2010 Doble Engineering Company -77th Annual International Doble Client ConferenceAll Rights Reserved
8
Further analysis of these and other RFI emissions recorded within the general vicinity of circuit bays „BUS
COUPLER B‟ and „STATIC COMPENSATOR 1‟ provide further evidence to recommend that addit ional resources
be allocated to complete the RFI localisation activity to locate and characterise the nature and severity of the
degradation.
RFI Measurements – North Eastern Section
Figure 6
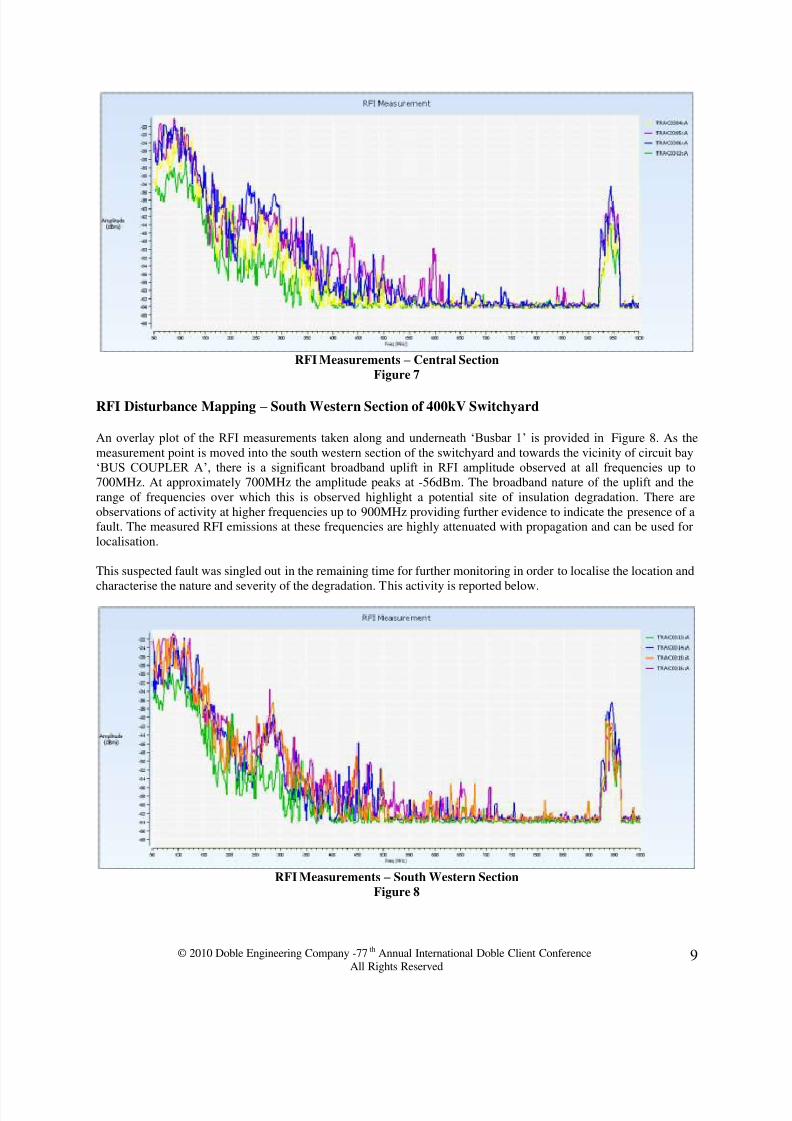
RFI Disturbance Mapping – Central Section of 400kV Switchyard
An overlay plot of the RFI measurements taken along and underneath „Busbar 1‟ is provided in Figure 7. This
represents the observed RFI emissions in this section of the switchyard. In general RFI emissions show a 10dB uplift
at frequencies up to 200MHz in comparison to that observed from the baseline measurement taken at survey point
TRAC0313. This increase may again be attributable to the loud and audible levels of corona that are pervasive
across the site and to the level of pollution on the apparatus bushing insulators. However, as the measurement point
is moved towards the vicinity of electrical circuit bay „CAPACITOR 11‟, a broadband uplift in RFI amplitude can
be observed at frequencies above 200MHz and up to 620MHz. At 600MHz the amplitude peaks at -50dBm. The
broadband nature of the uplift and the range of frequencies over which this is observed highlight a potential site of
insulation degradation. There are observations of activity at higher frequencies up to 900MHz providing further
evidence to indicate the presence of a fault. The measured RFI emissions at these frequencies are highly attenuated
with propagation and can be used for localisation.
Further analysis of these and other RFI emissions recorded within the general vicinity of circuit bay „CAPACITOR
11‟ provided further evidence to recommend that additional resources be allocated to complete the RFI l ocalisation
activity to locate and characterise the nature and severity of the degradation. The capacitor bank should be
monitored to rule it out as a potential source of RFI emissions.
8/8/2019 ACCA-6 RFI Surveillance Nesbitt
http://slidepdf.com/reader/full/acca-6-rfi-surveillance-nesbitt 9/16
© 2010 Doble Engineering Company -77th Annual International Doble Client ConferenceAll Rights Reserved
9
RFI Measurements – Central Section
Figure 7
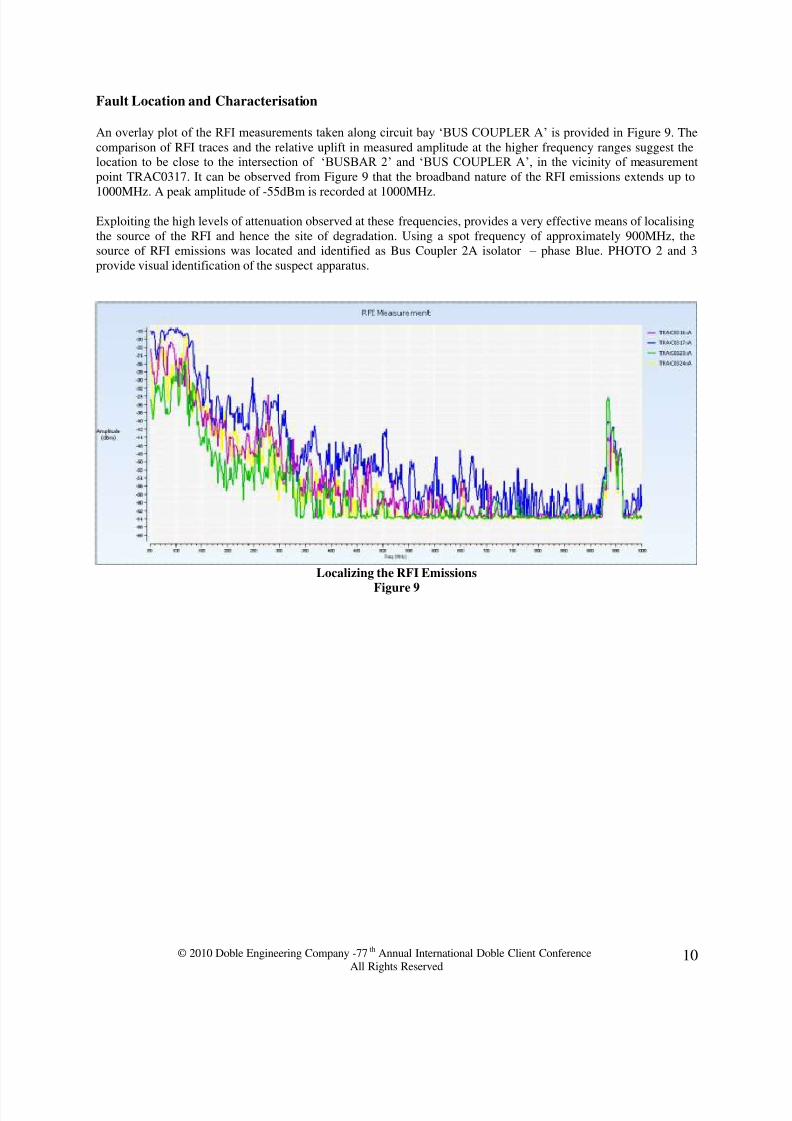
RFI Disturbance Mapping – South Western Section of 400kV Switchyard
An overlay plot of the RFI measurements taken along and underneath „Busbar 1‟ is provided in Figure 8. As the
measurement point is moved into the south western section of the switchyard and towards the vicinity of circuit bay
„BUS COUPLER A‟, there is a significant broadband uplift in RFI amplitude observed at all frequencies up to
700MHz. At approximately 700MHz the amplitude peaks at -56dBm. The broadband nature of the uplift and the
range of frequencies over which this is observed highlight a potential site of insulation degradation. There are
observations of activity at higher frequencies up to 900MHz providing further evidence to indicate the presence of a
fault. The measured RFI emissions at these frequencies are highly attenuated with propagation and can be used for
localisation.
This suspected fault was singled out in the remaining time for further monitoring in order to localise the location and
characterise the nature and severity of the degradation. This activity is reported below.
RFI Measurements – South Western Section
Figure 8
8/8/2019 ACCA-6 RFI Surveillance Nesbitt
http://slidepdf.com/reader/full/acca-6-rfi-surveillance-nesbitt 10/16
© 2010 Doble Engineering Company -77th Annual International Doble Client ConferenceAll Rights Reserved
10
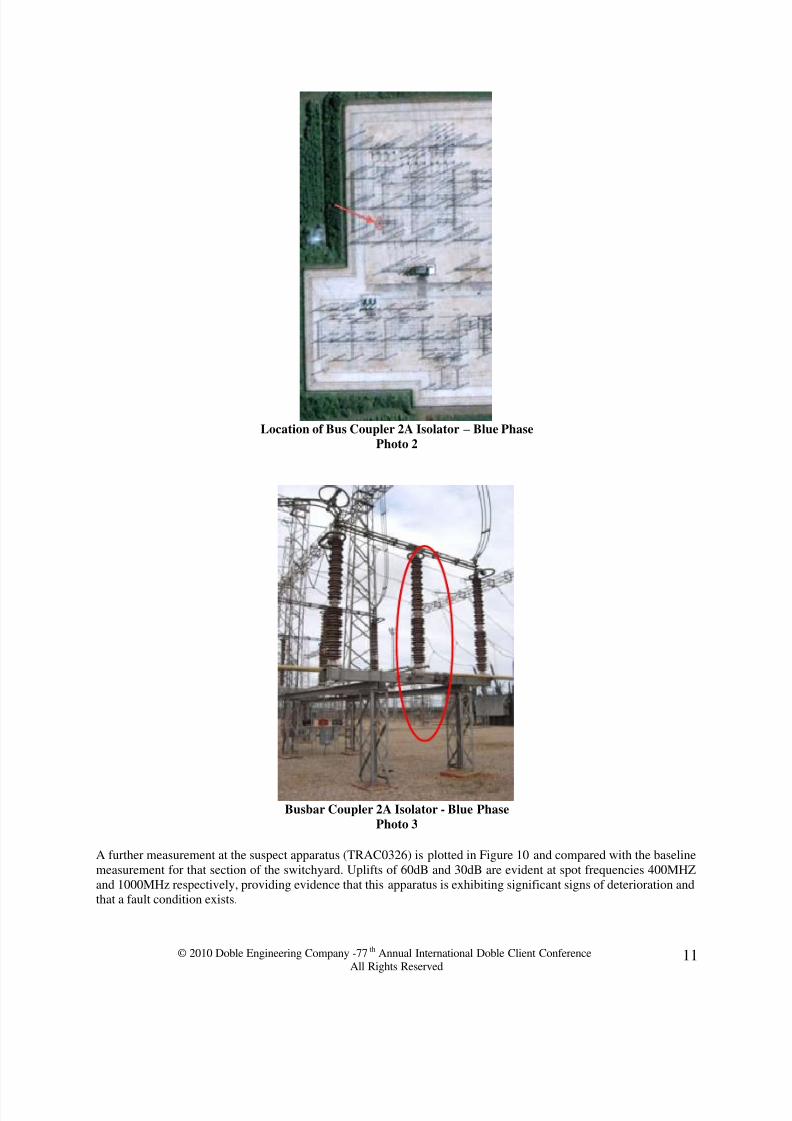
Fault Location and Characterisation
An overlay plot of the RFI measurements taken along circuit bay „BUS COUPLER A‟ is provided in Figure 9. The
comparison of RFI traces and the relative uplift in measured amplitude at the higher frequency ranges suggest thelocation to be close to the intersection of „BUSBAR 2‟ and „BUS COUPLER A‟, in the vicinity of measurement
point TRAC0317. It can be observed from Figure 9 that the broadband nature of the RFI emissions extends up to
1000MHz. A peak amplitude of -55dBm is recorded at 1000MHz.
Exploiting the high levels of attenuation observed at these frequencies, provides a very effective means of localising
the source of the RFI and hence the site of degradation. Using a spot frequency of approximately 900MHz, the
source of RFI emissions was located and identified as Bus Coupler 2A isolator – phase Blue. PHOTO 2 and 3
provide visual identification of the suspect apparatus.
Localizing the RFI Emissions
Figure 9
8/8/2019 ACCA-6 RFI Surveillance Nesbitt
http://slidepdf.com/reader/full/acca-6-rfi-surveillance-nesbitt 11/16
© 2010 Doble Engineering Company -77th Annual International Doble Client ConferenceAll Rights Reserved
11
Location of Bus Coupler 2A Isolator – Blue Phase
Photo 2
Busbar Coupler 2A Isolator - Blue Phase
Photo 3
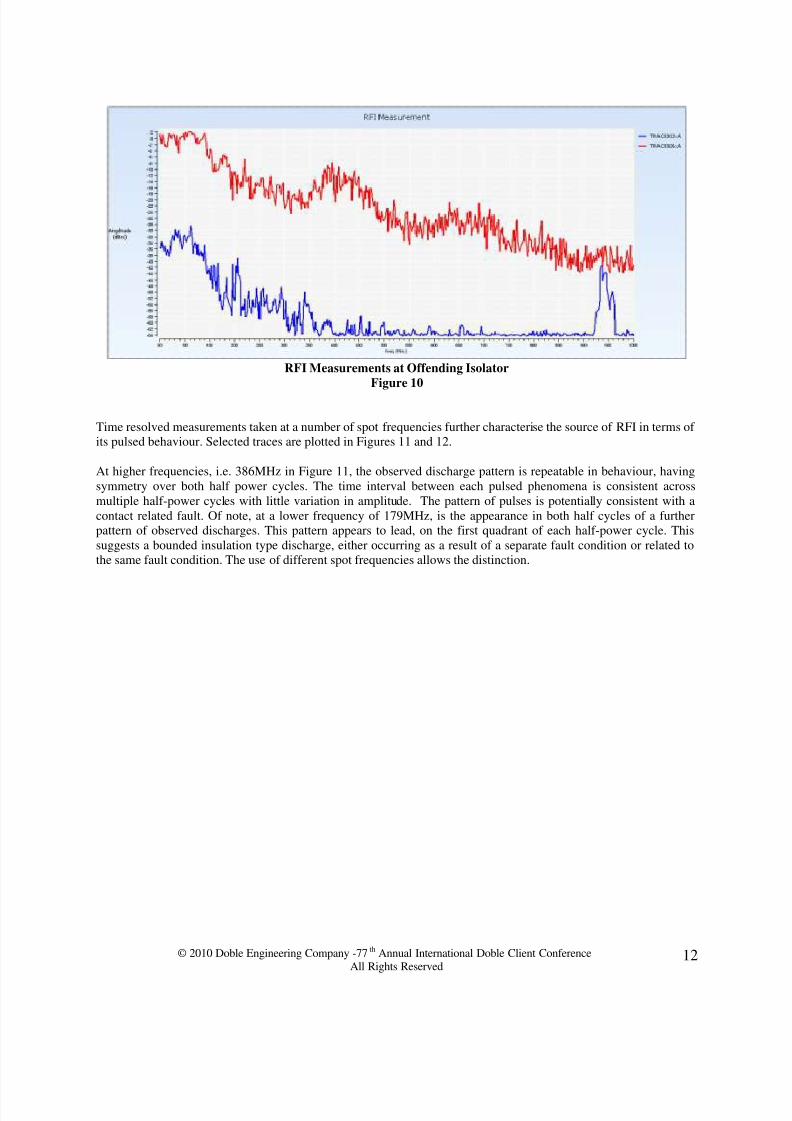
A further measurement at the suspect apparatus (TRAC0326) is plotted in Figure 10 and compared with the baseline
measurement for that section of the switchyard. Uplifts of 60dB and 30dB are evident at spot frequencies 400MHZ
and 1000MHz respectively, providing evidence that this apparatus is exhibiting significant signs of deterioration and
that a fault condition exists.
8/8/2019 ACCA-6 RFI Surveillance Nesbitt
http://slidepdf.com/reader/full/acca-6-rfi-surveillance-nesbitt 12/16
© 2010 Doble Engineering Company -77th Annual International Doble Client ConferenceAll Rights Reserved
12
RFI Measurements at Offending Isolator
Figure 10
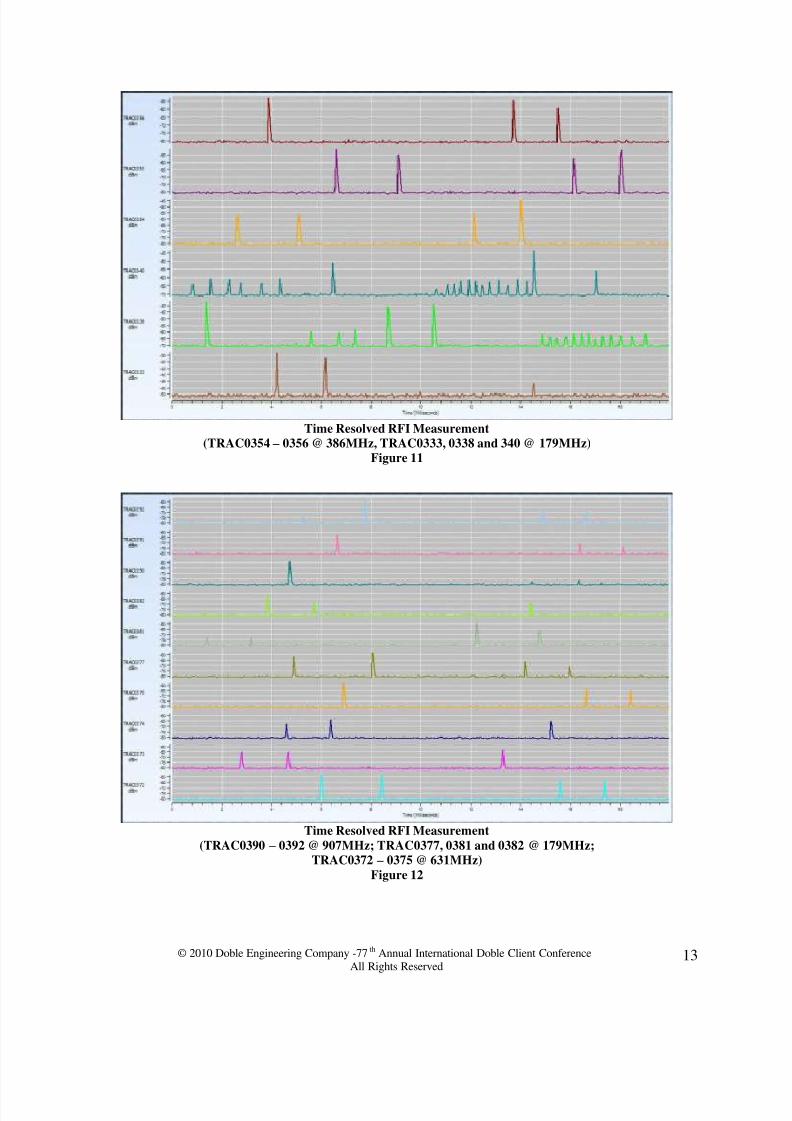
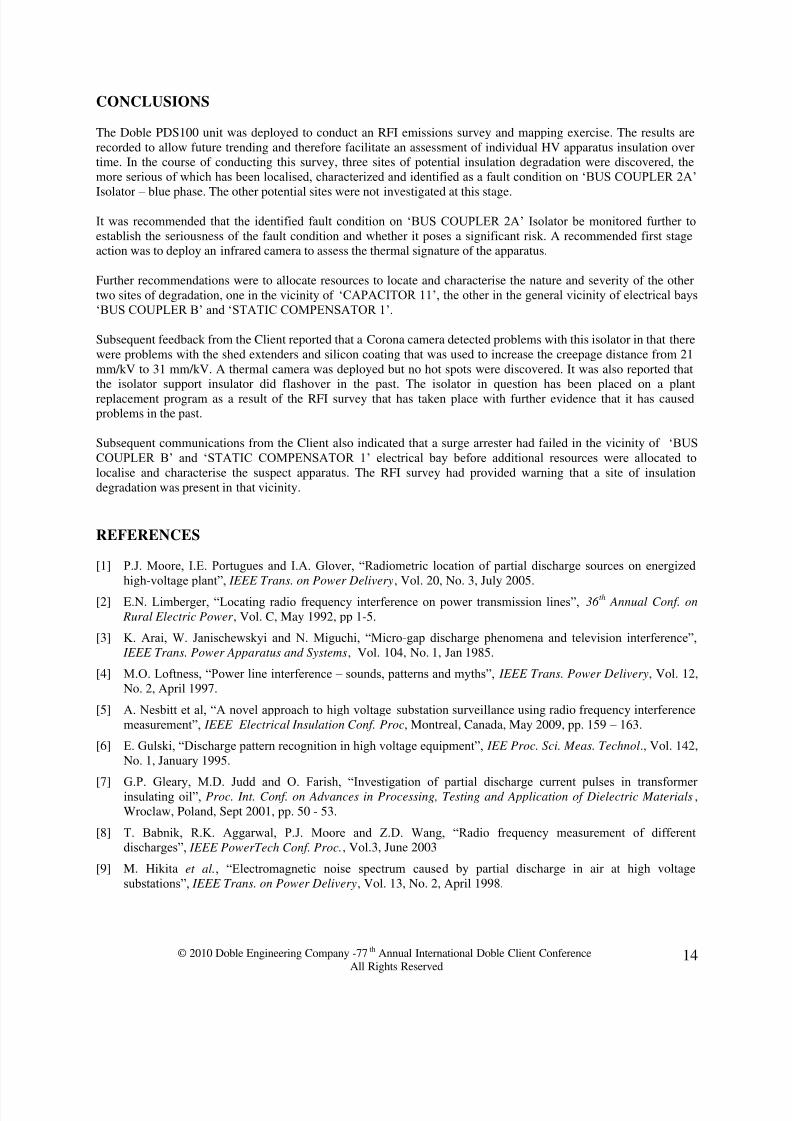
Time resolved measurements taken at a number of spot frequencies further characterise the source of RFI in terms of
its pulsed behaviour. Selected traces are plotted in Figures 11 and 12.
At higher frequencies, i.e. 386MHz in Figure 11, the observed discharge pattern is repeatable in behaviour, having
symmetry over both half power cycles. The time interval between each pulsed phenomena is consistent across
multiple half-power cycles with little variation in amplitude. The pattern of pulses is potentially consistent with a
contact related fault. Of note, at a lower frequency of 179MHz, is the appearance in both half cycles of a further
pattern of observed discharges. This pattern appears to lead, on the first quadrant of each half-power cycle. This
suggests a bounded insulation type discharge, either occurring as a result of a separate fault condition or related to
the same fault condition. The use of different spot frequencies allows the distinction.
8/8/2019 ACCA-6 RFI Surveillance Nesbitt
http://slidepdf.com/reader/full/acca-6-rfi-surveillance-nesbitt 13/16
© 2010 Doble Engineering Company -77th Annual International Doble Client ConferenceAll Rights Reserved
13
Time Resolved RFI Measurement
(TRAC0354 – 0356 @ 386MHz, TRAC0333, 0338 and 340 @ 179MHz)
Figure 11
Time Resolved RFI Measurement
(TRAC0390 – 0392 @ 907MHz; TRAC0377, 0381 and 0382 @ 179MHz;
TRAC0372 – 0375 @ 631MHz)
Figure 12
8/8/2019 ACCA-6 RFI Surveillance Nesbitt
http://slidepdf.com/reader/full/acca-6-rfi-surveillance-nesbitt 14/16
© 2010 Doble Engineering Company -77th Annual International Doble Client ConferenceAll Rights Reserved
14
CONCLUSIONS
The Doble PDS100 unit was deployed to conduct an RFI emissions survey and mapping exercise. The results are
recorded to allow future trending and therefore facilitate an assessment of individual HV apparatus insulation over
time. In the course of conducting this survey, three sites of potential insulation degradation were discovered, the
more serious of which has been localised, characterized and identified as a fault condition on „BUS COUPLER 2A‟
Isolator – blue phase. The other potential sites were not investigated at this stage.
It was recommended that the identified fault condition on „BUS COUPLER 2A‟ Isolator be monitored further to
establish the seriousness of the fault condition and whether it poses a significant risk. A recommended first stage
action was to deploy an infrared camera to assess the thermal signature of the apparatus.
Further recommendations were to allocate resources to locate and characterise the nature and severity of the other
two sites of degradation, one in the vicinity of „CAPACITOR 11‟, the other in the general vicinity of electrical bays
„BUS COUPLER B‟ and „STATIC COMPENSATOR 1‟.
Subsequent feedback from the Client reported that a Corona camera detected problems with this isolator in that there
were problems with the shed extenders and silicon coating that was used to increase the creepage distance from 21
mm/kV to 31 mm/kV. A thermal camera was deployed but no hot spots were discovered. It was also reported that
the isolator support insulator did flashover in the past. The isolator in question has been placed on a plant
replacement program as a result of the RFI survey that has taken place with further evidence that it has caused
problems in the past.
Subsequent communications from the Client also indicated that a surge arrester had failed in the vicinity of „BUS
COUPLER B‟ and „STATIC COMPENSATOR 1‟ electrical bay before additional resources were allocated to
localise and characterise the suspect apparatus. The RFI survey had provided warning that a site of insulation
degradation was present in that vicinity.
REFERENCES
[1] P.J. Moore, I.E. Portugues and I.A. Glover, “Radiometric location of partial discharge sources on energized
high-voltage plant”, IEEE Trans. on Power Delivery, Vol. 20, No. 3, July 2005.
[2] E.N. Limberger, “Locating radio frequency interference on power transmission lines”, 36 th
Annual Conf. on
Rural Electric Power , Vol. C, May 1992, pp 1-5.
[3] K. Arai, W. Janischewskyi and N. Miguchi, “Micro-gap discharge phenomena and television interference”,
IEEE Trans. Power Apparatus and Systems, Vol. 104, No. 1, Jan 1985.
[4] M.O. Loftness, “Power line interference – sounds, patterns and myths”, IEEE Trans. Power Delivery, Vol. 12,
No. 2, April 1997.
[5] A. Nesbitt et al, “A novel approach to high voltage substation surveillance using radio frequency interference
measurement”, IEEE Electrical Insulation Conf. Proc, Montreal, Canada, May 2009, pp. 159 – 163.
[6] E. Gulski, “Discharge pattern recognition in high voltage equipment”, IEE Proc. Sci. Meas. Technol., Vol. 142,
No. 1, January 1995.
[7] G.P. Gleary, M.D. Judd and O. Farish, “Investigation of partial discharge current pulses in transformer insulating oil”, Proc. Int. Conf. on Advances in Processing, Testing and Application of Dielectric Materials,
Wroclaw, Poland, Sept 2001, pp. 50 - 53.
[8] T. Babnik, R.K. Aggarwal, P.J. Moore and Z.D. Wang, “Radio frequency measurement of different
discharges”, IEEE PowerTech Conf. Proc., Vol.3, June 2003
[9] M. Hikita et al., “Electromagnetic noise spectrum caused by partial discharge in air at high voltage
substations”, IEEE Trans. on Power Delivery, Vol. 13, No. 2, April 1998.
8/8/2019 ACCA-6 RFI Surveillance Nesbitt
http://slidepdf.com/reader/full/acca-6-rfi-surveillance-nesbitt 15/16
© 2010 Doble Engineering Company -77th Annual International Doble Client ConferenceAll Rights Reserved
15
[10] W. Schaefer, “Narrowband and broadband discrimination with a spectrum analyzer or EMI receiver”, IEEE
Int. Symp. on EMC , Vol. 2, Aug. 2006, pp. 249-255.
[11] W. Schaefer, “Measurement of impulsive signals with a spectrum analyzer or EMI receivers”, IEEE Int. Symp.
on EMC , Vol. 1, 2005, pp. 267-271.
[12] W. Schaefer, “Understanding impulsive bandwidth specifications of EMI receivers”, IEEE Int. Symp. on EMC ,
Vol. 2, 1999, pp. 958-961.
[13] R. Southwick and G. Runger, “A theory to optimize the detection and measurement of EMI signals”, IEEE
Nat. Symp. on EMC , May 1989, pp. 12-15.
[14] G.A. Jackson, “Survey of EMC measurement techniques,” Electronics and Communication Engineering
Journal, Vol. 1, Issue 2, March/April 1989, pp. 61-70.
[15] Schaffner EMC, “RF emission testing – a handy guide”, 2000.
[16] CISPR 16-1:1999, “Radio disturbance and immunity measuring apparatus”.
[17] Norwegian Post and Telecommunications Authority, “Assigned spectrum licenses”,
http://www.npt.no/iKnowBase/Content/49005/Microsoft%20Overview_of_assigned_spectrum_licenses-
20090202.pdf .
[18] M. Duval, “Interpretation of gas-in-oil analysis using new IEC publication 60599 and IEC TC 10 databases”,
IEEE Elect. Insul. Mag., Vol. 17, No. 2, March/April 2001.[19] IEC Publication 60599, March 1999.
BIOGRAPHIES
Alan Nesbitt, Glasgow Caledonian UniversityAlan Nesbitt graduated from Queens University Belfast with a BSc in Electrical and Electronic Engineering (1
st
Class Honours) and then with an MSc in Digital Techniques from Heriot-Watt University, Edinburgh. He has over
24 years experience of high performance embedded systems design, firstly in the avionics industry and latterly
leading University collaboration with industry. Latterly over the past 10 years his attention is to the fundamental
process of partial discharge (PD) and the characterization of failure modes through academic research and
consultancy for clients. He was lead investigator for Glasgow Caledonian University on a number of industriallyfunded projects on the investigation of novel methods for detecting and measurement of deterioration in insulation
materials in power plant. He is currently engaged in transferring academic knowledge to industrial through the
development of the next generation of condition monitoring instruments.
Brian Stewart, Glasgow Caledonian UniversityBrian G Stewart graduated with a BSc (1st Class Honours) in 1981 and PhD in 1985 both from the University of
Glasgow and is currently a Professor in the School of Engineering and Computing at Glasgow Caledonian
University. Brian has been involved in the condition monitoring of high voltage plant for the past 10 years and has
over 20 years of research and design experience of the electronic systems. His research interests are in the areas of
partial discharge, high voltage condition monitoring and communication systems. He has carried out numerous
industrial consultancies and reports on HV and partial discharge measurement.
Scott McMeekin, Glasgow Caledonian UniversityScott McMeekin has worked on the design, fabrication and characterisation of photonic devices for the past 20
years. He was appointed as a Lecturer in the School of Engineering Science and Design at Glasgow Caledonian
University in 2004 and promoted to Reader in 2007. His present research activities include next generation digital
communication systems, condition based monitoring systems and optical systems. Prior to joining Glasgow
Caledonian University he was the Process Development manager at Alcatel Optronics Ltd (formerly Kymata Ltd)
where he was responsible for the development and qualification of novel optical components for advanced optical
telecommunication systems. Previous positions have included being a Lecturer in the Cardiff School of Engineering
at the University of Wales, Cardiff from 1994 to 2000 where his research activities included the fabrication of sub-
micron electronic and optoelectronic devices, visible lasers, and BioMEMs structures.

8/8/2019 ACCA-6 RFI Surveillance Nesbitt
http://slidepdf.com/reader/full/acca-6-rfi-surveillance-nesbitt 16/16
© 2010 Doble Engineering Company -77th Annual International Doble Client ConferenceAll Rights Reserved
16
Carlos Gamio, Glasgow Caledonian UniversityJ. C. Gamio received the B.S. degree in electronic and communication engineering from the Mexico National
Polytechnic Institute, Mexico City, in 1989 and the M.Sc. degree in instrument design and application and the Ph.D.
degree in electronic engineering from the University of Manchester Institute of Science and Technology (UMIST),
Manchester, U.K., in 1993 and 1998, respectively. He is a member of the Institution of Engineering and Technology
(IET) and the Institute of Physics (IoP). From 1984 to 2005 he was with the Mexican Petroleum Institute, Mexico
City. During that period, he designed a sonar-based tool used to measure man-made underground oil-storage caverns
and undertook research on multiphase flow imaging using capacitance tomography. In 2005 he joined Glasgow
Caledonian University where he designs novel instrumentation systems for condition monitoring of high-voltage
plant, including an optically-isolated partial discharge sensor and a radio-frequency based portable partial discharge
detector.
Steven Conner, Glasgow Caledonian UniversitySteve Conner received his PhD from the University of Strathclyde in 2003. From 2003-2007 he worked at Optosci
Ltd., where he designed a tunable diode laser spectroscope for gas leak detection. In 2007 he moved to Glasgow
Caledonian University to develop a portable RF instrument for partial discharge detection. He has also worked as a
part-time consultant on many projects, including precision laser diode drivers for the telecoms industry, audio
mixers for Numark, LLC., and a computer-controlled Tesla coil display at Danfoss Universe, and is named as aninventor on several patent applications.
Luwendran Moodley, Doble Engineering AfricaLuwendran Moodley graduated from the University of Natal with a BSc in Electrical Engineering. Upon his
graduation he joined Durban Electricity as an Engineer in training. He held the positions of Technical Support
Engineer, Manager: Technical Support and finally the Manager: Transmission Substations within Durban
Electricity. In 2007 he joined Doble Engineering and manages the Doble Africa offices based in South Africa. He is
also currently involved in transformer condition assessment.
Kamendran Govender, Doble Engineering AfricaKamendren Govender graduated from the University of Natal in 2006 with BSc in Electrical Engineering. Upon
graduating he worked as a Candidate Engineer in Durban Electricity. In 2008 he joined Doble Africa as an Engineer.
He is predominantly involved in transformer condition assessment work for the utilities in Africa.
Kjetil Liebech-Lien, Doble TransiNor ASKjetil Liebech-Lien has been with Doble TransiNor since May 2006. His current position is Product Support
Engineer and his responsibilities are within product support, product training, field & lab testing and product
development & modification. Kjetil graduated from Norwegian University of Science and Technology with M.Sc. in
Electronics in 2005. Since joining Doble, Kjetil has gained extensive world wide field experience and product
knowledge for in-service testing of surge arresters, cable terminations and SF6- insulated systems, and he has been
co-author and presenter of papers at conferences like SIPDA, ICOLIM and GCC Cigré.
Hans Ove Kristiansen, Doble TransiNor ASHans Ove Kristiansen has been employed with Doble since January 1st, 2008. As Product Manager he is responsible
for the acoustic online insulator analyzer, surge arrester leakage current tester and insulation pollution monitor. Hans
holds a degree from Trondheim Technical College, Electronics and Automation 1986 and Norwegian Institute of Technology, Electrical Engineering in 1991. He started his own company in 1992 called Stretek AS where he
worked as Engineering Manager, developing electrical drives for HVAC. From 1995 he was employed as sales
manager for a company in Trondheim selling pumps and electrical drives until he started as Service Manager at
Metron AS in 2003. This company was acquired by Fluke Corp in 2005. Hans left the position as Global Technical
Support Manager in 2007 to join Doble TransiNor AS.