Abdourahmane FAYE BI & SQL-Server Consultant Microsoft...
42
Transcript of Abdourahmane FAYE BI & SQL-Server Consultant Microsoft...
Abdourahmane FAYEBI & SQL-Server ConsultantMicrosoft Consulting [email protected]
Stratégie BI de Microsoft
Positionnement dans le monde de la BI
Prolématiques et Challenges
Offre BI autour SQL-Server 2008 et Office 2007
•B107: SQL Server 2008 : La Business Intelligence pour tous
•B108: Le Data Warehousing avec SQL Server 2008
•B109: Le Data Mining avec SQL Server 2008
•B110: De l'analyse à la compréhension avec PerformancePoint/ProClarity
•B111: Visio Professional 2007 enriche la visualisation des données des solutions BI
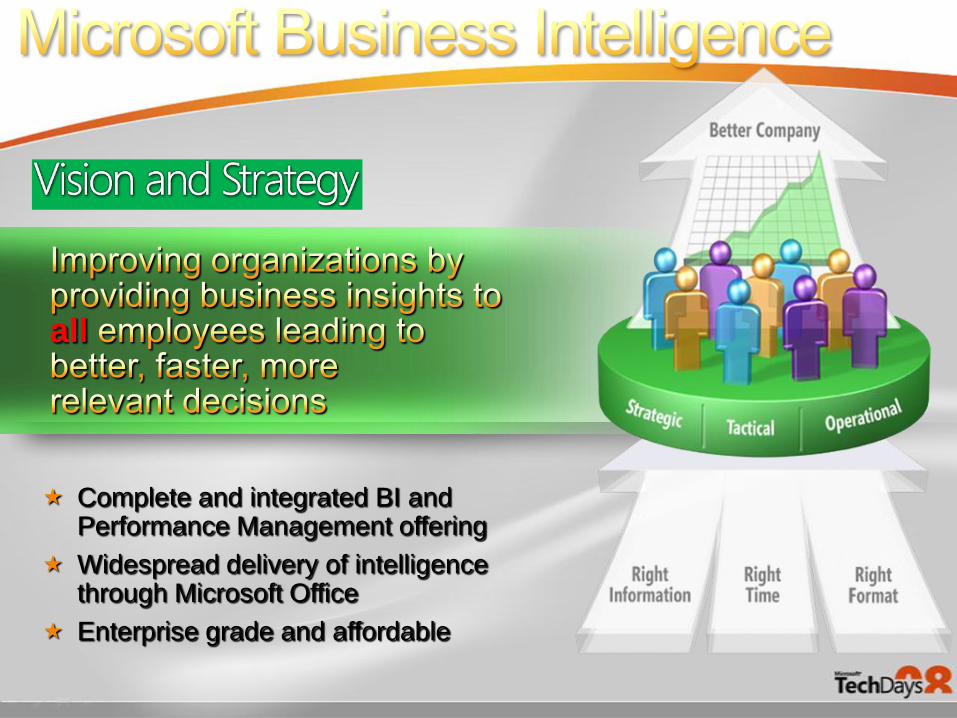
all
Complete and integrated BI and Performance Management offering
Widespread delivery of intelligence through Microsoft Office
Enterprise grade and affordable
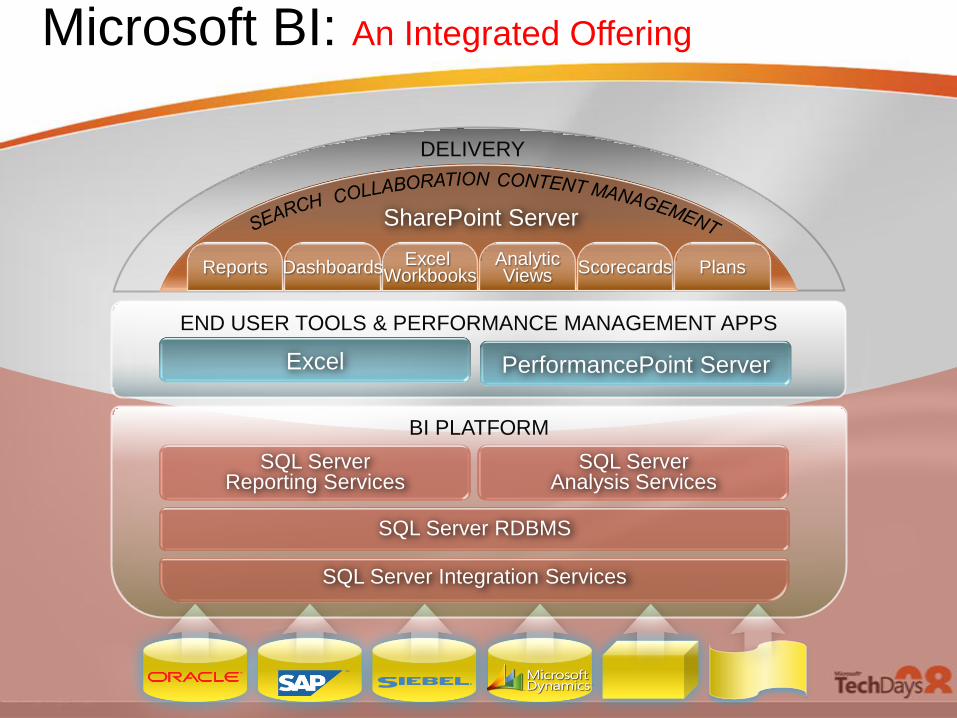
BI PLATFORM
SQL Server Reporting Services
SQL Server Analysis Services
SQL Server RDBMS
SQL Server Integration Services
SharePoint Server
DELIVERY
Reports Dashboards Excel Workbooks
AnalyticViews Scorecards Plans
END USER TOOLS & PERFORMANCE MANAGEMENT APPS
PerformancePoint ServerExcel
Microsoft BI: An Integrated Offering
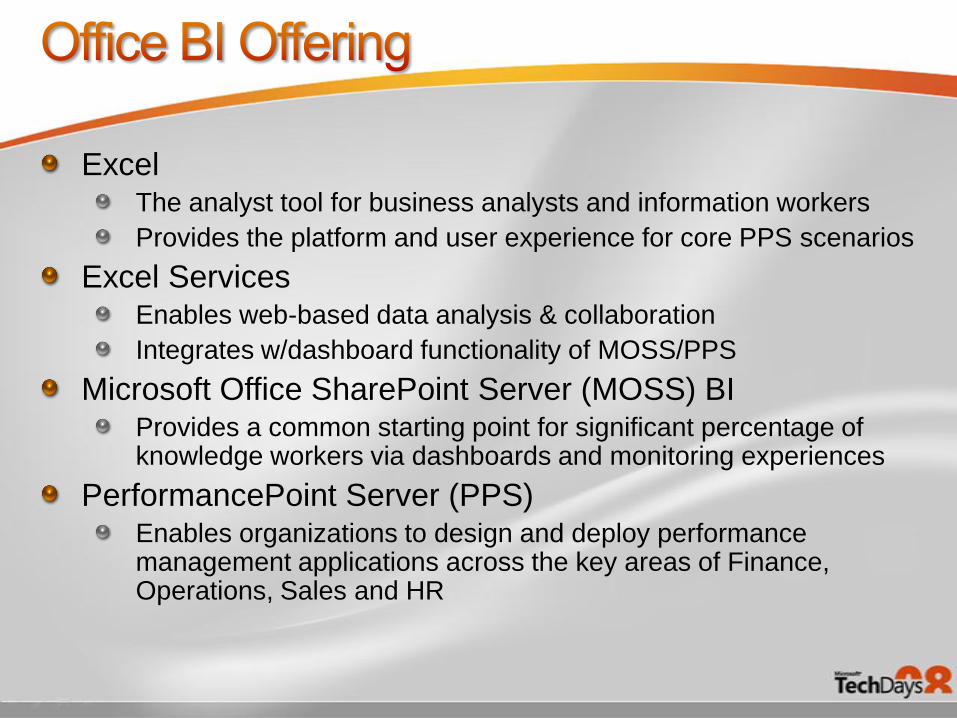
ExcelThe analyst tool for business analysts and information workers
Provides the platform and user experience for core PPS scenarios
Excel ServicesEnables web-based data analysis & collaboration
Integrates w/dashboard functionality of MOSS/PPS
Microsoft Office SharePoint Server (MOSS) BIProvides a common starting point for significant percentage of knowledge workers via dashboards and monitoring experiences
PerformancePoint Server (PPS)Enables organizations to design and deploy performance management applications across the key areas of Finance, Operations, Sales and HR
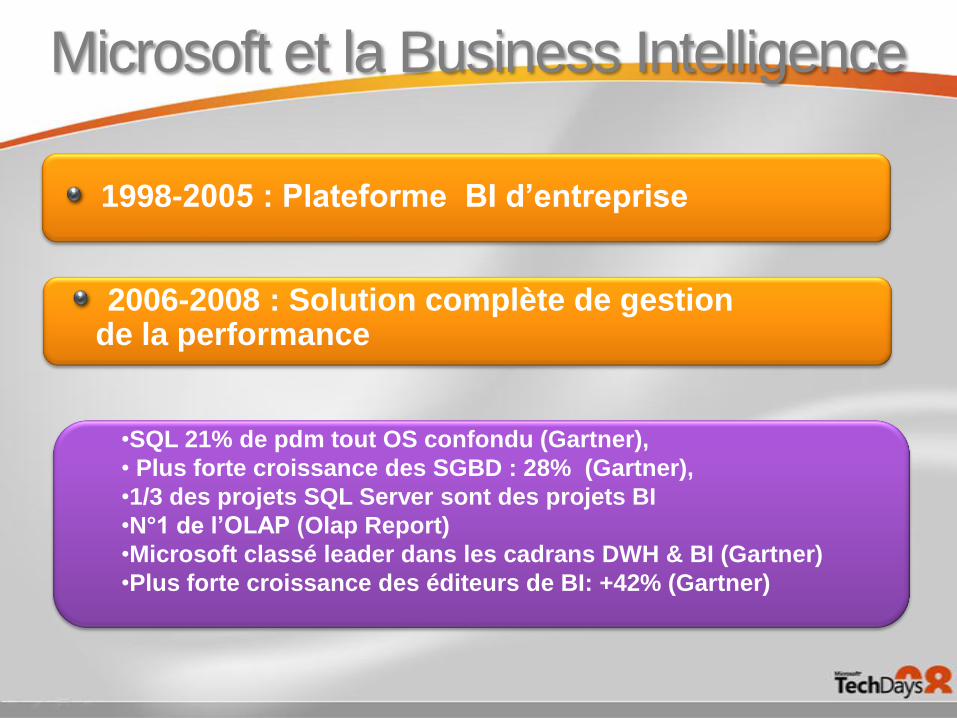
2006-2008 : Solution complète de gestionde la performance
•SQL 21% de pdm tout OS confondu (Gartner),
• Plus forte croissance des SGBD : 28% (Gartner),
•1/3 des projets SQL Server sont des projets BI
•N°1 de l’OLAP (Olap Report)
•Microsoft classé leader dans les cadrans DWH & BI (Gartner)
•Plus forte croissance des éditeurs de BI: +42% (Gartner)
Microsoft et la Business Intelligence
1998-2005 : Plateforme BI d’entreprise
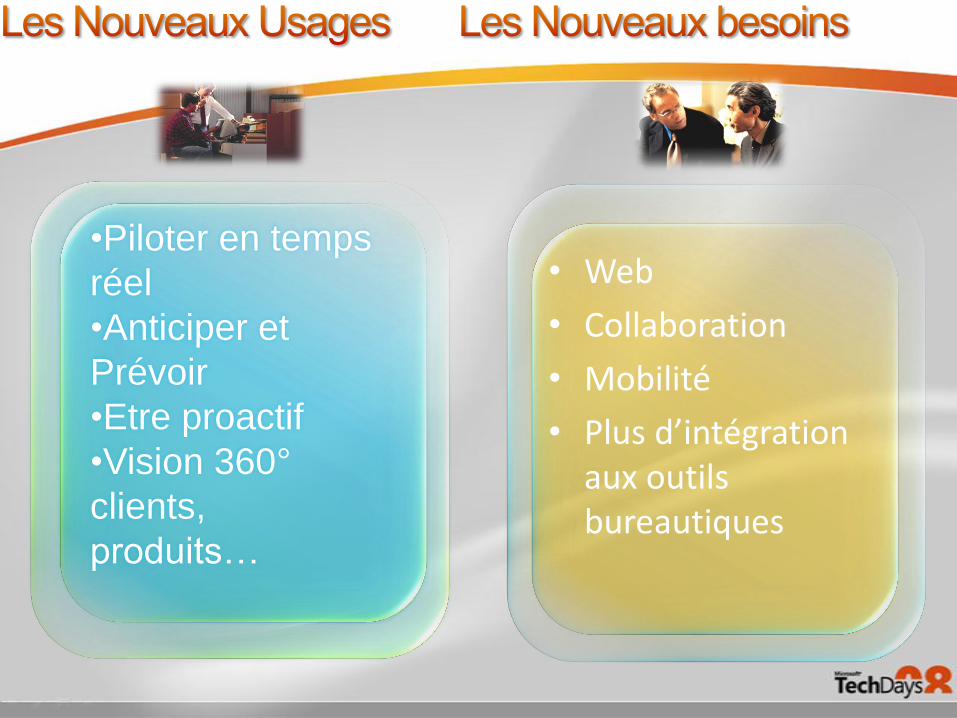
•Piloter en temps
réel
•Anticiper et
Prévoir
•Etre proactif
•Vision 360°
clients,
produits…
• Web
• Collaboration
• Mobilité
• Plus d’intégrationaux outils bureautiques
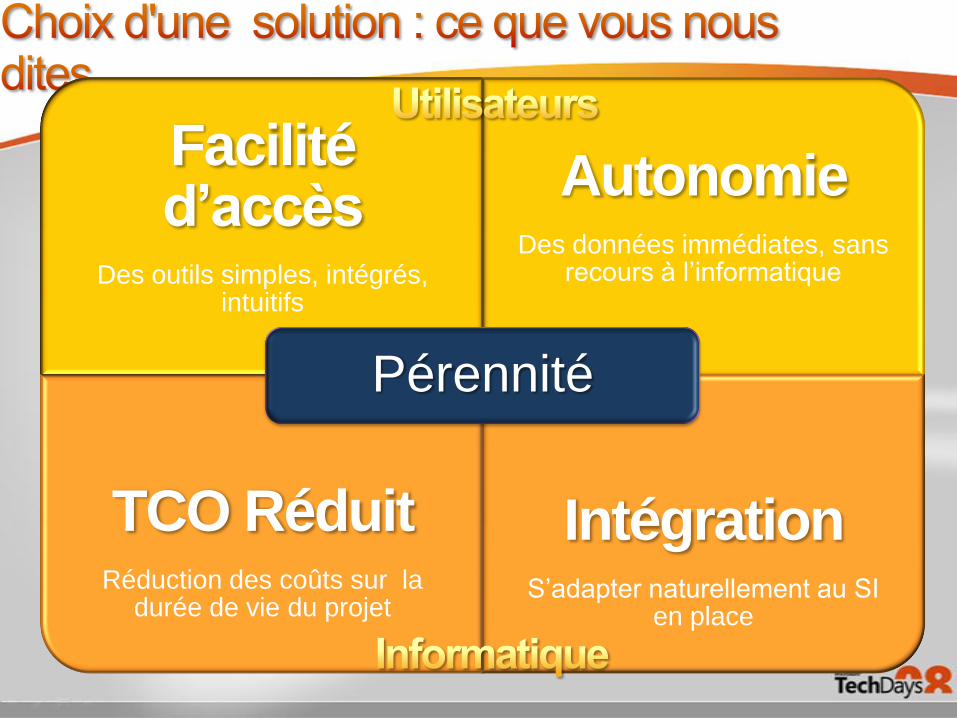
Facilité d’accès
Des outils simples, intégrés, intuitifs
AutonomieDes données immédiates, sans
recours à l’informatique
TCO RéduitRéduction des coûts sur la
durée de vie du projet
IntégrationS’adapter naturellement au SI
en place
Pérennité
Gartner
IDC
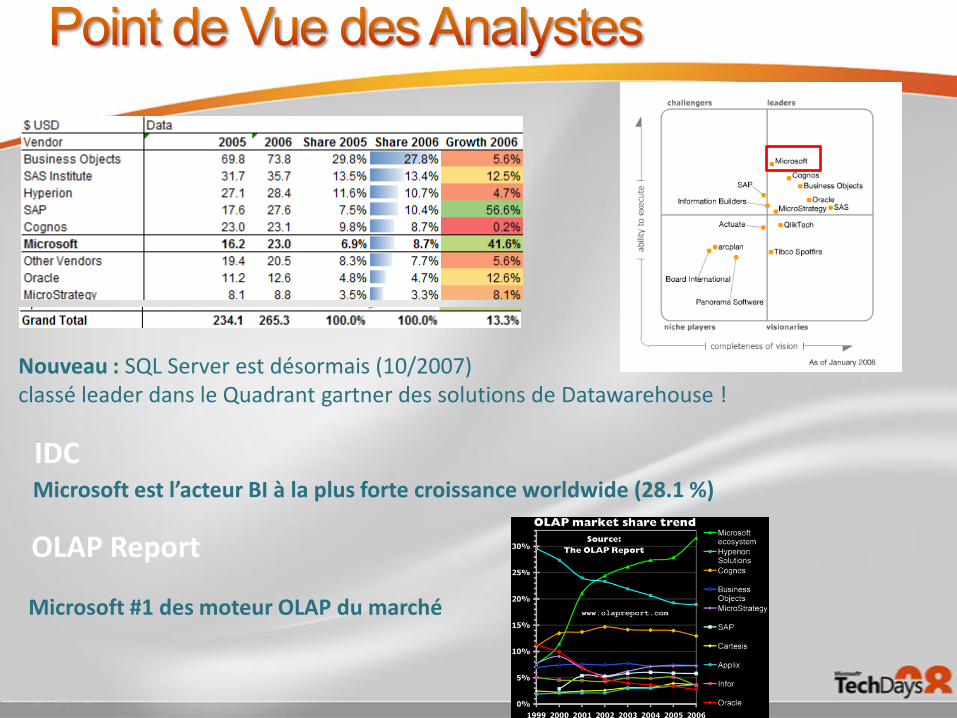
Nouveau : SQL Server est désormais (10/2007) classé leader dans le Quadrant gartner des solutions de Datawarehouse !
OLAP Report
Microsoft #1 des moteur OLAP du marché
IDCMicrosoft est l’acteur BI à la plus forte croissance worldwide (28.1 %)
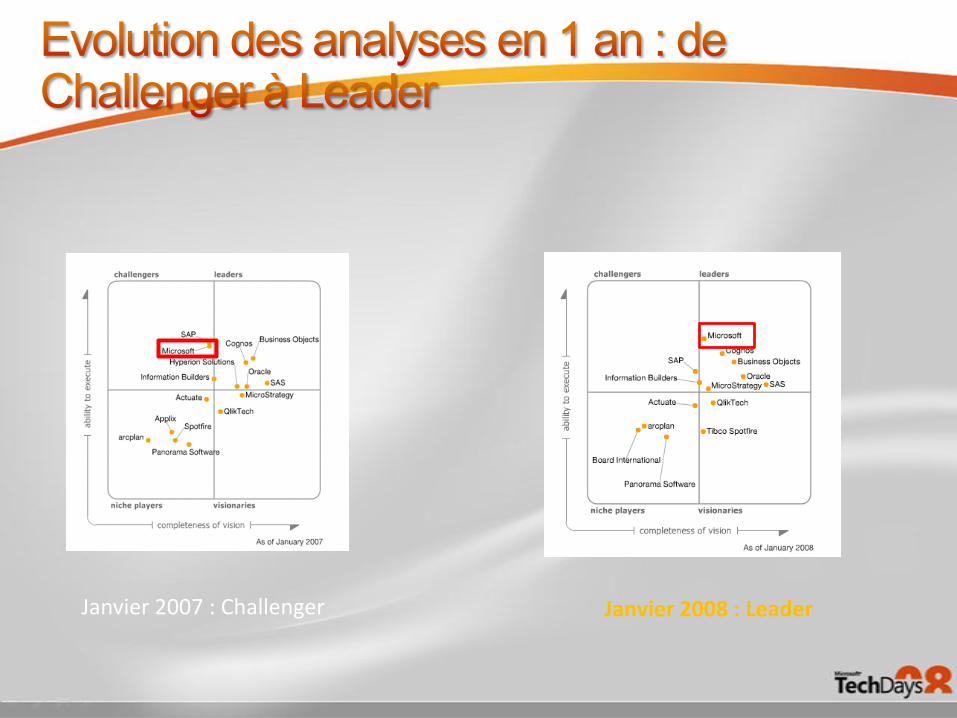
Janvier 2007 : Challenger Janvier 2008 : Leader
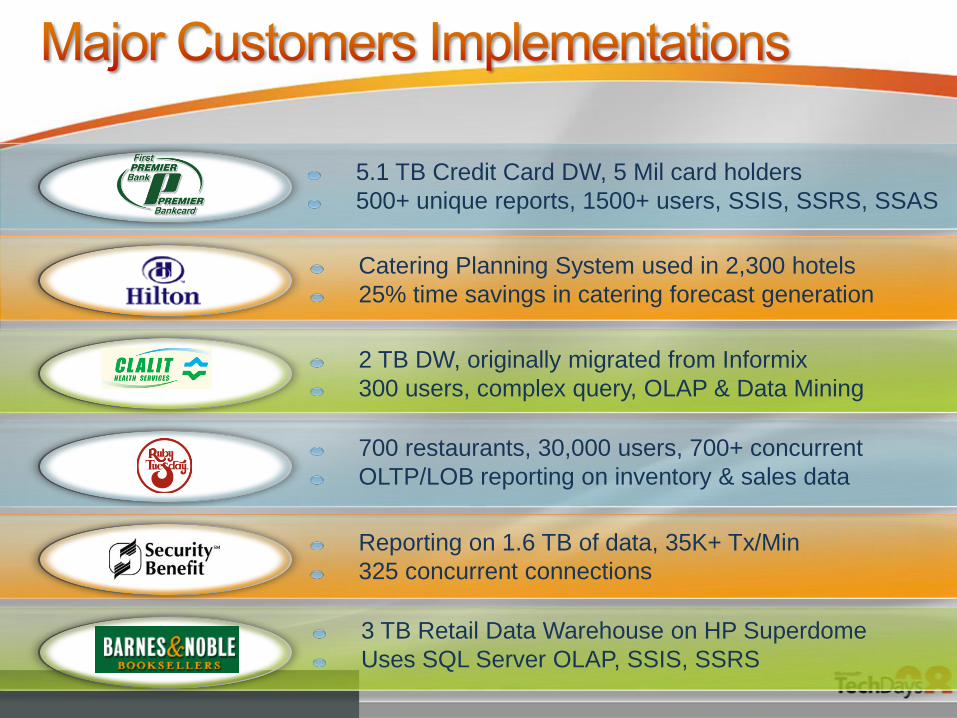
5.1 TB Credit Card DW, 5 Mil card holders
500+ unique reports, 1500+ users, SSIS, SSRS, SSAS
Catering Planning System used in 2,300 hotels
25% time savings in catering forecast generation
Reporting on 1.6 TB of data, 35K+ Tx/Min
325 concurrent connections
2 TB DW, originally migrated from Informix
300 users, complex query, OLAP & Data Mining
700 restaurants, 30,000 users, 700+ concurrent
OLTP/LOB reporting on inventory & sales data
3 TB Retail Data Warehouse on HP Superdome
Uses SQL Server OLAP, SSIS, SSRS
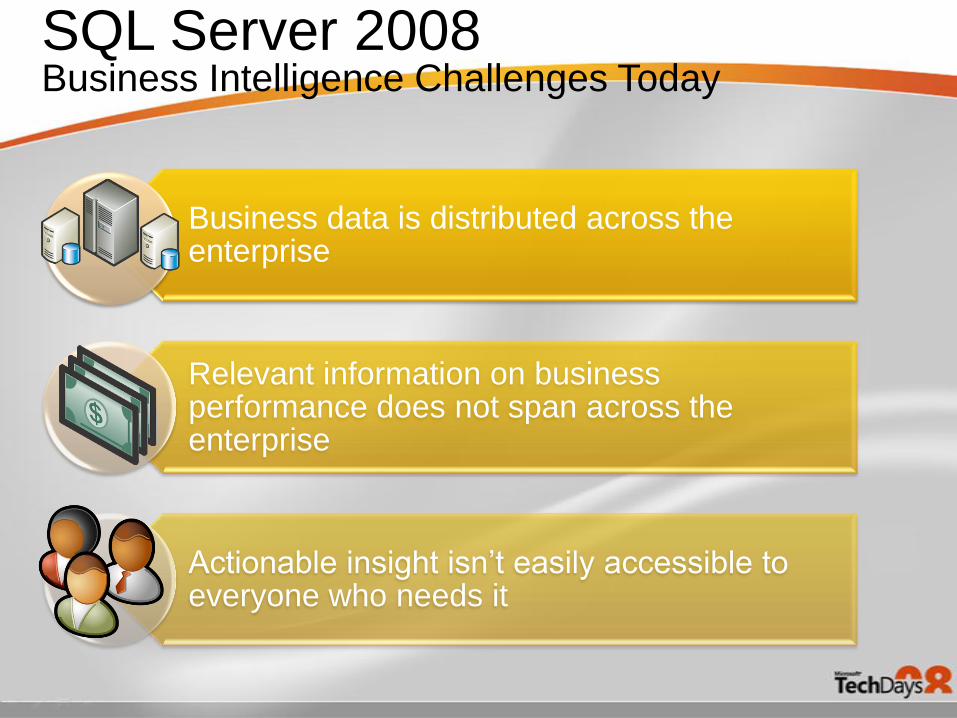
Business data is distributed across the enterprise
Relevant information on business performance does not span across the enterprise
Actionable insight isn’t easily accessible to everyone who needs it
SQL Server 2008Business Intelligence Challenges Today
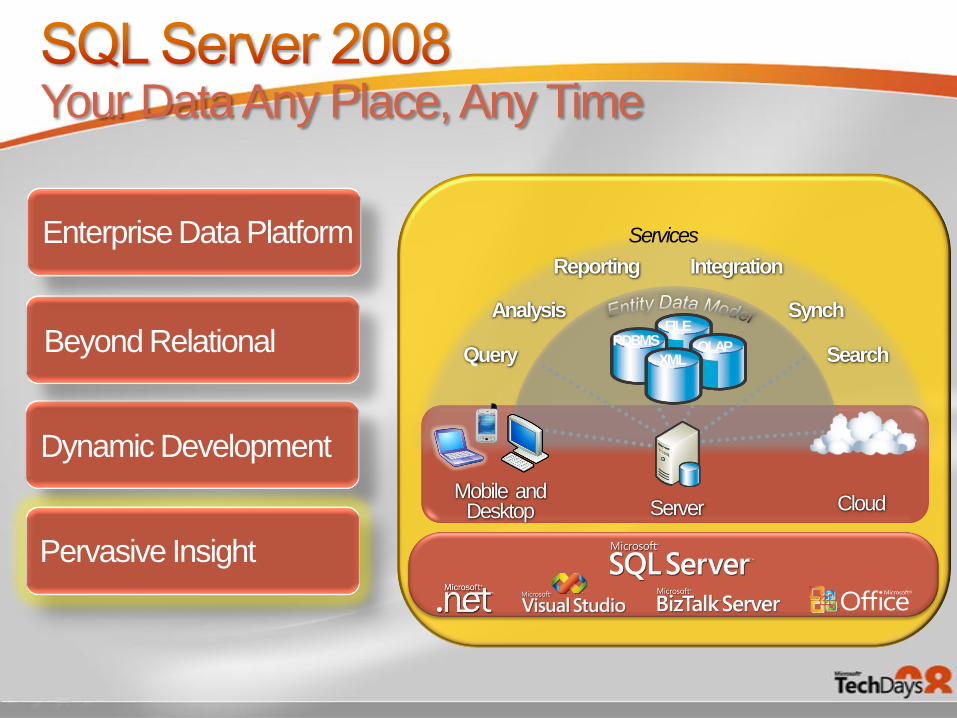
Your Data Any Place, Any Time
Dynamic Development
Beyond Relational
Pervasive Insight
Enterprise Data Platform
Mobile andDesktop
OLAP
FILE
XML
RDBMS
Services
Query
Analysis
Reporting Integration
Synch
Search
CloudServer
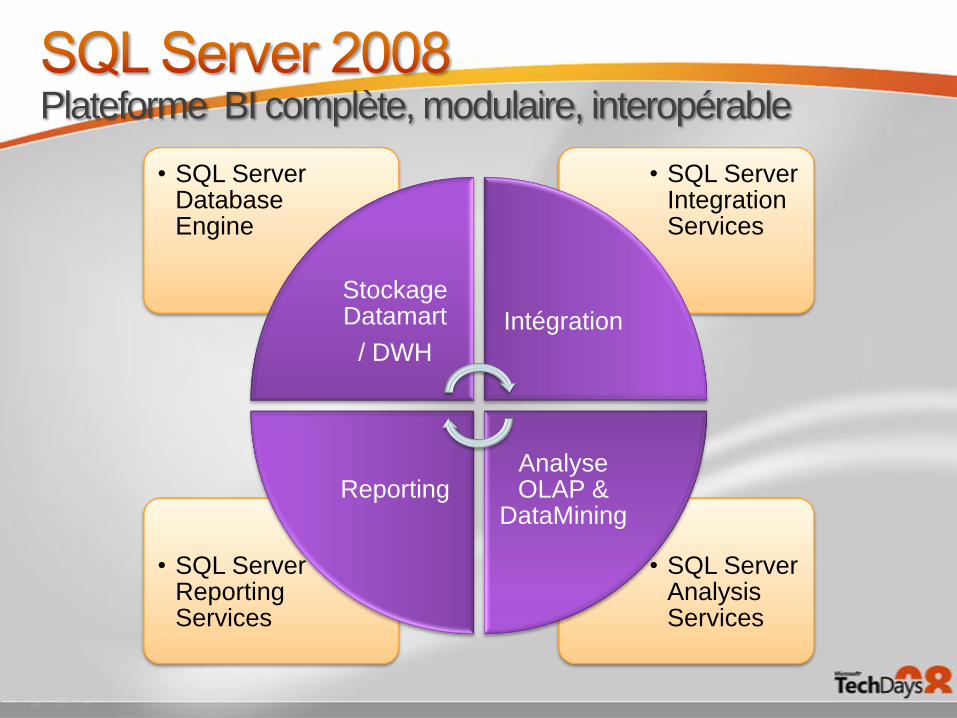
Plateforme BI complète, modulaire, interopérable
• SQL Server Analysis Services
• SQL Server Reporting Services
• SQL Server Integration Services
• SQL Server Database Engine
StockageDatamart
/ DWH
Intégration
Analyse OLAP &
DataMiningReporting
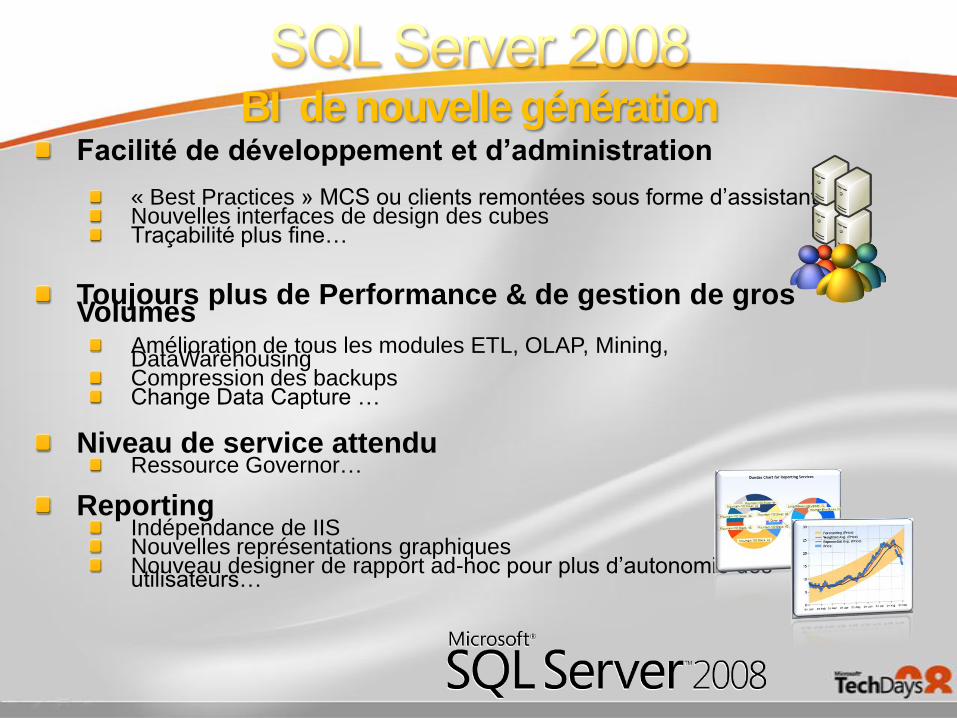
Facilité de développement et d’administration
« Best Practices » MCS ou clients remontées sous forme d’assistantsNouvelles interfaces de design des cubesTraçabilité plus fine…
Toujours plus de Performance & de gestion de gros Volumes
Amélioration de tous les modules ETL, OLAP, Mining, DataWarehousingCompression des backupsChange Data Capture …
Niveau de service attenduRessource Governor…
ReportingIndépendance de IISNouvelles représentations graphiquesNouveau designer de rapport ad-hoc pour plus d’autonomie des utilisateurs…
BI de nouvelle génération
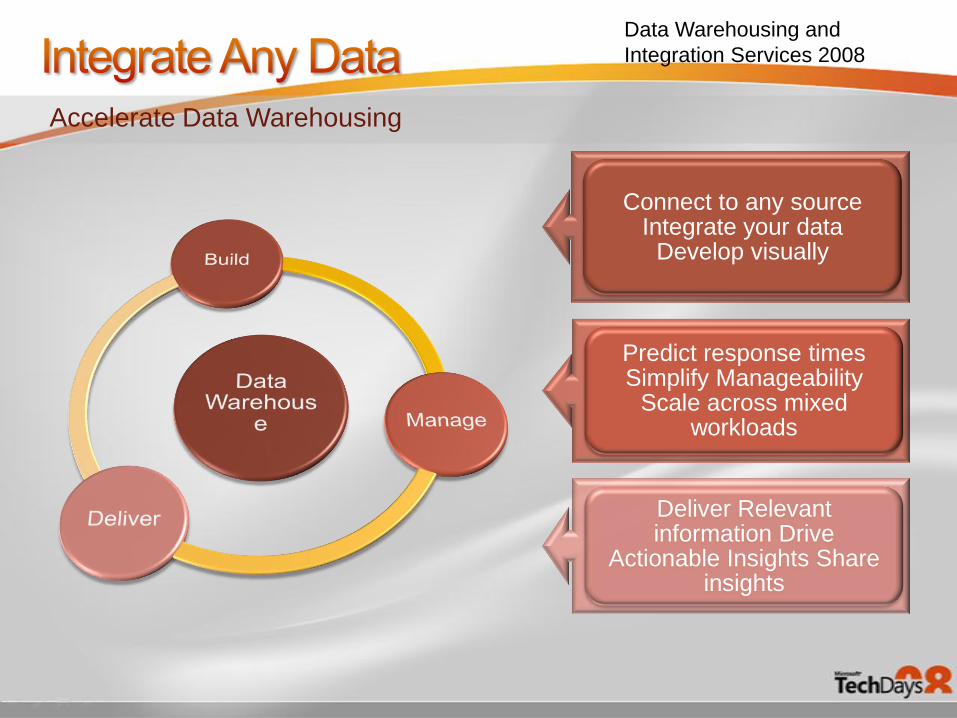
Accelerate Data Warehousing
Connect to any source Integrate your data
Develop visually
Predict response times Simplify Manageability
Scale across mixed workloads
Deliver Relevant information Drive
Actionable Insights Share insights
Data Warehousing and
Integration Services 2008
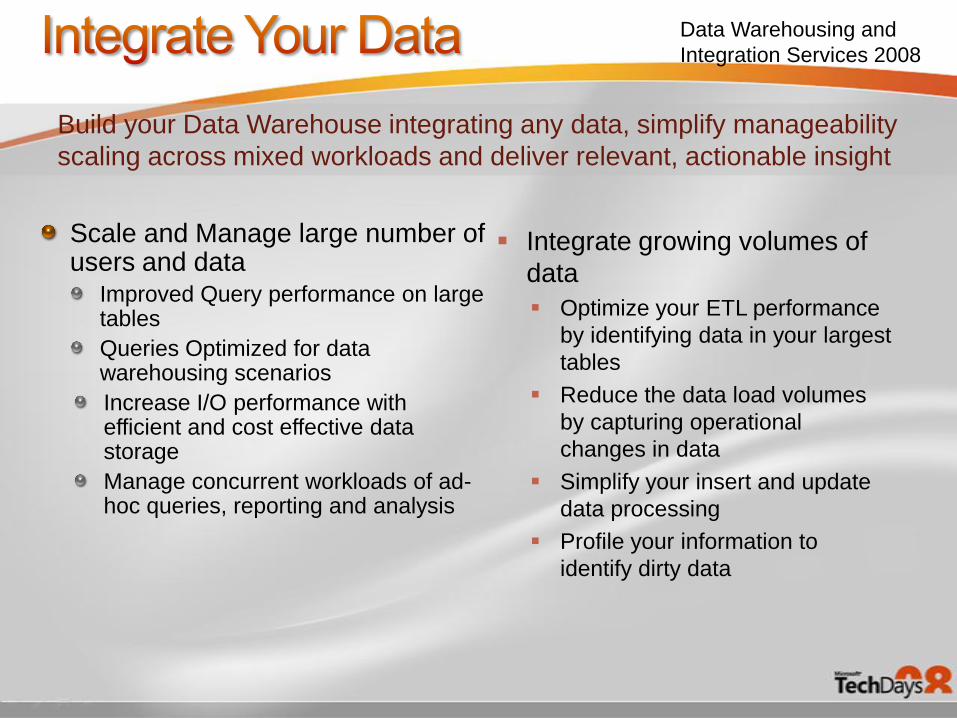
Scale and Manage large number of users and data
Improved Query performance on large tables
Queries Optimized for data warehousing scenarios
Increase I/O performance with efficient and cost effective data storage
Manage concurrent workloads of ad-hoc queries, reporting and analysis
Data Warehousing and
Integration Services 2008
Integrate growing volumes of
data
Optimize your ETL performance
by identifying data in your largest
tables
Reduce the data load volumes
by capturing operational
changes in data
Simplify your insert and update
data processing
Profile your information to
identify dirty data
Build your Data Warehouse integrating any data, simplify manageability
scaling across mixed workloads and deliver relevant, actionable insight
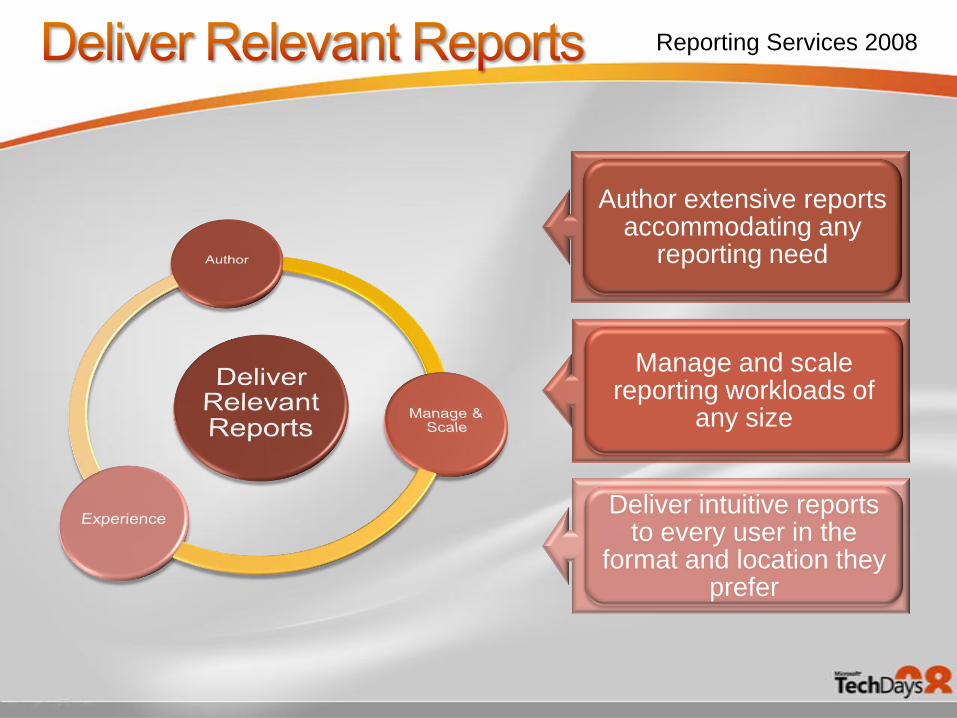
Author extensive reports accommodating any
reporting need
Manage and scale reporting workloads of
any size
Deliver intuitive reports to every user in the
format and location they prefer
Reporting Services 2008
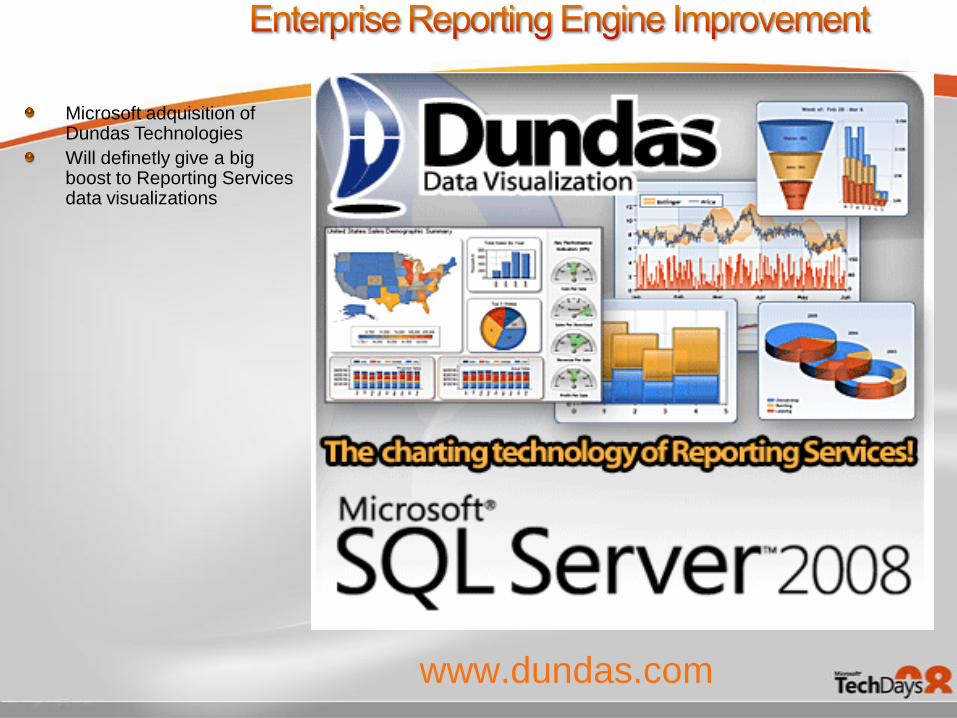
www.dundas.com
Microsoft adquisition of Dundas Technologies
Will definetly give a big boost to Reporting Services data visualizations
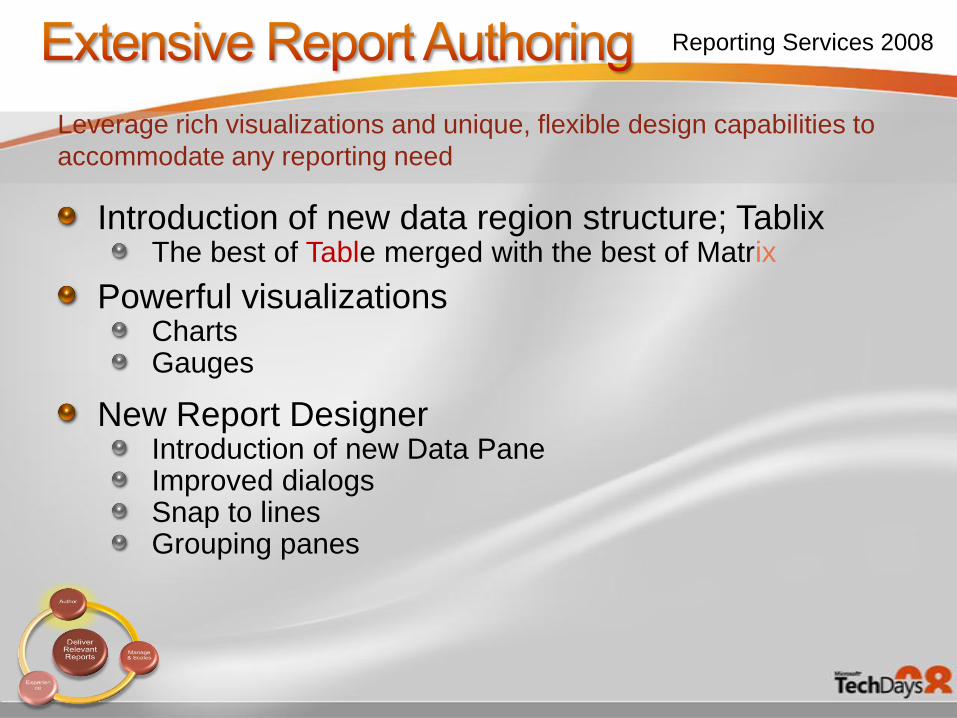
Introduction of new data region structure; TablixThe best of Table merged with the best of Matrix
Powerful visualizations Charts Gauges
New Report Designer Introduction of new Data PaneImproved dialogsSnap to linesGrouping panes
Leverage rich visualizations and unique, flexible design capabilities to
accommodate any reporting need
Reporting Services 2008
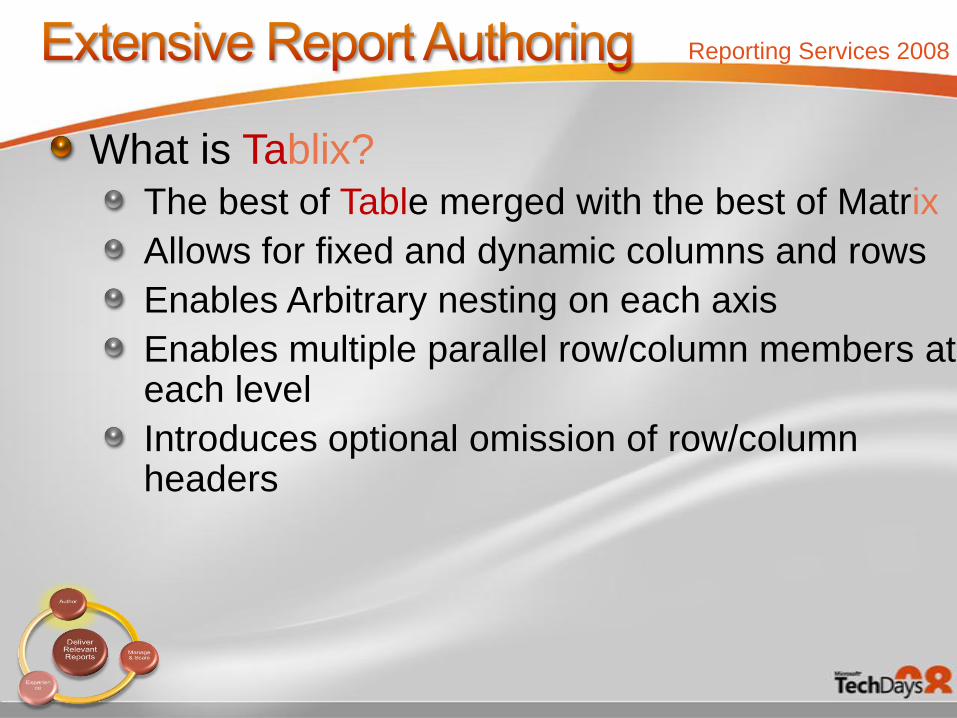
What is Tablix?
The best of Table merged with the best of Matrix
Allows for fixed and dynamic columns and rows
Enables Arbitrary nesting on each axis
Enables multiple parallel row/column members at each level
Introduces optional omission of row/column headers
Reporting Services 2008
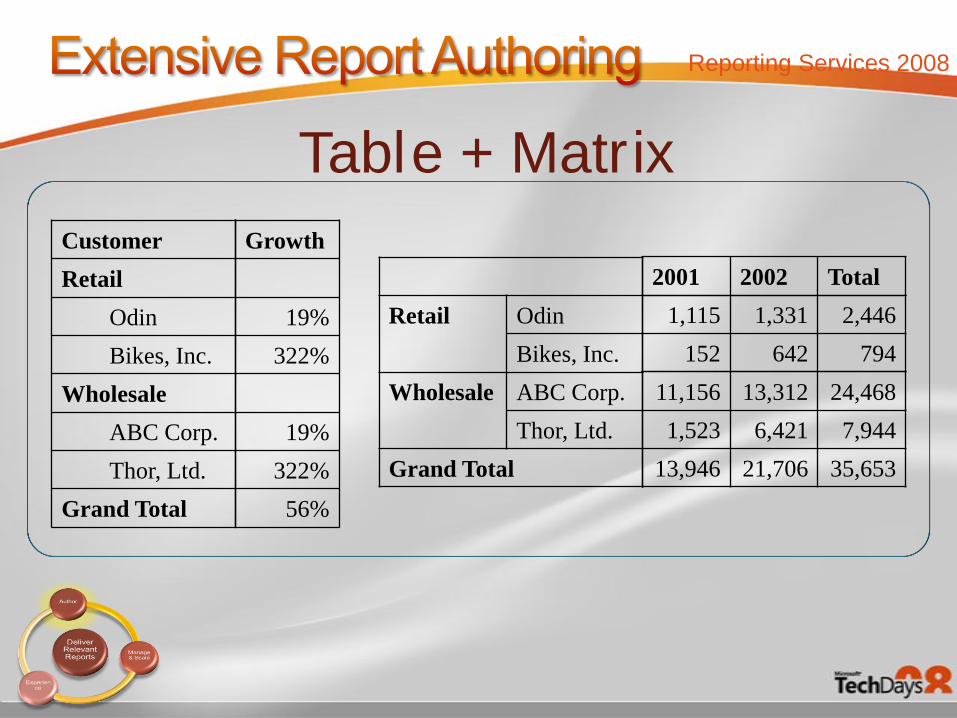
2001 2002 Total
1,115 1,331 2,446
152 642 794
11,156 13,312 24,468
1,523 6,421 7,944
13,946 21,706 35,653
Retail Odin
Bikes, Inc.
Wholesale ABC Corp.
Thor, Ltd.
Grand Total
Customer
Retail
Odin
Bikes, Inc.
Wholesale
ABC Corp.
Thor, Ltd.
Grand Total
Growth
19%
322%
19%
322%
56%
Tabl ixe + Matr
Reporting Services 2008
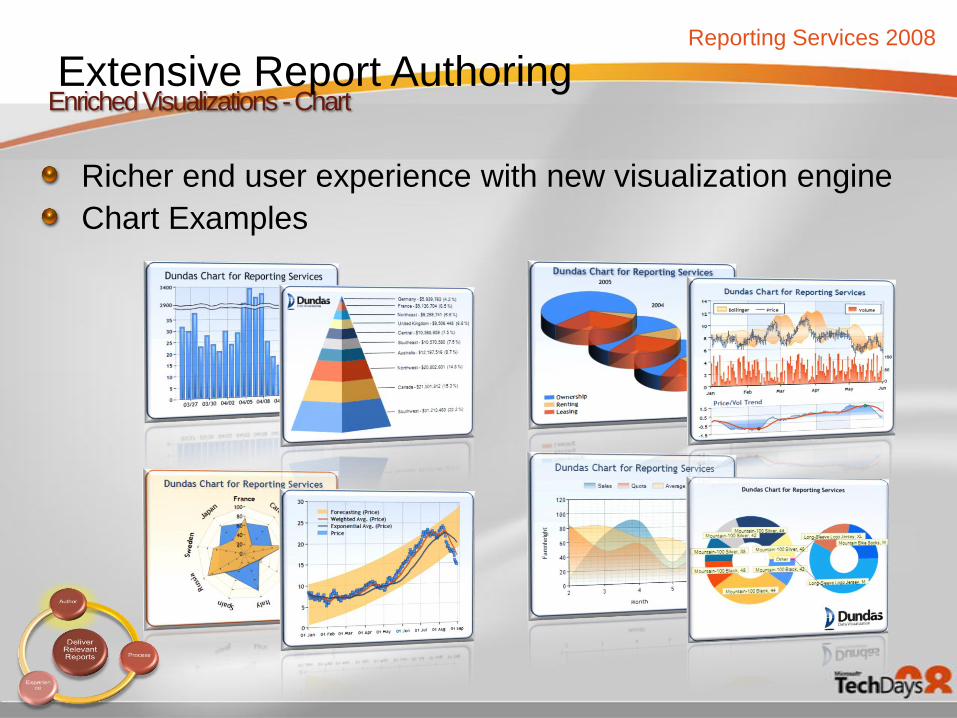
Enriched Visualizations -Chart
Richer end user experience with new visualization engine
Chart Examples
Reporting Services 2008
Extensive Report Authoring
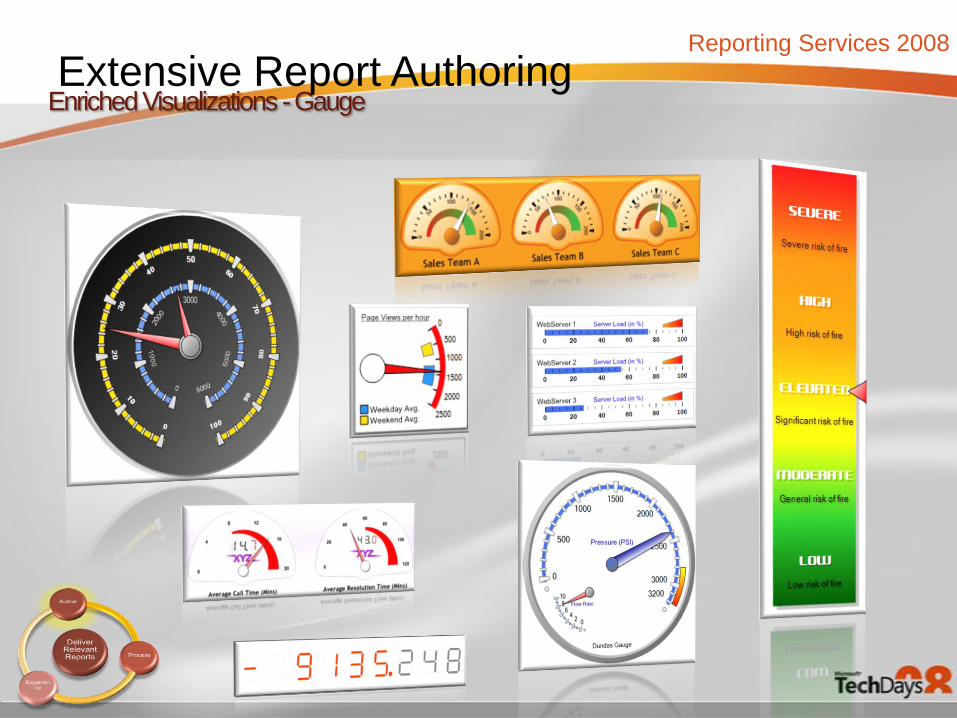
Enriched Visualizations -Gauge
Reporting Services 2008
Extensive Report Authoring
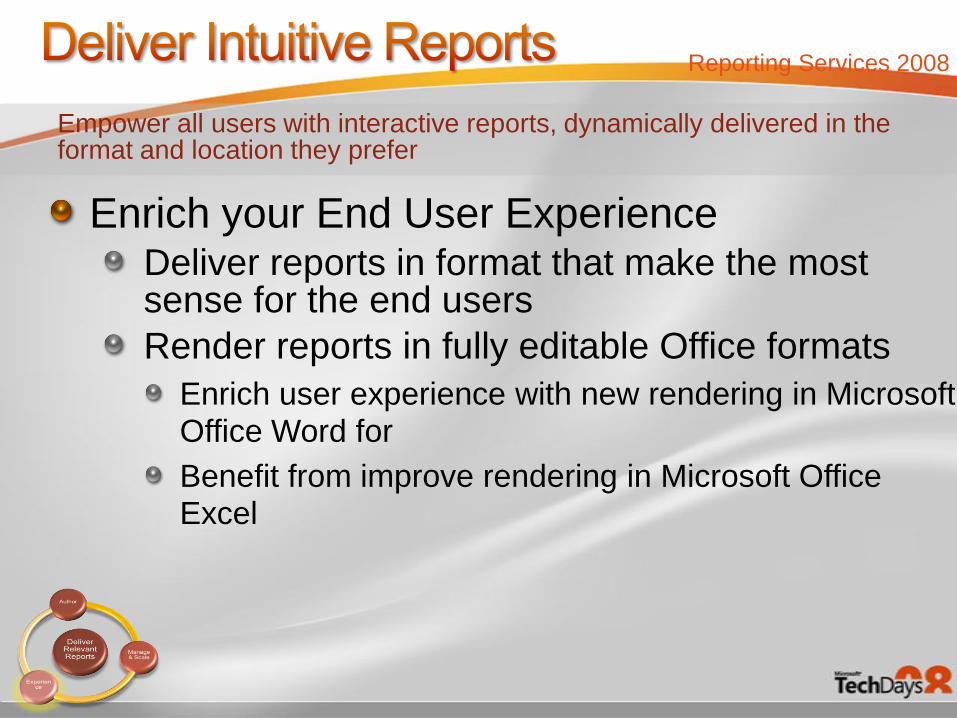
Enrich your End User ExperienceDeliver reports in format that make the most sense for the end users
Render reports in fully editable Office formats
Enrich user experience with new rendering in Microsoft Office Word for
Benefit from improve rendering in Microsoft Office Excel
Empower all users with interactive reports, dynamically delivered in the format and location they prefer
Reporting Services 2008
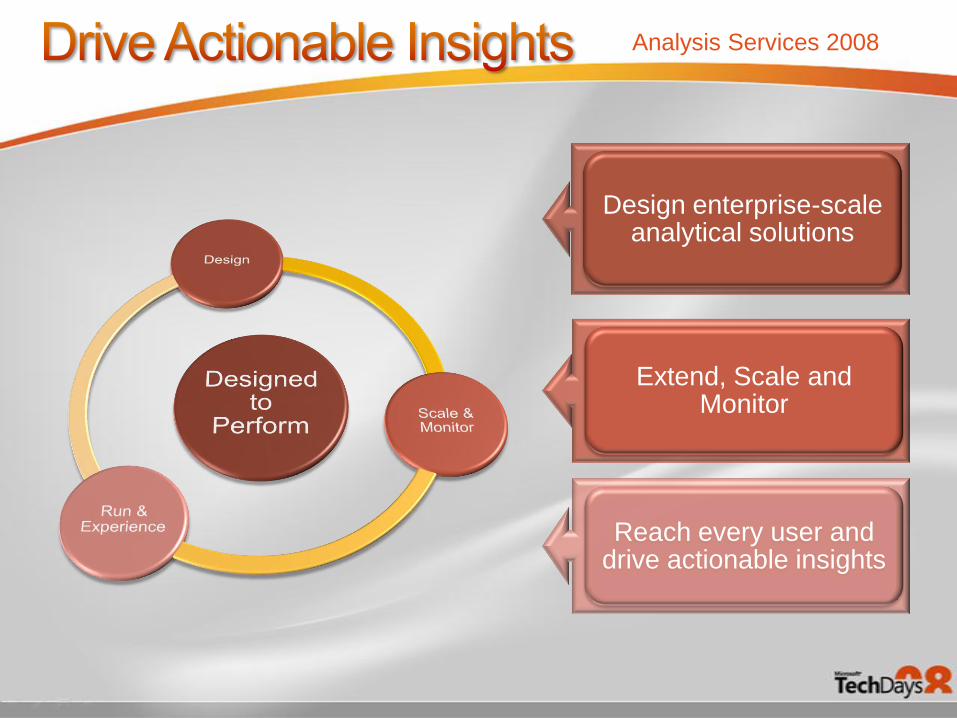
Analysis Services 2008
Design enterprise-scale analytical solutions
Extend, Scale and Monitor
Reach every user and drive actionable insights
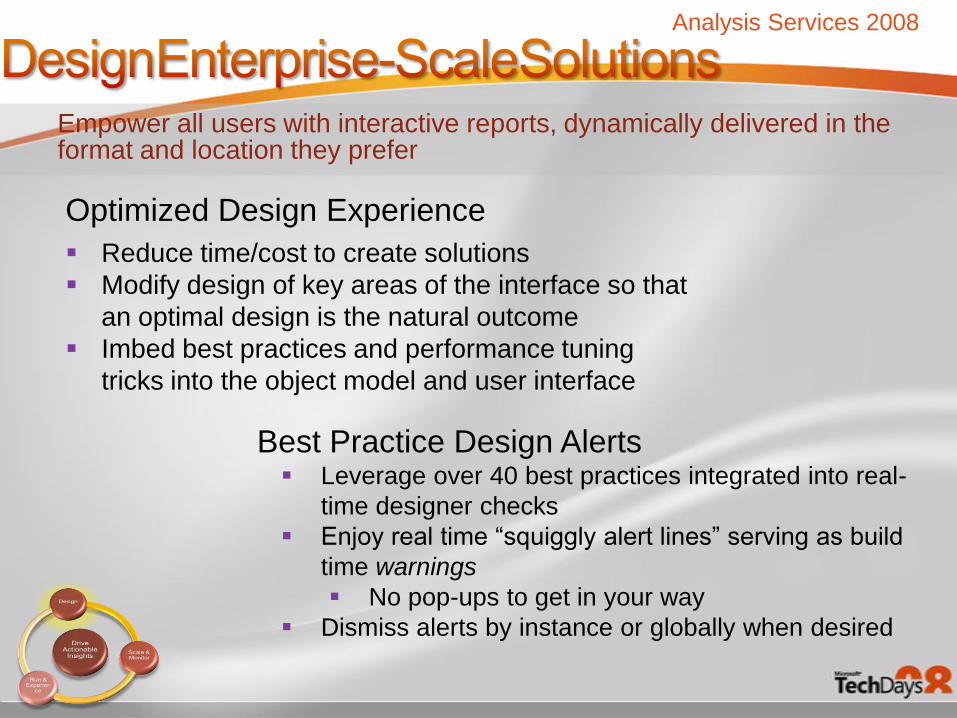
Reduce time/cost to create solutions
Modify design of key areas of the interface so that
an optimal design is the natural outcome
Imbed best practices and performance tuning
tricks into the object model and user interface
Leverage over 40 best practices integrated into real-
time designer checks
Enjoy real time “squiggly alert lines” serving as build
time warnings
No pop-ups to get in your way
Dismiss alerts by instance or globally when desired
Analysis Services 2008
Best Practice Design Alerts
Optimized Design Experience
Empower all users with interactive reports, dynamically delivered in the format and location they prefer
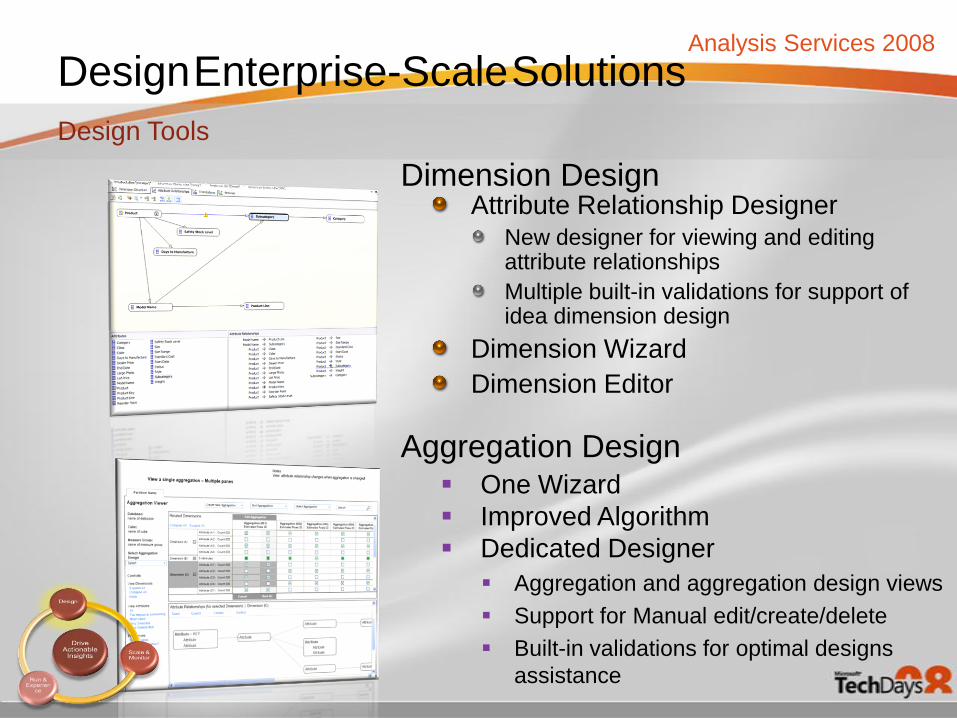
Attribute Relationship DesignerNew designer for viewing and editing attribute relationships
Multiple built-in validations for support of idea dimension design
Dimension Wizard
Dimension Editor
One Wizard
Improved Algorithm
Dedicated Designer
Aggregation and aggregation design views
Support for Manual edit/create/delete
Built-in validations for optimal designs
assistance
Analysis Services 2008
Aggregation Design
Dimension Design
DesignEnterprise-ScaleSolutions
Design Tools
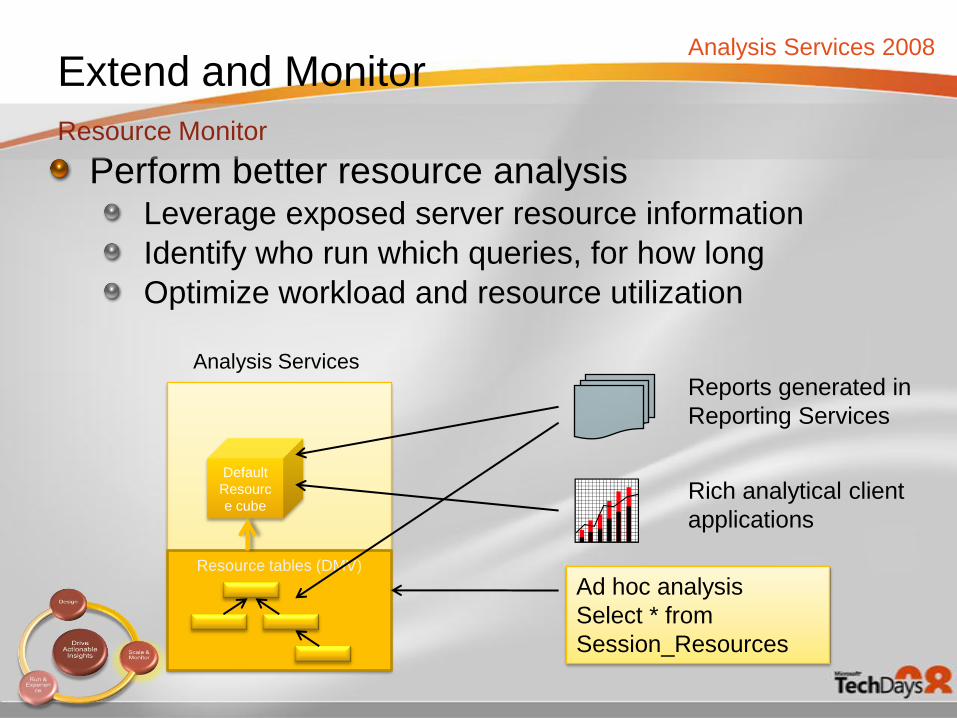
Perform better resource analysisLeverage exposed server resource information
Identify who run which queries, for how long
Optimize workload and resource utilization
Default
Resourc
e cube
Resource tables (DMV)
Ad hoc analysis
Select * from
Session_Resources
Reports generated in
Reporting Services
Rich analytical client
applications
Analysis Services
Analysis Services 2008
Extend and Monitor
Resource Monitor
Empower business users with MOLAP enabled write-back
Extend the superior performance of the MOLAP storage mode to write-back scenarios
Eliminate the need for ROLAP storage
Enable an end-user optimized write-back experience
Support improved what-if analysis
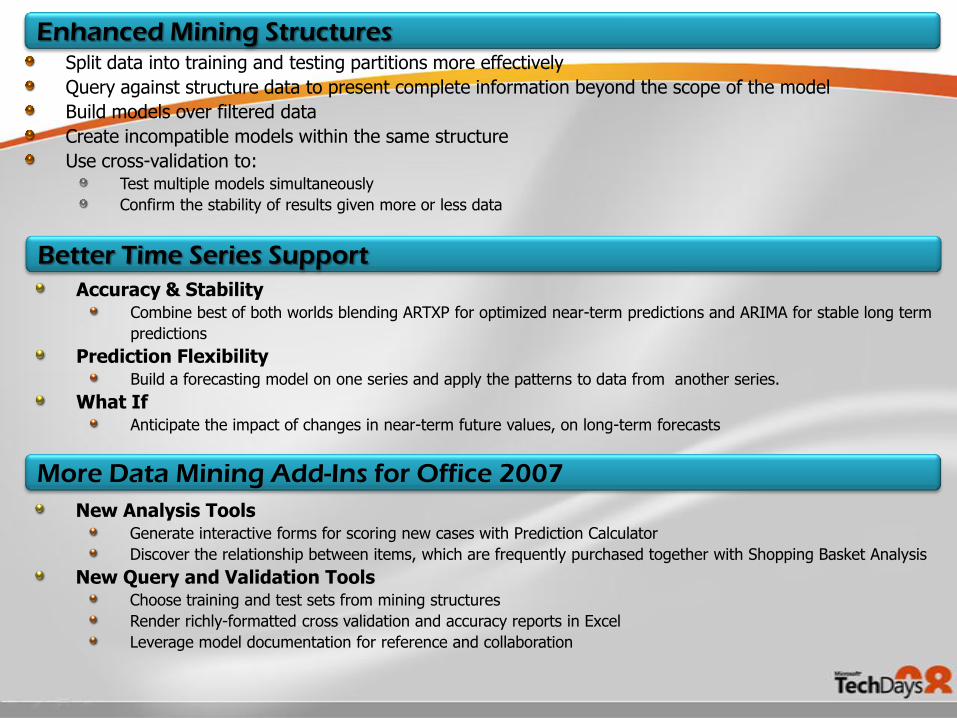
Split data into training and testing partitions more effectively
Query against structure data to present complete information beyond the scope of the model
Build models over filtered data
Create incompatible models within the same structure
Use cross-validation to:Test multiple models simultaneously
Confirm the stability of results given more or less data
Enhanced Mining Structures
Accuracy & Stability Combine best of both worlds blending ARTXP for optimized near-term predictions and ARIMA for stable long term
predictions
Prediction FlexibilityBuild a forecasting model on one series and apply the patterns to data from another series.
What IfAnticipate the impact of changes in near-term future values, on long-term forecasts
Better Time Series Support
New Analysis ToolsGenerate interactive forms for scoring new cases with Prediction Calculator
Discover the relationship between items, which are frequently purchased together with Shopping Basket Analysis
New Query and Validation ToolsChoose training and test sets from mining structures
Render richly-formatted cross validation and accuracy reports in Excel
Leverage model documentation for reference and collaboration
More Data Mining Add-Ins for Office 2007
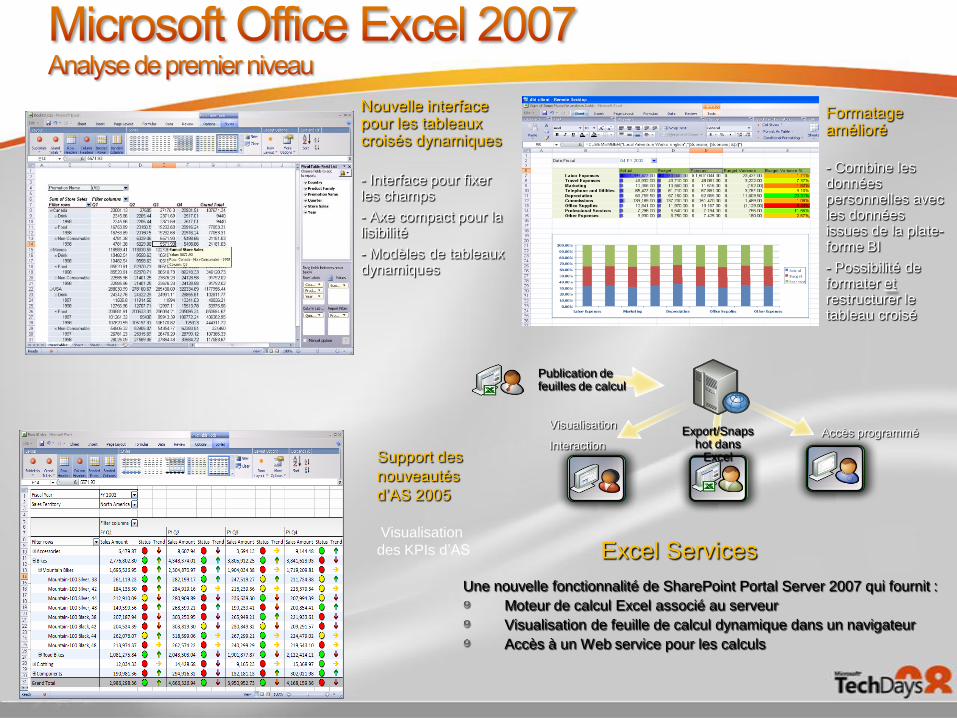
Formatage amélioré
- Combine les données personnelles avec les données issues de la plate-forme BI
- Possibilité de formater etrestructurer le tableau croisé
Nouvelle interface pour les tableaux croisés dynamiques
- Interface pour fixer les champs
- Axe compact pour la lisibilité
- Modèles de tableaux dynamiques
Support des
nouveautés
d’AS 2005
Visualisation
des KPIs d’AS Excel Services
Publication de feuilles de calcul
Visualisation
Interaction
Export/Snapshot dans
Excel
Accès programmé
Une nouvelle fonctionnalité de SharePoint Portal Server 2007 qui fournit :
Moteur de calcul Excel associé au serveur
Visualisation de feuille de calcul dynamique dans un navigateur
Accès à un Web service pour les calculs
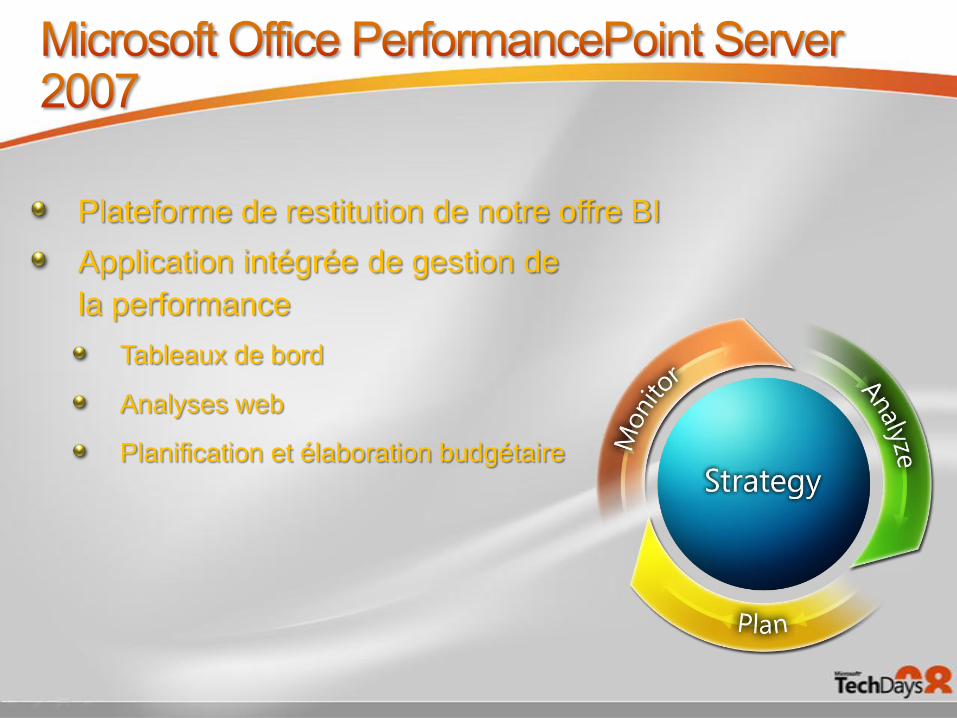
Plateforme de restitution de notre offre BI
Application intégrée de gestion de
la performance
Tableaux de bord
Analyses web
Planification et élaboration budgétaire
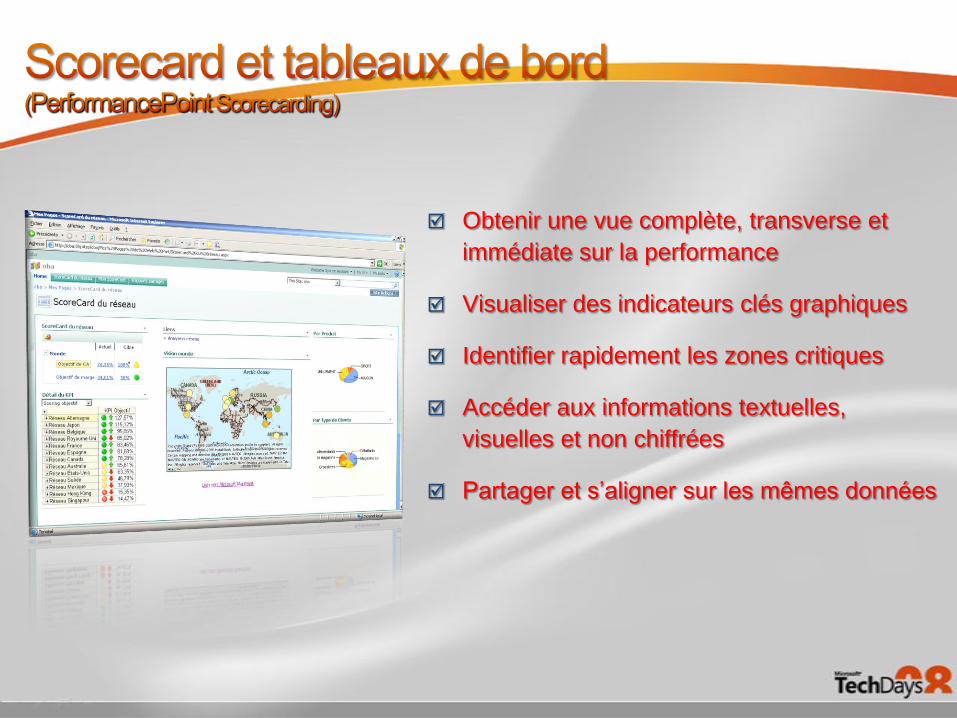
Obtenir une vue complète, transverse et
immédiate sur la performance
Visualiser des indicateurs clés graphiques
Identifier rapidement les zones critiques
Accéder aux informations textuelles,
visuelles et non chiffrées
Partager et s’aligner sur les mêmes données
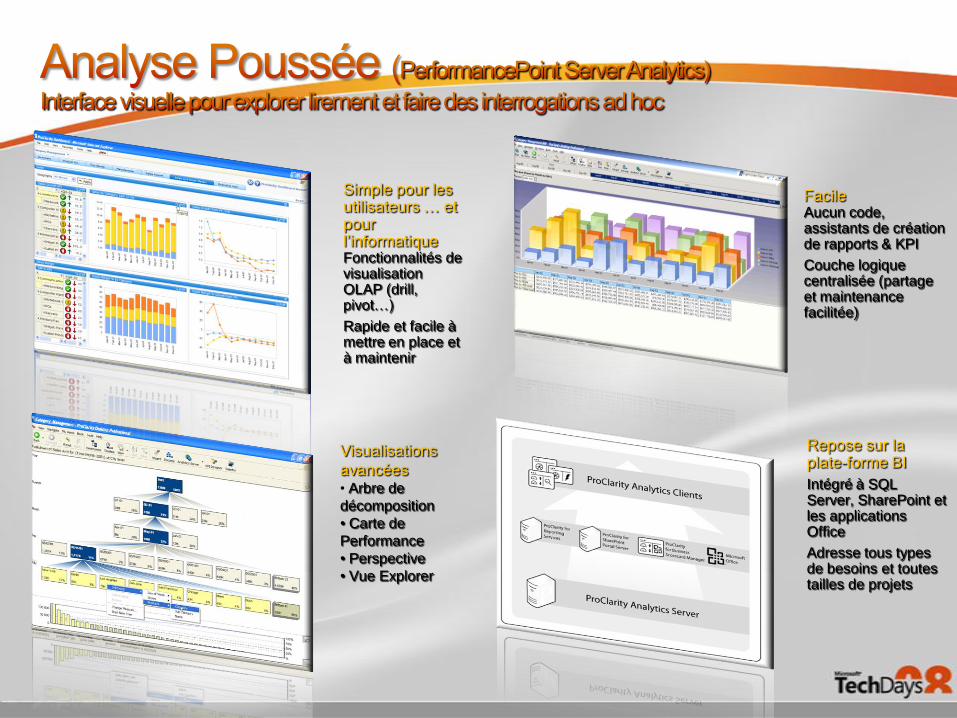
Simple pour les utilisateurs … et pour l’informatiqueFonctionnalités de visualisation OLAP (drill, pivot…)
Rapide et facile à mettre en place et à maintenir
FacileAucun code, assistants de création de rapports & KPI
Couche logique centralisée (partage et maintenance facilitée)
Visualisations
avancées• Arbre de
décomposition
• Carte de
Performance
• Perspective
• Vue Explorer
Repose sur la plate-forme BI
Intégré à SQL Server, SharePoint et les applications Office
Adresse tous types de besoins et toutes tailles de projets
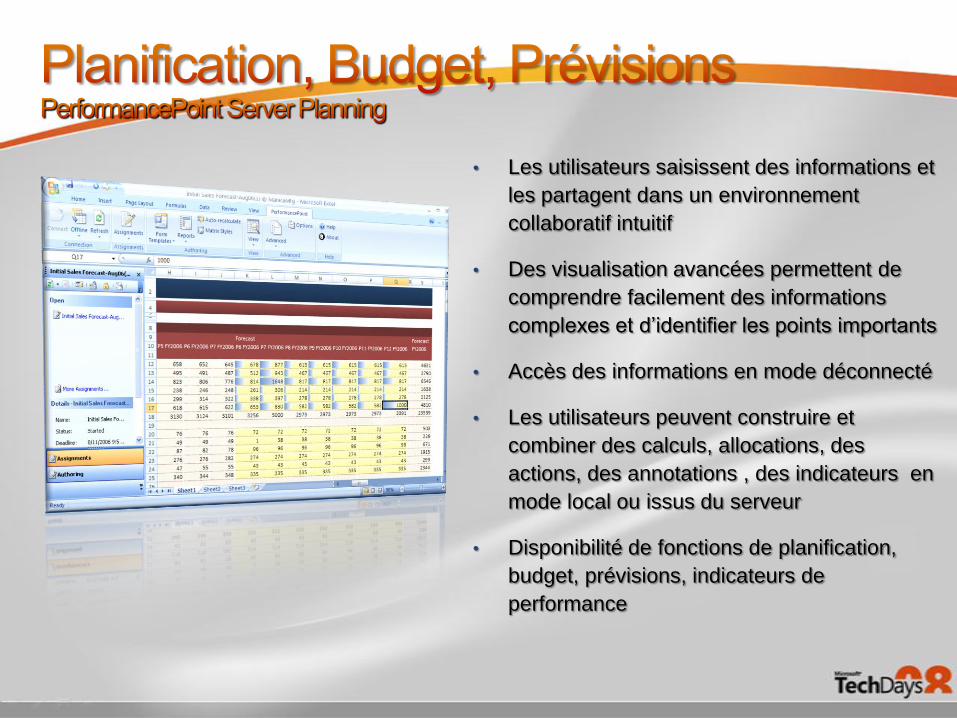
• Les utilisateurs saisissent des informations et
les partagent dans un environnement
collaboratif intuitif
• Des visualisation avancées permettent de
comprendre facilement des informations
complexes et d’identifier les points importants
• Accès des informations en mode déconnecté
• Les utilisateurs peuvent construire et
combiner des calculs, allocations, des
actions, des annotations , des indicateurs en
mode local ou issus du serveur
• Disponibilité de fonctions de planification,
budget, prévisions, indicateurs de
performance
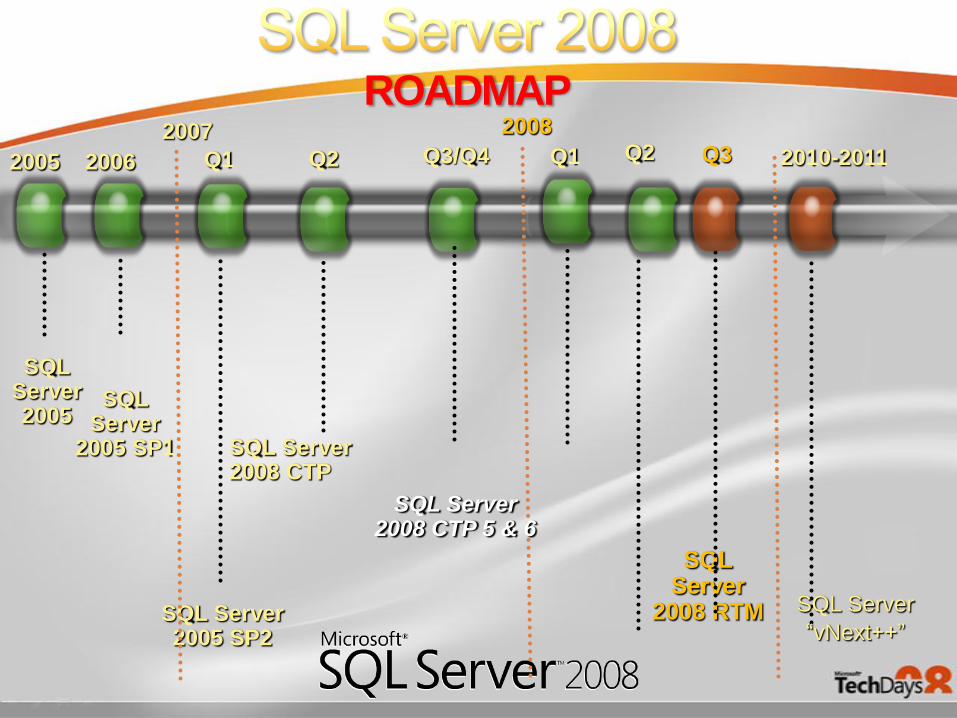
ROADMAP
SQL Server
2008 RTMSQL Server 2005 SP2
2007
2005
SQL Server 2005
2006
SQL Server
2005 SP1
Q1
2008Q2Q1
SQL Server 2008 CTP 5 & 6
SQL Server 2008 CTP
Q2 Q3/Q4 Q3 2010-2011
SQL Server
“vNext++”
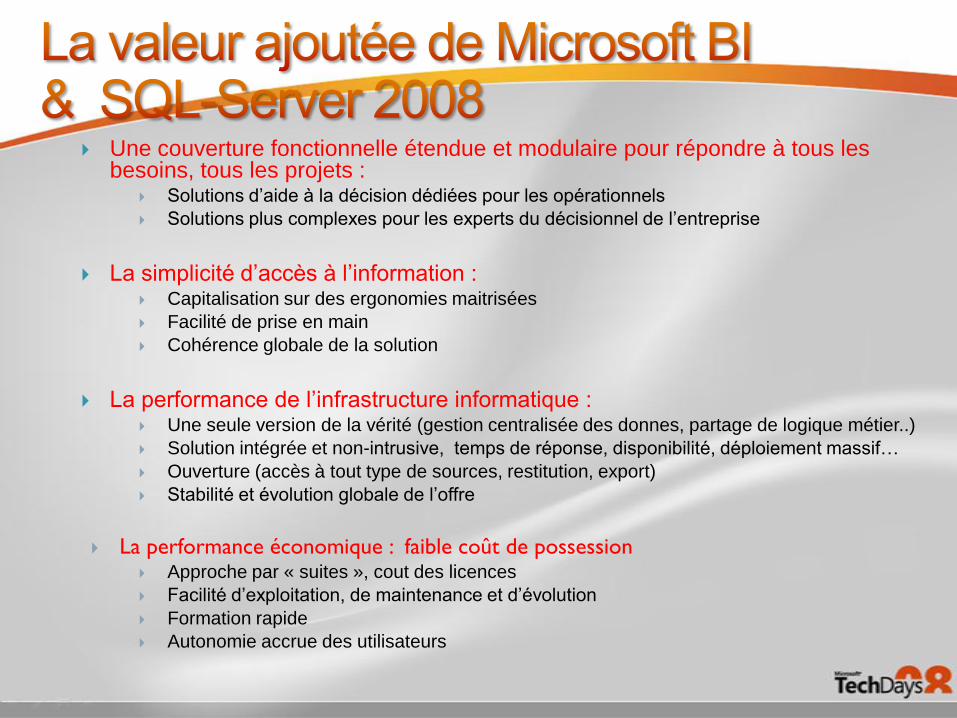
Une couverture fonctionnelle étendue et modulaire pour répondre à tous les besoins, tous les projets :
Solutions d’aide à la décision dédiées pour les opérationnels
Solutions plus complexes pour les experts du décisionnel de l’entreprise
La simplicité d’accès à l’information : Capitalisation sur des ergonomies maitrisées
Facilité de prise en main
Cohérence globale de la solution
La performance de l’infrastructure informatique : Une seule version de la vérité (gestion centralisée des donnes, partage de logique métier..)
Solution intégrée et non-intrusive, temps de réponse, disponibilité, déploiement massif…
Ouverture (accès à tout type de sources, restitution, export)
Stabilité et évolution globale de l’offre
La performance économique : faible coût de possession Approche par « suites », cout des licences
Facilité d’exploitation, de maintenance et d’évolution
Formation rapide
Autonomie accrue des utilisateurs
© 2007 Microsoft Corporation. All rights reserved. Microsoft, Windows, Windows Vista and other product names are or may be registered trademarks and/or trademarks in the U.S. and/or other countries.
The information herein is for informational purposes only and represents the current view of Microsoft Corporation as of the date of this presentation. Because Microsoft must respond to changing market
conditions, it should not be interpreted to be a commitment on the part of Microsoft, and Microsoft cannot guarantee the accuracy of any information provided after the date of this presentation.
MICROSOFT MAKES NO WARRANTIES, EXPRESS, IMPLIED OR STATUTORY, AS TO THE INFORMATION IN THIS PRESENTATION.
49
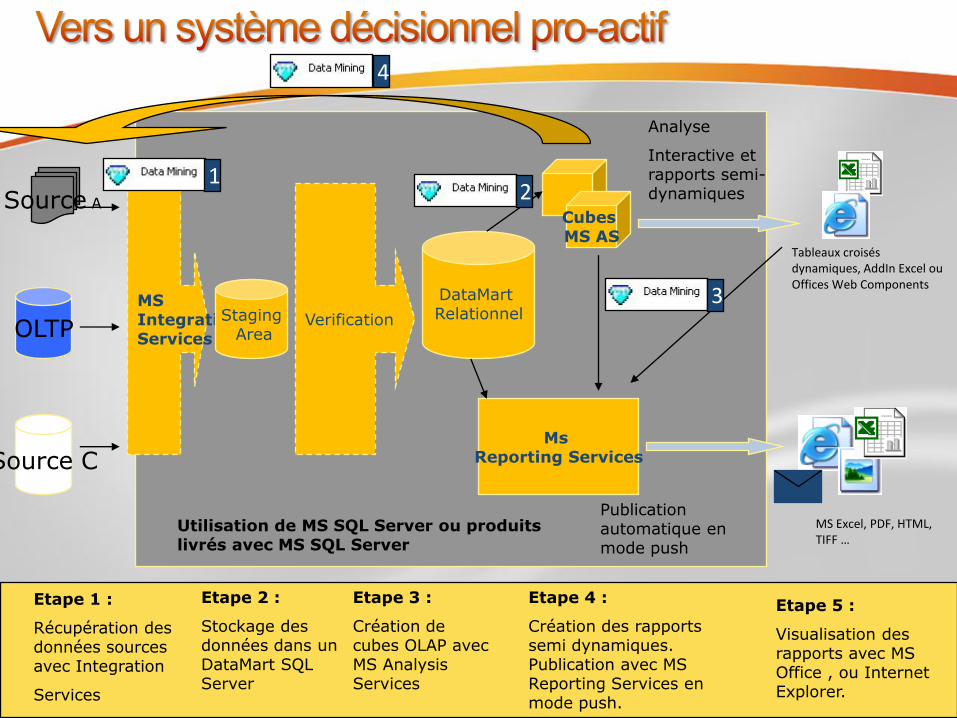
Source C
DataMart Relationnel
Cubes MS AS
Ms Reporting Services
Analyse
Interactive et rapports semi-dynamiques
Tableaux croisés dynamiques, AddIn Excel ou Offices Web Components
Publication automatique en mode push
MS IntegrationServices
MS Excel, PDF, HTML, TIFF …
Etape 1 :
Récupération des données sources avec Integration
Services
Etape 2 :
Stockage des données dans un DataMart SQL Server
Etape 3 :
Création de cubes OLAP avec MS Analysis Services
Etape 4 :
Création des rapports semi dynamiques. Publication avec MS Reporting Services en mode push.
Etape 5 :
Visualisation des rapports avec MS Office , ou Internet Explorer.
Utilisation de MS SQL Server ou produits livrés avec MS SQL Server
StagingArea
Verification
Source A
OLTP
12
3
4