CIRCUIT ELECTRIQUE OUVERT - FERME REGIME CONTINU Le circuit électrique.
tre :
Université Toulouse 3 Paul Sabatier (UT3 Paul Sabatier)
ED SDM : Chimie moléculaire - CO 046
Daniel HERNANDEZ MALDONADO16 juillet 2015
Photovoltaïque Organique: étude de la morphologie de films minces,conception, synthèse et étude de petites molécules pour leur utilisation en
hétérojonction en volume dans des dispositifs photovoltaïques.
Laboratoire de Chimie de Coordination
Mme Kathleen MOINEAU-CHANE CHING
M. Jean RONCALI, DR CNRS, Université d'Angers M. Harald BOCK, DR CNRS, Université de Bordeaux
Mme Fabienne ALARY, Professeur, Université PAUL SABATIER Toulouse IIIMme Séverine LEROY, CR CNRS, Université PAUL SABATIER Toulouse IIIM. Thanh-Tuan BUI, Maître de Conférence, Université de Cergy-Pontoise
Mme Kathleen MOINEAU, DR CNRS, Université PAUL SABATIER Toulouse III

Remerciements
Je souhaite remercier en premier lieu ma directrice de thèse, Mme. Kathleen I. Moineau-Chane
Ching, Directrice de Recherche au CNRS au Laboratoire de Chimie de Coordination pour m'avoir
accueilli et permis de travailler avec elle. Je lui suis énormément reconnaissant pour le temps
conséquent qu’elle m’a accordé, sa patience, ses qualités humaines, pédagogiques et scientifiques,
sa franchise, sa sympathie et son aide inconditionnelle en tout moment. J’ai beaucoup appris à ses
côtés et je lui adresse ma grande gratitude pour tout cela. Je ne vais jamais oublier tout ce qu’elle a
fait pour moi.
J’adresse de chaleureux remerciements à l’ensemble de l’équipe « Molécules et Composites pour
l’Optique », dirigée par Isabelle Malfant, pour leur attention de tous instants sur mes travaux, pour
leurs conseils avisés et leur écoute qui ont été prépondérants pour la bonne réussite de cette thèse.
Leur énergie, leurs connaissances et leur confiance ont été des éléments moteurs pour moi. J’ai pris
un grand plaisir à travailler avec eux tout au long de ces 4 ans. Les réunions d’équipe du vendredi
matin vont beaucoup me manquer. Vous avez fait de mon séjour au LCC une étape inoubliable dans
beaucoup d’aspects.
Un grand merci à tous les collaborateurs des laboratoires toulousains, Isabelle Séguy, Eléna Bedel-
Pereira, et Benjamin du LAAS, Christina Villeneuve-Faure du LAPLACE, Fabienne Alary et Jean-
Louis Heully du LCPQ, pour leur implication dans le projet, notamment sur la partie physique et
théorique de notre étude. Ils m’ont beaucoup appris, j’ai apprécié leur aide, leur enthousiasme et
leur sympathie.
Je voudrais remercier les rapporteurs de cette thèse M. Harald Bock, DR CNRS au Centre de
Recherche Paul Pascal à Pessac, et M. Jean Roncali, DR CNRS au Laboratoire Moltech-Anjou à
Angers, pour l’intérêt qu’ils ont porté à mon travail.
J'associe à ces remerciements Thanh-Tuân Bui, Maître de Conférences au Laboratoire de
Physicochimie des Polymères et des Interfaces, Université de Cergy-Pontoise, Séverine Leroy CR
CNRS au Laboratoire Laplace, Université de Toulouse, et Fabienne Alary Professeur des
Universités au LCPQ, Université de Toulouse, pour avoir accepté d’examiner mon travail.
J’adresse de sincères remerciements à Pr. Ernesto Rivera, de l’Instituto de Investigaciones en
Materiales (IIM-UNAM) à Mexico directeur de l’équipe « Azo » et à tous ses membres pour m’avoir
accueilli très chaleureusement au sein de son équipe lors d’un échange à la fin de ma première année
de thèse. Le financement de ce séjour a été possible grâce à la bourse ATUPS, de l’Université Paul
Sabatier.
Je désire remercier Dr José Luis Maldonado, Chercheur au Centro de Investigaciones en Óptica
(CIO-León) au Mexique et toute son équipe pour m’avoir accueilli sur la fin de ma thèse pour
l’élaboration des prototypes de cellules photovoltaïques et leurs caractérisations physiques. Leur
aide a été la clef de l’aboutissement de ce projet de thèse. Je veux remercier le LIA France-Mexique
et son directeur français et cher ami Pascal Lacroix pour avoir financé mon séjour.
Bien sûr, atteindre ces objectifs n’aurait pas été possible sans l’aide de tous les services techniques
et administratifs du Laboratoire de Chimie de Coordination. Je souhaite notamment les remercier
car ils sont une partie fondamentale pour que nous tous puissions travailler au quotidien.
Je désire en outre remercier tous les doctorants et stagiaires qui ont fait partie de l’équipe au long
de ces 4 ans, pour leur sympathie et leur amitié. J’ai eu beaucoup de plaisir à travailler avec eux. Le
cadre de travail était idéal.
Je remercie le CONACyT qui m’a permis d’effectuer ces travaux de thèse en France, grâce à une
bourse doctorale.
D’autre part, je ne serais jamais arrivé jusqu’au doctorat sans l’énorme contribution, orientation et
aide de M. Juana María Alvarado, Coordinatrice de la Licence en Chimie de l’Université Autonome
de San Luis Potosí, tout au long de ma formation universitaire au Mexique.
Un grand remerciement à tous mes amis (d’ici et d’ailleurs) et « colocs » pendant tout ce temps de
la thèse, qui ont fait de mon séjour à Toulouse (et séjours au Mexique) une étape inoubliable. Cette
ville m’a beaucoup donné et je l’en remercie. De la même façon, je veux remercier à toute l’équipe

de « Fréquences Latines » de Radio Mon Païs pour ces deux dernières années magnifiques. J’ai
beaucoup appris d’eux tous et je leur souhaite le meilleur pour les années à venir.
Je souhaite remercier spécialement Sara pour son soutien et sa patience dans l’étape plus critique de
la thèse.
Enfin, je remercie mes parents et sœur, Jaime, Elda et Katya, pour leur soutien au cours de ces quatre
années et sans lesquels je n'en serais pas là aujourd'hui. Muchas gracias por todo. Los amo. Por
ustedes y nuestro esfuerzo colectivo estoy aquí, y he llegado hasta donde estoy.

1
Table des matières ABREVIATIONS ............................................................................................................................................. 5
Chapitre I: Introduction ............................................................................................................................... 7
Les énergies renouvelables : le solaire. ....................................................................................................... 9
Le photovoltaïque organique .................................................................................................................... 11
L’électronique organique .......................................................................................................................... 11
Photovoltaïque organique : le pour et le contre. ...................................................................................... 12
Evolution de l’OPV ..................................................................................................................................... 14
Types, fonctionnement et constitution des cellules OPV ......................................................................... 15
Matériaux pour l’OPV : l’ingénierie moléculaire. ...................................................................................... 23
Objectifs : de l’étude de la morphologie et transfert de charges en films minces à la conception de
nouvelles molécules pour l’OPV. ............................................................................................................... 26
Matériaux organiques solubles pour l’élaboration des films minces. ...................................................... 27
Conception et synthèse de molécules pour l’OPV .................................................................................... 29
Elaboration des prototypes de cellules organiques .................................................................................. 29
Chapter II: Films Development .................................................................................................................. 31
Introduction ............................................................................................................................................... 33
UV-Vis-Near IR spectroscopy: analysis of P3HT and Ni-bdt family in solution.......................................... 35
UV-Vis-Near IR spectroscopy: analysis of P3HT and Ni-bdt family in thin films........................................ 39
Fluorescence spectroscopy: analysis of P3HT and Ni-bdt family in solution. ........................................... 46
Fluorescence spectroscopy: analysis of P3HT and Ni-bdt family in thin films. ......................................... 49
RAMAN spectroscopy: analysis of P3HT and Ni-bdt family in thin films. .................................................. 51
Electrochemistry: analysis of P3HT and Ni-bdt family in solution. ........................................................... 66
Electrochemistry: analysis of P3HT and Ni-bdt family in thin films. ......................................................... 70
Atomic Force Microscopy (AFM) of P3HT and Ni-bdt family in thin films. ............................................... 75
P3HT:[Ni(4dopedt)2] organic solar cells. ................................................................................................... 78
Chapter Conclusions .................................................................................................................................. 82
Chapter III: Molecular Engineering ............................................................................................................ 83
Introduction ............................................................................................................................................... 85
II) Organic Synthesis .................................................................................................................................. 95
2,1,3-Benzothiadiazole .............................................................................................................................. 96
2
5’-bromo-5-dicyanovinyl-2,2’-bithiophene ............................................................................................. 100
4,4’-Dioctyl-2,6-dibromodithieno[3,2-b:2’,3’-d]silole and 4,4’-diethylhexyl-2,6-dibromodithieno[3,2-
b:2’,3’-d]silole .......................................................................................................................................... 102
Cross-coupling methods .......................................................................................................................... 105
Fragment BrBzT2DCV ............................................................................................................................... 105
SilOCAO ................................................................................................................................................... 109
Fragment 1 (SilOCAO synthesis) .............................................................................................................. 111
Suzuki cross-coupling .......................................................................................................................... 111
Direct Heteroarylation ......................................................................................................................... 113
Fragment 2 (SilOCAO synthesis) .............................................................................................................. 114
SilOCAO synthesis (final step) ................................................................................................................. 116
Bz(T1CAO)2 and Bz(T1CAEH)2 .................................................................................................................... 116
Chapter Conclusions ................................................................................................................................ 118
Chapter IV: Molecules characterisations and OPV devices ..................................................................... 119
Bz(T1CAO)2 and Bz(T1CAEH)2 .................................................................................................................... 121
Theoretical calculations ........................................................................................................................... 121
Electrochemical Properties ..................................................................................................................... 123
Optical Properties .................................................................................................................................... 125
Optical properties in thin film ................................................................................................................. 132
Thermal Properties .................................................................................................................................. 133
SilO(BzT1CAO)2 (alias SilOCAO) ................................................................................................................ 136
Theoretical calculations ........................................................................................................................... 137
Electrochemical Properties ..................................................................................................................... 137
Optical Properties .................................................................................................................................... 139
Chapter Conclusions ................................................................................................................................ 157
Perspectives............................................................................................................................................. 158
Résultats et discussion ............................................................................................................................ 159
Matériaux organiques solubles pour l’élaboration des films minces. .................................................... 159
Conception et synthèse de molécules pour l’OPV .................................................................................. 162
Elaboration des prototypes de cellules organiques ................................................................................ 163
Conclusion ............................................................................................................................................... 165
GENERAL CONCLUSION AND PERSPECTIVES ........................................................................................... 167
3
Experimental Section ............................................................................................................................... 175
Films development .................................................................................................................................. 177
Films elaboration ..................................................................................................................................... 177
UV-Vis-Near Infrared Measurements ...................................................................................................... 177
Fluorescence Measurements .................................................................................................................. 177
Determination of quenching parameter: the Stern-Volmer constant ................................................ 177
RAMAN Measurements ........................................................................................................................... 180
Electrochemical measurements .............................................................................................................. 181
AFM measurements ................................................................................................................................ 181
Molecular Engineering ............................................................................................................................ 182
Theoretical calculations ........................................................................................................................... 182
Organic synthesis ..................................................................................................................................... 182
Molecules Characterisation and OPV devices. ........................................................................................ 195
Thermal measurements .......................................................................................................................... 195
Organic Solar Cell elaboration ................................................................................................................. 195
Annexes ................................................................................................................................................... 197
Films Development .................................................................................................................................. 199
Molecular Engineering ............................................................................................................................ 201
Suzuki cross-coupling .......................................................................................................................... 201
Stille cross-coupling ............................................................................................................................. 202
Direct (Hetero)arylation ...................................................................................................................... 203
Molecules Characterisation and OPV devices ......................................................................................... 205
BIBLIOGRAPHY ......................................................................................................................................... 207

4
5
ABREVIATIONS
AM1 conditions d'éclairement qui correspondent à un ciel parfaitement clair et
dégagé, sous un soleil de midi au zénith (900)
AM1.5 conditions d'éclairement qui correspondent à un ciel parfaitement clair et
dégagé, sous un soleil d'inclinaison ∼ 420
AM2 conditions d'éclairement qui correspondent à un ciel parfaitement clair et
dégagé, sous un soleil d'inclinaison ∼ 600
DIO 1,8-DiIodoOctane C8H16I2, N° CAS : 24772-63-2
Eg écart énergétique (gap) entre les niveaux HOMO et LUMO (molécule ou
polymère)
FF Facteur de Forme (Fill Factor en anglais)
HOMO orbitale moléculaire la plus haute occupée (Highest Occupied Molecular Orbital
en anglais)
ITO oxyde mixte d’indium et d’étain (Indium Tin Oxide en anglais)
Jsc courant de court-circuit (short circuit courent en anglais)
LUMO orbitale moléculaire la plus basse vacante (Lowest Unoccupied Molecular Orbital
en anglais)
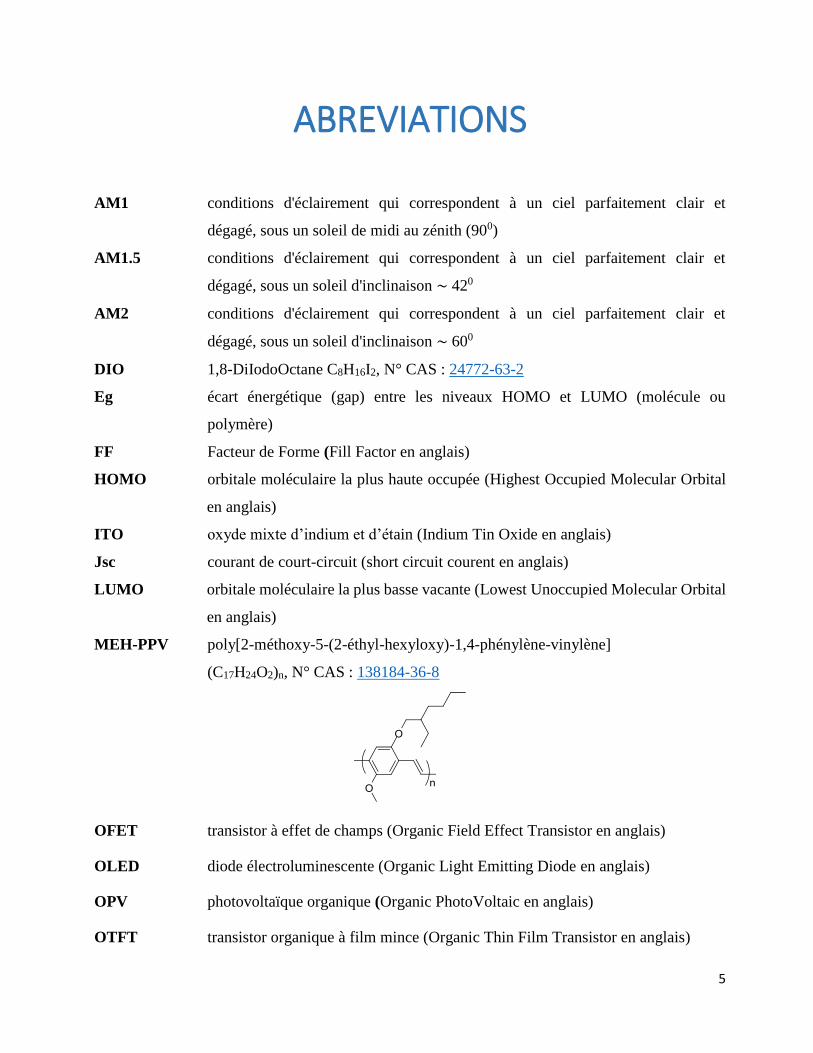
MEH-PPV poly[2-méthoxy-5-(2-éthyl-hexyloxy)-1,4-phénylène-vinylène]
(C17H24O2)n, N° CAS : 138184-36-8
OFET transistor à effet de champs (Organic Field Effect Transistor en anglais)
OLED diode électroluminescente (Organic Light Emitting Diode en anglais)
OPV photovoltaïque organique (Organic PhotoVoltaic en anglais)
OTFT transistor organique à film mince (Organic Thin Film Transistor en anglais)
6
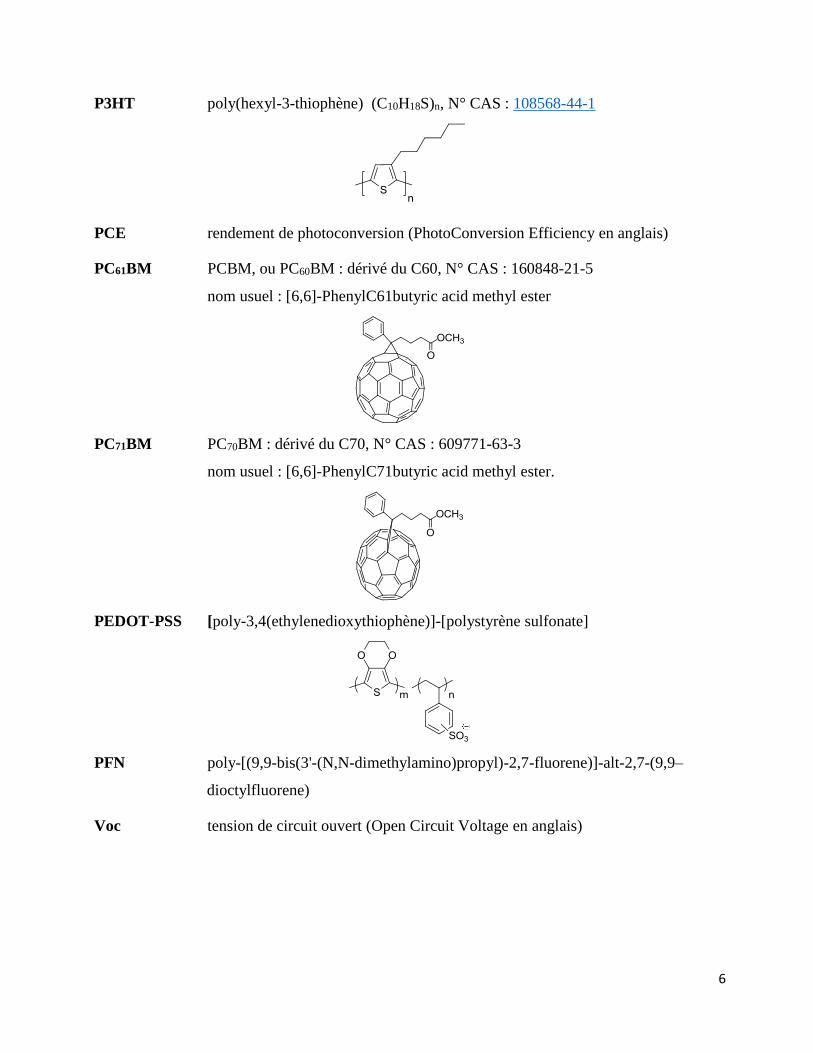
P3HT poly(hexyl-3-thiophène) (C10H18S)n, N° CAS : 108568-44-1
PCE rendement de photoconversion (PhotoConversion Efficiency en anglais)
PC61BM PCBM, ou PC60BM : dérivé du C60, N° CAS : 160848-21-5
nom usuel : [6,6]-PhenylC61butyric acid methyl ester
PC71BM PC70BM : dérivé du C70, N° CAS : 609771-63-3
nom usuel : [6,6]-PhenylC71butyric acid methyl ester.
PEDOT-PSS [poly-3,4(ethylenedioxythiophène)]-[polystyrène sulfonate]
PFN poly-[(9,9-bis(3'-(N,N-dimethylamino)propyl)-2,7-fluorene)]-alt-2,7-(9,9–
dioctylfluorene)
Voc tension de circuit ouvert (Open Circuit Voltage en anglais)

CHAPITRE I : INTRODUCTION
7
Chapitre I: Introduction

CHAPITRE I : INTRODUCTION
8
CHAPITRE I : INTRODUCTION
9
Introduction
Ce travail de thèse était consacré à la thématique : photovoltaïque organique (OPV). Il fait suite à
une étude réalisée dans le cadre d’un projet ANR : « Cellules Photovoltaïques Auto-structurées à
Forte Absorption aux Longueurs d’Onde Infra Rouges » (CPA FALLOIR) qui avait abouti à la
synthèse de plusieurs complexes de nickel potentiellement intéressants pour l’OPV. Ces matériaux
innovants étaient destinés à être utilisés en mélange avec un matériau organique, le poly-3-
hexylthiophène (P3HT).
Le présent travail est par conséquent consacré en premier lieu à une étude approfondie en solution
et en films minces de P3HT pur et en mélange avec les complexes de nickel (Ni-bdt). L'objectif
principal de cette étude était de comprendre l'organisation moléculaire au sein des films organiques
et son impact sur le transfert de charges entre les matériaux. Le but est in fine d’optimiser les
rendements de photoconversion de cellules conçues à partir de tels matériaux
D’autre part, ce travail de recherche porte également sur la conception, synthèse et étude de petites
molécules pour leur utilisation en hétérojonction en volume dans des dispositifs photovoltaïques
organiques.
Il a été réalisé au Laboratoire de Chimie de Coordination du Centre National de la Recherche
Scientifique (LCC-CNRS UPR 8241) à Toulouse. Ce travail a été dirigé par Madame Kathleen I.
Moineau-Chane Ching, Directrice de Recherche au CNRS.
Les énergies renouvelables : le solaire.
L’énorme réduction des réserves de combustibles fossiles dans le monde, leur extraction difficile,
l’impact environnemental de leur utilisation et exploitation, montrent un besoin urgent d'autres
sources d'énergie « propres » et renouvelables telles que l'éolien, le biogaz et le solaire, parmi
d'autres.
L’énergie solaire est une énergie propre qui n'émet aucun gaz à effet de serre et sa matière première,
le soleil, est disponible partout dans le monde. Gratuite et inépuisable, elle demeure notre plus
grande source d'énergie.
CHAPITRE I : INTRODUCTION
10
Cette énergie permet de fabriquer de l'électricité en centrales solaires thermiques ou grâce à des
panneaux photovoltaïques, appelés aussi panneaux solaires. Pour faire fonctionner une installation
photovoltaïque on a besoin de 3 éléments principaux: des panneaux solaires qui peuvent récupérer
l’énergie transmise par le soleil et la transformer en électricité, d’un onduleur et d’un compteur pour
permettre de distribuer cette énergie à l’ensemble de la population connectée au réseau.1 Rappelons
que le rendement de photoconversion d’une cellule solaire se déduit du rapport de l’énergie
électrique délivrée par la cellule sur l’énergie d’illumination utilisée pour tester la cellule.
La plupart de ces panneaux photovoltaïques sont constitués de silicium, et appartiennent à la
technologie dite de 1ère génération représentant 90% du marché actuel. Le silicium qui est l'élément
le plus abondant dans la croûte terrestre après l'oxygène (soit 25,7% de sa masse), a des propriétés
de semi-conducteur qui en font un matériau privilégié pour la fabrication des composants
électroniques.
Il existe plusieurs types de panneaux photovoltaïques de 1ère génération à base de silicium: le
silicium amorphe délivrant des rendements de conversion de l’énergie solaire en électricité situés
entre 6 et 7% et représentant environ 3% du marché, le silicium multicristallin délivrant des
rendements entre 11 et 15% et représentant plus de 55% du marché, et enfin le silicium
monocristallin délivrant des rendements entre 13 et 19% et représentant environ 30% du marché.2,3
Une autre technologie photovoltaïque (PV) consiste en panneaux plus légers et éventuellement
flexibles, constitués de couches minces de matériau actif. Ces propriétés permettent une fabrication
de cellules solaires sur des supports non plans avec un usage possible dans une large possibilité
d’endroits. Ces panneaux solaires constituent la technologie dite de 2ème génération. Les matériaux
actifs concernés les plus utilisés et commercialisés sont le tellurure de cadmium (CdTe) (très stable
et le moins cher de ce type), les alliages cuivre/indium/sélénium (CIS),
cuivre/indium/gallium/sélénium (CIGS) et cuivre/indium/gallium/disélénure/disulphure (CIGSS).
Ces trois derniers permettent d’obtenir les rendements de conversion les plus élevés parmi les
systèmes à couches minces mais à un coût plus élevé. Enfin, l’arséniure de gallium (AsGa) est utilisé
préférentiellement dans le domaine du spatial pour ses hautes performances, et cela malgré un prix
CHAPITRE I : INTRODUCTION
11
très élevé. Ces filières représentent à peine plus de 5% du marché photovoltaïque mondial actuel.
Le photovoltaïque organique
Une alternative qui commence à se développer depuis quelque temps et à se faire une place dans le
secteur solaire, se base sur des matériaux organiques : elle appartient à ce qui est appelé la 3ème
génération. Son but n’est pas de remplacer les autres technologies existantes mais de les
complémenter en s’adaptant aux besoins du marché.
Tout d’abord, pour pouvoir comprendre le fonctionnement d’une cellule photovoltaïque organique
(cellule OPV), nous allons expliquer le contexte actuel et situer le photovoltaïque organique dans le
monde de l'électronique organique.
L’électronique organique
Par définition, dans l'électronique organique, la composante principale utilisée est un matériau à
base de molécules constituées principalement de carbone et d'hydrogène.
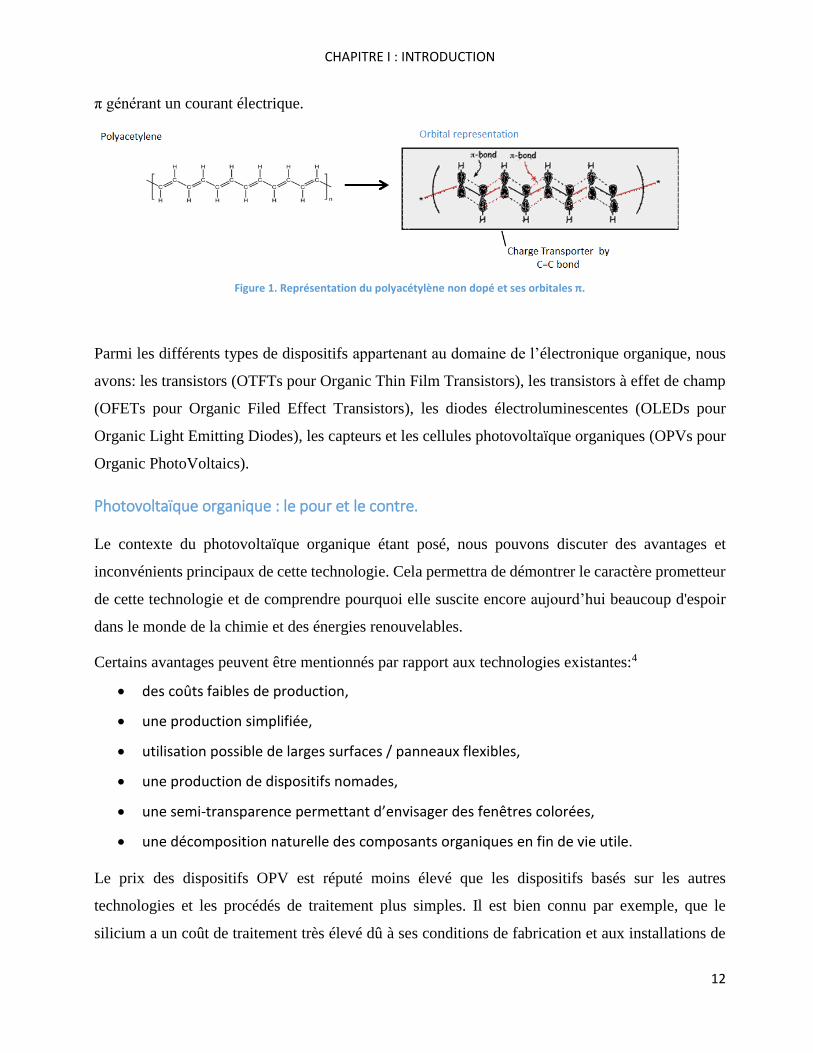
Un exemple de composant organique de ce type est le polyacétylène, un polymère pouvant présenter
des propriétés de semi-conduction et qui a conduit à l’obtention du prix Nobel dans l’année 2000
pour sa surprenante conductivité quand il est dopé.1
Le polyacétylène doit cette propriété à sa structure chimique (Figure 1), qui présente une alternance
de simples et doubles liaisons C-C, favorisant ainsi une délocalisation électronique étendue à tout
le système π. Ce système π conjugué est une caractéristique clé des composants électroniques
organiques, car c’est à travers lui que le transport de charge dans le matériau est effectué. Dans son
état dopé, c’est-à-dire partiellement oxydé, ce matériau voit sa conductivité augmenter de l’ordre de
108 fois. En d'autres termes, les électrons sont parfaitement délocalisés sur l’ensemble des orbitales
1 En 1977, Hideko Shirakawa, Alan Heeger et Alan MacDiarmid ont découvert les polymères conducteurs. Ils ont publié
leur découverte dans l'article intitulé «Synthesis of electrically conducting organic polymers : Halogen Derivatives of
Polyacetylene, (CH)x» J.C.S. Chem. Comm. 1977, 578-580 et se sont vu décerner le prix Nobel de chimie en 2000.
CHAPITRE I : INTRODUCTION
12
π générant un courant électrique.
Figure 1. Représentation du polyacétylène non dopé et ses orbitales π.
Parmi les différents types de dispositifs appartenant au domaine de l’électronique organique, nous
avons: les transistors (OTFTs pour Organic Thin Film Transistors), les transistors à effet de champ
(OFETs pour Organic Filed Effect Transistors), les diodes électroluminescentes (OLEDs pour
Organic Light Emitting Diodes), les capteurs et les cellules photovoltaïque organiques (OPVs pour
Organic PhotoVoltaics).
Photovoltaïque organique : le pour et le contre.
Le contexte du photovoltaïque organique étant posé, nous pouvons discuter des avantages et
inconvénients principaux de cette technologie. Cela permettra de démontrer le caractère prometteur
de cette technologie et de comprendre pourquoi elle suscite encore aujourd’hui beaucoup d'espoir
dans le monde de la chimie et des énergies renouvelables.
Certains avantages peuvent être mentionnés par rapport aux technologies existantes:4
des coûts faibles de production,
une production simplifiée,
utilisation possible de larges surfaces / panneaux flexibles,
une production de dispositifs nomades,
une semi-transparence permettant d’envisager des fenêtres colorées,
une décomposition naturelle des composants organiques en fin de vie utile.
Le prix des dispositifs OPV est réputé moins élevé que les dispositifs basés sur les autres
technologies et les procédés de traitement plus simples. Il est bien connu par exemple, que le
silicium a un coût de traitement très élevé dû à ses conditions de fabrication et aux installations de
CHAPITRE I : INTRODUCTION
13
haute technologie requises qui pourraient limiter son utilisation massive. En revanche, la production
des cellules OPV peut éventuellement être beaucoup plus simple avec des techniques d’impression
accessibles (roll to roll, screen printing, ink-jet printing, docteur blade, etc.) et sur des substrats de
nature plastique. Cela donnerait une souplesse considérable aux dispositifs en les rendant beaucoup
plus légers, des caractéristiques très appréciées pour beaucoup d’applications qui ne sauraient être
couvertes par les autres technologies de l’énergie solaire. En outre, les techniques d’impression
citées nécessitent peu de matière pour recouvrir de larges surfaces, permettant l’économie des
matières premières. Par conséquent, les techniques de fabrication des cellules OPV font de cette
3ème génération des candidats idéaux pour des systèmes nomades et mobiles.
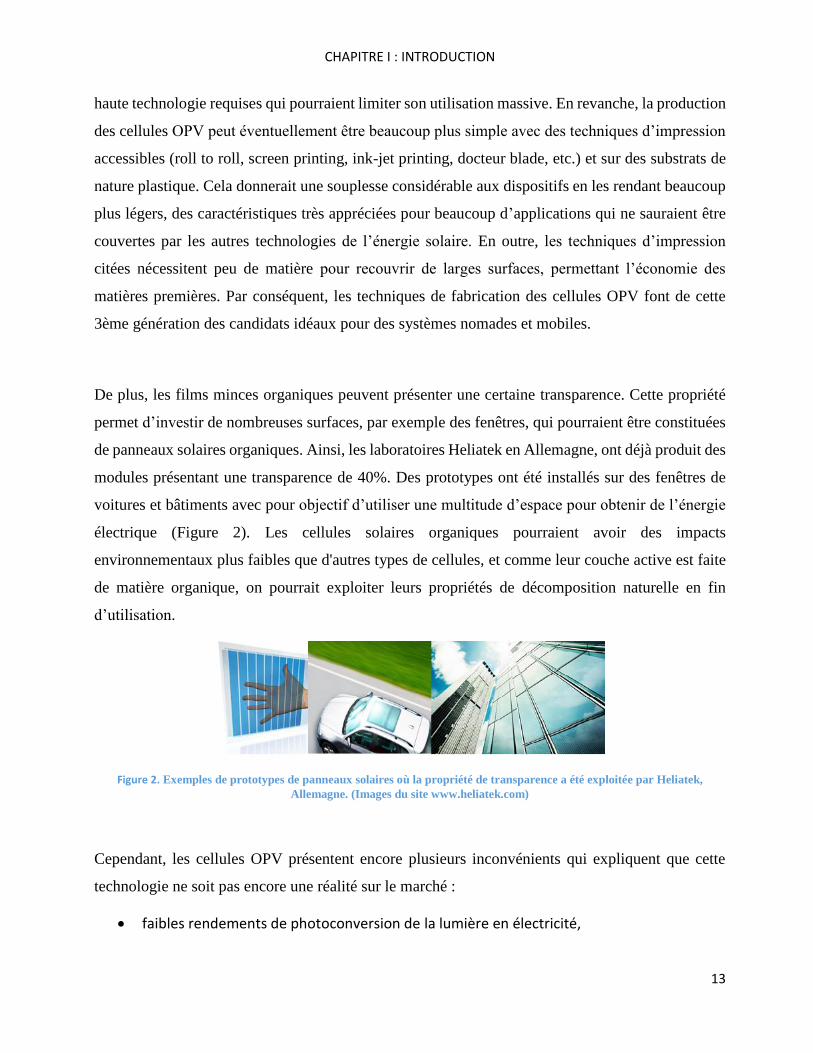
De plus, les films minces organiques peuvent présenter une certaine transparence. Cette propriété
permet d’investir de nombreuses surfaces, par exemple des fenêtres, qui pourraient être constituées
de panneaux solaires organiques. Ainsi, les laboratoires Heliatek en Allemagne, ont déjà produit des
modules présentant une transparence de 40%. Des prototypes ont été installés sur des fenêtres de
voitures et bâtiments avec pour objectif d’utiliser une multitude d’espace pour obtenir de l’énergie
électrique (Figure 2). Les cellules solaires organiques pourraient avoir des impacts
environnementaux plus faibles que d'autres types de cellules, et comme leur couche active est faite
de matière organique, on pourrait exploiter leurs propriétés de décomposition naturelle en fin
d’utilisation.
Figure 2. Exemples de prototypes de panneaux solaires où la propriété de transparence a été exploitée par Heliatek,
Allemagne. (Images du site www.heliatek.com)
Cependant, les cellules OPV présentent encore plusieurs inconvénients qui expliquent que cette
technologie ne soit pas encore une réalité sur le marché :
faibles rendements de photoconversion de la lumière en électricité,
CHAPITRE I : INTRODUCTION
14
stabilité des matériaux utilisés,
courte durée de vie des panneaux et sensibilité à l’humidité et à l’oxygène.
Cependant, cette thématique suscite toujours une quantité énorme de travaux à travers le monde, le
but étant d’obtenir de meilleurs rendements de photoconversion ainsi que de créer des molécules
organiques stables (chimiquement, thermiquement, photosensibilité, oxydation, humidité, etc.) et
performantes dont la synthèse doit être de plus en plus simple pour envisager leur production par le
secteur industriel.
Evolution de l’OPV
L’origine des cellules OPV remonte à 1959 avec les travaux de Kallmann et Pope qui ont proposé
l’utilisation de l’anthracène pour fabriquer un panneau photovoltaïque avec des rendements très
faibles.5 Une trentaine d’années plus tard, en 1986, la réalisation des premières cellules solaires
organiques bicouches a été possible grâce aux travaux de Tang avec l’obtention de rendements de
photoconversion se situant autour de 0,95%.6 Ces premiers essais ont été réalisés avec une
phthalocyanine de cuivre (donneur d’électrons) et un dérivé de pérylène tétracarboxylique
(accepteur d’électrons), tous deux étant des petites molécules.
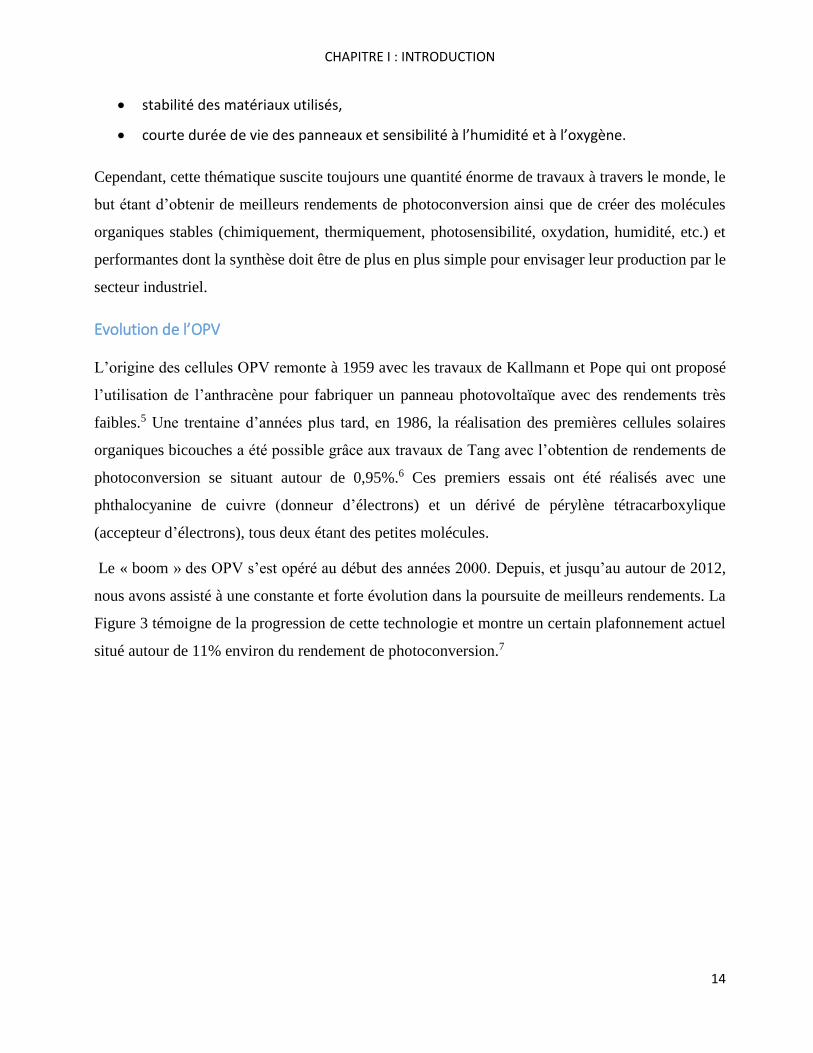
Le « boom » des OPV s’est opéré au début des années 2000. Depuis, et jusqu’au autour de 2012,
nous avons assisté à une constante et forte évolution dans la poursuite de meilleurs rendements. La
Figure 3 témoigne de la progression de cette technologie et montre un certain plafonnement actuel
situé autour de 11% environ du rendement de photoconversion.7
CHAPITRE I : INTRODUCTION
15
Figure 3. Graphique avec l’évolution des rendements de photoconversion des technologies solaires crée par le « National Center for Photovoltaics » (NCPV) du NREL, US.
Une technologie récente s’est posée en forte concurrence par rapport aux cellules OPV : il s’agit des
cellules à base de pérovskites. Les premières cellules à base de pérovskites datent de 2009 avec les
travaux de Miyasaka et collaborateurs, avec des rendements de conversion prometteurs de l’ordre
de 3.8%.8 Cette technologie dépasse aujourd’hui une efficacité de 20% avec des cellules de surface
cependant très faible, de l’ordre de 0.2 cm²- notons qu’une telle amélioration obtenue en moins de
deux ans avec les pérovskites a nécessité des décennies pour d’autres technologies de cellules
photovoltaïques. La stabilité de ces matériaux est encore à améliorer car il a encore observé une
chute de rendement de conversion lors des tests en laboratoire.9
Types, fonctionnement et constitution des cellules OPV
L’effet photovoltaïque est un processus qui conduit à produire de l'électricité à partir de l'absorption
de lumière. Les cellules solaires organiques peuvent être distinguées par la technique de production
utilisée, la nature des matériaux, leur composition et la conception du dispositif. Les deux
principales techniques de production sont le dépôt à partir d’une solution et le dépôt sous vide. Les
différentes architectures existantes consistent en une seule couche (constituée d’un matériau
CHAPITRE I : INTRODUCTION
16
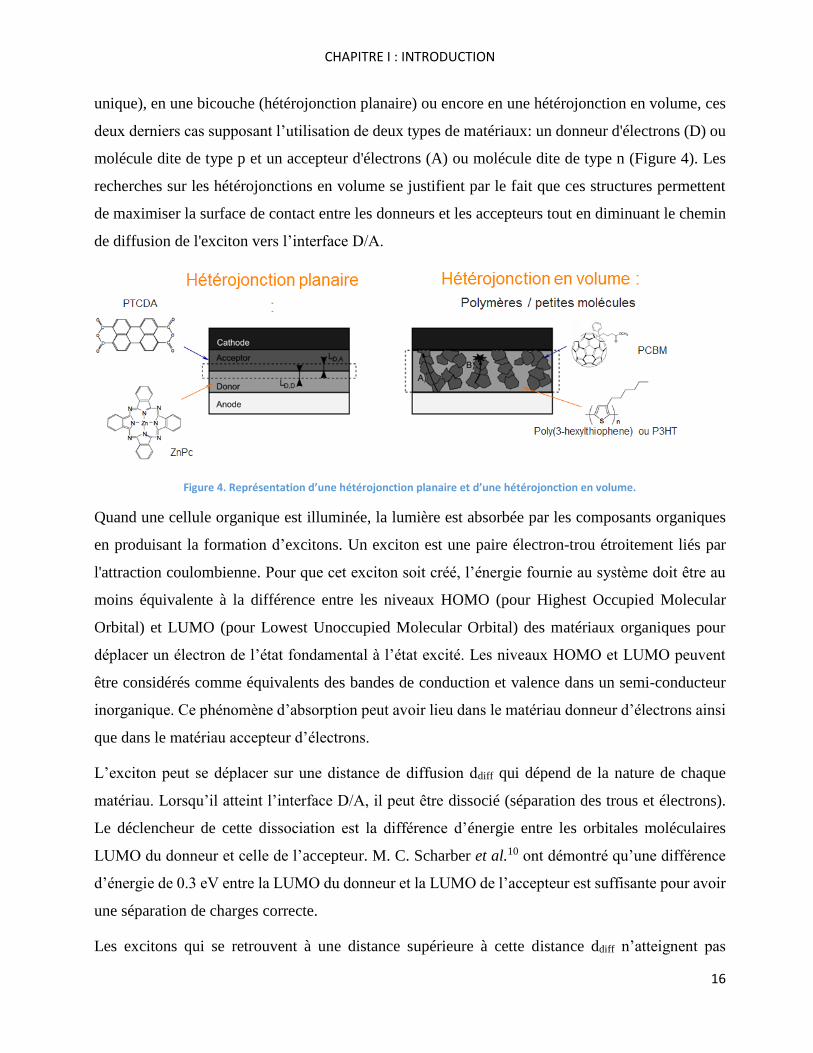
unique), en une bicouche (hétérojonction planaire) ou encore en une hétérojonction en volume, ces
deux derniers cas supposant l’utilisation de deux types de matériaux: un donneur d'électrons (D) ou
molécule dite de type p et un accepteur d'électrons (A) ou molécule dite de type n (Figure 4). Les
recherches sur les hétérojonctions en volume se justifient par le fait que ces structures permettent
de maximiser la surface de contact entre les donneurs et les accepteurs tout en diminuant le chemin
de diffusion de l'exciton vers l’interface D/A.
Figure 4. Représentation d’une hétérojonction planaire et d’une hétérojonction en volume.
Quand une cellule organique est illuminée, la lumière est absorbée par les composants organiques
en produisant la formation d’excitons. Un exciton est une paire électron-trou étroitement liés par
l'attraction coulombienne. Pour que cet exciton soit créé, l’énergie fournie au système doit être au
moins équivalente à la différence entre les niveaux HOMO (pour Highest Occupied Molecular
Orbital) et LUMO (pour Lowest Unoccupied Molecular Orbital) des matériaux organiques pour
déplacer un électron de l’état fondamental à l’état excité. Les niveaux HOMO et LUMO peuvent
être considérés comme équivalents des bandes de conduction et valence dans un semi-conducteur
inorganique. Ce phénomène d’absorption peut avoir lieu dans le matériau donneur d’électrons ainsi
que dans le matériau accepteur d’électrons.
L’exciton peut se déplacer sur une distance de diffusion ddiff qui dépend de la nature de chaque
matériau. Lorsqu’il atteint l’interface D/A, il peut être dissocié (séparation des trous et électrons).
Le déclencheur de cette dissociation est la différence d’énergie entre les orbitales moléculaires
LUMO du donneur et celle de l’accepteur. M. C. Scharber et al.10 ont démontré qu’une différence
d’énergie de 0.3 eV entre la LUMO du donneur et la LUMO de l’accepteur est suffisante pour avoir
une séparation de charges correcte.
Les excitons qui se retrouvent à une distance supérieure à cette distance ddiff n’atteignent pas
CHAPITRE I : INTRODUCTION
17
l’interface D/A et donnent lieu à des phénomènes de recombinaison. Dans les polymères π-
conjugués cette distance peut être de l’ordre de 10 nm. Par exemple dans le cas du P3HT, cette
valeur se situe autour de 3 à 7 nm selon sa nature cristalline.11
Une fois dissociés, les trous et les électrons «libres» peuvent migrer vers les électrodes respectives
et produire un courant, une différence de potentiel s’établissant aux bornes de la cellule. L'électron
est transféré à la cathode et le trou à l'anode. La mobilité des électrons et des trous ou, en d'autres
termes, la vitesse de la charge électrique par unité de champ électrique, est un autre facteur très
important pour la performance optimale de la cellule OPV. En général, les mobilités des charges
dans les semi-conducteurs organiques varient de 102 à 10-7 cm2/Vs.12 Dans les meilleurs des cas, la
mobilité des charge dans un semi-conducteur organique cristallin peut atteindre des valeurs de 0.1
à 20 cm2/Vs, cependant dans un semi-conducteur organique amorphe, cette mobilité peut diminuer
bien en dessous de 0.1 cm2/Vs.13
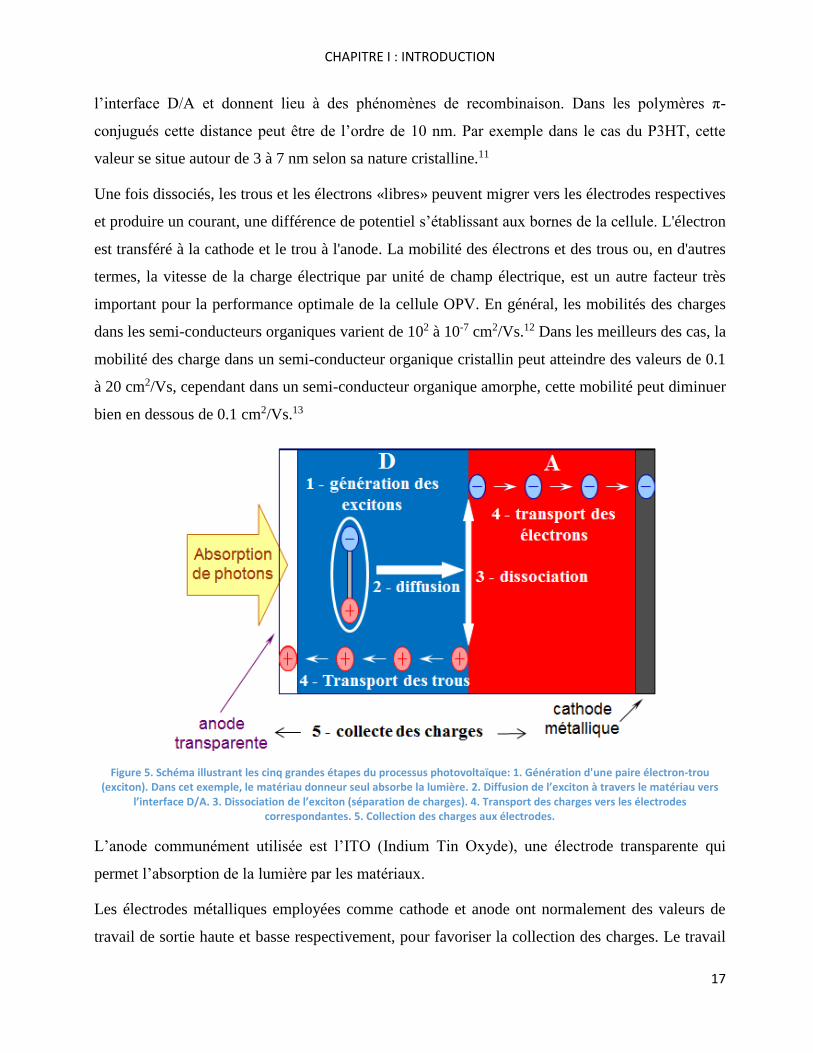
Figure 5. Schéma illustrant les cinq grandes étapes du processus photovoltaïque: 1. Génération d'une paire électron-trou (exciton). Dans cet exemple, le matériau donneur seul absorbe la lumière. 2. Diffusion de l’exciton à travers le matériau vers
l’interface D/A. 3. Dissociation de l’exciton (séparation de charges). 4. Transport des charges vers les électrodes correspondantes. 5. Collection des charges aux électrodes.
L’anode communément utilisée est l’ITO (Indium Tin Oxyde), une électrode transparente qui
permet l’absorption de la lumière par les matériaux.
Les électrodes métalliques employées comme cathode et anode ont normalement des valeurs de
travail de sortie haute et basse respectivement, pour favoriser la collection des charges. Le travail
CHAPITRE I : INTRODUCTION
18
de sortie est l'énergie nécessaire pour arracher un électron depuis le niveau de Fermi du métal
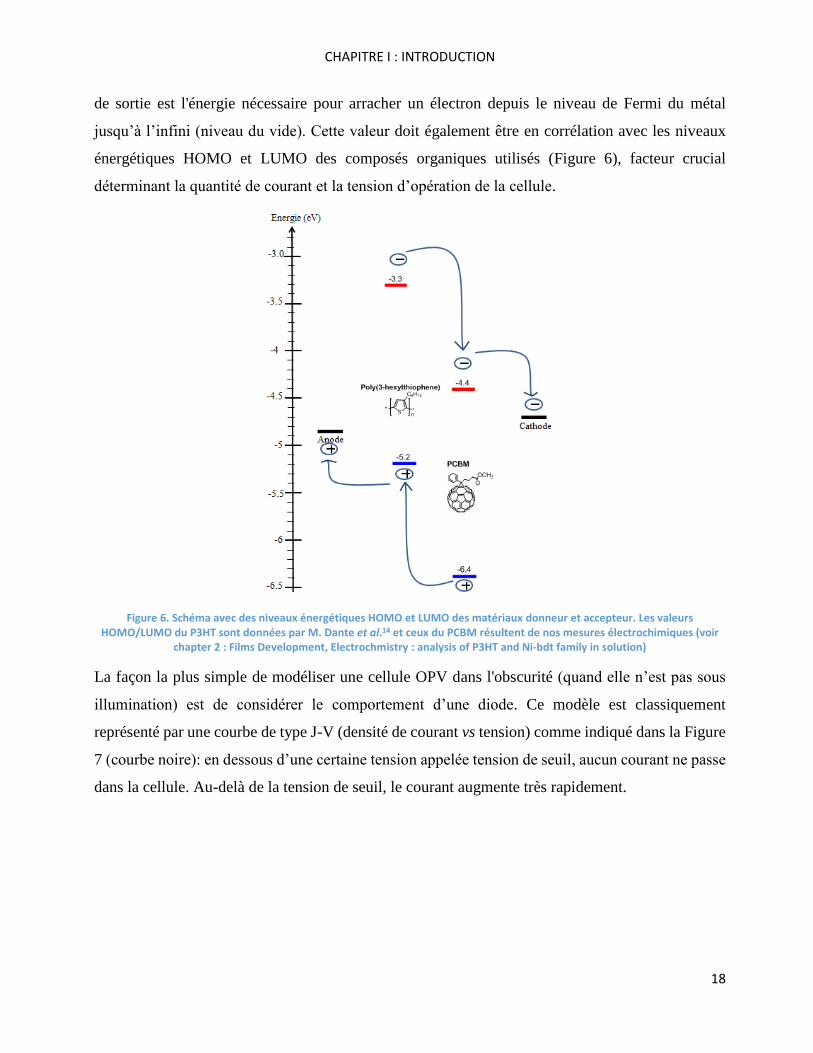
jusqu’à l’infini (niveau du vide). Cette valeur doit également être en corrélation avec les niveaux
énergétiques HOMO et LUMO des composés organiques utilisés (Figure 6), facteur crucial
déterminant la quantité de courant et la tension d’opération de la cellule.
Figure 6. Schéma avec des niveaux énergétiques HOMO et LUMO des matériaux donneur et accepteur. Les valeurs HOMO/LUMO du P3HT sont données par M. Dante et al.14 et ceux du PCBM résultent de nos mesures électrochimiques (voir
chapter 2 : Films Development, Electrochmistry : analysis of P3HT and Ni-bdt family in solution)
La façon la plus simple de modéliser une cellule OPV dans l'obscurité (quand elle n’est pas sous
illumination) est de considérer le comportement d’une diode. Ce modèle est classiquement
représenté par une courbe de type J-V (densité de courant vs tension) comme indiqué dans la Figure
7 (courbe noire): en dessous d’une certaine tension appelée tension de seuil, aucun courant ne passe
dans la cellule. Au-delà de la tension de seuil, le courant augmente très rapidement.
CHAPITRE I : INTRODUCTION
19
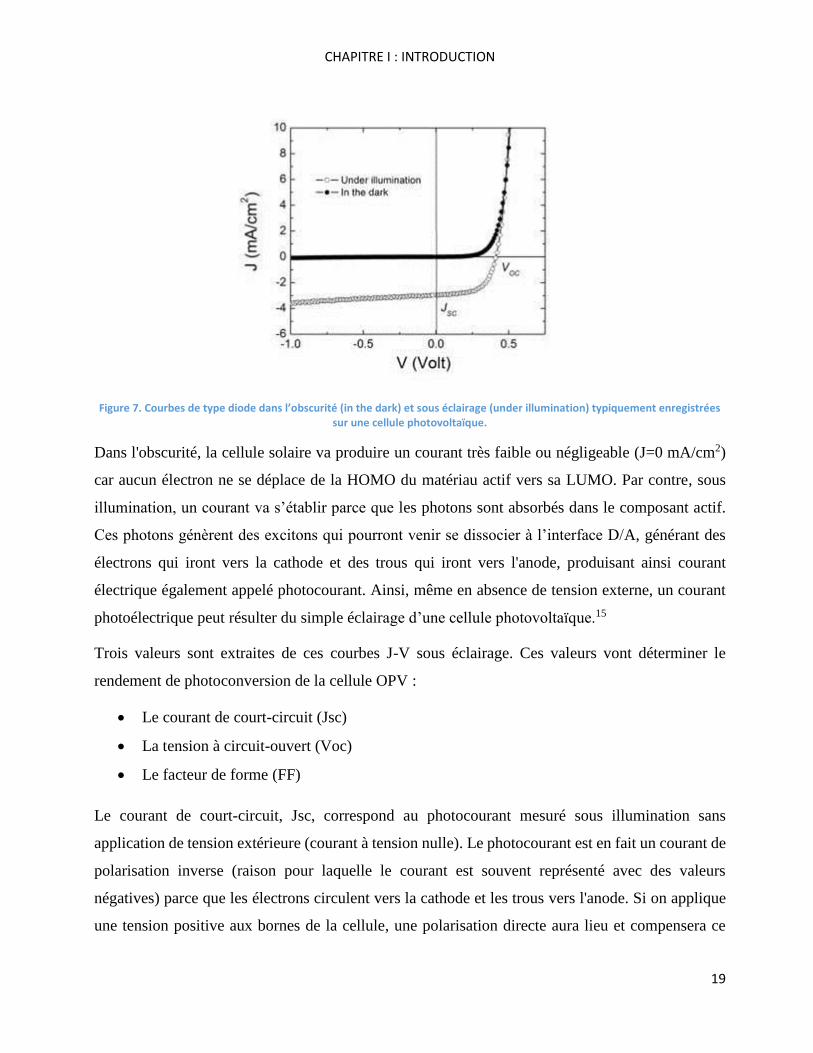
Figure 7. Courbes de type diode dans l’obscurité (in the dark) et sous éclairage (under illumination) typiquement enregistrées sur une cellule photovoltaïque.
Dans l'obscurité, la cellule solaire va produire un courant très faible ou négligeable (J=0 mA/cm2)
car aucun électron ne se déplace de la HOMO du matériau actif vers sa LUMO. Par contre, sous
illumination, un courant va s’établir parce que les photons sont absorbés dans le composant actif.
Ces photons génèrent des excitons qui pourront venir se dissocier à l’interface D/A, générant des
électrons qui iront vers la cathode et des trous qui iront vers l'anode, produisant ainsi courant
électrique également appelé photocourant. Ainsi, même en absence de tension externe, un courant
photoélectrique peut résulter du simple éclairage d’une cellule photovoltaïque.15
Trois valeurs sont extraites de ces courbes J-V sous éclairage. Ces valeurs vont déterminer le
rendement de photoconversion de la cellule OPV :
Le courant de court-circuit (Jsc)
La tension à circuit-ouvert (Voc)
Le facteur de forme (FF)
Le courant de court-circuit, Jsc, correspond au photocourant mesuré sous illumination sans
application de tension extérieure (courant à tension nulle). Le photocourant est en fait un courant de
polarisation inverse (raison pour laquelle le courant est souvent représenté avec des valeurs
négatives) parce que les électrons circulent vers la cathode et les trous vers l'anode. Si on applique
une tension positive aux bornes de la cellule, une polarisation directe aura lieu et compensera ce
CHAPITRE I : INTRODUCTION
20
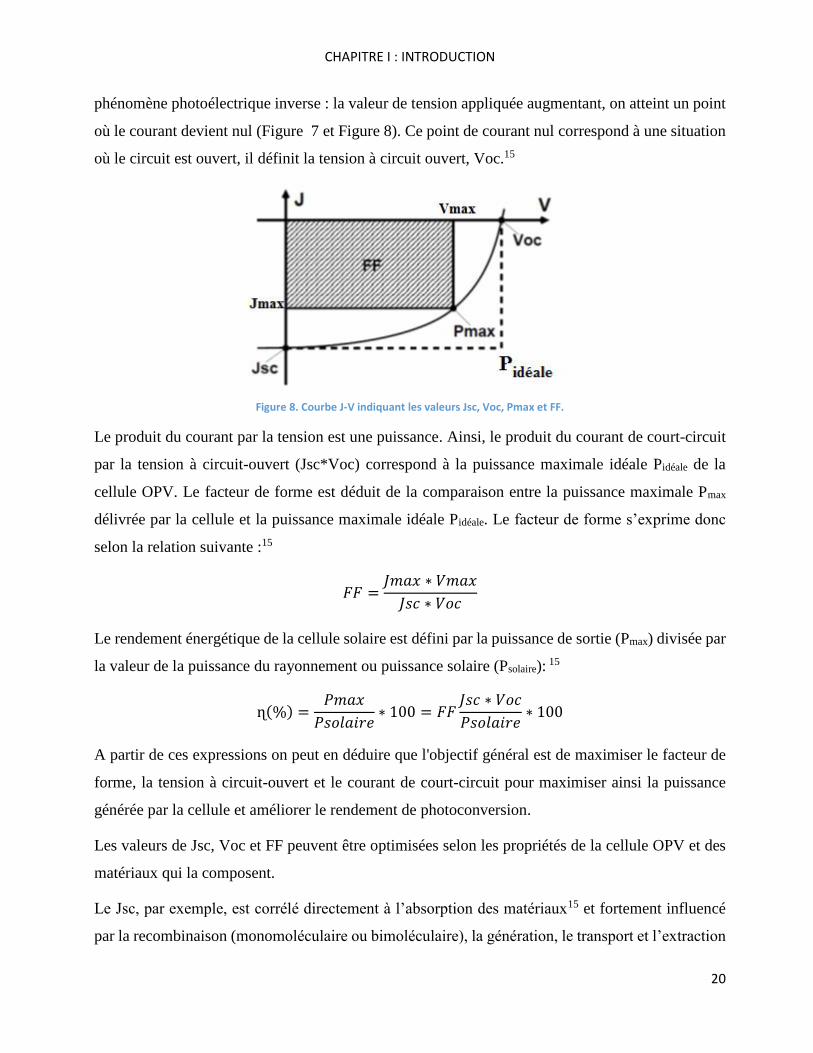
phénomène photoélectrique inverse : la valeur de tension appliquée augmentant, on atteint un point
où le courant devient nul (Figure 7 et Figure 8). Ce point de courant nul correspond à une situation
où le circuit est ouvert, il définit la tension à circuit ouvert, Voc.15
Figure 8. Courbe J-V indiquant les valeurs Jsc, Voc, Pmax et FF.
Le produit du courant par la tension est une puissance. Ainsi, le produit du courant de court-circuit
par la tension à circuit-ouvert (Jsc*Voc) correspond à la puissance maximale idéale Pidéale de la
cellule OPV. Le facteur de forme est déduit de la comparaison entre la puissance maximale Pmax
délivrée par la cellule et la puissance maximale idéale Pidéale. Le facteur de forme s’exprime donc
selon la relation suivante :15
𝐹𝐹 =𝐽𝑚𝑎𝑥 ∗ 𝑉𝑚𝑎𝑥
𝐽𝑠𝑐 ∗ 𝑉𝑜𝑐
Le rendement énergétique de la cellule solaire est défini par la puissance de sortie (Pmax) divisée par
la valeur de la puissance du rayonnement ou puissance solaire (Psolaire): 15
ɳ(%) =𝑃𝑚𝑎𝑥
𝑃𝑠𝑜𝑙𝑎𝑖𝑟𝑒∗ 100 = 𝐹𝐹
𝐽𝑠𝑐 ∗ 𝑉𝑜𝑐
𝑃𝑠𝑜𝑙𝑎𝑖𝑟𝑒∗ 100
A partir de ces expressions on peut en déduire que l'objectif général est de maximiser le facteur de
forme, la tension à circuit-ouvert et le courant de court-circuit pour maximiser ainsi la puissance
générée par la cellule et améliorer le rendement de photoconversion.
Les valeurs de Jsc, Voc et FF peuvent être optimisées selon les propriétés de la cellule OPV et des
matériaux qui la composent.
Le Jsc, par exemple, est corrélé directement à l’absorption des matériaux15 et fortement influencé
par la recombinaison (monomoléculaire ou bimoléculaire), la génération, le transport et l’extraction
CHAPITRE I : INTRODUCTION
21
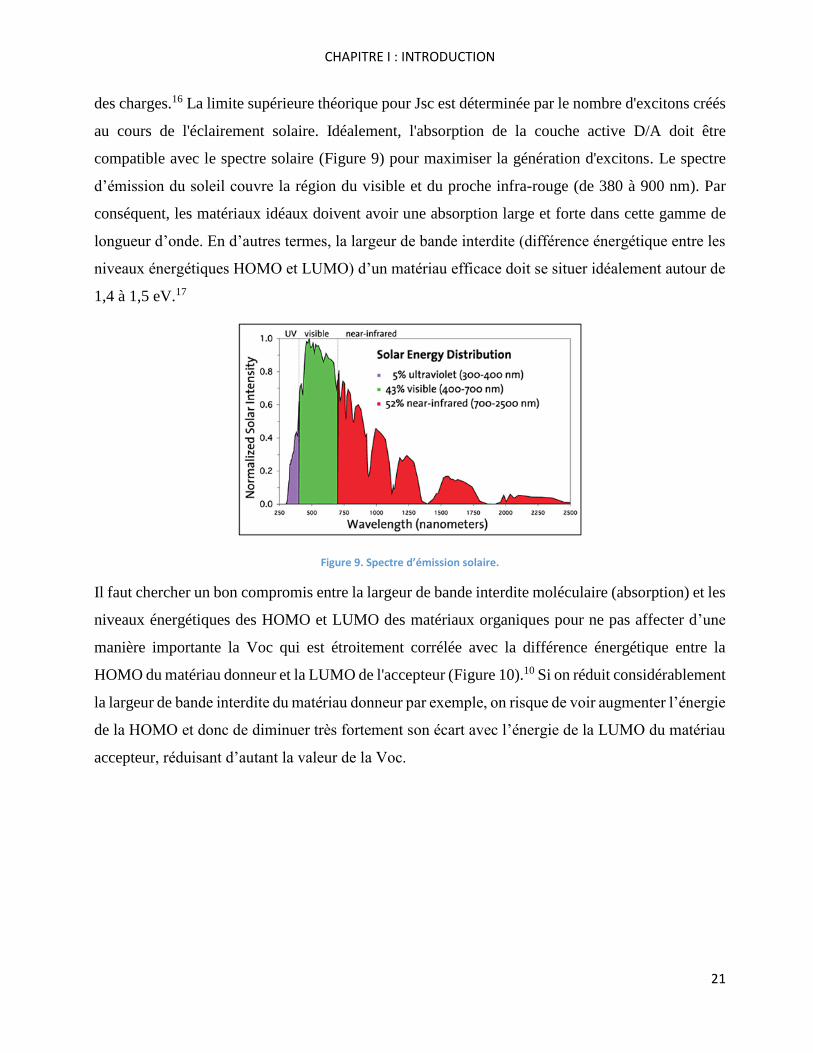
des charges.16 La limite supérieure théorique pour Jsc est déterminée par le nombre d'excitons créés
au cours de l'éclairement solaire. Idéalement, l'absorption de la couche active D/A doit être
compatible avec le spectre solaire (Figure 9) pour maximiser la génération d'excitons. Le spectre
d’émission du soleil couvre la région du visible et du proche infra-rouge (de 380 à 900 nm). Par
conséquent, les matériaux idéaux doivent avoir une absorption large et forte dans cette gamme de
longueur d’onde. En d’autres termes, la largeur de bande interdite (différence énergétique entre les
niveaux énergétiques HOMO et LUMO) d’un matériau efficace doit se situer idéalement autour de
1,4 à 1,5 eV.17
Figure 9. Spectre d’émission solaire.
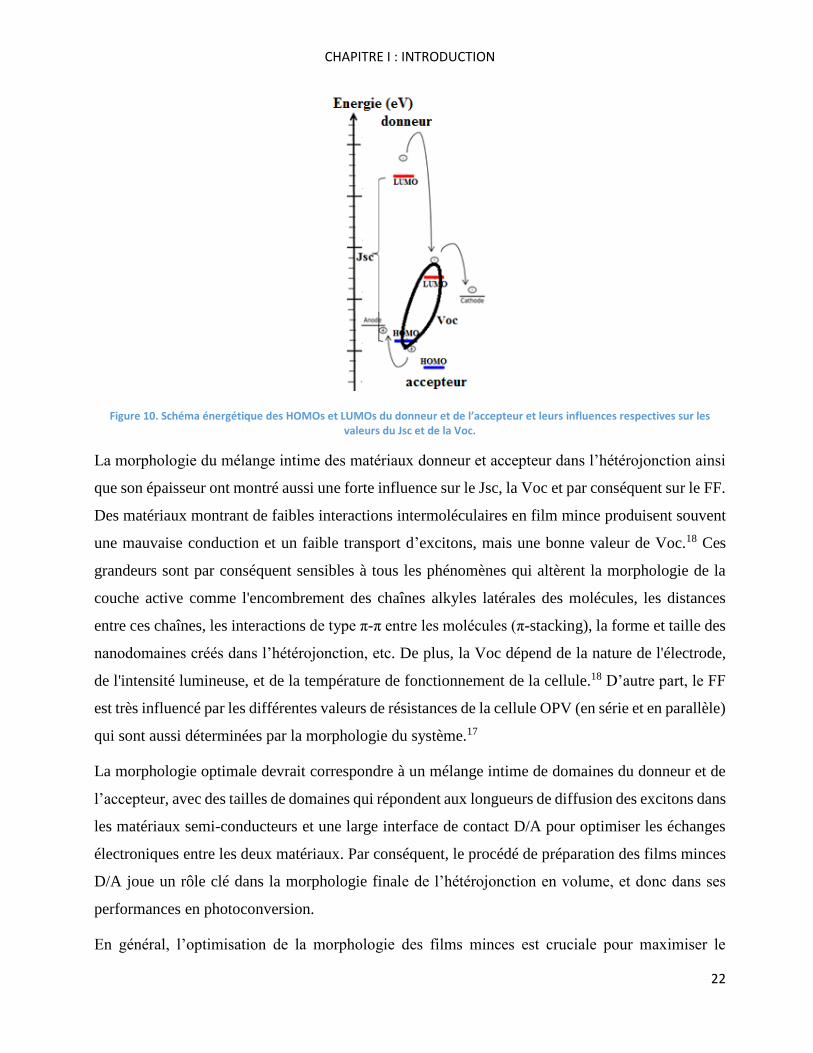
Il faut chercher un bon compromis entre la largeur de bande interdite moléculaire (absorption) et les
niveaux énergétiques des HOMO et LUMO des matériaux organiques pour ne pas affecter d’une
manière importante la Voc qui est étroitement corrélée avec la différence énergétique entre la
HOMO du matériau donneur et la LUMO de l'accepteur (Figure 10).10 Si on réduit considérablement
la largeur de bande interdite du matériau donneur par exemple, on risque de voir augmenter l’énergie
de la HOMO et donc de diminuer très fortement son écart avec l’énergie de la LUMO du matériau
accepteur, réduisant d’autant la valeur de la Voc.
CHAPITRE I : INTRODUCTION
22
Figure 10. Schéma énergétique des HOMOs et LUMOs du donneur et de l’accepteur et leurs influences respectives sur les valeurs du Jsc et de la Voc.
La morphologie du mélange intime des matériaux donneur et accepteur dans l’hétérojonction ainsi
que son épaisseur ont montré aussi une forte influence sur le Jsc, la Voc et par conséquent sur le FF.
Des matériaux montrant de faibles interactions intermoléculaires en film mince produisent souvent
une mauvaise conduction et un faible transport d’excitons, mais une bonne valeur de Voc.18 Ces
grandeurs sont par conséquent sensibles à tous les phénomènes qui altèrent la morphologie de la
couche active comme l'encombrement des chaînes alkyles latérales des molécules, les distances
entre ces chaînes, les interactions de type π-π entre les molécules (π-stacking), la forme et taille des
nanodomaines créés dans l’hétérojonction, etc. De plus, la Voc dépend de la nature de l'électrode,
de l'intensité lumineuse, et de la température de fonctionnement de la cellule.18 D’autre part, le FF
est très influencé par les différentes valeurs de résistances de la cellule OPV (en série et en parallèle)
qui sont aussi déterminées par la morphologie du système.17
La morphologie optimale devrait correspondre à un mélange intime de domaines du donneur et de
l’accepteur, avec des tailles de domaines qui répondent aux longueurs de diffusion des excitons dans
les matériaux semi-conducteurs et une large interface de contact D/A pour optimiser les échanges
électroniques entre les deux matériaux. Par conséquent, le procédé de préparation des films minces
D/A joue un rôle clé dans la morphologie finale de l’hétérojonction en volume, et donc dans ses
performances en photoconversion.
En général, l’optimisation de la morphologie des films minces est cruciale pour maximiser le
CHAPITRE I : INTRODUCTION
23
rendement de photoconversion. Il nous faut bien comprendre les facteurs influant la morphologie
qui ont un impact important sur une grande partie des propriétés électroniques des matériaux dans
les cellules OPV. En d’autres termes, le rendement de photoconversion va être déterminé par
l’arrangement des composants organiques à l’intérieur de la couche active. Nous avons examiné cet
aspect à travers une étude poussée de la morphologie de films de P3HT mélangé à une molécule
cristalline liquide capable d’induire une organisation des chaînes polymères. Ce travail original est
présenté dans le chapitre II: « Films development ».
Matériaux pour l’OPV : l’ingénierie moléculaire.
Les semi-conducteurs organiques peuvent être des polymères17,19,20 ou des « petites molécules » 21,22
(souvent en fait des oligomères) qui ont la capacité de transporter des charges avec une conductivité
électronique située entre celle des métaux et des isolants avec des valeurs entre 10-7 et 103 Scm-1.21
Un avantage des composés organiques est la facilité avec laquelle on peut effectuer des
modifications de leur structure chimique, permettant la modulation de leurs propriétés optiques,
mécaniques et électroniques.
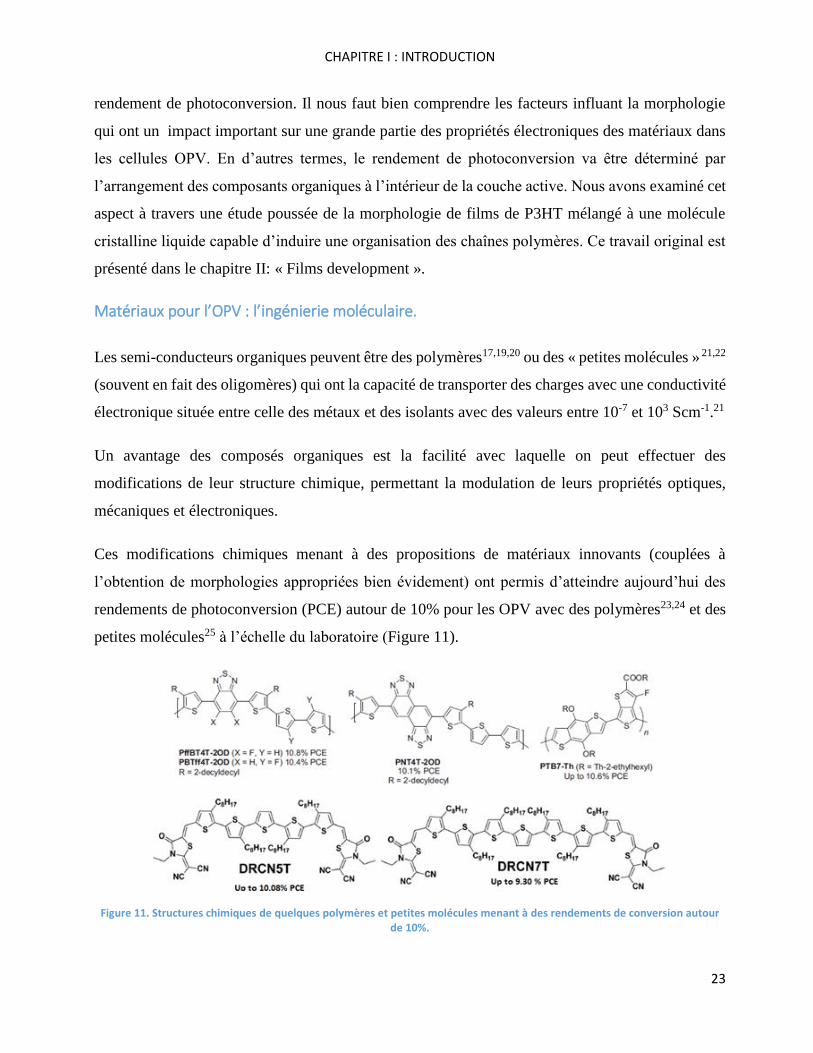
Ces modifications chimiques menant à des propositions de matériaux innovants (couplées à
l’obtention de morphologies appropriées bien évidement) ont permis d’atteindre aujourd’hui des
rendements de photoconversion (PCE) autour de 10% pour les OPV avec des polymères23,24 et des
petites molécules25 à l’échelle du laboratoire (Figure 11).
Figure 11. Structures chimiques de quelques polymères et petites molécules menant à des rendements de conversion autour de 10%.
CHAPITRE I : INTRODUCTION
24
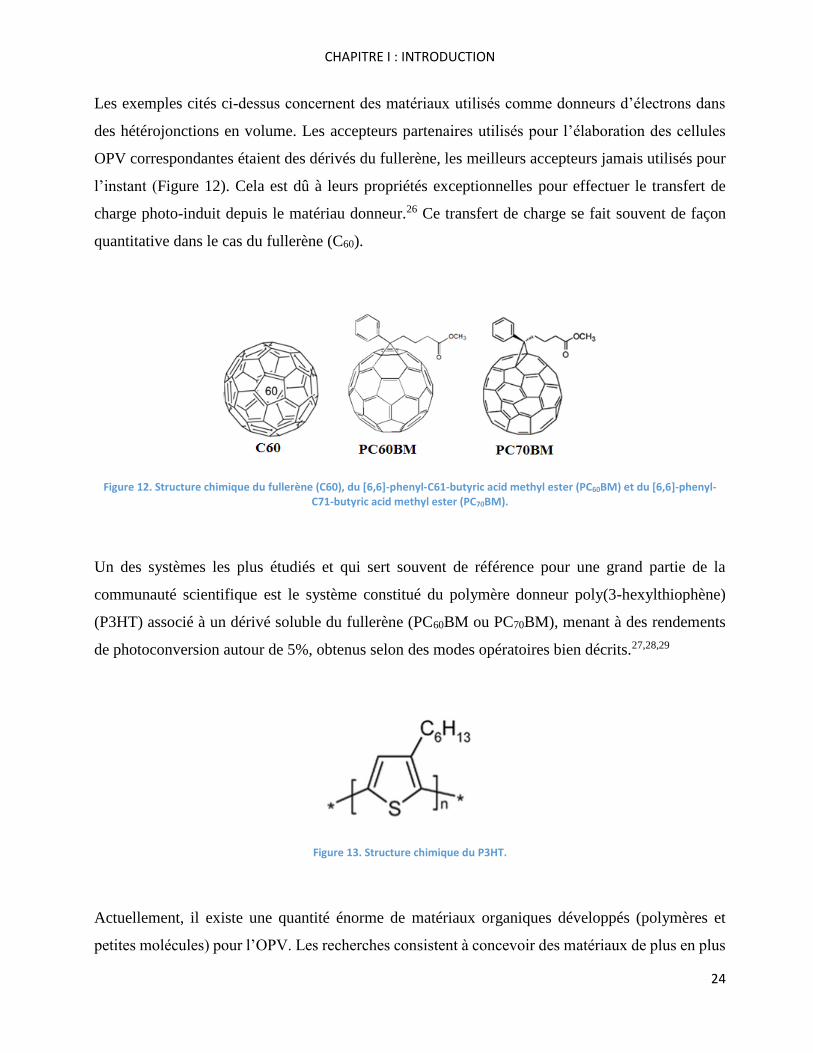
Les exemples cités ci-dessus concernent des matériaux utilisés comme donneurs d’électrons dans
des hétérojonctions en volume. Les accepteurs partenaires utilisés pour l’élaboration des cellules
OPV correspondantes étaient des dérivés du fullerène, les meilleurs accepteurs jamais utilisés pour
l’instant (Figure 12). Cela est dû à leurs propriétés exceptionnelles pour effectuer le transfert de
charge photo-induit depuis le matériau donneur.26 Ce transfert de charge se fait souvent de façon
quantitative dans le cas du fullerène (C60).
Figure 12. Structure chimique du fullerène (C60), du [6,6]-phenyl-C61-butyric acid methyl ester (PC60BM) et du [6,6]-phenyl-C71-butyric acid methyl ester (PC70BM).
Un des systèmes les plus étudiés et qui sert souvent de référence pour une grand partie de la
communauté scientifique est le système constitué du polymère donneur poly(3-hexylthiophène)
(P3HT) associé à un dérivé soluble du fullerène (PC60BM ou PC70BM), menant à des rendements
de photoconversion autour de 5%, obtenus selon des modes opératoires bien décrits.27,28,29
Figure 13. Structure chimique du P3HT.
Actuellement, il existe une quantité énorme de matériaux organiques développés (polymères et
petites molécules) pour l’OPV. Les recherches consistent à concevoir des matériaux de plus en plus
CHAPITRE I : INTRODUCTION
25
simples (en termes de voies de synthèses), les moins chers et les moins toxiques possibles. D’autre
part les recherches visent également à proposer des nouveaux systèmes qui puissent être des
alternatives innovantes vis-à-vis des semi-conducteurs organiques commerciaux (fournisseurs des
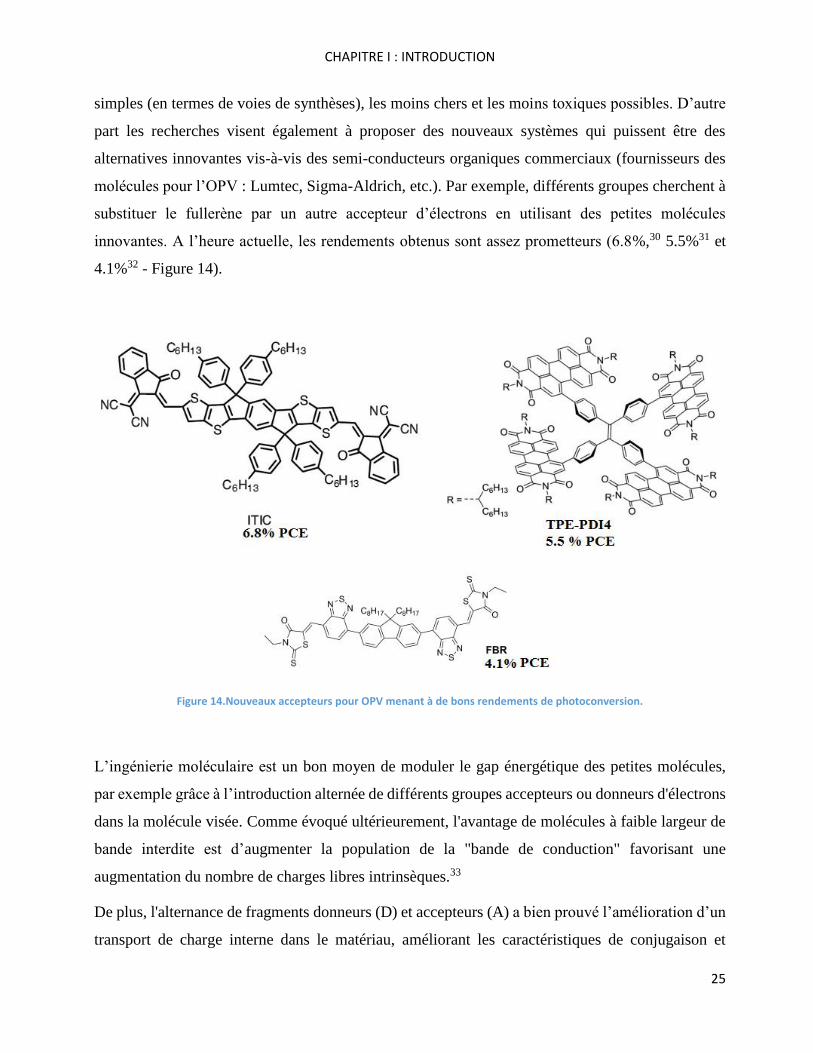
molécules pour l’OPV : Lumtec, Sigma-Aldrich, etc.). Par exemple, différents groupes cherchent à
substituer le fullerène par un autre accepteur d’électrons en utilisant des petites molécules
innovantes. A l’heure actuelle, les rendements obtenus sont assez prometteurs (6.8%,30 5.5%31 et
4.1%32 - Figure 14).
Figure 14.Nouveaux accepteurs pour OPV menant à de bons rendements de photoconversion.
L’ingénierie moléculaire est un bon moyen de moduler le gap énergétique des petites molécules,
par exemple grâce à l’introduction alternée de différents groupes accepteurs ou donneurs d'électrons
dans la molécule visée. Comme évoqué ultérieurement, l'avantage de molécules à faible largeur de
bande interdite est d’augmenter la population de la "bande de conduction" favorisant une
augmentation du nombre de charges libres intrinsèques.33
De plus, l'alternance de fragments donneurs (D) et accepteurs (A) a bien prouvé l’amélioration d’un
transport de charge interne dans le matériau, améliorant les caractéristiques de conjugaison et
CHAPITRE I : INTRODUCTION
26
l'orientation de la molécule vers une configuration plus planaire.17 L’énergie de la HOMO serait
plus influencée par le fragment donneur et celle de la LUMO par la partie acceptrice de la petite
molécule.34 Dans le cadre de la recherche pour les matériaux OPV idéaux, H. Zhou et al. ont proposé
une stratégie pour atteindre des valeurs importants au niveau de la Voc et le Jsc, en utilisant une
alternance de fragments de caractère donneur faible avec des fragments de caractère accepteur fort.
En effet, cela permet d’obtenir des molécules avec des HOMOs basses en énergie et des LUMOs
adaptées pour obtenir un faible écart électronique entre elles (faible largeur de bande).35 Parmi les
fragments donneurs les plus communs utilisés pour l’OPV, nous pouvons trouver : le thiophène, le
benzodithiophène (BDT), le dithiénosilole (DTS), le dithiénocyclopenta (DTC),
l’indacénodithiophène (IDT), le silafluorène (SFL), le fluorène (FL), le carbazole (CZ), les
phtalocyanines, etc.17 Pour les accepteurs on peut trouver des fragments moléculaires comme les
suivants: le benzothiadiazole, le dicyanovinyle, le cyanoacetate d’alkyle, la rhodanine, le 1,3-
indanedione, etc.17,36,37,38
Dans le troisième chapitre de ce travail « Molecular Engineering », nous présentons nos travaux de
conception et synthèse de trois molécules en suivant cette philosophie d’alternance de groupes
donneurs et accepteurs (A-D-A-D-A et A-D-A-D-A-D-A) afin de moduler leurs niveaux
électroniques.
Objectifs : de l’étude de la morphologie et transfert de charges en films minces à la
conception de nouvelles molécules pour l’OPV.
Un des objectifs de ce travail vient de la dernière conclusion qui consiste à comprendre
l'organisation moléculaire au sein des films minces organiques et son impact sur le transfert de
charge entre les matériaux afin d’optimiser les rendements de photoconversion.
CHAPITRE I : INTRODUCTION
27
Matériaux organiques solubles pour l’élaboration des films minces.
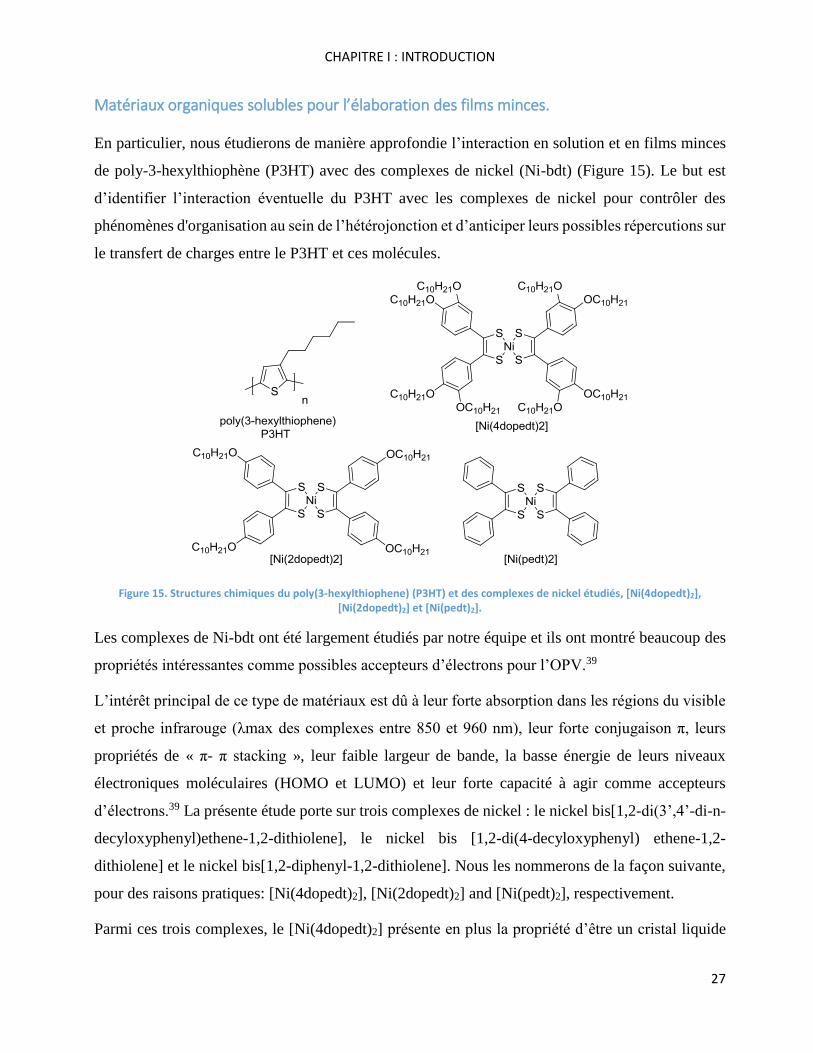
En particulier, nous étudierons de manière approfondie l’interaction en solution et en films minces
de poly-3-hexylthiophène (P3HT) avec des complexes de nickel (Ni-bdt) (Figure 15). Le but est
d’identifier l’interaction éventuelle du P3HT avec les complexes de nickel pour contrôler des
phénomènes d'organisation au sein de l’hétérojonction et d’anticiper leurs possibles répercutions sur
le transfert de charges entre le P3HT et ces molécules.
Figure 15. Structures chimiques du poly(3-hexylthiophene) (P3HT) et des complexes de nickel étudiés, [Ni(4dopedt)2], [Ni(2dopedt)2] et [Ni(pedt)2].
Les complexes de Ni-bdt ont été largement étudiés par notre équipe et ils ont montré beaucoup des
propriétés intéressantes comme possibles accepteurs d’électrons pour l’OPV.39
L’intérêt principal de ce type de matériaux est dû à leur forte absorption dans les régions du visible
et proche infrarouge (λmax des complexes entre 850 et 960 nm), leur forte conjugaison π, leurs
propriétés de « π- π stacking », leur faible largeur de bande, la basse énergie de leurs niveaux
électroniques moléculaires (HOMO et LUMO) et leur forte capacité à agir comme accepteurs
d’électrons.39 La présente étude porte sur trois complexes de nickel : le nickel bis[1,2-di(3’,4’-di-n-
decyloxyphenyl)ethene-1,2-dithiolene], le nickel bis [1,2-di(4-decyloxyphenyl) ethene-1,2-
dithiolene] et le nickel bis[1,2-diphenyl-1,2-dithiolene]. Nous les nommerons de la façon suivante,
pour des raisons pratiques: [Ni(4dopedt)2], [Ni(2dopedt)2] and [Ni(pedt)2], respectivement.
Parmi ces trois complexes, le [Ni(4dopedt)2] présente en plus la propriété d’être un cristal liquide
CHAPITRE I : INTRODUCTION
28
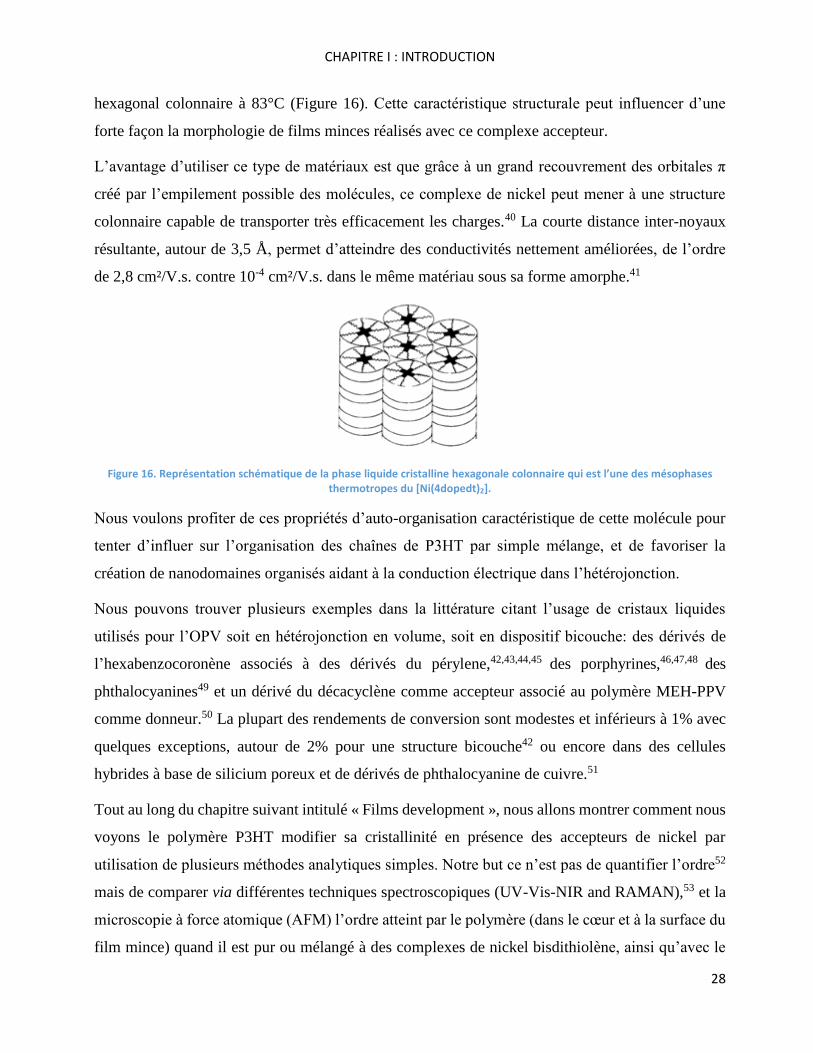
hexagonal colonnaire à 83°C (Figure 16). Cette caractéristique structurale peut influencer d’une
forte façon la morphologie de films minces réalisés avec ce complexe accepteur.
L’avantage d’utiliser ce type de matériaux est que grâce à un grand recouvrement des orbitales π
créé par l’empilement possible des molécules, ce complexe de nickel peut mener à une structure
colonnaire capable de transporter très efficacement les charges.40 La courte distance inter-noyaux
résultante, autour de 3,5 Å, permet d’atteindre des conductivités nettement améliorées, de l’ordre
de 2,8 cm²/V.s. contre 10-4 cm²/V.s. dans le même matériau sous sa forme amorphe.41
Figure 16. Représentation schématique de la phase liquide cristalline hexagonale colonnaire qui est l’une des mésophases thermotropes du [Ni(4dopedt)2].
Nous voulons profiter de ces propriétés d’auto-organisation caractéristique de cette molécule pour
tenter d’influer sur l’organisation des chaînes de P3HT par simple mélange, et de favoriser la
création de nanodomaines organisés aidant à la conduction électrique dans l’hétérojonction.
Nous pouvons trouver plusieurs exemples dans la littérature citant l’usage de cristaux liquides
utilisés pour l’OPV soit en hétérojonction en volume, soit en dispositif bicouche: des dérivés de
l’hexabenzocoronène associés à des dérivés du pérylene,42,43,44,45 des porphyrines,46,47,48 des
phthalocyanines49 et un dérivé du décacyclène comme accepteur associé au polymère MEH-PPV
comme donneur.50 La plupart des rendements de conversion sont modestes et inférieurs à 1% avec
quelques exceptions, autour de 2% pour une structure bicouche42 ou encore dans des cellules
hybrides à base de silicium poreux et de dérivés de phthalocyanine de cuivre.51
Tout au long du chapitre suivant intitulé « Films development », nous allons montrer comment nous
voyons le polymère P3HT modifier sa cristallinité en présence des accepteurs de nickel par
utilisation de plusieurs méthodes analytiques simples. Notre but ce n’est pas de quantifier l’ordre52
mais de comparer via différentes techniques spectroscopiques (UV-Vis-NIR and RAMAN),53 et la
microscopie à force atomique (AFM) l’ordre atteint par le polymère (dans le cœur et à la surface du
film mince) quand il est pur ou mélangé à des complexes de nickel bisdithiolène, ainsi qu’avec le
CHAPITRE I : INTRODUCTION
29
PC60BM utilisé comme matériau accepteur de référence. En outre, ces changements morphologiques
du P3HT affecteront comme nous l’avons bien mentionné le possible transfert de charge entre
matériaux, et nous mettrons évidence ces modifications par utilisation de la spectroscopie de
fluorescence, l’électrochimie et la microscopie à sonde de Kelvin (ou Kelvin Probe Force
Microscopy, KPFM). Toutes ces études ont été réalisées en collaboration avec plusieurs laboratoires
toulousains, le LAAS (Isabelle Séguy et Elena Bedel), le LAPLACE (Christina Villeneuve) et le
LCPQ (Fabienne Alary et Jean-Louis Heully).
Nous terminerons ce deuxième chapitre avec la description d’une première utilisation en cellules
photovoltaïques prototypes à base de P3HT comme donneur d’électrons et du complexe de nickel
[Ni(4dopedt)2] comme accepteur, en hétérojonction en volume.
Conception et synthèse de molécules pour l’OPV
Le deuxième objectif de ce travail de thèse consistait à concevoir et synthétiser des molécules
originales présentant des niveaux énergétiques (HOMO et LUMO) adaptés à ceux des complexes
de nickel : [Ni(4dopedt)2], [Ni(2dopedt)2] et [Ni(pedt)2]. Le but était de mettre à profit nos
connaissances sur l’organisation induite par l’utilisation de ces molécules pour élaborer des cellules
photovoltaïques originales.
Nous avons opté pour l’utilisation de petites molécules plutôt que de polymères car du point de vue
chimique, les petites molécules ont des structures bien définies et sont synthétiquement bien
reproductibles,21 au contraire du cas des polymères qui mènent souvent à des résultats variant en
fonction du lot synthétisé.
D’autre part, grâce à l'ingénierie moléculaire on peut obtenir des molécules basées sur l’alternance
de fragments donneurs et accepteurs d’électrons pour obtenir des valeurs de gap électronique
optimales et conduisant à des dispositifs aux paramètres de photoconversion optimisés. Pour arriver
à alterner ces fragments nous avons utilisé plusieurs méthodes de couplage : le couplage de Suzuki,
le couplage de Stille et l’hétéroarylation directe que nous présentons en annexe de ce mémoire.
Elaboration des prototypes de cellules organiques
Le quatrième et dernier chapitre intitulé « Molecules characterization and OPV devices » consiste
en la caractérisation complète des molécules présentées dans le chapitre précédent. Les différentes
techniques analytiques utilisées ont été la spectroscopie d’absorption UV-visible, la fluorescence,

CHAPITRE I : INTRODUCTION
30
la résonance magnétique nucléaire (RMN), la spectroscopie de masse, l'électrochimie, l'analyse
thermogravimétrique (TGA) et la calorimétrie différentielle à balayage (DSC). Finalement, nous
avons élaboré plusieurs dispositifs OPV avec les molécules qui ont mené à des résultats prometteurs.

CHAPTER II: FILMS DEVELOPMENT
31
Chapter II: Films Development

CHAPTER II: FILMS DEVELOPMENT
32
CHAPTER II: FILMS DEVELOPMENT
33
Films Development
Introduction
Optoelectronic properties of semiconducting polymeric/small molecules materials are highly
influenced by molecules organisation.54,55,56 In particular, the photoconversion efficiency of organic
devices may be correlated directly to their blend morphology.57 Therefore, a better understanding
of the blend film morphology evolution during postproduction treatment and device performance is
essential and needed.58 The study of molecules ordering is fundamental to understanding molecules
organisation and its influence on their semiconducting behaviour in organic electronics.
For instance, conjugated polymers such as poly(3-hexylthiophene) (P3HT) in its regioregular form
can display a high degree of molecular order as a result of the π-π interactions of thiophene moieties
(π-π stacking).59 This polymer organisation is crucial to potentially define P3HT as a good candidate
in Organic Photovoltaics. Moreover, many different organic-organic heterojunctions (OOHs) have
been reported and studied worldwide for their use in organic photovoltaics (OPV).60,61,62 A detailed
understanding of OOH electronic and morphological characteristics is therefore of high interest for
the control and optimisation of organic-based devices. Recently, electronic structures have been
studied at interfaces in bulk heterojunctions (BHJs) as part of an emerging research, with the
majority of works concerning poly(3-hexyl-thiophene) (P3HT)-fullerene systems.63,64
In the present work, we present a comprehensive study in solution and on thin films of pristine
P3HT and of some nickel bisdithiolene complexes (Ni-bdt), and their blends, in order to understand
how P3HT interacts with the nickel core with the aim of understanding eventual organisation
phenomena. The main goal of this study is to understand materials organisation and the charge
transfer effect between donor and acceptor molecules, rather than focusing on high photoconversion
yields.
The thin films elaboration by spin coating was realised in collaboration with Isabelle Séguy, from
LAAS-CNRS laboratory.
The different analytical techniques used for this study were UV-Visible-NIR and RAMAN
spectroscopies as well as Atomic Force Microscopy (AFM). For charge transfer phenomena, we
used Electrochemistry, Fluorescence and Kelvin Probe Force Microscopy (KFM).
CHAPTER II: FILMS DEVELOPMENT
34
Nickel complexes were chosen for this work because they present interesting particularities for their
use as electron acceptors in OPV, such as a strong absorption in the vis-NIR region, π-conjugation,
π-π stacking properties, low band gap, low energy levels and electron acceptor capacity. We worked
with three nickel complexes: nickel bis[1,2-di(3’,4’-di-n-decyloxyphenyl)ethene-1,2-dithiolene],
nickel bis[1,2-di(4-decyloxyphenyl) ethene-1,2-dithiolene], and nickel bis[1,2-diphenyl-1,2-
dithiolene]. These will be referred to as [Ni(4dopedt)2], [Ni(2dopedt)2] and [Ni(pedt)2], respectively,
for practical reasons.
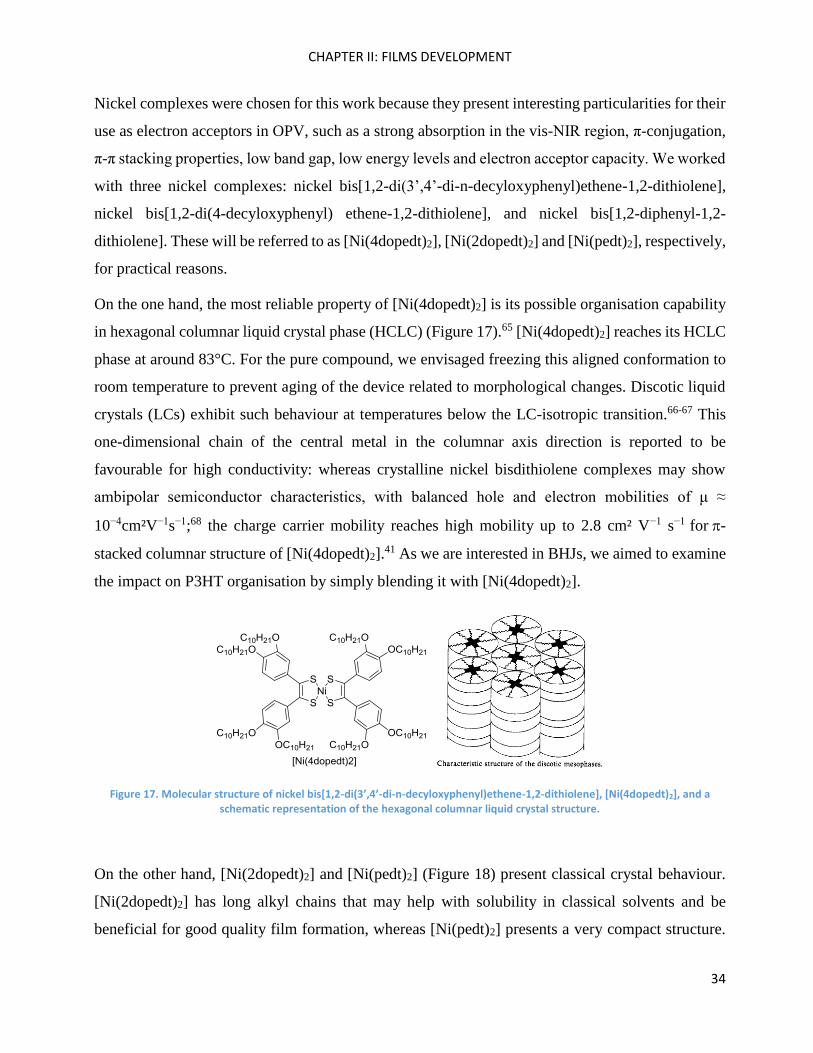
On the one hand, the most reliable property of [Ni(4dopedt)2] is its possible organisation capability
in hexagonal columnar liquid crystal phase (HCLC) (Figure 17).65 [Ni(4dopedt)2] reaches its HCLC
phase at around 83°C. For the pure compound, we envisaged freezing this aligned conformation to
room temperature to prevent aging of the device related to morphological changes. Discotic liquid
crystals (LCs) exhibit such behaviour at temperatures below the LC-isotropic transition.66-67 This
one-dimensional chain of the central metal in the columnar axis direction is reported to be
favourable for high conductivity: whereas crystalline nickel bisdithiolene complexes may show
ambipolar semiconductor characteristics, with balanced hole and electron mobilities of μ ≈
10−4cm²V−1s−1;68 the charge carrier mobility reaches high mobility up to 2.8 cm² V−1 s−1 for-
stacked columnar structure of [Ni(4dopedt)2].41 As we are interested in BHJs, we aimed to examine
the impact on P3HT organisation by simply blending it with [Ni(4dopedt)2].
Figure 17. Molecular structure of nickel bis[1,2-di(3’,4’-di-n-decyloxyphenyl)ethene-1,2-dithiolene], [Ni(4dopedt)2], and a schematic representation of the hexagonal columnar liquid crystal structure.
On the other hand, [Ni(2dopedt)2] and [Ni(pedt)2] (Figure 18) present classical crystal behaviour.
[Ni(2dopedt)2] has long alkyl chains that may help with solubility in classical solvents and be
beneficial for good quality film formation, whereas [Ni(pedt)2] presents a very compact structure.
CHAPTER II: FILMS DEVELOPMENT
35
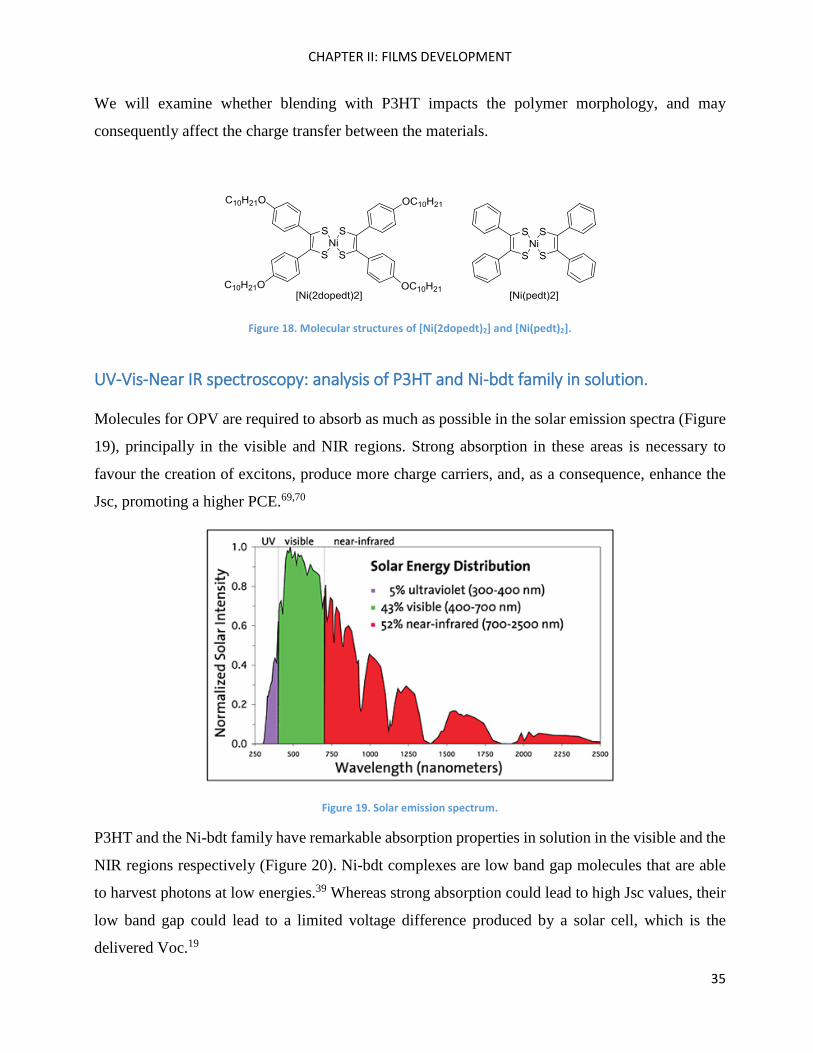
We will examine whether blending with P3HT impacts the polymer morphology, and may
consequently affect the charge transfer between the materials.
Figure 18. Molecular structures of [Ni(2dopedt)2] and [Ni(pedt)2].
UV-Vis-Near IR spectroscopy: analysis of P3HT and Ni-bdt family in solution.
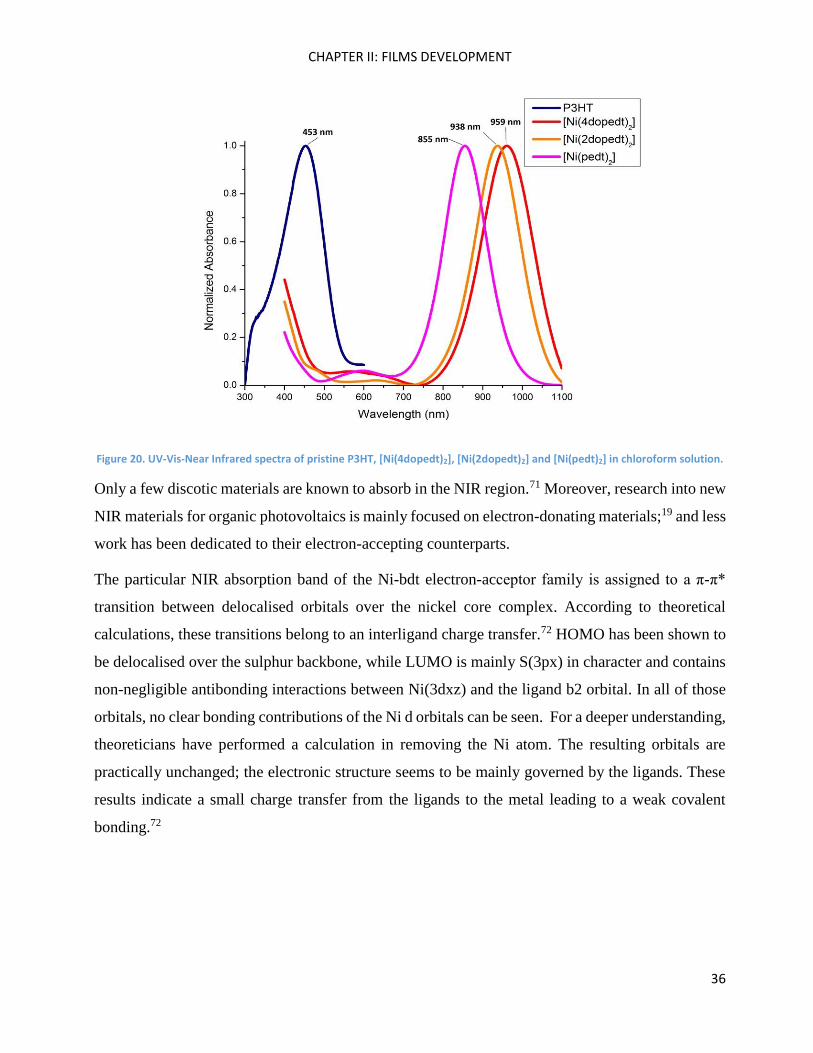
Molecules for OPV are required to absorb as much as possible in the solar emission spectra (Figure
19), principally in the visible and NIR regions. Strong absorption in these areas is necessary to
favour the creation of excitons, produce more charge carriers, and, as a consequence, enhance the
Jsc, promoting a higher PCE.69,70
Figure 19. Solar emission spectrum.
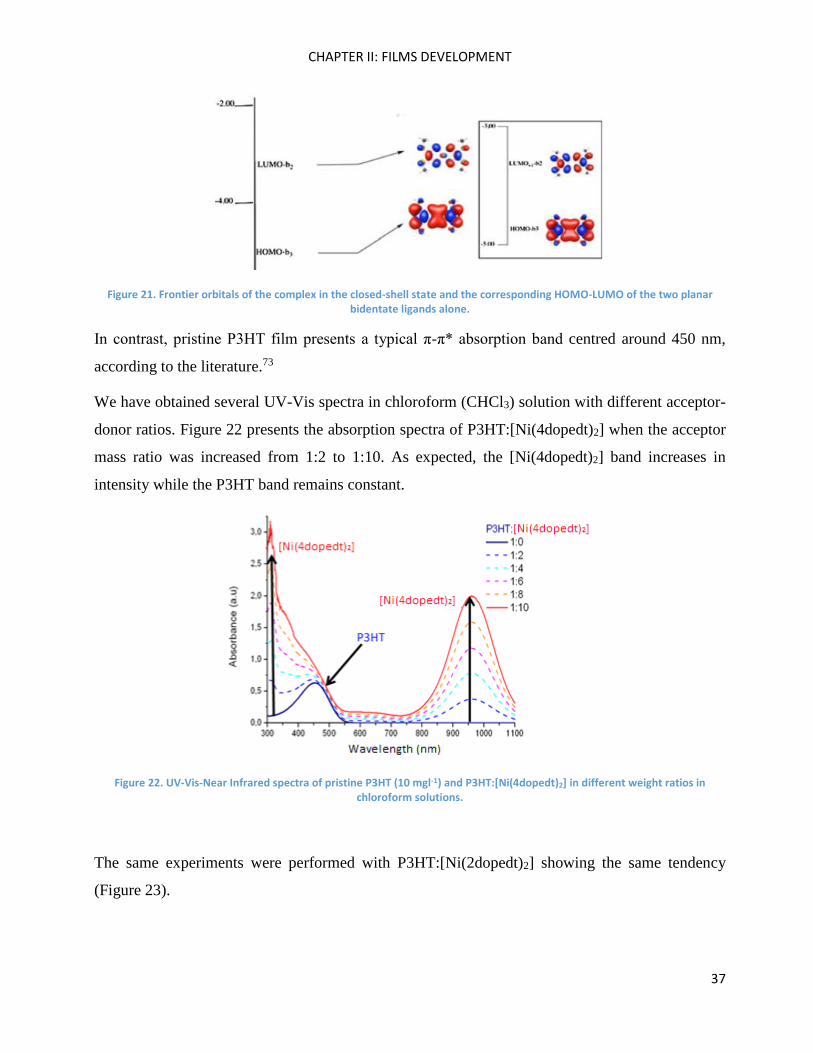
P3HT and the Ni-bdt family have remarkable absorption properties in solution in the visible and the
NIR regions respectively (Figure 20). Ni-bdt complexes are low band gap molecules that are able
to harvest photons at low energies.39 Whereas strong absorption could lead to high Jsc values, their
low band gap could lead to a limited voltage difference produced by a solar cell, which is the
delivered Voc.19
CHAPTER II: FILMS DEVELOPMENT
36
Figure 20. UV-Vis-Near Infrared spectra of pristine P3HT, [Ni(4dopedt)2], [Ni(2dopedt)2] and [Ni(pedt)2] in chloroform solution.
Only a few discotic materials are known to absorb in the NIR region.71 Moreover, research into new
NIR materials for organic photovoltaics is mainly focused on electron-donating materials;19 and less
work has been dedicated to their electron-accepting counterparts.
The particular NIR absorption band of the Ni-bdt electron-acceptor family is assigned to a π-π*
transition between delocalised orbitals over the nickel core complex. According to theoretical
calculations, these transitions belong to an interligand charge transfer.72 HOMO has been shown to
be delocalised over the sulphur backbone, while LUMO is mainly S(3px) in character and contains
non-negligible antibonding interactions between Ni(3dxz) and the ligand b2 orbital. In all of those
orbitals, no clear bonding contributions of the Ni d orbitals can be seen. For a deeper understanding,
theoreticians have performed a calculation in removing the Ni atom. The resulting orbitals are
practically unchanged; the electronic structure seems to be mainly governed by the ligands. These
results indicate a small charge transfer from the ligands to the metal leading to a weak covalent
bonding.72
CHAPTER II: FILMS DEVELOPMENT
37
Figure 21. Frontier orbitals of the complex in the closed-shell state and the corresponding HOMO-LUMO of the two planar bidentate ligands alone.
In contrast, pristine P3HT film presents a typical π-π* absorption band centred around 450 nm,
according to the literature.73
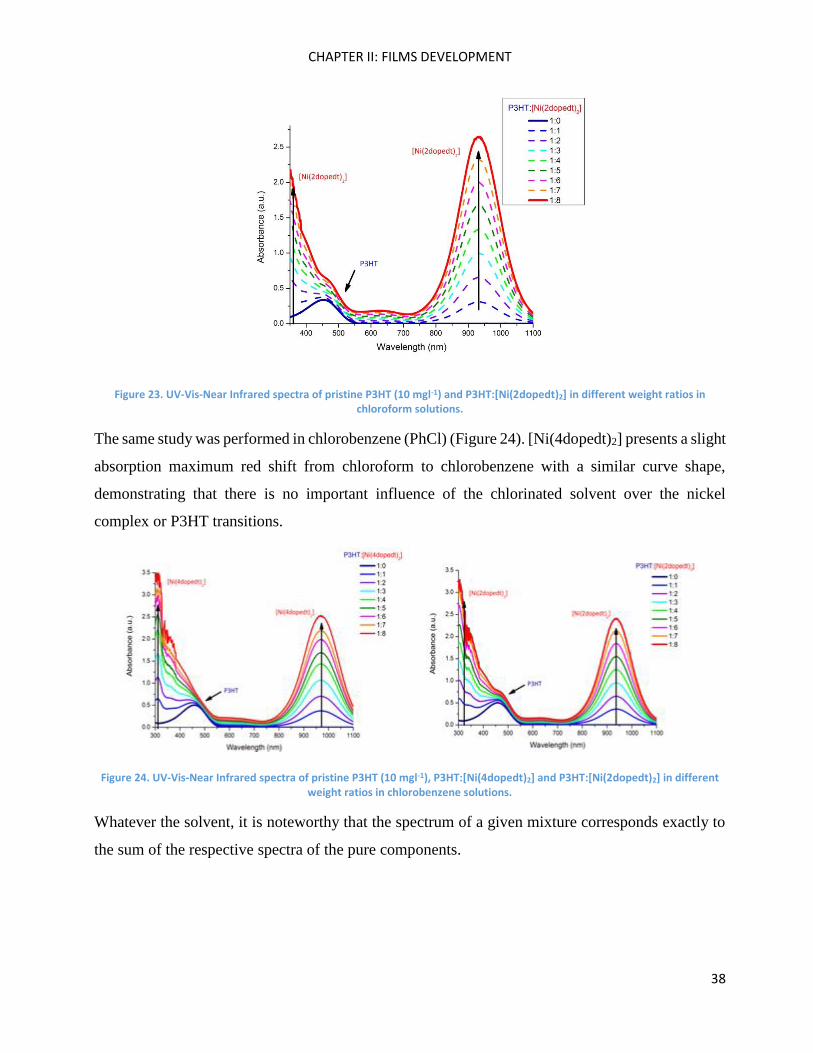
We have obtained several UV-Vis spectra in chloroform (CHCl3) solution with different acceptor-
donor ratios. Figure 22 presents the absorption spectra of P3HT:[Ni(4dopedt)2] when the acceptor
mass ratio was increased from 1:2 to 1:10. As expected, the [Ni(4dopedt)2] band increases in
intensity while the P3HT band remains constant.
Figure 22. UV-Vis-Near Infrared spectra of pristine P3HT (10 mgl-1) and P3HT:[Ni(4dopedt)2] in different weight ratios in chloroform solutions.
The same experiments were performed with P3HT:[Ni(2dopedt)2] showing the same tendency
(Figure 23).
CHAPTER II: FILMS DEVELOPMENT
38
Figure 23. UV-Vis-Near Infrared spectra of pristine P3HT (10 mgl-1) and P3HT:[Ni(2dopedt)2] in different weight ratios in chloroform solutions.
The same study was performed in chlorobenzene (PhCl) (Figure 24). [Ni(4dopedt)2] presents a slight
absorption maximum red shift from chloroform to chlorobenzene with a similar curve shape,
demonstrating that there is no important influence of the chlorinated solvent over the nickel
complex or P3HT transitions.
Figure 24. UV-Vis-Near Infrared spectra of pristine P3HT (10 mgl-1), P3HT:[Ni(4dopedt)2] and P3HT:[Ni(2dopedt)2] in different weight ratios in chlorobenzene solutions.
Whatever the solvent, it is noteworthy that the spectrum of a given mixture corresponds exactly to
the sum of the respective spectra of the pure components.
CHAPTER II: FILMS DEVELOPMENT
39
UV-Vis-Near IR spectroscopy: analysis of P3HT and Ni-bdt family in thin films.
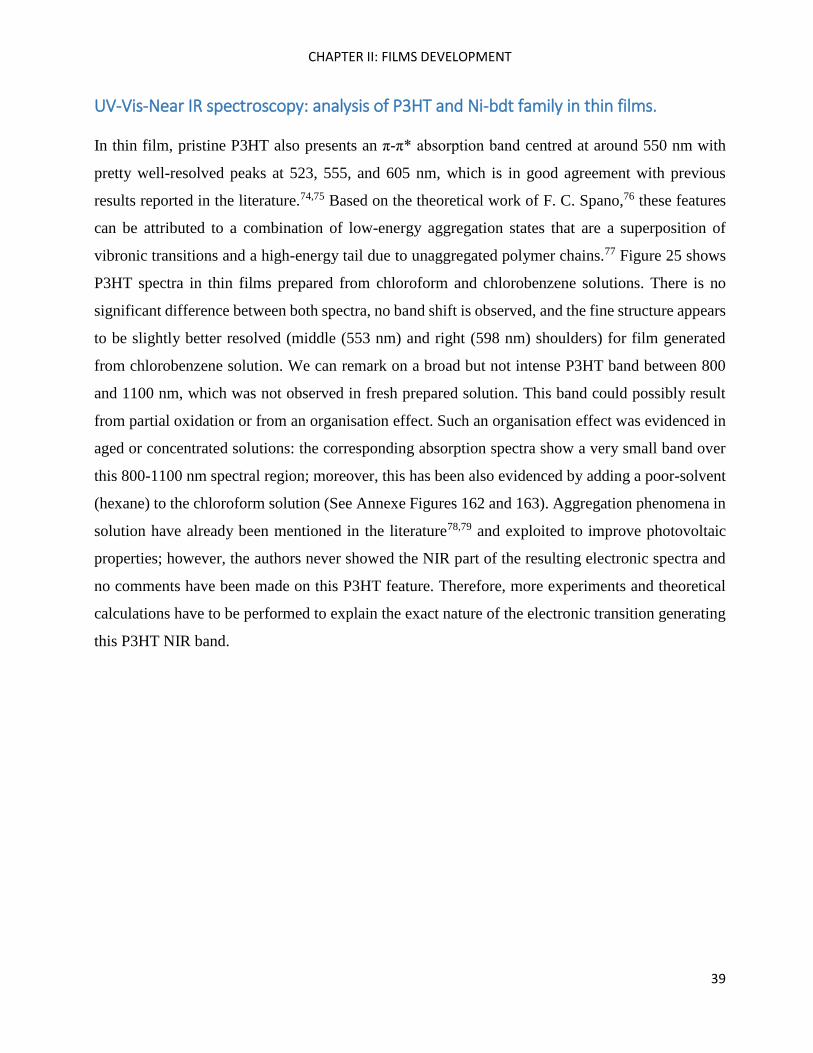
In thin film, pristine P3HT also presents an π-π* absorption band centred at around 550 nm with
pretty well-resolved peaks at 523, 555, and 605 nm, which is in good agreement with previous
results reported in the literature.74,75 Based on the theoretical work of F. C. Spano,76 these features
can be attributed to a combination of low-energy aggregation states that are a superposition of
vibronic transitions and a high-energy tail due to unaggregated polymer chains.77 Figure 25 shows
P3HT spectra in thin films prepared from chloroform and chlorobenzene solutions. There is no
significant difference between both spectra, no band shift is observed, and the fine structure appears
to be slightly better resolved (middle (553 nm) and right (598 nm) shoulders) for film generated
from chlorobenzene solution. We can remark on a broad but not intense P3HT band between 800
and 1100 nm, which was not observed in fresh prepared solution. This band could possibly result
from partial oxidation or from an organisation effect. Such an organisation effect was evidenced in
aged or concentrated solutions: the corresponding absorption spectra show a very small band over
this 800-1100 nm spectral region; moreover, this has been also evidenced by adding a poor-solvent
(hexane) to the chloroform solution (See Annexe Figures 162 and 163). Aggregation phenomena in
solution have already been mentioned in the literature78,79 and exploited to improve photovoltaic
properties; however, the authors never showed the NIR part of the resulting electronic spectra and
no comments have been made on this P3HT feature. Therefore, more experiments and theoretical
calculations have to be performed to explain the exact nature of the electronic transition generating
this P3HT NIR band.
CHAPTER II: FILMS DEVELOPMENT
40
Figure 25. Normalized UV-Vis-Near Infrared spectra of P3HTof P3HT thin films formed from CHCl3 and PhCl solutions.
During this work, we mainly focused on [Ni(4dopedt)2] as the principal P3HT acceptor partner over
the other nickel complexes due to its HCLC characteristics and properties, which will be presented
and analysed throughout the thesis.
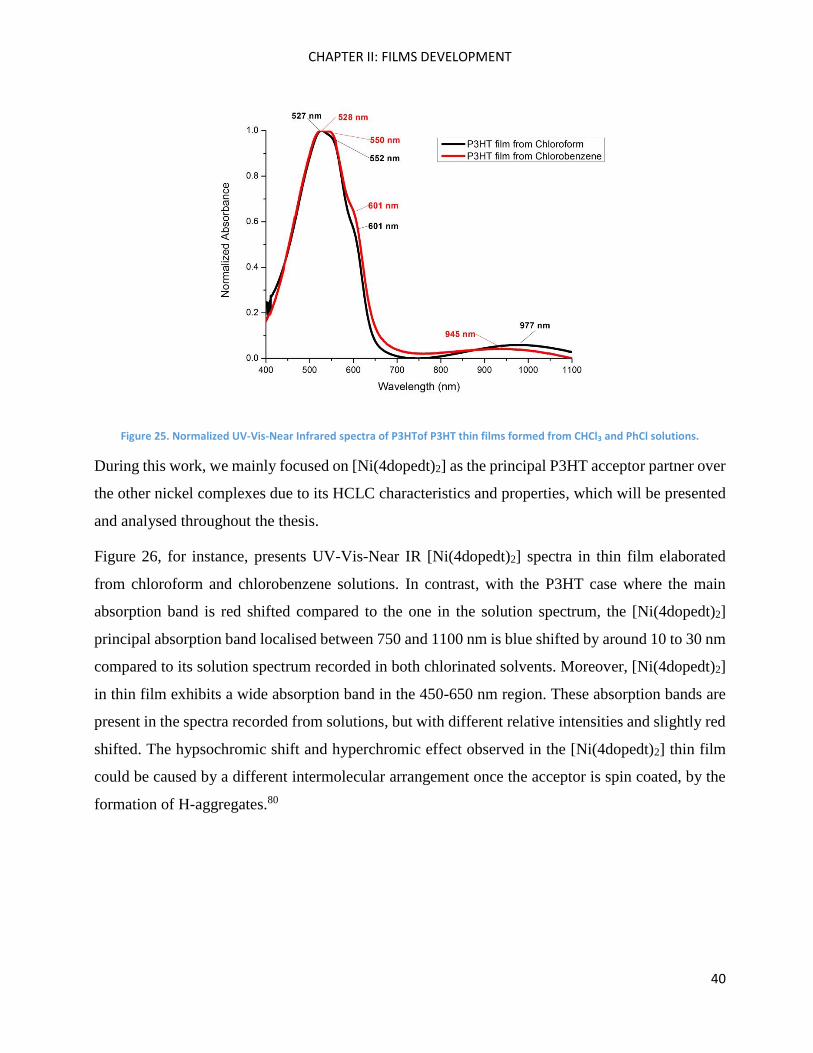
Figure 26, for instance, presents UV-Vis-Near IR [Ni(4dopedt)2] spectra in thin film elaborated
from chloroform and chlorobenzene solutions. In contrast, with the P3HT case where the main
absorption band is red shifted compared to the one in the solution spectrum, the [Ni(4dopedt)2]
principal absorption band localised between 750 and 1100 nm is blue shifted by around 10 to 30 nm
compared to its solution spectrum recorded in both chlorinated solvents. Moreover, [Ni(4dopedt)2]
in thin film exhibits a wide absorption band in the 450-650 nm region. These absorption bands are
present in the spectra recorded from solutions, but with different relative intensities and slightly red
shifted. The hypsochromic shift and hyperchromic effect observed in the [Ni(4dopedt)2] thin film
could be caused by a different intermolecular arrangement once the acceptor is spin coated, by the
formation of H-aggregates.80
CHAPTER II: FILMS DEVELOPMENT
41
Figure 26. Normalized UV-Vis-Near Infrared spectra of [Ni(4dopedt)2] in solution and thin film from CHCl3 and PhCl.
So far, we have been working with CHCl3 and PhCl indistinctly; however, from now on, for
practical reasons the solvent chosen for thin film elaboration was chlorobenzene. This presents a
higher boiling point than chloroform (130°C vs 61°C) and we have clearly seen that our spectra are
better resolved for films elaborated from PhCl solution than from CHCl3 solution (better fine
structures).
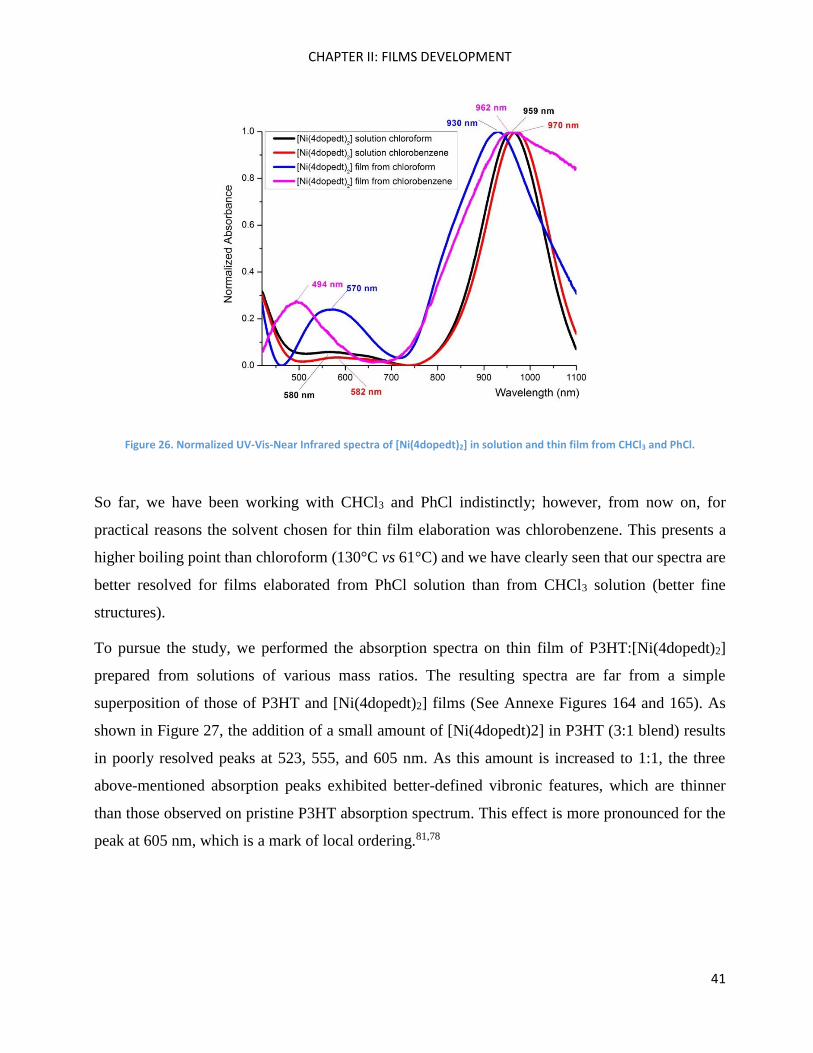
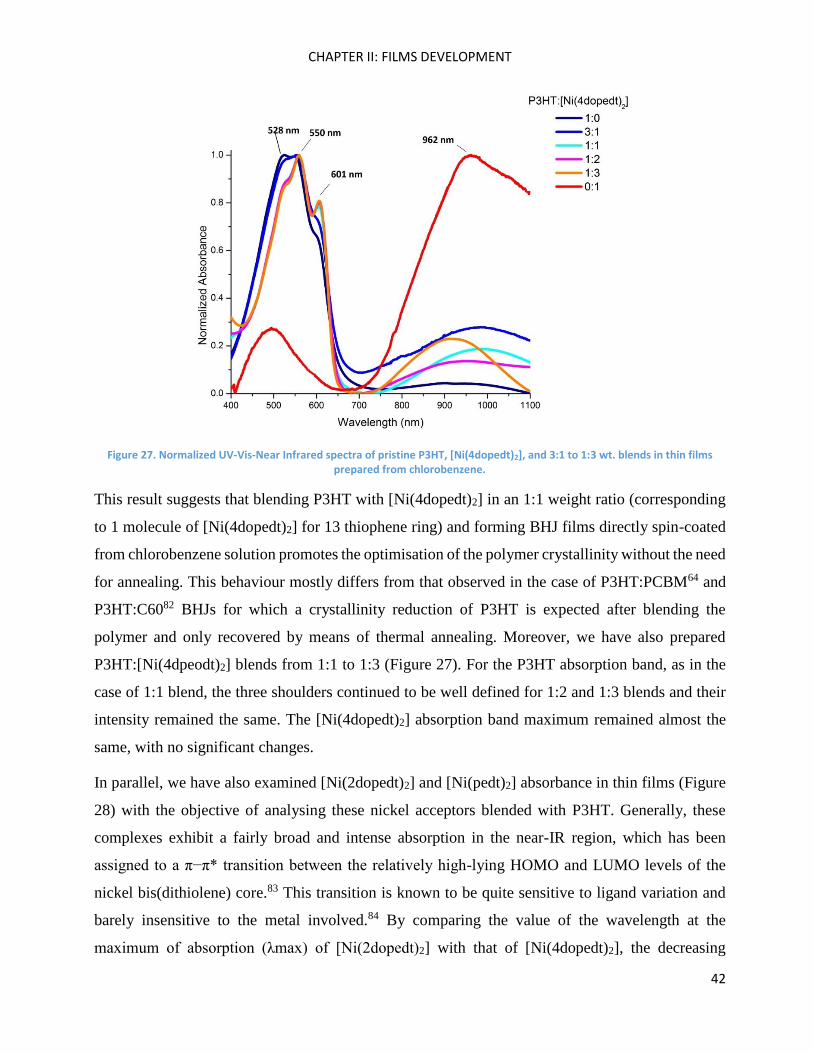
To pursue the study, we performed the absorption spectra on thin film of P3HT:[Ni(4dopedt)2]
prepared from solutions of various mass ratios. The resulting spectra are far from a simple
superposition of those of P3HT and [Ni(4dopedt)2] films (See Annexe Figures 164 and 165). As
shown in Figure 27, the addition of a small amount of [Ni(4dopedt)2] in P3HT (3:1 blend) results
in poorly resolved peaks at 523, 555, and 605 nm. As this amount is increased to 1:1, the three
above-mentioned absorption peaks exhibited better-defined vibronic features, which are thinner
than those observed on pristine P3HT absorption spectrum. This effect is more pronounced for the
peak at 605 nm, which is a mark of local ordering.81,78
CHAPTER II: FILMS DEVELOPMENT
42
Figure 27. Normalized UV-Vis-Near Infrared spectra of pristine P3HT, [Ni(4dopedt)2], and 3:1 to 1:3 wt. blends in thin films prepared from chlorobenzene.
This result suggests that blending P3HT with [Ni(4dopedt)2] in an 1:1 weight ratio (corresponding
to 1 molecule of [Ni(4dopedt)2] for 13 thiophene ring) and forming BHJ films directly spin-coated
from chlorobenzene solution promotes the optimisation of the polymer crystallinity without the need
for annealing. This behaviour mostly differs from that observed in the case of P3HT:PCBM64 and
P3HT:C6082 BHJs for which a crystallinity reduction of P3HT is expected after blending the
polymer and only recovered by means of thermal annealing. Moreover, we have also prepared
P3HT:[Ni(4dpeodt)2] blends from 1:1 to 1:3 (Figure 27). For the P3HT absorption band, as in the
case of 1:1 blend, the three shoulders continued to be well defined for 1:2 and 1:3 blends and their
intensity remained the same. The [Ni(4dopedt)2] absorption band maximum remained almost the
same, with no significant changes.
In parallel, we have also examined [Ni(2dopedt)2] and [Ni(pedt)2] absorbance in thin films (Figure
28) with the objective of analysing these nickel acceptors blended with P3HT. Generally, these
complexes exhibit a fairly broad and intense absorption in the near-IR region, which has been
assigned to a π−π* transition between the relatively high-lying HOMO and LUMO levels of the
nickel bis(dithiolene) core.83 This transition is known to be quite sensitive to ligand variation and
barely insensitive to the metal involved.84 By comparing the value of the wavelength at the
maximum of absorption (λmax) of [Ni(2dopedt)2] with that of [Ni(4dopedt)2], the decreasing
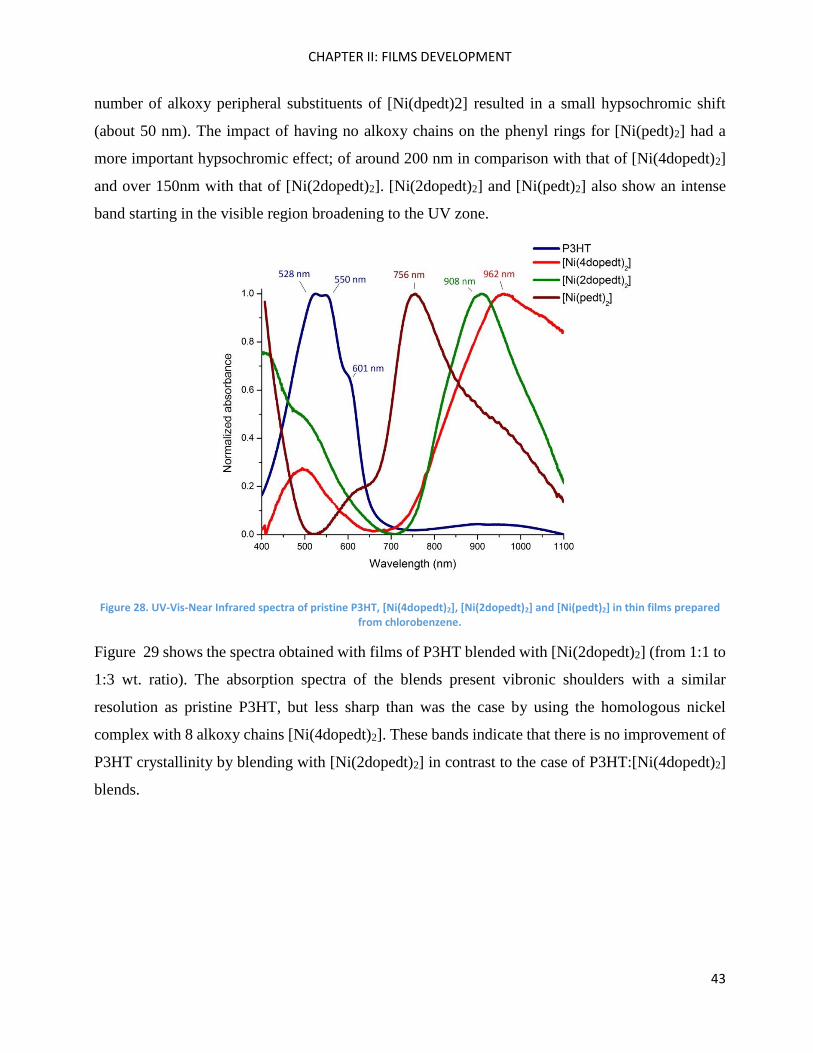
CHAPTER II: FILMS DEVELOPMENT
43
number of alkoxy peripheral substituents of [Ni(dpedt)2] resulted in a small hypsochromic shift
(about 50 nm). The impact of having no alkoxy chains on the phenyl rings for [Ni(pedt)2] had a
more important hypsochromic effect; of around 200 nm in comparison with that of [Ni(4dopedt)2]
and over 150nm with that of [Ni(2dopedt)2]. [Ni(2dopedt)2] and [Ni(pedt)2] also show an intense
band starting in the visible region broadening to the UV zone.
Figure 28. UV-Vis-Near Infrared spectra of pristine P3HT, [Ni(4dopedt)2], [Ni(2dopedt)2] and [Ni(pedt)2] in thin films prepared from chlorobenzene.
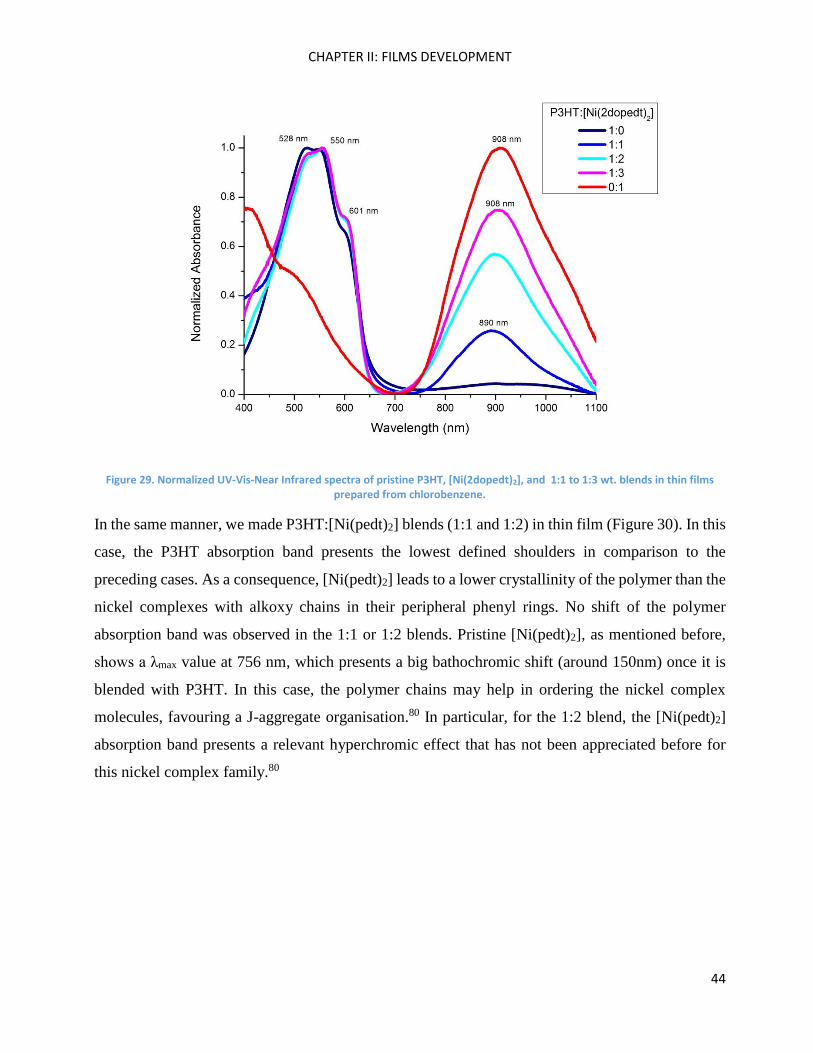
Figure 29 shows the spectra obtained with films of P3HT blended with [Ni(2dopedt)2] (from 1:1 to
1:3 wt. ratio). The absorption spectra of the blends present vibronic shoulders with a similar
resolution as pristine P3HT, but less sharp than was the case by using the homologous nickel
complex with 8 alkoxy chains [Ni(4dopedt)2]. These bands indicate that there is no improvement of
P3HT crystallinity by blending with [Ni(2dopedt)2] in contrast to the case of P3HT:[Ni(4dopedt)2]
blends.
CHAPTER II: FILMS DEVELOPMENT
44
Figure 29. Normalized UV-Vis-Near Infrared spectra of pristine P3HT, [Ni(2dopedt)2], and 1:1 to 1:3 wt. blends in thin films prepared from chlorobenzene.
In the same manner, we made P3HT:[Ni(pedt)2] blends (1:1 and 1:2) in thin film (Figure 30). In this
case, the P3HT absorption band presents the lowest defined shoulders in comparison to the
preceding cases. As a consequence, [Ni(pedt)2] leads to a lower crystallinity of the polymer than the
nickel complexes with alkoxy chains in their peripheral phenyl rings. No shift of the polymer
absorption band was observed in the 1:1 or 1:2 blends. Pristine [Ni(pedt)2], as mentioned before,
shows a λmax value at 756 nm, which presents a big bathochromic shift (around 150nm) once it is
blended with P3HT. In this case, the polymer chains may help in ordering the nickel complex
molecules, favouring a J-aggregate organisation.80 In particular, for the 1:2 blend, the [Ni(pedt)2]
absorption band presents a relevant hyperchromic effect that has not been appreciated before for
this nickel complex family.80
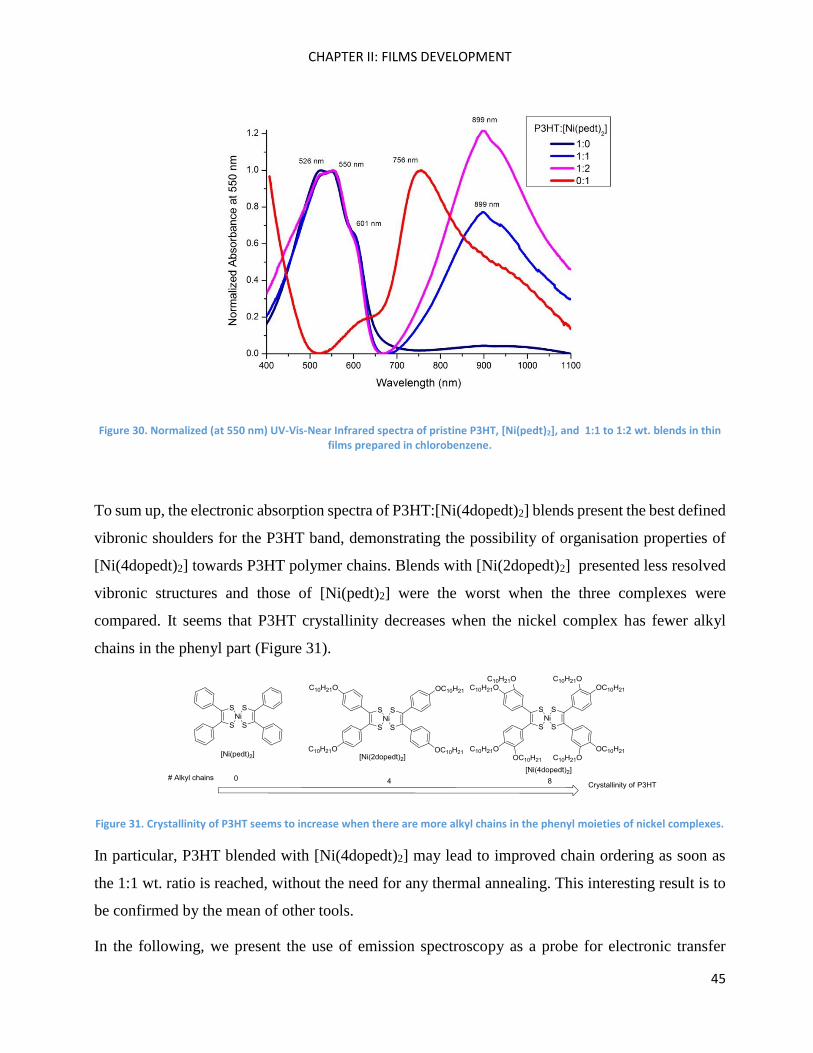
CHAPTER II: FILMS DEVELOPMENT
45
Figure 30. Normalized (at 550 nm) UV-Vis-Near Infrared spectra of pristine P3HT, [Ni(pedt)2], and 1:1 to 1:2 wt. blends in thin films prepared in chlorobenzene.
To sum up, the electronic absorption spectra of P3HT:[Ni(4dopedt)2] blends present the best defined
vibronic shoulders for the P3HT band, demonstrating the possibility of organisation properties of
[Ni(4dopedt)2] towards P3HT polymer chains. Blends with [Ni(2dopedt)2] presented less resolved
vibronic structures and those of [Ni(pedt)2] were the worst when the three complexes were
compared. It seems that P3HT crystallinity decreases when the nickel complex has fewer alkyl
chains in the phenyl part (Figure 31).
Figure 31. Crystallinity of P3HT seems to increase when there are more alkyl chains in the phenyl moieties of nickel complexes.
In particular, P3HT blended with [Ni(4dopedt)2] may lead to improved chain ordering as soon as
the 1:1 wt. ratio is reached, without the need for any thermal annealing. This interesting result is to
be confirmed by the mean of other tools.
In the following, we present the use of emission spectroscopy as a probe for electronic transfer
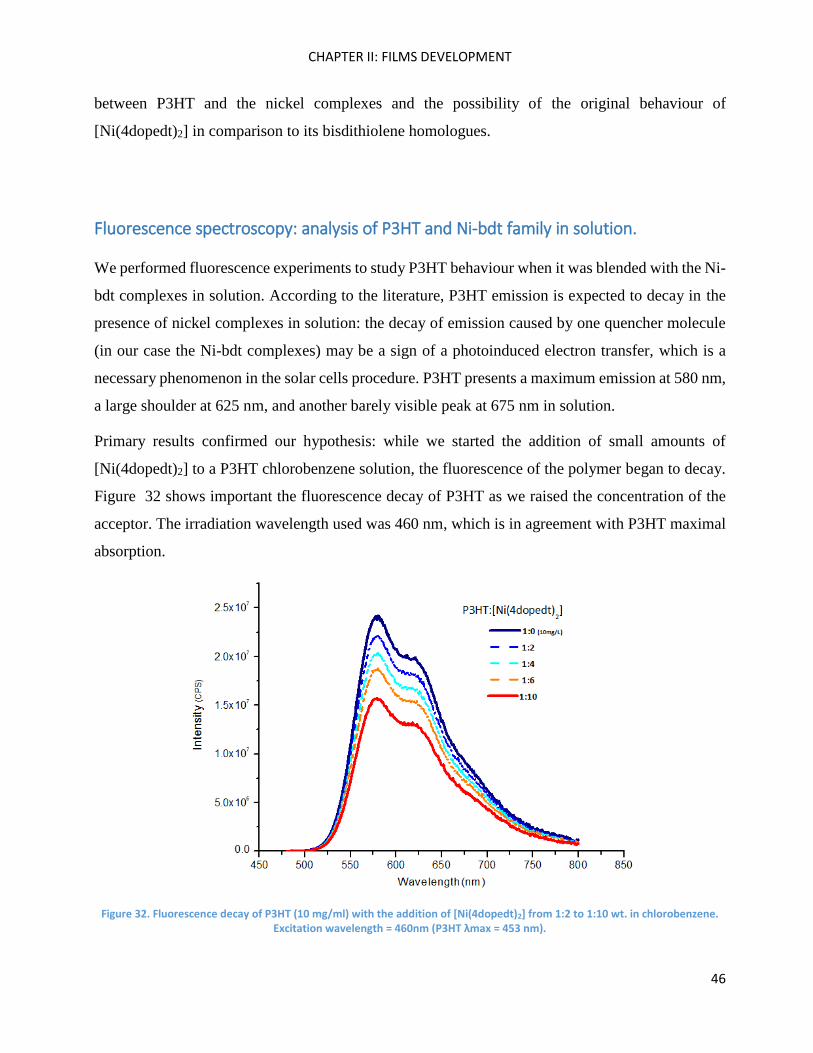
CHAPTER II: FILMS DEVELOPMENT
46
between P3HT and the nickel complexes and the possibility of the original behaviour of
[Ni(4dopedt)2] in comparison to its bisdithiolene homologues.
Fluorescence spectroscopy: analysis of P3HT and Ni-bdt family in solution.
We performed fluorescence experiments to study P3HT behaviour when it was blended with the Ni-
bdt complexes in solution. According to the literature, P3HT emission is expected to decay in the
presence of nickel complexes in solution: the decay of emission caused by one quencher molecule
(in our case the Ni-bdt complexes) may be a sign of a photoinduced electron transfer, which is a
necessary phenomenon in the solar cells procedure. P3HT presents a maximum emission at 580 nm,
a large shoulder at 625 nm, and another barely visible peak at 675 nm in solution.
Primary results confirmed our hypothesis: while we started the addition of small amounts of
[Ni(4dopedt)2] to a P3HT chlorobenzene solution, the fluorescence of the polymer began to decay.
Figure 32 shows important the fluorescence decay of P3HT as we raised the concentration of the
acceptor. The irradiation wavelength used was 460 nm, which is in agreement with P3HT maximal
absorption.
Figure 32. Fluorescence decay of P3HT (10 mg/ml) with the addition of [Ni(4dopedt)2] from 1:2 to 1:10 wt. in chlorobenzene. Excitation wavelength = 460nm (P3HT λmax = 453 nm).
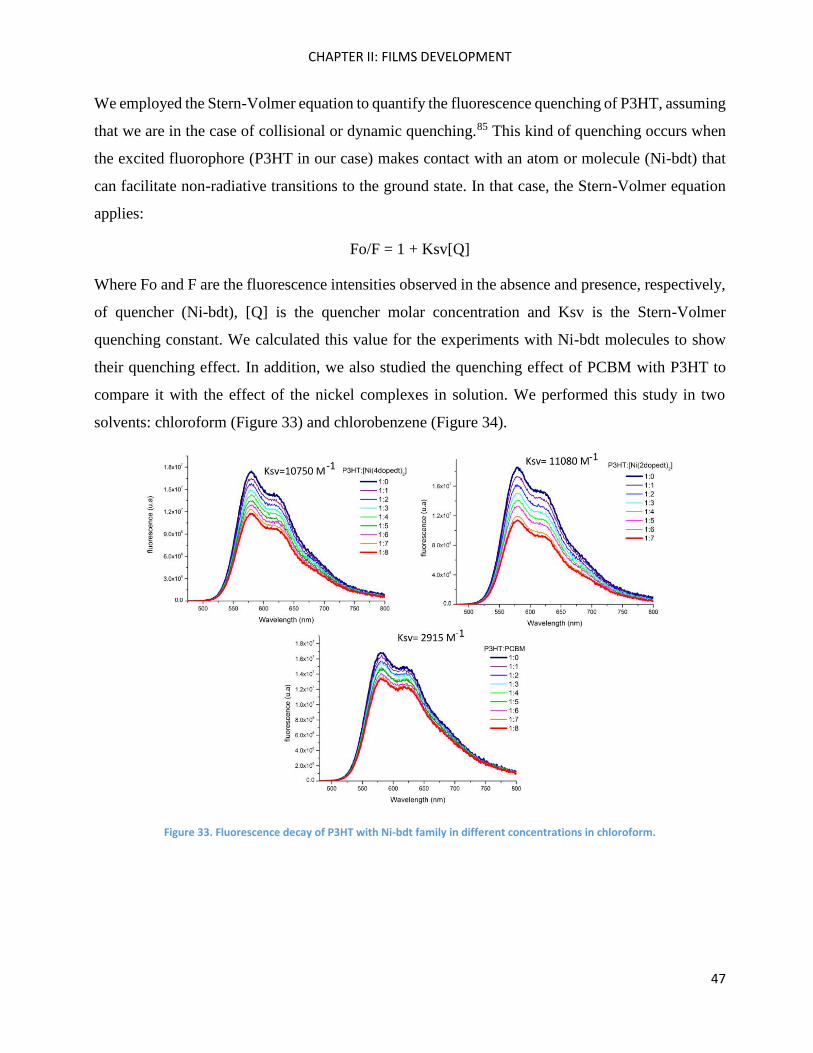
CHAPTER II: FILMS DEVELOPMENT
47
We employed the Stern-Volmer equation to quantify the fluorescence quenching of P3HT, assuming
that we are in the case of collisional or dynamic quenching.85 This kind of quenching occurs when
the excited fluorophore (P3HT in our case) makes contact with an atom or molecule (Ni-bdt) that
can facilitate non-radiative transitions to the ground state. In that case, the Stern-Volmer equation
applies:
Fo/F = 1 + Ksv[Q]
Where Fo and F are the fluorescence intensities observed in the absence and presence, respectively,
of quencher (Ni-bdt), [Q] is the quencher molar concentration and Ksv is the Stern-Volmer
quenching constant. We calculated this value for the experiments with Ni-bdt molecules to show
their quenching effect. In addition, we also studied the quenching effect of PCBM with P3HT to
compare it with the effect of the nickel complexes in solution. We performed this study in two
solvents: chloroform (Figure 33) and chlorobenzene (Figure 34).
Figure 33. Fluorescence decay of P3HT with Ni-bdt family in different concentrations in chloroform.
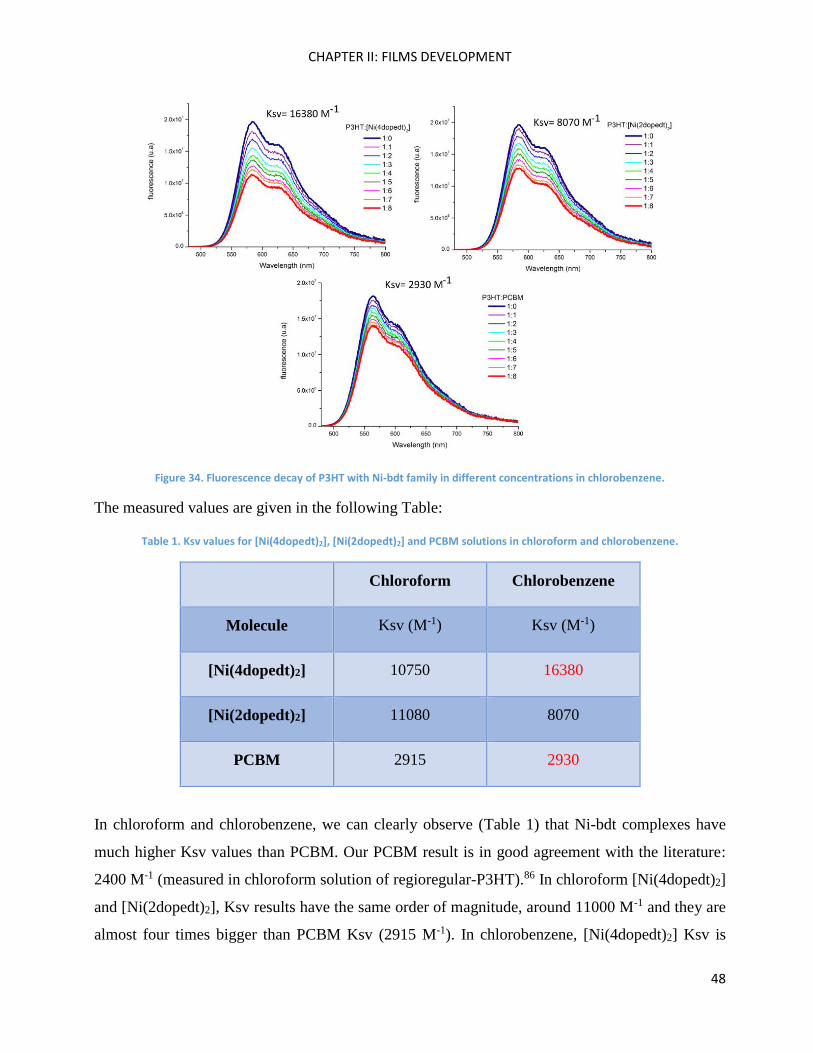
CHAPTER II: FILMS DEVELOPMENT
48
Figure 34. Fluorescence decay of P3HT with Ni-bdt family in different concentrations in chlorobenzene.
The measured values are given in the following Table:
Table 1. Ksv values for [Ni(4dopedt)2], [Ni(2dopedt)2] and PCBM solutions in chloroform and chlorobenzene.
Chloroform Chlorobenzene
Molecule Ksv (M-1) Ksv (M-1)
[Ni(4dopedt)2] 10750 16380
[Ni(2dopedt)2] 11080 8070
PCBM 2915 2930
In chloroform and chlorobenzene, we can clearly observe (Table 1) that Ni-bdt complexes have
much higher Ksv values than PCBM. Our PCBM result is in good agreement with the literature:
2400 M-1 (measured in chloroform solution of regioregular-P3HT).86 In chloroform [Ni(4dopedt)2]
and [Ni(2dopedt)2], Ksv results have the same order of magnitude, around 11000 M-1 and they are
almost four times bigger than PCBM Ksv (2915 M-1). In chlorobenzene, [Ni(4dopedt)2] Ksv is
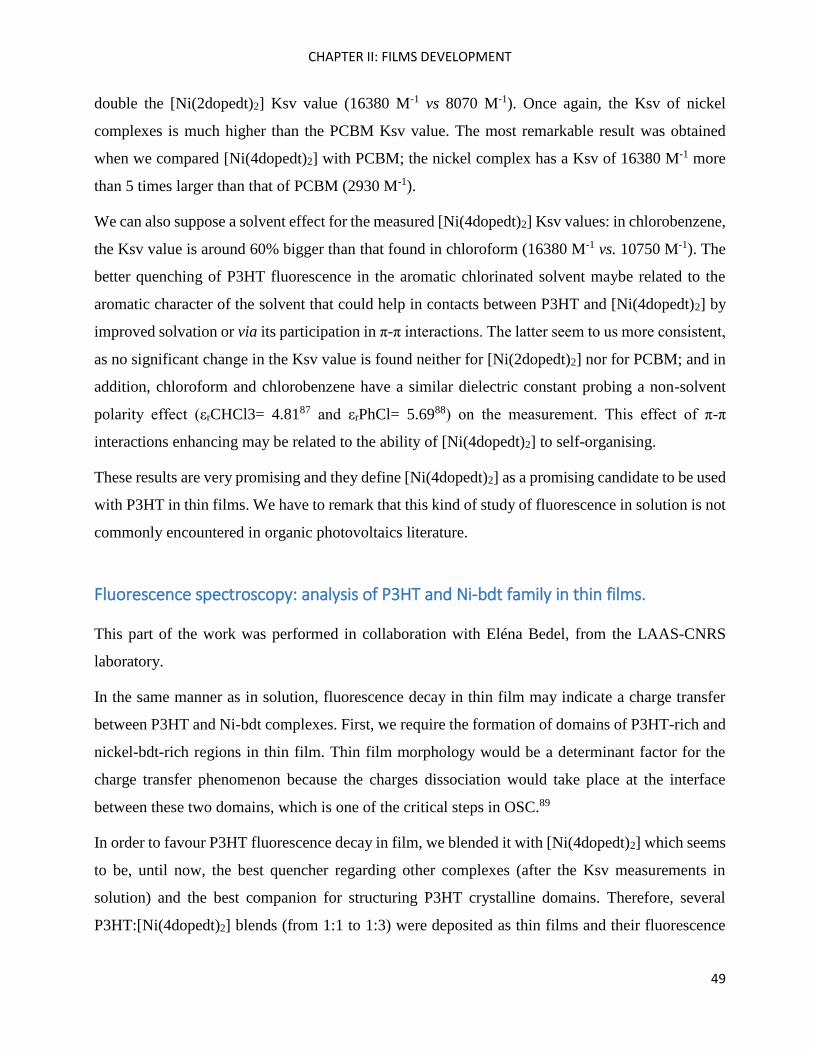
CHAPTER II: FILMS DEVELOPMENT
49
double the [Ni(2dopedt)2] Ksv value (16380 M-1 vs 8070 M-1). Once again, the Ksv of nickel
complexes is much higher than the PCBM Ksv value. The most remarkable result was obtained
when we compared [Ni(4dopedt)2] with PCBM; the nickel complex has a Ksv of 16380 M-1 more
than 5 times larger than that of PCBM (2930 M-1).
We can also suppose a solvent effect for the measured [Ni(4dopedt)2] Ksv values: in chlorobenzene,
the Ksv value is around 60% bigger than that found in chloroform (16380 M-1 vs. 10750 M-1). The
better quenching of P3HT fluorescence in the aromatic chlorinated solvent maybe related to the
aromatic character of the solvent that could help in contacts between P3HT and [Ni(4dopedt)2] by
improved solvation or via its participation in π-π interactions. The latter seem to us more consistent,
as no significant change in the Ksv value is found neither for [Ni(2dopedt)2] nor for PCBM; and in
addition, chloroform and chlorobenzene have a similar dielectric constant probing a non-solvent
polarity effect (εrCHCl3= 4.8187 and εrPhCl= 5.6988) on the measurement. This effect of π-π
interactions enhancing may be related to the ability of [Ni(4dopedt)2] to self-organising.
These results are very promising and they define [Ni(4dopedt)2] as a promising candidate to be used
with P3HT in thin films. We have to remark that this kind of study of fluorescence in solution is not
commonly encountered in organic photovoltaics literature.
Fluorescence spectroscopy: analysis of P3HT and Ni-bdt family in thin films.
This part of the work was performed in collaboration with Eléna Bedel, from the LAAS-CNRS
laboratory.
In the same manner as in solution, fluorescence decay in thin film may indicate a charge transfer
between P3HT and Ni-bdt complexes. First, we require the formation of domains of P3HT-rich and
nickel-bdt-rich regions in thin film. Thin film morphology would be a determinant factor for the
charge transfer phenomenon because the charges dissociation would take place at the interface
between these two domains, which is one of the critical steps in OSC.89
In order to favour P3HT fluorescence decay in film, we blended it with [Ni(4dopedt)2] which seems
to be, until now, the best quencher regarding other complexes (after the Ksv measurements in
solution) and the best companion for structuring P3HT crystalline domains. Therefore, several
P3HT:[Ni(4dopedt)2] blends (from 1:1 to 1:3) were deposited as thin films and their fluorescence
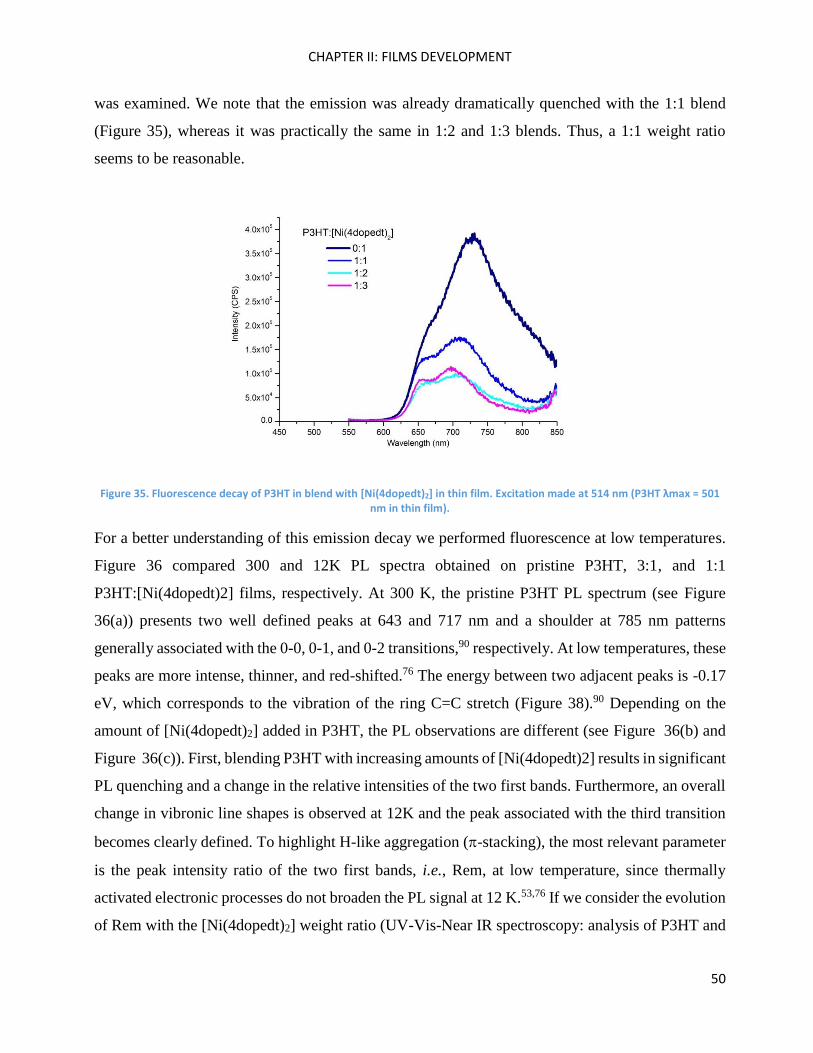
CHAPTER II: FILMS DEVELOPMENT
50
was examined. We note that the emission was already dramatically quenched with the 1:1 blend
(Figure 35), whereas it was practically the same in 1:2 and 1:3 blends. Thus, a 1:1 weight ratio
seems to be reasonable.
Figure 35. Fluorescence decay of P3HT in blend with [Ni(4dopedt)2] in thin film. Excitation made at 514 nm (P3HT λmax = 501 nm in thin film).
For a better understanding of this emission decay we performed fluorescence at low temperatures.
Figure 36 compared 300 and 12K PL spectra obtained on pristine P3HT, 3:1, and 1:1
P3HT:[Ni(4dopedt)2] films, respectively. At 300 K, the pristine P3HT PL spectrum (see Figure
36(a)) presents two well defined peaks at 643 and 717 nm and a shoulder at 785 nm patterns
generally associated with the 0-0, 0-1, and 0-2 transitions,90 respectively. At low temperatures, these
peaks are more intense, thinner, and red-shifted.76 The energy between two adjacent peaks is -0.17
eV, which corresponds to the vibration of the ring C=C stretch (Figure 38).90 Depending on the
amount of [Ni(4dopedt)2] added in P3HT, the PL observations are different (see Figure 36(b) and
Figure 36(c)). First, blending P3HT with increasing amounts of [Ni(4dopedt)2] results in significant
PL quenching and a change in the relative intensities of the two first bands. Furthermore, an overall
change in vibronic line shapes is observed at 12K and the peak associated with the third transition
becomes clearly defined. To highlight H-like aggregation (-stacking), the most relevant parameter
is the peak intensity ratio of the two first bands, i.e., Rem, at low temperature, since thermally
activated electronic processes do not broaden the PL signal at 12 K.53,76 If we consider the evolution
of Rem with the [Ni(4dopedt)2] weight ratio (UV-Vis-Near IR spectroscopy: analysis of P3HT and
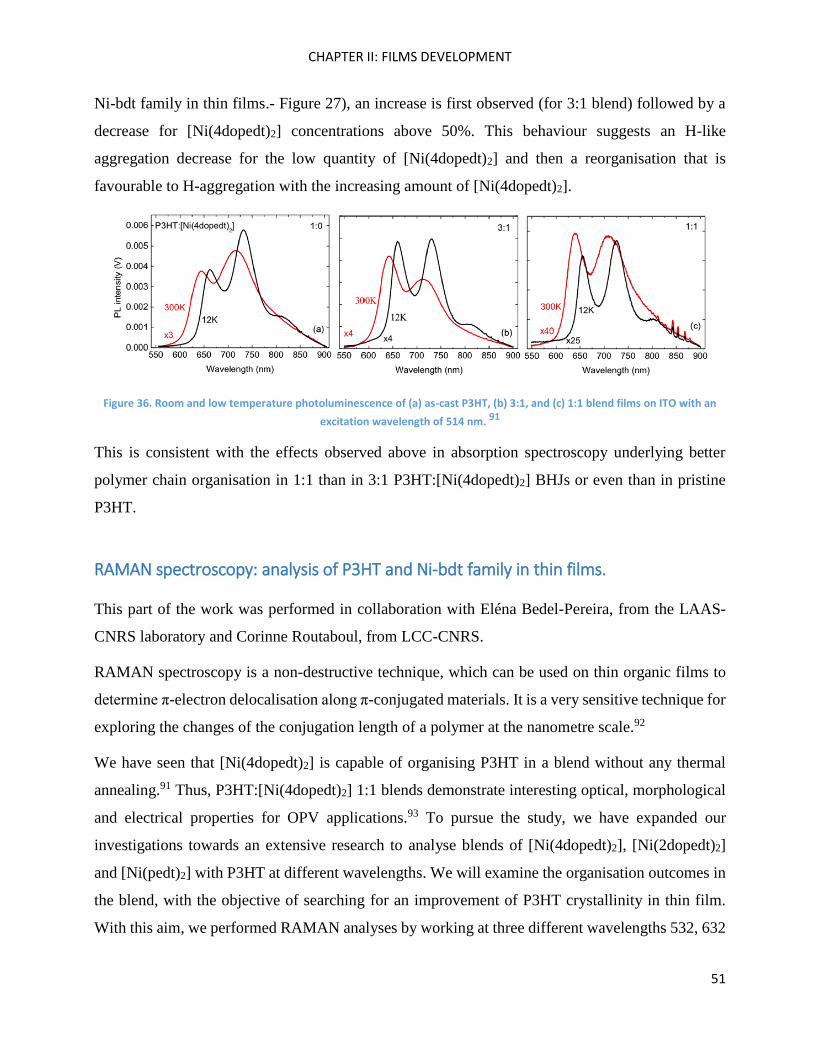
CHAPTER II: FILMS DEVELOPMENT
51
Ni-bdt family in thin films.- Figure 27), an increase is first observed (for 3:1 blend) followed by a
decrease for [Ni(4dopedt)2] concentrations above 50%. This behaviour suggests an H-like
aggregation decrease for the low quantity of [Ni(4dopedt)2] and then a reorganisation that is
favourable to H-aggregation with the increasing amount of [Ni(4dopedt)2].
Figure 36. Room and low temperature photoluminescence of (a) as-cast P3HT, (b) 3:1, and (c) 1:1 blend films on ITO with an
excitation wavelength of 514 nm. 91
This is consistent with the effects observed above in absorption spectroscopy underlying better
polymer chain organisation in 1:1 than in 3:1 P3HT:[Ni(4dopedt)2] BHJs or even than in pristine
P3HT.
RAMAN spectroscopy: analysis of P3HT and Ni-bdt family in thin films.
This part of the work was performed in collaboration with Eléna Bedel-Pereira, from the LAAS-
CNRS laboratory and Corinne Routaboul, from LCC-CNRS.
RAMAN spectroscopy is a non-destructive technique, which can be used on thin organic films to
determine π-electron delocalisation along π-conjugated materials. It is a very sensitive technique for
exploring the changes of the conjugation length of a polymer at the nanometre scale.92
We have seen that [Ni(4dopedt)2] is capable of organising P3HT in a blend without any thermal
annealing.91 Thus, P3HT:[Ni(4dopedt)2] 1:1 blends demonstrate interesting optical, morphological
and electrical properties for OPV applications.93 To pursue the study, we have expanded our
investigations towards an extensive research to analyse blends of [Ni(4dopedt)2], [Ni(2dopedt)2]
and [Ni(pedt)2] with P3HT at different wavelengths. We will examine the organisation outcomes in
the blend, with the objective of searching for an improvement of P3HT crystallinity in thin film.
With this aim, we performed RAMAN analyses by working at three different wavelengths 532, 632
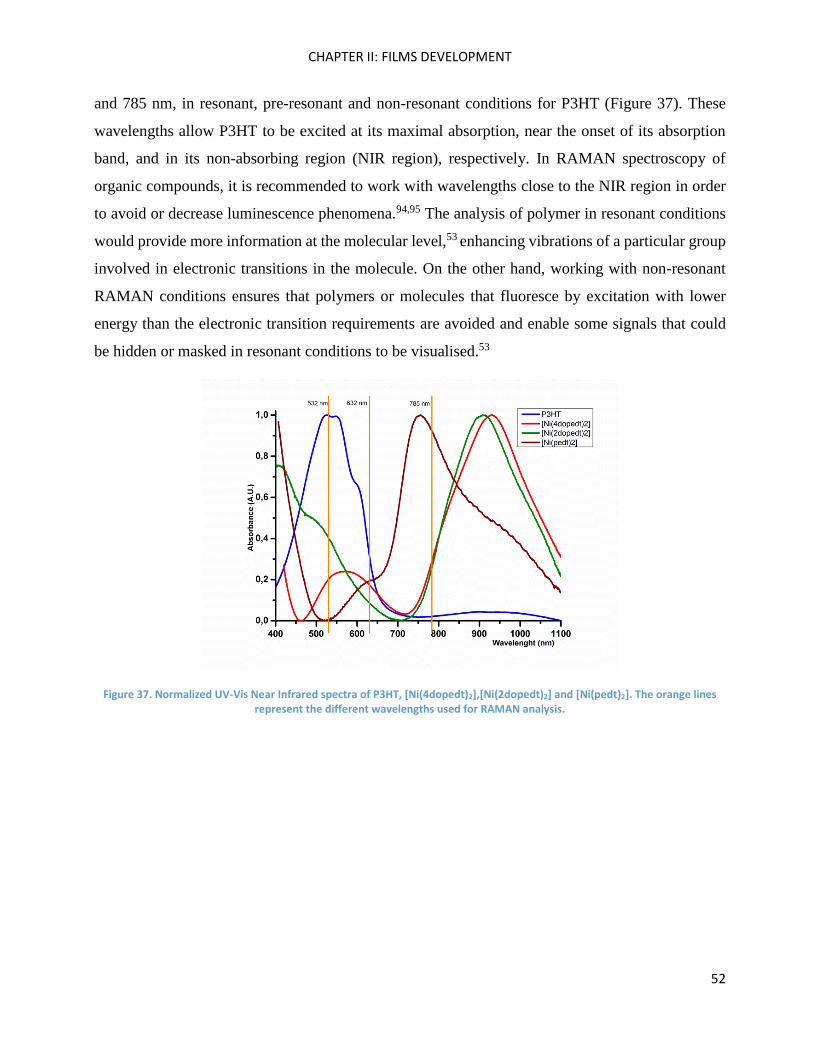
CHAPTER II: FILMS DEVELOPMENT
52
and 785 nm, in resonant, pre-resonant and non-resonant conditions for P3HT (Figure 37). These
wavelengths allow P3HT to be excited at its maximal absorption, near the onset of its absorption
band, and in its non-absorbing region (NIR region), respectively. In RAMAN spectroscopy of
organic compounds, it is recommended to work with wavelengths close to the NIR region in order
to avoid or decrease luminescence phenomena.94,95 The analysis of polymer in resonant conditions
would provide more information at the molecular level,53 enhancing vibrations of a particular group
involved in electronic transitions in the molecule. On the other hand, working with non-resonant
RAMAN conditions ensures that polymers or molecules that fluoresce by excitation with lower
energy than the electronic transition requirements are avoided and enable some signals that could
be hidden or masked in resonant conditions to be visualised.53
Figure 37. Normalized UV-Vis Near Infrared spectra of P3HT, [Ni(4dopedt)2],[Ni(2dopedt)2] and [Ni(pedt)2]. The orange lines represent the different wavelengths used for RAMAN analysis.
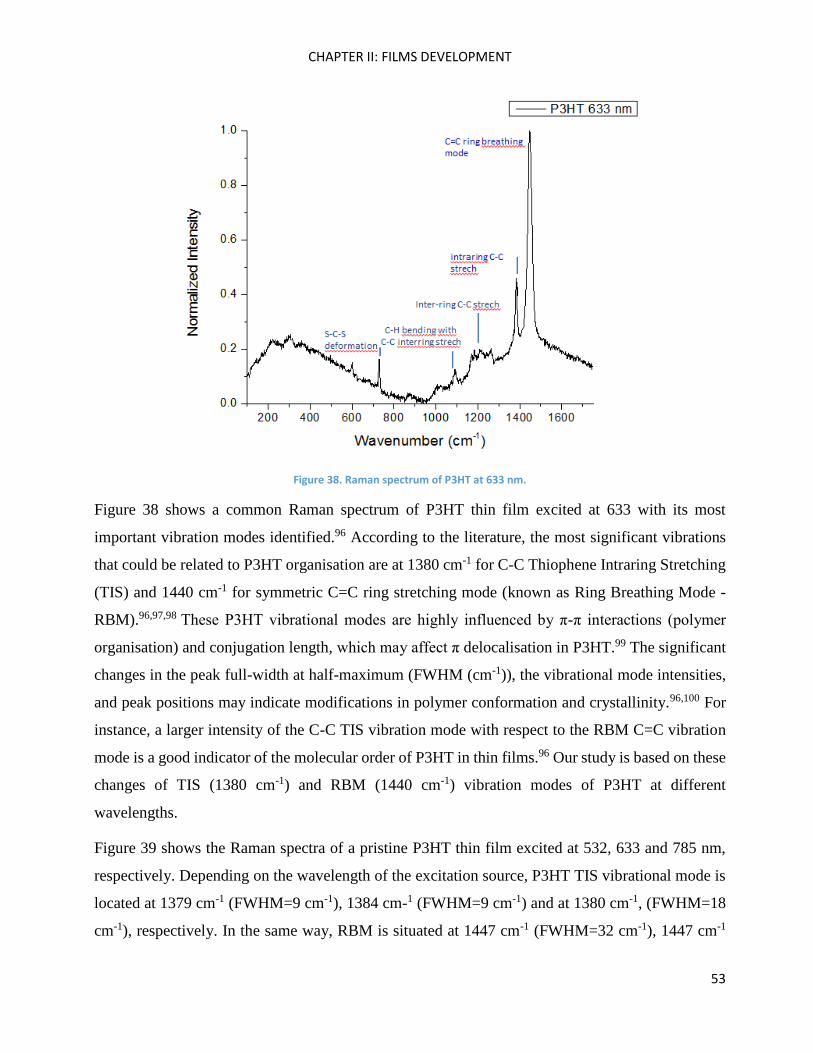
CHAPTER II: FILMS DEVELOPMENT
53
Figure 38. Raman spectrum of P3HT at 633 nm.
Figure 38 shows a common Raman spectrum of P3HT thin film excited at 633 with its most
important vibration modes identified.96 According to the literature, the most significant vibrations
that could be related to P3HT organisation are at 1380 cm-1 for C-C Thiophene Intraring Stretching
(TIS) and 1440 cm-1 for symmetric C=C ring stretching mode (known as Ring Breathing Mode -
RBM).96,97,98 These P3HT vibrational modes are highly influenced by π-π interactions (polymer
organisation) and conjugation length, which may affect π delocalisation in P3HT.99 The significant
changes in the peak full-width at half-maximum (FWHM (cm-1)), the vibrational mode intensities,
and peak positions may indicate modifications in polymer conformation and crystallinity.96,100 For
instance, a larger intensity of the C-C TIS vibration mode with respect to the RBM C=C vibration
mode is a good indicator of the molecular order of P3HT in thin films.96 Our study is based on these
changes of TIS (1380 cm-1) and RBM (1440 cm-1) vibration modes of P3HT at different
wavelengths.
Figure 39 shows the Raman spectra of a pristine P3HT thin film excited at 532, 633 and 785 nm,
respectively. Depending on the wavelength of the excitation source, P3HT TIS vibrational mode is
located at 1379 cm-1 (FWHM=9 cm-1), 1384 cm-1 (FWHM=9 cm-1) and at 1380 cm-1, (FWHM=18
cm-1), respectively. In the same way, RBM is situated at 1447 cm-1 (FWHM=32 cm-1), 1447 cm-1
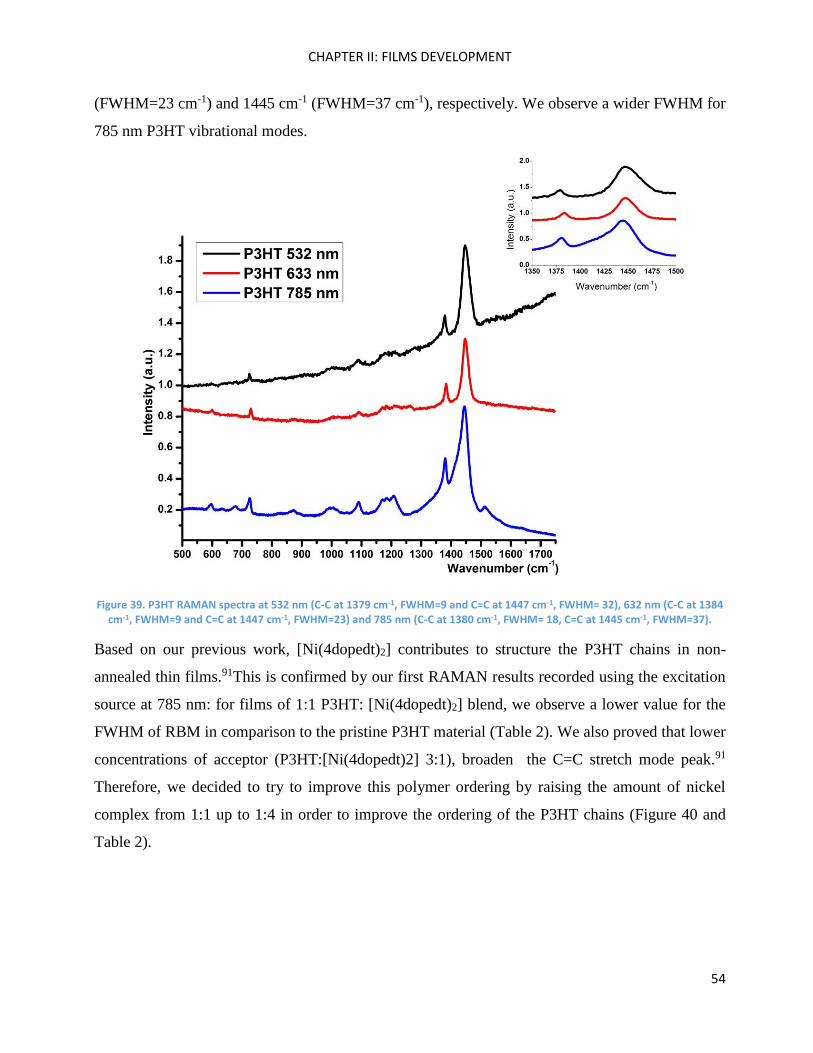
CHAPTER II: FILMS DEVELOPMENT
54
(FWHM=23 cm-1) and 1445 cm-1 (FWHM=37 cm-1), respectively. We observe a wider FWHM for
785 nm P3HT vibrational modes.
Figure 39. P3HT RAMAN spectra at 532 nm (C-C at 1379 cm-1, FWHM=9 and C=C at 1447 cm-1, FWHM= 32), 632 nm (C-C at 1384 cm-1, FWHM=9 and C=C at 1447 cm-1, FWHM=23) and 785 nm (C-C at 1380 cm-1, FWHM= 18, C=C at 1445 cm-1, FWHM=37).
Based on our previous work, [Ni(4dopedt)2] contributes to structure the P3HT chains in non-
annealed thin films.91This is confirmed by our first RAMAN results recorded using the excitation
source at 785 nm: for films of 1:1 P3HT: [Ni(4dopedt)2] blend, we observe a lower value for the
FWHM of RBM in comparison to the pristine P3HT material (Table 2). We also proved that lower
concentrations of acceptor (P3HT:[Ni(4dopedt)2] 3:1), broaden the C=C stretch mode peak.91
Therefore, we decided to try to improve this polymer ordering by raising the amount of nickel
complex from 1:1 up to 1:4 in order to improve the ordering of the P3HT chains (Figure 40 and
Table 2).
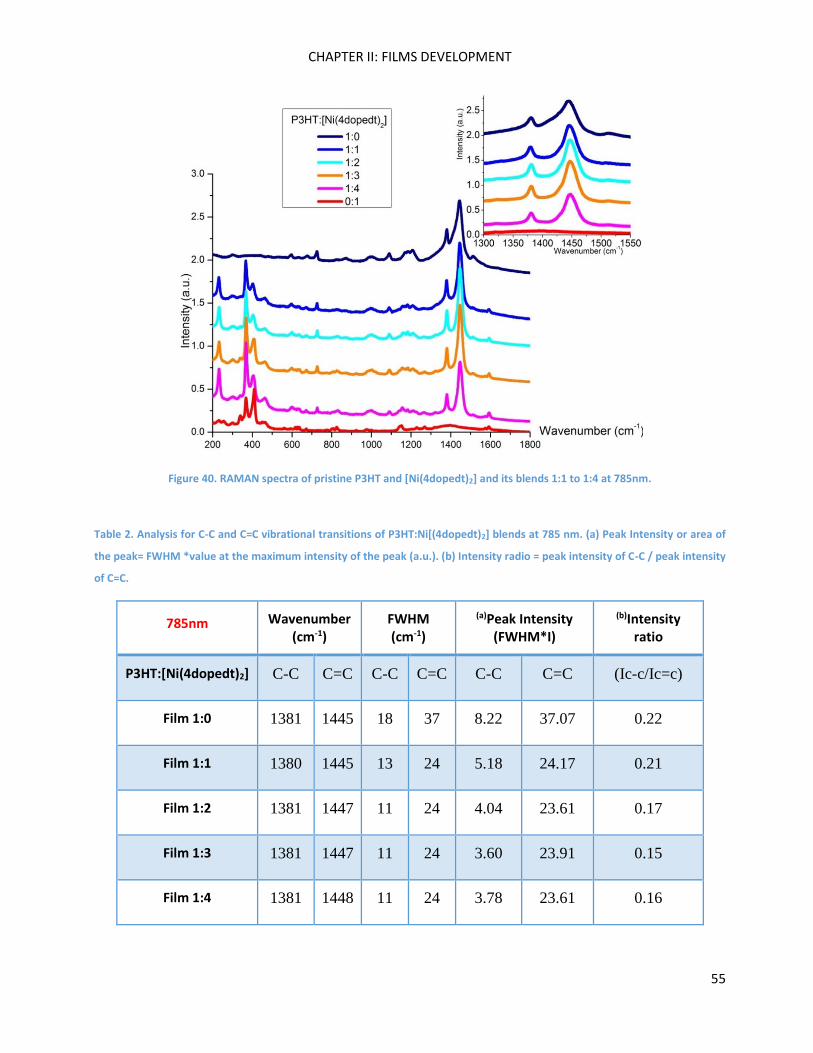
CHAPTER II: FILMS DEVELOPMENT
55
Figure 40. RAMAN spectra of pristine P3HT and [Ni(4dopedt)2] and its blends 1:1 to 1:4 at 785nm.
Table 2. Analysis for C-C and C=C vibrational transitions of P3HT:Ni[(4dopedt)2] blends at 785 nm. (a) Peak Intensity or area of
the peak= FWHM *value at the maximum intensity of the peak (a.u.). (b) Intensity radio = peak intensity of C-C / peak intensity
of C=C.
785nm Wavenumber (cm-1)
FWHM (cm-1)
(a)Peak Intensity (FWHM*I)
(b)Intensity ratio
P3HT:[Ni(4dopedt)2] C-C C=C C-C C=C C-C C=C (Ic-c/Ic=c)
Film 1:0 1381 1445 18 37 8.22 37.07 0.22
Film 1:1 1380 1445 13 24 5.18 24.17 0.21
Film 1:2 1381 1447 11 24 4.04 23.61 0.17
Film 1:3 1381 1447 11 24 3.60 23.91 0.15
Film 1:4 1381 1448 11 24 3.78 23.61 0.16
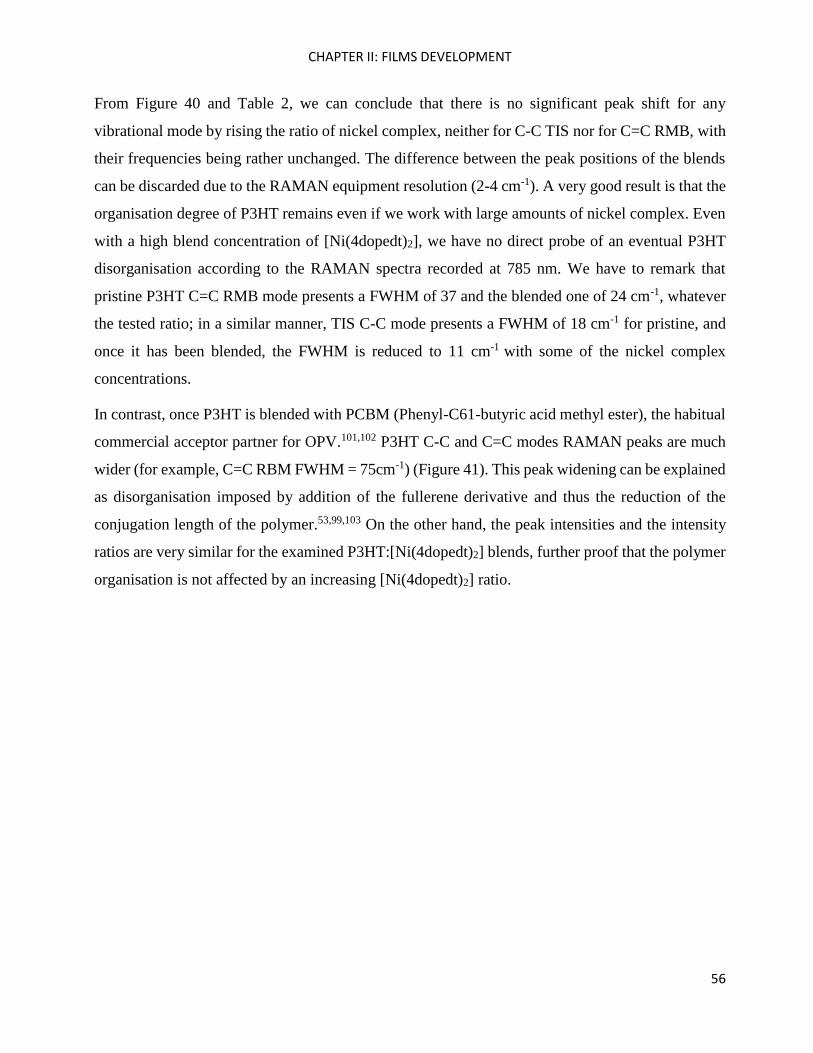
CHAPTER II: FILMS DEVELOPMENT
56
From Figure 40 and Table 2, we can conclude that there is no significant peak shift for any
vibrational mode by rising the ratio of nickel complex, neither for C-C TIS nor for C=C RMB, with
their frequencies being rather unchanged. The difference between the peak positions of the blends
can be discarded due to the RAMAN equipment resolution (2-4 cm-1). A very good result is that the
organisation degree of P3HT remains even if we work with large amounts of nickel complex. Even
with a high blend concentration of [Ni(4dopedt)2], we have no direct probe of an eventual P3HT
disorganisation according to the RAMAN spectra recorded at 785 nm. We have to remark that
pristine P3HT C=C RMB mode presents a FWHM of 37 and the blended one of 24 cm-1, whatever
the tested ratio; in a similar manner, TIS C-C mode presents a FWHM of 18 cm-1 for pristine, and
once it has been blended, the FWHM is reduced to 11 cm-1 with some of the nickel complex
concentrations.
In contrast, once P3HT is blended with PCBM (Phenyl-C61-butyric acid methyl ester), the habitual
commercial acceptor partner for OPV.101,102 P3HT C-C and C=C modes RAMAN peaks are much
wider (for example, C=C RBM FWHM = 75cm-1) (Figure 41). This peak widening can be explained
as disorganisation imposed by addition of the fullerene derivative and thus the reduction of the
conjugation length of the polymer.53,99,103 On the other hand, the peak intensities and the intensity
ratios are very similar for the examined P3HT:[Ni(4dopedt)2] blends, further proof that the polymer
organisation is not affected by an increasing [Ni(4dopedt)2] ratio.
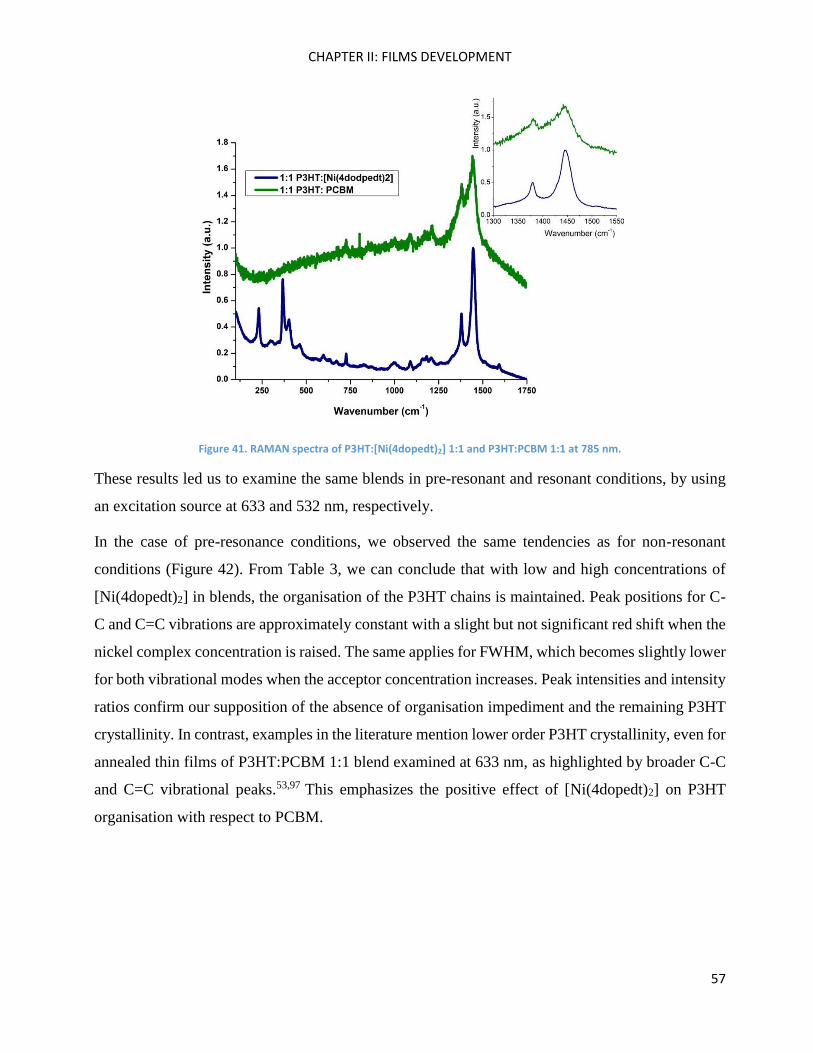
CHAPTER II: FILMS DEVELOPMENT
57
Figure 41. RAMAN spectra of P3HT:[Ni(4dopedt)2] 1:1 and P3HT:PCBM 1:1 at 785 nm.
These results led us to examine the same blends in pre-resonant and resonant conditions, by using
an excitation source at 633 and 532 nm, respectively.
In the case of pre-resonance conditions, we observed the same tendencies as for non-resonant
conditions (Figure 42). From Table 3, we can conclude that with low and high concentrations of
[Ni(4dopedt)2] in blends, the organisation of the P3HT chains is maintained. Peak positions for C-
C and C=C vibrations are approximately constant with a slight but not significant red shift when the
nickel complex concentration is raised. The same applies for FWHM, which becomes slightly lower
for both vibrational modes when the acceptor concentration increases. Peak intensities and intensity
ratios confirm our supposition of the absence of organisation impediment and the remaining P3HT
crystallinity. In contrast, examples in the literature mention lower order P3HT crystallinity, even for
annealed thin films of P3HT:PCBM 1:1 blend examined at 633 nm, as highlighted by broader C-C
and C=C vibrational peaks.53,97 This emphasizes the positive effect of [Ni(4dopedt)2] on P3HT
organisation with respect to PCBM.
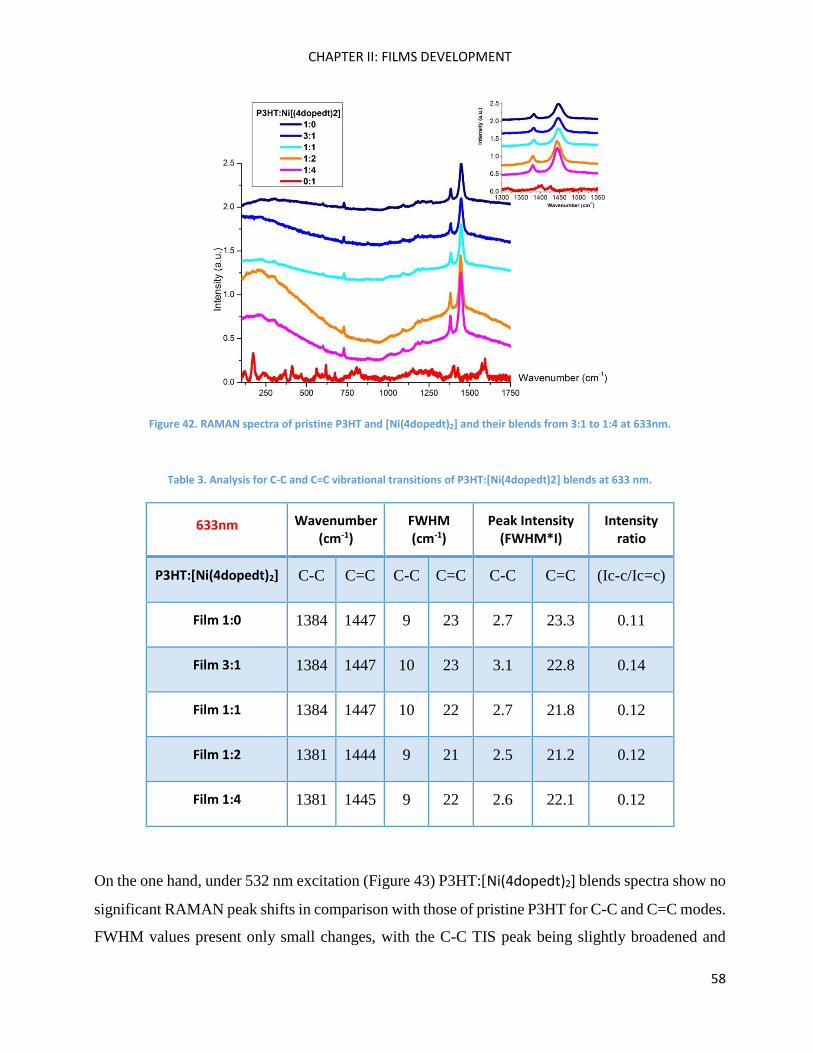
CHAPTER II: FILMS DEVELOPMENT
58
Figure 42. RAMAN spectra of pristine P3HT and [Ni(4dopedt)2] and their blends from 3:1 to 1:4 at 633nm.
Table 3. Analysis for C-C and C=C vibrational transitions of P3HT:[Ni(4dopedt)2] blends at 633 nm.
633nm Wavenumber (cm-1)
FWHM (cm-1)
Peak Intensity (FWHM*I)
Intensity ratio
P3HT:[Ni(4dopedt)2] C-C C=C C-C C=C C-C C=C (Ic-c/Ic=c)
Film 1:0 1384 1447 9 23 2.7 23.3 0.11
Film 3:1 1384 1447 10 23 3.1 22.8 0.14
Film 1:1 1384 1447 10 22 2.7 21.8 0.12
Film 1:2 1381 1444 9 21 2.5 21.2 0.12
Film 1:4 1381 1445 9 22 2.6 22.1 0.12
On the one hand, under 532 nm excitation (Figure 43) P3HT:[Ni(4dopedt)2] blends spectra show no
significant RAMAN peak shifts in comparison with those of pristine P3HT for C-C and C=C modes.
FWHM values present only small changes, with the C-C TIS peak being slightly broadened and
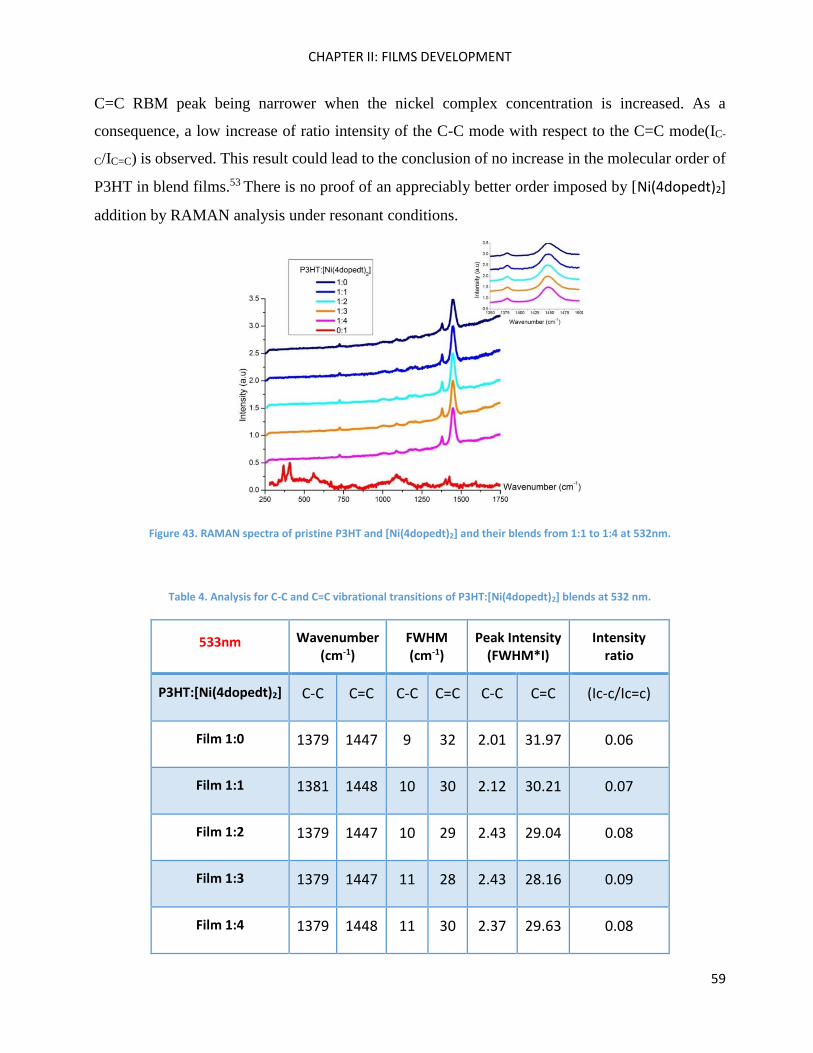
CHAPTER II: FILMS DEVELOPMENT
59
C=C RBM peak being narrower when the nickel complex concentration is increased. As a
consequence, a low increase of ratio intensity of the C-C mode with respect to the C=C mode(IC-
C/IC=C) is observed. This result could lead to the conclusion of no increase in the molecular order of
P3HT in blend films.53 There is no proof of an appreciably better order imposed by [Ni(4dopedt)2]
addition by RAMAN analysis under resonant conditions.
Figure 43. RAMAN spectra of pristine P3HT and [Ni(4dopedt)2] and their blends from 1:1 to 1:4 at 532nm.
Table 4. Analysis for C-C and C=C vibrational transitions of P3HT:[Ni(4dopedt)2] blends at 532 nm.
533nm Wavenumber (cm-1)
FWHM (cm-1)
Peak Intensity (FWHM*I)
Intensity ratio
P3HT:[Ni(4dopedt)2] C-C C=C C-C C=C C-C C=C (Ic-c/Ic=c)
Film 1:0 1379 1447 9 32 2.01 31.97 0.06
Film 1:1 1381 1448 10 30 2.12 30.21 0.07
Film 1:2 1379 1447 10 29 2.43 29.04 0.08
Film 1:3 1379 1447 11 28 2.43 28.16 0.09
Film 1:4 1379 1448 11 30 2.37 29.63 0.08
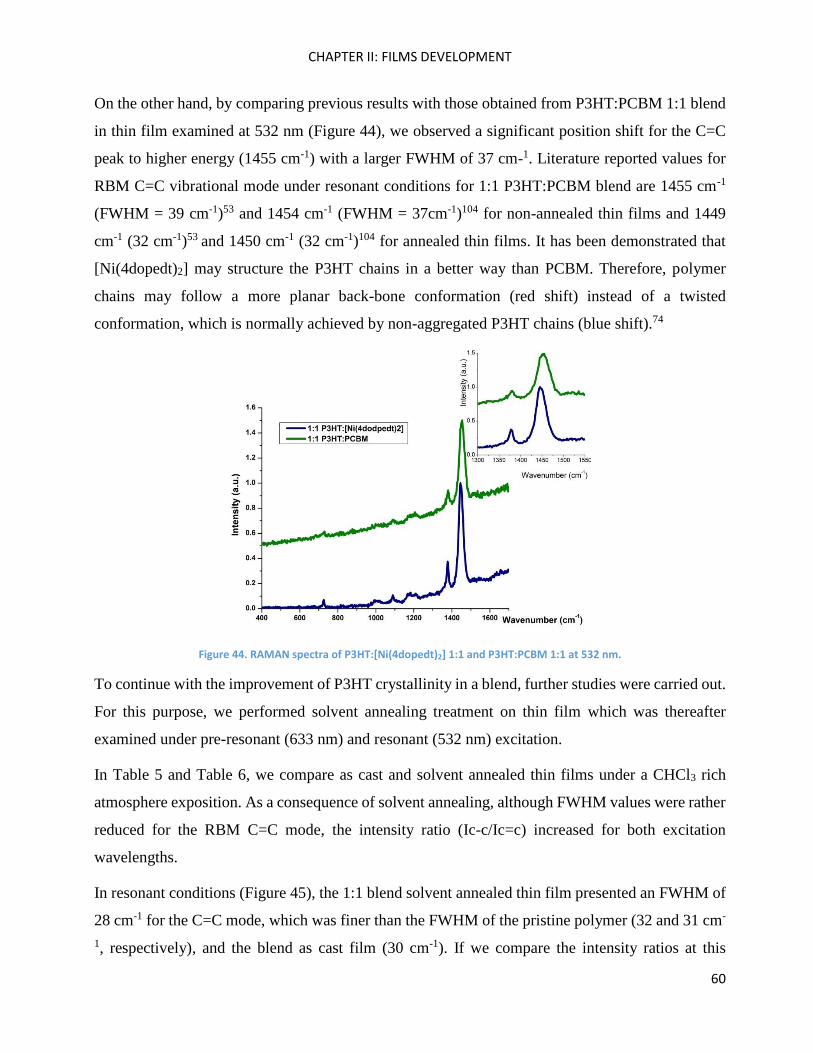
CHAPTER II: FILMS DEVELOPMENT
60
On the other hand, by comparing previous results with those obtained from P3HT:PCBM 1:1 blend
in thin film examined at 532 nm (Figure 44), we observed a significant position shift for the C=C
peak to higher energy (1455 cm-1) with a larger FWHM of 37 cm-1. Literature reported values for
RBM C=C vibrational mode under resonant conditions for 1:1 P3HT:PCBM blend are 1455 cm-1
(FWHM = 39 cm-1)53 and 1454 cm-1 (FWHM = 37cm-1)104 for non-annealed thin films and 1449
cm-1 (32 cm-1)53 and 1450 cm-1 (32 cm-1)104 for annealed thin films. It has been demonstrated that
[Ni(4dopedt)2] may structure the P3HT chains in a better way than PCBM. Therefore, polymer
chains may follow a more planar back-bone conformation (red shift) instead of a twisted
conformation, which is normally achieved by non-aggregated P3HT chains (blue shift).74
Figure 44. RAMAN spectra of P3HT:[Ni(4dopedt)2] 1:1 and P3HT:PCBM 1:1 at 532 nm.
To continue with the improvement of P3HT crystallinity in a blend, further studies were carried out.
For this purpose, we performed solvent annealing treatment on thin film which was thereafter
examined under pre-resonant (633 nm) and resonant (532 nm) excitation.
In Table 5 and Table 6, we compare as cast and solvent annealed thin films under a CHCl3 rich
atmosphere exposition. As a consequence of solvent annealing, although FWHM values were rather
reduced for the RBM C=C mode, the intensity ratio (Ic-c/Ic=c) increased for both excitation
wavelengths.
In resonant conditions (Figure 45), the 1:1 blend solvent annealed thin film presented an FWHM of
28 cm-1 for the C=C mode, which was finer than the FWHM of the pristine polymer (32 and 31 cm-
1, respectively), and the blend as cast film (30 cm-1). If we compare the intensity ratios at this
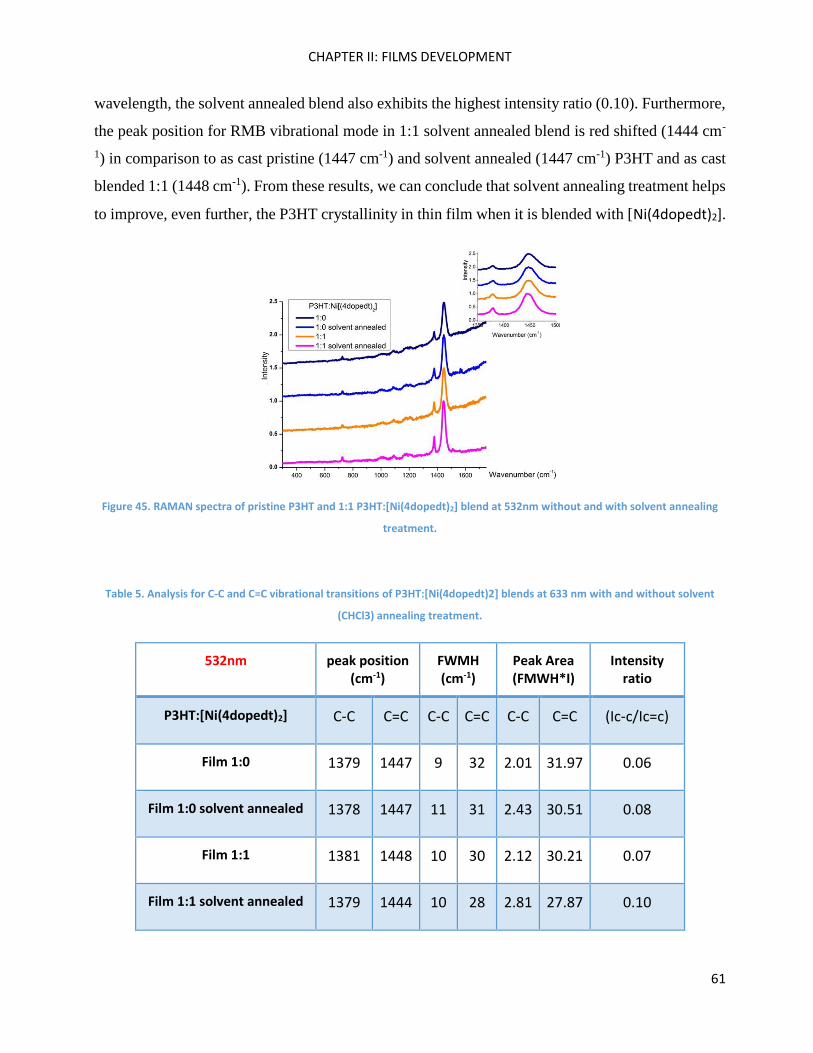
CHAPTER II: FILMS DEVELOPMENT
61
wavelength, the solvent annealed blend also exhibits the highest intensity ratio (0.10). Furthermore,
the peak position for RMB vibrational mode in 1:1 solvent annealed blend is red shifted (1444 cm-
1) in comparison to as cast pristine (1447 cm-1) and solvent annealed (1447 cm-1) P3HT and as cast
blended 1:1 (1448 cm-1). From these results, we can conclude that solvent annealing treatment helps
to improve, even further, the P3HT crystallinity in thin film when it is blended with [Ni(4dopedt)2].
Figure 45. RAMAN spectra of pristine P3HT and 1:1 P3HT:[Ni(4dopedt)2] blend at 532nm without and with solvent annealing
treatment.
Table 5. Analysis for C-C and C=C vibrational transitions of P3HT:[Ni(4dopedt)2] blends at 633 nm with and without solvent
(CHCl3) annealing treatment.
532nm peak position (cm-1)
FWMH (cm-1)
Peak Area (FMWH*I)
Intensity ratio
P3HT:[Ni(4dopedt)2] C-C C=C C-C C=C C-C C=C (Ic-c/Ic=c)
Film 1:0 1379 1447 9 32 2.01 31.97 0.06
Film 1:0 solvent annealed 1378 1447 11 31 2.43 30.51 0.08
Film 1:1 1381 1448 10 30 2.12 30.21 0.07
Film 1:1 solvent annealed 1379 1444 10 28 2.81 27.87 0.10
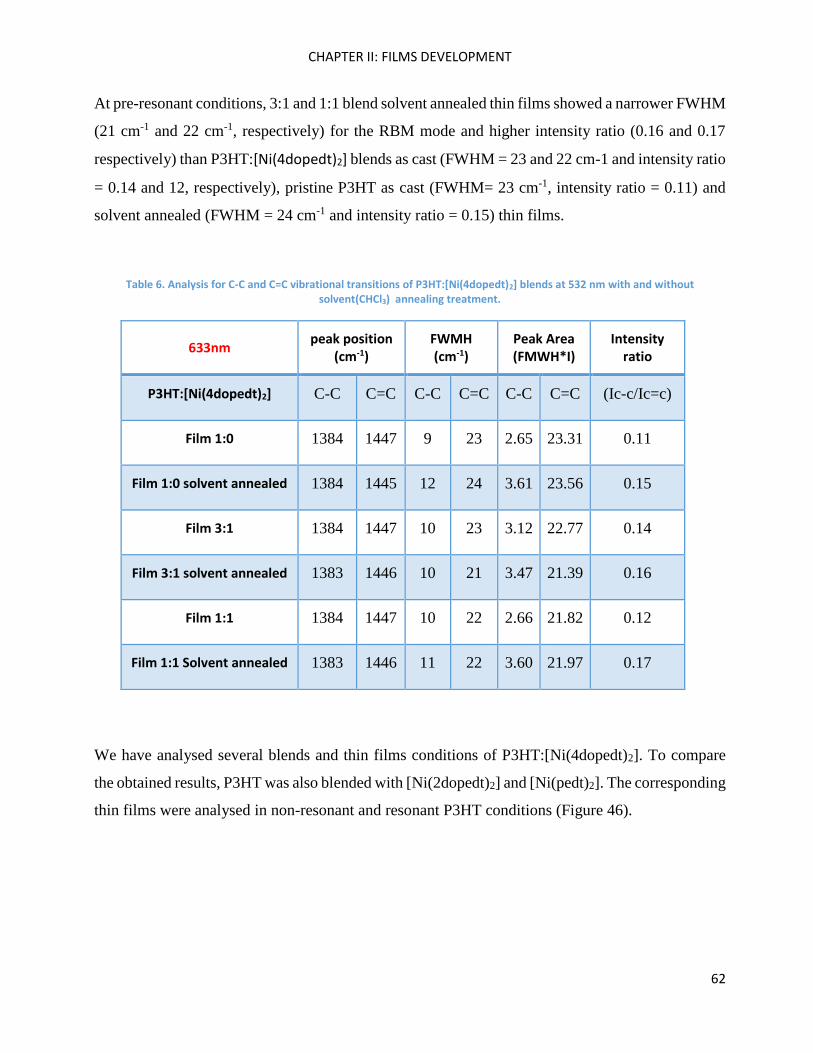
CHAPTER II: FILMS DEVELOPMENT
62
At pre-resonant conditions, 3:1 and 1:1 blend solvent annealed thin films showed a narrower FWHM
(21 cm-1 and 22 cm-1, respectively) for the RBM mode and higher intensity ratio (0.16 and 0.17
respectively) than P3HT:[Ni(4dopedt)2] blends as cast (FWHM = 23 and 22 cm-1 and intensity ratio
= 0.14 and 12, respectively), pristine P3HT as cast (FWHM= 23 cm-1, intensity ratio = 0.11) and
solvent annealed (FWHM = 24 cm-1 and intensity ratio = 0.15) thin films.
Table 6. Analysis for C-C and C=C vibrational transitions of P3HT:[Ni(4dopedt)2] blends at 532 nm with and without solvent(CHCl3) annealing treatment.
We have analysed several blends and thin films conditions of P3HT:[Ni(4dopedt)2]. To compare
the obtained results, P3HT was also blended with [Ni(2dopedt)2] and [Ni(pedt)2]. The corresponding
thin films were analysed in non-resonant and resonant P3HT conditions (Figure 46).
633nm peak position
(cm-1) FWMH (cm-1)
Peak Area (FMWH*I)
Intensity ratio
P3HT:[Ni(4dopedt)2] C-C C=C C-C C=C C-C C=C (Ic-c/Ic=c)
Film 1:0 1384 1447 9 23 2.65 23.31 0.11
Film 1:0 solvent annealed 1384 1445 12 24 3.61 23.56 0.15
Film 3:1 1384 1447 10 23 3.12 22.77 0.14
Film 3:1 solvent annealed 1383 1446 10 21 3.47 21.39 0.16
Film 1:1 1384 1447 10 22 2.66 21.82 0.12
Film 1:1 Solvent annealed 1383 1446 11 22 3.60 21.97 0.17
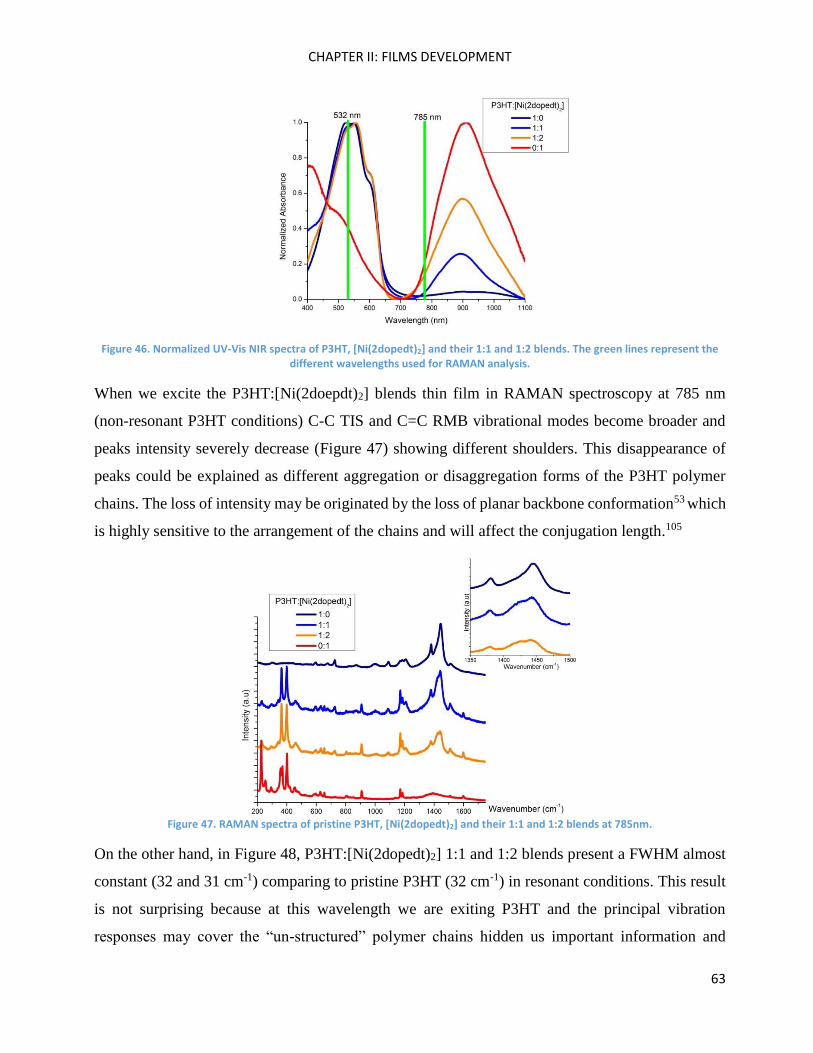
CHAPTER II: FILMS DEVELOPMENT
63
Figure 46. Normalized UV-Vis NIR spectra of P3HT, [Ni(2dopedt)2] and their 1:1 and 1:2 blends. The green lines represent the
different wavelengths used for RAMAN analysis.
When we excite the P3HT:[Ni(2doepdt)2] blends thin film in RAMAN spectroscopy at 785 nm
(non-resonant P3HT conditions) C-C TIS and C=C RMB vibrational modes become broader and
peaks intensity severely decrease (Figure 47) showing different shoulders. This disappearance of
peaks could be explained as different aggregation or disaggregation forms of the P3HT polymer
chains. The loss of intensity may be originated by the loss of planar backbone conformation53 which
is highly sensitive to the arrangement of the chains and will affect the conjugation length.105
Figure 47. RAMAN spectra of pristine P3HT, [Ni(2dopedt)2] and their 1:1 and 1:2 blends at 785nm.
On the other hand, in Figure 48, P3HT:[Ni(2dopedt)2] 1:1 and 1:2 blends present a FWHM almost
constant (32 and 31 cm-1) comparing to pristine P3HT (32 cm-1) in resonant conditions. This result
is not surprising because at this wavelength we are exiting P3HT and the principal vibration
responses may cover the “un-structured” polymer chains hidden us important information and
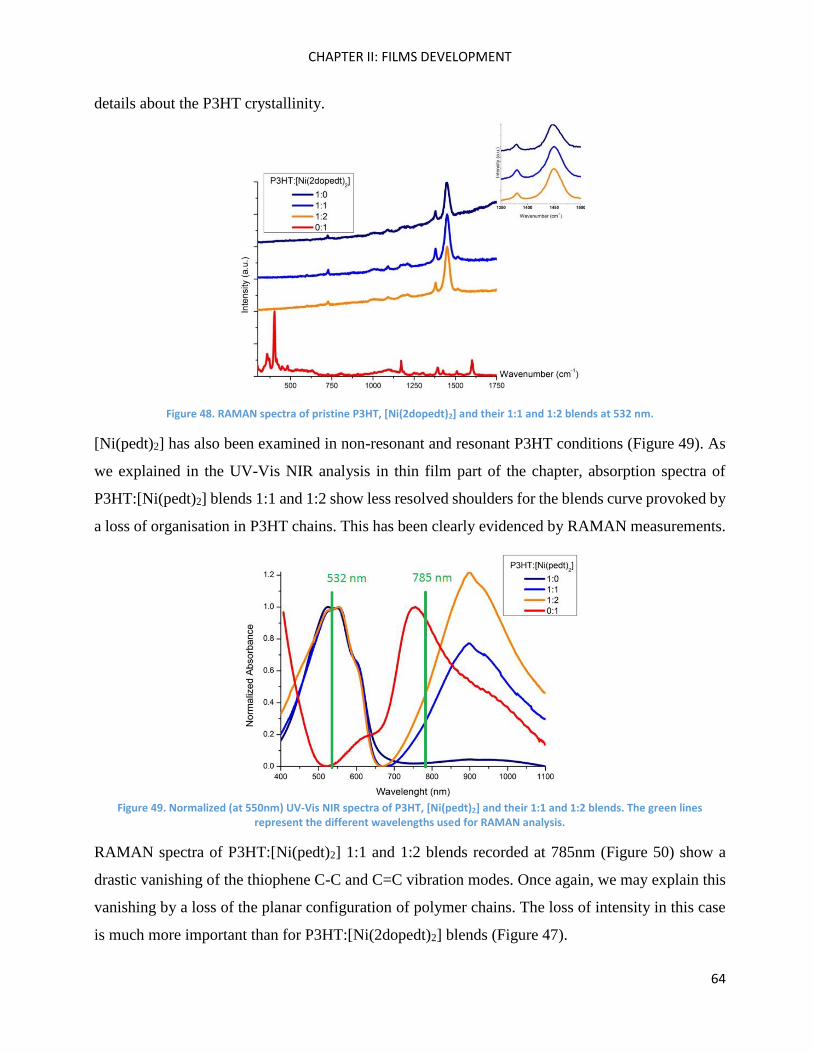
CHAPTER II: FILMS DEVELOPMENT
64
details about the P3HT crystallinity.
Figure 48. RAMAN spectra of pristine P3HT, [Ni(2dopedt)2] and their 1:1 and 1:2 blends at 532 nm.
[Ni(pedt)2] has also been examined in non-resonant and resonant P3HT conditions (Figure 49). As
we explained in the UV-Vis NIR analysis in thin film part of the chapter, absorption spectra of
P3HT:[Ni(pedt)2] blends 1:1 and 1:2 show less resolved shoulders for the blends curve provoked by
a loss of organisation in P3HT chains. This has been clearly evidenced by RAMAN measurements.
Figure 49. Normalized (at 550nm) UV-Vis NIR spectra of P3HT, [Ni(pedt)2] and their 1:1 and 1:2 blends. The green lines
represent the different wavelengths used for RAMAN analysis.
RAMAN spectra of P3HT:[Ni(pedt)2] 1:1 and 1:2 blends recorded at 785nm (Figure 50) show a
drastic vanishing of the thiophene C-C and C=C vibration modes. Once again, we may explain this
vanishing by a loss of the planar configuration of polymer chains. The loss of intensity in this case
is much more important than for P3HT:[Ni(2dopedt)2] blends (Figure 47).
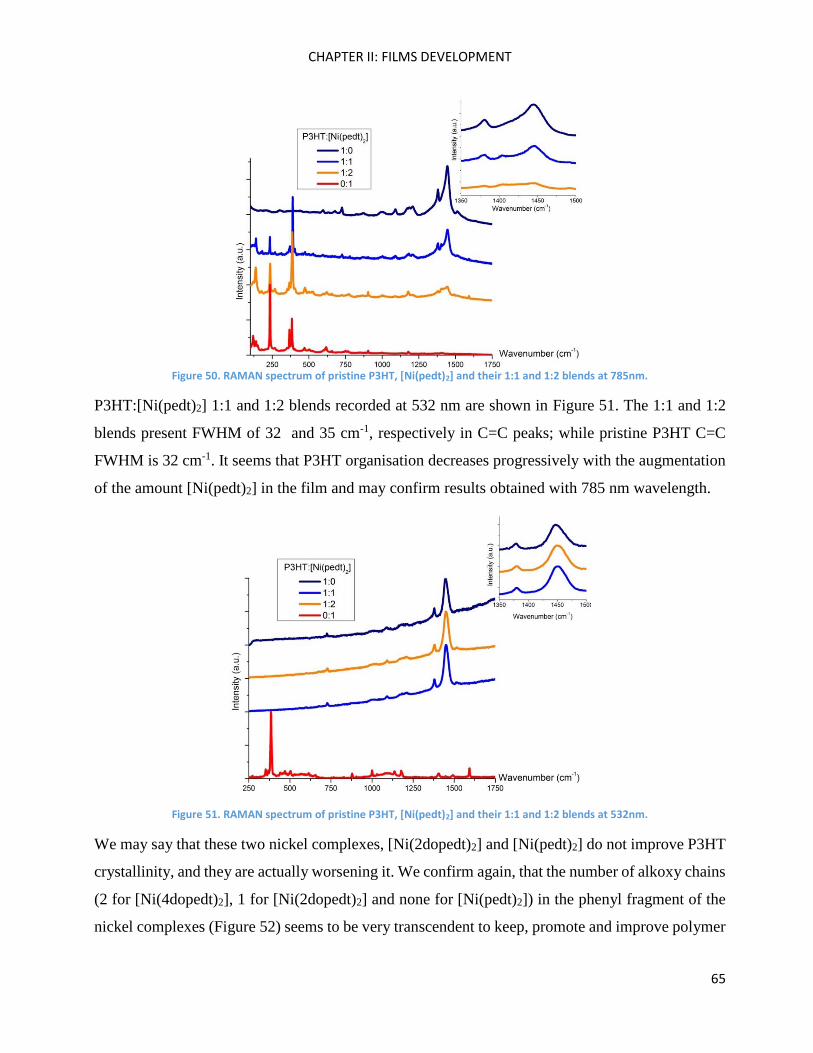
CHAPTER II: FILMS DEVELOPMENT
65
Figure 50. RAMAN spectrum of pristine P3HT, [Ni(pedt)2] and their 1:1 and 1:2 blends at 785nm.
P3HT:[Ni(pedt)2] 1:1 and 1:2 blends recorded at 532 nm are shown in Figure 51. The 1:1 and 1:2
blends present FWHM of 32 and 35 cm-1, respectively in C=C peaks; while pristine P3HT C=C
FWHM is 32 cm-1. It seems that P3HT organisation decreases progressively with the augmentation
of the amount [Ni(pedt)2] in the film and may confirm results obtained with 785 nm wavelength.
Figure 51. RAMAN spectrum of pristine P3HT, [Ni(pedt)2] and their 1:1 and 1:2 blends at 532nm.
We may say that these two nickel complexes, [Ni(2dopedt)2] and [Ni(pedt)2] do not improve P3HT
crystallinity, and they are actually worsening it. We confirm again, that the number of alkoxy chains
(2 for [Ni(4dopedt)2], 1 for [Ni(2dopedt)2] and none for [Ni(pedt)2]) in the phenyl fragment of the
nickel complexes (Figure 52) seems to be very transcendent to keep, promote and improve polymer
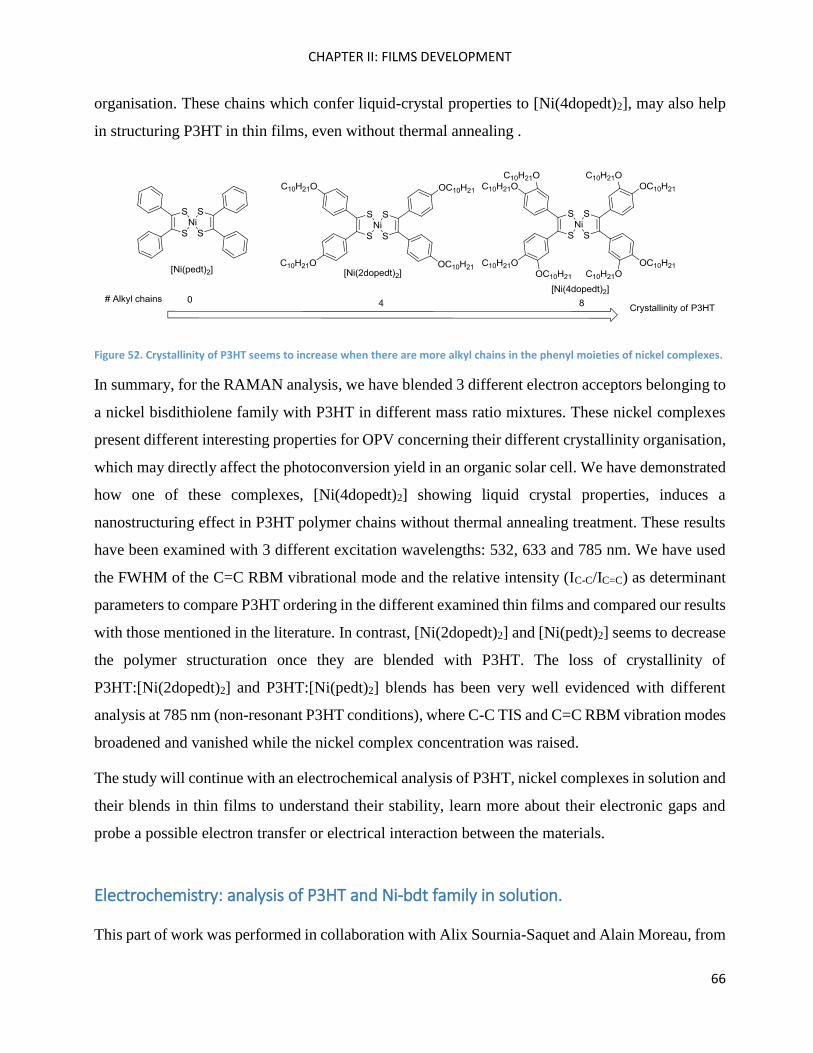
CHAPTER II: FILMS DEVELOPMENT
66
organisation. These chains which confer liquid-crystal properties to [Ni(4dopedt)2], may also help
in structuring P3HT in thin films, even without thermal annealing .
Figure 52. Crystallinity of P3HT seems to increase when there are more alkyl chains in the phenyl moieties of nickel complexes.
In summary, for the RAMAN analysis, we have blended 3 different electron acceptors belonging to
a nickel bisdithiolene family with P3HT in different mass ratio mixtures. These nickel complexes
present different interesting properties for OPV concerning their different crystallinity organisation,
which may directly affect the photoconversion yield in an organic solar cell. We have demonstrated
how one of these complexes, [Ni(4dopedt)2] showing liquid crystal properties, induces a
nanostructuring effect in P3HT polymer chains without thermal annealing treatment. These results
have been examined with 3 different excitation wavelengths: 532, 633 and 785 nm. We have used
the FWHM of the C=C RBM vibrational mode and the relative intensity (IC-C/IC=C) as determinant
parameters to compare P3HT ordering in the different examined thin films and compared our results
with those mentioned in the literature. In contrast, [Ni(2dopedt)2] and [Ni(pedt)2] seems to decrease
the polymer structuration once they are blended with P3HT. The loss of crystallinity of
P3HT:[Ni(2dopedt)2] and P3HT:[Ni(pedt)2] blends has been very well evidenced with different
analysis at 785 nm (non-resonant P3HT conditions), where C-C TIS and C=C RBM vibration modes
broadened and vanished while the nickel complex concentration was raised.
The study will continue with an electrochemical analysis of P3HT, nickel complexes in solution and
their blends in thin films to understand their stability, learn more about their electronic gaps and
probe a possible electron transfer or electrical interaction between the materials.
Electrochemistry: analysis of P3HT and Ni-bdt family in solution.
This part of work was performed in collaboration with Alix Sournia-Saquet and Alain Moreau, from
CHAPTER II: FILMS DEVELOPMENT
67
the LCC-CNRS laboratory.
For photovoltaic application, the reversibility of the REDOX process of concerned materials for
organic solar cells is an indispensable criterion which ensures components stability against
electronic transfer that would take place inside the framework.
The electrochemical study made by previous members of our team65 and some literature results106
have allowed us to obtain crucial parameters such as electron affinity, ionisation potential and
electrochemical gap of nickel complexes.
To a first approximation for some members of the Ni-bdt family, the first reduction potential
(relative to ferrocene/ferrocenium couple, Fc/Fc+) can be related to the electron affinity, EA, and
thus to the LUMO energy level, according to the following equation: EA (ELUMO) = - (Eonsetred
+ 5.39) eV. A similar relationship can be used for the first oxidation potential (relative to
ferrocene/ferrocenium couple, Fc/Fc+), the ionisation potential, IP, and the HOMO energies: IP
(EHOMO) = - (Eonsetox + 5.39) eV.39,107 From cyclic voltammetry measurements, the onset
potentials of reversible electrochemical processes are measured and used to evaluate the LUMO and
HOMO energy levels (Table 7).
Calculating LUMO/HOMO values of P3HT from electrochemical data is quite complicated. In the
literature, we can find a wide range of values for these levels. The wide difference between authors
resides, first of all, in the nature of their P3HT (regioregularity, regioirregularity, polydispersity,
conjugation length, etc.). The oxidation potential is related with the conjugation length of the
polymer. For longer conjugation lengths, one gets lower oxidation potentials. Moreover, the
measure depends on the technique used (Cyclic Voltammetry, Square Wave Voltammetry, Ultra-
Violet Photoemission Spectroscopy, X-ray Photoemission Spectroscopy, Inverse Photoemission
Spectroscopy, etc.) and the experiment conditions. Therefore, there are no established HOMO and
LUMO values for P3HT which are used by the entire scientific community, even if it is one of the
most important semiconducting polythiophenes. Theoretically, the optical gap is lower than the
difference between LUMO and HOMO levels which are related to the difference of ionisation
potential and electron affinity (fundamental gap), because, the optical gap does not take into account
the electron–hole pair binding energy. 108
In some cases, the authors calculate these levels via approximations using the optical gap. This is
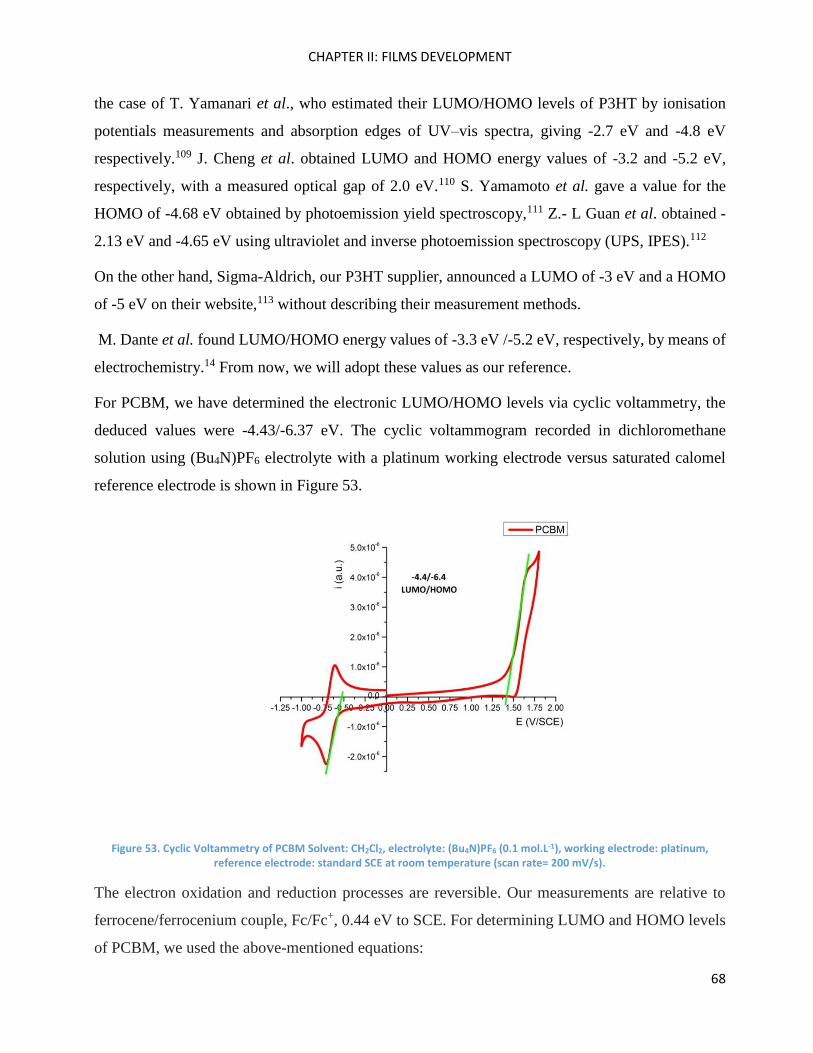
CHAPTER II: FILMS DEVELOPMENT
68
the case of T. Yamanari et al., who estimated their LUMO/HOMO levels of P3HT by ionisation
potentials measurements and absorption edges of UV–vis spectra, giving -2.7 eV and -4.8 eV
respectively.109 J. Cheng et al. obtained LUMO and HOMO energy values of -3.2 and -5.2 eV,
respectively, with a measured optical gap of 2.0 eV.110 S. Yamamoto et al. gave a value for the
HOMO of -4.68 eV obtained by photoemission yield spectroscopy,111 Z.- L Guan et al. obtained -
2.13 eV and -4.65 eV using ultraviolet and inverse photoemission spectroscopy (UPS, IPES).112
On the other hand, Sigma-Aldrich, our P3HT supplier, announced a LUMO of -3 eV and a HOMO
of -5 eV on their website,113 without describing their measurement methods.
M. Dante et al. found LUMO/HOMO energy values of -3.3 eV /-5.2 eV, respectively, by means of
electrochemistry.14 From now, we will adopt these values as our reference.
For PCBM, we have determined the electronic LUMO/HOMO levels via cyclic voltammetry, the
deduced values were -4.43/-6.37 eV. The cyclic voltammogram recorded in dichloromethane
solution using (Bu4N)PF6 electrolyte with a platinum working electrode versus saturated calomel
reference electrode is shown in Figure 53.
Figure 53. Cyclic Voltammetry of PCBM Solvent: CH2Cl2, electrolyte: (Bu4N)PF6 (0.1 mol.L-1), working electrode: platinum, reference electrode: standard SCE at room temperature (scan rate= 200 mV/s).
The electron oxidation and reduction processes are reversible. Our measurements are relative to
ferrocene/ferrocenium couple, Fc/Fc+, 0.44 eV to SCE. For determining LUMO and HOMO levels
of PCBM, we used the above-mentioned equations:
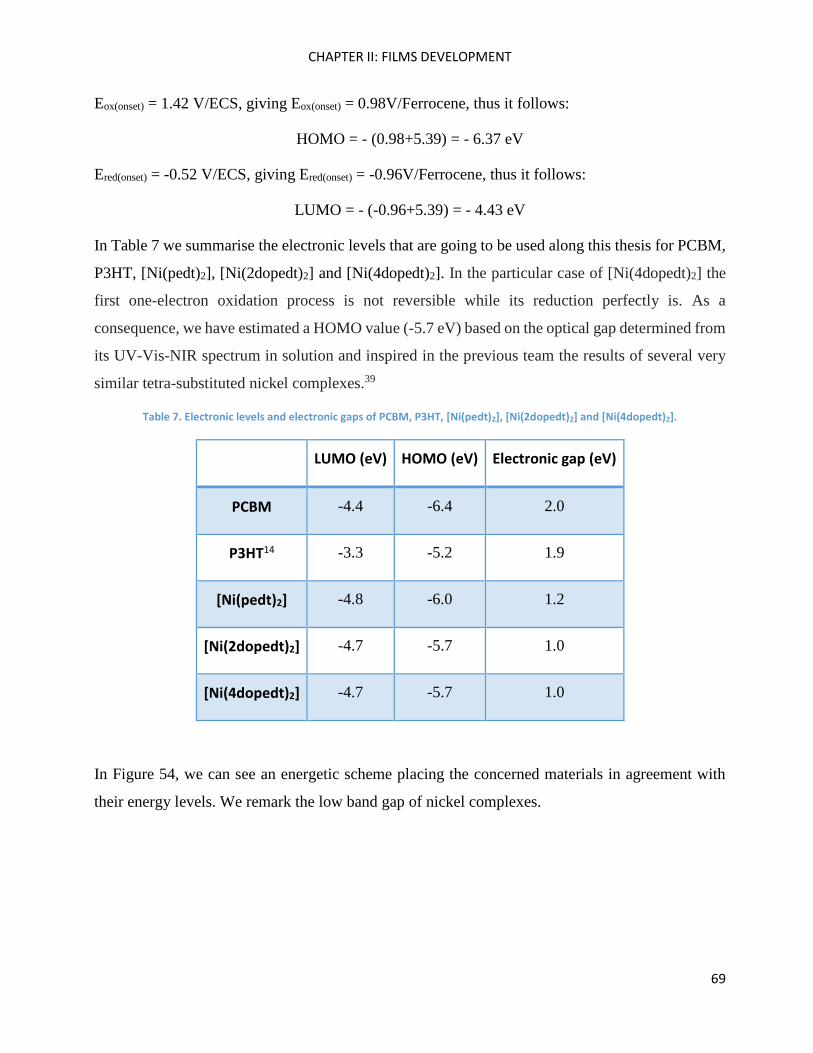
CHAPTER II: FILMS DEVELOPMENT
69
Eox(onset) = 1.42 V/ECS, giving Eox(onset) = 0.98V/Ferrocene, thus it follows:
HOMO = - (0.98+5.39) = - 6.37 eV
Ered(onset) = -0.52 V/ECS, giving Ered(onset) = -0.96V/Ferrocene, thus it follows:
LUMO = - (-0.96+5.39) = - 4.43 eV
In Table 7 we summarise the electronic levels that are going to be used along this thesis for PCBM,
P3HT, [Ni(pedt)2], [Ni(2dopedt)2] and [Ni(4dopedt)2]. In the particular case of [Ni(4dopedt)2] the
first one-electron oxidation process is not reversible while its reduction perfectly is. As a
consequence, we have estimated a HOMO value (-5.7 eV) based on the optical gap determined from
its UV-Vis-NIR spectrum in solution and inspired in the previous team the results of several very
similar tetra-substituted nickel complexes.39
Table 7. Electronic levels and electronic gaps of PCBM, P3HT, [Ni(pedt)2], [Ni(2dopedt)2] and [Ni(4dopedt)2].
LUMO (eV) HOMO (eV) Electronic gap (eV)
PCBM -4.4 -6.4 2.0
P3HT14 -3.3 -5.2 1.9
[Ni(pedt)2] -4.8 -6.0 1.2
[Ni(2dopedt)2] -4.7 -5.7 1.0
[Ni(4dopedt)2] -4.7 -5.7 1.0
In Figure 54, we can see an energetic scheme placing the concerned materials in agreement with
their energy levels. We remark the low band gap of nickel complexes.
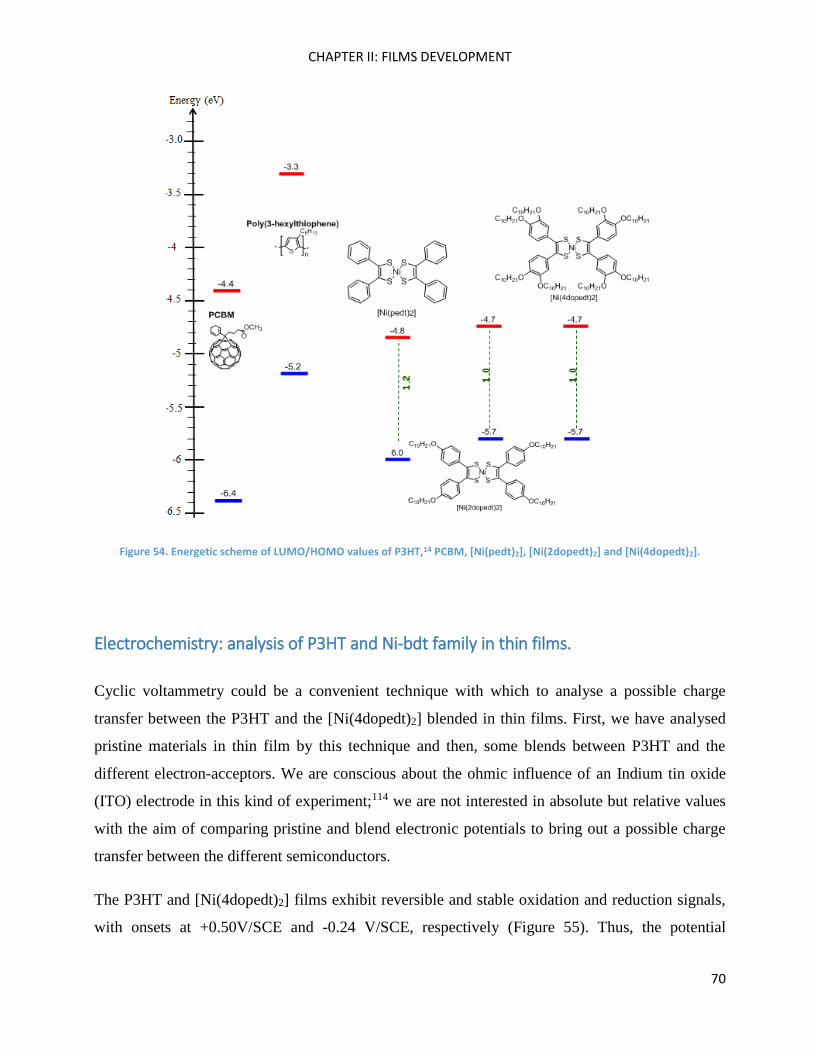
CHAPTER II: FILMS DEVELOPMENT
70
Figure 54. Energetic scheme of LUMO/HOMO values of P3HT,14 PCBM, [Ni(pedt)2], [Ni(2dopedt)2] and [Ni(4dopedt)2].
Electrochemistry: analysis of P3HT and Ni-bdt family in thin films.
Cyclic voltammetry could be a convenient technique with which to analyse a possible charge
transfer between the P3HT and the [Ni(4dopedt)2] blended in thin films. First, we have analysed
pristine materials in thin film by this technique and then, some blends between P3HT and the
different electron-acceptors. We are conscious about the ohmic influence of an Indium tin oxide
(ITO) electrode in this kind of experiment;114 we are not interested in absolute but relative values
with the aim of comparing pristine and blend electronic potentials to bring out a possible charge
transfer between the different semiconductors.
The P3HT and [Ni(4dopedt)2] films exhibit reversible and stable oxidation and reduction signals,
with onsets at +0.50V/SCE and -0.24 V/SCE, respectively (Figure 55). Thus, the potential
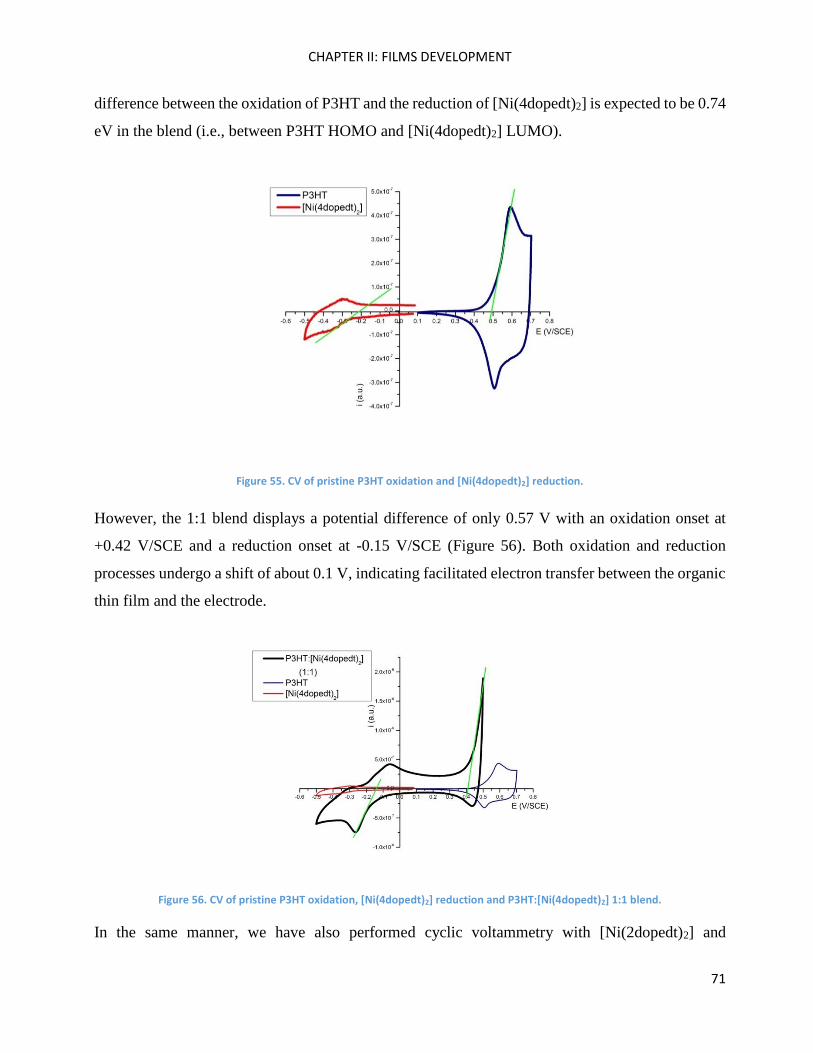
CHAPTER II: FILMS DEVELOPMENT
71
difference between the oxidation of P3HT and the reduction of [Ni(4dopedt)2] is expected to be 0.74
eV in the blend (i.e., between P3HT HOMO and [Ni(4dopedt)2] LUMO).
Figure 55. CV of pristine P3HT oxidation and [Ni(4dopedt)2] reduction.
However, the 1:1 blend displays a potential difference of only 0.57 V with an oxidation onset at
+0.42 V/SCE and a reduction onset at -0.15 V/SCE (Figure 56). Both oxidation and reduction
processes undergo a shift of about 0.1 V, indicating facilitated electron transfer between the organic
thin film and the electrode.
Figure 56. CV of pristine P3HT oxidation, [Ni(4dopedt)2] reduction and P3HT:[Ni(4dopedt)2] 1:1 blend.
In the same manner, we have also performed cyclic voltammetry with [Ni(2dopedt)2] and

CHAPTER II: FILMS DEVELOPMENT
72
[Ni(pedt)2] pristine and blended with P3HT in thin films.
[Ni(2dopedt)2] film shows a reversible reduction signal with onset at -0.25 V/SCE (Figure 57). The
potential difference between the oxidation of P3HT (+0.50V/SCE) and [Ni(2dopedt)2] is expected
to be 0.75 eV, while in the 1:1 blend is around 0.35 eV (Figure 57) with an oxidation onset at +0.35
V/SCE and a reduction onset at 0 V/SCE.
Figure 57. CV of pristine P3HT oxidation and [Ni(4dopedt)2] reduction and P3HT:[Ni(2dopedt)2] 1:1 blend.
On the other hand, pristine [Ni(pedt)2] film presents a positive reduction signal with onset at +0.15
V/SCE (Figure 58). The pristine potential difference compared to P3HT oxidation onset
(+0.50V/SCE) is about 0.35 eV. The P3HT:[Ni(pedt)2] 1:1 blend shows an oxidation onset at +0.43
V/SCE and an onset reduction at +0.18 V/SCE, pointing out a difference of 0.25 eV (Figure 58)
instead of the expected 0.35 eV.
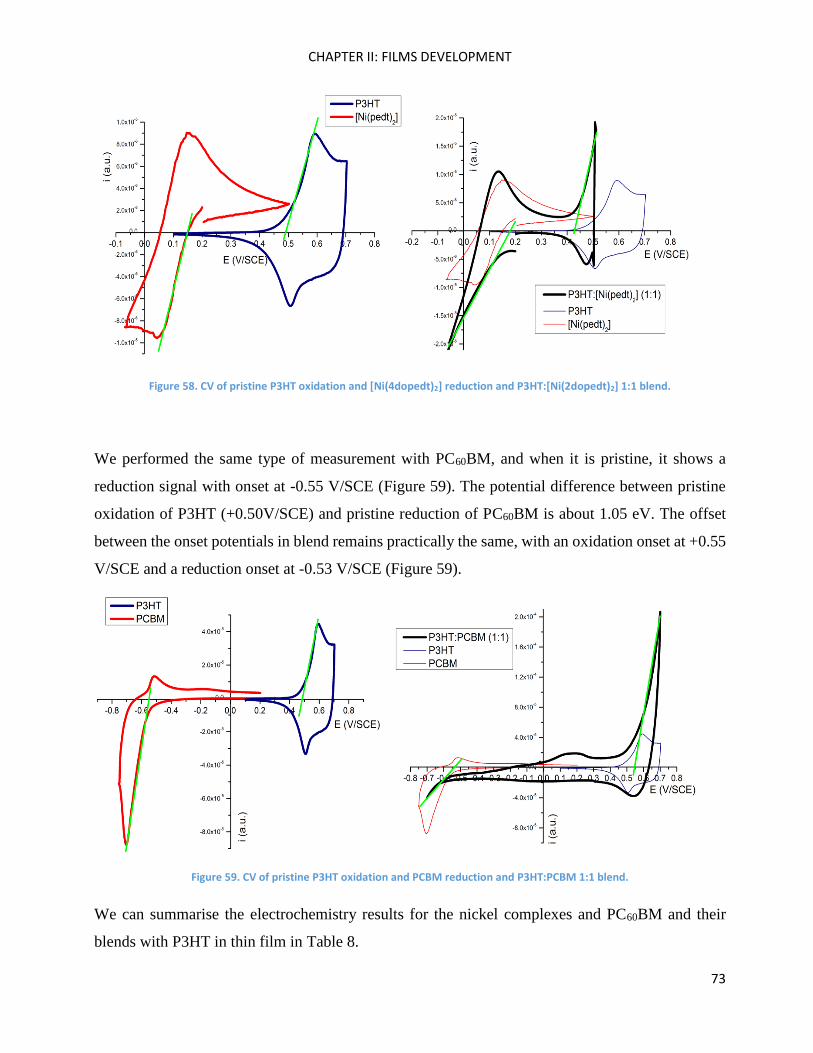
CHAPTER II: FILMS DEVELOPMENT
73
Figure 58. CV of pristine P3HT oxidation and [Ni(4dopedt)2] reduction and P3HT:[Ni(2dopedt)2] 1:1 blend.
We performed the same type of measurement with PC60BM, and when it is pristine, it shows a
reduction signal with onset at -0.55 V/SCE (Figure 59). The potential difference between pristine
oxidation of P3HT (+0.50V/SCE) and pristine reduction of PC60BM is about 1.05 eV. The offset
between the onset potentials in blend remains practically the same, with an oxidation onset at +0.55
V/SCE and a reduction onset at -0.53 V/SCE (Figure 59).
Figure 59. CV of pristine P3HT oxidation and PCBM reduction and P3HT:PCBM 1:1 blend.
We can summarise the electrochemistry results for the nickel complexes and PC60BM and their
blends with P3HT in thin film in Table 8.
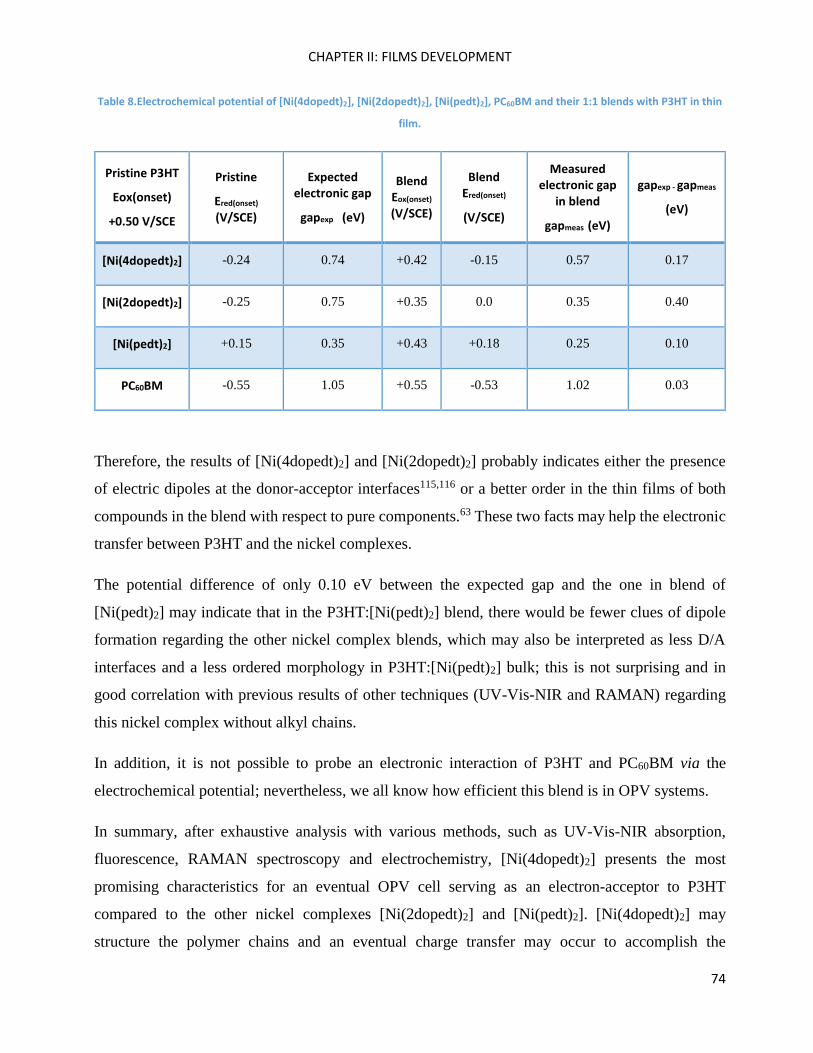
CHAPTER II: FILMS DEVELOPMENT
74
Table 8.Electrochemical potential of [Ni(4dopedt)2], [Ni(2dopedt)2], [Ni(pedt)2], PC60BM and their 1:1 blends with P3HT in thin
film.
Pristine P3HT
Eox(onset)
+0.50 V/SCE
Pristine
Ered(onset) (V/SCE)
Expected electronic gap
gapexp (eV)
Blend Eox(onset) (V/SCE)
Blend Ered(onset)
(V/SCE)
Measured electronic gap
in blend
gapmeas (eV)
gapexp - gapmeas
(eV)
[Ni(4dopedt)2] -0.24 0.74 +0.42 -0.15 0.57 0.17
[Ni(2dopedt)2] -0.25 0.75 +0.35 0.0 0.35 0.40
[Ni(pedt)2] +0.15 0.35 +0.43 +0.18 0.25 0.10
PC60BM -0.55 1.05 +0.55 -0.53 1.02 0.03
Therefore, the results of [Ni(4dopedt)2] and [Ni(2dopedt)2] probably indicates either the presence
of electric dipoles at the donor-acceptor interfaces115,116 or a better order in the thin films of both
compounds in the blend with respect to pure components.63 These two facts may help the electronic
transfer between P3HT and the nickel complexes.
The potential difference of only 0.10 eV between the expected gap and the one in blend of
[Ni(pedt)2] may indicate that in the P3HT:[Ni(pedt)2] blend, there would be fewer clues of dipole
formation regarding the other nickel complex blends, which may also be interpreted as less D/A
interfaces and a less ordered morphology in P3HT:[Ni(pedt)2] bulk; this is not surprising and in
good correlation with previous results of other techniques (UV-Vis-NIR and RAMAN) regarding
this nickel complex without alkyl chains.
In addition, it is not possible to probe an electronic interaction of P3HT and PC60BM via the
electrochemical potential; nevertheless, we all know how efficient this blend is in OPV systems.
In summary, after exhaustive analysis with various methods, such as UV-Vis-NIR absorption,
fluorescence, RAMAN spectroscopy and electrochemistry, [Ni(4dopedt)2] presents the most
promising characteristics for an eventual OPV cell serving as an electron-acceptor to P3HT
compared to the other nickel complexes [Ni(2dopedt)2] and [Ni(pedt)2]. [Ni(4dopedt)2] may
structure the polymer chains and an eventual charge transfer may occur to accomplish the
CHAPTER II: FILMS DEVELOPMENT
75
photovoltaic effect. For these reasons, from now on, we are going to study P3HT:[Ni(4dopedt)2]
blends with the aim of achieving a better understanding of the intimate blend of both materials by
Atomic Force Microscopy with an eventual solar cell elaboration.
Atomic Force Microscopy (AFM) of P3HT and Ni-bdt family in thin films.
This part of work has been performed in collaboration with Christina Villeneuve-Faure, from the
LAPLACE laboratory.
As we have insisted before, photoconversion efficiency may be correlated not only with the inherent
physical properties of the OSCs (absorption, charge mobility), but also with the blend morphology
which is crucial for charges separation.117 Consequently, Atomic Force Microscopy (AFM) is a
high-resolution technic used to accurately characterise the morphology and local electrical
properties of BHJs in order to improve understanding of the physical mechanisms involved at the
nanoscale.118,119
For instance, Figure 60(a) and Figure 60(b) show typical P3HT:[Ni(4dopedt)2] 3:1 and 1:1 blend
microstructure surface topography, which consist of a homogeneous matrix and small fibrils. Blend
film topographies are quite different from those of pristine materials. Indeed, the surface
morphology presented a roughness close to 4.6 nm (8 and 5nm for P3HT and [Ni(4dopedt)2] areas,
respectively). This roughness is strongly related to [Ni(4dopedt)2] concentration, especially for
blends with an [Ni(4dopedt)2] weight ratio lower than 50%. Indeed, the roughness is 10.7 nm and
5.46 nm for 3:1 and 1:1 P3HT:[Ni(4dopedt)2] films, respectively (the values remain quite constant
for [Ni(4dopedt)2] concentrations up to 80%). Fibril shape follows the same evolution, with typical
widths of about 30 nm and 10–15 nm for 3:1 and 1:1 blends, respectively (Figure 60(a) and 4(b)).
These results corroborate the above conclusions from optical characterisations, indicating an
improved order of the P3HT chain by 1:1 blending in weight.
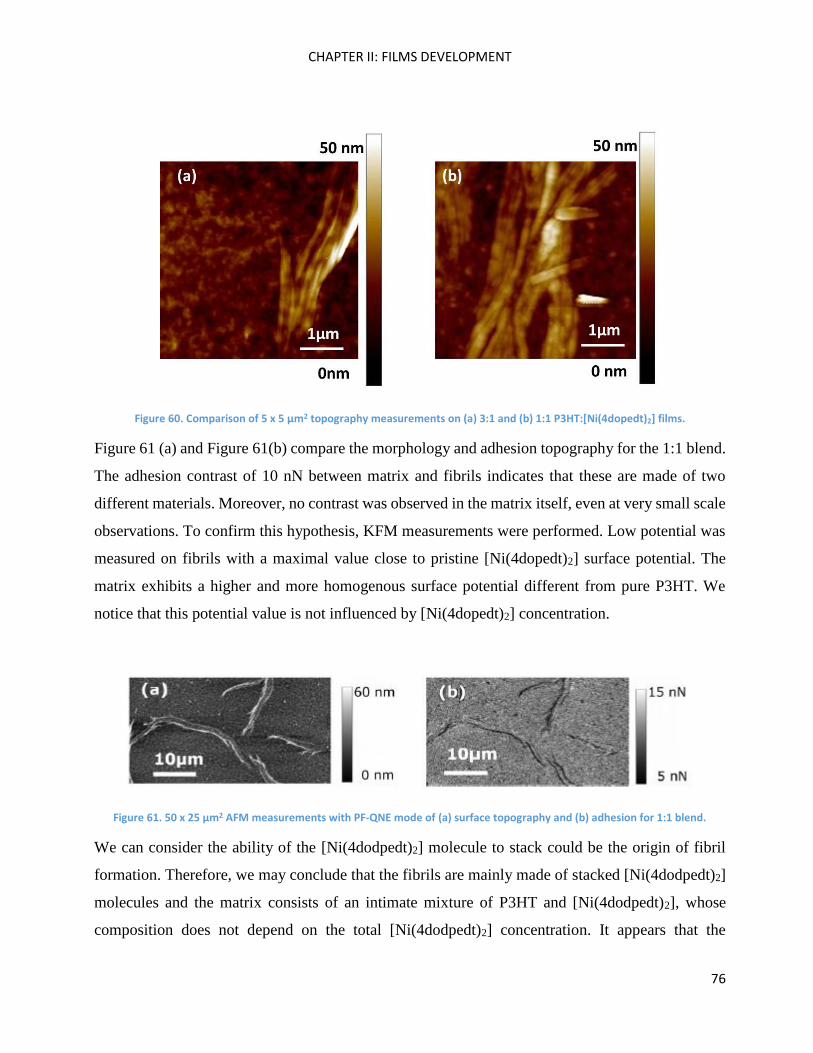
CHAPTER II: FILMS DEVELOPMENT
76
Figure 60. Comparison of 5 x 5 µm2 topography measurements on (a) 3:1 and (b) 1:1 P3HT:[Ni(4dopedt)2] films.
Figure 61 (a) and Figure 61(b) compare the morphology and adhesion topography for the 1:1 blend.
The adhesion contrast of 10 nN between matrix and fibrils indicates that these are made of two
different materials. Moreover, no contrast was observed in the matrix itself, even at very small scale
observations. To confirm this hypothesis, KFM measurements were performed. Low potential was
measured on fibrils with a maximal value close to pristine [Ni(4dopedt)2] surface potential. The
matrix exhibits a higher and more homogenous surface potential different from pure P3HT. We
notice that this potential value is not influenced by [Ni(4dopedt)2] concentration.
Figure 61. 50 x 25 µm2 AFM measurements with PF-QNE mode of (a) surface topography and (b) adhesion for 1:1 blend.
We can consider the ability of the [Ni(4dodpedt)2] molecule to stack could be the origin of fibril
formation. Therefore, we may conclude that the fibrils are mainly made of stacked [Ni(4dodpedt)2]
molecules and the matrix consists of an intimate mixture of P3HT and [Ni(4dodpedt)2], whose
composition does not depend on the total [Ni(4dodpedt)2] concentration. It appears that the
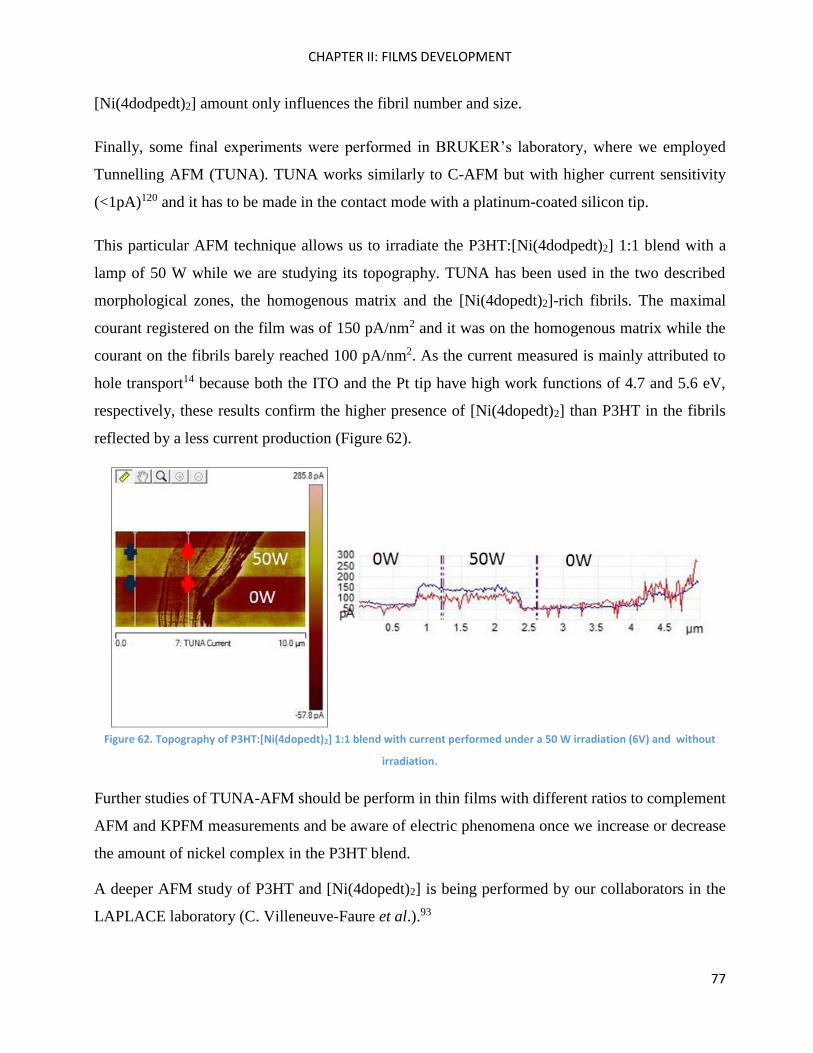
CHAPTER II: FILMS DEVELOPMENT
77
[Ni(4dodpedt)2] amount only influences the fibril number and size.
Finally, some final experiments were performed in BRUKER’s laboratory, where we employed
Tunnelling AFM (TUNA). TUNA works similarly to C-AFM but with higher current sensitivity
(<1pA)120 and it has to be made in the contact mode with a platinum-coated silicon tip.
This particular AFM technique allows us to irradiate the P3HT:[Ni(4dodpedt)2] 1:1 blend with a
lamp of 50 W while we are studying its topography. TUNA has been used in the two described
morphological zones, the homogenous matrix and the [Ni(4dopedt)2]-rich fibrils. The maximal
courant registered on the film was of 150 pA/nm2 and it was on the homogenous matrix while the
courant on the fibrils barely reached 100 pA/nm2. As the current measured is mainly attributed to
hole transport14 because both the ITO and the Pt tip have high work functions of 4.7 and 5.6 eV,
respectively, these results confirm the higher presence of [Ni(4dopedt)2] than P3HT in the fibrils
reflected by a less current production (Figure 62).
Figure 62. Topography of P3HT:[Ni(4dopedt)2] 1:1 blend with current performed under a 50 W irradiation (6V) and without
irradiation.
Further studies of TUNA-AFM should be perform in thin films with different ratios to complement
AFM and KPFM measurements and be aware of electric phenomena once we increase or decrease
the amount of nickel complex in the P3HT blend.
A deeper AFM study of P3HT and [Ni(4dopedt)2] is being performed by our collaborators in the
LAPLACE laboratory (C. Villeneuve-Faure et al.).93
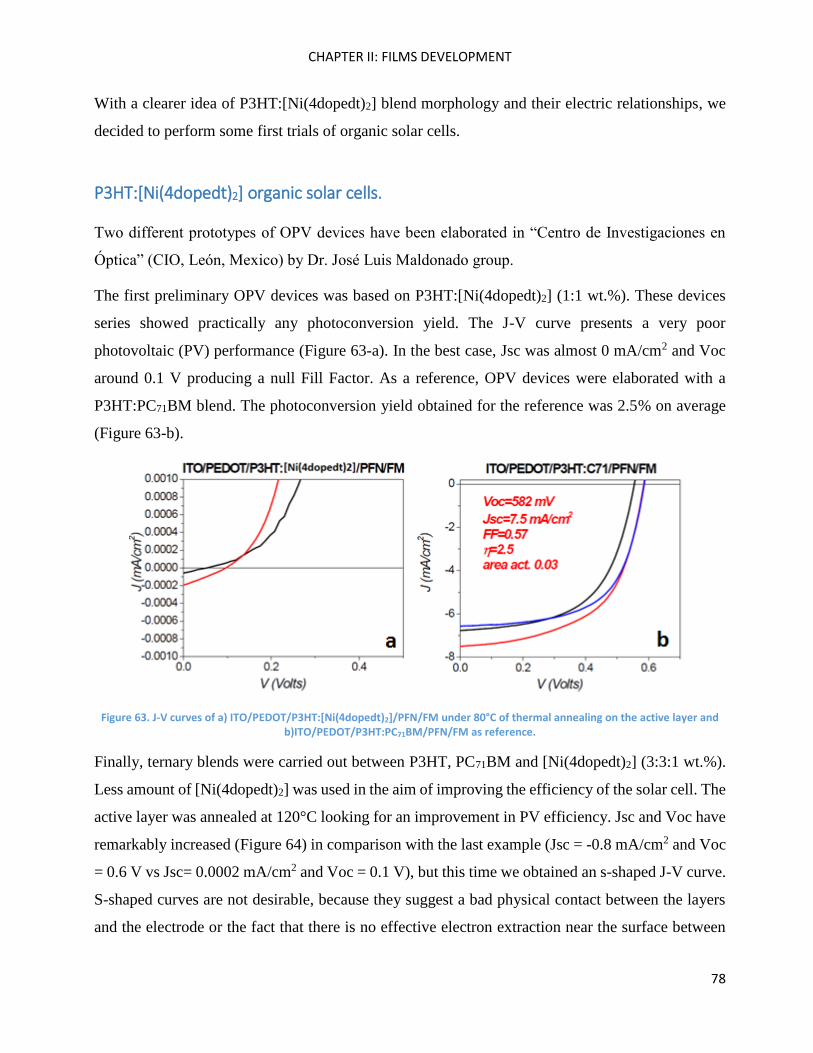
CHAPTER II: FILMS DEVELOPMENT
78
With a clearer idea of P3HT:[Ni(4dopedt)2] blend morphology and their electric relationships, we
decided to perform some first trials of organic solar cells.
P3HT:[Ni(4dopedt)2] organic solar cells.
Two different prototypes of OPV devices have been elaborated in “Centro de Investigaciones en
Óptica” (CIO, León, Mexico) by Dr. José Luis Maldonado group.
The first preliminary OPV devices was based on P3HT:[Ni(4dopedt)2] (1:1 wt.%). These devices
series showed practically any photoconversion yield. The J-V curve presents a very poor
photovoltaic (PV) performance (Figure 63-a). In the best case, Jsc was almost 0 mA/cm2 and Voc
around 0.1 V producing a null Fill Factor. As a reference, OPV devices were elaborated with a
P3HT:PC71BM blend. The photoconversion yield obtained for the reference was 2.5% on average
(Figure 63-b).
Figure 63. J-V curves of a) ITO/PEDOT/P3HT:[Ni(4dopedt)2]/PFN/FM under 80°C of thermal annealing on the active layer and b)ITO/PEDOT/P3HT:PC71BM/PFN/FM as reference.
Finally, ternary blends were carried out between P3HT, PC71BM and [Ni(4dopedt)2] (3:3:1 wt.%).
Less amount of [Ni(4dopedt)2] was used in the aim of improving the efficiency of the solar cell. The
active layer was annealed at 120°C looking for an improvement in PV efficiency. Jsc and Voc have
remarkably increased (Figure 64) in comparison with the last example (Jsc = -0.8 mA/cm2 and Voc
= 0.6 V vs Jsc= 0.0002 mA/cm2 and Voc = 0.1 V), but this time we obtained an s-shaped J-V curve.
S-shaped curves are not desirable, because they suggest a bad physical contact between the layers
and the electrode or the fact that there is no effective electron extraction near the surface between
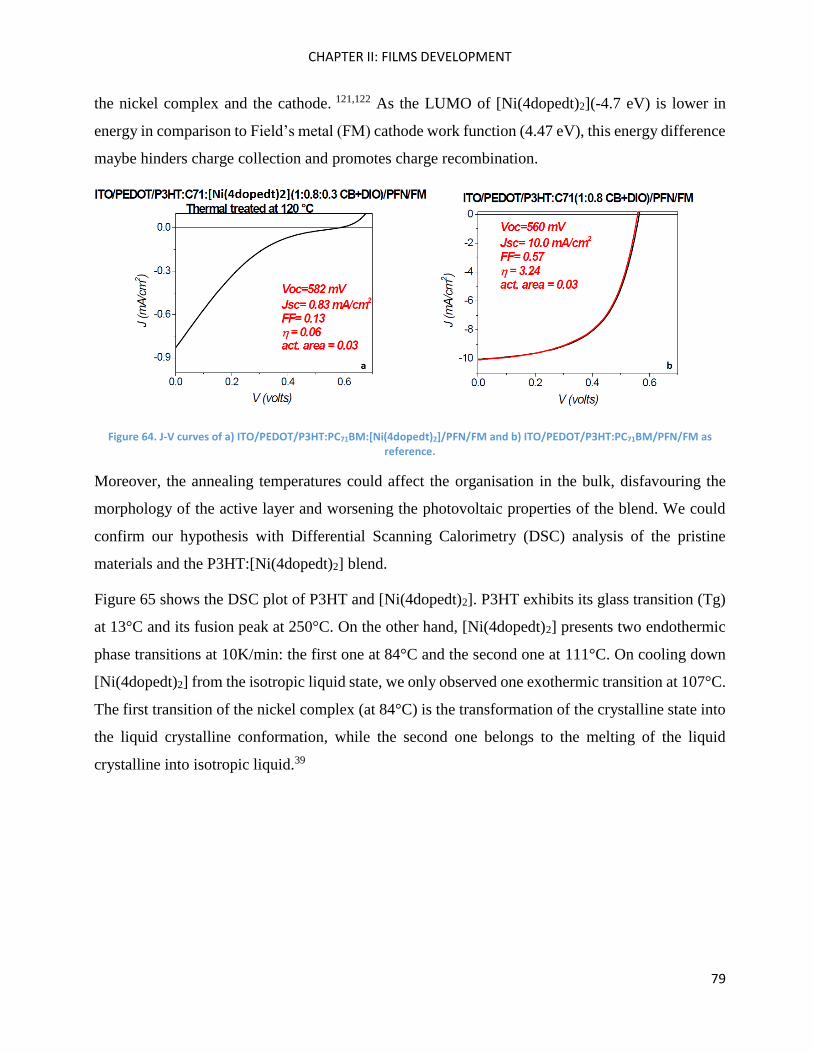
CHAPTER II: FILMS DEVELOPMENT
79
the nickel complex and the cathode. 121,122 As the LUMO of [Ni(4dopedt)2](-4.7 eV) is lower in
energy in comparison to Field’s metal (FM) cathode work function (4.47 eV), this energy difference
maybe hinders charge collection and promotes charge recombination.
Figure 64. J-V curves of a) ITO/PEDOT/P3HT:PC71BM:[Ni(4dopedt)2]/PFN/FM and b) ITO/PEDOT/P3HT:PC71BM/PFN/FM as reference.
Moreover, the annealing temperatures could affect the organisation in the bulk, disfavouring the
morphology of the active layer and worsening the photovoltaic properties of the blend. We could
confirm our hypothesis with Differential Scanning Calorimetry (DSC) analysis of the pristine
materials and the P3HT:[Ni(4dopedt)2] blend.
Figure 65 shows the DSC plot of P3HT and [Ni(4dopedt)2]. P3HT exhibits its glass transition (Tg)
at 13°C and its fusion peak at 250°C. On the other hand, [Ni(4dopedt)2] presents two endothermic
phase transitions at 10K/min: the first one at 84°C and the second one at 111°C. On cooling down
[Ni(4dopedt)2] from the isotropic liquid state, we only observed one exothermic transition at 107°C.
The first transition of the nickel complex (at 84°C) is the transformation of the crystalline state into
the liquid crystalline conformation, while the second one belongs to the melting of the liquid
crystalline into isotropic liquid.39
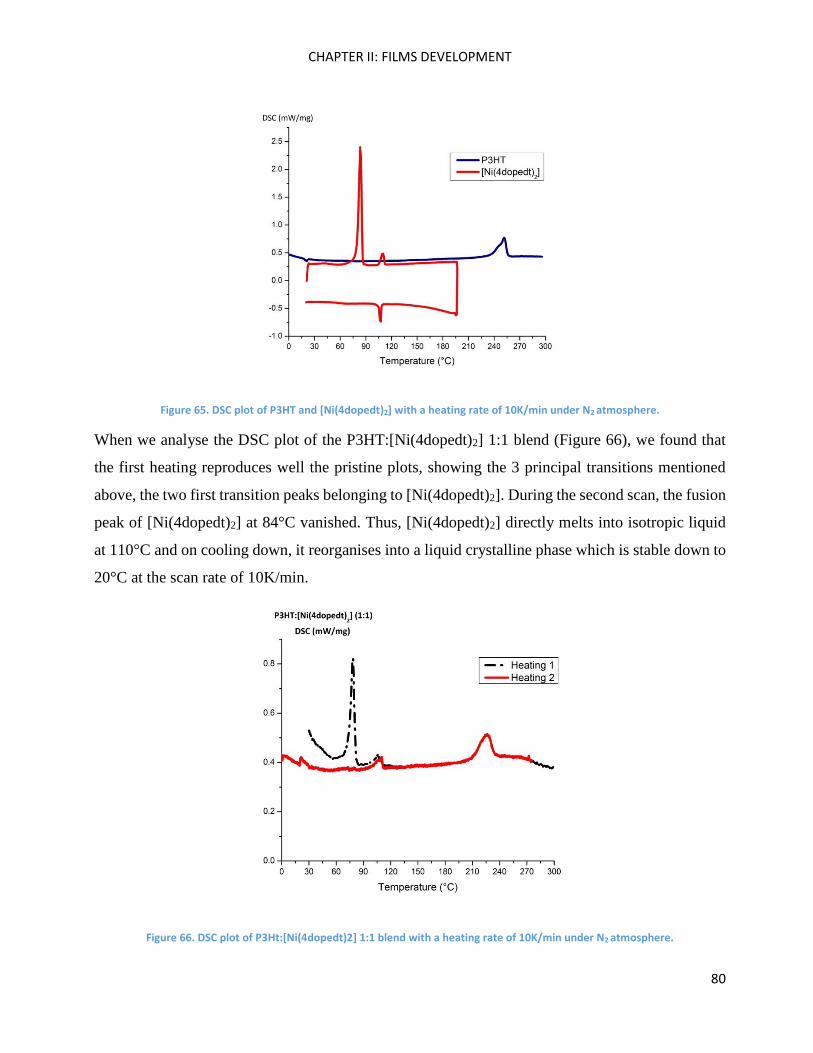
CHAPTER II: FILMS DEVELOPMENT
80
Figure 65. DSC plot of P3HT and [Ni(4dopedt)2] with a heating rate of 10K/min under N2 atmosphere.
When we analyse the DSC plot of the P3HT:[Ni(4dopedt)2] 1:1 blend (Figure 66), we found that
the first heating reproduces well the pristine plots, showing the 3 principal transitions mentioned
above, the two first transition peaks belonging to [Ni(4dopedt)2]. During the second scan, the fusion
peak of [Ni(4dopedt)2] at 84°C vanished. Thus, [Ni(4dopedt)2] directly melts into isotropic liquid
at 110°C and on cooling down, it reorganises into a liquid crystalline phase which is stable down to
20°C at the scan rate of 10K/min.
Figure 66. DSC plot of P3Ht:[Ni(4dopedt)2] 1:1 blend with a heating rate of 10K/min under N2 atmosphere.
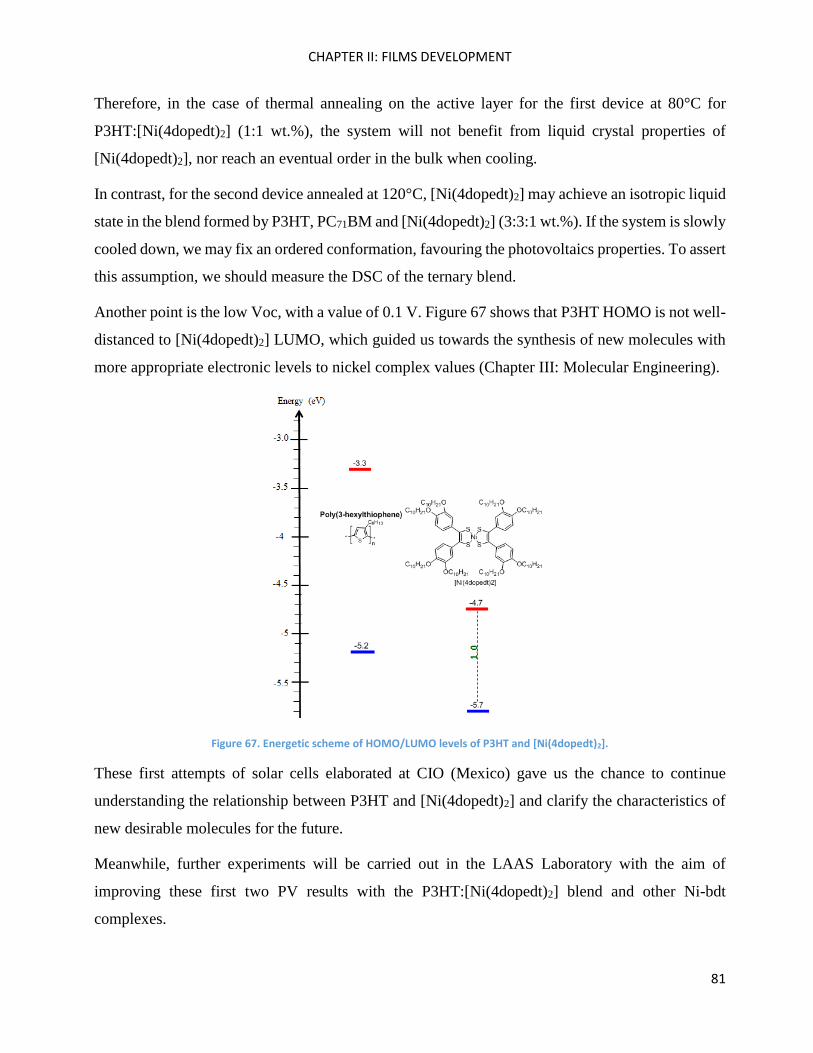
CHAPTER II: FILMS DEVELOPMENT
81
Therefore, in the case of thermal annealing on the active layer for the first device at 80°C for
P3HT:[Ni(4dopedt)2] (1:1 wt.%), the system will not benefit from liquid crystal properties of
[Ni(4dopedt)2], nor reach an eventual order in the bulk when cooling.
In contrast, for the second device annealed at 120°C, [Ni(4dopedt)2] may achieve an isotropic liquid
state in the blend formed by P3HT, PC71BM and [Ni(4dopedt)2] (3:3:1 wt.%). If the system is slowly
cooled down, we may fix an ordered conformation, favouring the photovoltaics properties. To assert
this assumption, we should measure the DSC of the ternary blend.
Another point is the low Voc, with a value of 0.1 V. Figure 67 shows that P3HT HOMO is not well-
distanced to [Ni(4dopedt)2] LUMO, which guided us towards the synthesis of new molecules with
more appropriate electronic levels to nickel complex values (Chapter III: Molecular Engineering).
Figure 67. Energetic scheme of HOMO/LUMO levels of P3HT and [Ni(4dopedt)2].
These first attempts of solar cells elaborated at CIO (Mexico) gave us the chance to continue
understanding the relationship between P3HT and [Ni(4dopedt)2] and clarify the characteristics of
new desirable molecules for the future.
Meanwhile, further experiments will be carried out in the LAAS Laboratory with the aim of
improving these first two PV results with the P3HT:[Ni(4dopedt)2] blend and other Ni-bdt
complexes.
CHAPTER II: FILMS DEVELOPMENT
82
Chapter Conclusions
In summary, we have demonstrated that blending P3HT with [Ni(4dopedt)2] may lead to improved
chain ordering as soon as the 1:1 wt. ratio is reached, without the need for thermal (or solvent)
annealing treatment. Various methods, such as UV-Vis-NIR absorption, RAMAN spectroscopy,
and AFM, were used to evaluate the P3HT:[Ni(4dopedt)2] blends film morphology. All of these
techniques converge to demonstrate a polymer chain organisation induced by blending with
[Ni(4dopedt)2] rather than [Ni(2dopedt)2] and [Ni(pedt)2]. The ease of adding a small molecule as a
nanostructuring agent in P3HT appears to be a promising way to enhance the performances of
organic electronic devices when annealed and processed at the right temperature. Supplementary
studies on blends with other nickel complexes will bring about a deeper understanding of the
correlation between the liquid crystal properties of this molecule and the structuring effect on P3HT.
Fluorescence spectroscopy, electrochemistry and TUNA AFM helped us to observe an electrical
interaction between P3HT and nickel complexes, mostly [Ni(4dopedt)2], indicating the possible
formation of dipoles in bulk-metal interfaces that may indicate a good charge dissociation. The
optimisation of the solar cells based on these materials is needed.

CHAPTER III: MOLECULAR ENGINEERING
83
Chapter III: Molecular Engineering

CHAPTER III: MOLECULAR ENGINEERING
84
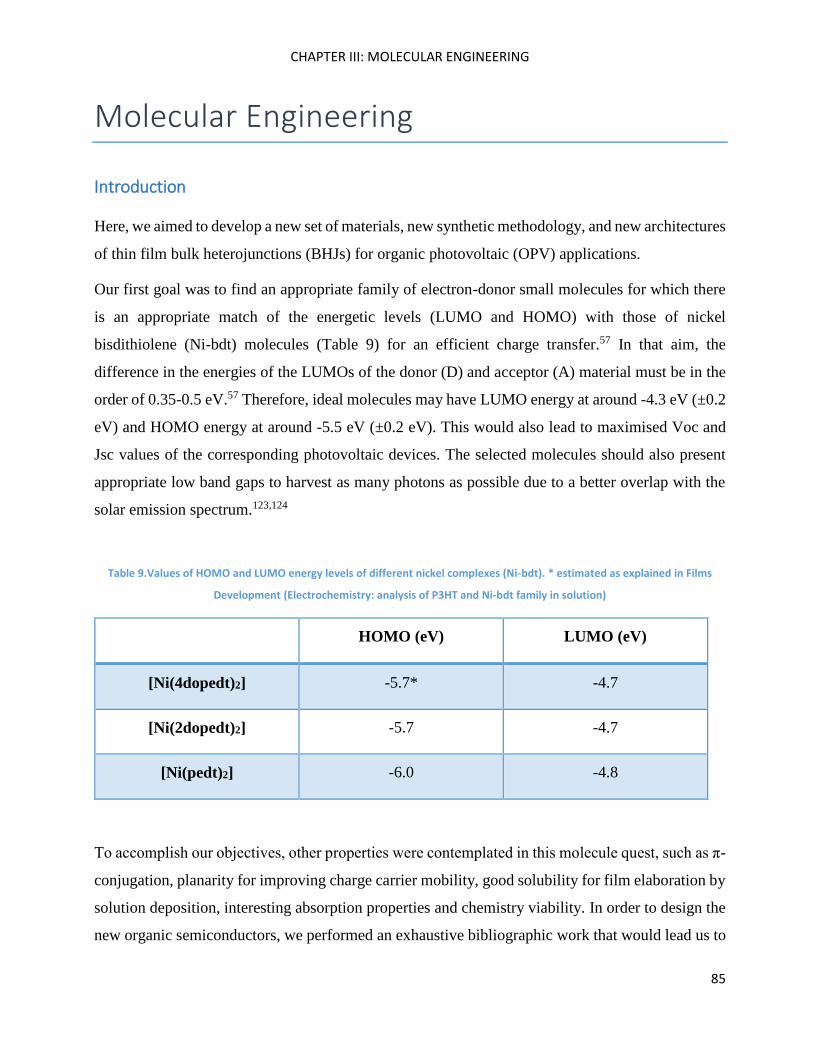
CHAPTER III: MOLECULAR ENGINEERING
85
Molecular Engineering
Introduction
Here, we aimed to develop a new set of materials, new synthetic methodology, and new architectures
of thin film bulk heterojunctions (BHJs) for organic photovoltaic (OPV) applications.
Our first goal was to find an appropriate family of electron-donor small molecules for which there
is an appropriate match of the energetic levels (LUMO and HOMO) with those of nickel
bisdithiolene (Ni-bdt) molecules (Table 9) for an efficient charge transfer.57 In that aim, the
difference in the energies of the LUMOs of the donor (D) and acceptor (A) material must be in the
order of 0.35-0.5 eV.57 Therefore, ideal molecules may have LUMO energy at around -4.3 eV (±0.2
eV) and HOMO energy at around -5.5 eV (±0.2 eV). This would also lead to maximised Voc and
Jsc values of the corresponding photovoltaic devices. The selected molecules should also present
appropriate low band gaps to harvest as many photons as possible due to a better overlap with the
solar emission spectrum.123,124
Table 9.Values of HOMO and LUMO energy levels of different nickel complexes (Ni-bdt). * estimated as explained in Films
Development (Electrochemistry: analysis of P3HT and Ni-bdt family in solution)
HOMO (eV) LUMO (eV)
[Ni(4dopedt)2] -5.7* -4.7
[Ni(2dopedt)2] -5.7 -4.7
[Ni(pedt)2] -6.0 -4.8
To accomplish our objectives, other properties were contemplated in this molecule quest, such as π-
conjugation, planarity for improving charge carrier mobility, good solubility for film elaboration by
solution deposition, interesting absorption properties and chemistry viability. In order to design the
new organic semiconductors, we performed an exhaustive bibliographic work that would lead us to
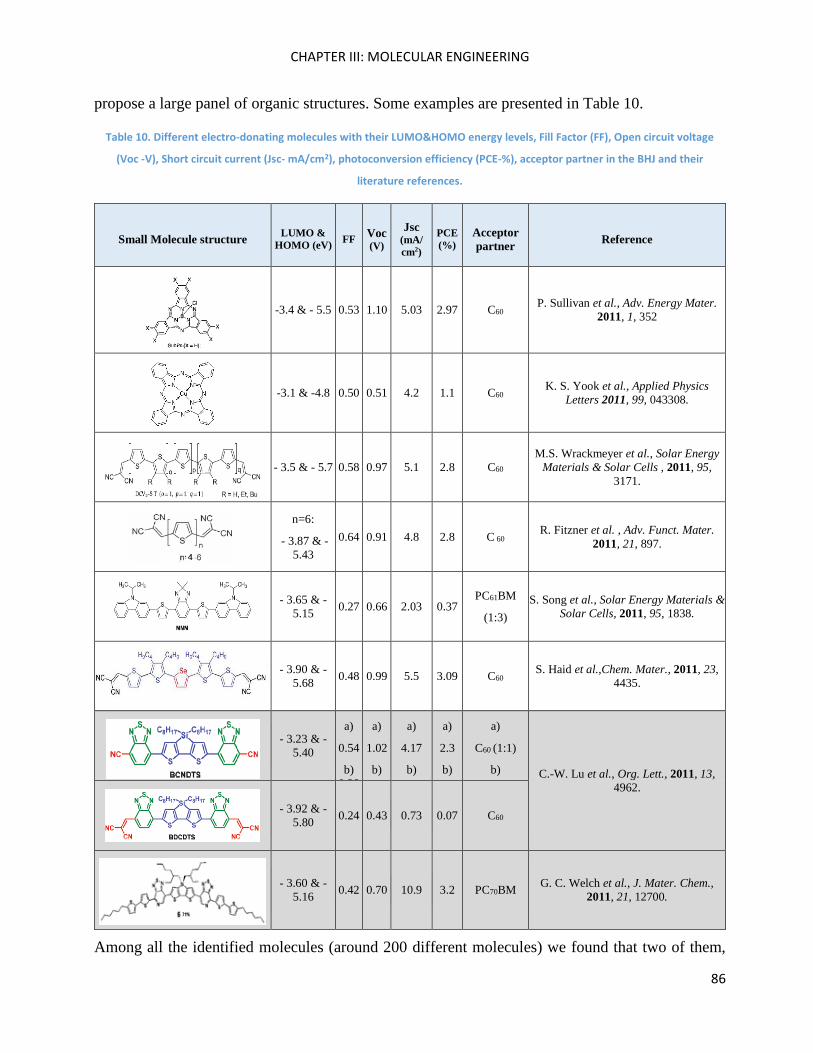
CHAPTER III: MOLECULAR ENGINEERING
86
propose a large panel of organic structures. Some examples are presented in Table 10.
Table 10. Different electro-donating molecules with their LUMO&HOMO energy levels, Fill Factor (FF), Open circuit voltage
(Voc -V), Short circuit current (Jsc- mA/cm2), photoconversion efficiency (PCE-%), acceptor partner in the BHJ and their
literature references.
Small Molecule structure LUMO &
HOMO (eV) FF
Voc (V)
Jsc (mA/
cm2)
PCE
(%)
Acceptor
partner Reference
-3.4 & - 5.5 0.53 1.10 5.03 2.97 C60 P. Sullivan et al., Adv. Energy Mater.
2011, 1, 352
-3.1 & -4.8 0.50 0.51 4.2 1.1 C60 K. S. Yook et al., Applied Physics
Letters 2011, 99, 043308.
- 3.5 & - 5.7 0.58 0.97 5.1 2.8 C60
M.S. Wrackmeyer et al., Solar Energy
Materials & Solar Cells , 2011, 95,
3171.
n=6:
- 3.87 & -
5.43
0.64 0.91 4.8 2.8 C 60 R. Fitzner et al. , Adv. Funct. Mater.
2011, 21, 897.
- 3.65 & -
5.15 0.27 0.66 2.03 0.37
PC61BM
(1:3)
S. Song et al., Solar Energy Materials &
Solar Cells, 2011, 95, 1838.
- 3.90 & -
5.68 0.48 0.99 5.5 3.09 C60
S. Haid et al.,Chem. Mater., 2011, 23,
4435.
- 3.23 & -
5.40
a)
0.54
b)
0.38
a)
1.02
b)
1.01
a)
4.17
b)
9.79
a)
2.3
b)
3.7
a)
C60 (1:1)
b)
C70 (1:1.5)
C.-W. Lu et al., Org. Lett., 2011, 13,
4962.
- 3.92 & -
5.80 0.24 0.43 0.73 0.07 C60
- 3.60 & -
5.16 0.42 0.70 10.9 3.2 PC70BM
G. C. Welch et al., J. Mater. Chem.,
2011, 21, 12700.
Among all the identified molecules (around 200 different molecules) we found that two of them,
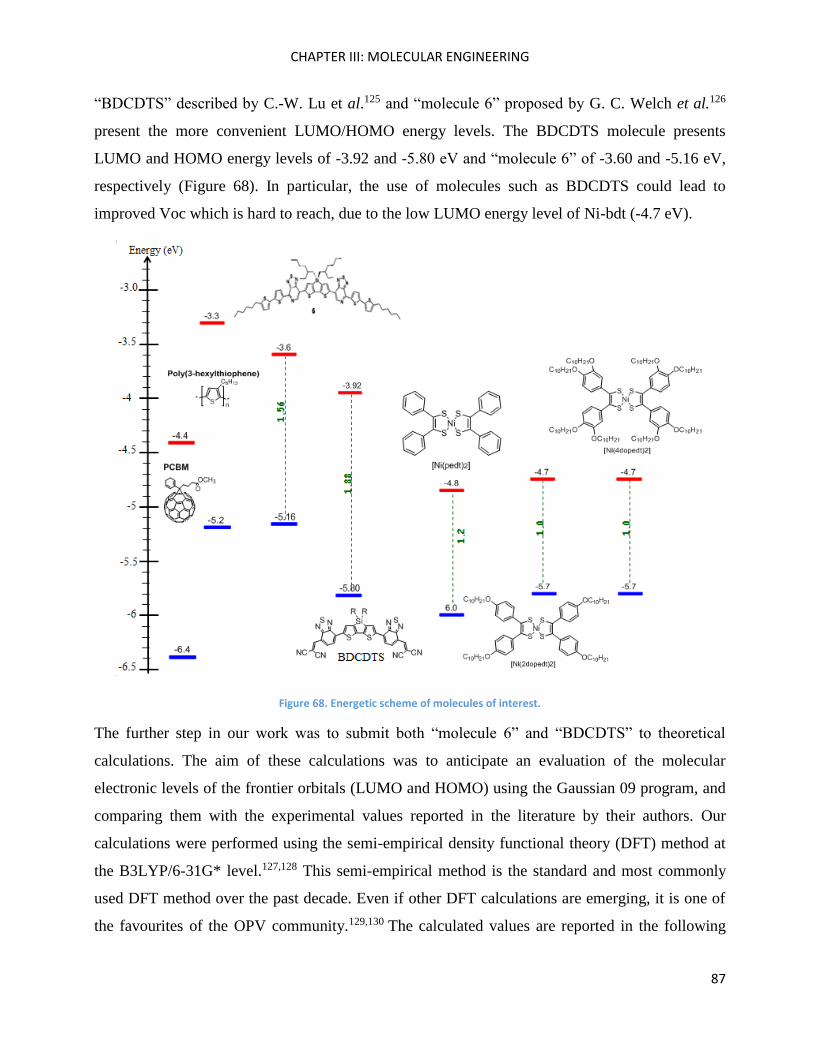
CHAPTER III: MOLECULAR ENGINEERING
87
“BDCDTS” described by C.-W. Lu et al.125 and “molecule 6” proposed by G. C. Welch et al.126
present the more convenient LUMO/HOMO energy levels. The BDCDTS molecule presents
LUMO and HOMO energy levels of -3.92 and -5.80 eV and “molecule 6” of -3.60 and -5.16 eV,
respectively (Figure 68). In particular, the use of molecules such as BDCDTS could lead to
improved Voc which is hard to reach, due to the low LUMO energy level of Ni-bdt (-4.7 eV).
Figure 68. Energetic scheme of molecules of interest.
The further step in our work was to submit both “molecule 6” and “BDCDTS” to theoretical
calculations. The aim of these calculations was to anticipate an evaluation of the molecular
electronic levels of the frontier orbitals (LUMO and HOMO) using the Gaussian 09 program, and
comparing them with the experimental values reported in the literature by their authors. Our
calculations were performed using the semi-empirical density functional theory (DFT) method at
the B3LYP/6-31G* level.127,128 This semi-empirical method is the standard and most commonly
used DFT method over the past decade. Even if other DFT calculations are emerging, it is one of
the favourites of the OPV community.129,130 The calculated values are reported in the following
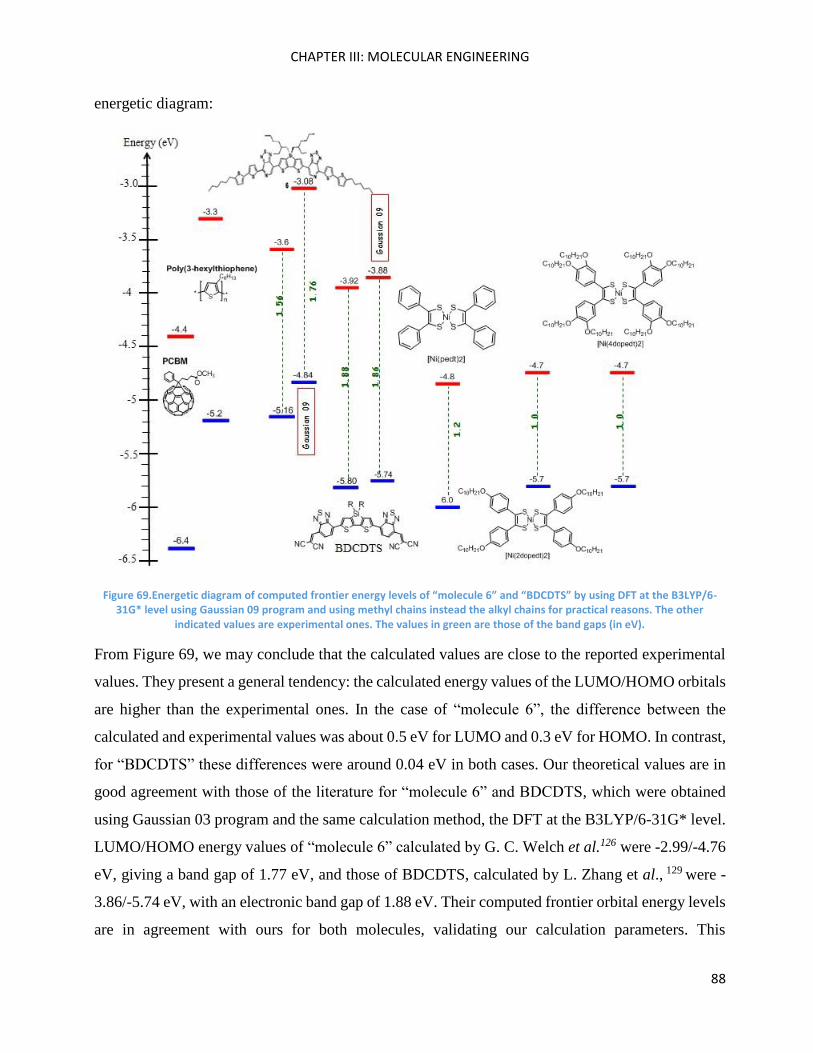
CHAPTER III: MOLECULAR ENGINEERING
88
energetic diagram:
Figure 69.Energetic diagram of computed frontier energy levels of “molecule 6” and “BDCDTS” by using DFT at the B3LYP/6-31G* level using Gaussian 09 program and using methyl chains instead the alkyl chains for practical reasons. The other
indicated values are experimental ones. The values in green are those of the band gaps (in eV).
From Figure 69, we may conclude that the calculated values are close to the reported experimental
values. They present a general tendency: the calculated energy values of the LUMO/HOMO orbitals
are higher than the experimental ones. In the case of “molecule 6”, the difference between the
calculated and experimental values was about 0.5 eV for LUMO and 0.3 eV for HOMO. In contrast,
for “BDCDTS” these differences were around 0.04 eV in both cases. Our theoretical values are in
good agreement with those of the literature for “molecule 6” and BDCDTS, which were obtained
using Gaussian 03 program and the same calculation method, the DFT at the B3LYP/6-31G* level.
LUMO/HOMO energy values of “molecule 6” calculated by G. C. Welch et al.126 were -2.99/-4.76
eV, giving a band gap of 1.77 eV, and those of BDCDTS, calculated by L. Zhang et al., 129 were -
3.86/-5.74 eV, with an electronic band gap of 1.88 eV. Their computed frontier orbital energy levels
are in agreement with ours for both molecules, validating our calculation parameters. This
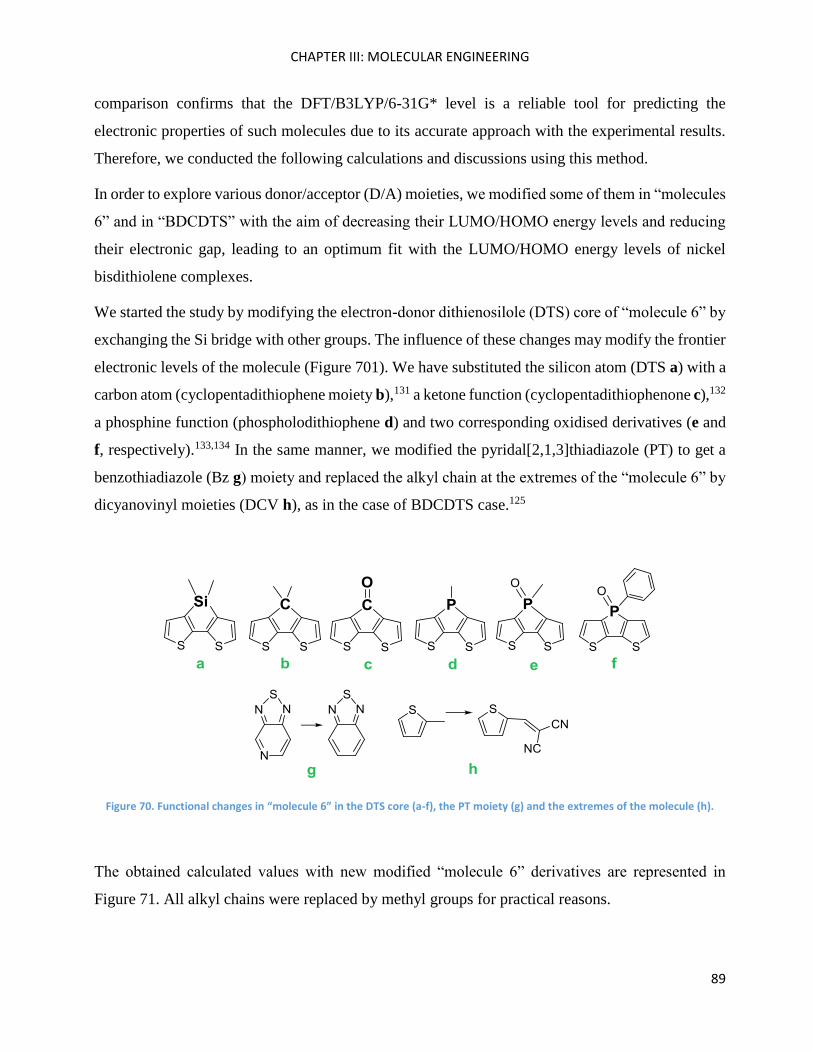
CHAPTER III: MOLECULAR ENGINEERING
89
comparison confirms that the DFT/B3LYP/6-31G* level is a reliable tool for predicting the
electronic properties of such molecules due to its accurate approach with the experimental results.
Therefore, we conducted the following calculations and discussions using this method.
In order to explore various donor/acceptor (D/A) moieties, we modified some of them in “molecules
6” and in “BDCDTS” with the aim of decreasing their LUMO/HOMO energy levels and reducing
their electronic gap, leading to an optimum fit with the LUMO/HOMO energy levels of nickel
bisdithiolene complexes.
We started the study by modifying the electron-donor dithienosilole (DTS) core of “molecule 6” by
exchanging the Si bridge with other groups. The influence of these changes may modify the frontier
electronic levels of the molecule (Figure 701). We have substituted the silicon atom (DTS a) with a
carbon atom (cyclopentadithiophene moiety b),131 a ketone function (cyclopentadithiophenone c),132
a phosphine function (phospholodithiophene d) and two corresponding oxidised derivatives (e and
f, respectively).133,134 In the same manner, we modified the pyridal[2,1,3]thiadiazole (PT) to get a
benzothiadiazole (Bz g) moiety and replaced the alkyl chain at the extremes of the “molecule 6” by
dicyanovinyl moieties (DCV h), as in the case of BDCDTS case.125
Figure 70. Functional changes in “molecule 6” in the DTS core (a-f), the PT moiety (g) and the extremes of the molecule (h).
The obtained calculated values with new modified “molecule 6” derivatives are represented in
Figure 71. All alkyl chains were replaced by methyl groups for practical reasons.
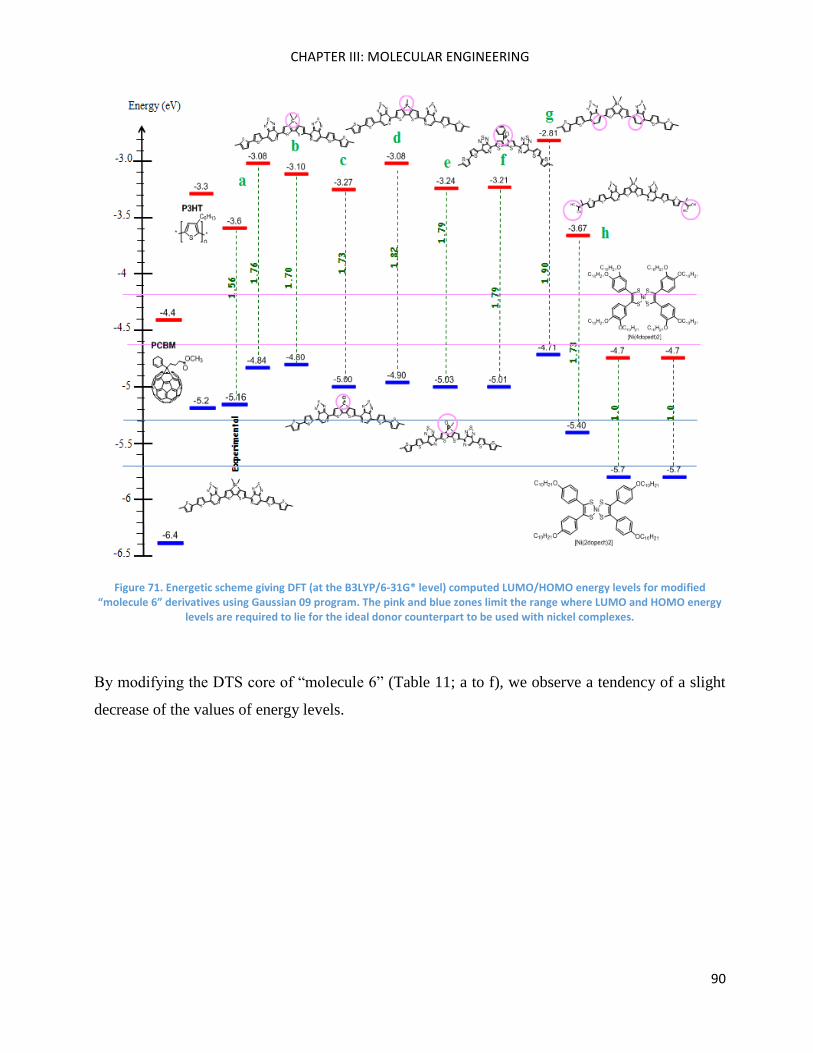
CHAPTER III: MOLECULAR ENGINEERING
90
Figure 71. Energetic scheme giving DFT (at the B3LYP/6-31G* level) computed LUMO/HOMO energy levels for modified “molecule 6” derivatives using Gaussian 09 program. The pink and blue zones limit the range where LUMO and HOMO energy
levels are required to lie for the ideal donor counterpart to be used with nickel complexes.
By modifying the DTS core of “molecule 6” (Table 11; a to f), we observe a tendency of a slight
decrease of the values of energy levels.
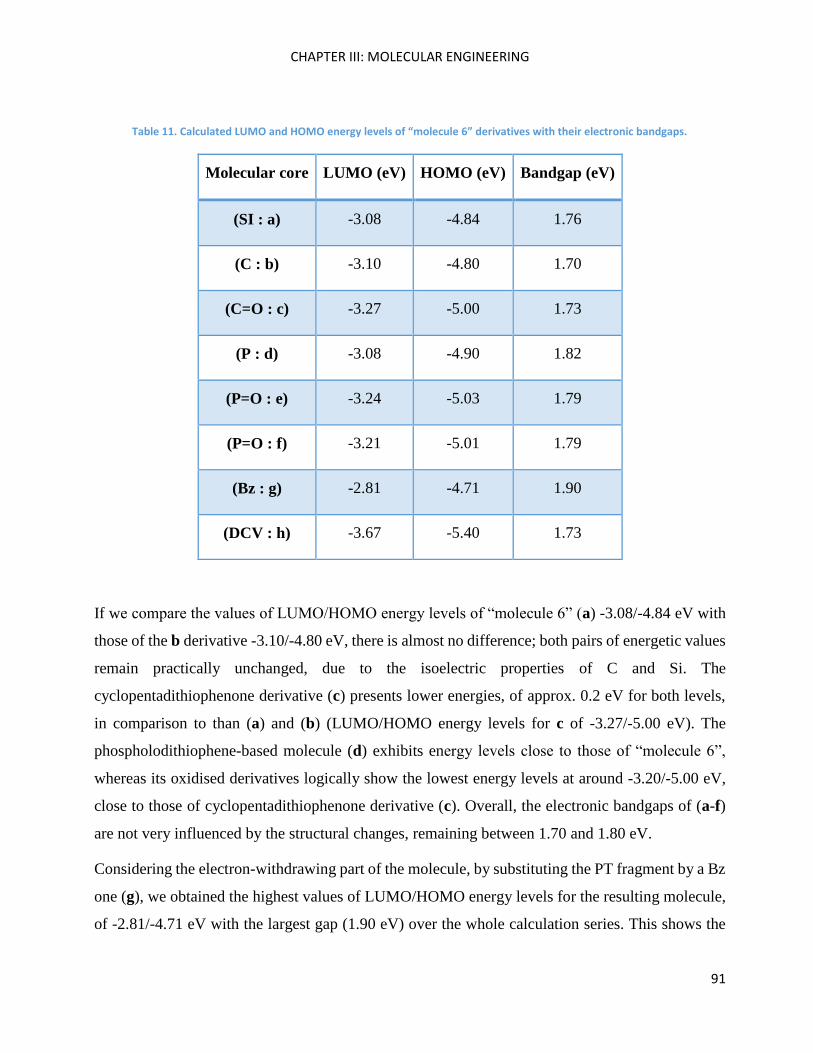
CHAPTER III: MOLECULAR ENGINEERING
91
Table 11. Calculated LUMO and HOMO energy levels of “molecule 6” derivatives with their electronic bandgaps.
Molecular core LUMO (eV) HOMO (eV) Bandgap (eV)
(SI : a) -3.08 -4.84 1.76
(C : b) -3.10 -4.80 1.70
(C=O : c) -3.27 -5.00 1.73
(P : d) -3.08 -4.90 1.82
(P=O : e) -3.24 -5.03 1.79
(P=O : f) -3.21 -5.01 1.79
(Bz : g) -2.81 -4.71 1.90
(DCV : h) -3.67 -5.40 1.73
If we compare the values of LUMO/HOMO energy levels of “molecule 6” (a) -3.08/-4.84 eV with
those of the b derivative -3.10/-4.80 eV, there is almost no difference; both pairs of energetic values
remain practically unchanged, due to the isoelectric properties of C and Si. The
cyclopentadithiophenone derivative (c) presents lower energies, of approx. 0.2 eV for both levels,
in comparison to than (a) and (b) (LUMO/HOMO energy levels for c of -3.27/-5.00 eV). The
phospholodithiophene-based molecule (d) exhibits energy levels close to those of “molecule 6”,
whereas its oxidised derivatives logically show the lowest energy levels at around -3.20/-5.00 eV,
close to those of cyclopentadithiophenone derivative (c). Overall, the electronic bandgaps of (a-f)
are not very influenced by the structural changes, remaining between 1.70 and 1.80 eV.
Considering the electron-withdrawing part of the molecule, by substituting the PT fragment by a Bz
one (g), we obtained the highest values of LUMO/HOMO energy levels for the resulting molecule,
of -2.81/-4.71 eV with the largest gap (1.90 eV) over the whole calculation series. This shows the
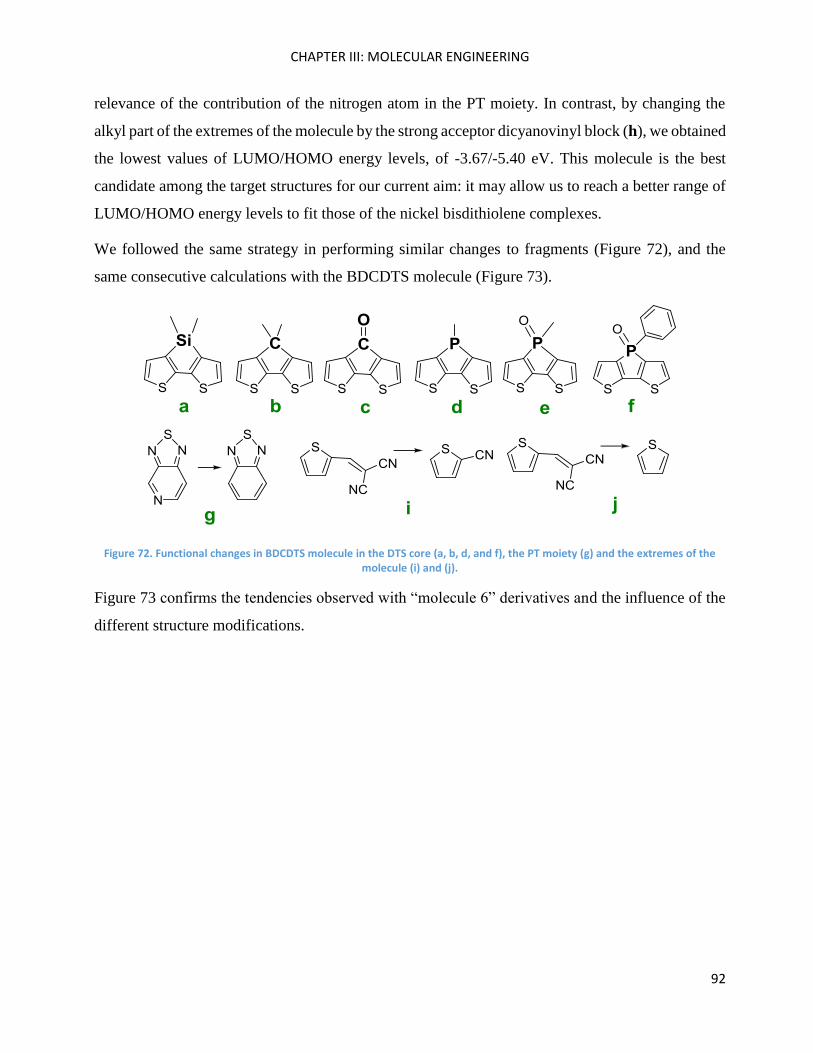
CHAPTER III: MOLECULAR ENGINEERING
92
relevance of the contribution of the nitrogen atom in the PT moiety. In contrast, by changing the
alkyl part of the extremes of the molecule by the strong acceptor dicyanovinyl block (h), we obtained
the lowest values of LUMO/HOMO energy levels, of -3.67/-5.40 eV. This molecule is the best
candidate among the target structures for our current aim: it may allow us to reach a better range of
LUMO/HOMO energy levels to fit those of the nickel bisdithiolene complexes.
We followed the same strategy in performing similar changes to fragments (Figure 72), and the
same consecutive calculations with the BDCDTS molecule (Figure 73).
Figure 72. Functional changes in BDCDTS molecule in the DTS core (a, b, d, and f), the PT moiety (g) and the extremes of the molecule (i) and (j).
Figure 73 confirms the tendencies observed with “molecule 6” derivatives and the influence of the
different structure modifications.
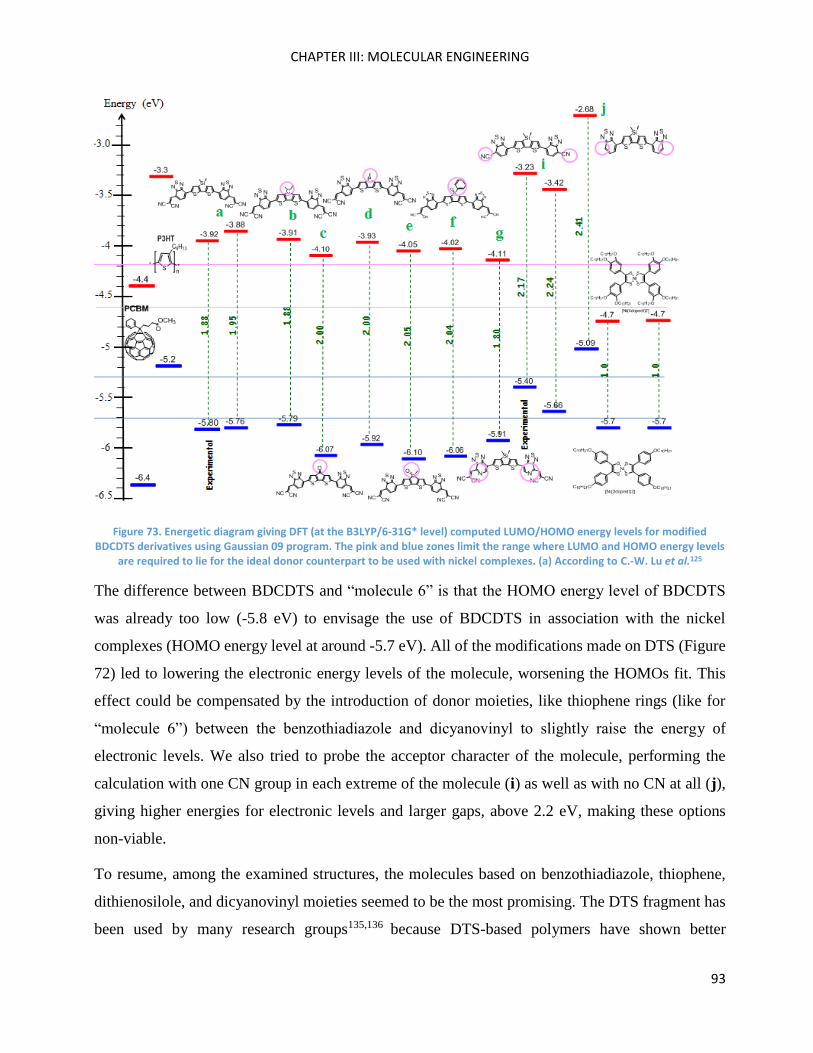
CHAPTER III: MOLECULAR ENGINEERING
93
Figure 73. Energetic diagram giving DFT (at the B3LYP/6-31G* level) computed LUMO/HOMO energy levels for modified BDCDTS derivatives using Gaussian 09 program. The pink and blue zones limit the range where LUMO and HOMO energy levels
are required to lie for the ideal donor counterpart to be used with nickel complexes. (a) According to C.-W. Lu et al.125
The difference between BDCDTS and “molecule 6” is that the HOMO energy level of BDCDTS
was already too low (-5.8 eV) to envisage the use of BDCDTS in association with the nickel
complexes (HOMO energy level at around -5.7 eV). All of the modifications made on DTS (Figure
72) led to lowering the electronic energy levels of the molecule, worsening the HOMOs fit. This
effect could be compensated by the introduction of donor moieties, like thiophene rings (like for
“molecule 6”) between the benzothiadiazole and dicyanovinyl to slightly raise the energy of
electronic levels. We also tried to probe the acceptor character of the molecule, performing the
calculation with one CN group in each extreme of the molecule (i) as well as with no CN at all (j),
giving higher energies for electronic levels and larger gaps, above 2.2 eV, making these options
non-viable.
To resume, among the examined structures, the molecules based on benzothiadiazole, thiophene,
dithienosilole, and dicyanovinyl moieties seemed to be the most promising. The DTS fragment has
been used by many research groups135,136 because DTS-based polymers have shown better
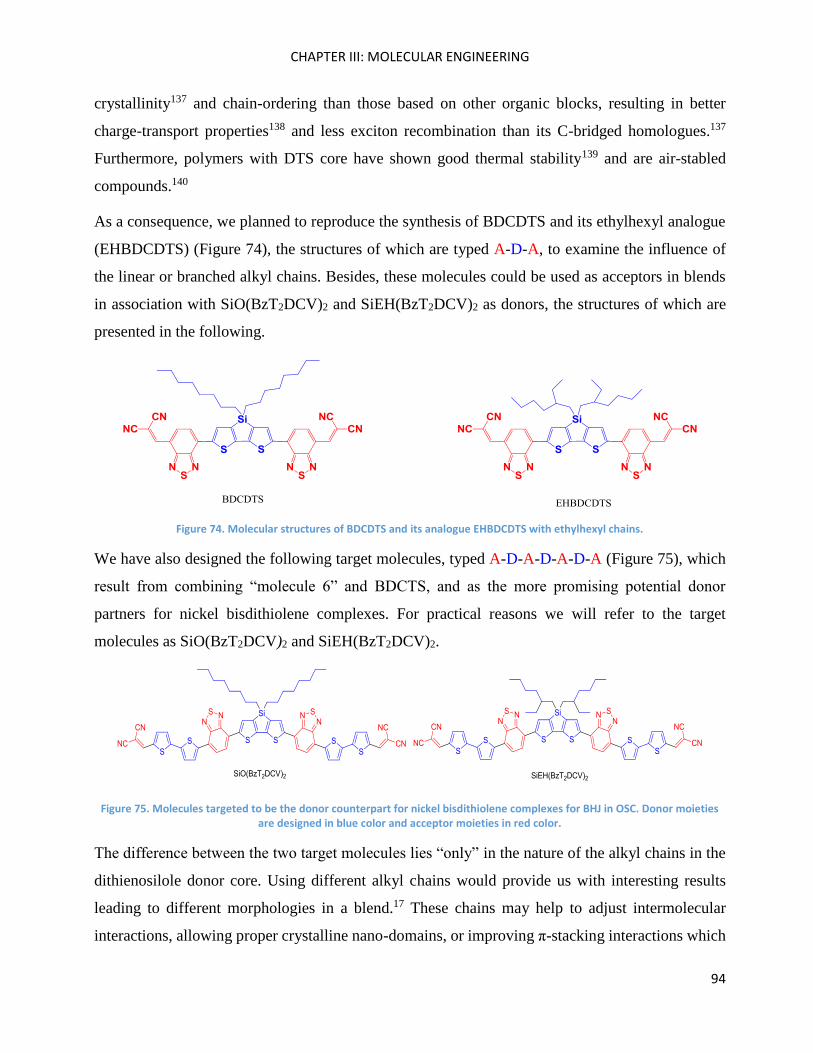
CHAPTER III: MOLECULAR ENGINEERING
94
crystallinity137 and chain-ordering than those based on other organic blocks, resulting in better
charge-transport properties138 and less exciton recombination than its C-bridged homologues.137
Furthermore, polymers with DTS core have shown good thermal stability139 and are air-stabled
compounds.140
As a consequence, we planned to reproduce the synthesis of BDCDTS and its ethylhexyl analogue
(EHBDCDTS) (Figure 74), the structures of which are typed A-D-A, to examine the influence of
the linear or branched alkyl chains. Besides, these molecules could be used as acceptors in blends
in association with SiO(BzT2DCV)2 and SiEH(BzT2DCV)2 as donors, the structures of which are
presented in the following.
Figure 74. Molecular structures of BDCDTS and its analogue EHBDCDTS with ethylhexyl chains.
We have also designed the following target molecules, typed A-D-A-D-A-D-A (Figure 75), which
result from combining “molecule 6” and BDCTS, and as the more promising potential donor
partners for nickel bisdithiolene complexes. For practical reasons we will refer to the target
molecules as SiO(BzT2DCV)2 and SiEH(BzT2DCV)2.
Figure 75. Molecules targeted to be the donor counterpart for nickel bisdithiolene complexes for BHJ in OSC. Donor moieties are designed in blue color and acceptor moieties in red color.
The difference between the two target molecules lies “only” in the nature of the alkyl chains in the
dithienosilole donor core. Using different alkyl chains would provide us with interesting results
leading to different morphologies in a blend.17 These chains may help to adjust intermolecular
interactions, allowing proper crystalline nano-domains, or improving π-stacking interactions which
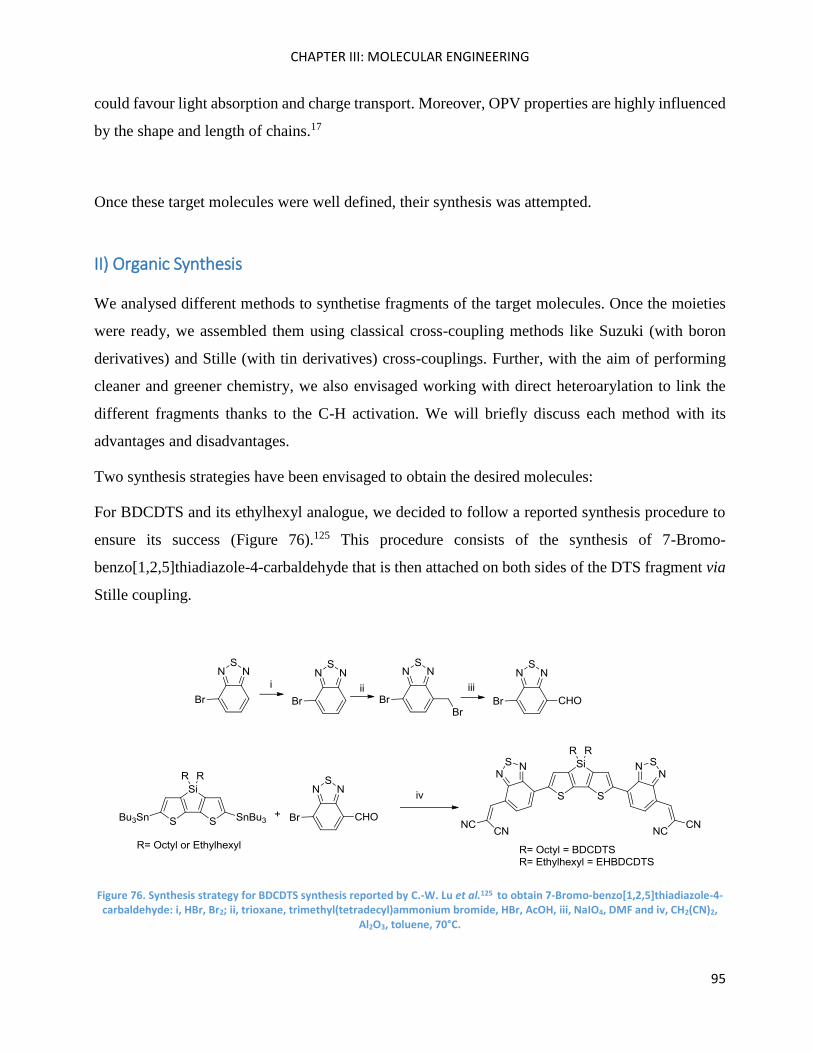
CHAPTER III: MOLECULAR ENGINEERING
95
could favour light absorption and charge transport. Moreover, OPV properties are highly influenced
by the shape and length of chains.17
Once these target molecules were well defined, their synthesis was attempted.
II) Organic Synthesis
We analysed different methods to synthetise fragments of the target molecules. Once the moieties
were ready, we assembled them using classical cross-coupling methods like Suzuki (with boron
derivatives) and Stille (with tin derivatives) cross-couplings. Further, with the aim of performing
cleaner and greener chemistry, we also envisaged working with direct heteroarylation to link the
different fragments thanks to the C-H activation. We will briefly discuss each method with its
advantages and disadvantages.
Two synthesis strategies have been envisaged to obtain the desired molecules:
For BDCDTS and its ethylhexyl analogue, we decided to follow a reported synthesis procedure to
ensure its success (Figure 76).125 This procedure consists of the synthesis of 7-Bromo-
benzo[1,2,5]thiadiazole-4-carbaldehyde that is then attached on both sides of the DTS fragment via
Stille coupling.
Figure 76. Synthesis strategy for BDCDTS synthesis reported by C.-W. Lu et al.125 to obtain 7-Bromo-benzo[1,2,5]thiadiazole-4-carbaldehyde: i, HBr, Br2; ii, trioxane, trimethyl(tetradecyl)ammonium bromide, HBr, AcOH, iii, NaIO4, DMF and iv, CH2(CN)2,
Al2O3, toluene, 70°C.
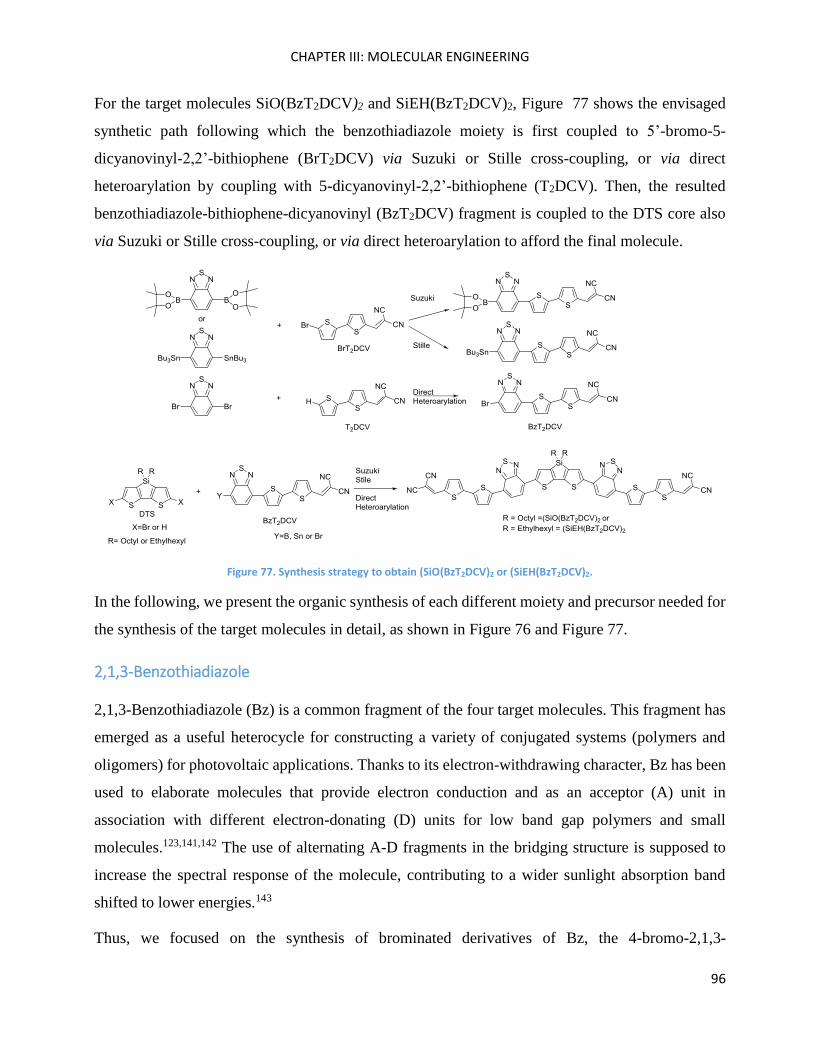
CHAPTER III: MOLECULAR ENGINEERING
96
For the target molecules SiO(BzT2DCV)2 and SiEH(BzT2DCV)2, Figure 77 shows the envisaged
synthetic path following which the benzothiadiazole moiety is first coupled to 5’-bromo-5-
dicyanovinyl-2,2’-bithiophene (BrT2DCV) via Suzuki or Stille cross-coupling, or via direct
heteroarylation by coupling with 5-dicyanovinyl-2,2’-bithiophene (T2DCV). Then, the resulted
benzothiadiazole-bithiophene-dicyanovinyl (BzT2DCV) fragment is coupled to the DTS core also
via Suzuki or Stille cross-coupling, or via direct heteroarylation to afford the final molecule.
Figure 77. Synthesis strategy to obtain (SiO(BzT2DCV)2 or (SiEH(BzT2DCV)2.
In the following, we present the organic synthesis of each different moiety and precursor needed for
the synthesis of the target molecules in detail, as shown in Figure 76 and Figure 77.
2,1,3-Benzothiadiazole
2,1,3-Benzothiadiazole (Bz) is a common fragment of the four target molecules. This fragment has
emerged as a useful heterocycle for constructing a variety of conjugated systems (polymers and
oligomers) for photovoltaic applications. Thanks to its electron-withdrawing character, Bz has been
used to elaborate molecules that provide electron conduction and as an acceptor (A) unit in
association with different electron-donating (D) units for low band gap polymers and small
molecules.123,141,142 The use of alternating A-D fragments in the bridging structure is supposed to
increase the spectral response of the molecule, contributing to a wider sunlight absorption band
shifted to lower energies.143
Thus, we focused on the synthesis of brominated derivatives of Bz, the 4-bromo-2,1,3-
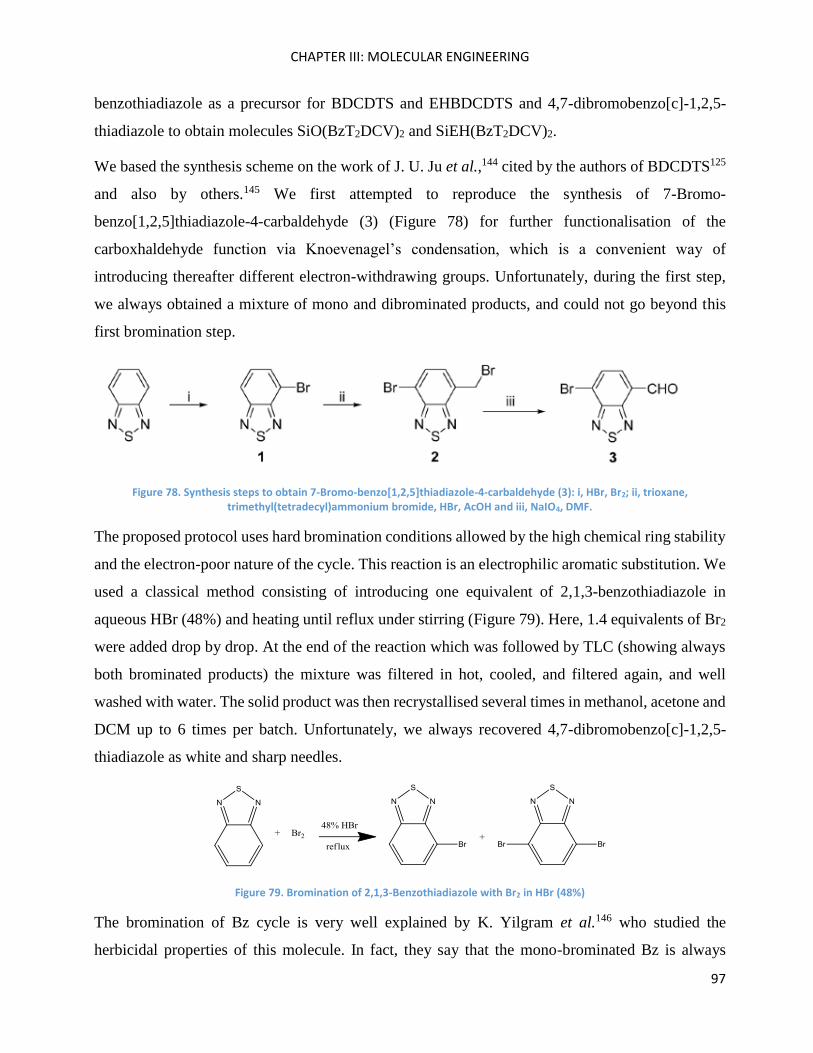
CHAPTER III: MOLECULAR ENGINEERING
97
benzothiadiazole as a precursor for BDCDTS and EHBDCDTS and 4,7-dibromobenzo[c]-1,2,5-
thiadiazole to obtain molecules SiO(BzT2DCV)2 and SiEH(BzT2DCV)2.
We based the synthesis scheme on the work of J. U. Ju et al.,144 cited by the authors of BDCDTS125
and also by others.145 We first attempted to reproduce the synthesis of 7-Bromo-
benzo[1,2,5]thiadiazole-4-carbaldehyde (3) (Figure 78) for further functionalisation of the
carboxhaldehyde function via Knoevenagel’s condensation, which is a convenient way of
introducing thereafter different electron-withdrawing groups. Unfortunately, during the first step,
we always obtained a mixture of mono and dibrominated products, and could not go beyond this
first bromination step.
Figure 78. Synthesis steps to obtain 7-Bromo-benzo[1,2,5]thiadiazole-4-carbaldehyde (3): i, HBr, Br2; ii, trioxane, trimethyl(tetradecyl)ammonium bromide, HBr, AcOH and iii, NaIO4, DMF.
The proposed protocol uses hard bromination conditions allowed by the high chemical ring stability
and the electron-poor nature of the cycle. This reaction is an electrophilic aromatic substitution. We
used a classical method consisting of introducing one equivalent of 2,1,3-benzothiadiazole in
aqueous HBr (48%) and heating until reflux under stirring (Figure 79). Here, 1.4 equivalents of Br2
were added drop by drop. At the end of the reaction which was followed by TLC (showing always
both brominated products) the mixture was filtered in hot, cooled, and filtered again, and well
washed with water. The solid product was then recrystallised several times in methanol, acetone and
DCM up to 6 times per batch. Unfortunately, we always recovered 4,7-dibromobenzo[c]-1,2,5-
thiadiazole as white and sharp needles.
Figure 79. Bromination of 2,1,3-Benzothiadiazole with Br2 in HBr (48%)
The bromination of Bz cycle is very well explained by K. Yilgram et al.146 who studied the
herbicidal properties of this molecule. In fact, they say that the mono-brominated Bz is always
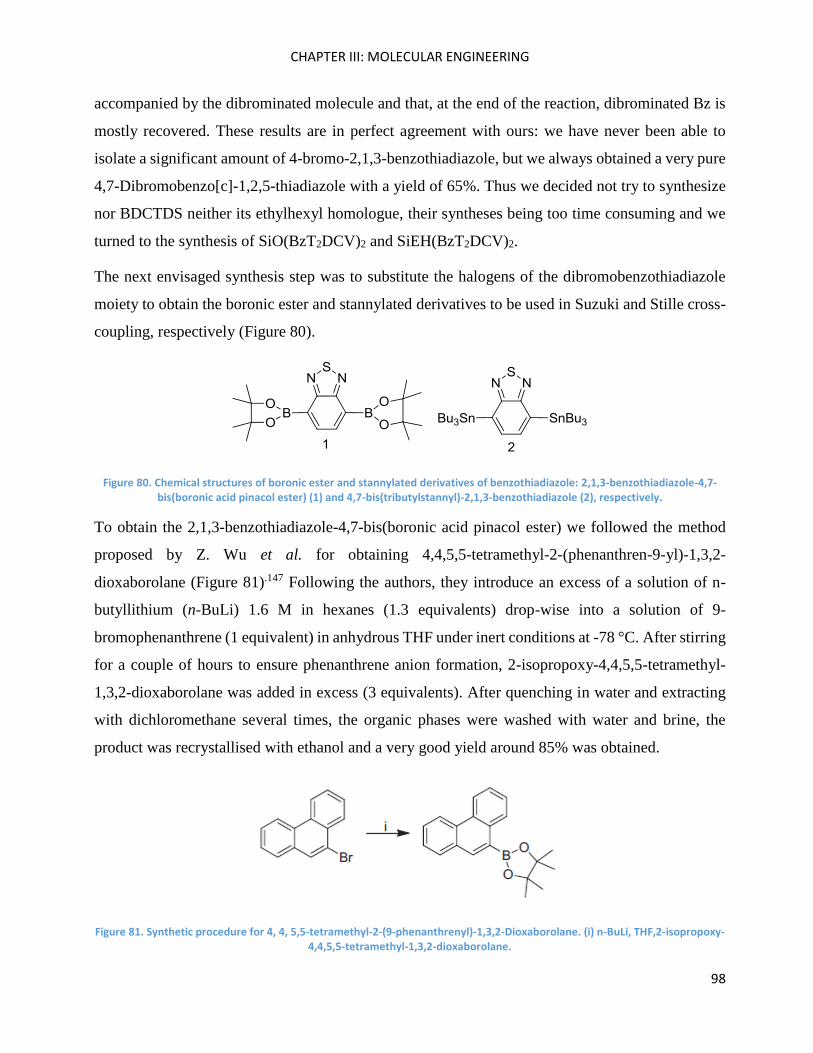
CHAPTER III: MOLECULAR ENGINEERING
98
accompanied by the dibrominated molecule and that, at the end of the reaction, dibrominated Bz is
mostly recovered. These results are in perfect agreement with ours: we have never been able to
isolate a significant amount of 4-bromo-2,1,3-benzothiadiazole, but we always obtained a very pure
4,7-Dibromobenzo[c]-1,2,5-thiadiazole with a yield of 65%. Thus we decided not try to synthesize
nor BDCTDS neither its ethylhexyl homologue, their syntheses being too time consuming and we
turned to the synthesis of SiO(BzT2DCV)2 and SiEH(BzT2DCV)2.
The next envisaged synthesis step was to substitute the halogens of the dibromobenzothiadiazole
moiety to obtain the boronic ester and stannylated derivatives to be used in Suzuki and Stille cross-
coupling, respectively (Figure 80).
Figure 80. Chemical structures of boronic ester and stannylated derivatives of benzothiadiazole: 2,1,3-benzothiadiazole-4,7-bis(boronic acid pinacol ester) (1) and 4,7-bis(tributylstannyl)-2,1,3-benzothiadiazole (2), respectively.
To obtain the 2,1,3-benzothiadiazole-4,7-bis(boronic acid pinacol ester) we followed the method
proposed by Z. Wu et al. for obtaining 4,4,5,5-tetramethyl-2-(phenanthren-9-yl)-1,3,2-
dioxaborolane (Figure 81).147 Following the authors, they introduce an excess of a solution of n-
butyllithium (n-BuLi) 1.6 M in hexanes (1.3 equivalents) drop-wise into a solution of 9-
bromophenanthrene (1 equivalent) in anhydrous THF under inert conditions at -78 °C. After stirring
for a couple of hours to ensure phenanthrene anion formation, 2-isopropoxy-4,4,5,5-tetramethyl-
1,3,2-dioxaborolane was added in excess (3 equivalents). After quenching in water and extracting
with dichloromethane several times, the organic phases were washed with water and brine, the
product was recrystallised with ethanol and a very good yield around 85% was obtained.
Figure 81. Synthetic procedure for 4, 4, 5,5-tetramethyl-2-(9-phenanthrenyl)-1,3,2-Dioxaborolane. (i) n-BuLi, THF,2-isopropoxy-4,4,5,5-tetramethyl-1,3,2-dioxaborolane.
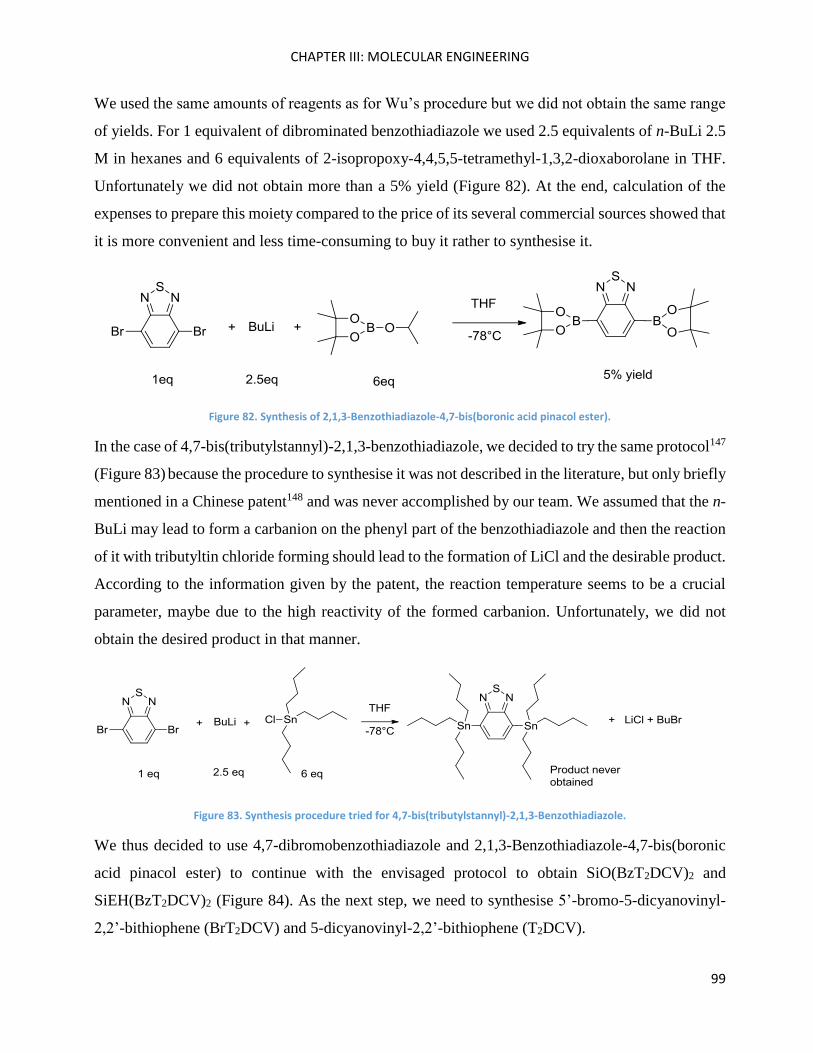
CHAPTER III: MOLECULAR ENGINEERING
99
We used the same amounts of reagents as for Wu’s procedure but we did not obtain the same range
of yields. For 1 equivalent of dibrominated benzothiadiazole we used 2.5 equivalents of n-BuLi 2.5
M in hexanes and 6 equivalents of 2-isopropoxy-4,4,5,5-tetramethyl-1,3,2-dioxaborolane in THF.
Unfortunately we did not obtain more than a 5% yield (Figure 82). At the end, calculation of the
expenses to prepare this moiety compared to the price of its several commercial sources showed that
it is more convenient and less time-consuming to buy it rather to synthesise it.
Figure 82. Synthesis of 2,1,3-Benzothiadiazole-4,7-bis(boronic acid pinacol ester).
In the case of 4,7-bis(tributylstannyl)-2,1,3-benzothiadiazole, we decided to try the same protocol147
(Figure 83) because the procedure to synthesise it was not described in the literature, but only briefly
mentioned in a Chinese patent148 and was never accomplished by our team. We assumed that the n-
BuLi may lead to form a carbanion on the phenyl part of the benzothiadiazole and then the reaction
of it with tributyltin chloride forming should lead to the formation of LiCl and the desirable product.
According to the information given by the patent, the reaction temperature seems to be a crucial
parameter, maybe due to the high reactivity of the formed carbanion. Unfortunately, we did not
obtain the desired product in that manner.
Figure 83. Synthesis procedure tried for 4,7-bis(tributylstannyl)-2,1,3-Benzothiadiazole.
We thus decided to use 4,7-dibromobenzothiadiazole and 2,1,3-Benzothiadiazole-4,7-bis(boronic
acid pinacol ester) to continue with the envisaged protocol to obtain SiO(BzT2DCV)2 and
SiEH(BzT2DCV)2 (Figure 84). As the next step, we need to synthesise 5’-bromo-5-dicyanovinyl-
2,2’-bithiophene (BrT2DCV) and 5-dicyanovinyl-2,2’-bithiophene (T2DCV).
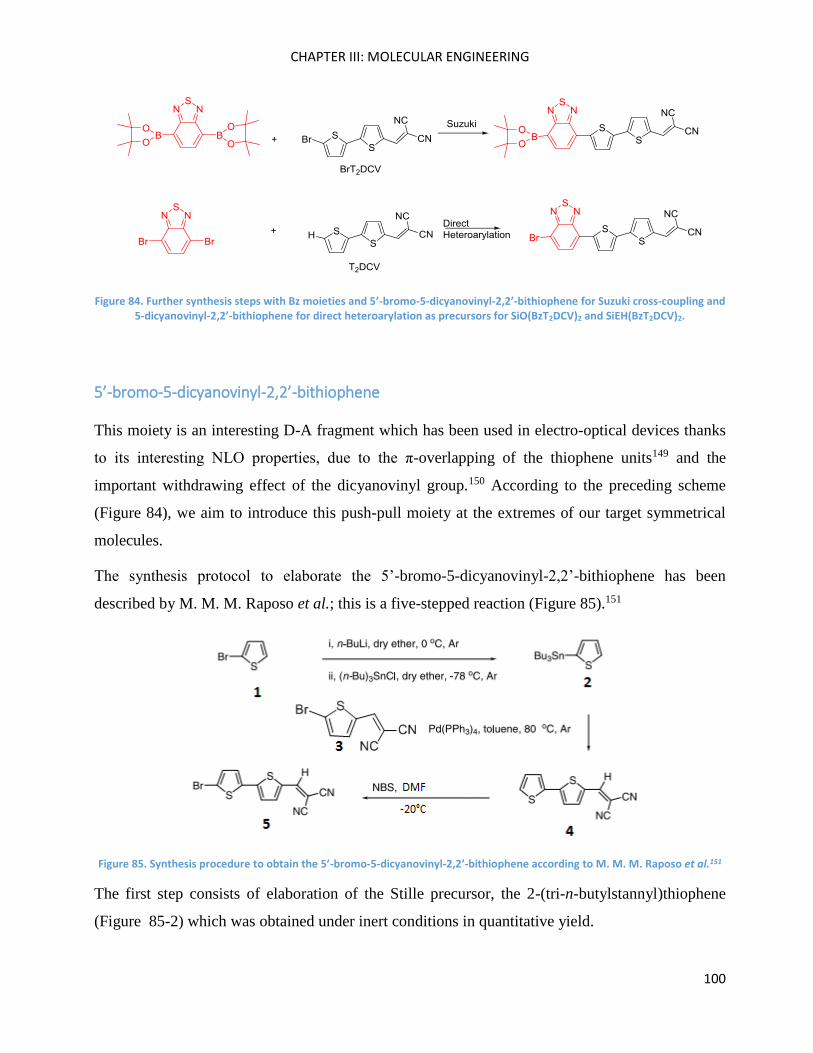
CHAPTER III: MOLECULAR ENGINEERING
100
Figure 84. Further synthesis steps with Bz moieties and 5’-bromo-5-dicyanovinyl-2,2’-bithiophene for Suzuki cross-coupling and 5-dicyanovinyl-2,2’-bithiophene for direct heteroarylation as precursors for SiO(BzT2DCV)2 and SiEH(BzT2DCV)2.
5’-bromo-5-dicyanovinyl-2,2’-bithiophene
This moiety is an interesting D-A fragment which has been used in electro-optical devices thanks
to its interesting NLO properties, due to the π-overlapping of the thiophene units149 and the
important withdrawing effect of the dicyanovinyl group.150 According to the preceding scheme
(Figure 84), we aim to introduce this push-pull moiety at the extremes of our target symmetrical
molecules.
The synthesis protocol to elaborate the 5’-bromo-5-dicyanovinyl-2,2’-bithiophene has been
described by M. M. M. Raposo et al.; this is a five-stepped reaction (Figure 85).151
Figure 85. Synthesis procedure to obtain the 5’-bromo-5-dicyanovinyl-2,2’-bithiophene according to M. M. M. Raposo et al.151
The first step consists of elaboration of the Stille precursor, the 2-(tri-n-butylstannyl)thiophene
(Figure 85-2) which was obtained under inert conditions in quantitative yield.
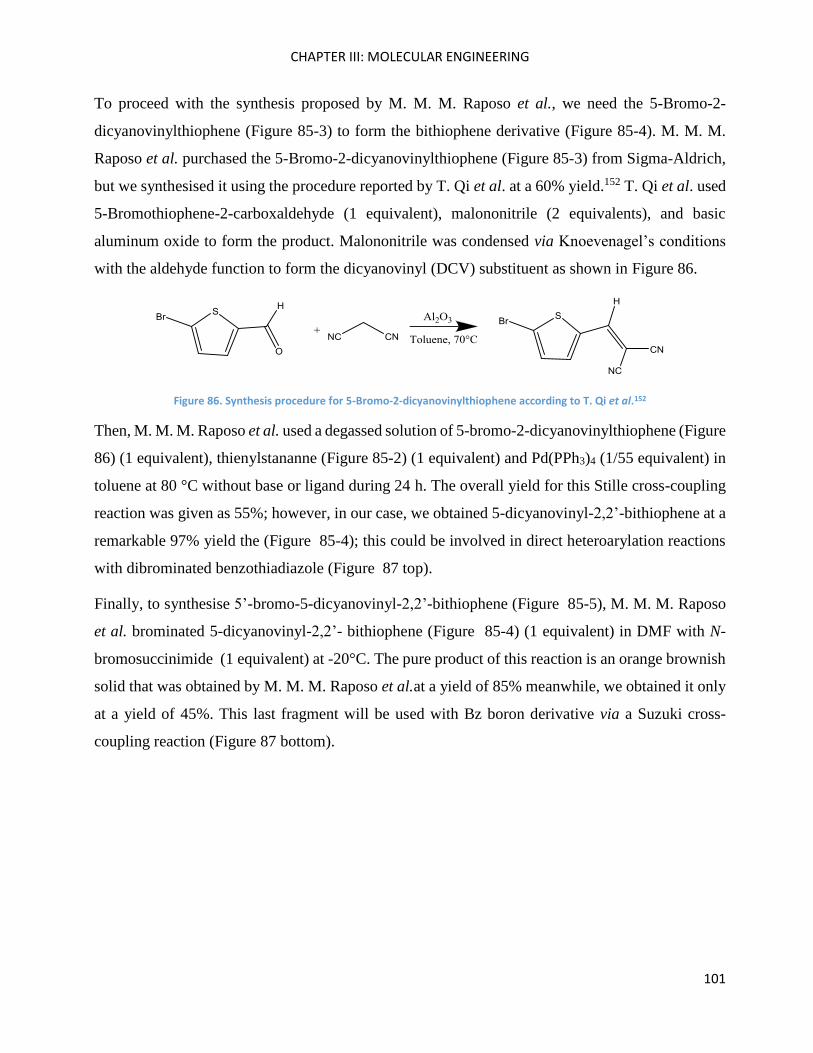
CHAPTER III: MOLECULAR ENGINEERING
101
To proceed with the synthesis proposed by M. M. M. Raposo et al., we need the 5-Bromo-2-
dicyanovinylthiophene (Figure 85-3) to form the bithiophene derivative (Figure 85-4). M. M. M.
Raposo et al. purchased the 5-Bromo-2-dicyanovinylthiophene (Figure 85-3) from Sigma-Aldrich,
but we synthesised it using the procedure reported by T. Qi et al. at a 60% yield.152 T. Qi et al. used
5-Bromothiophene-2-carboxaldehyde (1 equivalent), malononitrile (2 equivalents), and basic
aluminum oxide to form the product. Malononitrile was condensed via Knoevenagel’s conditions
with the aldehyde function to form the dicyanovinyl (DCV) substituent as shown in Figure 86.
Figure 86. Synthesis procedure for 5-Bromo-2-dicyanovinylthiophene according to T. Qi et al.152
Then, M. M. M. Raposo et al. used a degassed solution of 5-bromo-2-dicyanovinylthiophene (Figure
86) (1 equivalent), thienylstananne (Figure 85-2) (1 equivalent) and Pd(PPh3)4 (1/55 equivalent) in
toluene at 80 °C without base or ligand during 24 h. The overall yield for this Stille cross-coupling
reaction was given as 55%; however, in our case, we obtained 5-dicyanovinyl-2,2’-bithiophene at a
remarkable 97% yield the (Figure 85-4); this could be involved in direct heteroarylation reactions
with dibrominated benzothiadiazole (Figure 87 top).
Finally, to synthesise 5’-bromo-5-dicyanovinyl-2,2’-bithiophene (Figure 85-5), M. M. M. Raposo
et al. brominated 5-dicyanovinyl-2,2’- bithiophene (Figure 85-4) (1 equivalent) in DMF with N-
bromosuccinimide (1 equivalent) at -20°C. The pure product of this reaction is an orange brownish
solid that was obtained by M. M. M. Raposo et al.at a yield of 85% meanwhile, we obtained it only
at a yield of 45%. This last fragment will be used with Bz boron derivative via a Suzuki cross-
coupling reaction (Figure 87 bottom).
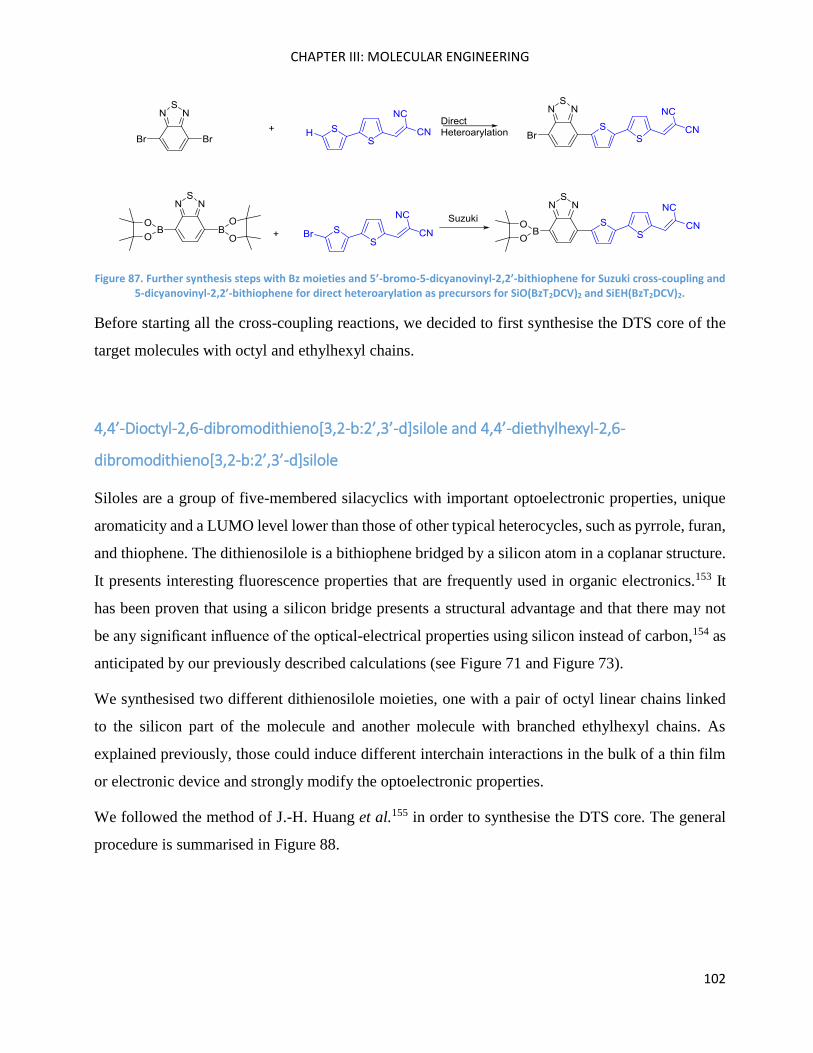
CHAPTER III: MOLECULAR ENGINEERING
102
Figure 87. Further synthesis steps with Bz moieties and 5’-bromo-5-dicyanovinyl-2,2’-bithiophene for Suzuki cross-coupling and 5-dicyanovinyl-2,2’-bithiophene for direct heteroarylation as precursors for SiO(BzT2DCV)2 and SiEH(BzT2DCV)2.
Before starting all the cross-coupling reactions, we decided to first synthesise the DTS core of the
target molecules with octyl and ethylhexyl chains.
4,4’-Dioctyl-2,6-dibromodithieno[3,2-b:2’,3’-d]silole and 4,4’-diethylhexyl-2,6-
dibromodithieno[3,2-b:2’,3’-d]silole
Siloles are a group of five-membered silacyclics with important optoelectronic properties, unique
aromaticity and a LUMO level lower than those of other typical heterocycles, such as pyrrole, furan,
and thiophene. The dithienosilole is a bithiophene bridged by a silicon atom in a coplanar structure.
It presents interesting fluorescence properties that are frequently used in organic electronics.153 It
has been proven that using a silicon bridge presents a structural advantage and that there may not
be any significant influence of the optical-electrical properties using silicon instead of carbon,154 as
anticipated by our previously described calculations (see Figure 71 and Figure 73).
We synthesised two different dithienosilole moieties, one with a pair of octyl linear chains linked
to the silicon part of the molecule and another molecule with branched ethylhexyl chains. As
explained previously, those could induce different interchain interactions in the bulk of a thin film
or electronic device and strongly modify the optoelectronic properties.
We followed the method of J.-H. Huang et al.155 in order to synthesise the DTS core. The general
procedure is summarised in Figure 88.
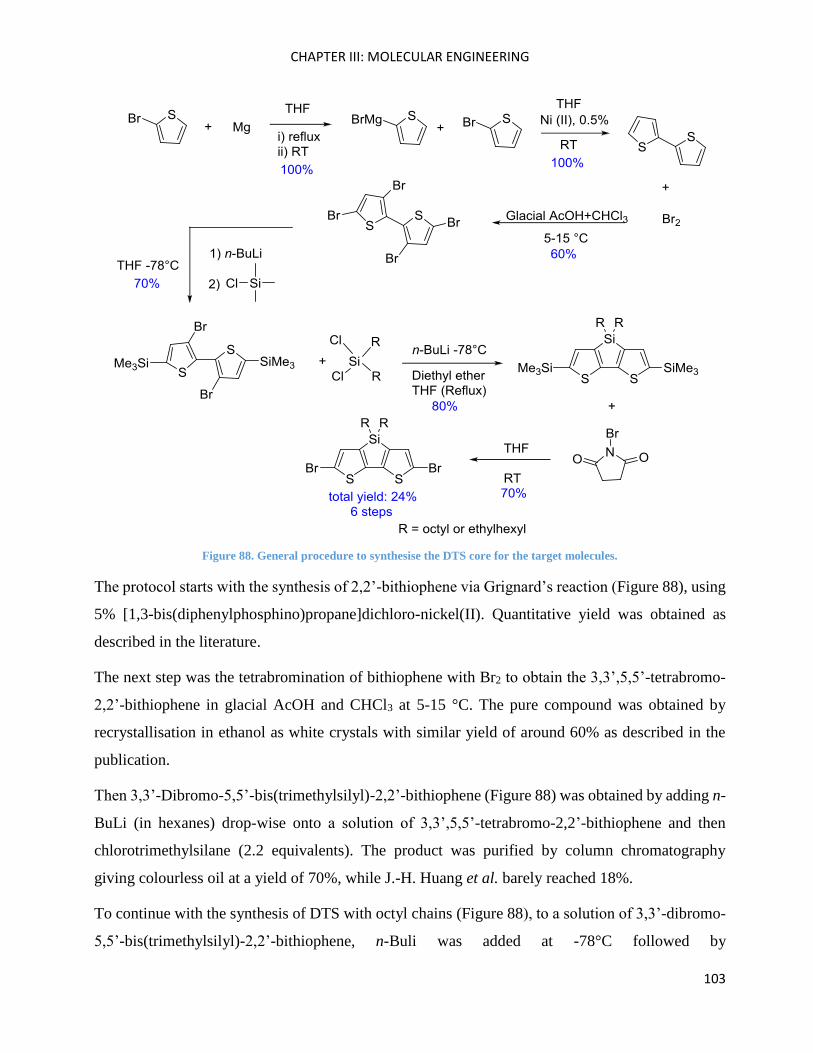
CHAPTER III: MOLECULAR ENGINEERING
103
Figure 88. General procedure to synthesise the DTS core for the target molecules.
The protocol starts with the synthesis of 2,2’-bithiophene via Grignard’s reaction (Figure 88), using
5% [1,3-bis(diphenylphosphino)propane]dichloro-nickel(II). Quantitative yield was obtained as
described in the literature.
The next step was the tetrabromination of bithiophene with Br2 to obtain the 3,3’,5,5’-tetrabromo-
2,2’-bithiophene in glacial AcOH and CHCl3 at 5-15 °C. The pure compound was obtained by
recrystallisation in ethanol as white crystals with similar yield of around 60% as described in the
publication.
Then 3,3’-Dibromo-5,5’-bis(trimethylsilyl)-2,2’-bithiophene (Figure 88) was obtained by adding n-
BuLi (in hexanes) drop-wise onto a solution of 3,3’,5,5’-tetrabromo-2,2’-bithiophene and then
chlorotrimethylsilane (2.2 equivalents). The product was purified by column chromatography
giving colourless oil at a yield of 70%, while J.-H. Huang et al. barely reached 18%.
To continue with the synthesis of DTS with octyl chains (Figure 88), to a solution of 3,3’-dibromo-
5,5’-bis(trimethylsilyl)-2,2’-bithiophene, n-Buli was added at -78°C followed by
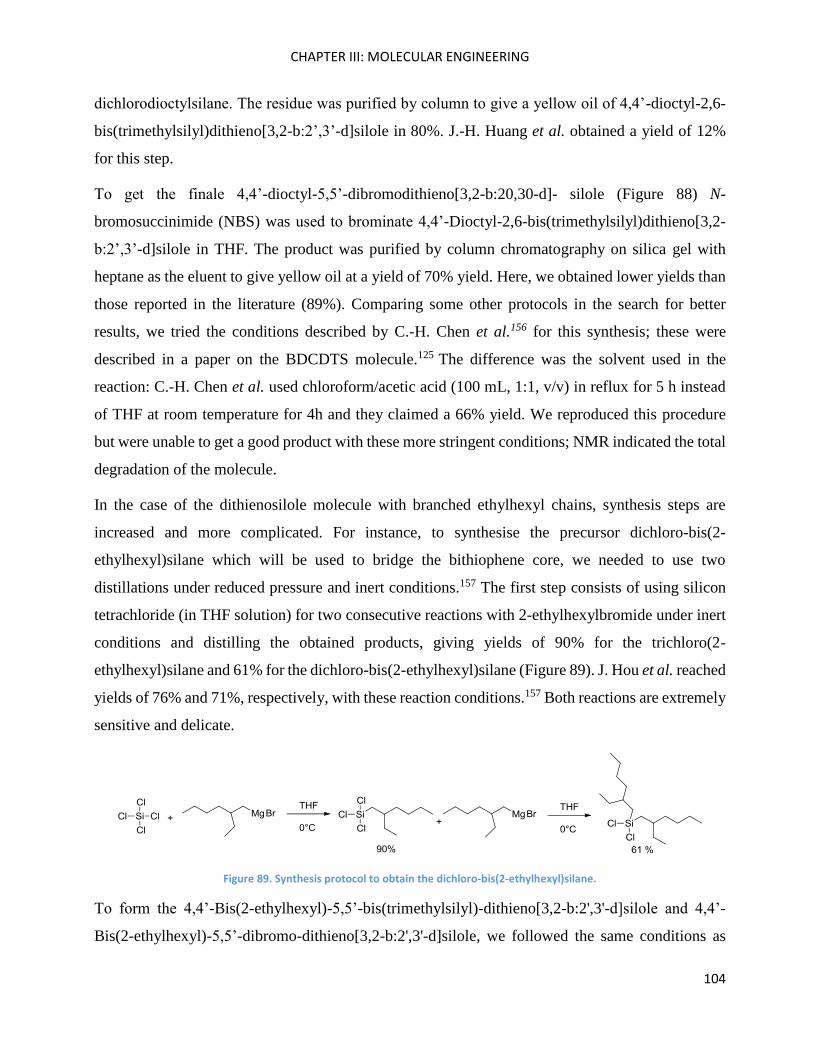
CHAPTER III: MOLECULAR ENGINEERING
104
dichlorodioctylsilane. The residue was purified by column to give a yellow oil of 4,4’-dioctyl-2,6-
bis(trimethylsilyl)dithieno[3,2-b:2’,3’-d]silole in 80%. J.-H. Huang et al. obtained a yield of 12%
for this step.
To get the finale 4,4’-dioctyl-5,5’-dibromodithieno[3,2-b:20,30-d]- silole (Figure 88) N-
bromosuccinimide (NBS) was used to brominate 4,4’-Dioctyl-2,6-bis(trimethylsilyl)dithieno[3,2-
b:2’,3’-d]silole in THF. The product was purified by column chromatography on silica gel with
heptane as the eluent to give yellow oil at a yield of 70% yield. Here, we obtained lower yields than
those reported in the literature (89%). Comparing some other protocols in the search for better
results, we tried the conditions described by C.-H. Chen et al.156 for this synthesis; these were
described in a paper on the BDCDTS molecule.125 The difference was the solvent used in the
reaction: C.-H. Chen et al. used chloroform/acetic acid (100 mL, 1:1, v/v) in reflux for 5 h instead
of THF at room temperature for 4h and they claimed a 66% yield. We reproduced this procedure
but were unable to get a good product with these more stringent conditions; NMR indicated the total
degradation of the molecule.
In the case of the dithienosilole molecule with branched ethylhexyl chains, synthesis steps are
increased and more complicated. For instance, to synthesise the precursor dichloro-bis(2-
ethylhexyl)silane which will be used to bridge the bithiophene core, we needed to use two
distillations under reduced pressure and inert conditions.157 The first step consists of using silicon
tetrachloride (in THF solution) for two consecutive reactions with 2-ethylhexylbromide under inert
conditions and distilling the obtained products, giving yields of 90% for the trichloro(2-
ethylhexyl)silane and 61% for the dichloro-bis(2-ethylhexyl)silane (Figure 89). J. Hou et al. reached
yields of 76% and 71%, respectively, with these reaction conditions.157 Both reactions are extremely
sensitive and delicate.
Figure 89. Synthesis protocol to obtain the dichloro-bis(2-ethylhexyl)silane.
To form the 4,4’-Bis(2-ethylhexyl)-5,5’-bis(trimethylsilyl)-dithieno[3,2-b:2',3'-d]silole and 4,4’-
Bis(2-ethylhexyl)-5,5’-dibromo-dithieno[3,2-b:2',3'-d]silole, we followed the same conditions as
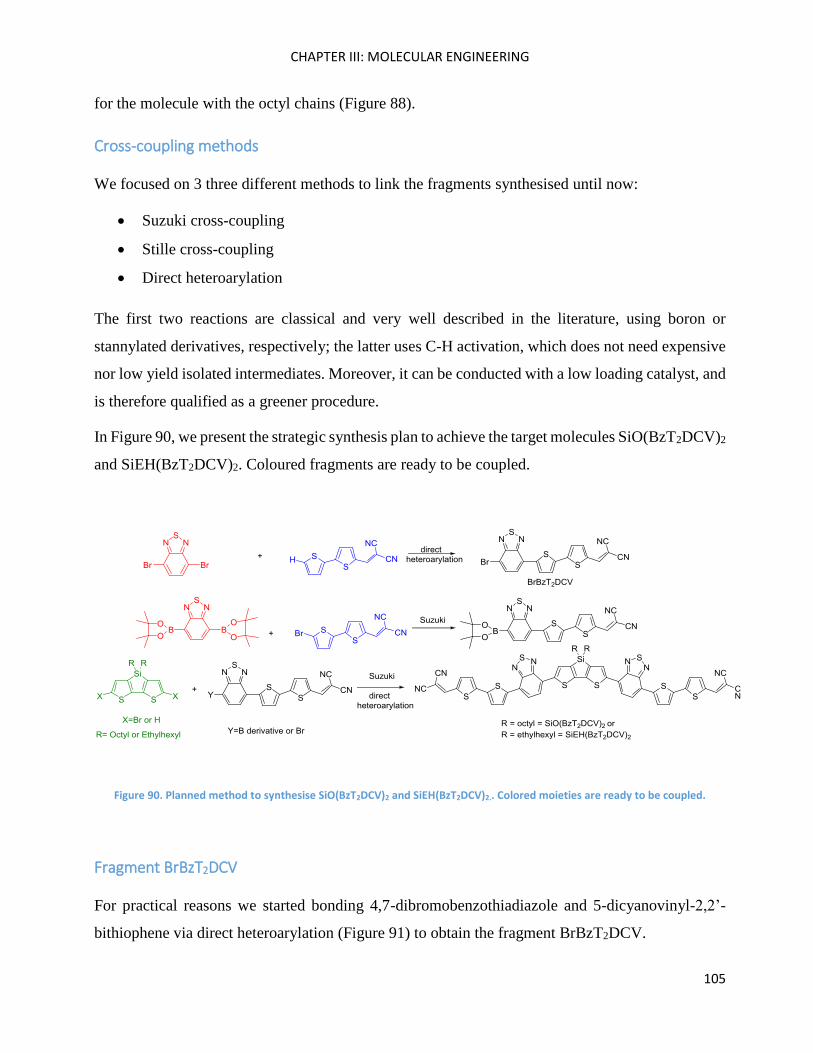
CHAPTER III: MOLECULAR ENGINEERING
105
for the molecule with the octyl chains (Figure 88).
Cross-coupling methods
We focused on 3 three different methods to link the fragments synthesised until now:
Suzuki cross-coupling
Stille cross-coupling
Direct heteroarylation
The first two reactions are classical and very well described in the literature, using boron or
stannylated derivatives, respectively; the latter uses C-H activation, which does not need expensive
nor low yield isolated intermediates. Moreover, it can be conducted with a low loading catalyst, and
is therefore qualified as a greener procedure.
In Figure 90, we present the strategic synthesis plan to achieve the target molecules SiO(BzT2DCV)2
and SiEH(BzT2DCV)2. Coloured fragments are ready to be coupled.
Figure 90. Planned method to synthesise SiO(BzT2DCV)2 and SiEH(BzT2DCV)2.. Colored moieties are ready to be coupled.
Fragment BrBzT2DCV
For practical reasons we started bonding 4,7-dibromobenzothiadiazole and 5-dicyanovinyl-2,2’-
bithiophene via direct heteroarylation (Figure 91) to obtain the fragment BrBzT2DCV.
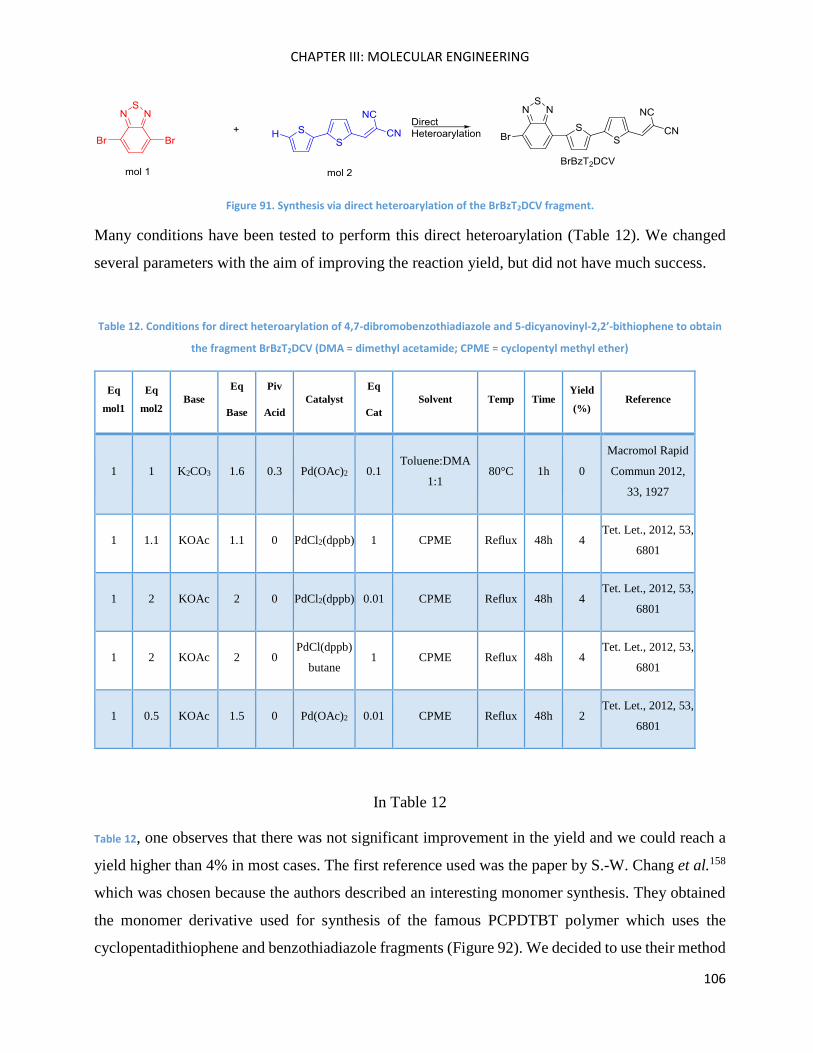
CHAPTER III: MOLECULAR ENGINEERING
106
Figure 91. Synthesis via direct heteroarylation of the BrBzT2DCV fragment.
Many conditions have been tested to perform this direct heteroarylation (Table 12). We changed
several parameters with the aim of improving the reaction yield, but did not have much success.
Table 12. Conditions for direct heteroarylation of 4,7-dibromobenzothiadiazole and 5-dicyanovinyl-2,2’-bithiophene to obtain
the fragment BrBzT2DCV (DMA = dimethyl acetamide; CPME = cyclopentyl methyl ether)
Eq
mol1
Eq
mol2 Base
Eq
Base
Piv
Acid
Catalyst
Eq
Cat
Solvent Temp Time Yield
(%) Reference
1 1 K2CO3 1.6 0.3 Pd(OAc)2 0.1 Toluene:DMA
1:1 80°C 1h 0
Macromol Rapid
Commun 2012,
33, 1927
1 1.1 KOAc 1.1 0 PdCl2(dppb) 1 CPME Reflux 48h 4 Tet. Let., 2012, 53,
6801
1 2 KOAc 2 0 PdCl2(dppb) 0.01 CPME Reflux 48h 4 Tet. Let., 2012, 53,
6801
1 2 KOAc 2 0 PdCl(dppb)
butane 1 CPME Reflux 48h 4
Tet. Let., 2012, 53,
6801
1 0.5 KOAc 1.5 0 Pd(OAc)2 0.01 CPME Reflux 48h 2 Tet. Let., 2012, 53,
6801
In Table 12
Table 12, one observes that there was not significant improvement in the yield and we could reach a
yield higher than 4% in most cases. The first reference used was the paper by S.-W. Chang et al.158
which was chosen because the authors described an interesting monomer synthesis. They obtained
the monomer derivative used for synthesis of the famous PCPDTBT polymer which uses the
cyclopentadithiophene and benzothiadiazole fragments (Figure 92). We decided to use their method
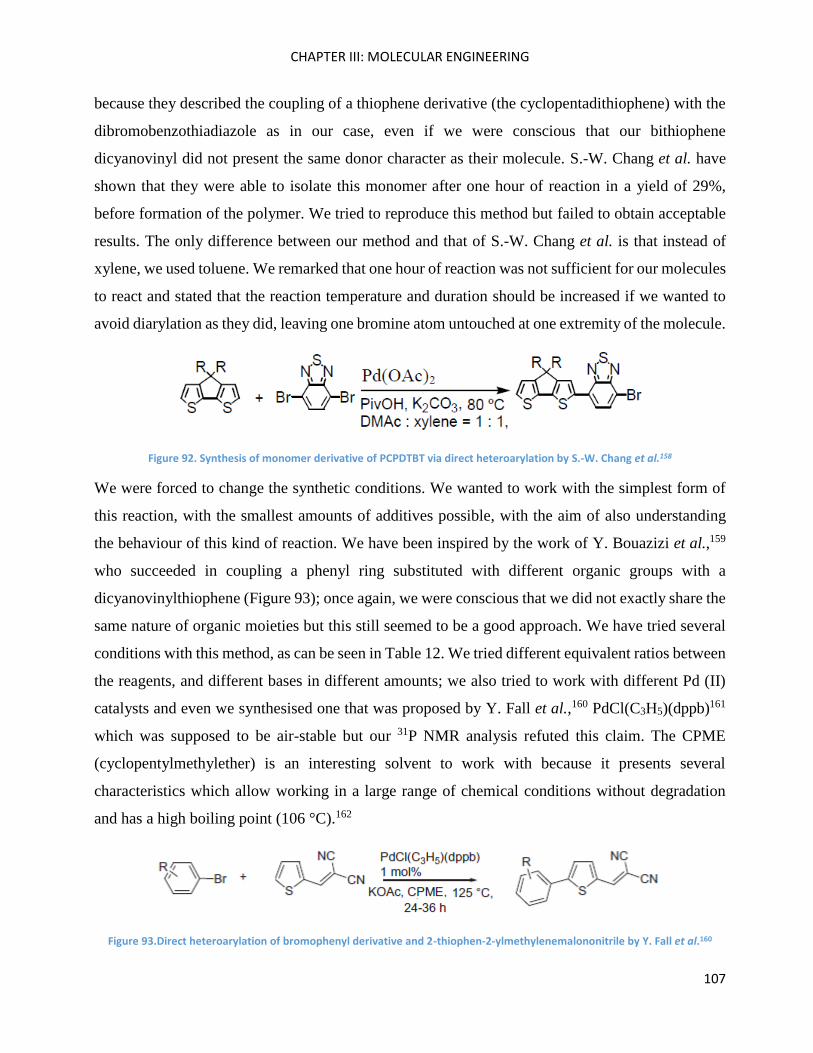
CHAPTER III: MOLECULAR ENGINEERING
107
because they described the coupling of a thiophene derivative (the cyclopentadithiophene) with the
dibromobenzothiadiazole as in our case, even if we were conscious that our bithiophene
dicyanovinyl did not present the same donor character as their molecule. S.-W. Chang et al. have
shown that they were able to isolate this monomer after one hour of reaction in a yield of 29%,
before formation of the polymer. We tried to reproduce this method but failed to obtain acceptable
results. The only difference between our method and that of S.-W. Chang et al. is that instead of
xylene, we used toluene. We remarked that one hour of reaction was not sufficient for our molecules
to react and stated that the reaction temperature and duration should be increased if we wanted to
avoid diarylation as they did, leaving one bromine atom untouched at one extremity of the molecule.
Figure 92. Synthesis of monomer derivative of PCPDTBT via direct heteroarylation by S.-W. Chang et al.158
We were forced to change the synthetic conditions. We wanted to work with the simplest form of
this reaction, with the smallest amounts of additives possible, with the aim of also understanding
the behaviour of this kind of reaction. We have been inspired by the work of Y. Bouazizi et al.,159
who succeeded in coupling a phenyl ring substituted with different organic groups with a
dicyanovinylthiophene (Figure 93); once again, we were conscious that we did not exactly share the
same nature of organic moieties but this still seemed to be a good approach. We have tried several
conditions with this method, as can be seen in Table 12. We tried different equivalent ratios between
the reagents, and different bases in different amounts; we also tried to work with different Pd (II)
catalysts and even we synthesised one that was proposed by Y. Fall et al.,160 PdCl(C3H5)(dppb)161
which was supposed to be air-stable but our 31P NMR analysis refuted this claim. The CPME
(cyclopentylmethylether) is an interesting solvent to work with because it presents several
characteristics which allow working in a large range of chemical conditions without degradation
and has a high boiling point (106 °C).162
Figure 93.Direct heteroarylation of bromophenyl derivative and 2-thiophen-2-ylmethylenemalononitrile by Y. Fall et al.160
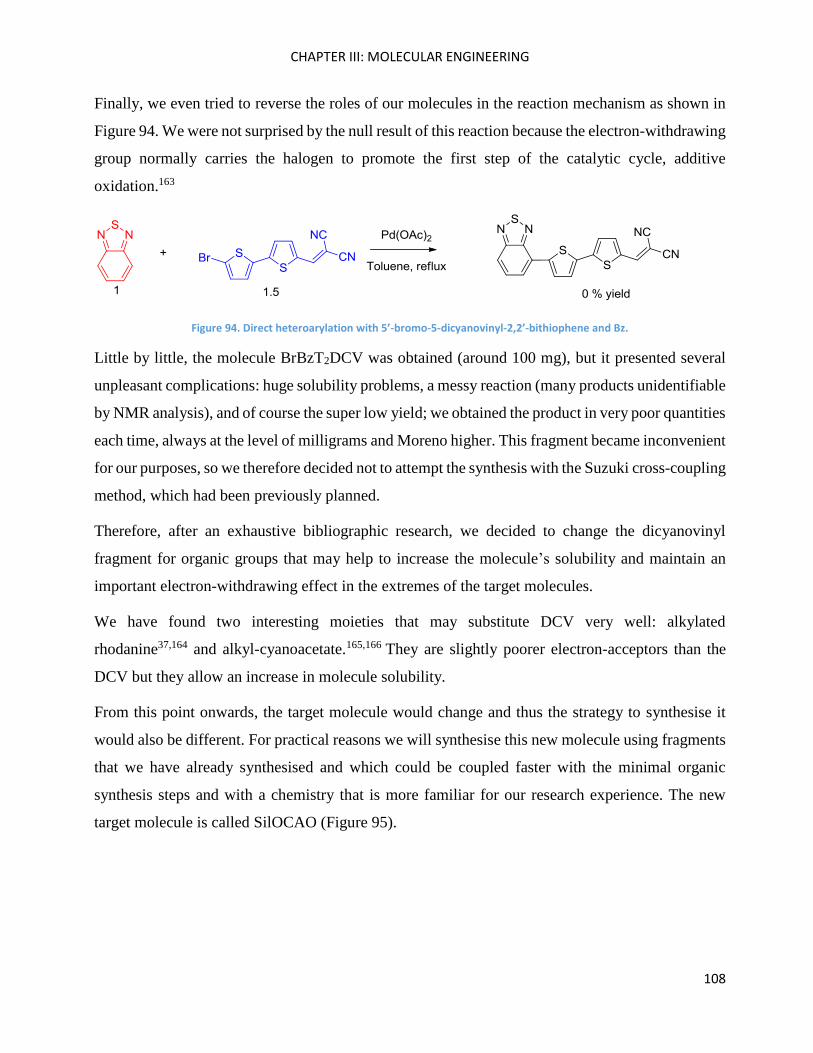
CHAPTER III: MOLECULAR ENGINEERING
108
Finally, we even tried to reverse the roles of our molecules in the reaction mechanism as shown in
Figure 94. We were not surprised by the null result of this reaction because the electron-withdrawing
group normally carries the halogen to promote the first step of the catalytic cycle, additive
oxidation.163
Figure 94. Direct heteroarylation with 5’-bromo-5-dicyanovinyl-2,2’-bithiophene and Bz.
Little by little, the molecule BrBzT2DCV was obtained (around 100 mg), but it presented several
unpleasant complications: huge solubility problems, a messy reaction (many products unidentifiable
by NMR analysis), and of course the super low yield; we obtained the product in very poor quantities
each time, always at the level of milligrams and Moreno higher. This fragment became inconvenient
for our purposes, so we therefore decided not to attempt the synthesis with the Suzuki cross-coupling
method, which had been previously planned.
Therefore, after an exhaustive bibliographic research, we decided to change the dicyanovinyl
fragment for organic groups that may help to increase the molecule’s solubility and maintain an
important electron-withdrawing effect in the extremes of the target molecules.
We have found two interesting moieties that may substitute DCV very well: alkylated
rhodanine37,164 and alkyl-cyanoacetate.165,166 They are slightly poorer electron-acceptors than the
DCV but they allow an increase in molecule solubility.
From this point onwards, the target molecule would change and thus the strategy to synthesise it
would also be different. For practical reasons we will synthesise this new molecule using fragments
that we have already synthesised and which could be coupled faster with the minimal organic
synthesis steps and with a chemistry that is more familiar for our research experience. The new
target molecule is called SilOCAO (Figure 95).
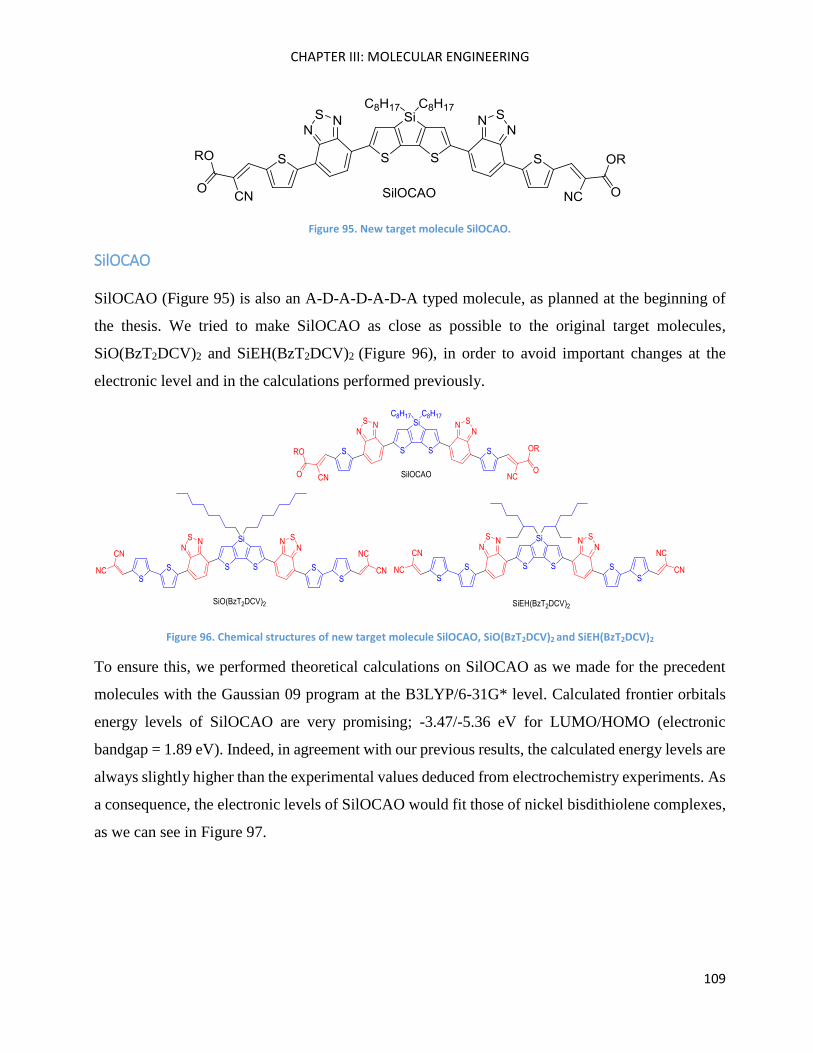
CHAPTER III: MOLECULAR ENGINEERING
109
Figure 95. New target molecule SilOCAO.
SilOCAO
SilOCAO (Figure 95) is also an A-D-A-D-A-D-A typed molecule, as planned at the beginning of
the thesis. We tried to make SilOCAO as close as possible to the original target molecules,
SiO(BzT2DCV)2 and SiEH(BzT2DCV)2 (Figure 96), in order to avoid important changes at the
electronic level and in the calculations performed previously.
Figure 96. Chemical structures of new target molecule SilOCAO, SiO(BzT2DCV)2 and SiEH(BzT2DCV)2
To ensure this, we performed theoretical calculations on SilOCAO as we made for the precedent
molecules with the Gaussian 09 program at the B3LYP/6-31G* level. Calculated frontier orbitals
energy levels of SilOCAO are very promising; -3.47/-5.36 eV for LUMO/HOMO (electronic
bandgap = 1.89 eV). Indeed, in agreement with our previous results, the calculated energy levels are
always slightly higher than the experimental values deduced from electrochemistry experiments. As
a consequence, the electronic levels of SilOCAO would fit those of nickel bisdithiolene complexes,
as we can see in Figure 97.
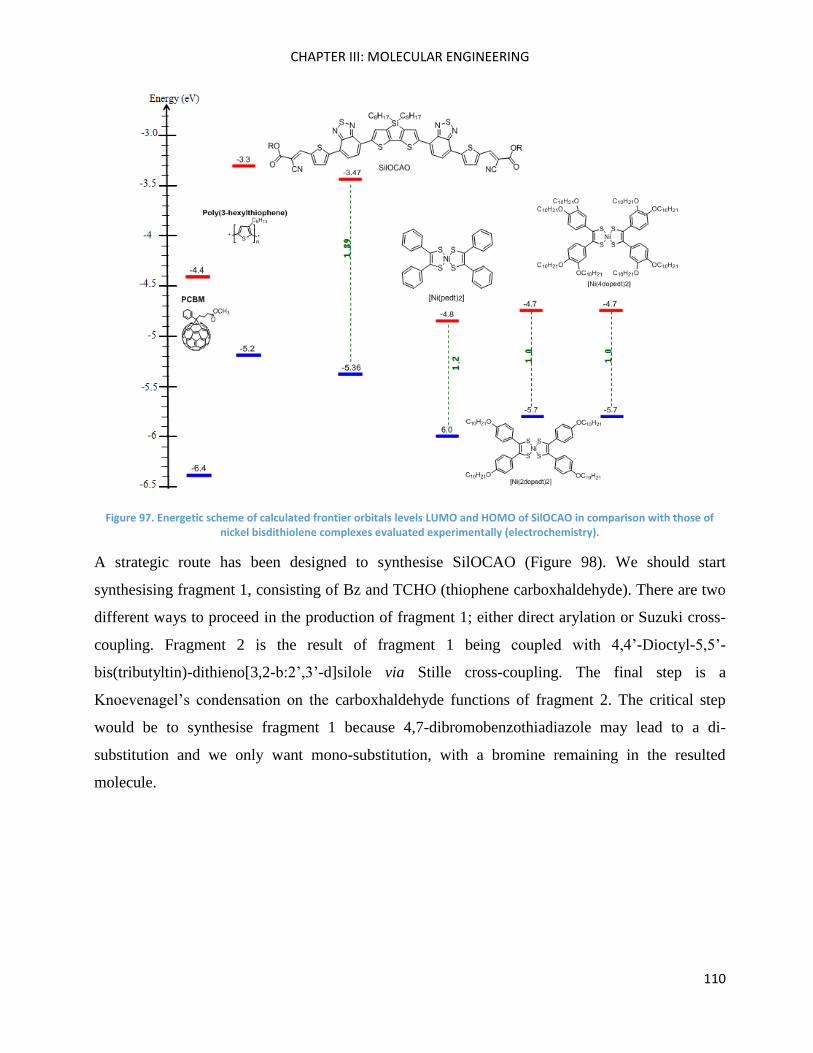
CHAPTER III: MOLECULAR ENGINEERING
110
Figure 97. Energetic scheme of calculated frontier orbitals levels LUMO and HOMO of SilOCAO in comparison with those of nickel bisdithiolene complexes evaluated experimentally (electrochemistry).
A strategic route has been designed to synthesise SilOCAO (Figure 98). We should start
synthesising fragment 1, consisting of Bz and TCHO (thiophene carboxhaldehyde). There are two
different ways to proceed in the production of fragment 1; either direct arylation or Suzuki cross-
coupling. Fragment 2 is the result of fragment 1 being coupled with 4,4’-Dioctyl-5,5’-
bis(tributyltin)-dithieno[3,2-b:2’,3’-d]silole via Stille cross-coupling. The final step is a
Knoevenagel’s condensation on the carboxhaldehyde functions of fragment 2. The critical step
would be to synthesise fragment 1 because 4,7-dibromobenzothiadiazole may lead to a di-
substitution and we only want mono-substitution, with a bromine remaining in the resulted
molecule.
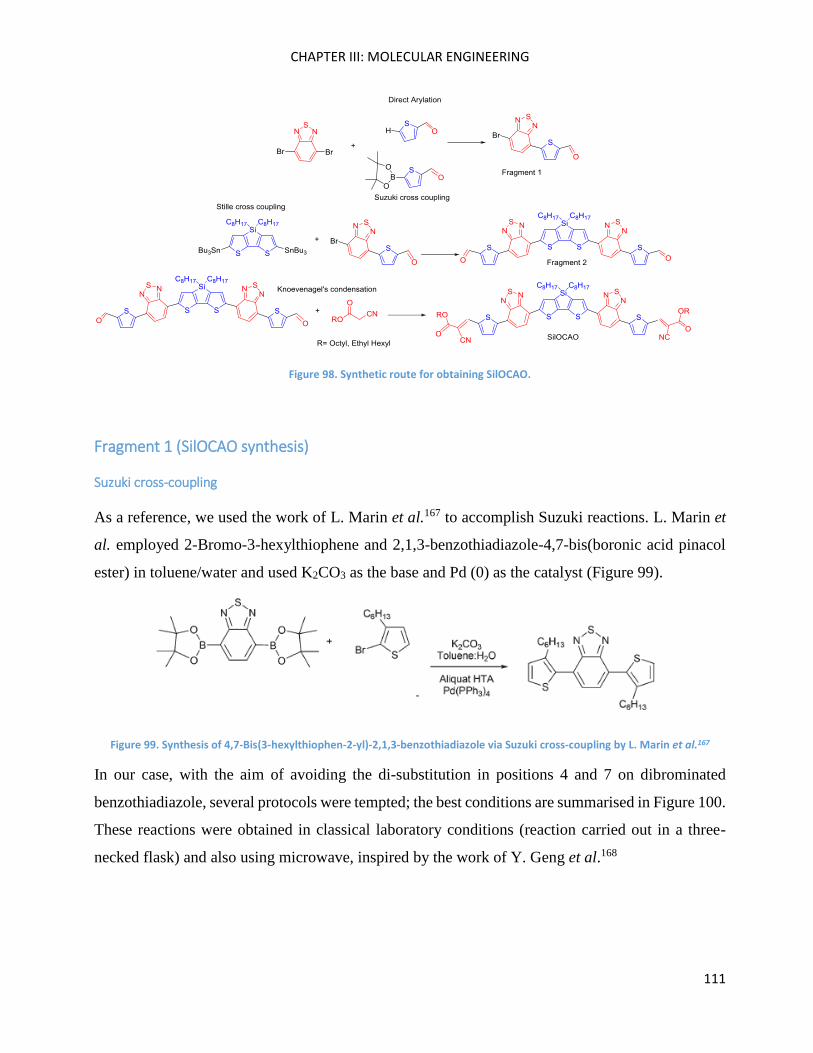
CHAPTER III: MOLECULAR ENGINEERING
111
Figure 98. Synthetic route for obtaining SilOCAO.
Fragment 1 (SilOCAO synthesis)
Suzuki cross-coupling
As a reference, we used the work of L. Marin et al.167 to accomplish Suzuki reactions. L. Marin et
al. employed 2-Bromo-3-hexylthiophene and 2,1,3-benzothiadiazole-4,7-bis(boronic acid pinacol
ester) in toluene/water and used K2CO3 as the base and Pd (0) as the catalyst (Figure 99).
Figure 99. Synthesis of 4,7-Bis(3-hexylthiophen-2-yl)-2,1,3-benzothiadiazole via Suzuki cross-coupling by L. Marin et al.167
In our case, with the aim of avoiding the di-substitution in positions 4 and 7 on dibrominated
benzothiadiazole, several protocols were tempted; the best conditions are summarised in Figure 100.
These reactions were obtained in classical laboratory conditions (reaction carried out in a three-
necked flask) and also using microwave, inspired by the work of Y. Geng et al.168
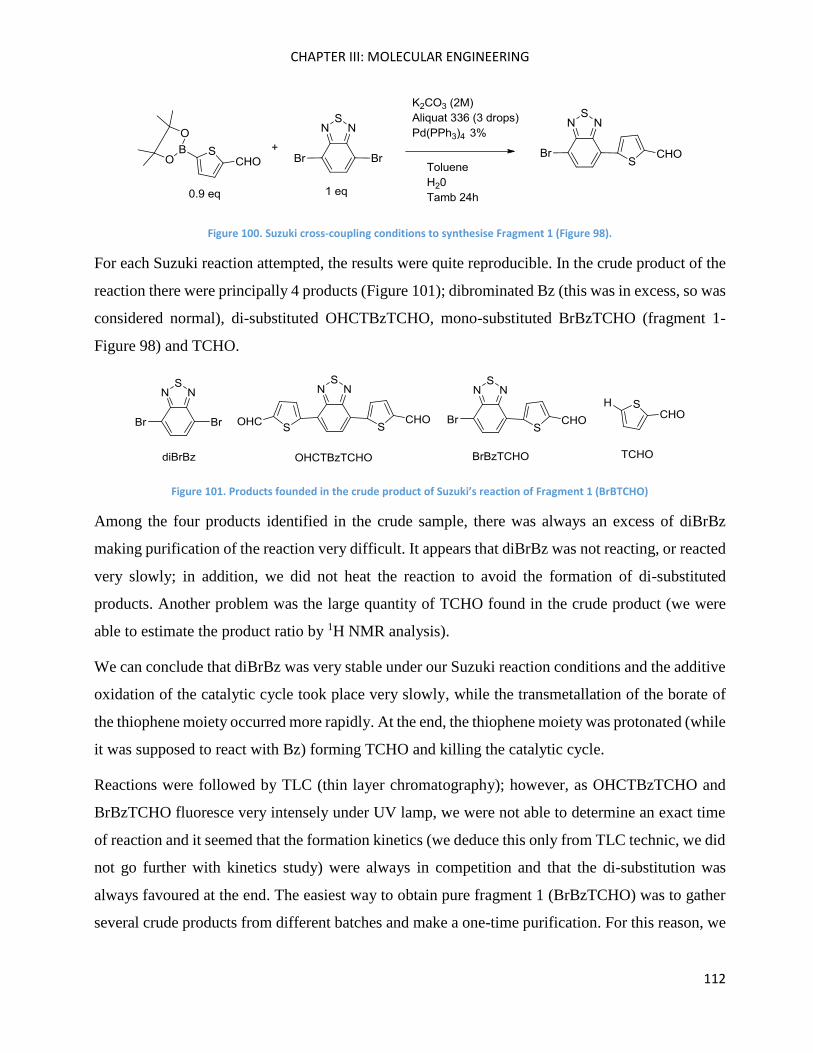
CHAPTER III: MOLECULAR ENGINEERING
112
Figure 100. Suzuki cross-coupling conditions to synthesise Fragment 1 (Figure 98).
For each Suzuki reaction attempted, the results were quite reproducible. In the crude product of the
reaction there were principally 4 products (Figure 101); dibrominated Bz (this was in excess, so was
considered normal), di-substituted OHCTBzTCHO, mono-substituted BrBzTCHO (fragment 1-
Figure 98) and TCHO.
Figure 101. Products founded in the crude product of Suzuki’s reaction of Fragment 1 (BrBTCHO)
Among the four products identified in the crude sample, there was always an excess of diBrBz
making purification of the reaction very difficult. It appears that diBrBz was not reacting, or reacted
very slowly; in addition, we did not heat the reaction to avoid the formation of di-substituted
products. Another problem was the large quantity of TCHO found in the crude product (we were
able to estimate the product ratio by 1H NMR analysis).
We can conclude that diBrBz was very stable under our Suzuki reaction conditions and the additive
oxidation of the catalytic cycle took place very slowly, while the transmetallation of the borate of
the thiophene moiety occurred more rapidly. At the end, the thiophene moiety was protonated (while
it was supposed to react with Bz) forming TCHO and killing the catalytic cycle.
Reactions were followed by TLC (thin layer chromatography); however, as OHCTBzTCHO and
BrBzTCHO fluoresce very intensely under UV lamp, we were not able to determine an exact time
of reaction and it seemed that the formation kinetics (we deduce this only from TLC technic, we did
not go further with kinetics study) were always in competition and that the di-substitution was
always favoured at the end. The easiest way to obtain pure fragment 1 (BrBzTCHO) was to gather
several crude products from different batches and make a one-time purification. For this reason, we
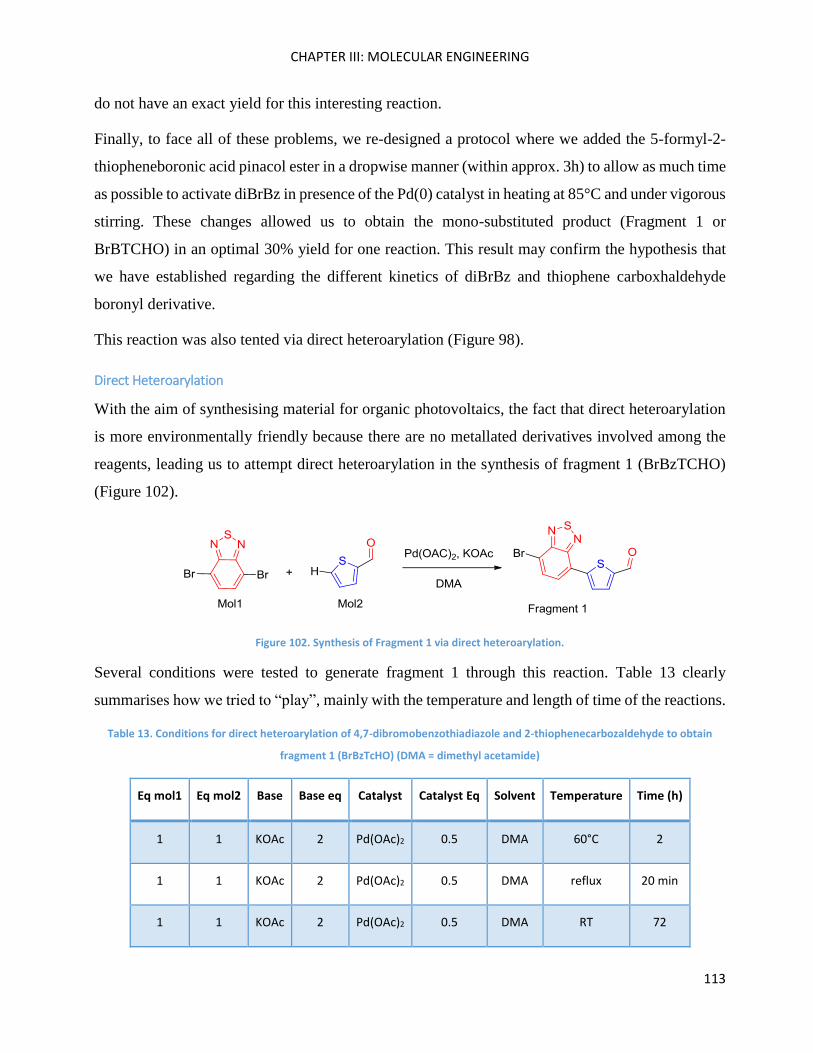
CHAPTER III: MOLECULAR ENGINEERING
113
do not have an exact yield for this interesting reaction.
Finally, to face all of these problems, we re-designed a protocol where we added the 5-formyl-2-
thiopheneboronic acid pinacol ester in a dropwise manner (within approx. 3h) to allow as much time
as possible to activate diBrBz in presence of the Pd(0) catalyst in heating at 85°C and under vigorous
stirring. These changes allowed us to obtain the mono-substituted product (Fragment 1 or
BrBTCHO) in an optimal 30% yield for one reaction. This result may confirm the hypothesis that
we have established regarding the different kinetics of diBrBz and thiophene carboxhaldehyde
boronyl derivative.
This reaction was also tented via direct heteroarylation (Figure 98).
Direct Heteroarylation
With the aim of synthesising material for organic photovoltaics, the fact that direct heteroarylation
is more environmentally friendly because there are no metallated derivatives involved among the
reagents, leading us to attempt direct heteroarylation in the synthesis of fragment 1 (BrBzTCHO)
(Figure 102).
Figure 102. Synthesis of Fragment 1 via direct heteroarylation.
Several conditions were tested to generate fragment 1 through this reaction. Table 13 clearly
summarises how we tried to “play”, mainly with the temperature and length of time of the reactions.
Table 13. Conditions for direct heteroarylation of 4,7-dibromobenzothiadiazole and 2-thiophenecarbozaldehyde to obtain
fragment 1 (BrBzTcHO) (DMA = dimethyl acetamide)
Eq mol1 Eq mol2 Base Base eq Catalyst Catalyst Eq Solvent Temperature Time (h)
1 1 KOAc 2 Pd(OAc)2 0.5 DMA 60°C 2
1 1 KOAc 2 Pd(OAc)2 0.5 DMA reflux 20 min
1 1 KOAc 2 Pd(OAc)2 0.5 DMA RT 72
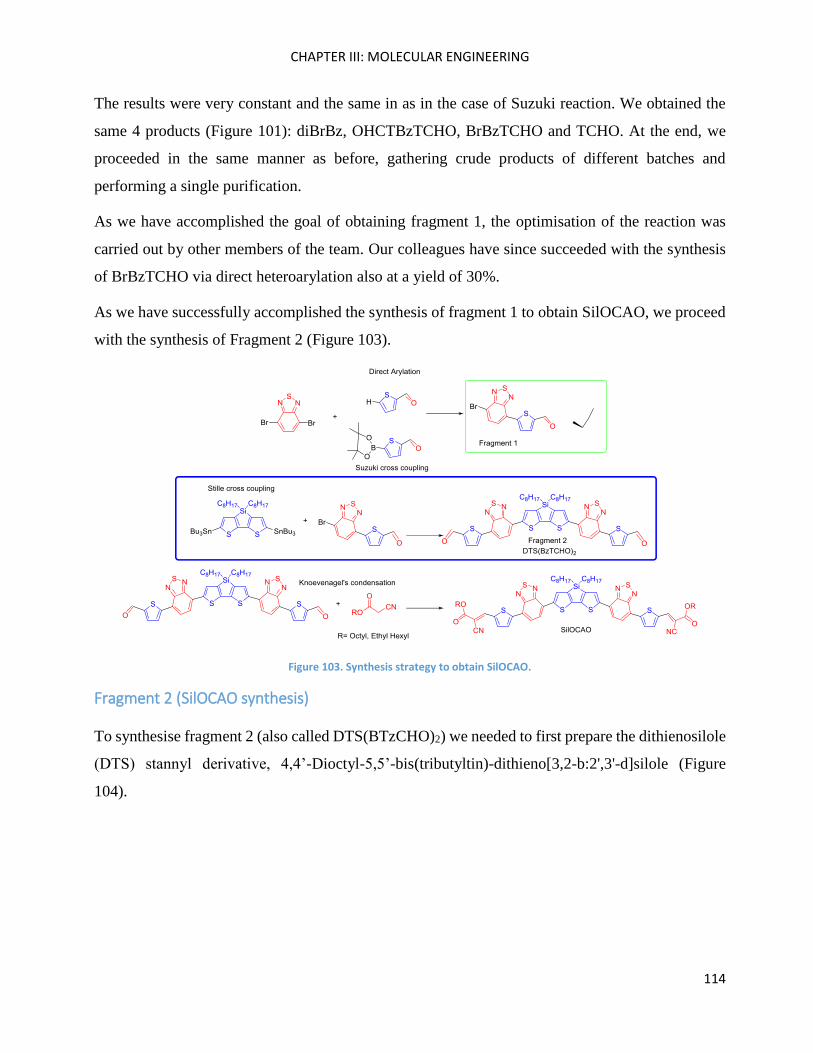
CHAPTER III: MOLECULAR ENGINEERING
114
The results were very constant and the same in as in the case of Suzuki reaction. We obtained the
same 4 products (Figure 101): diBrBz, OHCTBzTCHO, BrBzTCHO and TCHO. At the end, we
proceeded in the same manner as before, gathering crude products of different batches and
performing a single purification.
As we have accomplished the goal of obtaining fragment 1, the optimisation of the reaction was
carried out by other members of the team. Our colleagues have since succeeded with the synthesis
of BrBzTCHO via direct heteroarylation also at a yield of 30%.
As we have successfully accomplished the synthesis of fragment 1 to obtain SilOCAO, we proceed
with the synthesis of Fragment 2 (Figure 103).
Figure 103. Synthesis strategy to obtain SilOCAO.
Fragment 2 (SilOCAO synthesis)
To synthesise fragment 2 (also called DTS(BTzCHO)2) we needed to first prepare the dithienosilole
(DTS) stannyl derivative, 4,4’-Dioctyl-5,5’-bis(tributyltin)-dithieno[3,2-b:2',3'-d]silole (Figure
104).
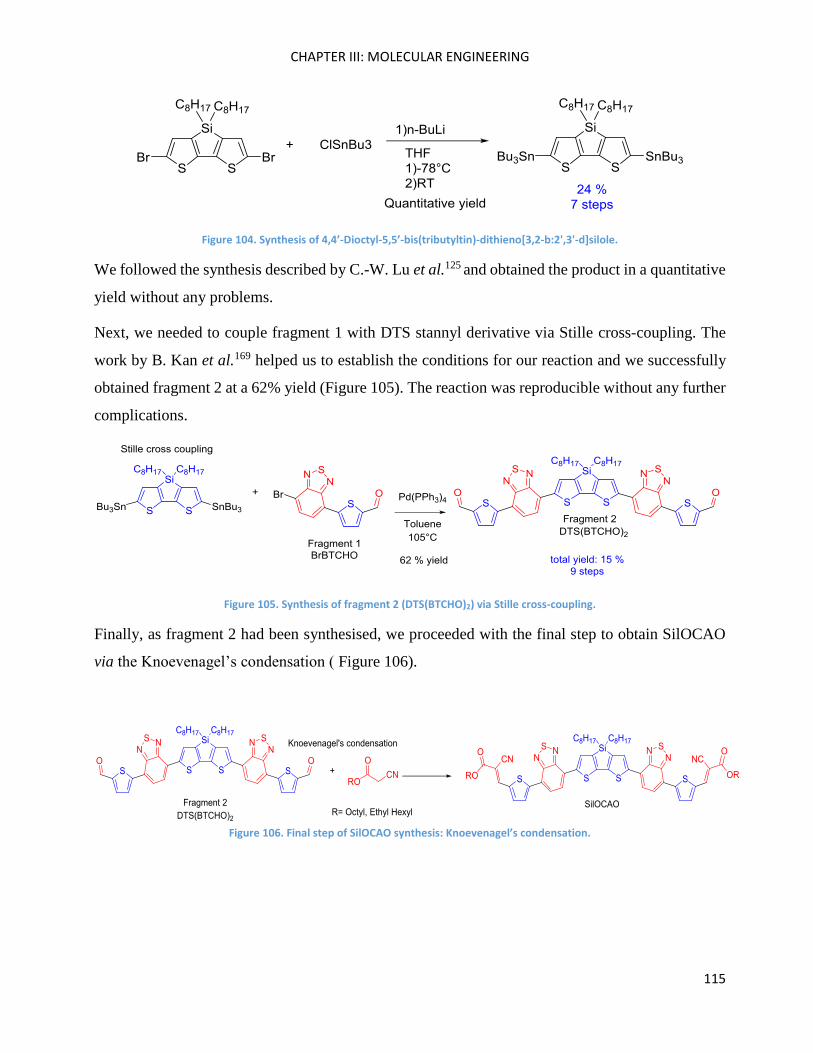
CHAPTER III: MOLECULAR ENGINEERING
115
Figure 104. Synthesis of 4,4’-Dioctyl-5,5’-bis(tributyltin)-dithieno[3,2-b:2',3'-d]silole.
We followed the synthesis described by C.-W. Lu et al.125 and obtained the product in a quantitative
yield without any problems.
Next, we needed to couple fragment 1 with DTS stannyl derivative via Stille cross-coupling. The
work by B. Kan et al.169 helped us to establish the conditions for our reaction and we successfully
obtained fragment 2 at a 62% yield (Figure 105). The reaction was reproducible without any further
complications.
Figure 105. Synthesis of fragment 2 (DTS(BTCHO)2) via Stille cross-coupling.
Finally, as fragment 2 had been synthesised, we proceeded with the final step to obtain SilOCAO
via the Knoevenagel’s condensation ( Figure 106).
Figure 106. Final step of SilOCAO synthesis: Knoevenagel’s condensation.
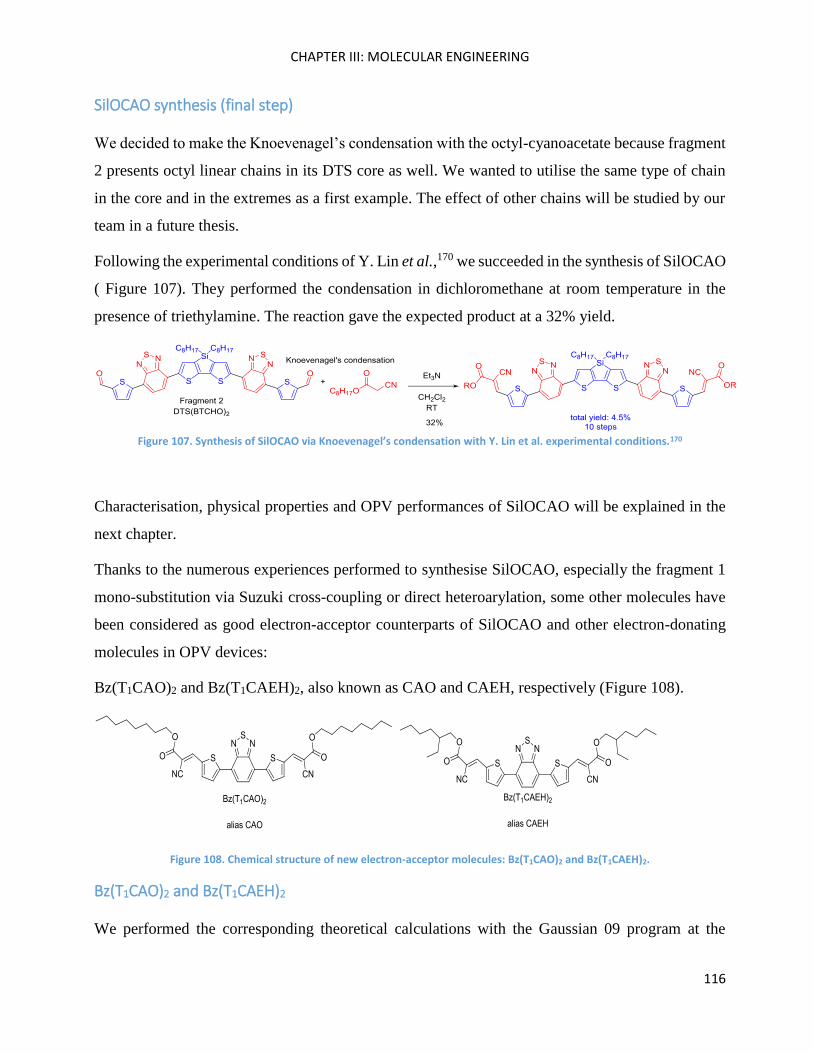
CHAPTER III: MOLECULAR ENGINEERING
116
SilOCAO synthesis (final step)
We decided to make the Knoevenagel’s condensation with the octyl-cyanoacetate because fragment
2 presents octyl linear chains in its DTS core as well. We wanted to utilise the same type of chain
in the core and in the extremes as a first example. The effect of other chains will be studied by our
team in a future thesis.
Following the experimental conditions of Y. Lin et al.,170 we succeeded in the synthesis of SilOCAO
( Figure 107). They performed the condensation in dichloromethane at room temperature in the
presence of triethylamine. The reaction gave the expected product at a 32% yield.
Figure 107. Synthesis of SilOCAO via Knoevenagel’s condensation with Y. Lin et al. experimental conditions.170
Characterisation, physical properties and OPV performances of SilOCAO will be explained in the
next chapter.
Thanks to the numerous experiences performed to synthesise SilOCAO, especially the fragment 1
mono-substitution via Suzuki cross-coupling or direct heteroarylation, some other molecules have
been considered as good electron-acceptor counterparts of SilOCAO and other electron-donating
molecules in OPV devices:
Bz(T1CAO)2 and Bz(T1CAEH)2, also known as CAO and CAEH, respectively (Figure 108).
Figure 108. Chemical structure of new electron-acceptor molecules: Bz(T1CAO)2 and Bz(T1CAEH)2.
Bz(T1CAO)2 and Bz(T1CAEH)2
We performed the corresponding theoretical calculations with the Gaussian 09 program at the
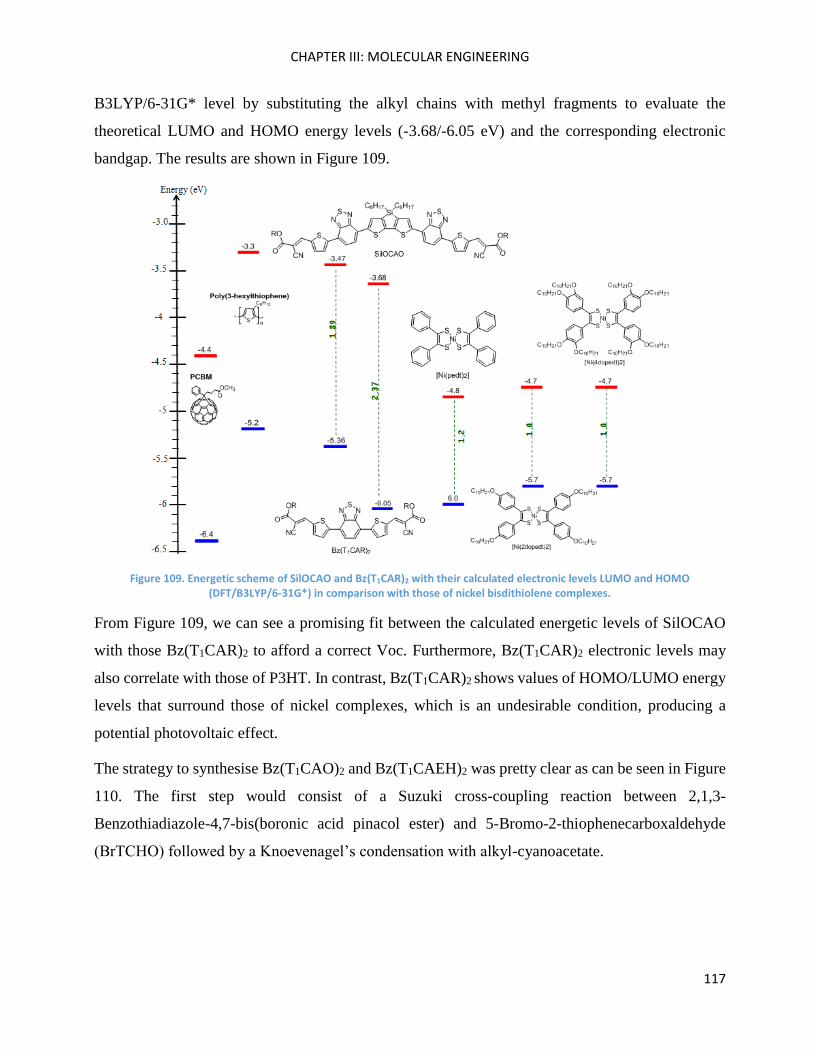
CHAPTER III: MOLECULAR ENGINEERING
117
B3LYP/6-31G* level by substituting the alkyl chains with methyl fragments to evaluate the
theoretical LUMO and HOMO energy levels (-3.68/-6.05 eV) and the corresponding electronic
bandgap. The results are shown in Figure 109.
Figure 109. Energetic scheme of SilOCAO and Bz(T1CAR)2 with their calculated electronic levels LUMO and HOMO (DFT/B3LYP/6-31G*) in comparison with those of nickel bisdithiolene complexes.
From Figure 109, we can see a promising fit between the calculated energetic levels of SilOCAO
with those Bz(T1CAR)2 to afford a correct Voc. Furthermore, Bz(T1CAR)2 electronic levels may
also correlate with those of P3HT. In contrast, Bz(T1CAR)2 shows values of HOMO/LUMO energy
levels that surround those of nickel complexes, which is an undesirable condition, producing a
potential photovoltaic effect.
The strategy to synthesise Bz(T1CAO)2 and Bz(T1CAEH)2 was pretty clear as can be seen in Figure
110. The first step would consist of a Suzuki cross-coupling reaction between 2,1,3-
Benzothiadiazole-4,7-bis(boronic acid pinacol ester) and 5-Bromo-2-thiophenecarboxaldehyde
(BrTCHO) followed by a Knoevenagel’s condensation with alkyl-cyanoacetate.
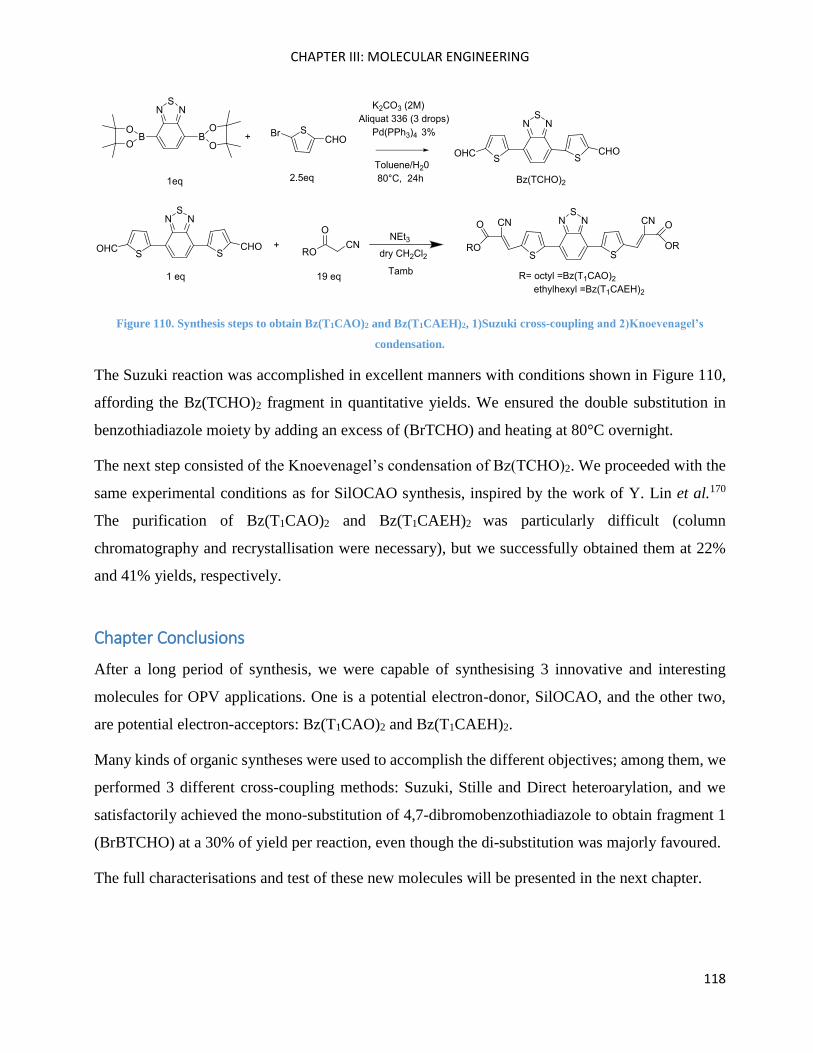
CHAPTER III: MOLECULAR ENGINEERING
118
Figure 110. Synthesis steps to obtain Bz(T1CAO)2 and Bz(T1CAEH)2, 1)Suzuki cross-coupling and 2)Knoevenagel’s
condensation.
The Suzuki reaction was accomplished in excellent manners with conditions shown in Figure 110,
affording the Bz(TCHO)2 fragment in quantitative yields. We ensured the double substitution in
benzothiadiazole moiety by adding an excess of (BrTCHO) and heating at 80°C overnight.
The next step consisted of the Knoevenagel’s condensation of Bz(TCHO)2. We proceeded with the
same experimental conditions as for SilOCAO synthesis, inspired by the work of Y. Lin et al.170
The purification of Bz(T1CAO)2 and Bz(T1CAEH)2 was particularly difficult (column
chromatography and recrystallisation were necessary), but we successfully obtained them at 22%
and 41% yields, respectively.
Chapter Conclusions
After a long period of synthesis, we were capable of synthesising 3 innovative and interesting
molecules for OPV applications. One is a potential electron-donor, SilOCAO, and the other two,
are potential electron-acceptors: Bz(T1CAO)2 and Bz(T1CAEH)2.
Many kinds of organic syntheses were used to accomplish the different objectives; among them, we
performed 3 different cross-coupling methods: Suzuki, Stille and Direct heteroarylation, and we
satisfactorily achieved the mono-substitution of 4,7-dibromobenzothiadiazole to obtain fragment 1
(BrBTCHO) at a 30% of yield per reaction, even though the di-substitution was majorly favoured.
The full characterisations and test of these new molecules will be presented in the next chapter.
CHAPTER IV: MOLECULES CHARACTERISATIONS AND OPV DEVICES
119
Chapter IV: Molecules characterisations
and OPV devices

CHAPTER IV: MOLECULES CHARACTERISATIONS AND OPV DEVICES
120
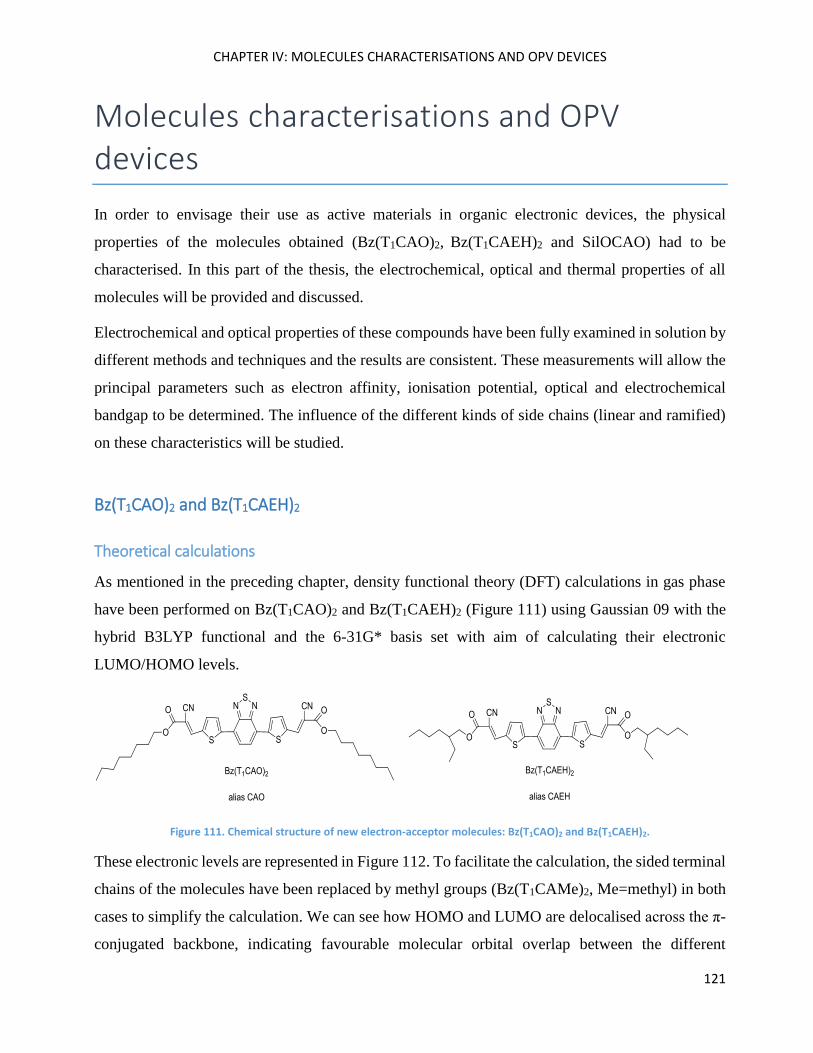
CHAPTER IV: MOLECULES CHARACTERISATIONS AND OPV DEVICES
121
Molecules characterisations and OPV devices
In order to envisage their use as active materials in organic electronic devices, the physical
properties of the molecules obtained (Bz(T1CAO)2, Bz(T1CAEH)2 and SilOCAO) had to be
characterised. In this part of the thesis, the electrochemical, optical and thermal properties of all
molecules will be provided and discussed.
Electrochemical and optical properties of these compounds have been fully examined in solution by
different methods and techniques and the results are consistent. These measurements will allow the
principal parameters such as electron affinity, ionisation potential, optical and electrochemical
bandgap to be determined. The influence of the different kinds of side chains (linear and ramified)
on these characteristics will be studied.
Bz(T1CAO)2 and Bz(T1CAEH)2
Theoretical calculations
As mentioned in the preceding chapter, density functional theory (DFT) calculations in gas phase
have been performed on Bz(T1CAO)2 and Bz(T1CAEH)2 (Figure 111) using Gaussian 09 with the
hybrid B3LYP functional and the 6-31G* basis set with aim of calculating their electronic
LUMO/HOMO levels.
Figure 111. Chemical structure of new electron-acceptor molecules: Bz(T1CAO)2 and Bz(T1CAEH)2.
These electronic levels are represented in Figure 112. To facilitate the calculation, the sided terminal
chains of the molecules have been replaced by methyl groups (Bz(T1CAMe)2, Me=methyl) in both
cases to simplify the calculation. We can see how HOMO and LUMO are delocalised across the π-
conjugated backbone, indicating favourable molecular orbital overlap between the different
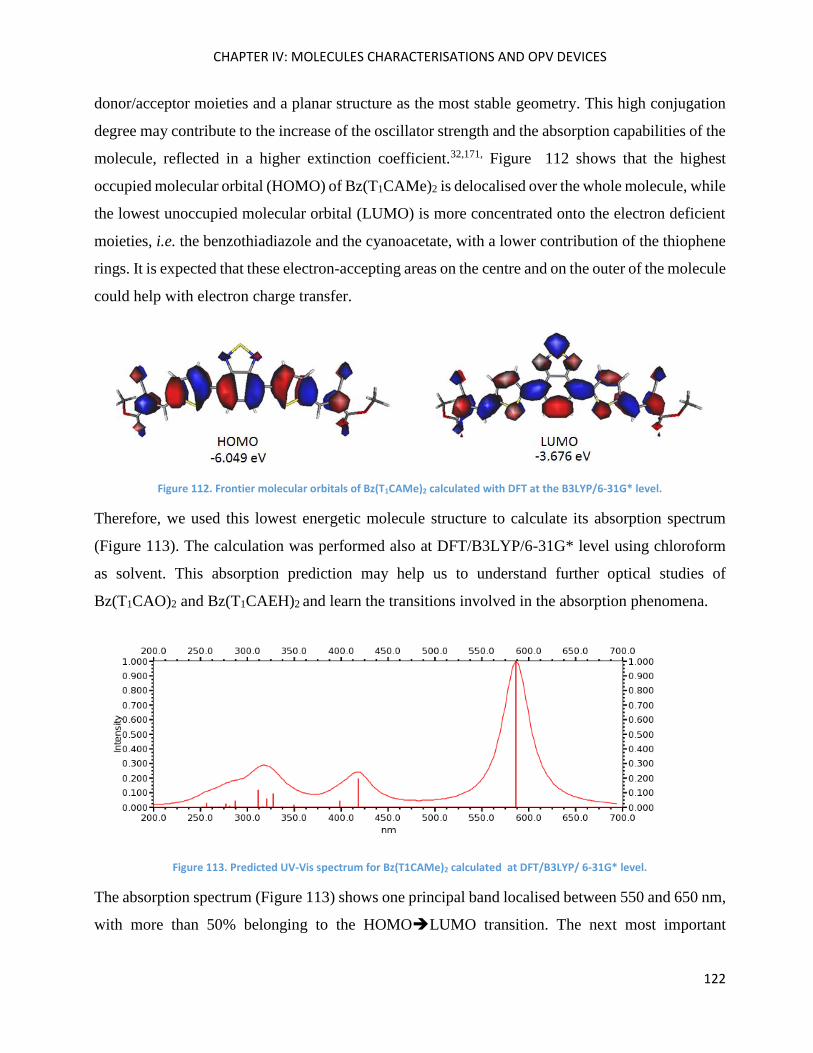
CHAPTER IV: MOLECULES CHARACTERISATIONS AND OPV DEVICES
122
donor/acceptor moieties and a planar structure as the most stable geometry. This high conjugation
degree may contribute to the increase of the oscillator strength and the absorption capabilities of the
molecule, reflected in a higher extinction coefficient.32,171, Figure 112 shows that the highest
occupied molecular orbital (HOMO) of Bz(T1CAMe)2 is delocalised over the whole molecule, while
the lowest unoccupied molecular orbital (LUMO) is more concentrated onto the electron deficient
moieties, i.e. the benzothiadiazole and the cyanoacetate, with a lower contribution of the thiophene
rings. It is expected that these electron-accepting areas on the centre and on the outer of the molecule
could help with electron charge transfer.
Figure 112. Frontier molecular orbitals of Bz(T1CAMe)2 calculated with DFT at the B3LYP/6-31G* level.
Therefore, we used this lowest energetic molecule structure to calculate its absorption spectrum
(Figure 113). The calculation was performed also at DFT/B3LYP/6-31G* level using chloroform
as solvent. This absorption prediction may help us to understand further optical studies of
Bz(T1CAO)2 and Bz(T1CAEH)2 and learn the transitions involved in the absorption phenomena.
Figure 113. Predicted UV-Vis spectrum for Bz(T1CAMe)2 calculated at DFT/B3LYP/ 6-31G* level.
The absorption spectrum (Figure 113) shows one principal band localised between 550 and 650 nm,
with more than 50% belonging to the HOMOLUMO transition. The next most important
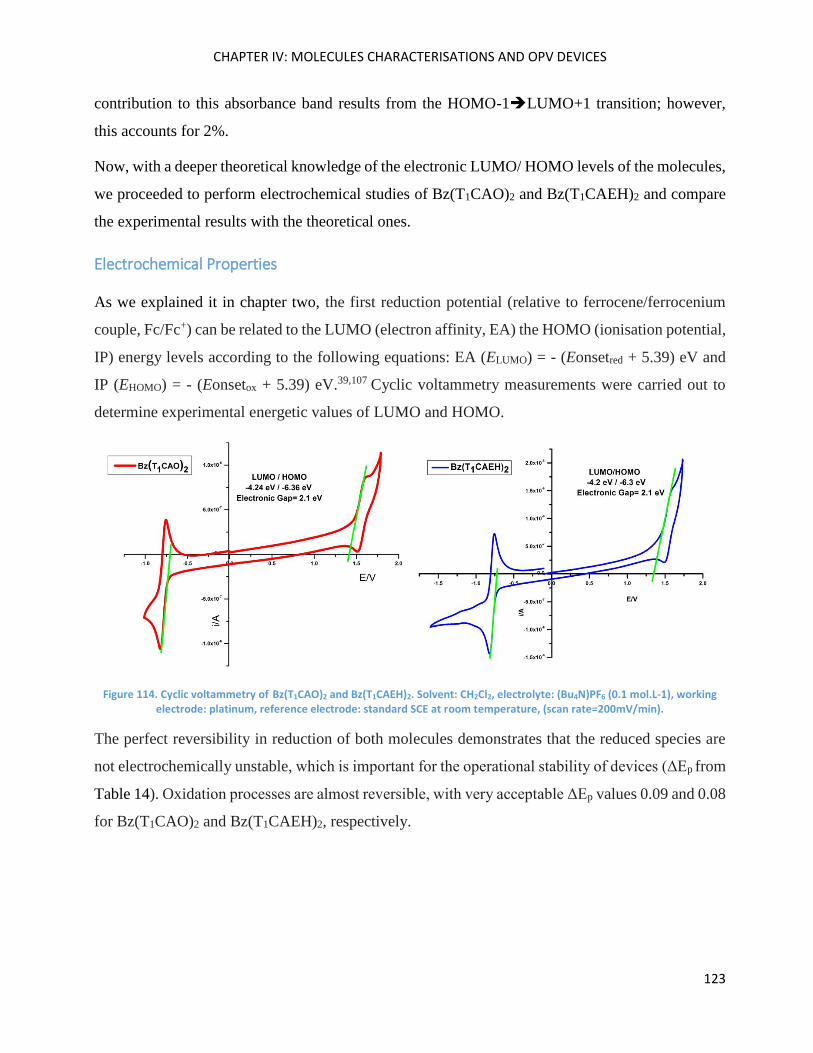
CHAPTER IV: MOLECULES CHARACTERISATIONS AND OPV DEVICES
123
contribution to this absorbance band results from the HOMO-1LUMO+1 transition; however,
this accounts for 2%.
Now, with a deeper theoretical knowledge of the electronic LUMO/ HOMO levels of the molecules,
we proceeded to perform electrochemical studies of Bz(T1CAO)2 and Bz(T1CAEH)2 and compare
the experimental results with the theoretical ones.
Electrochemical Properties
As we explained it in chapter two, the first reduction potential (relative to ferrocene/ferrocenium
couple, Fc/Fc+) can be related to the LUMO (electron affinity, EA) the HOMO (ionisation potential,
IP) energy levels according to the following equations: EA (ELUMO) = - (Eonsetred + 5.39) eV and
IP (EHOMO) = - (Eonsetox + 5.39) eV.39,107 Cyclic voltammetry measurements were carried out to
determine experimental energetic values of LUMO and HOMO.
Figure 114. Cyclic voltammetry of Bz(T1CAO)2 and Bz(T1CAEH)2. Solvent: CH2Cl2, electrolyte: (Bu4N)PF6 (0.1 mol.L-1), working electrode: platinum, reference electrode: standard SCE at room temperature, (scan rate=200mV/min).
The perfect reversibility in reduction of both molecules demonstrates that the reduced species are
not electrochemically unstable, which is important for the operational stability of devices (ΔEp from
Table 14). Oxidation processes are almost reversible, with very acceptable ΔEp values 0.09 and 0.08
for Bz(T1CAO)2 and Bz(T1CAEH)2, respectively.
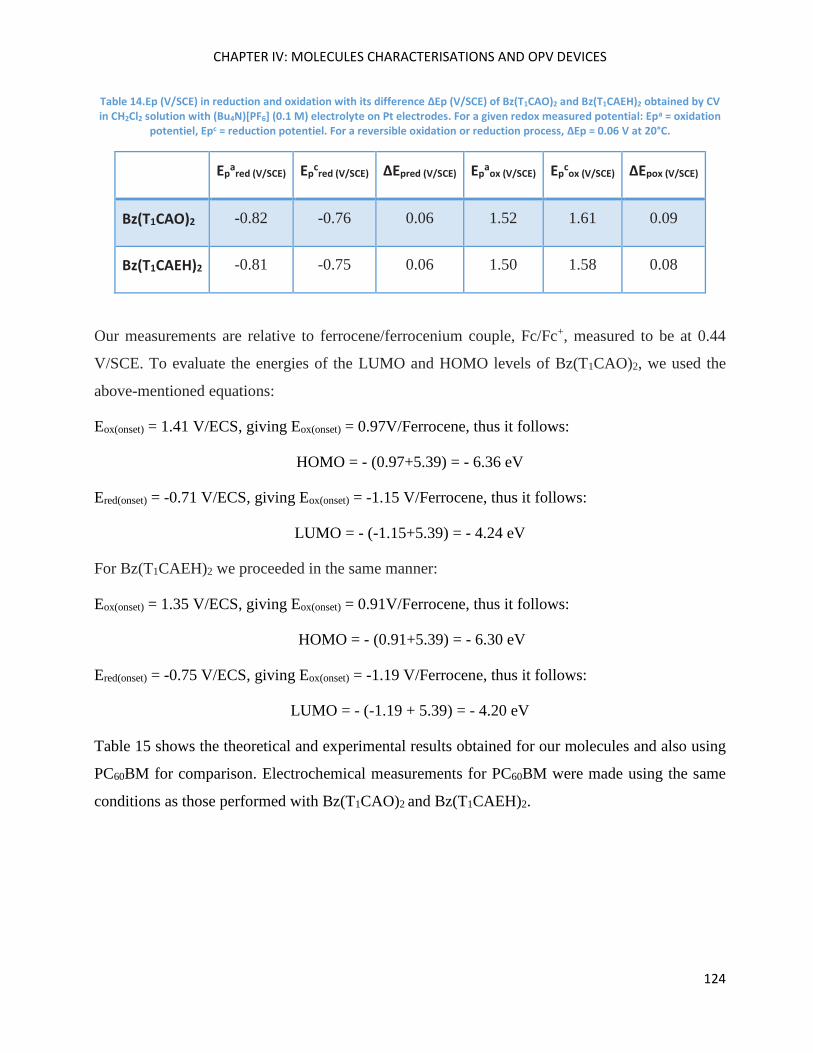
CHAPTER IV: MOLECULES CHARACTERISATIONS AND OPV DEVICES
124
Table 14.Ep (V/SCE) in reduction and oxidation with its difference ΔEp (V/SCE) of Bz(T1CAO)2 and Bz(T1CAEH)2 obtained by CV in CH2Cl2 solution with (Bu4N)[PF6] (0.1 M) electrolyte on Pt electrodes. For a given redox measured potential: Epa = oxidation
potentiel, Epc = reduction potentiel. For a reversible oxidation or reduction process, ΔEp = 0.06 V at 20°C.
Epa
red (V/SCE) Epcred (V/SCE) ΔEpred (V/SCE) Ep
aox (V/SCE) Ep
cox (V/SCE) ΔEpox (V/SCE)
Bz(T1CAO)2 -0.82 -0.76 0.06 1.52 1.61 0.09
Bz(T1CAEH)2 -0.81 -0.75 0.06 1.50 1.58 0.08
Our measurements are relative to ferrocene/ferrocenium couple, Fc/Fc+, measured to be at 0.44
V/SCE. To evaluate the energies of the LUMO and HOMO levels of Bz(T1CAO)2, we used the
above-mentioned equations:
Eox(onset) = 1.41 V/ECS, giving Eox(onset) = 0.97V/Ferrocene, thus it follows:
HOMO = - (0.97+5.39) = - 6.36 eV
Ered(onset) = -0.71 V/ECS, giving Eox(onset) = -1.15 V/Ferrocene, thus it follows:
LUMO = - (-1.15+5.39) = - 4.24 eV
For Bz(T1CAEH)2 we proceeded in the same manner:
Eox(onset) = 1.35 V/ECS, giving Eox(onset) = 0.91V/Ferrocene, thus it follows:
HOMO = - (0.91+5.39) = - 6.30 eV
Ered(onset) = -0.75 V/ECS, giving Eox(onset) = -1.19 V/Ferrocene, thus it follows:
LUMO = - (-1.19 + 5.39) = - 4.20 eV
Table 15 shows the theoretical and experimental results obtained for our molecules and also using
PC60BM for comparison. Electrochemical measurements for PC60BM were made using the same
conditions as those performed with Bz(T1CAO)2 and Bz(T1CAEH)2.
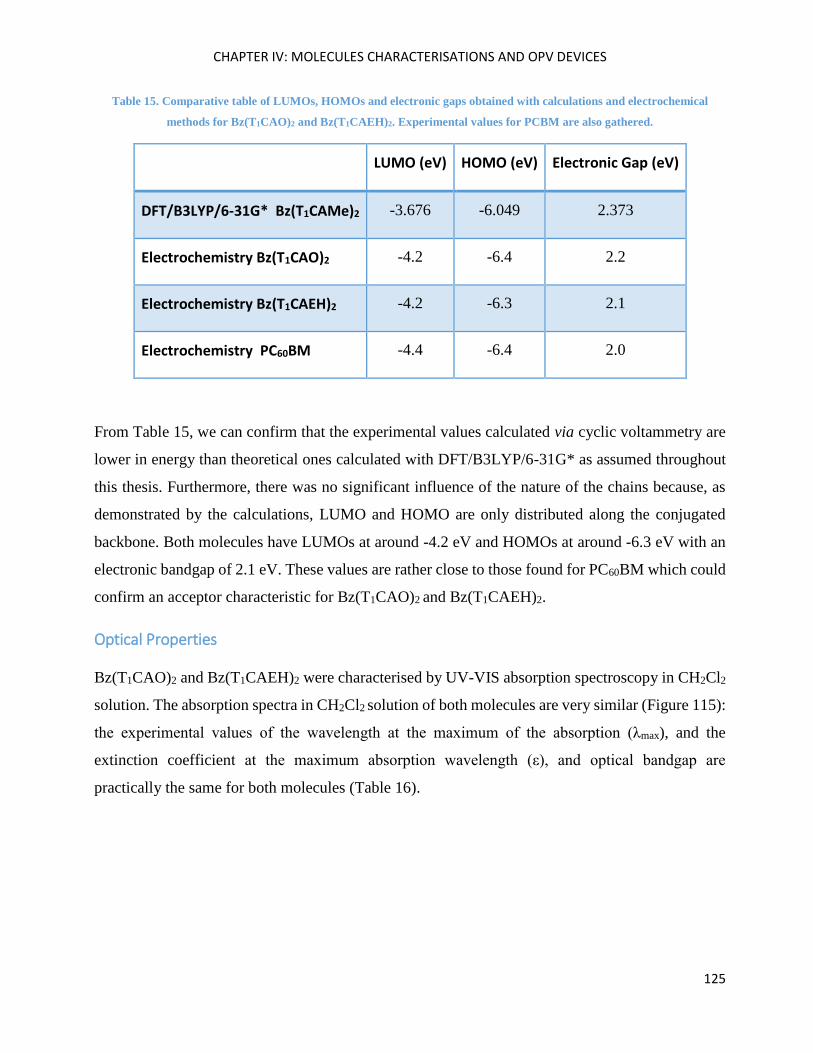
CHAPTER IV: MOLECULES CHARACTERISATIONS AND OPV DEVICES
125
Table 15. Comparative table of LUMOs, HOMOs and electronic gaps obtained with calculations and electrochemical
methods for Bz(T1CAO)2 and Bz(T1CAEH)2. Experimental values for PCBM are also gathered.
LUMO (eV) HOMO (eV) Electronic Gap (eV)
DFT/B3LYP/6-31G* Bz(T1CAMe)2 -3.676 -6.049 2.373
Electrochemistry Bz(T1CAO)2 -4.2 -6.4 2.2
Electrochemistry Bz(T1CAEH)2 -4.2 -6.3 2.1
Electrochemistry PC60BM -4.4 -6.4 2.0
From Table 15, we can confirm that the experimental values calculated via cyclic voltammetry are
lower in energy than theoretical ones calculated with DFT/B3LYP/6-31G* as assumed throughout
this thesis. Furthermore, there was no significant influence of the nature of the chains because, as
demonstrated by the calculations, LUMO and HOMO are only distributed along the conjugated
backbone. Both molecules have LUMOs at around -4.2 eV and HOMOs at around -6.3 eV with an
electronic bandgap of 2.1 eV. These values are rather close to those found for PC60BM which could
confirm an acceptor characteristic for Bz(T1CAO)2 and Bz(T1CAEH)2.
Optical Properties
Bz(T1CAO)2 and Bz(T1CAEH)2 were characterised by UV-VIS absorption spectroscopy in CH2Cl2
solution. The absorption spectra in CH2Cl2 solution of both molecules are very similar (Figure 115):
the experimental values of the wavelength at the maximum of the absorption (λmax), and the
extinction coefficient at the maximum absorption wavelength (ε), and optical bandgap are
practically the same for both molecules (Table 16).
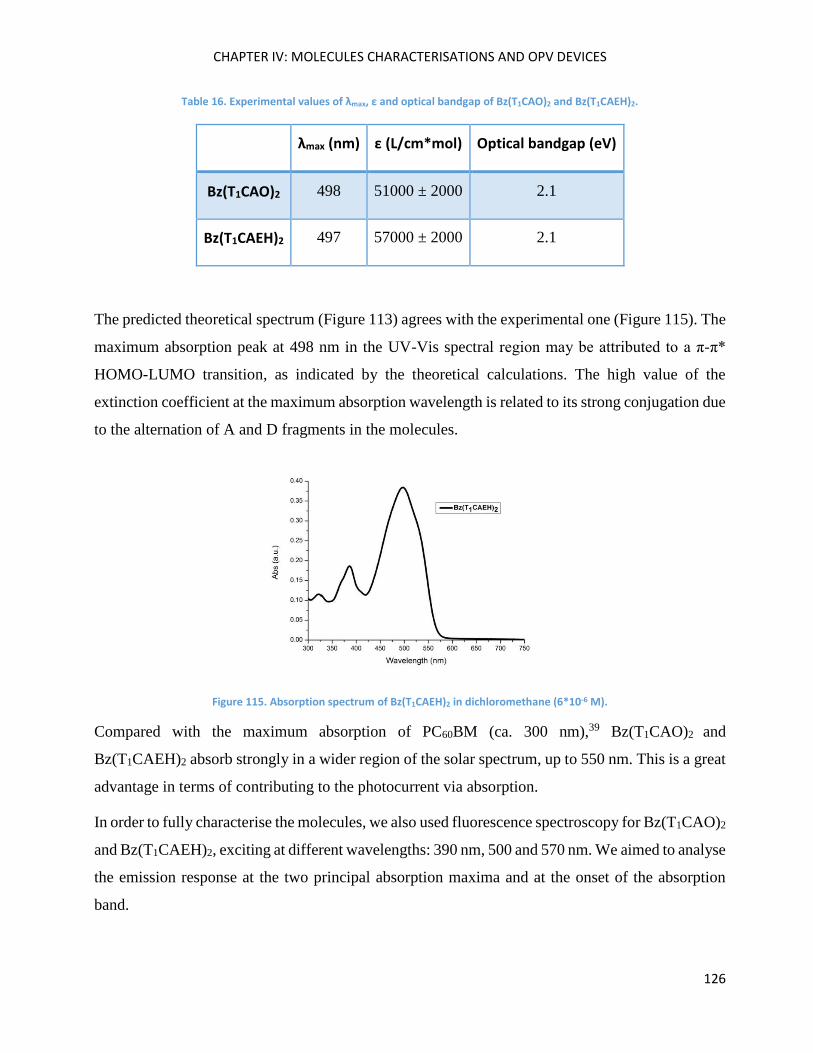
CHAPTER IV: MOLECULES CHARACTERISATIONS AND OPV DEVICES
126
Table 16. Experimental values of λmax, ε and optical bandgap of Bz(T1CAO)2 and Bz(T1CAEH)2.
λmax (nm) ε (L/cm*mol) Optical bandgap (eV)
Bz(T1CAO)2 498 51000 ± 2000 2.1
Bz(T1CAEH)2 497 57000 ± 2000 2.1
The predicted theoretical spectrum (Figure 113) agrees with the experimental one (Figure 115). The
maximum absorption peak at 498 nm in the UV-Vis spectral region may be attributed to a π-π*
HOMO-LUMO transition, as indicated by the theoretical calculations. The high value of the
extinction coefficient at the maximum absorption wavelength is related to its strong conjugation due
to the alternation of A and D fragments in the molecules.
Figure 115. Absorption spectrum of Bz(T1CAEH)2 in dichloromethane (6*10-6 M).
Compared with the maximum absorption of PC60BM (ca. 300 nm),39 Bz(T1CAO)2 and
Bz(T1CAEH)2 absorb strongly in a wider region of the solar spectrum, up to 550 nm. This is a great
advantage in terms of contributing to the photocurrent via absorption.
In order to fully characterise the molecules, we also used fluorescence spectroscopy for Bz(T1CAO)2
and Bz(T1CAEH)2, exciting at different wavelengths: 390 nm, 500 and 570 nm. We aimed to analyse
the emission response at the two principal absorption maxima and at the onset of the absorption
band.
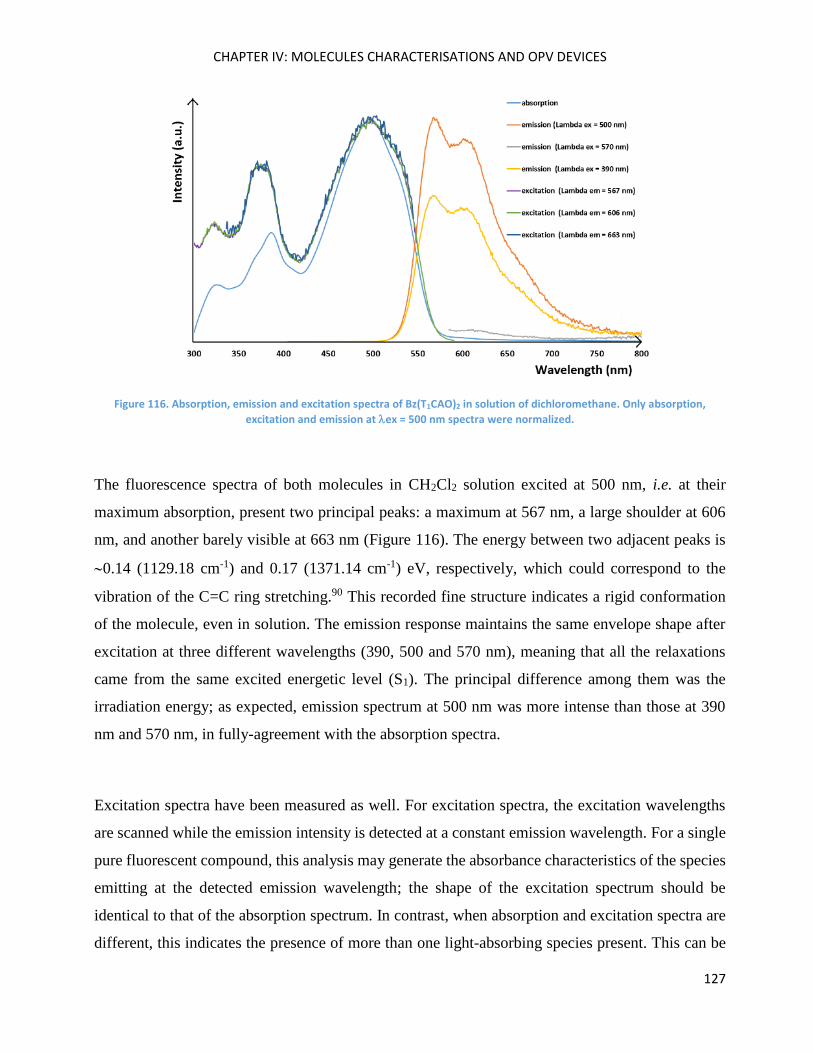
CHAPTER IV: MOLECULES CHARACTERISATIONS AND OPV DEVICES
127
Figure 116. Absorption, emission and excitation spectra of Bz(T1CAO)2 in solution of dichloromethane. Only absorption,
excitation and emission at ex = 500 nm spectra were normalized.
The fluorescence spectra of both molecules in CH2Cl2 solution excited at 500 nm, i.e. at their
maximum absorption, present two principal peaks: a maximum at 567 nm, a large shoulder at 606
nm, and another barely visible at 663 nm (Figure 116). The energy between two adjacent peaks is
0.14 (1129.18 cm-1) and 0.17 (1371.14 cm-1) eV, respectively, which could correspond to the
vibration of the C=C ring stretching.90 This recorded fine structure indicates a rigid conformation
of the molecule, even in solution. The emission response maintains the same envelope shape after
excitation at three different wavelengths (390, 500 and 570 nm), meaning that all the relaxations
came from the same excited energetic level (S1). The principal difference among them was the
irradiation energy; as expected, emission spectrum at 500 nm was more intense than those at 390
nm and 570 nm, in fully-agreement with the absorption spectra.
Excitation spectra have been measured as well. For excitation spectra, the excitation wavelengths
are scanned while the emission intensity is detected at a constant emission wavelength. For a single
pure fluorescent compound, this analysis may generate the absorbance characteristics of the species
emitting at the detected emission wavelength; the shape of the excitation spectrum should be
identical to that of the absorption spectrum. In contrast, when absorption and excitation spectra are
different, this indicates the presence of more than one light-absorbing species present. This can be
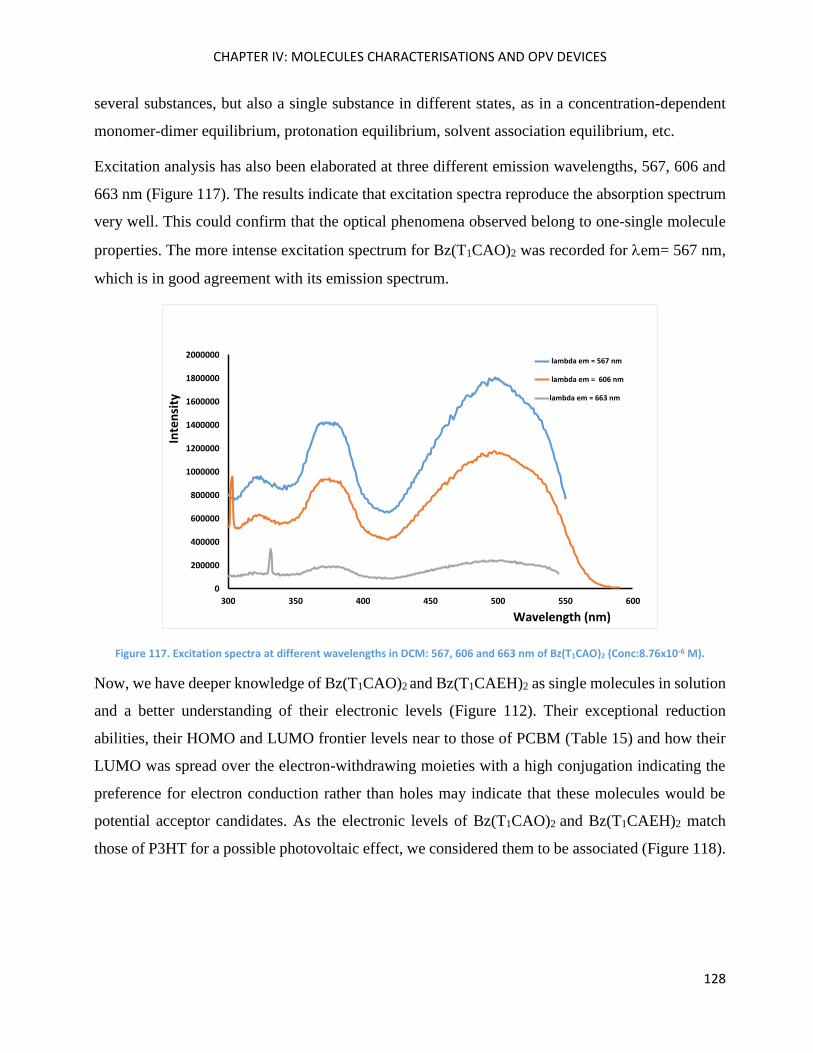
CHAPTER IV: MOLECULES CHARACTERISATIONS AND OPV DEVICES
128
several substances, but also a single substance in different states, as in a concentration-dependent
monomer-dimer equilibrium, protonation equilibrium, solvent association equilibrium, etc.
Excitation analysis has also been elaborated at three different emission wavelengths, 567, 606 and
663 nm (Figure 117). The results indicate that excitation spectra reproduce the absorption spectrum
very well. This could confirm that the optical phenomena observed belong to one-single molecule
properties. The more intense excitation spectrum for Bz(T1CAO)2 was recorded for em= 567 nm,
which is in good agreement with its emission spectrum.
Figure 117. Excitation spectra at different wavelengths in DCM: 567, 606 and 663 nm of Bz(T1CAO)2 (Conc:8.76x10⁻⁶ M).
Now, we have deeper knowledge of Bz(T1CAO)2 and Bz(T1CAEH)2 as single molecules in solution
and a better understanding of their electronic levels (Figure 112). Their exceptional reduction
abilities, their HOMO and LUMO frontier levels near to those of PCBM (Table 15) and how their
LUMO was spread over the electron-withdrawing moieties with a high conjugation indicating the
preference for electron conduction rather than holes may indicate that these molecules would be
potential acceptor candidates. As the electronic levels of Bz(T1CAO)2 and Bz(T1CAEH)2 match
those of P3HT for a possible photovoltaic effect, we considered them to be associated (Figure 118).
0
200000
400000
600000
800000
1000000
1200000
1400000
1600000
1800000
2000000
300 350 400 450 500 550 600
lambda em = 567 nm
lambda em = 606 nm
lambda em = 663 nm
Inte
nsi
ty
Wavelength (nm)
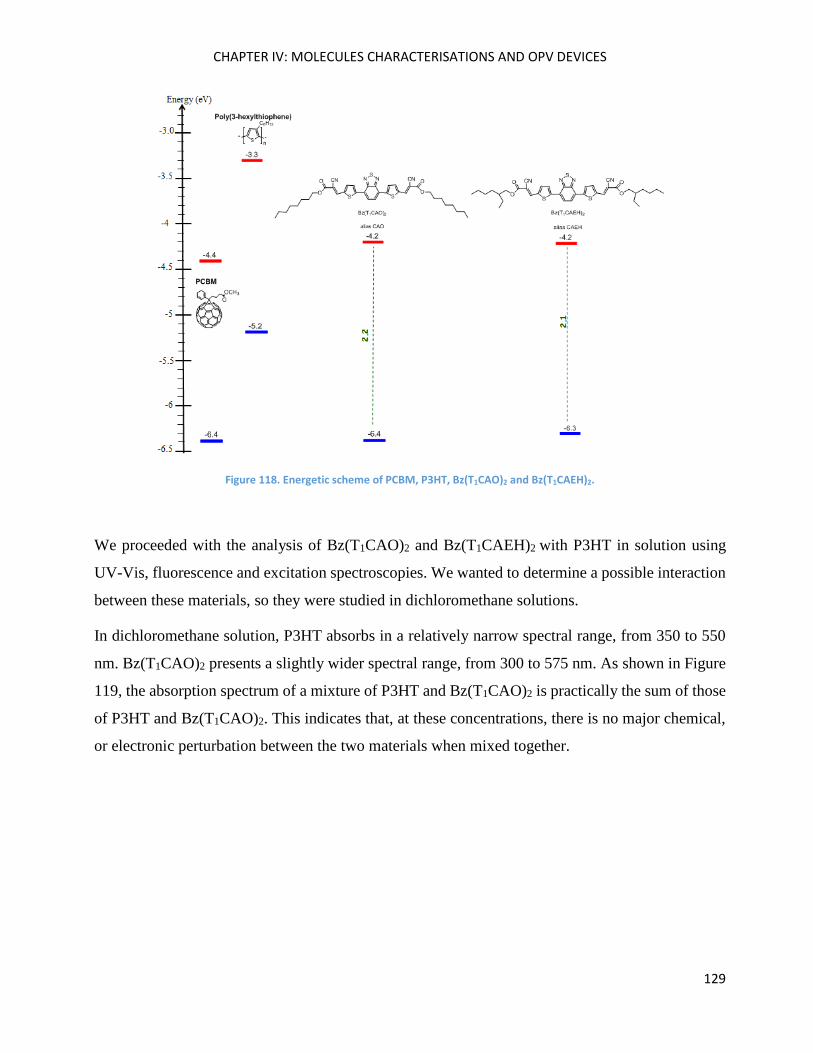
CHAPTER IV: MOLECULES CHARACTERISATIONS AND OPV DEVICES
129
Figure 118. Energetic scheme of PCBM, P3HT, Bz(T1CAO)2 and Bz(T1CAEH)2.
We proceeded with the analysis of Bz(T1CAO)2 and Bz(T1CAEH)2 with P3HT in solution using
UV-Vis, fluorescence and excitation spectroscopies. We wanted to determine a possible interaction
between these materials, so they were studied in dichloromethane solutions.
In dichloromethane solution, P3HT absorbs in a relatively narrow spectral range, from 350 to 550
nm. Bz(T1CAO)2 presents a slightly wider spectral range, from 300 to 575 nm. As shown in Figure
119, the absorption spectrum of a mixture of P3HT and Bz(T1CAO)2 is practically the sum of those
of P3HT and Bz(T1CAO)2. This indicates that, at these concentrations, there is no major chemical,
or electronic perturbation between the two materials when mixed together.
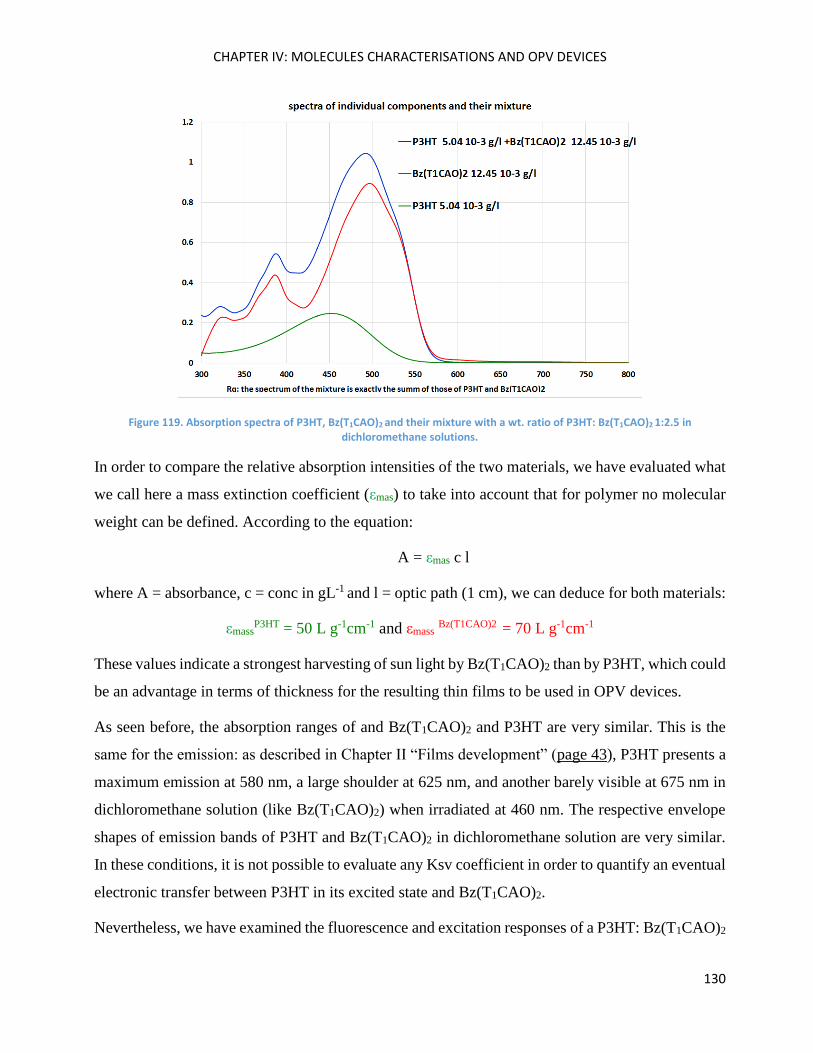
CHAPTER IV: MOLECULES CHARACTERISATIONS AND OPV DEVICES
130
Figure 119. Absorption spectra of P3HT, Bz(T1CAO)2 and their mixture with a wt. ratio of P3HT: Bz(T1CAO)2 1:2.5 in dichloromethane solutions.
In order to compare the relative absorption intensities of the two materials, we have evaluated what
we call here a mass extinction coefficient (εmas) to take into account that for polymer no molecular
weight can be defined. According to the equation:
A = εmas c l
where A = absorbance, c = conc in gL-1 and l = optic path (1 cm), we can deduce for both materials:
εmassP3HT = 50 L g-1cm-1 and εmass
Bz(T1CAO)2 = 70 L g-1cm-1
These values indicate a strongest harvesting of sun light by Bz(T1CAO)2 than by P3HT, which could
be an advantage in terms of thickness for the resulting thin films to be used in OPV devices.
As seen before, the absorption ranges of and Bz(T1CAO)2 and P3HT are very similar. This is the
same for the emission: as described in Chapter II “Films development” (page 43), P3HT presents a
maximum emission at 580 nm, a large shoulder at 625 nm, and another barely visible at 675 nm in
dichloromethane solution (like Bz(T1CAO)2) when irradiated at 460 nm. The respective envelope
shapes of emission bands of P3HT and Bz(T1CAO)2 in dichloromethane solution are very similar.
In these conditions, it is not possible to evaluate any Ksv coefficient in order to quantify an eventual
electronic transfer between P3HT in its excited state and Bz(T1CAO)2.
Nevertheless, we have examined the fluorescence and excitation responses of a P3HT: Bz(T1CAO)2
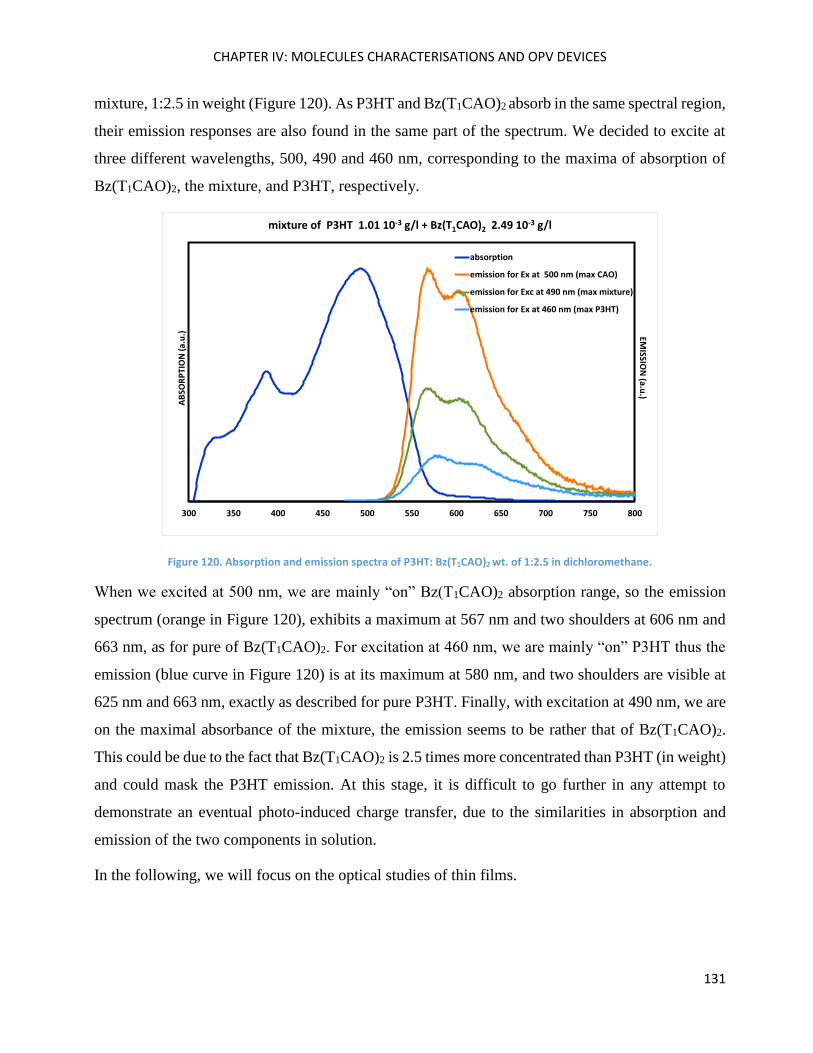
CHAPTER IV: MOLECULES CHARACTERISATIONS AND OPV DEVICES
131
mixture, 1:2.5 in weight (Figure 120). As P3HT and Bz(T1CAO)2 absorb in the same spectral region,
their emission responses are also found in the same part of the spectrum. We decided to excite at
three different wavelengths, 500, 490 and 460 nm, corresponding to the maxima of absorption of
Bz(T1CAO)2, the mixture, and P3HT, respectively.
Figure 120. Absorption and emission spectra of P3HT: Bz(T1CAO)2 wt. of 1:2.5 in dichloromethane.
When we excited at 500 nm, we are mainly “on” Bz(T1CAO)2 absorption range, so the emission
spectrum (orange in Figure 120), exhibits a maximum at 567 nm and two shoulders at 606 nm and
663 nm, as for pure of Bz(T1CAO)2. For excitation at 460 nm, we are mainly “on” P3HT thus the
emission (blue curve in Figure 120) is at its maximum at 580 nm, and two shoulders are visible at
625 nm and 663 nm, exactly as described for pure P3HT. Finally, with excitation at 490 nm, we are
on the maximal absorbance of the mixture, the emission seems to be rather that of Bz(T1CAO)2.
This could be due to the fact that Bz(T1CAO)2 is 2.5 times more concentrated than P3HT (in weight)
and could mask the P3HT emission. At this stage, it is difficult to go further in any attempt to
demonstrate an eventual photo-induced charge transfer, due to the similarities in absorption and
emission of the two components in solution.
In the following, we will focus on the optical studies of thin films.
300 350 400 450 500 550 600 650 700 750 800
mixture of P3HT 1.01 10-3 g/l + Bz(T1CAO)2 2.49 10-3 g/l
absorption
emission for Ex at 500 nm (max CAO)
emission for Exc at 490 nm (max mixture)
emission for Ex at 460 nm (max P3HT)
AB
SOR
PTI
ON
(a.u
.) EMISSIO
N(a.u
.)
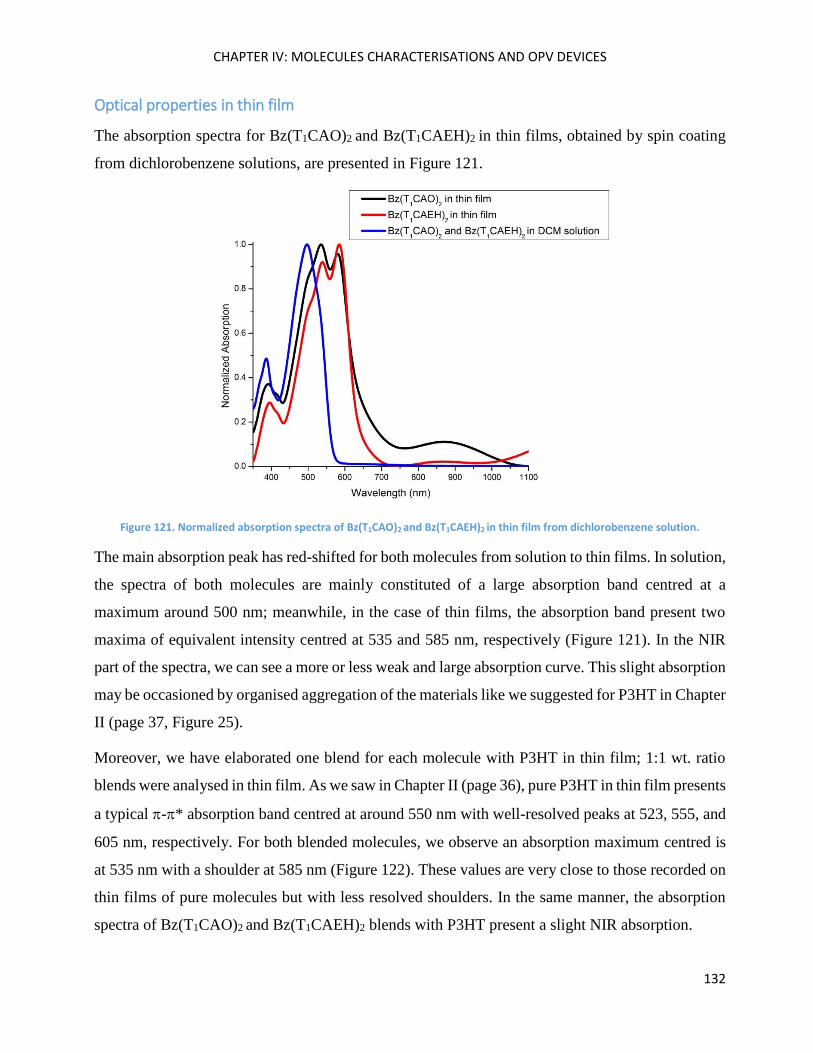
CHAPTER IV: MOLECULES CHARACTERISATIONS AND OPV DEVICES
132
Optical properties in thin film
The absorption spectra for Bz(T1CAO)2 and Bz(T1CAEH)2 in thin films, obtained by spin coating
from dichlorobenzene solutions, are presented in Figure 121.
Figure 121. Normalized absorption spectra of Bz(T1CAO)2 and Bz(T1CAEH)2 in thin film from dichlorobenzene solution.
The main absorption peak has red-shifted for both molecules from solution to thin films. In solution,
the spectra of both molecules are mainly constituted of a large absorption band centred at a
maximum around 500 nm; meanwhile, in the case of thin films, the absorption band present two
maxima of equivalent intensity centred at 535 and 585 nm, respectively (Figure 121). In the NIR
part of the spectra, we can see a more or less weak and large absorption curve. This slight absorption
may be occasioned by organised aggregation of the materials like we suggested for P3HT in Chapter
II (page 37, Figure 25).
Moreover, we have elaborated one blend for each molecule with P3HT in thin film; 1:1 wt. ratio
blends were analysed in thin film. As we saw in Chapter II (page 36), pure P3HT in thin film presents
a typical -* absorption band centred at around 550 nm with well-resolved peaks at 523, 555, and
605 nm, respectively. For both blended molecules, we observe an absorption maximum centred is
at 535 nm with a shoulder at 585 nm (Figure 122). These values are very close to those recorded on
thin films of pure molecules but with less resolved shoulders. In the same manner, the absorption
spectra of Bz(T1CAO)2 and Bz(T1CAEH)2 blends with P3HT present a slight NIR absorption.
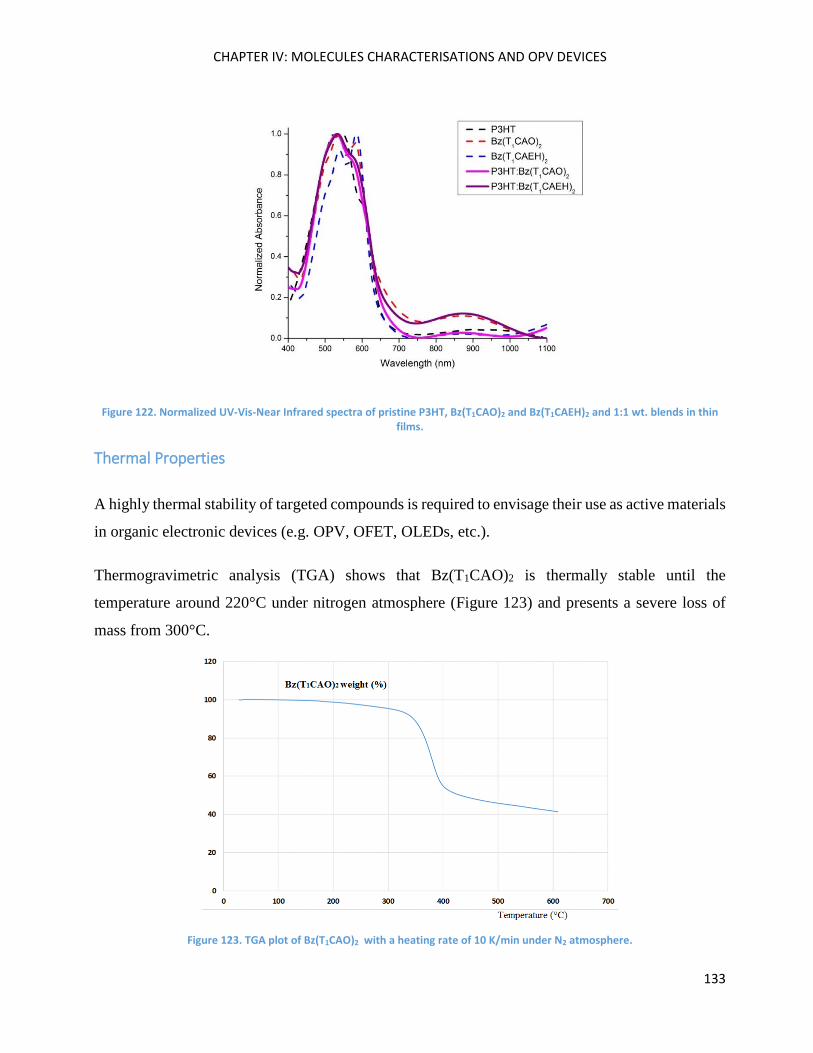
CHAPTER IV: MOLECULES CHARACTERISATIONS AND OPV DEVICES
133
Figure 122. Normalized UV-Vis-Near Infrared spectra of pristine P3HT, Bz(T1CAO)2 and Bz(T1CAEH)2 and 1:1 wt. blends in thin films.
Thermal Properties
A highly thermal stability of targeted compounds is required to envisage their use as active materials
in organic electronic devices (e.g. OPV, OFET, OLEDs, etc.).
Thermogravimetric analysis (TGA) shows that Bz(T1CAO)2 is thermally stable until the
temperature around 220°C under nitrogen atmosphere (Figure 123) and presents a severe loss of
mass from 300°C.
Figure 123. TGA plot of Bz(T1CAO)2 with a heating rate of 10 K/min under N2 atmosphere.
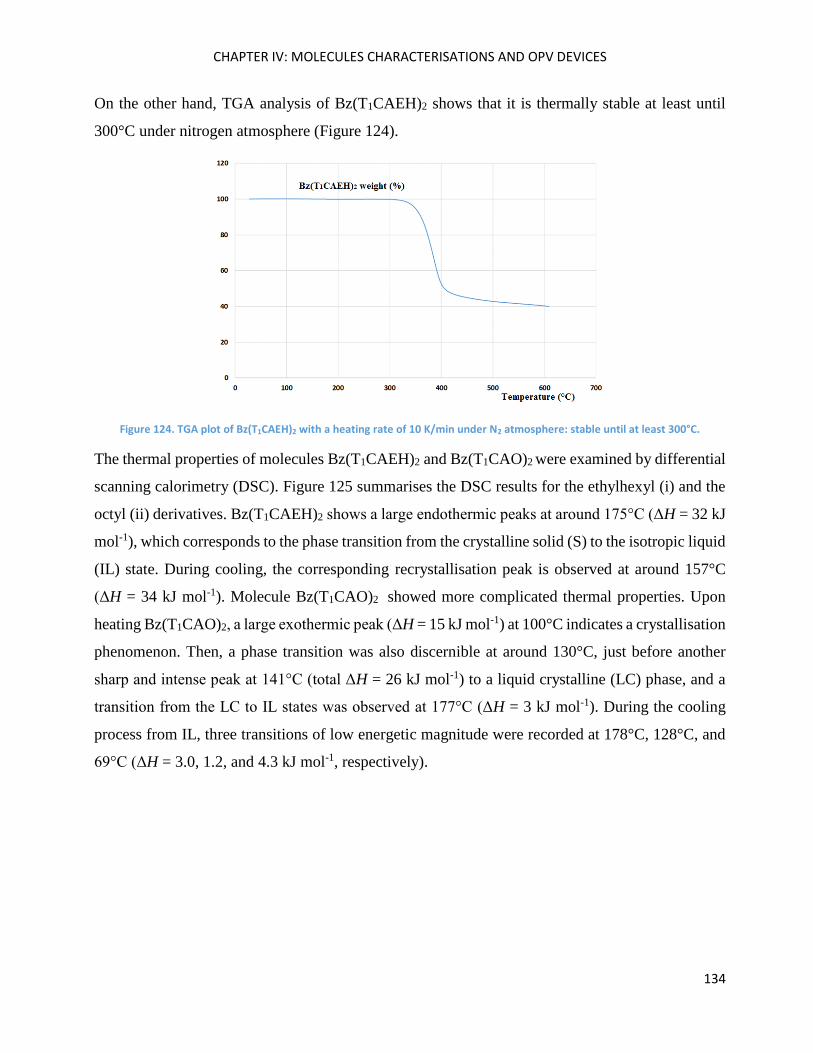
CHAPTER IV: MOLECULES CHARACTERISATIONS AND OPV DEVICES
134
On the other hand, TGA analysis of Bz(T1CAEH)2 shows that it is thermally stable at least until
300°C under nitrogen atmosphere (Figure 124).
Figure 124. TGA plot of Bz(T1CAEH)2 with a heating rate of 10 K/min under N2 atmosphere: stable until at least 300°C.
The thermal properties of molecules Bz(T1CAEH)2 and Bz(T1CAO)2 were examined by differential
scanning calorimetry (DSC). Figure 125 summarises the DSC results for the ethylhexyl (i) and the
octyl (ii) derivatives. Bz(T1CAEH)2 shows a large endothermic peaks at around 175°C (ΔH = 32 kJ
mol-1), which corresponds to the phase transition from the crystalline solid (S) to the isotropic liquid
(IL) state. During cooling, the corresponding recrystallisation peak is observed at around 157°C
(ΔH = 34 kJ mol-1). Molecule Bz(T1CAO)2 showed more complicated thermal properties. Upon
heating Bz(T1CAO)2, a large exothermic peak (ΔH = 15 kJ mol-1) at 100°C indicates a crystallisation
phenomenon. Then, a phase transition was also discernible at around 130°C, just before another
sharp and intense peak at 141°C (total ΔH = 26 kJ mol-1) to a liquid crystalline (LC) phase, and a
transition from the LC to IL states was observed at 177°C (ΔH = 3 kJ mol-1). During the cooling
process from IL, three transitions of low energetic magnitude were recorded at 178°C, 128°C, and
69°C (ΔH = 3.0, 1.2, and 4.3 kJ mol-1, respectively).
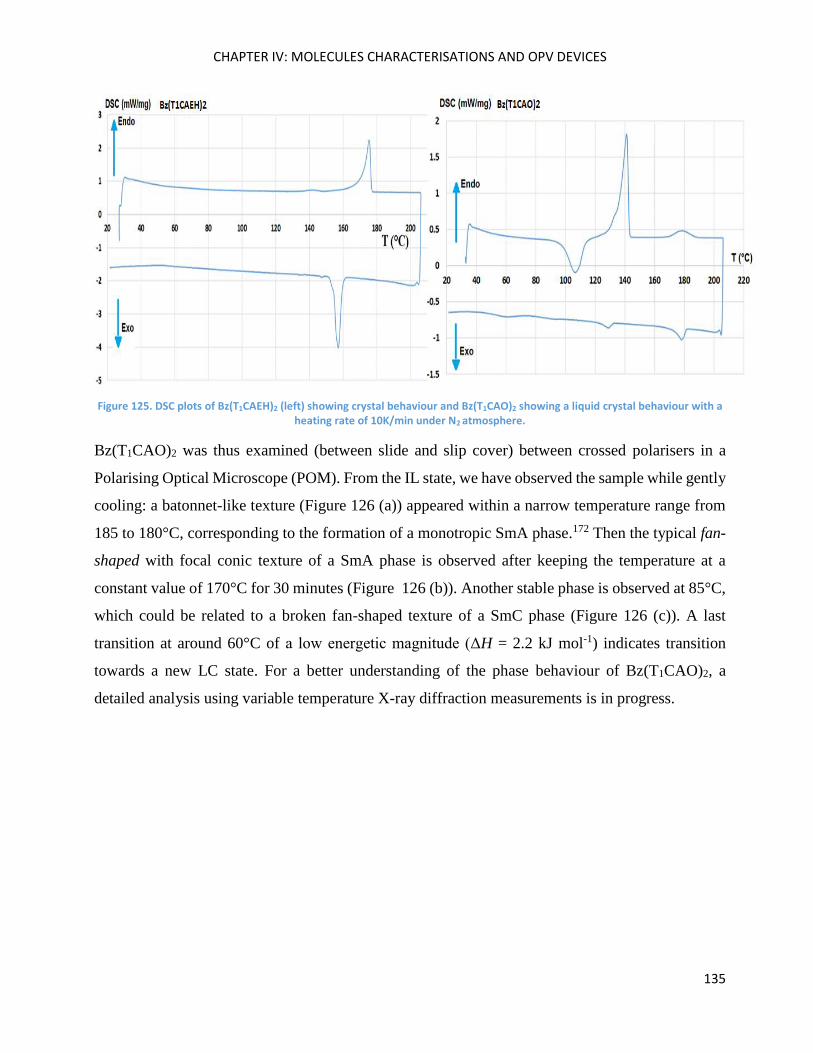
CHAPTER IV: MOLECULES CHARACTERISATIONS AND OPV DEVICES
135
Figure 125. DSC plots of Bz(T1CAEH)2 (left) showing crystal behaviour and Bz(T1CAO)2 showing a liquid crystal behaviour with a heating rate of 10K/min under N2 atmosphere.
Bz(T1CAO)2 was thus examined (between slide and slip cover) between crossed polarisers in a
Polarising Optical Microscope (POM). From the IL state, we have observed the sample while gently
cooling: a batonnet-like texture (Figure 126 (a)) appeared within a narrow temperature range from
185 to 180°C, corresponding to the formation of a monotropic SmA phase.172 Then the typical fan-
shaped with focal conic texture of a SmA phase is observed after keeping the temperature at a
constant value of 170°C for 30 minutes (Figure 126 (b)). Another stable phase is observed at 85°C,
which could be related to a broken fan-shaped texture of a SmC phase (Figure 126 (c)). A last
transition at around 60°C of a low energetic magnitude (ΔH = 2.2 kJ mol-1) indicates transition
towards a new LC state. For a better understanding of the phase behaviour of Bz(T1CAO)2, a
detailed analysis using variable temperature X-ray diffraction measurements is in progress.
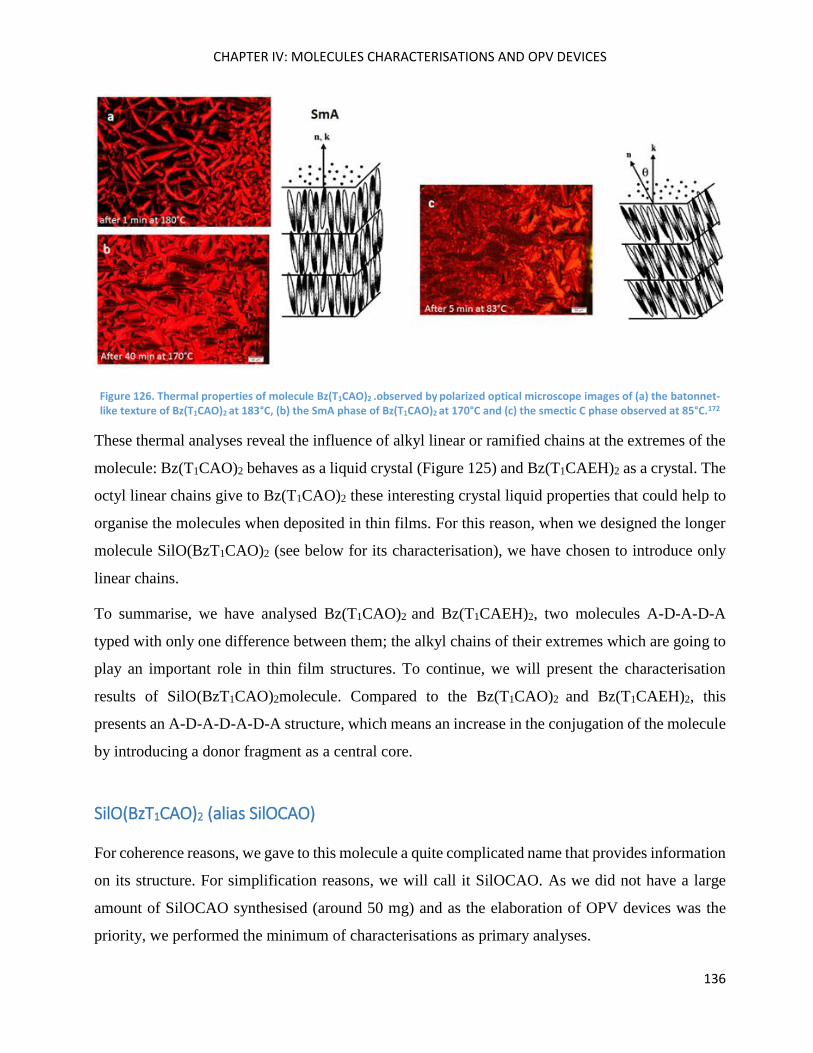
CHAPTER IV: MOLECULES CHARACTERISATIONS AND OPV DEVICES
136
Figure 126. Thermal properties of molecule Bz(T1CAO)2 .observed by polarized optical microscope images of (a) the batonnet-like texture of Bz(T1CAO)2 at 183°C, (b) the SmA phase of Bz(T1CAO)2 at 170°C and (c) the smectic C phase observed at 85°C.172
These thermal analyses reveal the influence of alkyl linear or ramified chains at the extremes of the
molecule: Bz(T1CAO)2 behaves as a liquid crystal (Figure 125) and Bz(T1CAEH)2 as a crystal. The
octyl linear chains give to Bz(T1CAO)2 these interesting crystal liquid properties that could help to
organise the molecules when deposited in thin films. For this reason, when we designed the longer
molecule SilO(BzT1CAO)2 (see below for its characterisation), we have chosen to introduce only
linear chains.
To summarise, we have analysed Bz(T1CAO)2 and Bz(T1CAEH)2, two molecules A-D-A-D-A
typed with only one difference between them; the alkyl chains of their extremes which are going to
play an important role in thin film structures. To continue, we will present the characterisation
results of SilO(BzT1CAO)2molecule. Compared to the Bz(T1CAO)2 and Bz(T1CAEH)2, this
presents an A-D-A-D-A-D-A structure, which means an increase in the conjugation of the molecule
by introducing a donor fragment as a central core.
SilO(BzT1CAO)2 (alias SilOCAO)
For coherence reasons, we gave to this molecule a quite complicated name that provides information
on its structure. For simplification reasons, we will call it SilOCAO. As we did not have a large
amount of SilOCAO synthesised (around 50 mg) and as the elaboration of OPV devices was the
priority, we performed the minimum of characterisations as primary analyses.
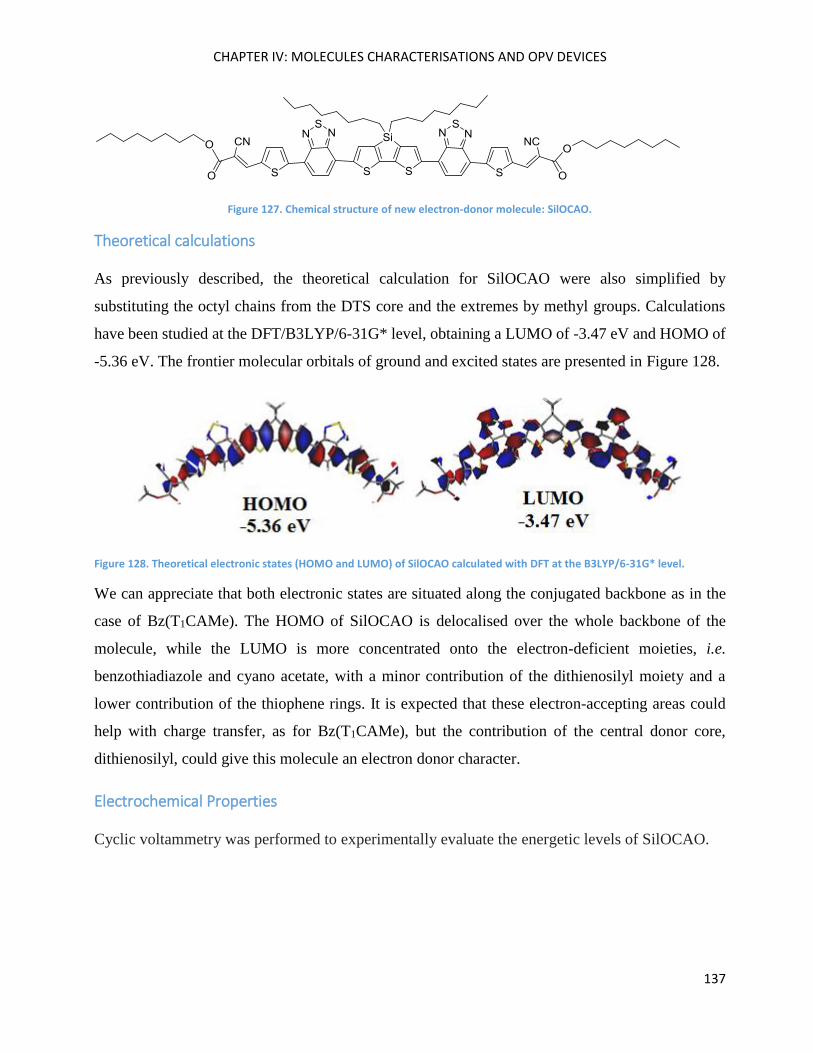
CHAPTER IV: MOLECULES CHARACTERISATIONS AND OPV DEVICES
137
Figure 127. Chemical structure of new electron-donor molecule: SilOCAO.
Theoretical calculations
As previously described, the theoretical calculation for SilOCAO were also simplified by
substituting the octyl chains from the DTS core and the extremes by methyl groups. Calculations
have been studied at the DFT/B3LYP/6-31G* level, obtaining a LUMO of -3.47 eV and HOMO of
-5.36 eV. The frontier molecular orbitals of ground and excited states are presented in Figure 128.
Figure 128. Theoretical electronic states (HOMO and LUMO) of SilOCAO calculated with DFT at the B3LYP/6-31G* level.
We can appreciate that both electronic states are situated along the conjugated backbone as in the
case of Bz(T1CAMe). The HOMO of SilOCAO is delocalised over the whole backbone of the
molecule, while the LUMO is more concentrated onto the electron-deficient moieties, i.e.
benzothiadiazole and cyano acetate, with a minor contribution of the dithienosilyl moiety and a
lower contribution of the thiophene rings. It is expected that these electron-accepting areas could
help with charge transfer, as for Bz(T1CAMe), but the contribution of the central donor core,
dithienosilyl, could give this molecule an electron donor character.
Electrochemical Properties
Cyclic voltammetry was performed to experimentally evaluate the energetic levels of SilOCAO.
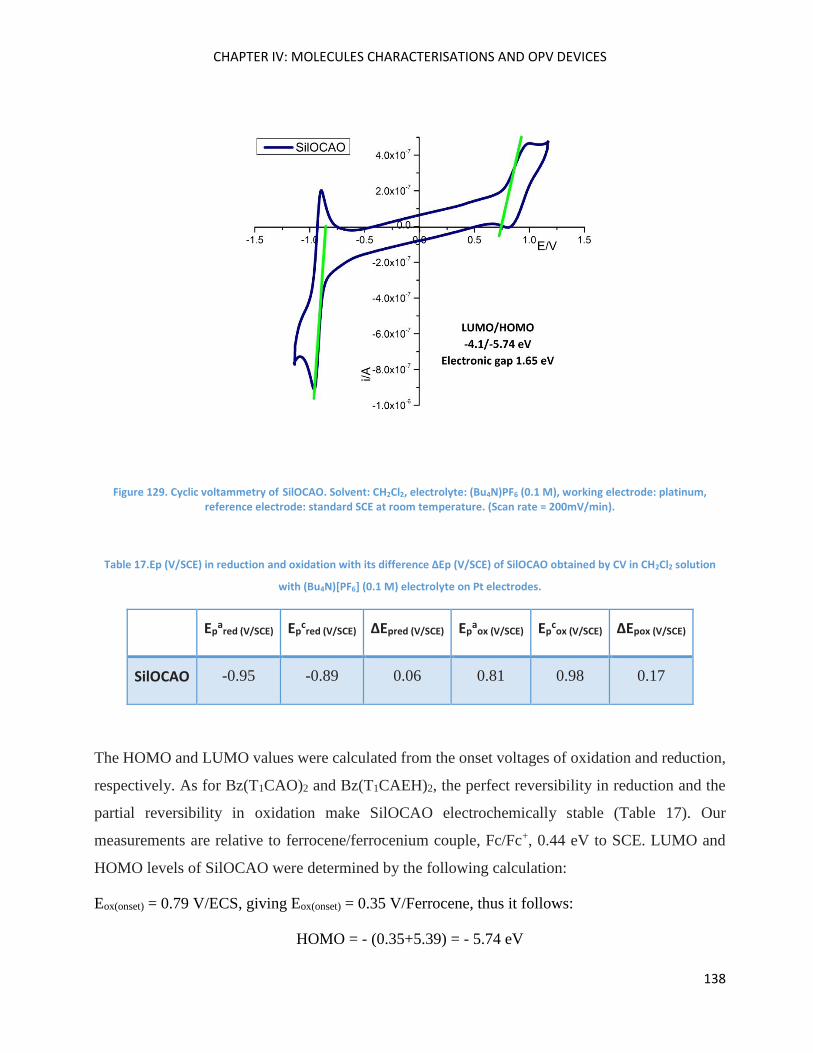
CHAPTER IV: MOLECULES CHARACTERISATIONS AND OPV DEVICES
138
Figure 129. Cyclic voltammetry of SilOCAO. Solvent: CH2Cl2, electrolyte: (Bu4N)PF6 (0.1 M), working electrode: platinum, reference electrode: standard SCE at room temperature. (Scan rate = 200mV/min).
Table 17.Ep (V/SCE) in reduction and oxidation with its difference ΔEp (V/SCE) of SilOCAO obtained by CV in CH2Cl2 solution
with (Bu4N)[PF6] (0.1 M) electrolyte on Pt electrodes.
Epa
red (V/SCE) Epcred (V/SCE) ΔEpred (V/SCE) Ep
aox (V/SCE) Ep
cox (V/SCE) ΔEpox (V/SCE)
SilOCAO -0.95 -0.89 0.06 0.81 0.98 0.17
The HOMO and LUMO values were calculated from the onset voltages of oxidation and reduction,
respectively. As for Bz(T1CAO)2 and Bz(T1CAEH)2, the perfect reversibility in reduction and the
partial reversibility in oxidation make SilOCAO electrochemically stable (Table 17). Our
measurements are relative to ferrocene/ferrocenium couple, Fc/Fc+, 0.44 eV to SCE. LUMO and
HOMO levels of SilOCAO were determined by the following calculation:
Eox(onset) = 0.79 V/ECS, giving Eox(onset) = 0.35 V/Ferrocene, thus it follows:
HOMO = - (0.35+5.39) = - 5.74 eV
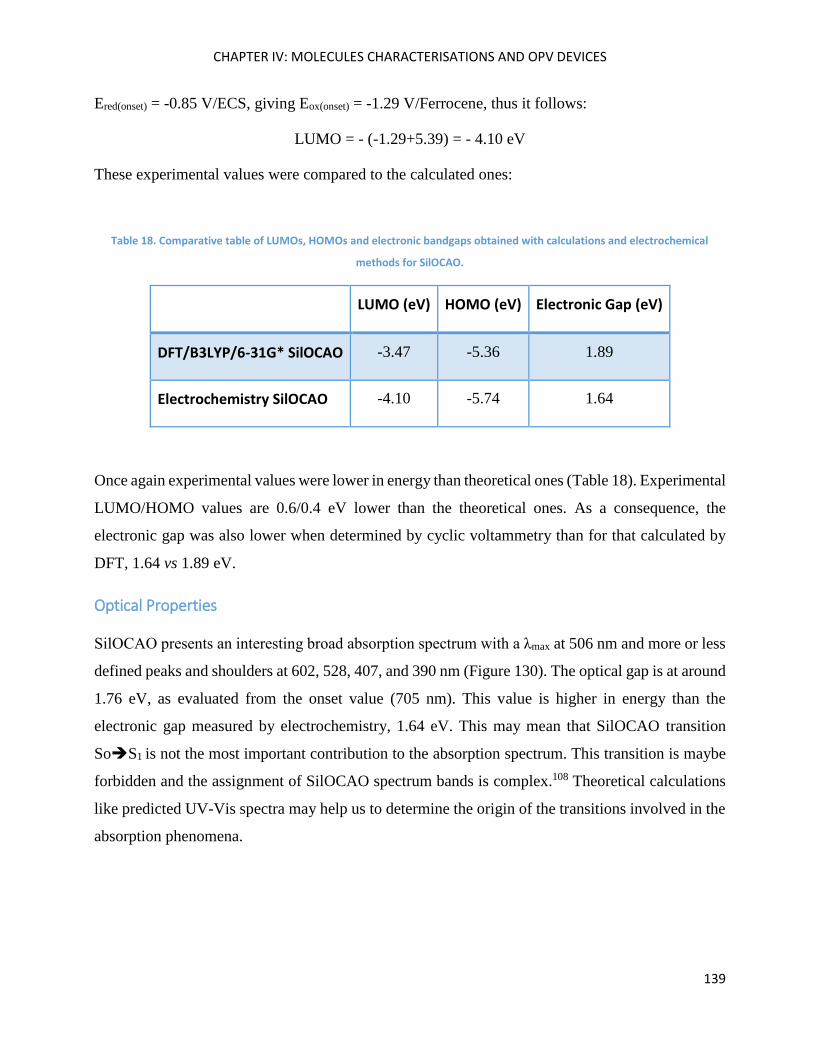
CHAPTER IV: MOLECULES CHARACTERISATIONS AND OPV DEVICES
139
Ered(onset) = -0.85 V/ECS, giving Eox(onset) = -1.29 V/Ferrocene, thus it follows:
LUMO = - (-1.29+5.39) = - 4.10 eV
These experimental values were compared to the calculated ones:
Table 18. Comparative table of LUMOs, HOMOs and electronic bandgaps obtained with calculations and electrochemical
methods for SilOCAO.
LUMO (eV) HOMO (eV) Electronic Gap (eV)
DFT/B3LYP/6-31G* SilOCAO -3.47 -5.36 1.89
Electrochemistry SilOCAO -4.10 -5.74 1.64
Once again experimental values were lower in energy than theoretical ones (Table 18). Experimental
LUMO/HOMO values are 0.6/0.4 eV lower than the theoretical ones. As a consequence, the
electronic gap was also lower when determined by cyclic voltammetry than for that calculated by
DFT, 1.64 vs 1.89 eV.
Optical Properties
SilOCAO presents an interesting broad absorption spectrum with a λmax at 506 nm and more or less
defined peaks and shoulders at 602, 528, 407, and 390 nm (Figure 130). The optical gap is at around
1.76 eV, as evaluated from the onset value (705 nm). This value is higher in energy than the
electronic gap measured by electrochemistry, 1.64 eV. This may mean that SilOCAO transition
SoS1 is not the most important contribution to the absorption spectrum. This transition is maybe
forbidden and the assignment of SilOCAO spectrum bands is complex.108 Theoretical calculations
like predicted UV-Vis spectra may help us to determine the origin of the transitions involved in the
absorption phenomena.
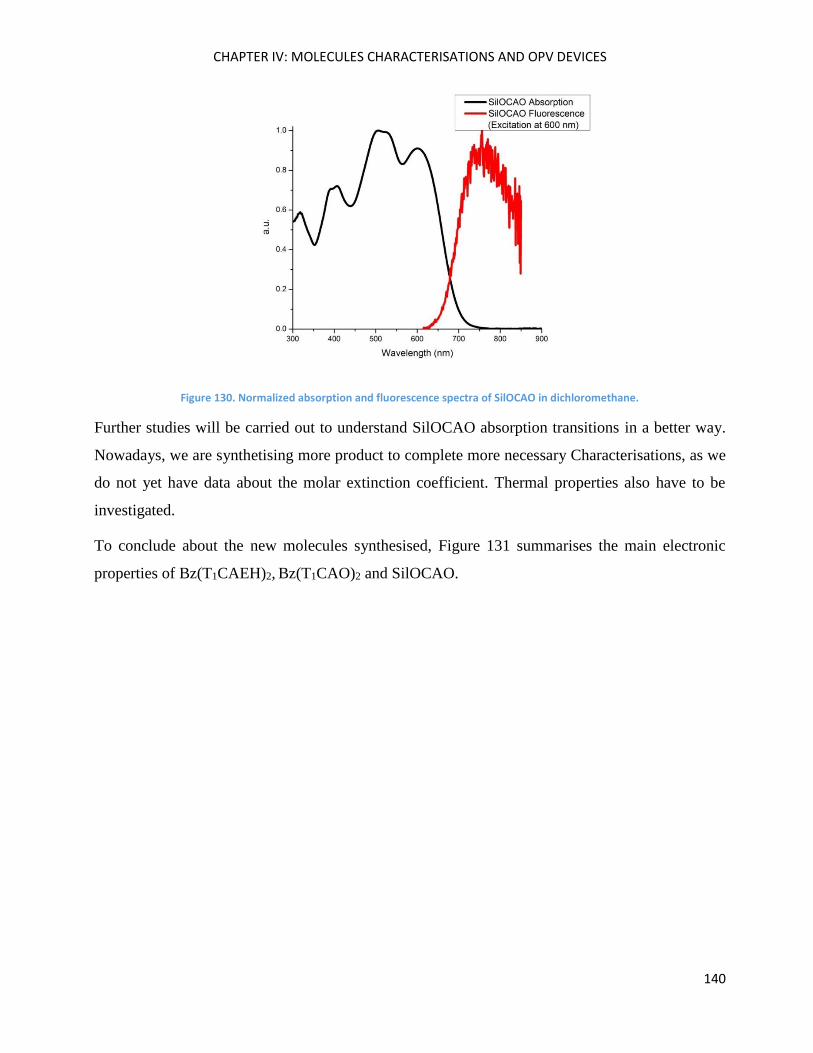
CHAPTER IV: MOLECULES CHARACTERISATIONS AND OPV DEVICES
140
Figure 130. Normalized absorption and fluorescence spectra of SilOCAO in dichloromethane.
Further studies will be carried out to understand SilOCAO absorption transitions in a better way.
Nowadays, we are synthetising more product to complete more necessary Characterisations, as we
do not yet have data about the molar extinction coefficient. Thermal properties also have to be
investigated.
To conclude about the new molecules synthesised, Figure 131 summarises the main electronic
properties of Bz(T1CAEH)2, Bz(T1CAO)2 and SilOCAO.
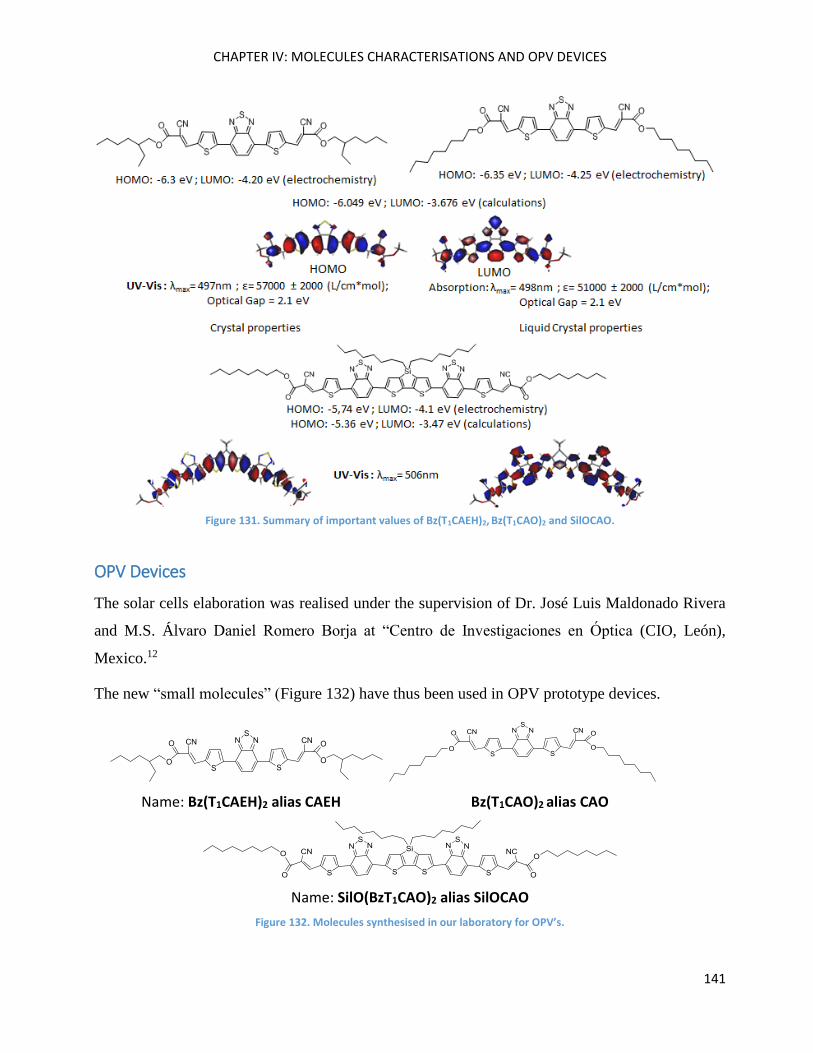
CHAPTER IV: MOLECULES CHARACTERISATIONS AND OPV DEVICES
141
Figure 131. Summary of important values of Bz(T1CAEH)2, Bz(T1CAO)2 and SilOCAO.
OPV Devices
The solar cells elaboration was realised under the supervision of Dr. José Luis Maldonado Rivera
and M.S. Álvaro Daniel Romero Borja at “Centro de Investigaciones en Óptica (CIO, León),
Mexico.12
The new “small molecules” (Figure 132) have thus been used in OPV prototype devices.
Name: Bz(T1CAEH)2 alias CAEH Bz(T1CAO)2 alias CAO
Name: SilO(BzT1CAO)2 alias SilOCAO
Figure 132. Molecules synthesised in our laboratory for OPV’s.
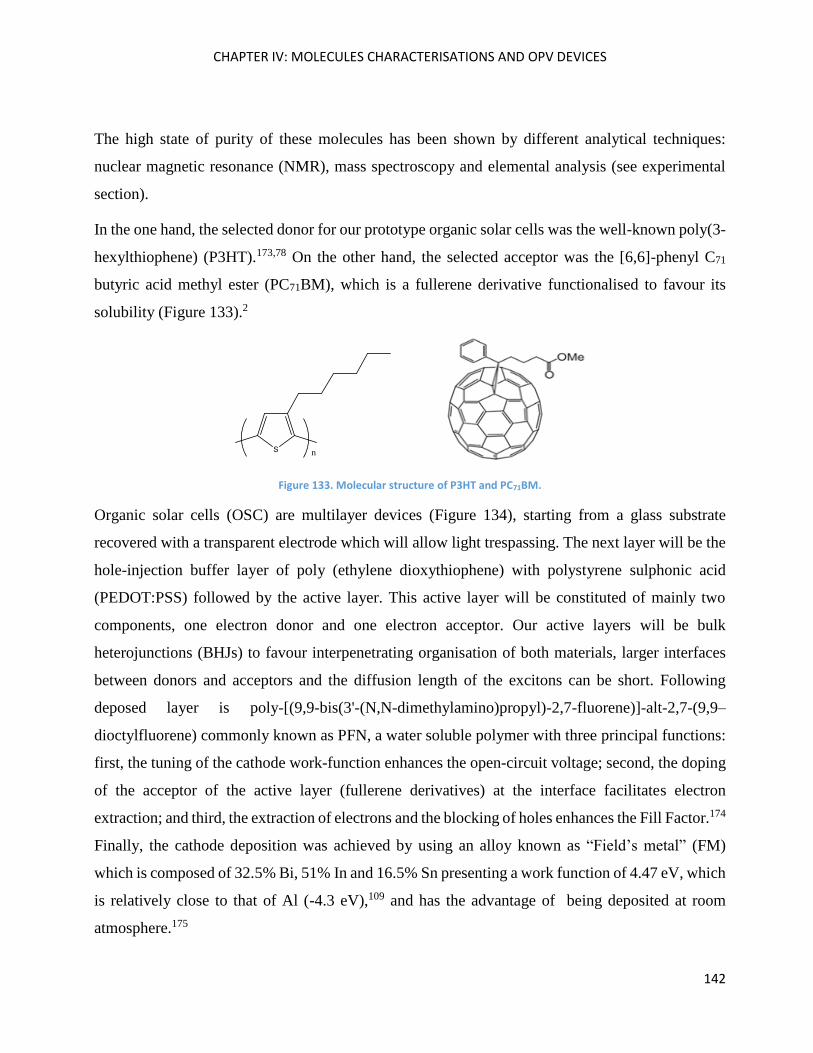
CHAPTER IV: MOLECULES CHARACTERISATIONS AND OPV DEVICES
142
The high state of purity of these molecules has been shown by different analytical techniques:
nuclear magnetic resonance (NMR), mass spectroscopy and elemental analysis (see experimental
section).
In the one hand, the selected donor for our prototype organic solar cells was the well-known poly(3-
hexylthiophene) (P3HT).173,78 On the other hand, the selected acceptor was the [6,6]-phenyl C71
butyric acid methyl ester (PC71BM), which is a fullerene derivative functionalised to favour its
solubility (Figure 133).2
Figure 133. Molecular structure of P3HT and PC71BM.
Organic solar cells (OSC) are multilayer devices (Figure 134), starting from a glass substrate
recovered with a transparent electrode which will allow light trespassing. The next layer will be the
hole-injection buffer layer of poly (ethylene dioxythiophene) with polystyrene sulphonic acid
(PEDOT:PSS) followed by the active layer. This active layer will be constituted of mainly two
components, one electron donor and one electron acceptor. Our active layers will be bulk
heterojunctions (BHJs) to favour interpenetrating organisation of both materials, larger interfaces
between donors and acceptors and the diffusion length of the excitons can be short. Following
deposed layer is poly-[(9,9-bis(3'-(N,N-dimethylamino)propyl)-2,7-fluorene)]-alt-2,7-(9,9–
dioctylfluorene) commonly known as PFN, a water soluble polymer with three principal functions:
first, the tuning of the cathode work-function enhances the open-circuit voltage; second, the doping
of the acceptor of the active layer (fullerene derivatives) at the interface facilitates electron
extraction; and third, the extraction of electrons and the blocking of holes enhances the Fill Factor.174
Finally, the cathode deposition was achieved by using an alloy known as “Field’s metal” (FM)
which is composed of 32.5% Bi, 51% In and 16.5% Sn presenting a work function of 4.47 eV, which
is relatively close to that of Al (-4.3 eV),109 and has the advantage of being deposited at room
atmosphere.175
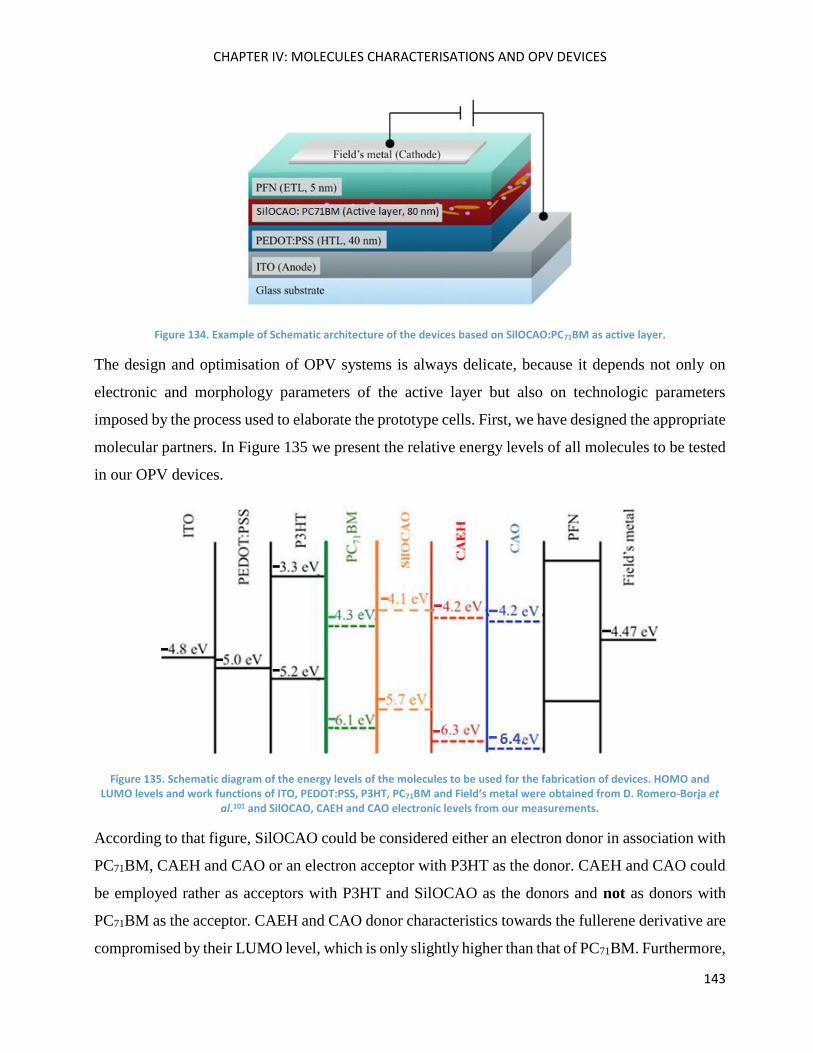
CHAPTER IV: MOLECULES CHARACTERISATIONS AND OPV DEVICES
143
Figure 134. Example of Schematic architecture of the devices based on SilOCAO:PC71BM as active layer.
The design and optimisation of OPV systems is always delicate, because it depends not only on
electronic and morphology parameters of the active layer but also on technologic parameters
imposed by the process used to elaborate the prototype cells. First, we have designed the appropriate
molecular partners. In Figure 135 we present the relative energy levels of all molecules to be tested
in our OPV devices.
Figure 135. Schematic diagram of the energy levels of the molecules to be used for the fabrication of devices. HOMO and LUMO levels and work functions of ITO, PEDOT:PSS, P3HT, PC71BM and Field’s metal were obtained from D. Romero-Borja et
al.101 and SilOCAO, CAEH and CAO electronic levels from our measurements.
According to that figure, SilOCAO could be considered either an electron donor in association with
PC71BM, CAEH and CAO or an electron acceptor with P3HT as the donor. CAEH and CAO could
be employed rather as acceptors with P3HT and SilOCAO as the donors and not as donors with
PC71BM as the acceptor. CAEH and CAO donor characteristics towards the fullerene derivative are
compromised by their LUMO level, which is only slightly higher than that of PC71BM. Furthermore,
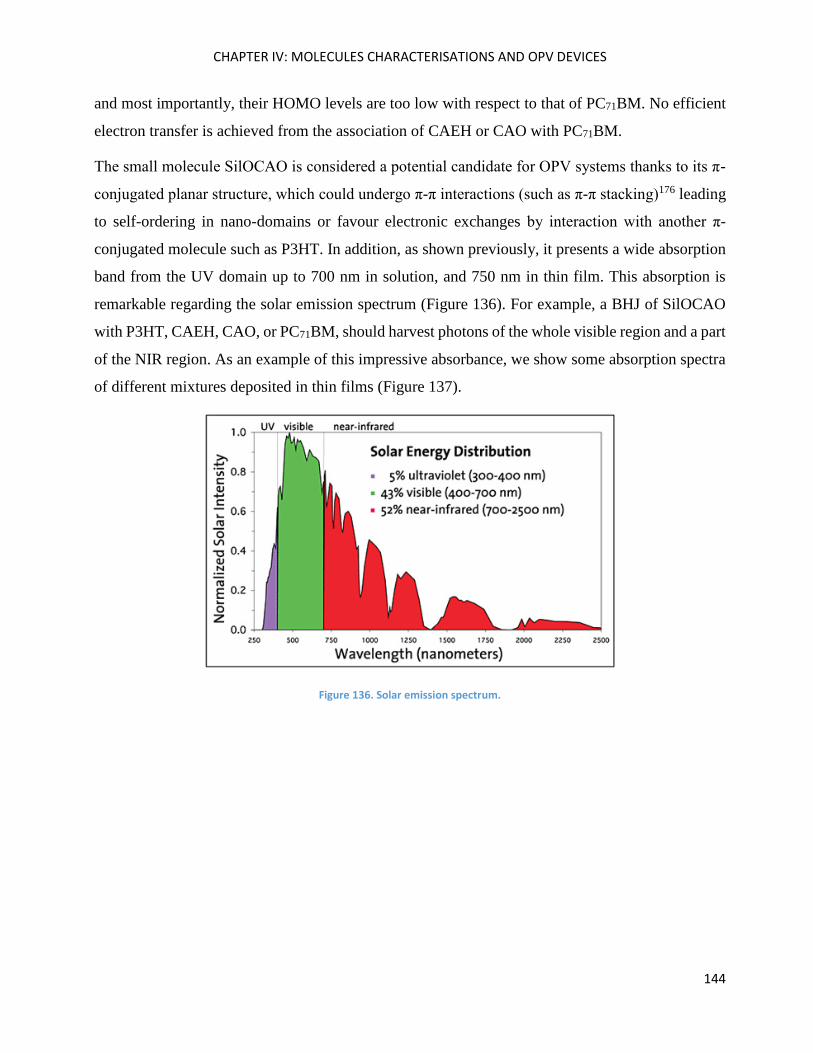
CHAPTER IV: MOLECULES CHARACTERISATIONS AND OPV DEVICES
144
and most importantly, their HOMO levels are too low with respect to that of PC71BM. No efficient
electron transfer is achieved from the association of CAEH or CAO with PC71BM.
The small molecule SilOCAO is considered a potential candidate for OPV systems thanks to its π-
conjugated planar structure, which could undergo π-π interactions (such as π-π stacking)176 leading
to self-ordering in nano-domains or favour electronic exchanges by interaction with another π-
conjugated molecule such as P3HT. In addition, as shown previously, it presents a wide absorption
band from the UV domain up to 700 nm in solution, and 750 nm in thin film. This absorption is
remarkable regarding the solar emission spectrum (Figure 136). For example, a BHJ of SilOCAO
with P3HT, CAEH, CAO, or PC71BM, should harvest photons of the whole visible region and a part
of the NIR region. As an example of this impressive absorbance, we show some absorption spectra
of different mixtures deposited in thin films (Figure 137).
Figure 136. Solar emission spectrum.
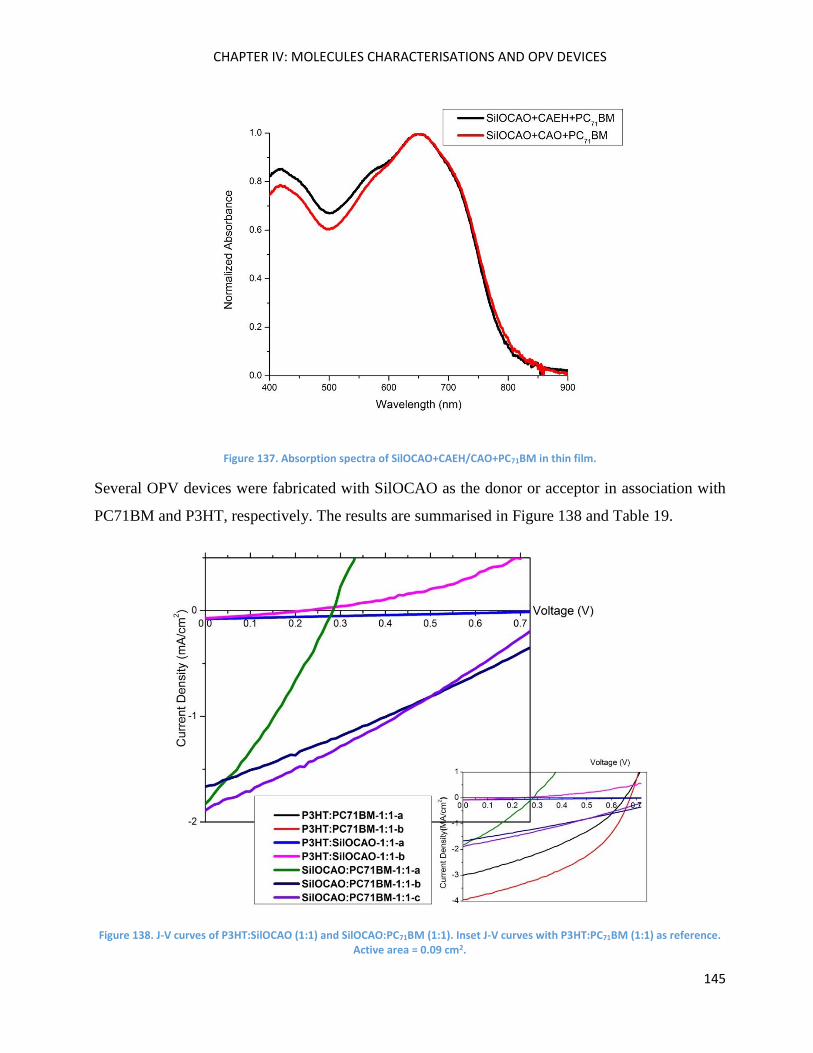
CHAPTER IV: MOLECULES CHARACTERISATIONS AND OPV DEVICES
145
Figure 137. Absorption spectra of SilOCAO+CAEH/CAO+PC71BM in thin film.
Several OPV devices were fabricated with SilOCAO as the donor or acceptor in association with
PC71BM and P3HT, respectively. The results are summarised in Figure 138 and Table 19.
Figure 138. J-V curves of P3HT:SilOCAO (1:1) and SilOCAO:PC71BM (1:1). Inset J-V curves with P3HT:PC71BM (1:1) as reference. Active area = 0.09 cm2.
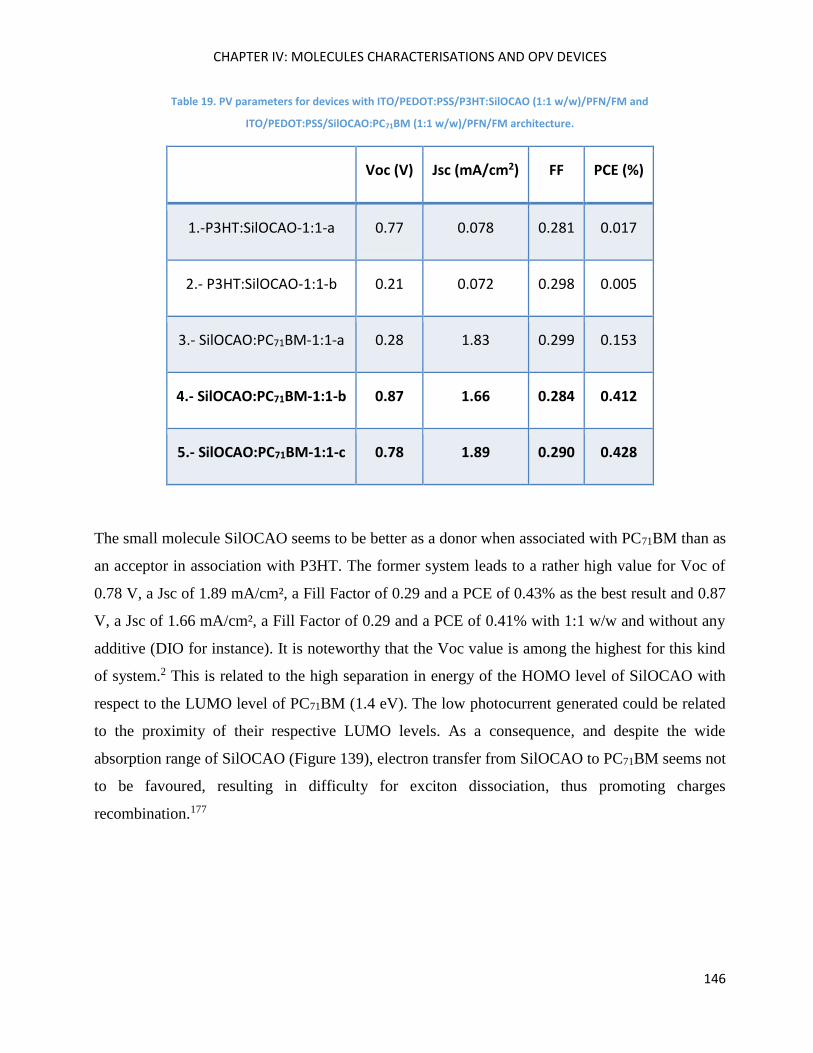
CHAPTER IV: MOLECULES CHARACTERISATIONS AND OPV DEVICES
146
Table 19. PV parameters for devices with ITO/PEDOT:PSS/P3HT:SilOCAO (1:1 w/w)/PFN/FM and
ITO/PEDOT:PSS/SilOCAO:PC71BM (1:1 w/w)/PFN/FM architecture.
Voc (V) Jsc (mA/cm2) FF PCE (%)
1.-P3HT:SilOCAO-1:1-a 0.77 0.078 0.281 0.017
2.- P3HT:SilOCAO-1:1-b 0.21 0.072 0.298 0.005
3.- SilOCAO:PC71BM-1:1-a 0.28 1.83 0.299 0.153
4.- SilOCAO:PC71BM-1:1-b 0.87 1.66 0.284 0.412
5.- SilOCAO:PC71BM-1:1-c 0.78 1.89 0.290 0.428
The small molecule SilOCAO seems to be better as a donor when associated with PC71BM than as
an acceptor in association with P3HT. The former system leads to a rather high value for Voc of
0.78 V, a Jsc of 1.89 mA/cm², a Fill Factor of 0.29 and a PCE of 0.43% as the best result and 0.87
V, a Jsc of 1.66 mA/cm², a Fill Factor of 0.29 and a PCE of 0.41% with 1:1 w/w and without any
additive (DIO for instance). It is noteworthy that the Voc value is among the highest for this kind
of system.2 This is related to the high separation in energy of the HOMO level of SilOCAO with
respect to the LUMO level of PC71BM (1.4 eV). The low photocurrent generated could be related
to the proximity of their respective LUMO levels. As a consequence, and despite the wide
absorption range of SilOCAO (Figure 139), electron transfer from SilOCAO to PC71BM seems not
to be favoured, resulting in difficulty for exciton dissociation, thus promoting charges
recombination.177
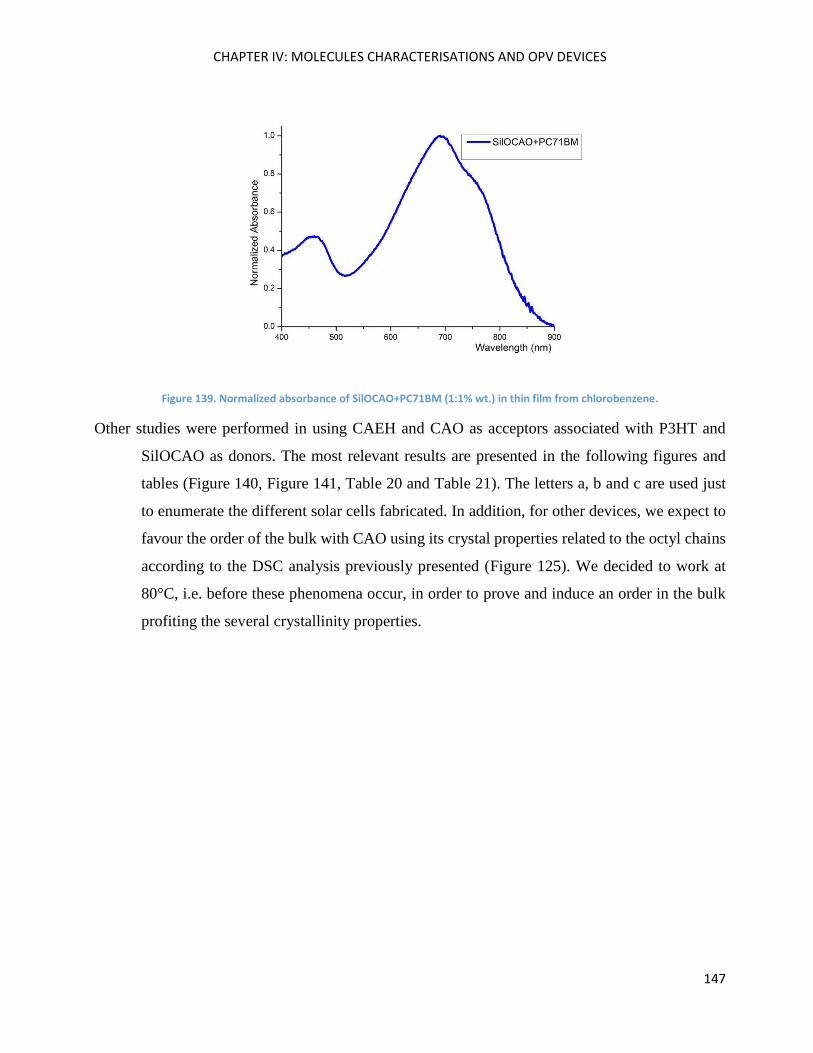
CHAPTER IV: MOLECULES CHARACTERISATIONS AND OPV DEVICES
147
Figure 139. Normalized absorbance of SilOCAO+PC71BM (1:1% wt.) in thin film from chlorobenzene.
Other studies were performed in using CAEH and CAO as acceptors associated with P3HT and
SilOCAO as donors. The most relevant results are presented in the following figures and
tables (Figure 140, Figure 141, Table 20 and Table 21). The letters a, b and c are used just
to enumerate the different solar cells fabricated. In addition, for other devices, we expect to
favour the order of the bulk with CAO using its crystal properties related to the octyl chains
according to the DSC analysis previously presented (Figure 125). We decided to work at
80°C, i.e. before these phenomena occur, in order to prove and induce an order in the bulk
profiting the several crystallinity properties.
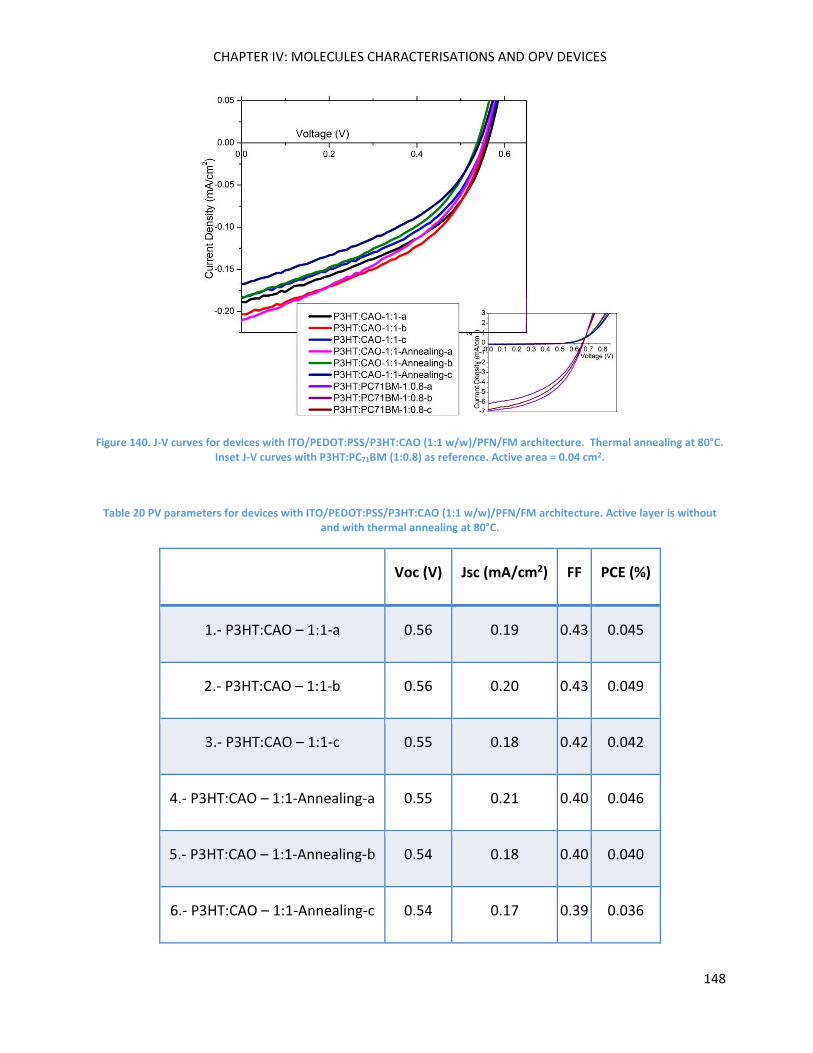
CHAPTER IV: MOLECULES CHARACTERISATIONS AND OPV DEVICES
148
Figure 140. J-V curves for devices with ITO/PEDOT:PSS/P3HT:CAO (1:1 w/w)/PFN/FM architecture. Thermal annealing at 80°C. Inset J-V curves with P3HT:PC71BM (1:0.8) as reference. Active area = 0.04 cm2.
Table 20 PV parameters for devices with ITO/PEDOT:PSS/P3HT:CAO (1:1 w/w)/PFN/FM architecture. Active layer is without and with thermal annealing at 80°C.
Voc (V) Jsc (mA/cm2) FF PCE (%)
1.- P3HT:CAO – 1:1-a 0.56 0.19 0.43 0.045
2.- P3HT:CAO – 1:1-b 0.56 0.20 0.43 0.049
3.- P3HT:CAO – 1:1-c 0.55 0.18 0.42 0.042
4.- P3HT:CAO – 1:1-Annealing-a 0.55 0.21 0.40 0.046
5.- P3HT:CAO – 1:1-Annealing-b 0.54 0.18 0.40 0.040
6.- P3HT:CAO – 1:1-Annealing-c 0.54 0.17 0.39 0.036
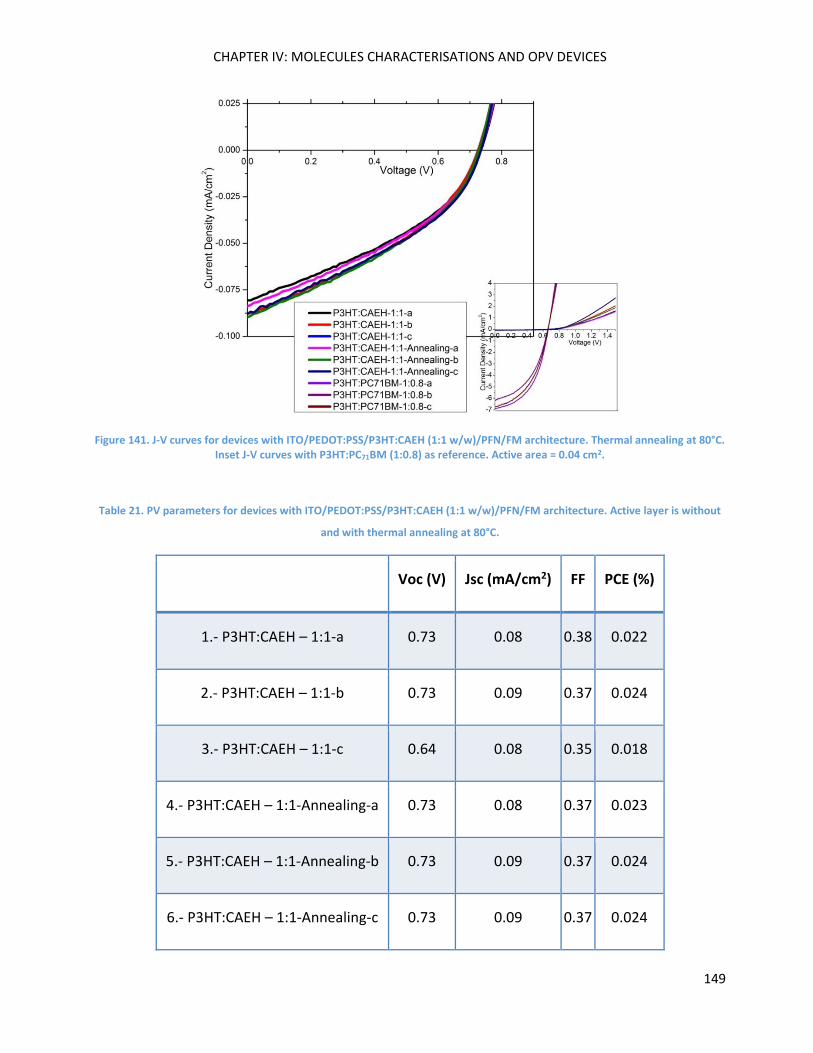
CHAPTER IV: MOLECULES CHARACTERISATIONS AND OPV DEVICES
149
Figure 141. J-V curves for devices with ITO/PEDOT:PSS/P3HT:CAEH (1:1 w/w)/PFN/FM architecture. Thermal annealing at 80°C. Inset J-V curves with P3HT:PC71BM (1:0.8) as reference. Active area = 0.04 cm2.
Table 21. PV parameters for devices with ITO/PEDOT:PSS/P3HT:CAEH (1:1 w/w)/PFN/FM architecture. Active layer is without
and with thermal annealing at 80°C.
Voc (V) Jsc (mA/cm2) FF PCE (%)
1.- P3HT:CAEH – 1:1-a 0.73 0.08 0.38 0.022
2.- P3HT:CAEH – 1:1-b 0.73 0.09 0.37 0.024
3.- P3HT:CAEH – 1:1-c 0.64 0.08 0.35 0.018
4.- P3HT:CAEH – 1:1-Annealing-a 0.73 0.08 0.37 0.023
5.- P3HT:CAEH – 1:1-Annealing-b 0.73 0.09 0.37 0.024
6.- P3HT:CAEH – 1:1-Annealing-c 0.73 0.09 0.37 0.024
CHAPTER IV: MOLECULES CHARACTERISATIONS AND OPV DEVICES
150
From the results obtained for devices based on CAO or CAEH with P3HT, we notice that we have
obtained also pretty high values of Voc, situated approximatively between 0.5 and 0.7 V. This means
that P3HT HOMO matches well with respect to LUMO acceptors, leading to a maximum difference
of approximatively 1 eV. In contrast, a very low current is again measured. In that case, we suggest
that this is due to a lack of acceptor strength from CAEH and CAO with respect to P3HT; the
generated charges are not efficiently dissociated so that recombination process takes place177 despite
a correct LUMO level offset between the donor and the acceptor. This could be due to the non-
optimised ratio of the two active components. Indeed, a relationship between the composition
dependence of photocurrent generation and microstructure has been demonstrated, controlled by the
phase behaviour of the two active components. Thus, the establishment of phase diagrams has been
proposed as a guiding criterion for bulk-heterojunction materials design.178 Phase diagrams of
systems based on P3HT blended with CAO and CAEH could be helpful for a better understanding
of our polymer-small molecular binary systems and a rationale design of optimal composition and
thermal treatment. In our conditions of blending, we observed that thermal annealing does not result
in any improvement. No value was in common with the thermal annealing treatment. This could
indicate that the chosen temperature was not optimised and that we should try different annealing
conditions in light of elaboration of the phase diagrams, for example.
Another example is the device built with SilOCAO and CAO, as the donor and acceptor,
respectively. The decision to use CAO first rather than CAEH as the acceptor partner was driven by
the same linearity and length of their respective alkyl chains, a particularity that could help in to
promoting order inside the bulk.179 The advantage of using CAO (or CAEH) as the acceptor rather
than PC71BM is that it presents a nice complementary absorption spectrum to that of SilOCAO
(Figure 142), with the BHJ covering a large part of the solar spectrum (Figure 136).
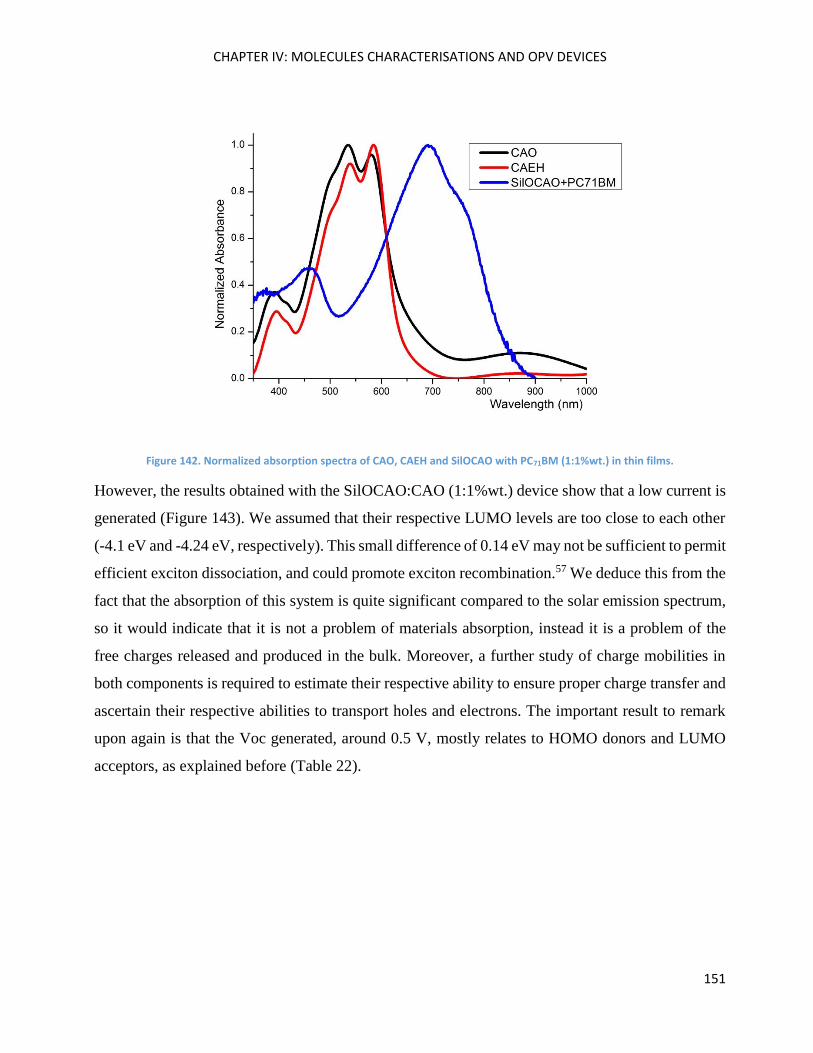
CHAPTER IV: MOLECULES CHARACTERISATIONS AND OPV DEVICES
151
Figure 142. Normalized absorption spectra of CAO, CAEH and SilOCAO with PC71BM (1:1%wt.) in thin films.
However, the results obtained with the SilOCAO:CAO (1:1%wt.) device show that a low current is
generated (Figure 143). We assumed that their respective LUMO levels are too close to each other
(-4.1 eV and -4.24 eV, respectively). This small difference of 0.14 eV may not be sufficient to permit
efficient exciton dissociation, and could promote exciton recombination.57 We deduce this from the
fact that the absorption of this system is quite significant compared to the solar emission spectrum,
so it would indicate that it is not a problem of materials absorption, instead it is a problem of the
free charges released and produced in the bulk. Moreover, a further study of charge mobilities in
both components is required to estimate their respective ability to ensure proper charge transfer and
ascertain their respective abilities to transport holes and electrons. The important result to remark
upon again is that the Voc generated, around 0.5 V, mostly relates to HOMO donors and LUMO
acceptors, as explained before (Table 22).
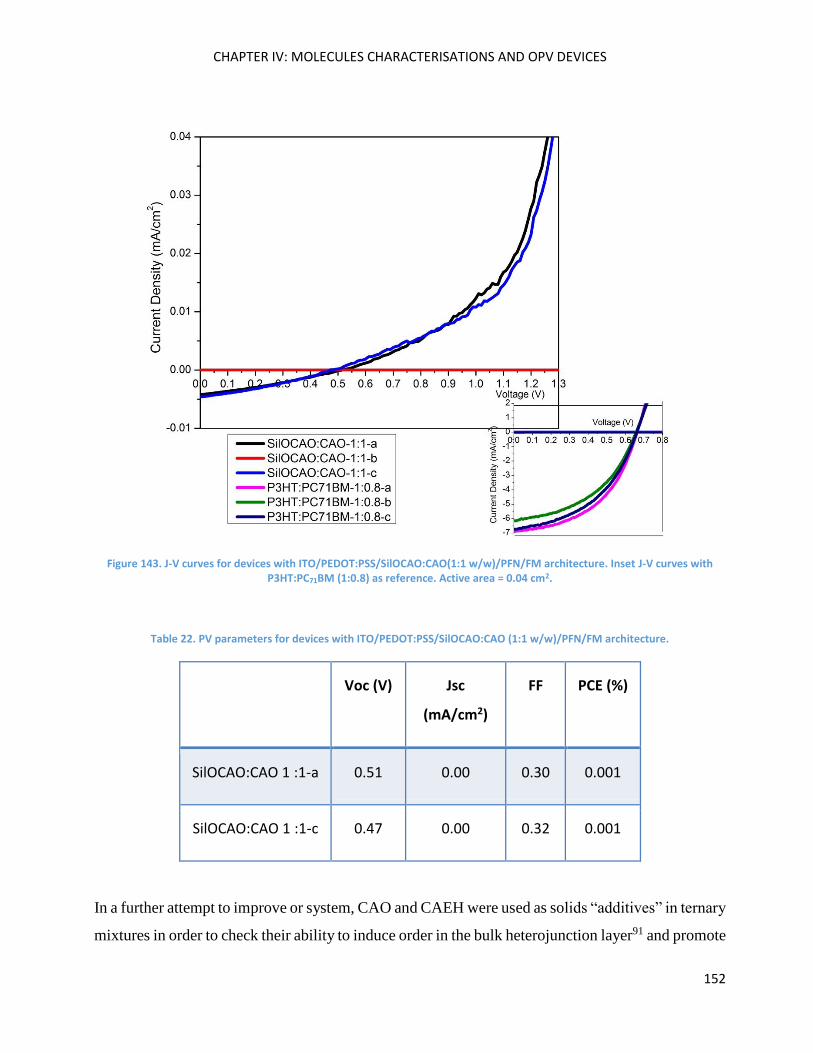
CHAPTER IV: MOLECULES CHARACTERISATIONS AND OPV DEVICES
152
Figure 143. J-V curves for devices with ITO/PEDOT:PSS/SilOCAO:CAO(1:1 w/w)/PFN/FM architecture. Inset J-V curves with P3HT:PC71BM (1:0.8) as reference. Active area = 0.04 cm2.
Table 22. PV parameters for devices with ITO/PEDOT:PSS/SilOCAO:CAO (1:1 w/w)/PFN/FM architecture.
Voc (V) Jsc
(mA/cm2)
FF PCE (%)
SilOCAO:CAO 1 :1-a 0.51 0.00 0.30 0.001
SilOCAO:CAO 1 :1-c 0.47 0.00 0.32 0.001
In a further attempt to improve or system, CAO and CAEH were used as solids “additives” in ternary
mixtures in order to check their ability to induce order in the bulk heterojunction layer91 and promote
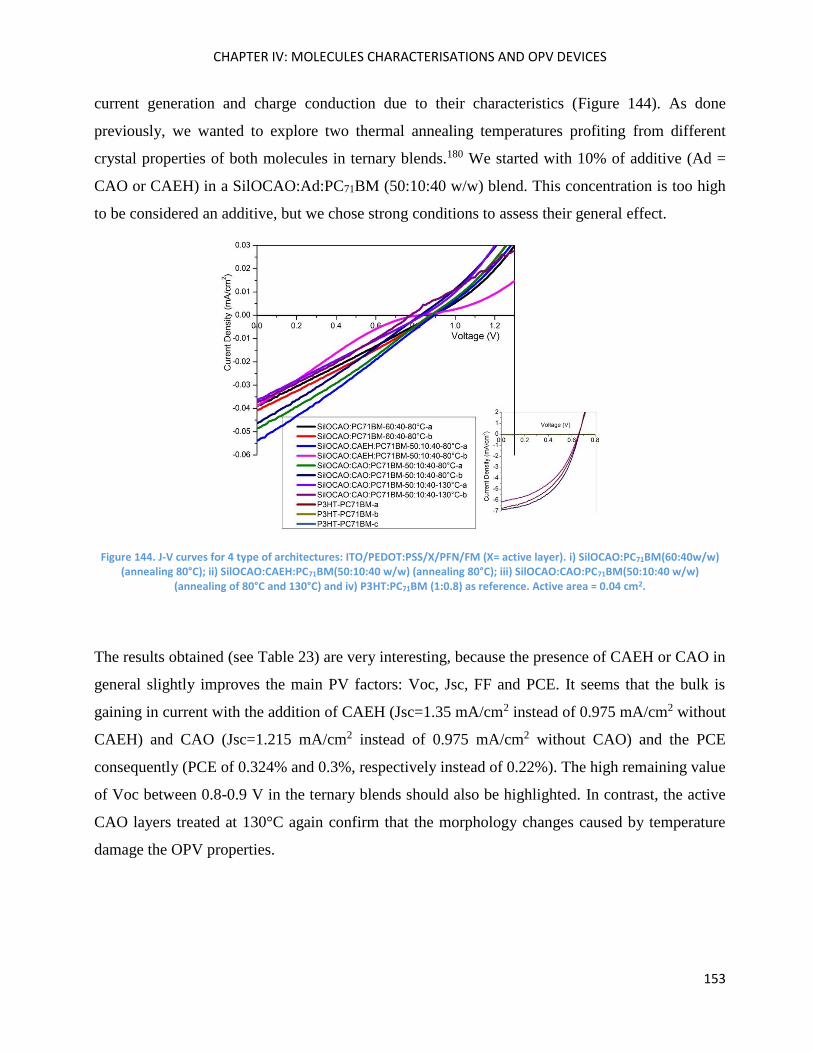
CHAPTER IV: MOLECULES CHARACTERISATIONS AND OPV DEVICES
153
current generation and charge conduction due to their characteristics (Figure 144). As done
previously, we wanted to explore two thermal annealing temperatures profiting from different
crystal properties of both molecules in ternary blends.180 We started with 10% of additive (Ad =
CAO or CAEH) in a SilOCAO:Ad:PC71BM (50:10:40 w/w) blend. This concentration is too high
to be considered an additive, but we chose strong conditions to assess their general effect.
Figure 144. J-V curves for 4 type of architectures: ITO/PEDOT:PSS/X/PFN/FM (X= active layer). i) SilOCAO:PC71BM(60:40w/w) (annealing 80°C); ii) SilOCAO:CAEH:PC71BM(50:10:40 w/w) (annealing 80°C); iii) SilOCAO:CAO:PC71BM(50:10:40 w/w)
(annealing of 80°C and 130°C) and iv) P3HT:PC71BM (1:0.8) as reference. Active area = 0.04 cm2.
The results obtained (see Table 23) are very interesting, because the presence of CAEH or CAO in
general slightly improves the main PV factors: Voc, Jsc, FF and PCE. It seems that the bulk is
gaining in current with the addition of CAEH (Jsc=1.35 mA/cm2 instead of 0.975 mA/cm2 without
CAEH) and CAO (Jsc=1.215 mA/cm2 instead of 0.975 mA/cm2 without CAO) and the PCE
consequently (PCE of 0.324% and 0.3%, respectively instead of 0.22%). The high remaining value
of Voc between 0.8-0.9 V in the ternary blends should also be highlighted. In contrast, the active
CAO layers treated at 130°C again confirm that the morphology changes caused by temperature
damage the OPV properties.
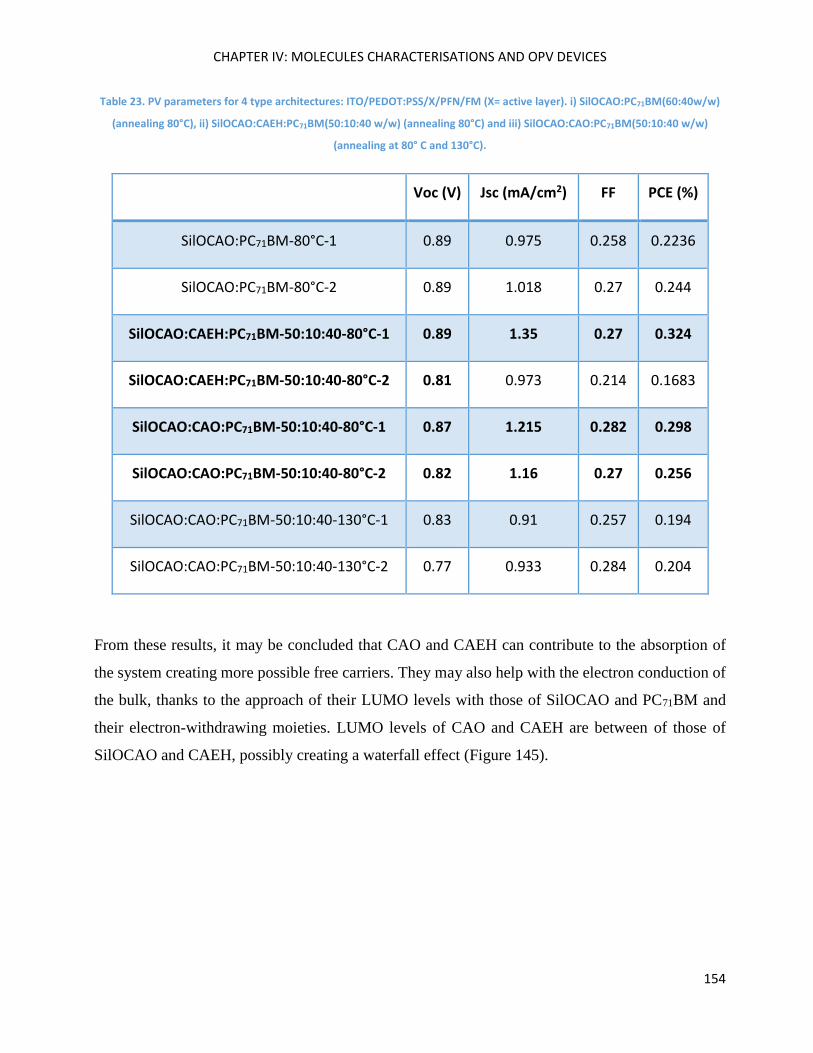
CHAPTER IV: MOLECULES CHARACTERISATIONS AND OPV DEVICES
154
Table 23. PV parameters for 4 type architectures: ITO/PEDOT:PSS/X/PFN/FM (X= active layer). i) SilOCAO:PC71BM(60:40w/w)
(annealing 80°C), ii) SilOCAO:CAEH:PC71BM(50:10:40 w/w) (annealing 80°C) and iii) SilOCAO:CAO:PC71BM(50:10:40 w/w)
(annealing at 80° C and 130°C).
Voc (V) Jsc (mA/cm2) FF PCE (%)
SilOCAO:PC71BM-80°C-1 0.89 0.975 0.258 0.2236
SilOCAO:PC71BM-80°C-2 0.89 1.018 0.27 0.244
SilOCAO:CAEH:PC71BM-50:10:40-80°C-1 0.89 1.35 0.27 0.324
SilOCAO:CAEH:PC71BM-50:10:40-80°C-2 0.81 0.973 0.214 0.1683
SilOCAO:CAO:PC71BM-50:10:40-80°C-1 0.87 1.215 0.282 0.298
SilOCAO:CAO:PC71BM-50:10:40-80°C-2 0.82 1.16 0.27 0.256
SilOCAO:CAO:PC71BM-50:10:40-130°C-1 0.83 0.91 0.257 0.194
SilOCAO:CAO:PC71BM-50:10:40-130°C-2 0.77 0.933 0.284 0.204
From these results, it may be concluded that CAO and CAEH can contribute to the absorption of
the system creating more possible free carriers. They may also help with the electron conduction of
the bulk, thanks to the approach of their LUMO levels with those of SilOCAO and PC71BM and
their electron-withdrawing moieties. LUMO levels of CAO and CAEH are between of those of
SilOCAO and CAEH, possibly creating a waterfall effect (Figure 145).
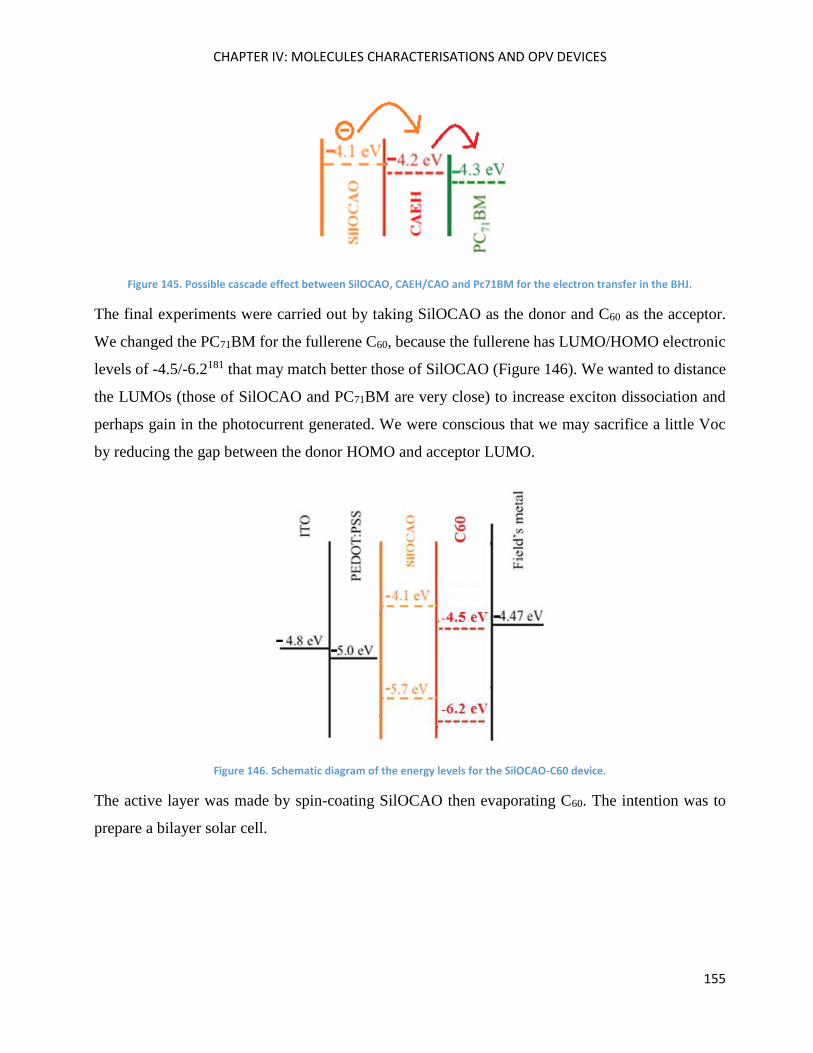
CHAPTER IV: MOLECULES CHARACTERISATIONS AND OPV DEVICES
155
Figure 145. Possible cascade effect between SilOCAO, CAEH/CAO and Pc71BM for the electron transfer in the BHJ.
The final experiments were carried out by taking SilOCAO as the donor and C60 as the acceptor.
We changed the PC71BM for the fullerene C60, because the fullerene has LUMO/HOMO electronic
levels of -4.5/-6.2181 that may match better those of SilOCAO (Figure 146). We wanted to distance
the LUMOs (those of SilOCAO and PC71BM are very close) to increase exciton dissociation and
perhaps gain in the photocurrent generated. We were conscious that we may sacrifice a little Voc
by reducing the gap between the donor HOMO and acceptor LUMO.
Figure 146. Schematic diagram of the energy levels for the SilOCAO-C60 device.
The active layer was made by spin-coating SilOCAO then evaporating C60. The intention was to
prepare a bilayer solar cell.
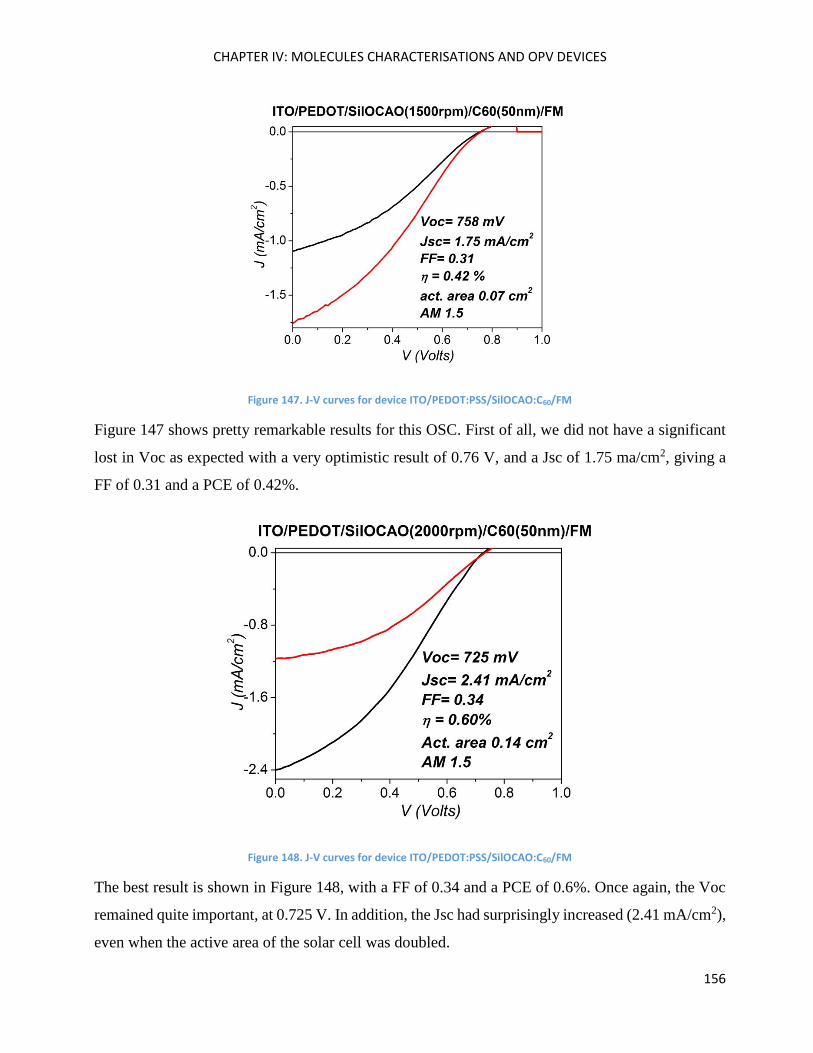
CHAPTER IV: MOLECULES CHARACTERISATIONS AND OPV DEVICES
156
Figure 147. J-V curves for device ITO/PEDOT:PSS/SilOCAO:C60/FM
Figure 147 shows pretty remarkable results for this OSC. First of all, we did not have a significant
lost in Voc as expected with a very optimistic result of 0.76 V, and a Jsc of 1.75 ma/cm2, giving a
FF of 0.31 and a PCE of 0.42%.
Figure 148. J-V curves for device ITO/PEDOT:PSS/SilOCAO:C60/FM
The best result is shown in Figure 148, with a FF of 0.34 and a PCE of 0.6%. Once again, the Voc
remained quite important, at 0.725 V. In addition, the Jsc had surprisingly increased (2.41 mA/cm2),
even when the active area of the solar cell was doubled.
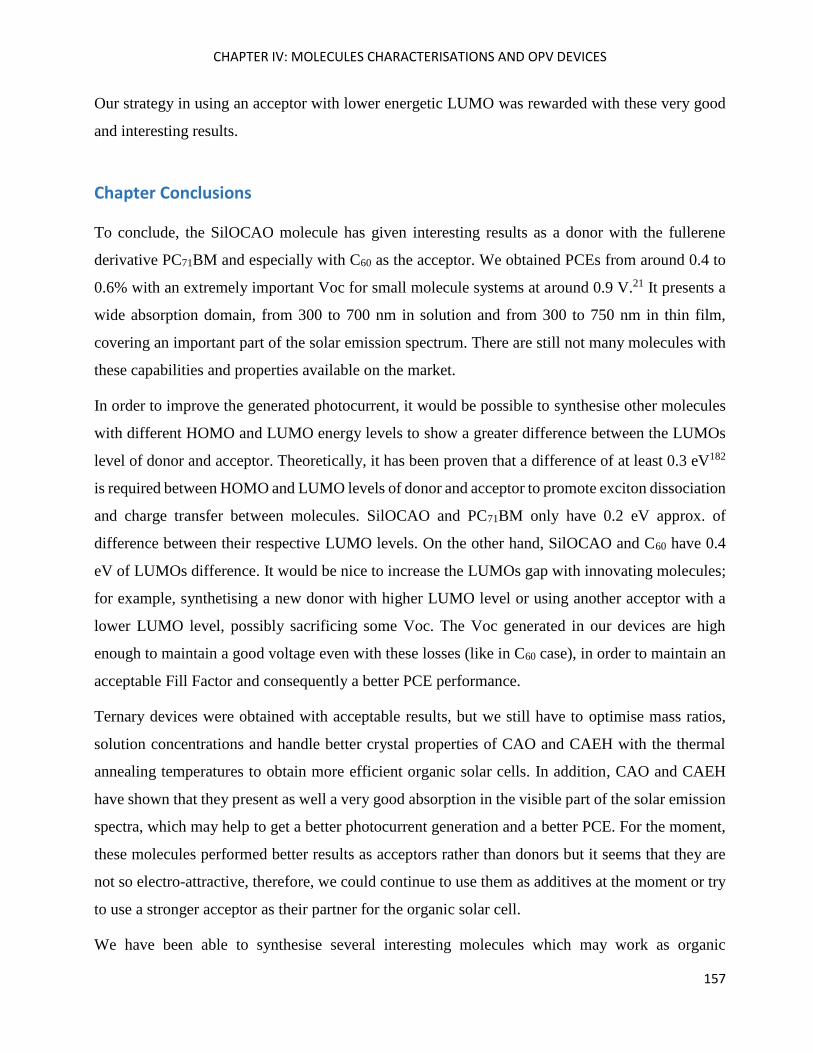
CHAPTER IV: MOLECULES CHARACTERISATIONS AND OPV DEVICES
157
Our strategy in using an acceptor with lower energetic LUMO was rewarded with these very good
and interesting results.
Chapter Conclusions
To conclude, the SilOCAO molecule has given interesting results as a donor with the fullerene
derivative PC71BM and especially with C60 as the acceptor. We obtained PCEs from around 0.4 to
0.6% with an extremely important Voc for small molecule systems at around 0.9 V.21 It presents a
wide absorption domain, from 300 to 700 nm in solution and from 300 to 750 nm in thin film,
covering an important part of the solar emission spectrum. There are still not many molecules with
these capabilities and properties available on the market.
In order to improve the generated photocurrent, it would be possible to synthesise other molecules
with different HOMO and LUMO energy levels to show a greater difference between the LUMOs
level of donor and acceptor. Theoretically, it has been proven that a difference of at least 0.3 eV182
is required between HOMO and LUMO levels of donor and acceptor to promote exciton dissociation
and charge transfer between molecules. SilOCAO and PC71BM only have 0.2 eV approx. of
difference between their respective LUMO levels. On the other hand, SilOCAO and C60 have 0.4
eV of LUMOs difference. It would be nice to increase the LUMOs gap with innovating molecules;
for example, synthetising a new donor with higher LUMO level or using another acceptor with a
lower LUMO level, possibly sacrificing some Voc. The Voc generated in our devices are high
enough to maintain a good voltage even with these losses (like in C60 case), in order to maintain an
acceptable Fill Factor and consequently a better PCE performance.
Ternary devices were obtained with acceptable results, but we still have to optimise mass ratios,
solution concentrations and handle better crystal properties of CAO and CAEH with the thermal
annealing temperatures to obtain more efficient organic solar cells. In addition, CAO and CAEH
have shown that they present as well a very good absorption in the visible part of the solar emission
spectra, which may help to get a better photocurrent generation and a better PCE. For the moment,
these molecules performed better results as acceptors rather than donors but it seems that they are
not so electro-attractive, therefore, we could continue to use them as additives at the moment or try
to use a stronger acceptor as their partner for the organic solar cell.
We have been able to synthesise several interesting molecules which may work as organic
CHAPTER IV: MOLECULES CHARACTERISATIONS AND OPV DEVICES
158
semiconductors, more specifically with OPV properties. These molecules have been elaborated with
classical, modern and greener cross-coupling methods which are trend-topic protocols in this
subject.
We are glad to have developed a very fruitful collaboration with the CIO laboratory, specifically
with GPOM team, Dr. José Luis Maldonado and his students.
Perspectives
SilOCAO, CAO and CAEH molecules could be used with acceptors of lower energy as we have
already explained such as functionalised graphene (work function of -4.5 eV),101 C60 and
[Ni(4dopedt)2]. With these acceptors we expect to increase the photocurrent produced in our
devices, as it has been proven in SilOCAO and C60 device.
At the same time, we have to continue optimising the devices already obtained in this collaboration
in order to get better photoconversion yields.
On the other hand, charge mobility should be measured on all organic compounds.
BHJ architectures will also be studied in Toulouse in the frame of an ongoing collaboration with
physicists of LAAS and LAPLACE Laboratories in France as well. Materials morphologies and
electronic properties will be investigated jointly in Toulouse (physico-chemical characterisations)
and in Dr. Jose-Luis Maldonado’s laboratory.
Finally, we will synthesise new innovating molecules for OPV applications.
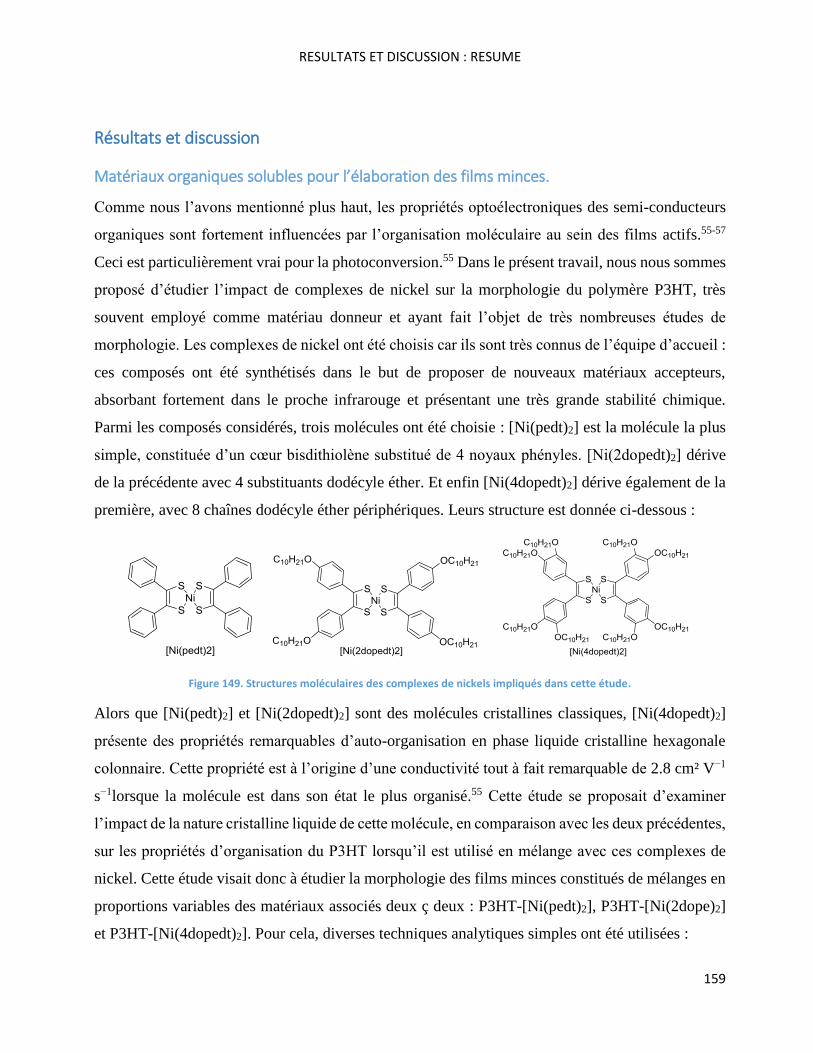
RESULTATS ET DISCUSSION : RESUME
159
Résultats et discussion
Matériaux organiques solubles pour l’élaboration des films minces.
Comme nous l’avons mentionné plus haut, les propriétés optoélectroniques des semi-conducteurs
organiques sont fortement influencées par l’organisation moléculaire au sein des films actifs.55-57
Ceci est particulièrement vrai pour la photoconversion.55 Dans le présent travail, nous nous sommes
proposé d’étudier l’impact de complexes de nickel sur la morphologie du polymère P3HT, très
souvent employé comme matériau donneur et ayant fait l’objet de très nombreuses études de
morphologie. Les complexes de nickel ont été choisis car ils sont très connus de l’équipe d’accueil :
ces composés ont été synthétisés dans le but de proposer de nouveaux matériaux accepteurs,
absorbant fortement dans le proche infrarouge et présentant une très grande stabilité chimique.
Parmi les composés considérés, trois molécules ont été choisie : [Ni(pedt)2] est la molécule la plus
simple, constituée d’un cœur bisdithiolène substitué de 4 noyaux phényles. [Ni(2dopedt)2] dérive
de la précédente avec 4 substituants dodécyle éther. Et enfin [Ni(4dopedt)2] dérive également de la
première, avec 8 chaînes dodécyle éther périphériques. Leurs structure est donnée ci-dessous :
Figure 149. Structures moléculaires des complexes de nickels impliqués dans cette étude.
Alors que [Ni(pedt)2] et [Ni(2dopedt)2] sont des molécules cristallines classiques, [Ni(4dopedt)2]
présente des propriétés remarquables d’auto-organisation en phase liquide cristalline hexagonale
colonnaire. Cette propriété est à l’origine d’une conductivité tout à fait remarquable de 2.8 cm² V−1
s−1lorsque la molécule est dans son état le plus organisé.55 Cette étude se proposait d’examiner
l’impact de la nature cristalline liquide de cette molécule, en comparaison avec les deux précédentes,
sur les propriétés d’organisation du P3HT lorsqu’il est utilisé en mélange avec ces complexes de
nickel. Cette étude visait donc à étudier la morphologie des films minces constitués de mélanges en
proportions variables des matériaux associés deux ç deux : P3HT-[Ni(pedt)2], P3HT-[Ni(2dope)2]
et P3HT-[Ni(4dopedt)2]. Pour cela, diverses techniques analytiques simples ont été utilisées :
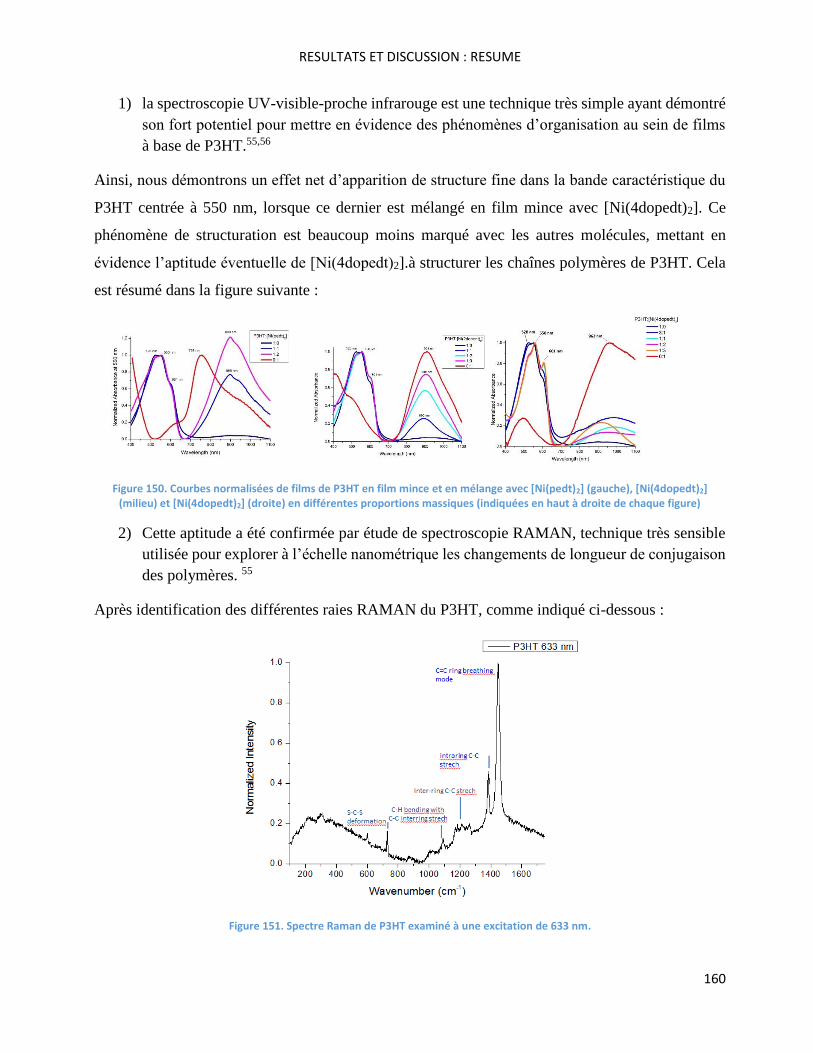
RESULTATS ET DISCUSSION : RESUME
160
1) la spectroscopie UV-visible-proche infrarouge est une technique très simple ayant démontré
son fort potentiel pour mettre en évidence des phénomènes d’organisation au sein de films
à base de P3HT.55,56
Ainsi, nous démontrons un effet net d’apparition de structure fine dans la bande caractéristique du
P3HT centrée à 550 nm, lorsque ce dernier est mélangé en film mince avec [Ni(4dopedt)2]. Ce
phénomène de structuration est beaucoup moins marqué avec les autres molécules, mettant en
évidence l’aptitude éventuelle de [Ni(4dopedt)2].à structurer les chaînes polymères de P3HT. Cela
est résumé dans la figure suivante :
Figure 150. Courbes normalisées de films de P3HT en film mince et en mélange avec [Ni(pedt)2] (gauche), [Ni(4dopedt)2] (milieu) et [Ni(4dopedt)2] (droite) en différentes proportions massiques (indiquées en haut à droite de chaque figure)
2) Cette aptitude a été confirmée par étude de spectroscopie RAMAN, technique très sensible
utilisée pour explorer à l’échelle nanométrique les changements de longueur de conjugaison
des polymères. 55
Après identification des différentes raies RAMAN du P3HT, comme indiqué ci-dessous :
Figure 151. Spectre Raman de P3HT examiné à une excitation de 633 nm.
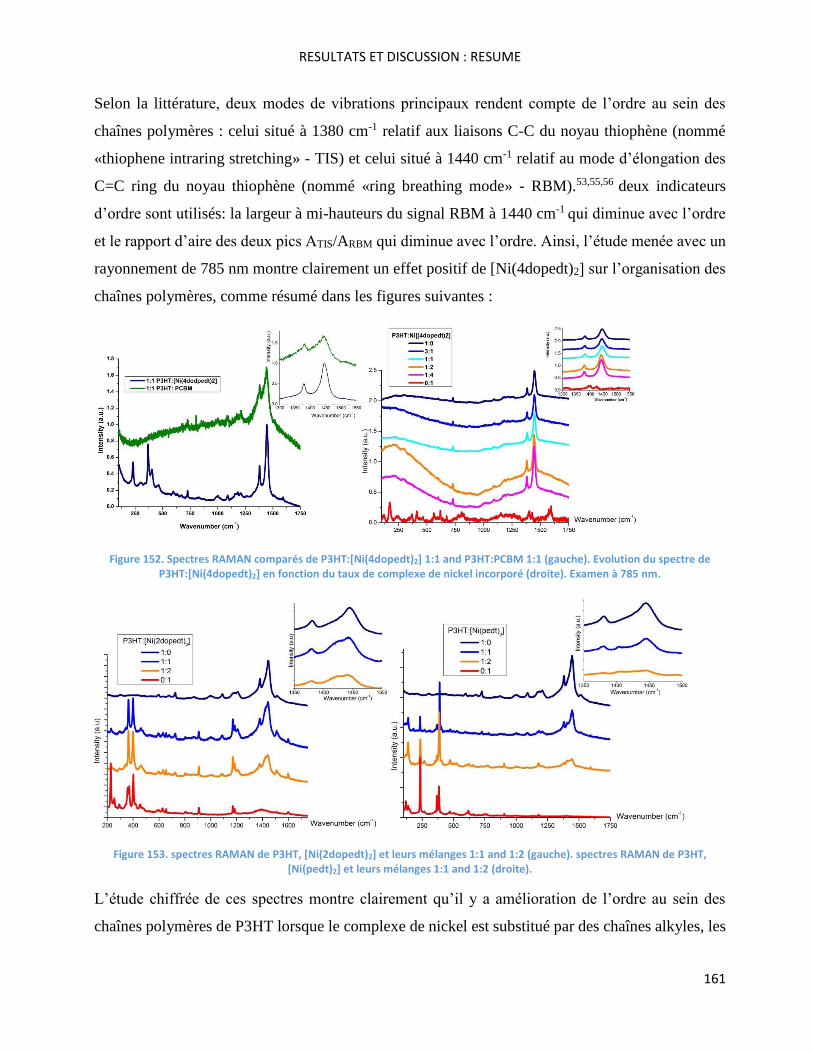
RESULTATS ET DISCUSSION : RESUME
161
Selon la littérature, deux modes de vibrations principaux rendent compte de l’ordre au sein des
chaînes polymères : celui situé à 1380 cm-1 relatif aux liaisons C-C du noyau thiophène (nommé
«thiophene intraring stretching» - TIS) et celui situé à 1440 cm-1 relatif au mode d’élongation des
C=C ring du noyau thiophène (nommé «ring breathing mode» - RBM).53,55,56 deux indicateurs
d’ordre sont utilisés: la largeur à mi-hauteurs du signal RBM à 1440 cm-1 qui diminue avec l’ordre
et le rapport d’aire des deux pics ATIS/ARBM qui diminue avec l’ordre. Ainsi, l’étude menée avec un
rayonnement de 785 nm montre clairement un effet positif de [Ni(4dopedt)2] sur l’organisation des
chaînes polymères, comme résumé dans les figures suivantes :
Figure 152. Spectres RAMAN comparés de P3HT:[Ni(4dopedt)2] 1:1 and P3HT:PCBM 1:1 (gauche). Evolution du spectre de P3HT:[Ni(4dopedt)2] en fonction du taux de complexe de nickel incorporé (droite). Examen à 785 nm.
Figure 153. spectres RAMAN de P3HT, [Ni(2dopedt)2] et leurs mélanges 1:1 and 1:2 (gauche). spectres RAMAN de P3HT, [Ni(pedt)2] et leurs mélanges 1:1 and 1:2 (droite).
L’étude chiffrée de ces spectres montre clairement qu’il y a amélioration de l’ordre au sein des
chaînes polymères de P3HT lorsque le complexe de nickel est substitué par des chaînes alkyles, les
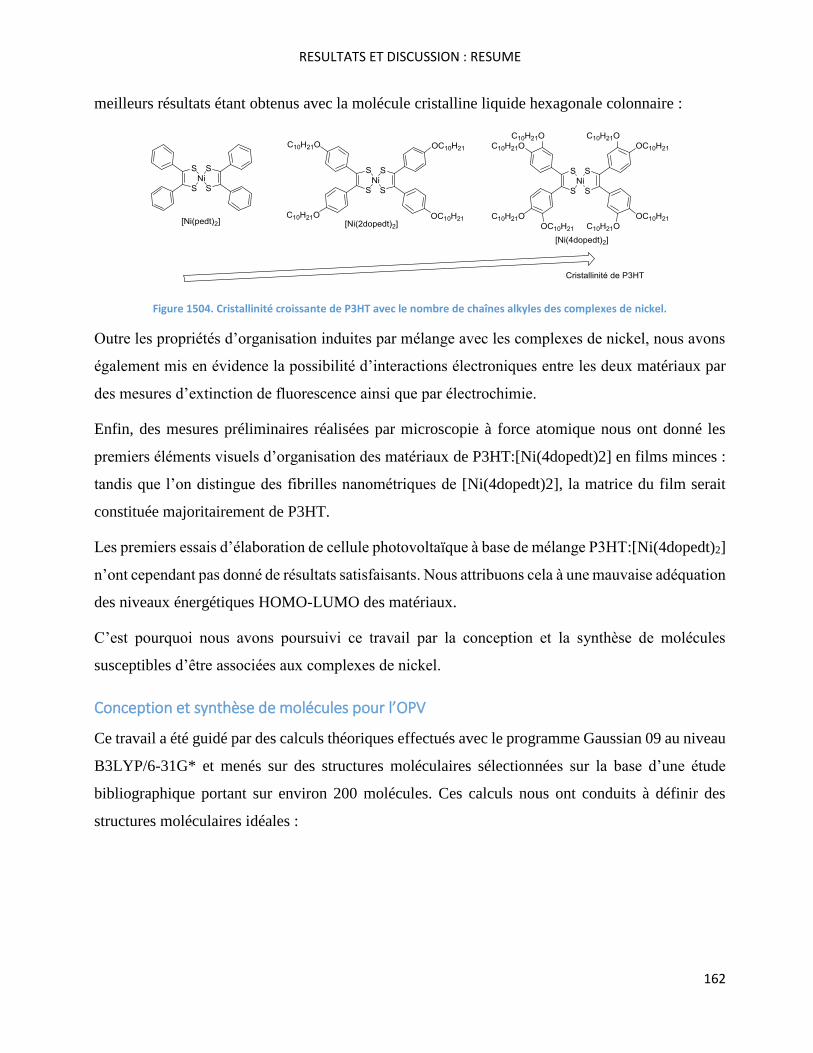
RESULTATS ET DISCUSSION : RESUME
162
meilleurs résultats étant obtenus avec la molécule cristalline liquide hexagonale colonnaire :
Figure 1504. Cristallinité croissante de P3HT avec le nombre de chaînes alkyles des complexes de nickel.
Outre les propriétés d’organisation induites par mélange avec les complexes de nickel, nous avons
également mis en évidence la possibilité d’interactions électroniques entre les deux matériaux par
des mesures d’extinction de fluorescence ainsi que par électrochimie.
Enfin, des mesures préliminaires réalisées par microscopie à force atomique nous ont donné les
premiers éléments visuels d’organisation des matériaux de P3HT:[Ni(4dopedt)2] en films minces :
tandis que l’on distingue des fibrilles nanométriques de [Ni(4dopedt)2], la matrice du film serait
constituée majoritairement de P3HT.
Les premiers essais d’élaboration de cellule photovoltaïque à base de mélange P3HT:[Ni(4dopedt)2]
n’ont cependant pas donné de résultats satisfaisants. Nous attribuons cela à une mauvaise adéquation
des niveaux énergétiques HOMO-LUMO des matériaux.
C’est pourquoi nous avons poursuivi ce travail par la conception et la synthèse de molécules
susceptibles d’être associées aux complexes de nickel.
Conception et synthèse de molécules pour l’OPV
Ce travail a été guidé par des calculs théoriques effectués avec le programme Gaussian 09 au niveau
B3LYP/6-31G* et menés sur des structures moléculaires sélectionnées sur la base d’une étude
bibliographique portant sur environ 200 molécules. Ces calculs nous ont conduits à définir des
structures moléculaires idéales :
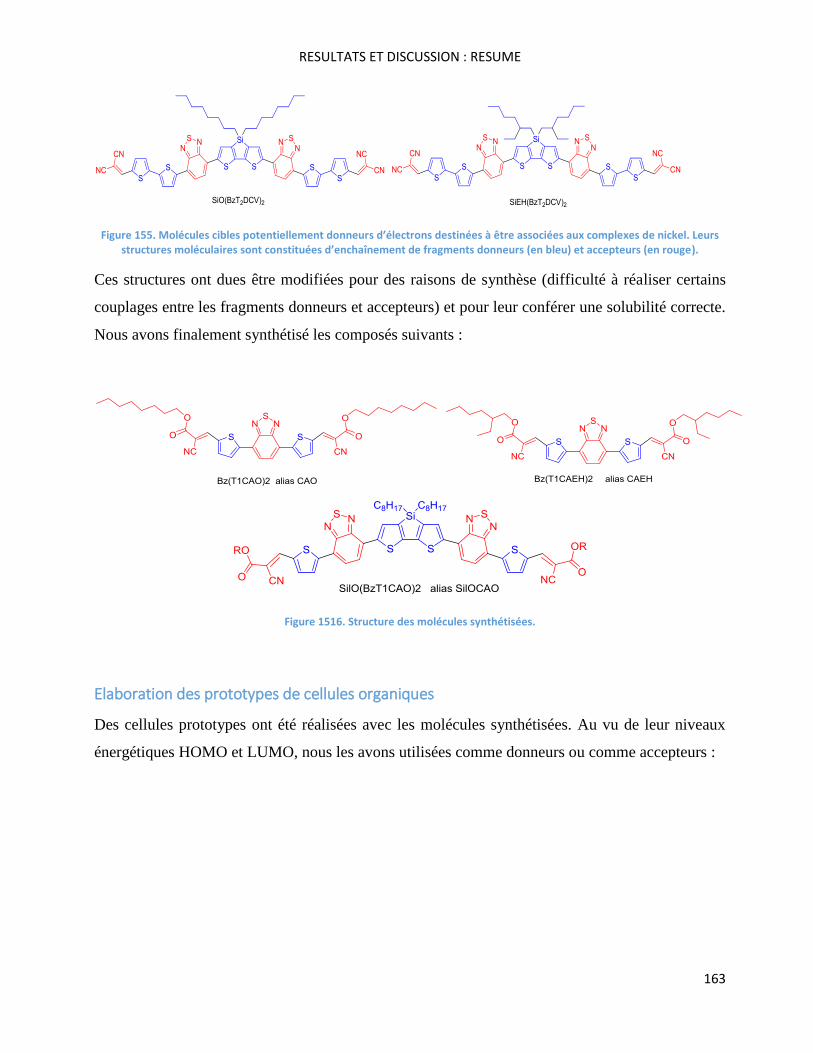
RESULTATS ET DISCUSSION : RESUME
163
Figure 155. Molécules cibles potentiellement donneurs d’électrons destinées à être associées aux complexes de nickel. Leurs structures moléculaires sont constituées d’enchaînement de fragments donneurs (en bleu) et accepteurs (en rouge).
Ces structures ont dues être modifiées pour des raisons de synthèse (difficulté à réaliser certains
couplages entre les fragments donneurs et accepteurs) et pour leur conférer une solubilité correcte.
Nous avons finalement synthétisé les composés suivants :
Figure 1516. Structure des molécules synthétisées.
Elaboration des prototypes de cellules organiques
Des cellules prototypes ont été réalisées avec les molécules synthétisées. Au vu de leur niveaux
énergétiques HOMO et LUMO, nous les avons utilisées comme donneurs ou comme accepteurs :
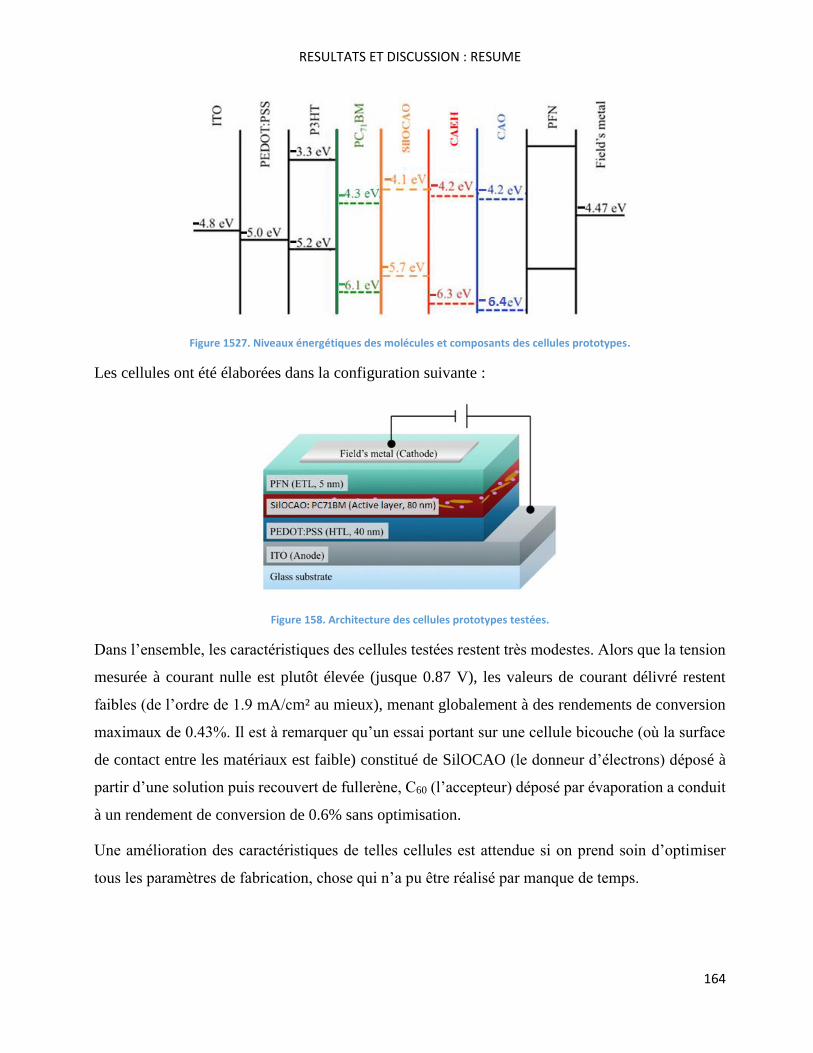
RESULTATS ET DISCUSSION : RESUME
164
Figure 1527. Niveaux énergétiques des molécules et composants des cellules prototypes.
Les cellules ont été élaborées dans la configuration suivante :
Figure 158. Architecture des cellules prototypes testées.
Dans l’ensemble, les caractéristiques des cellules testées restent très modestes. Alors que la tension
mesurée à courant nulle est plutôt élevée (jusque 0.87 V), les valeurs de courant délivré restent
faibles (de l’ordre de 1.9 mA/cm² au mieux), menant globalement à des rendements de conversion
maximaux de 0.43%. Il est à remarquer qu’un essai portant sur une cellule bicouche (où la surface
de contact entre les matériaux est faible) constitué de SilOCAO (le donneur d’électrons) déposé à
partir d’une solution puis recouvert de fullerène, C60 (l’accepteur) déposé par évaporation a conduit
à un rendement de conversion de 0.6% sans optimisation.
Une amélioration des caractéristiques de telles cellules est attendue si on prend soin d’optimiser
tous les paramètres de fabrication, chose qui n’a pu être réalisé par manque de temps.
RESULTATS ET DISCUSSION : RESUME
165
Conclusion
Dans le présent travail, nous avons présenté une étude approfondie en solution et sur des films
minces de poly-3-hexylthiophène (P3HT) pur et en mélange avec des complexes de nickel (Ni-BDT.
L'objectif principal de cette étude était de comprendre l'organisation moléculaires au sein des films
organiques et son impact sur le transfert de charge entre les matériaux afin d’optimiser les
rendements de photoconversion.
Nous avons également conçu et synthétisé trois nouvelles molécules à faible gap électronique,
nommées SilOCAO, Bz(T1CAO)2 et Bz(T1CAEH)2 selon des méthodologies de synthèse
optimisées. Ces molécules ont été conçues avec l’appui de calculs semi-empiriques dans le but de
les associer éventuellement aux complexes de nickel. Leurs synthèses et caractérisation complètes
ont été décrites en détail.
Ces molécules présentant des propriétés prometteuses pour leur utilisation en photovoltaïque
organique, nous avons réalisé des cellules solaires organiques prototypes. Les résultats obtenus sont
prometteurs, en particulier dans le cas de la molécule SilOCAO, utilisée ici comme donneur
d'électrons en association avec le PC71BM ou le C60.

GENERAL CONCLUSION AND PERSPECTIVES
166

GENERAL CONCLUSION AND PERSPECTIVES
167
GENERAL CONCLUSION AND
PERSPECTIVES

GENERAL CONCLUSION AND PERSPECTIVES
168
GENERAL CONCLUSION AND PERSPECTIVES
169
General Conclusion
In this work, we present a comprehensive study in solution and in thin films of poly-3-
hexylthiophene (P3HT) pure and blended with nickel complexes (Ni-bdt). The main objective of
this study was to understand the molecular organisation in organic thin films and its impact on the
charge transfer between the materials to optimise photoconversion efficiencies.
Furthermore, this work was also focused on the design, synthesis and study of small molecules for
use in organic bulk heterojunction photovoltaic devices.
First, we have demonstrated that blending P3HT with the nickel complex [Ni(4dopedt)2] may lead
to improved chain ordering as soon as the 1:1 wt. ratio is reached, without the need for thermal (or
solvent) annealing treatment. UV-Vis-NIR absorption, RAMAN spectroscopy, and AFM, have
proven this concept. Other nickel complexes such as [Ni(2dopedt)2] and [Ni(pedt)2] were studied in
a blend with P3HT but they did not promote any improvement of polymer organisation and
sometimes even worsened the crystalline structure.
In addition, P3HT presented an electrical interaction in blend with the nickel complexes in solution
and in thin film studied by electrochemistry; furthermore, nickel complexes quenched P3HT
fluorescence as well, which seemed promising for the OPV devices.
On the other hand, the first preliminary OPV devices made of P3HT:[Ni(4dopedt)2] showed no
positive result or a null PV effect. This may have occurred because [Ni(4dopedt)2] organisation
could be affected by the different annealing temperatures of devices, as shown by the DSC analysis.
Moreover, theoretical calculations have shown a possible triplet state for similar nickel complexes72
which is undesirable for OPV processes and devices. Finally, as observed in the thin film study
under UV-Vis-NIR spectroscopy, once the [Ni(4dopedt)2] is spin coated and in a condensed phase,
an absorption band appears between 480 and 670 nm, which may overlap some nanometres with
the emission spectrum of P3HT (P3HT Emissiononset = 615 nm), leading to an unwanted energy
transfer instead of a charge transfer. Further studies will be carried out on these subjects.
Then, after a long synthesis path, we have been able to synthesise 3 innovative and interesting
molecules for OPV applications: Bz(T1CAO)2, Bz(T1CAEH)2 and SilOCAO, headed by theoretical
GENERAL CONCLUSION AND PERSPECTIVES
170
calculations effected at the DFT/B3LYP/6-31G* level. They are -conjugated systems of alternating
(delocalised) saturated and unsaturated bonds, comprising planar aromatic units with delocalised
frontier molecular orbitals. These units present a planar structural shape and strong π-interactions.
They are highly soluble in chlorinated solvents.
SilOCAO is a potential electron-donor, and the other two, Bz(T1CAO)2 and Bz(T1CAEH)2 are
potential electron-acceptors. Many kinds of organic syntheses were performed to accomplish these
molecules, including 3 different cross-coupling methods: Suzuki, Stille and direct (hetero)arylation.
Among the obtained products and intermediates, we would like to emphasise in the unsymmetrical
substitution of 4,7-dibromobenzothiadiazole to obtain the monosubstituted “fragment 1”
(BrBTCHO) in 30% yield, because the di-substitution is always majorly favoured.
We have learnt from the literature and our experience, that direct (hetero)arylation can be developed
in innumerable conditions depending on the chemical groups of the reacting molecules. For us, there
is no general rule to follow to ensure the succeed of direct (hetero)arylation. It is a very interesting
reaction and we have no doubt that further research will be performed to achieve better results and
more general rules will allow its performance to be improved.
Finally, in the last chapter we have characterised the alternated D/A typed molecules obtained,
Bz(T1CAO)2, Bz(T1CAEH)2 and SilOCAO, by different techniques. All of these molecules
presented important absorption characteristics in the visible part of the spectrum. In particular,
Bz(T1CAO)2 presents very interesting liquid-crystal properties evidenced by its DSC analysis and
polarised light microscopy.
OPV devices have been elaborated with Bz(T1CAO)2 and Bz(T1CAEH)2 and SilOCAO. The best
results were achieved with SilOCAO molecule as a donor with the fullerene derivative PC71BM and
especially with C60 as acceptors. We have obtained PCEs values at around 0.4 to 0.6% with a great
Voc for small molecules systems at around 0.9 V.21 The D/A blend presents a wide absorption
domain, from 300 to 700 nm in solution and from 300 to 750 nm in thin film, covering an important
part of the solar emission spectrum. There are still not many molecules with these capabilities and
properties available on the market.
In order to improve the generated photocurrent of our devices, it would be possible to synthesise
GENERAL CONCLUSION AND PERSPECTIVES
171
other molecules with different HOMO and LUMO energy levels to have better difference between
LUMOs level of donor and acceptor. Theoretically, it has been proven that a difference of 0.3 eV182
at least is required between HOMO and LUMO levels of donor and acceptor to promote exciton
dissociation and charge transfer between molecules. SilOCAO and PC71BM only have 0.2 eV
approx. of difference between their respective LUMO levels. On the other hand, SilOCAO and C60
have a LUMOs difference of 0.4 eV. It would be nice to increase the LUMO gap with innovative
molecules; for example, synthesising a new donor with higher LUMO level or using another
acceptor with a lower LUMO level, maybe in sacrificing some Voc. The Voc generated in our
devices are high enough to maintain a good voltage even with these losses (like in C60 case) to
maintain an acceptable Fill Factor and consequently a better PCE performance.
Ternary devices were obtained with acceptable results, but we still have to optimise mass ratios,
solution concentrations and handle better crystal properties of Bz(T1CAO)2 and Bz(T1CAEH)2 with
the thermal annealing temperatures to obtain more efficient organic solar cells.
For the moment, Bz(T1CAO)2 and Bz(T1CAEH)2 do not appear as electro-attractive in the BHJ
tested; therefore, we could continue using them as additives or try to use a stronger acceptor as their
partner for the organic solar cell.
We are glad to have developed very fruitful collaborations along this thesis work with several
laboratories from Toulouse (LAAS, LAPLACE, LCPQ) and Mexican laboratories of IIM (UNAM,
Mexico City, Mexico) and CIO(León, Mexico).

GENERAL CONCLUSION AND PERSPECTIVES
172

GENERAL CONCLUSION AND PERSPECTIVES
173
Perspectives
More OPV devices have to be elaborated with the nickel complexes to be sure that they can
participate in a PV process.
The liquid crystal properties of Bz(T1CAO)2 open a new window of characterisations and
applications where we can profit of its properties such as organic transistors. Moreover Bz(T1CAO)2
and Bz(T1CAEH)2 have also been tested as OLEDs giving a red light, but much more work need to
be developed.
SilOCAO, CAO and CAEH molecules could be used with acceptors of lower energy as we have
already explained such as functionalised graphene (work function of -4.5 eV),101 C60 and
[Ni(4dopedt)2]. With these acceptors we expect to increase the photocurrent produced in our
devices, as it has been proven in SilOCAO and C60 device.
At the same time, we have to continue optimising the devices already obtained in this collaboration
in order to obtain better photoconversion yields.
On the other hand, charge mobility should be measured on all organic compounds.
BHJ architectures will also be studied in Toulouse in the frame of an ongoing collaboration with
physicists of LAAS and LAPLACE Laboratories in France as well. Materials morphologies and
electronic properties will be investigated jointly in Toulouse (physico-chemical characterisations)
and in Dr. Jose-Luis Maldonado’s laboratory.
Finally, we will synthesise new innovating molecules for OPV applications.

EXPERIMENTAL SECTION
174

EXPERIMENTAL SECTION
175
Experimental Section

EXPERIMENTAL SECTION
176
EXPERIMENTAL SECTION
177
Experimental Section
Films development
Films elaboration
Electronic grade regioregular P3HT (PlexcoreVR average Mn 54 000–75 000; >98% head-to-tail
regioregular) is purchased from Sigma-Aldrich and PCBM is acquired from LUMTEC (99.5%) both
used as received. [Ni(4dodpedt)2], [Ni(2dopedt)2] and [Ni(pedt)2] were synthesised in our
laboratory.39 All the materials, pristine and blended are dissolved in warm chlorobenzene (50°C) to
produce 10 mg/ml concentration solutions. Solutions are filtered using 0.2 m PTFE filters to
remove any soluble aggregates. Films are prepared by spin coating at 1500 rpm for 30 s and then at
2000 rpm for 60s on 120nm thick indium tin oxide (ITO) covered glass substrates. The thicknesses
of films were from 50 up to 100 nm. All the thin films were elaborated under clean-room conditions.
ITO was purchased from SOLEMS: reference 1) ITO sol 30/1.1 and 30 ohm/cm2. 2) ITO sol 12/1.1
and 10 ohm/cm2.
UV-Vis-Near Infrared Measurements
Visible-Near IR absorbance spectra were recorded using a Varian Cary 5000 spectrometer and
Spectrometer Perkin Elmer Lambda 35. In solution, the solvents used were dichloromethane,
chloroform and chlorobenzene.
Fluorescence Measurements
Fluorescence measurements were made on a HORIBA Jobin Yvon FluoroMax-4
spectrofluorometer.
Determination of quenching parameter: the Stern-Volmer constant
The Stern-Volmer equation applies:
Fo/F = 1 + Ksv[Q]
Formula 1. Mathematic relation to deduce Ksv constant.
In Formula 1 where Fo and F are the fluorescence intensities observed in the absence and presence,
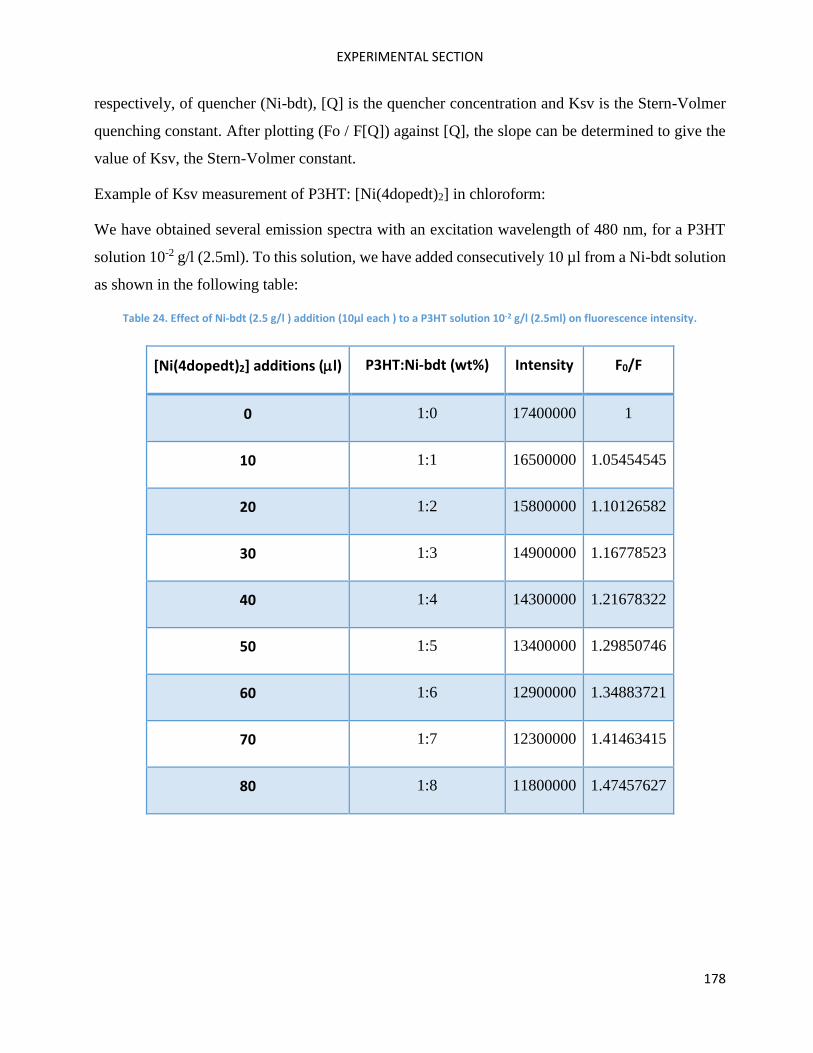
EXPERIMENTAL SECTION
178
respectively, of quencher (Ni-bdt), [Q] is the quencher concentration and Ksv is the Stern-Volmer
quenching constant. After plotting (Fo / F[Q]) against [Q], the slope can be determined to give the
value of Ksv, the Stern-Volmer constant.
Example of Ksv measurement of P3HT: [Ni(4dopedt)2] in chloroform:
We have obtained several emission spectra with an excitation wavelength of 480 nm, for a P3HT
solution 10-2 g/l (2.5ml). To this solution, we have added consecutively 10 µl from a Ni-bdt solution
as shown in the following table:
Table 24. Effect of Ni-bdt (2.5 g/l ) addition (10µl each ) to a P3HT solution 10-2 g/l (2.5ml) on fluorescence intensity.
[Ni(4dopedt)2] additions (l) P3HT:Ni-bdt (wt%) Intensity F0/F
0 1:0 17400000 1
10 1:1 16500000 1.05454545
20 1:2 15800000 1.10126582
30 1:3 14900000 1.16778523
40 1:4 14300000 1.21678322
50 1:5 13400000 1.29850746
60 1:6 12900000 1.34883721
70 1:7 12300000 1.41463415
80 1:8 11800000 1.47457627
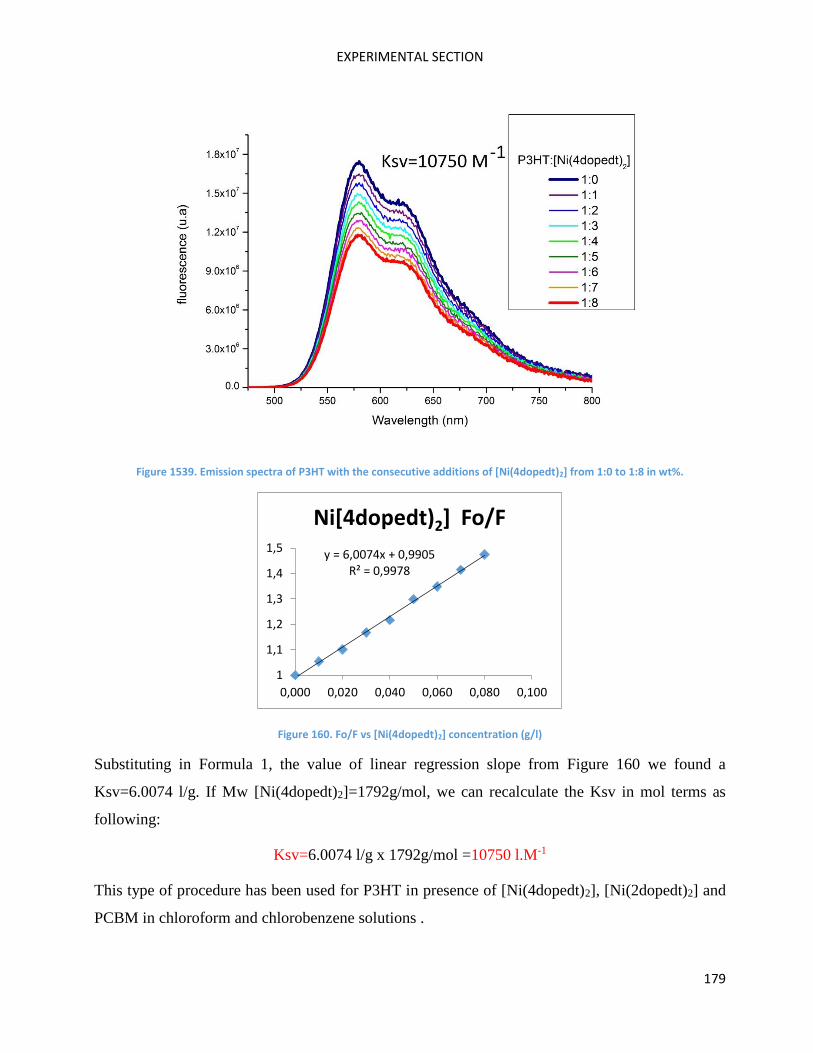
EXPERIMENTAL SECTION
179
Figure 1539. Emission spectra of P3HT with the consecutive additions of [Ni(4dopedt)2] from 1:0 to 1:8 in wt%.
Figure 160. Fo/F vs [Ni(4dopedt)2] concentration (g/l)
Substituting in Formula 1, the value of linear regression slope from Figure 160 we found a
Ksv=6.0074 l/g. If Mw [Ni(4dopedt)2]=1792g/mol, we can recalculate the Ksv in mol terms as
following:
Ksv=6.0074 l/g x 1792g/mol =10750 l.M-1
This type of procedure has been used for P3HT in presence of [Ni(4dopedt)2], [Ni(2dopedt)2] and
PCBM in chloroform and chlorobenzene solutions .
y = 6,0074x + 0,9905R² = 0,9978
1
1,1
1,2
1,3
1,4
1,5
0,000 0,020 0,040 0,060 0,080 0,100
Ni[4dopedt)2] Fo/F
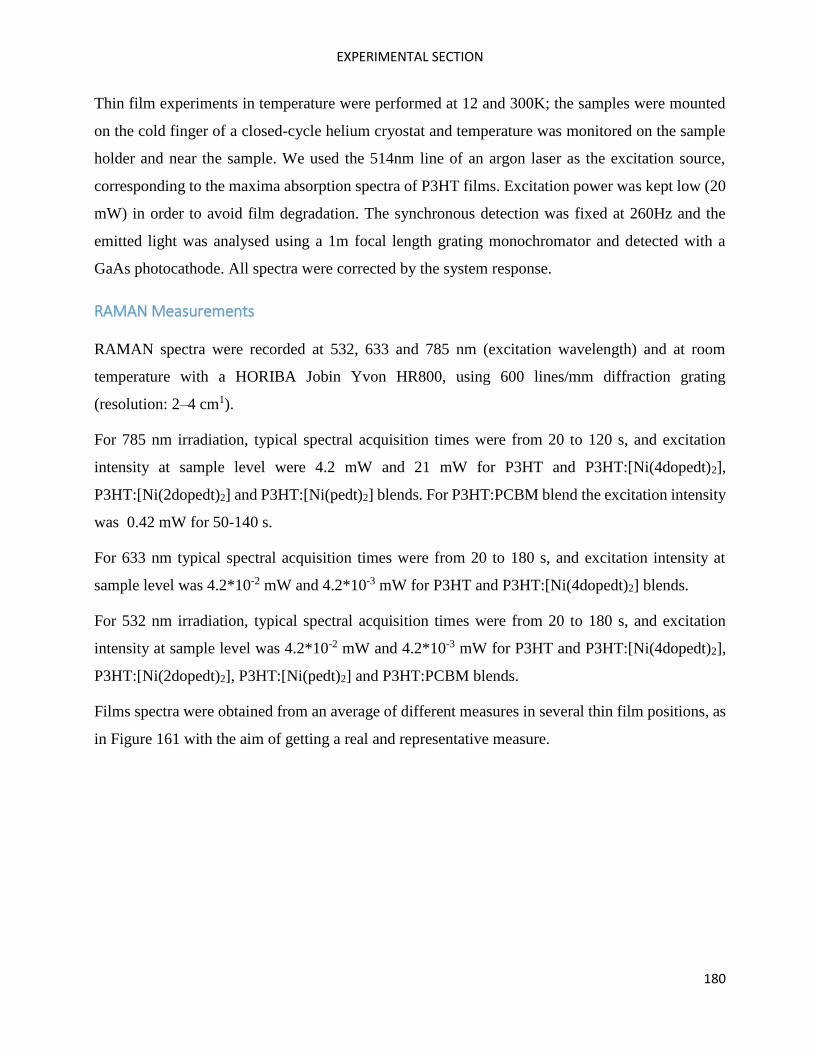
EXPERIMENTAL SECTION
180
Thin film experiments in temperature were performed at 12 and 300K; the samples were mounted
on the cold finger of a closed-cycle helium cryostat and temperature was monitored on the sample
holder and near the sample. We used the 514nm line of an argon laser as the excitation source,
corresponding to the maxima absorption spectra of P3HT films. Excitation power was kept low (20
mW) in order to avoid film degradation. The synchronous detection was fixed at 260Hz and the
emitted light was analysed using a 1m focal length grating monochromator and detected with a
GaAs photocathode. All spectra were corrected by the system response.
RAMAN Measurements
RAMAN spectra were recorded at 532, 633 and 785 nm (excitation wavelength) and at room
temperature with a HORIBA Jobin Yvon HR800, using 600 lines/mm diffraction grating
(resolution: 2–4 cm1).
For 785 nm irradiation, typical spectral acquisition times were from 20 to 120 s, and excitation
intensity at sample level were 4.2 mW and 21 mW for P3HT and P3HT:[Ni(4dopedt)2],
P3HT:[Ni(2dopedt)2] and P3HT:[Ni(pedt)2] blends. For P3HT:PCBM blend the excitation intensity
was 0.42 mW for 50-140 s.
For 633 nm typical spectral acquisition times were from 20 to 180 s, and excitation intensity at
sample level was 4.2*10-2 mW and 4.2*10-3 mW for P3HT and P3HT:[Ni(4dopedt)2] blends.
For 532 nm irradiation, typical spectral acquisition times were from 20 to 180 s, and excitation
intensity at sample level was 4.2*10-2 mW and 4.2*10-3 mW for P3HT and P3HT:[Ni(4dopedt)2],
P3HT:[Ni(2dopedt)2], P3HT:[Ni(pedt)2] and P3HT:PCBM blends.
Films spectra were obtained from an average of different measures in several thin film positions, as
in Figure 161 with the aim of getting a real and representative measure.
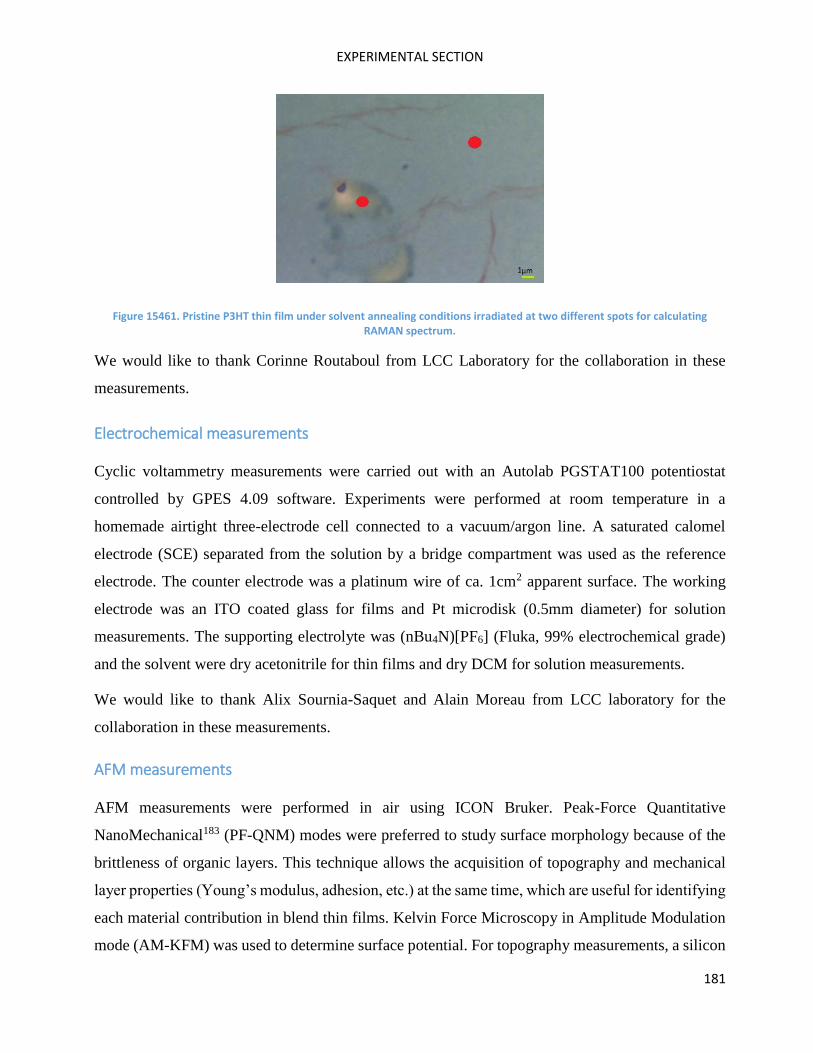
EXPERIMENTAL SECTION
181
Figure 15461. Pristine P3HT thin film under solvent annealing conditions irradiated at two different spots for calculating RAMAN spectrum.
We would like to thank Corinne Routaboul from LCC Laboratory for the collaboration in these
measurements.
Electrochemical measurements
Cyclic voltammetry measurements were carried out with an Autolab PGSTAT100 potentiostat
controlled by GPES 4.09 software. Experiments were performed at room temperature in a
homemade airtight three-electrode cell connected to a vacuum/argon line. A saturated calomel
electrode (SCE) separated from the solution by a bridge compartment was used as the reference
electrode. The counter electrode was a platinum wire of ca. 1cm2 apparent surface. The working
electrode was an ITO coated glass for films and Pt microdisk (0.5mm diameter) for solution
measurements. The supporting electrolyte was (nBu4N)[PF6] (Fluka, 99% electrochemical grade)
and the solvent were dry acetonitrile for thin films and dry DCM for solution measurements.
We would like to thank Alix Sournia-Saquet and Alain Moreau from LCC laboratory for the
collaboration in these measurements.
AFM measurements
AFM measurements were performed in air using ICON Bruker. Peak-Force Quantitative
NanoMechanical183 (PF-QNM) modes were preferred to study surface morphology because of the
brittleness of organic layers. This technique allows the acquisition of topography and mechanical
layer properties (Young’s modulus, adhesion, etc.) at the same time, which are useful for identifying
each material contribution in blend thin films. Kelvin Force Microscopy in Amplitude Modulation
mode (AM-KFM) was used to determine surface potential. For topography measurements, a silicon
EXPERIMENTAL SECTION
182
tip with 4 nm-radius curvature was used. Current/potential measurements were carried out with
20nm-radius platinum-iridium-coated silicon tip.
We would like to thank Christina Villeneuve from LAPLACE Laboratory for the collaboration in
these measurements.
Molecular Engineering
Theoretical calculations
Optimized gas phase ground state structures were calculated at the density functional theory (DFT)
using Gaussian 09 with the global hybrid B3LYP functional and the 6-31G* basis set with aim of
calculating their electronic LUMO/HOMO levels. Frequency calculations were carried out to ensure
that the geometries obtained corresponded to minima and not saddle points (i.e. global minima).
UV-Vis spectra were calculated in solution with chloroform as solvent. All the calculations were
advised by Pascal Lacroix member of our team in LCC laboratory.
Organic synthesis
The organic syntheses are going to be described in chronological order as they have been presented
along the chapter “Molecule Engineering”.
All starting materials were purchased from commercial suppliers and used without further
purification. The 1H spectra were recorded on a Bruker AV400 spectrometer with deuterated
solvents from Sigma Aldrich. Multiplicity of NMR signal was denoted as m (multiplet), s (singlet),
d (doublet), t (triplet), dd (double doublet).
Mass analyses were performed at the Université Paul Sabatier Mass Spectrometry service.
Elemental analyses (C, H, N) were carried out at the Laboratoire de Chimie de Coordination-CNRS.
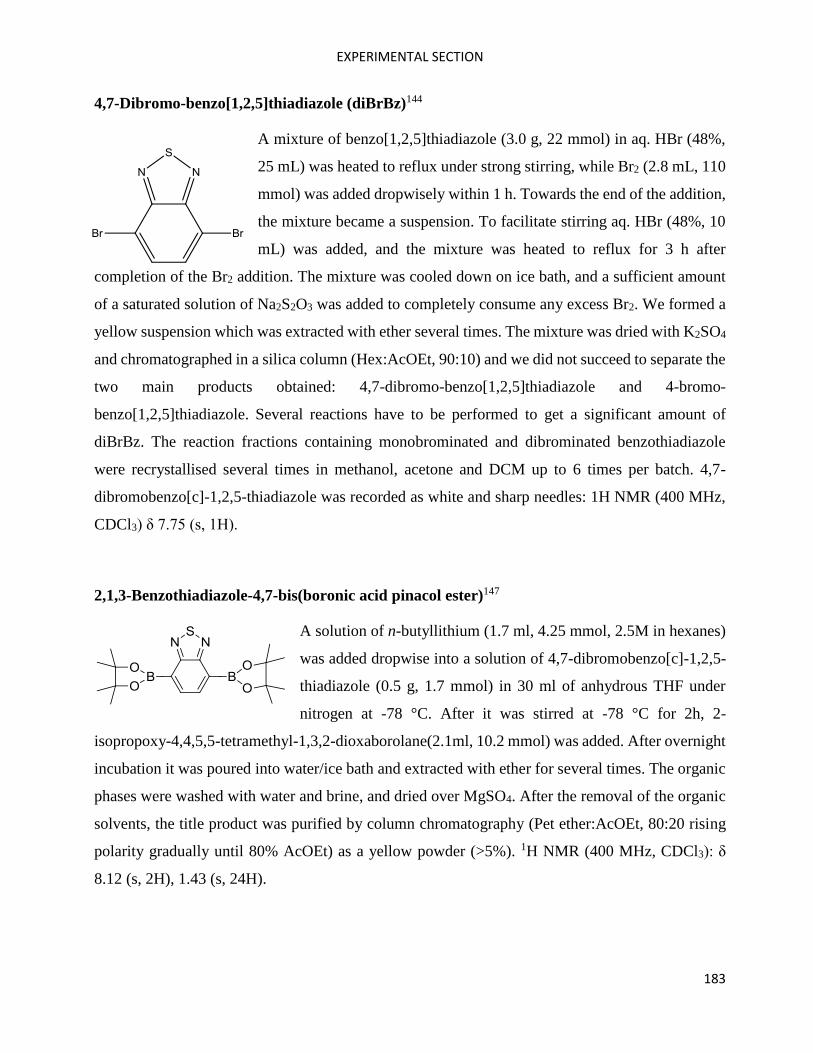
EXPERIMENTAL SECTION
183
4,7-Dibromo-benzo[1,2,5]thiadiazole (diBrBz)144
A mixture of benzo[1,2,5]thiadiazole (3.0 g, 22 mmol) in aq. HBr (48%,
25 mL) was heated to reflux under strong stirring, while Br2 (2.8 mL, 110
mmol) was added dropwisely within 1 h. Towards the end of the addition,
the mixture became a suspension. To facilitate stirring aq. HBr (48%, 10
mL) was added, and the mixture was heated to reflux for 3 h after
completion of the Br2 addition. The mixture was cooled down on ice bath, and a sufficient amount
of a saturated solution of Na2S2O3 was added to completely consume any excess Br2. We formed a
yellow suspension which was extracted with ether several times. The mixture was dried with K2SO4
and chromatographed in a silica column (Hex:AcOEt, 90:10) and we did not succeed to separate the
two main products obtained: 4,7-dibromo-benzo[1,2,5]thiadiazole and 4-bromo-
benzo[1,2,5]thiadiazole. Several reactions have to be performed to get a significant amount of
diBrBz. The reaction fractions containing monobrominated and dibrominated benzothiadiazole
were recrystallised several times in methanol, acetone and DCM up to 6 times per batch. 4,7-
dibromobenzo[c]-1,2,5-thiadiazole was recorded as white and sharp needles: 1H NMR (400 MHz,
CDCl3) δ 7.75 (s, 1H).
2,1,3-Benzothiadiazole-4,7-bis(boronic acid pinacol ester)147
A solution of n-butyllithium (1.7 ml, 4.25 mmol, 2.5M in hexanes)
was added dropwise into a solution of 4,7-dibromobenzo[c]-1,2,5-
thiadiazole (0.5 g, 1.7 mmol) in 30 ml of anhydrous THF under
nitrogen at -78 °C. After it was stirred at -78 °C for 2h, 2-
isopropoxy-4,4,5,5-tetramethyl-1,3,2-dioxaborolane(2.1ml, 10.2 mmol) was added. After overnight
incubation it was poured into water/ice bath and extracted with ether for several times. The organic
phases were washed with water and brine, and dried over MgSO4. After the removal of the organic
solvents, the title product was purified by column chromatography (Pet ether:AcOEt, 80:20 rising
polarity gradually until 80% AcOEt) as a yellow powder (>5%). 1H NMR (400 MHz, CDCl3): δ
8.12 (s, 2H), 1.43 (s, 24H).
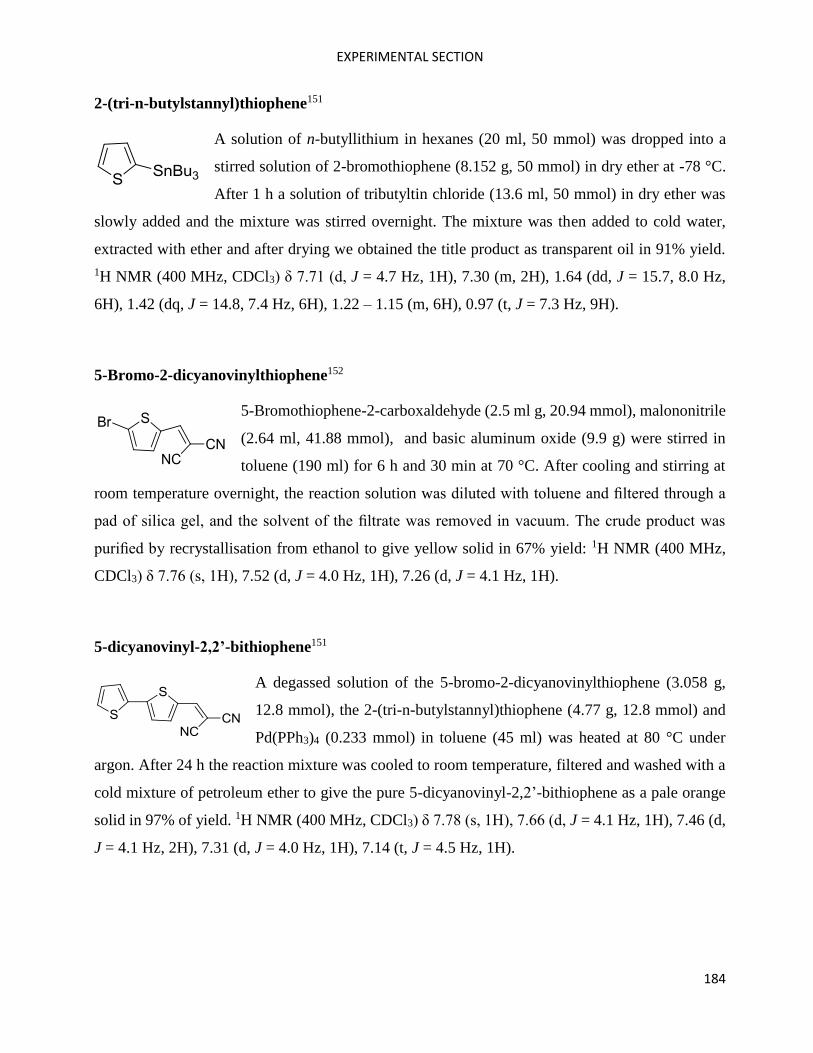
EXPERIMENTAL SECTION
184
2-(tri-n-butylstannyl)thiophene151
A solution of n-butyllithium in hexanes (20 ml, 50 mmol) was dropped into a
stirred solution of 2-bromothiophene (8.152 g, 50 mmol) in dry ether at -78 °C.
After 1 h a solution of tributyltin chloride (13.6 ml, 50 mmol) in dry ether was
slowly added and the mixture was stirred overnight. The mixture was then added to cold water,
extracted with ether and after drying we obtained the title product as transparent oil in 91% yield.
1H NMR (400 MHz, CDCl3) δ 7.71 (d, J = 4.7 Hz, 1H), 7.30 (m, 2H), 1.64 (dd, J = 15.7, 8.0 Hz,
6H), 1.42 (dq, J = 14.8, 7.4 Hz, 6H), 1.22 – 1.15 (m, 6H), 0.97 (t, J = 7.3 Hz, 9H).
5-Bromo-2-dicyanovinylthiophene152
5-Bromothiophene-2-carboxaldehyde (2.5 ml g, 20.94 mmol), malononitrile
(2.64 ml, 41.88 mmol), and basic aluminum oxide (9.9 g) were stirred in
toluene (190 ml) for 6 h and 30 min at 70 °C. After cooling and stirring at
room temperature overnight, the reaction solution was diluted with toluene and filtered through a
pad of silica gel, and the solvent of the filtrate was removed in vacuum. The crude product was
purified by recrystallisation from ethanol to give yellow solid in 67% yield: 1H NMR (400 MHz,
CDCl3) δ 7.76 (s, 1H), 7.52 (d, J = 4.0 Hz, 1H), 7.26 (d, J = 4.1 Hz, 1H).
5-dicyanovinyl-2,2’-bithiophene151
A degassed solution of the 5-bromo-2-dicyanovinylthiophene (3.058 g,
12.8 mmol), the 2-(tri-n-butylstannyl)thiophene (4.77 g, 12.8 mmol) and
Pd(PPh3)4 (0.233 mmol) in toluene (45 ml) was heated at 80 °C under
argon. After 24 h the reaction mixture was cooled to room temperature, filtered and washed with a
cold mixture of petroleum ether to give the pure 5-dicyanovinyl-2,2’-bithiophene as a pale orange
solid in 97% of yield. 1H NMR (400 MHz, CDCl3) δ 7.78 (s, 1H), 7.66 (d, J = 4.1 Hz, 1H), 7.46 (d,
J = 4.1 Hz, 2H), 7.31 (d, J = 4.0 Hz, 1H), 7.14 (t, J = 4.5 Hz, 1H).
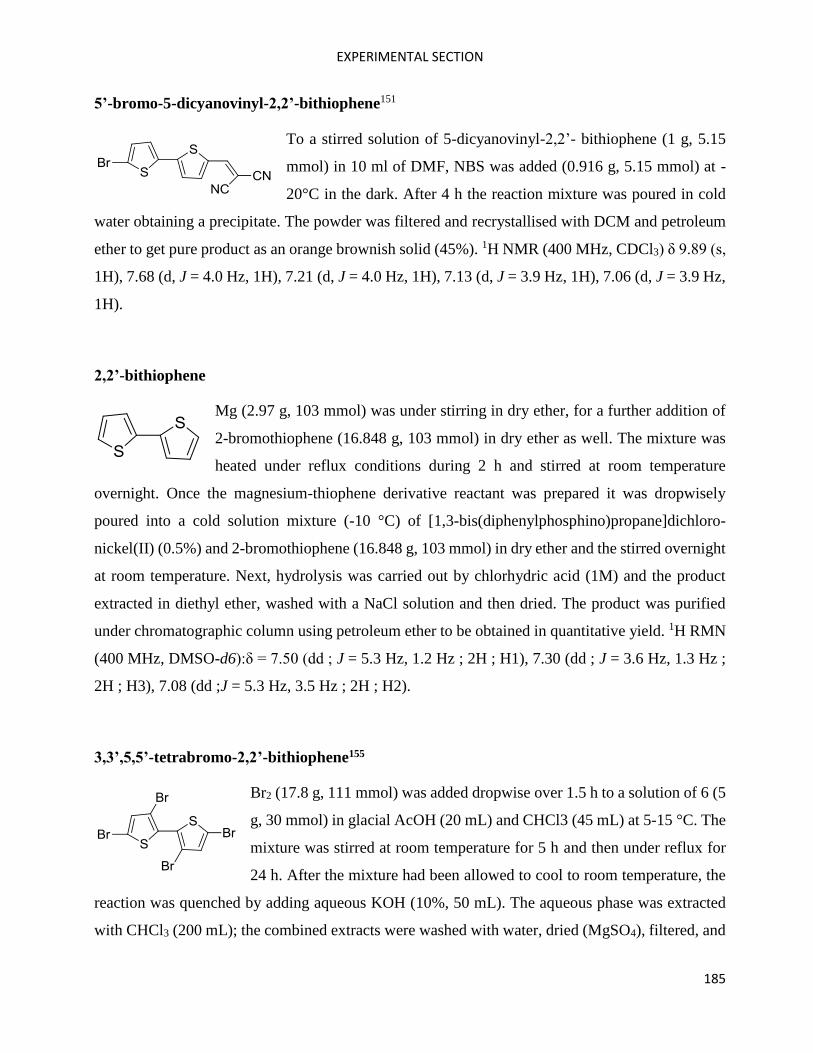
EXPERIMENTAL SECTION
185
5’-bromo-5-dicyanovinyl-2,2’-bithiophene151
To a stirred solution of 5-dicyanovinyl-2,2’- bithiophene (1 g, 5.15
mmol) in 10 ml of DMF, NBS was added (0.916 g, 5.15 mmol) at -
20°C in the dark. After 4 h the reaction mixture was poured in cold
water obtaining a precipitate. The powder was filtered and recrystallised with DCM and petroleum
ether to get pure product as an orange brownish solid (45%). 1H NMR (400 MHz, CDCl3) δ 9.89 (s,
1H), 7.68 (d, J = 4.0 Hz, 1H), 7.21 (d, J = 4.0 Hz, 1H), 7.13 (d, J = 3.9 Hz, 1H), 7.06 (d, J = 3.9 Hz,
1H).
2,2’-bithiophene
Mg (2.97 g, 103 mmol) was under stirring in dry ether, for a further addition of
2-bromothiophene (16.848 g, 103 mmol) in dry ether as well. The mixture was
heated under reflux conditions during 2 h and stirred at room temperature
overnight. Once the magnesium-thiophene derivative reactant was prepared it was dropwisely
poured into a cold solution mixture (-10 °C) of [1,3-bis(diphenylphosphino)propane]dichloro-
nickel(II) (0.5%) and 2-bromothiophene (16.848 g, 103 mmol) in dry ether and the stirred overnight
at room temperature. Next, hydrolysis was carried out by chlorhydric acid (1M) and the product
extracted in diethyl ether, washed with a NaCl solution and then dried. The product was purified
under chromatographic column using petroleum ether to be obtained in quantitative yield. 1H RMN
(400 MHz, DMSO-d6):δ = 7.50 (dd ; J = 5.3 Hz, 1.2 Hz ; 2H ; H1), 7.30 (dd ; J = 3.6 Hz, 1.3 Hz ;
2H ; H3), 7.08 (dd ;J = 5.3 Hz, 3.5 Hz ; 2H ; H2).
3,3’,5,5’-tetrabromo-2,2’-bithiophene155
Br2 (17.8 g, 111 mmol) was added dropwise over 1.5 h to a solution of 6 (5
g, 30 mmol) in glacial AcOH (20 mL) and CHCl3 (45 mL) at 5-15 °C. The
mixture was stirred at room temperature for 5 h and then under reflux for
24 h. After the mixture had been allowed to cool to room temperature, the
reaction was quenched by adding aqueous KOH (10%, 50 mL). The aqueous phase was extracted
with CHCl3 (200 mL); the combined extracts were washed with water, dried (MgSO4), filtered, and
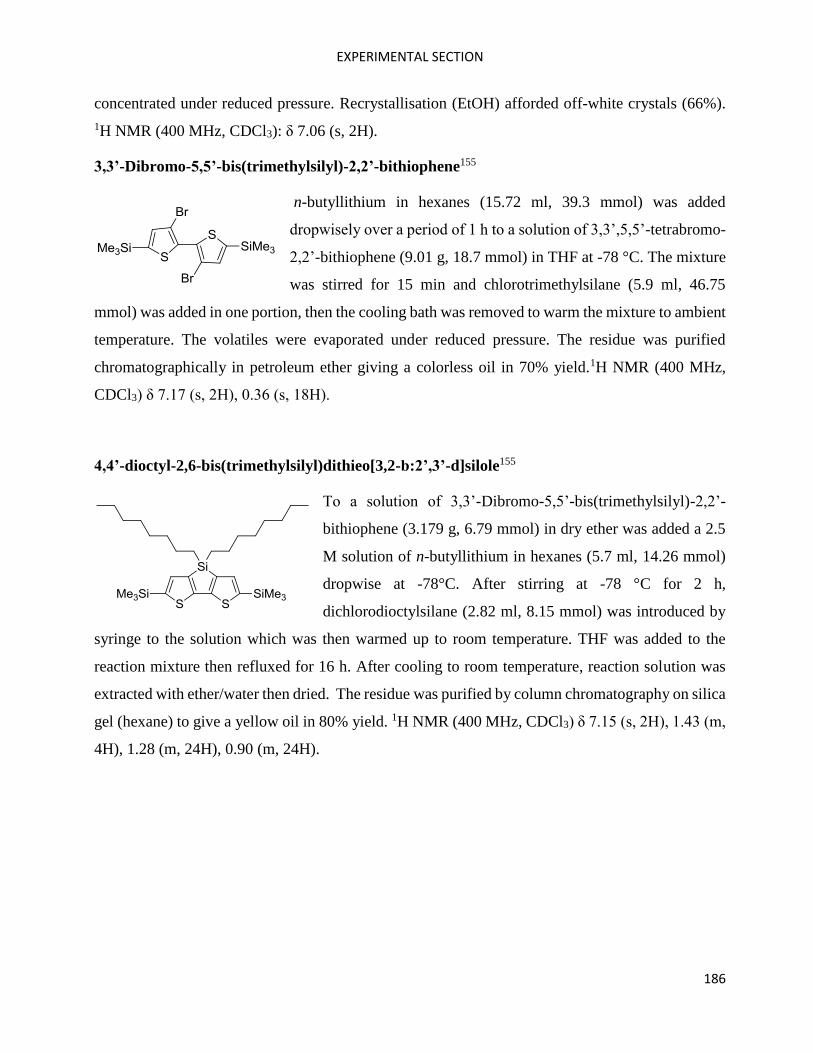
EXPERIMENTAL SECTION
186
concentrated under reduced pressure. Recrystallisation (EtOH) afforded off-white crystals (66%).
1H NMR (400 MHz, CDCl3): δ 7.06 (s, 2H).
3,3’-Dibromo-5,5’-bis(trimethylsilyl)-2,2’-bithiophene155
n-butyllithium in hexanes (15.72 ml, 39.3 mmol) was added
dropwisely over a period of 1 h to a solution of 3,3’,5,5’-tetrabromo-
2,2’-bithiophene (9.01 g, 18.7 mmol) in THF at -78 °C. The mixture
was stirred for 15 min and chlorotrimethylsilane (5.9 ml, 46.75
mmol) was added in one portion, then the cooling bath was removed to warm the mixture to ambient
temperature. The volatiles were evaporated under reduced pressure. The residue was purified
chromatographically in petroleum ether giving a colorless oil in 70% yield.1H NMR (400 MHz,
CDCl3) δ 7.17 (s, 2H), 0.36 (s, 18H).
4,4’-dioctyl-2,6-bis(trimethylsilyl)dithieo[3,2-b:2’,3’-d]silole155
To a solution of 3,3’-Dibromo-5,5’-bis(trimethylsilyl)-2,2’-
bithiophene (3.179 g, 6.79 mmol) in dry ether was added a 2.5
M solution of n-butyllithium in hexanes (5.7 ml, 14.26 mmol)
dropwise at -78°C. After stirring at -78 °C for 2 h,
dichlorodioctylsilane (2.82 ml, 8.15 mmol) was introduced by
syringe to the solution which was then warmed up to room temperature. THF was added to the
reaction mixture then refluxed for 16 h. After cooling to room temperature, reaction solution was
extracted with ether/water then dried. The residue was purified by column chromatography on silica
gel (hexane) to give a yellow oil in 80% yield. 1H NMR (400 MHz, CDCl3) δ 7.15 (s, 2H), 1.43 (m,
4H), 1.28 (m, 24H), 0.90 (m, 24H).
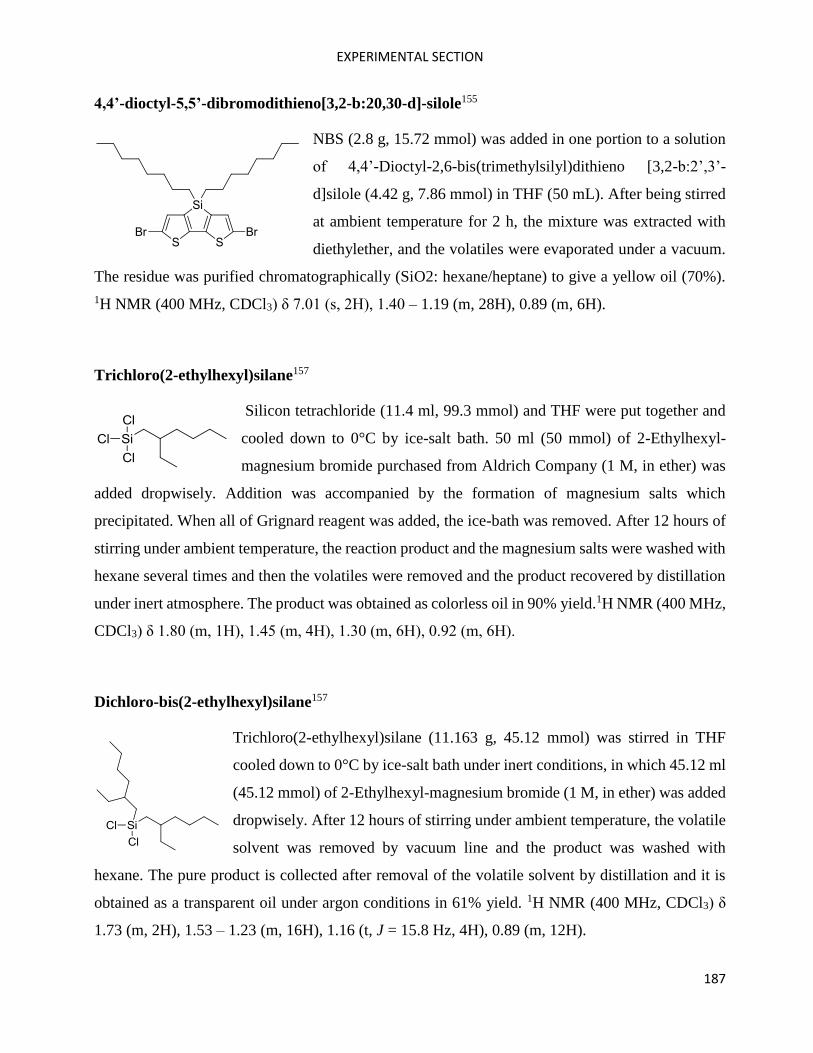
EXPERIMENTAL SECTION
187
4,4’-dioctyl-5,5’-dibromodithieno[3,2-b:20,30-d]-silole155
NBS (2.8 g, 15.72 mmol) was added in one portion to a solution
of 4,4’-Dioctyl-2,6-bis(trimethylsilyl)dithieno [3,2-b:2’,3’-
d]silole (4.42 g, 7.86 mmol) in THF (50 mL). After being stirred
at ambient temperature for 2 h, the mixture was extracted with
diethylether, and the volatiles were evaporated under a vacuum.
The residue was purified chromatographically (SiO2: hexane/heptane) to give a yellow oil (70%).
1H NMR (400 MHz, CDCl3) δ 7.01 (s, 2H), 1.40 – 1.19 (m, 28H), 0.89 (m, 6H).
Trichloro(2-ethylhexyl)silane157
Silicon tetrachloride (11.4 ml, 99.3 mmol) and THF were put together and
cooled down to 0°C by ice-salt bath. 50 ml (50 mmol) of 2-Ethylhexyl-
magnesium bromide purchased from Aldrich Company (1 M, in ether) was
added dropwisely. Addition was accompanied by the formation of magnesium salts which
precipitated. When all of Grignard reagent was added, the ice-bath was removed. After 12 hours of
stirring under ambient temperature, the reaction product and the magnesium salts were washed with
hexane several times and then the volatiles were removed and the product recovered by distillation
under inert atmosphere. The product was obtained as colorless oil in 90% yield.1H NMR (400 MHz,
CDCl3) δ 1.80 (m, 1H), 1.45 (m, 4H), 1.30 (m, 6H), 0.92 (m, 6H).
Dichloro-bis(2-ethylhexyl)silane157
Trichloro(2-ethylhexyl)silane (11.163 g, 45.12 mmol) was stirred in THF
cooled down to 0°C by ice-salt bath under inert conditions, in which 45.12 ml
(45.12 mmol) of 2-Ethylhexyl-magnesium bromide (1 M, in ether) was added
dropwisely. After 12 hours of stirring under ambient temperature, the volatile
solvent was removed by vacuum line and the product was washed with
hexane. The pure product is collected after removal of the volatile solvent by distillation and it is
obtained as a transparent oil under argon conditions in 61% yield. 1H NMR (400 MHz, CDCl3) δ
1.73 (m, 2H), 1.53 – 1.23 (m, 16H), 1.16 (t, J = 15.8 Hz, 4H), 0.89 (m, 12H).
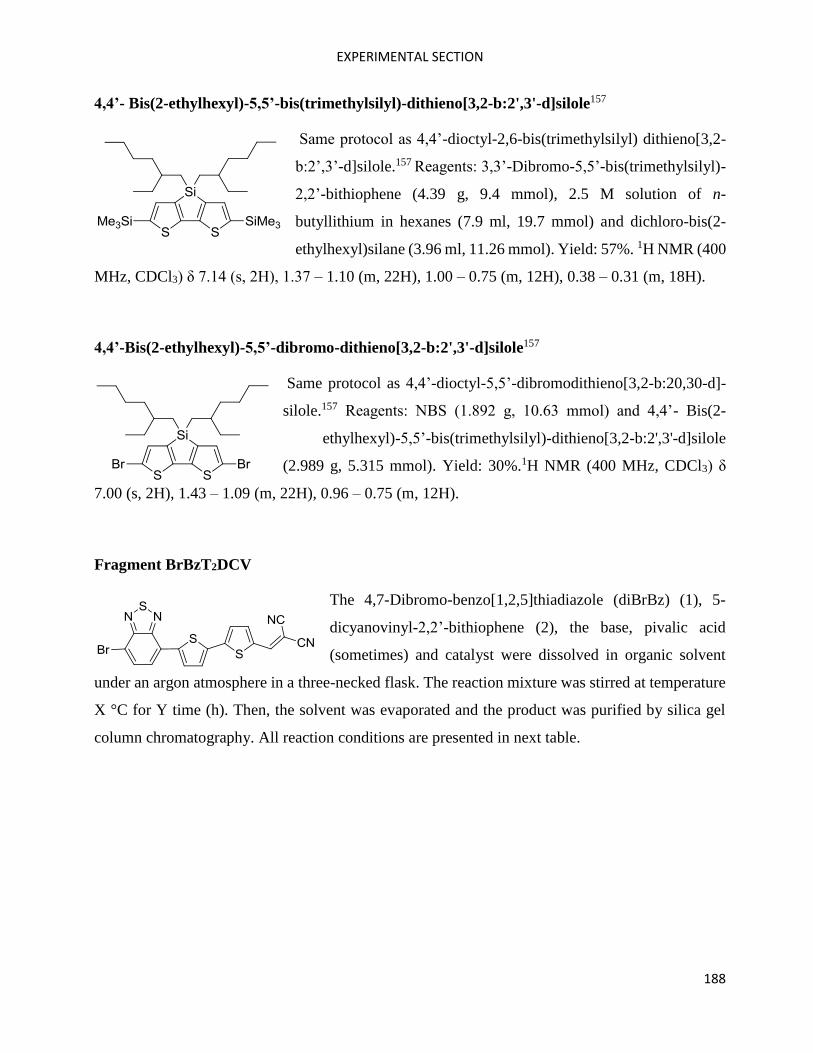
EXPERIMENTAL SECTION
188
4,4’- Bis(2-ethylhexyl)-5,5’-bis(trimethylsilyl)-dithieno[3,2-b:2',3'-d]silole157
Same protocol as 4,4’-dioctyl-2,6-bis(trimethylsilyl) dithieno[3,2-
b:2’,3’-d]silole.157 Reagents: 3,3’-Dibromo-5,5’-bis(trimethylsilyl)-
2,2’-bithiophene (4.39 g, 9.4 mmol), 2.5 M solution of n-
butyllithium in hexanes (7.9 ml, 19.7 mmol) and dichloro-bis(2-
ethylhexyl)silane (3.96 ml, 11.26 mmol). Yield: 57%. 1H NMR (400
MHz, CDCl3) δ 7.14 (s, 2H), 1.37 – 1.10 (m, 22H), 1.00 – 0.75 (m, 12H), 0.38 – 0.31 (m, 18H).
4,4’-Bis(2-ethylhexyl)-5,5’-dibromo-dithieno[3,2-b:2',3'-d]silole157
Same protocol as 4,4’-dioctyl-5,5’-dibromodithieno[3,2-b:20,30-d]-
silole.157 Reagents: NBS (1.892 g, 10.63 mmol) and 4,4’- Bis(2-
ethylhexyl)-5,5’-bis(trimethylsilyl)-dithieno[3,2-b:2',3'-d]silole
(2.989 g, 5.315 mmol). Yield: 30%.1H NMR (400 MHz, CDCl3) δ
7.00 (s, 2H), 1.43 – 1.09 (m, 22H), 0.96 – 0.75 (m, 12H).
Fragment BrBzT2DCV
The 4,7-Dibromo-benzo[1,2,5]thiadiazole (diBrBz) (1), 5-
dicyanovinyl-2,2’-bithiophene (2), the base, pivalic acid
(sometimes) and catalyst were dissolved in organic solvent
under an argon atmosphere in a three-necked flask. The reaction mixture was stirred at temperature
X °C for Y time (h). Then, the solvent was evaporated and the product was purified by silica gel
column chromatography. All reaction conditions are presented in next table.
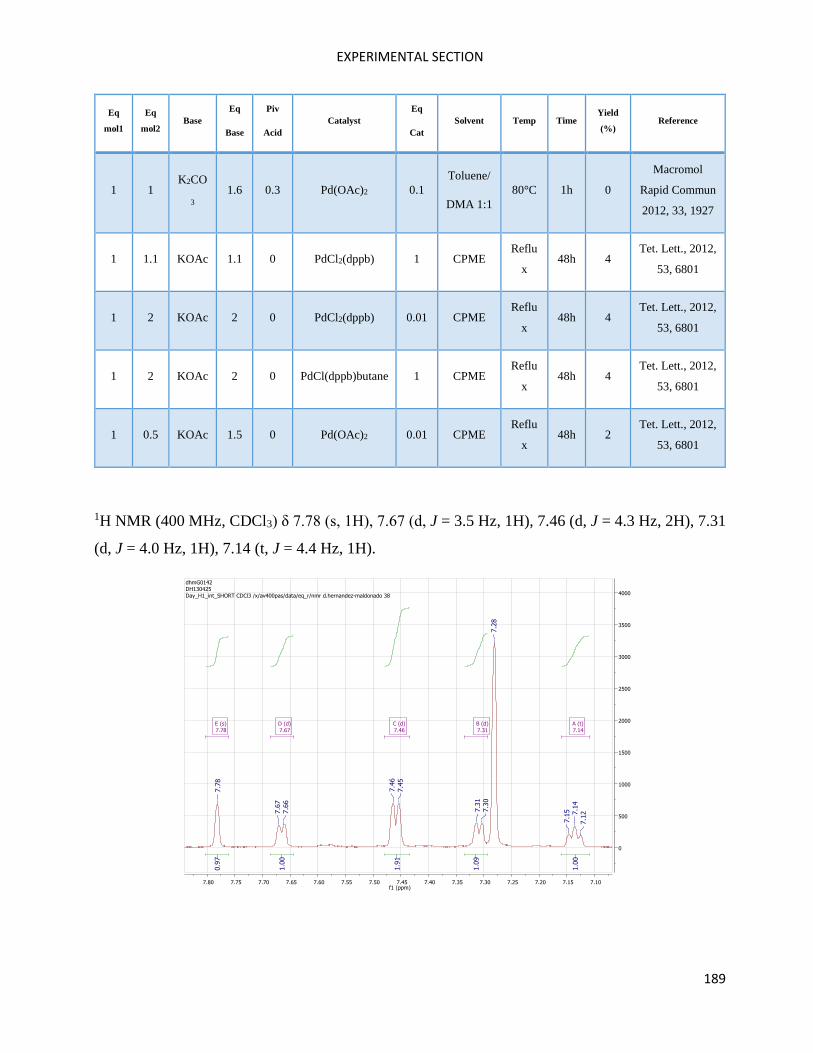
EXPERIMENTAL SECTION
189
Eq
mol1
Eq
mol2 Base
Eq
Base
Piv
Acid
Catalyst
Eq
Cat
Solvent Temp Time Yield
(%) Reference
1 1 K2CO
3 1.6 0.3 Pd(OAc)2 0.1
Toluene/
DMA 1:1
80°C 1h 0
Macromol
Rapid Commun
2012, 33, 1927
1 1.1 KOAc 1.1 0 PdCl2(dppb) 1 CPME Reflu
x 48h 4
Tet. Lett., 2012,
53, 6801
1 2 KOAc 2 0 PdCl2(dppb) 0.01 CPME Reflu
x 48h 4
Tet. Lett., 2012,
53, 6801
1 2 KOAc 2 0 PdCl(dppb)butane 1 CPME Reflu
x 48h 4
Tet. Lett., 2012,
53, 6801
1 0.5 KOAc 1.5 0 Pd(OAc)2 0.01 CPME Reflu
x 48h 2
Tet. Lett., 2012,
53, 6801
1H NMR (400 MHz, CDCl3) δ 7.78 (s, 1H), 7.67 (d, J = 3.5 Hz, 1H), 7.46 (d, J = 4.3 Hz, 2H), 7.31
(d, J = 4.0 Hz, 1H), 7.14 (t, J = 4.4 Hz, 1H).
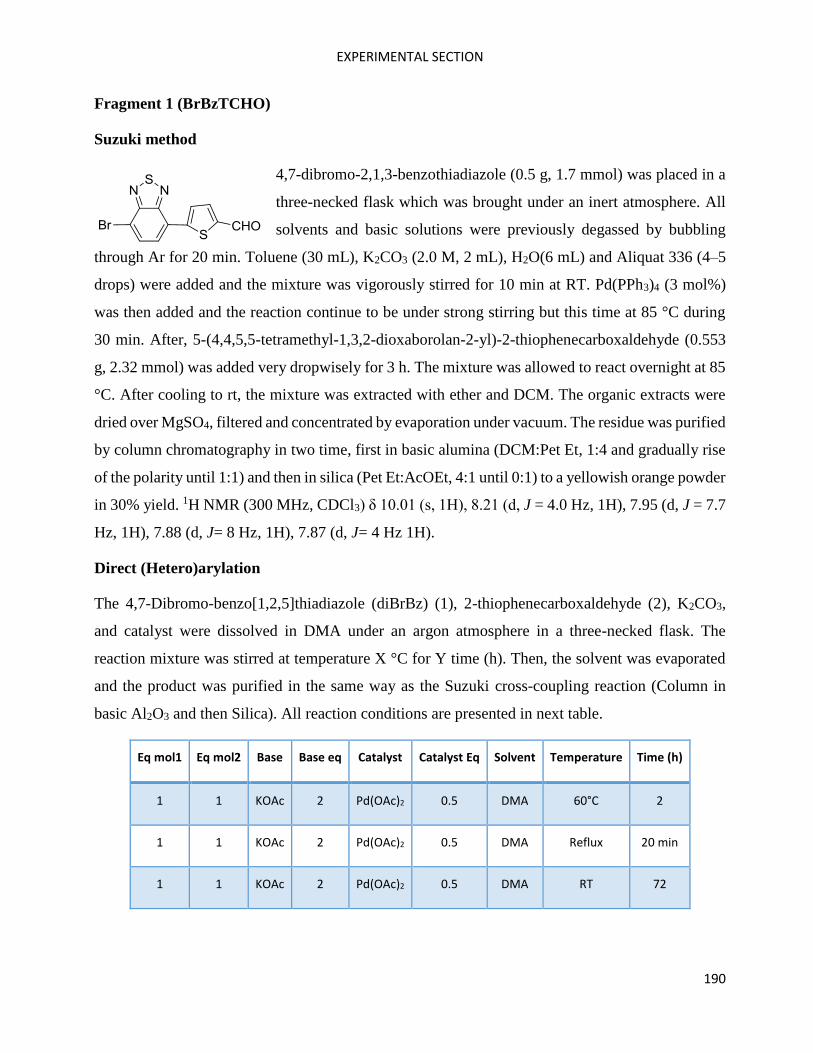
EXPERIMENTAL SECTION
190
Fragment 1 (BrBzTCHO)
Suzuki method
4,7-dibromo-2,1,3-benzothiadiazole (0.5 g, 1.7 mmol) was placed in a
three-necked flask which was brought under an inert atmosphere. All
solvents and basic solutions were previously degassed by bubbling
through Ar for 20 min. Toluene (30 mL), K2CO3 (2.0 M, 2 mL), H2O(6 mL) and Aliquat 336 (4–5
drops) were added and the mixture was vigorously stirred for 10 min at RT. Pd(PPh3)4 (3 mol%)
was then added and the reaction continue to be under strong stirring but this time at 85 °C during
30 min. After, 5-(4,4,5,5-tetramethyl-1,3,2-dioxaborolan-2-yl)-2-thiophenecarboxaldehyde (0.553
g, 2.32 mmol) was added very dropwisely for 3 h. The mixture was allowed to react overnight at 85
°C. After cooling to rt, the mixture was extracted with ether and DCM. The organic extracts were
dried over MgSO4, filtered and concentrated by evaporation under vacuum. The residue was purified
by column chromatography in two time, first in basic alumina (DCM:Pet Et, 1:4 and gradually rise
of the polarity until 1:1) and then in silica (Pet Et:AcOEt, 4:1 until 0:1) to a yellowish orange powder
in 30% yield. 1H NMR (300 MHz, CDCl3) δ 10.01 (s, 1H), 8.21 (d, J = 4.0 Hz, 1H), 7.95 (d, J = 7.7
Hz, 1H), 7.88 (d, J= 8 Hz, 1H), 7.87 (d, J= 4 Hz 1H).
Direct (Hetero)arylation
The 4,7-Dibromo-benzo[1,2,5]thiadiazole (diBrBz) (1), 2-thiophenecarboxaldehyde (2), K2CO3,
and catalyst were dissolved in DMA under an argon atmosphere in a three-necked flask. The
reaction mixture was stirred at temperature X °C for Y time (h). Then, the solvent was evaporated
and the product was purified in the same way as the Suzuki cross-coupling reaction (Column in
basic Al2O3 and then Silica). All reaction conditions are presented in next table.
Eq mol1 Eq mol2 Base Base eq Catalyst Catalyst Eq Solvent Temperature Time (h)
1 1 KOAc 2 Pd(OAc)2 0.5 DMA 60°C 2
1 1 KOAc 2 Pd(OAc)2 0.5 DMA Reflux 20 min
1 1 KOAc 2 Pd(OAc)2 0.5 DMA RT 72
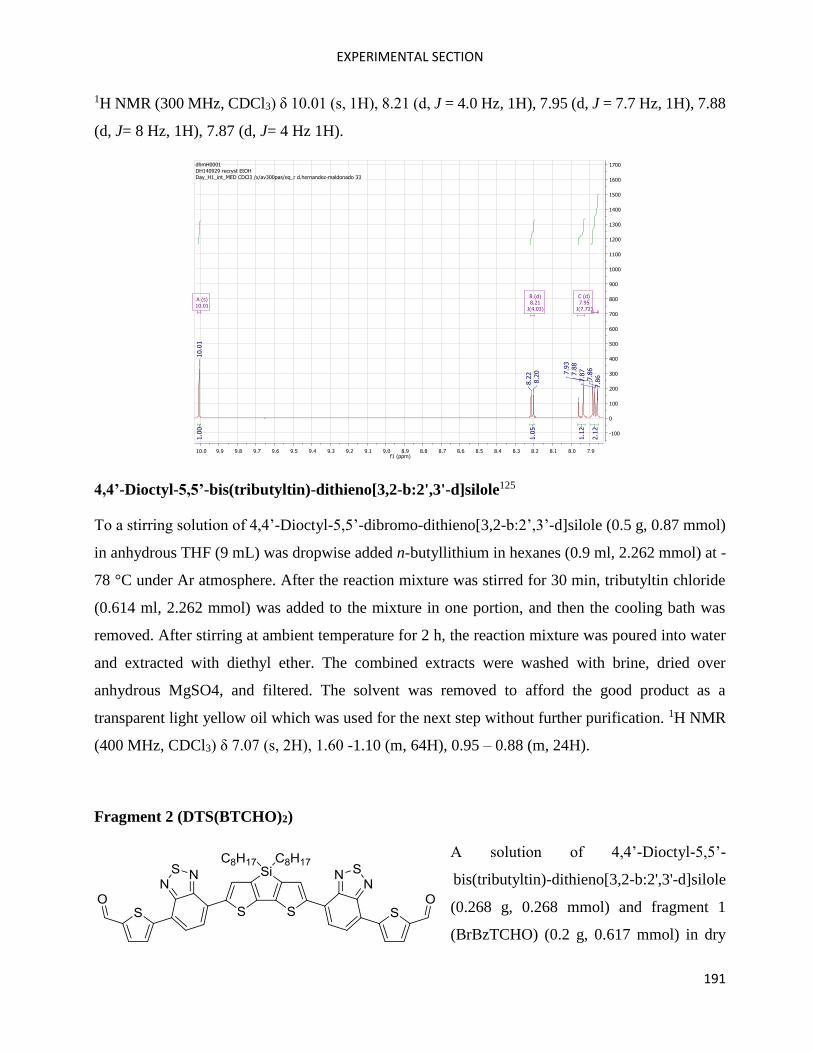
EXPERIMENTAL SECTION
191
1H NMR (300 MHz, CDCl3) δ 10.01 (s, 1H), 8.21 (d, J = 4.0 Hz, 1H), 7.95 (d, J = 7.7 Hz, 1H), 7.88
(d, J= 8 Hz, 1H), 7.87 (d, J= 4 Hz 1H).
4,4’-Dioctyl-5,5’-bis(tributyltin)-dithieno[3,2-b:2',3'-d]silole125
To a stirring solution of 4,4’-Dioctyl-5,5’-dibromo-dithieno[3,2-b:2’,3’-d]silole (0.5 g, 0.87 mmol)
in anhydrous THF (9 mL) was dropwise added n-butyllithium in hexanes (0.9 ml, 2.262 mmol) at -
78 °C under Ar atmosphere. After the reaction mixture was stirred for 30 min, tributyltin chloride
(0.614 ml, 2.262 mmol) was added to the mixture in one portion, and then the cooling bath was
removed. After stirring at ambient temperature for 2 h, the reaction mixture was poured into water
and extracted with diethyl ether. The combined extracts were washed with brine, dried over
anhydrous MgSO4, and filtered. The solvent was removed to afford the good product as a
transparent light yellow oil which was used for the next step without further purification. 1H NMR
(400 MHz, CDCl3) δ 7.07 (s, 2H), 1.60 -1.10 (m, 64H), 0.95 – 0.88 (m, 24H).
Fragment 2 (DTS(BTCHO)2)
A solution of 4,4’-Dioctyl-5,5’-
bis(tributyltin)-dithieno[3,2-b:2',3'-d]silole
(0.268 g, 0.268 mmol) and fragment 1
(BrBzTCHO) (0.2 g, 0.617 mmol) in dry
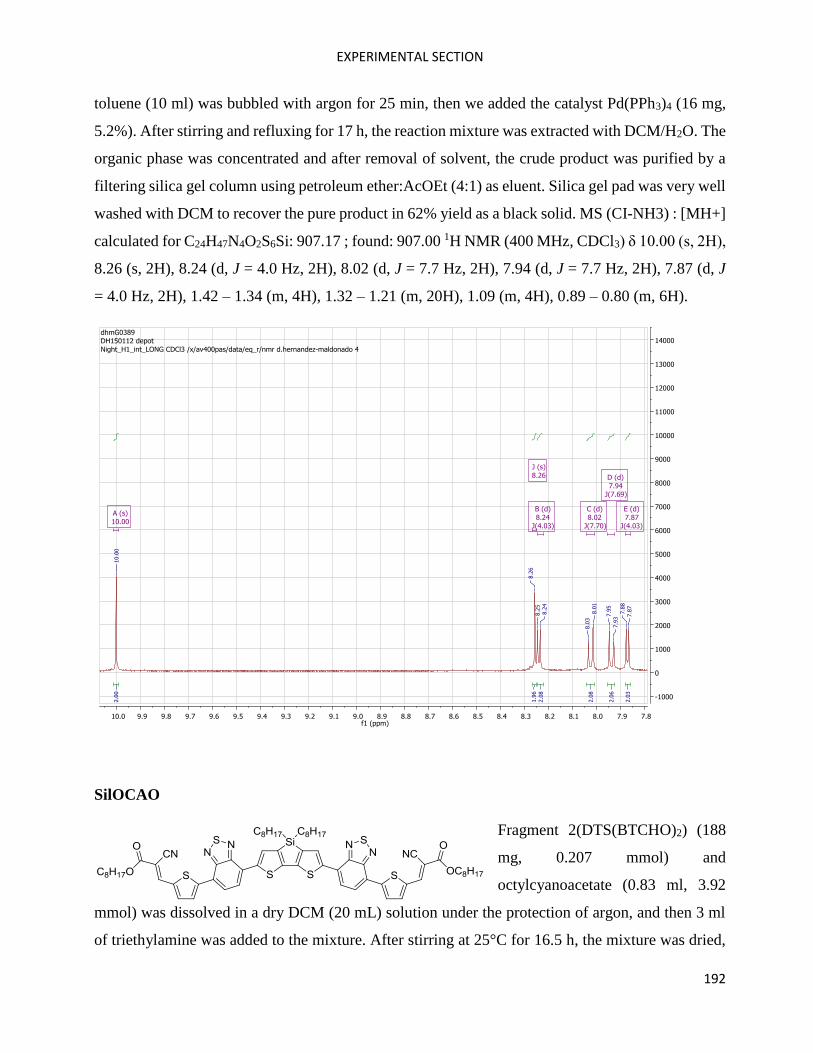
EXPERIMENTAL SECTION
192
toluene (10 ml) was bubbled with argon for 25 min, then we added the catalyst Pd(PPh3)4 (16 mg,
5.2%). After stirring and refluxing for 17 h, the reaction mixture was extracted with DCM/H2O. The
organic phase was concentrated and after removal of solvent, the crude product was purified by a
filtering silica gel column using petroleum ether:AcOEt (4:1) as eluent. Silica gel pad was very well
washed with DCM to recover the pure product in 62% yield as a black solid. MS (CI-NH3) : [MH+]
calculated for C24H47N4O2S6Si: 907.17 ; found: 907.00 1H NMR (400 MHz, CDCl3) δ 10.00 (s, 2H),
8.26 (s, 2H), 8.24 (d, J = 4.0 Hz, 2H), 8.02 (d, J = 7.7 Hz, 2H), 7.94 (d, J = 7.7 Hz, 2H), 7.87 (d, J
= 4.0 Hz, 2H), 1.42 – 1.34 (m, 4H), 1.32 – 1.21 (m, 20H), 1.09 (m, 4H), 0.89 – 0.80 (m, 6H).
SilOCAO
Fragment 2(DTS(BTCHO)2) (188
mg, 0.207 mmol) and
octylcyanoacetate (0.83 ml, 3.92
mmol) was dissolved in a dry DCM (20 mL) solution under the protection of argon, and then 3 ml
of triethylamine was added to the mixture. After stirring at 25°C for 16.5 h, the mixture was dried,
EXPERIMENTAL SECTION
193
we removed the solvent, and the crude product was filtered through a silica gel column using Pet
Et:AcOEt 1)100:0, 2)80:20, 3)50:50 and 4) 0:100 as eluent. Silica gel pad was very well washed
with DCM to recover the pure product in 32% yield as thin black layers with metallic aspect. 1H
NMR (400 MHz, CDCl3) δ 8.37 (s, 2H), 8.29 (d, J = 4.1 Hz, 2H), 8.26 (s, 2H), 8.06 (d, J = 7.8 Hz,
2H), 7.94 (d, J = 7.7 Hz, 2H), 7.92 (d, J = 4.4 Hz, 2H), 4.34 (t, J = 6.8 Hz, 4H), 1.43 – 1.20 (m,
56H), 0.95 – 0.81 (m, 12H).
Bz(TCHO)2
5-Bromo-2-thiophenecarboxaldehyde (0.314 g, 1.64 mmol)
and 2,1,3-benzothiadiazole-4,7-bis(boronic acid pinacol
ester) (0.247 g, 0.637 mmol) were placed in three-necked
flask which was brought under an inert atmosphere. All solvents and basic solutions were previously
degassed by bubbling through Argon for 20 min. Toluene (10 mL), K2CO3 (2.0 M, 5 mL), H2O (4
mL) and Aliquat 336 (4–5 drops) were added and the mixture was vigorously stirred for 20 min at
rt. Pd(PPh3)4 (2.6 mol%) was then added and the mixture was allowed to react for 24 hours at 80
°C. After cooling to rt, the solid crude mixture was filtered and then, washed with distilled water,
ethyl acetate and petroleum ether. The powder recovered was used as obtained after washing and it
was very pure (0.230 g, 100%). 1H NMR (400 MHz, CDCl3) δ 10.02 (s, 2H), 8.29 (d, J = 4 Hz, 2H),
8.08 (s, 2H), 7.90 (d, J = 4 Hz, 2H).
Bz(T1CAEH)2 and Bz(T1CAO)2
Ethylhexyl: To a three-necked round bottom flask were
added Bz(TCHO)2 (230 mg, 0.646 mmol) and
dichloromethane (50 mL). The mixture was deoxygenated
with Argon for 20 min. Triethylamine (3 mL) and 2-ethylhexyl cyanoacetate (2.5 mL, 12.3 mmol)
were added successively. The mixture was stirred at room temperature for 48 h. After removing the
solvent from the mixture, the powder obtained was washed with petroleum ether, filtered and then
washed with ethyl acetate under reflux. The powder recovered after filtration was purified by 3
column chromatography on silica gel using petroleum ether-ethylacetate (starting 85 : 15 and
finishing 0 : 100) as the eluent yielding a dark solid (100 mg, 22%). MS (CI-NH3): [M+NH4]+ calcd
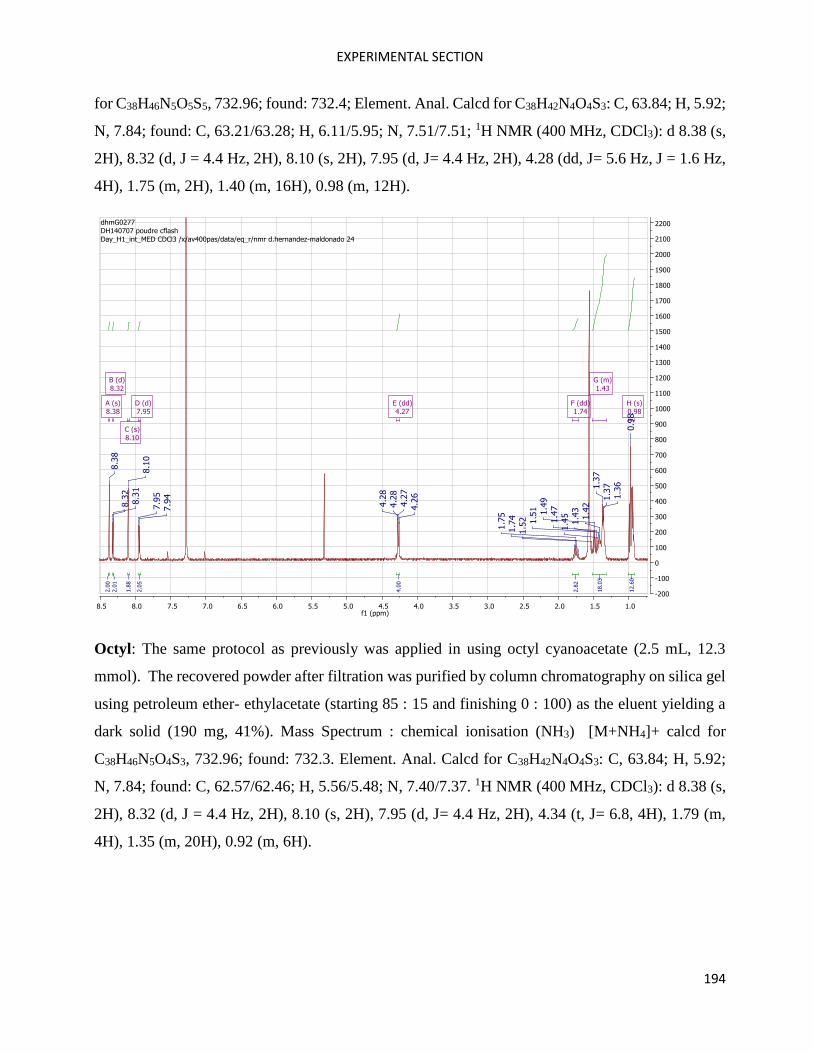
EXPERIMENTAL SECTION
194
for C38H46N5O5S5, 732.96; found: 732.4; Element. Anal. Calcd for C38H42N4O4S3: C, 63.84; H, 5.92;
N, 7.84; found: C, 63.21/63.28; H, 6.11/5.95; N, 7.51/7.51; 1H NMR (400 MHz, CDCl3): d 8.38 (s,
2H), 8.32 (d, J = 4.4 Hz, 2H), 8.10 (s, 2H), 7.95 (d, J= 4.4 Hz, 2H), 4.28 (dd, J= 5.6 Hz, J = 1.6 Hz,
4H), 1.75 (m, 2H), 1.40 (m, 16H), 0.98 (m, 12H).
Octyl: The same protocol as previously was applied in using octyl cyanoacetate (2.5 mL, 12.3
mmol). The recovered powder after filtration was purified by column chromatography on silica gel
using petroleum ether- ethylacetate (starting 85 : 15 and finishing 0 : 100) as the eluent yielding a
dark solid (190 mg, 41%). Mass Spectrum : chemical ionisation (NH3) [M+NH4]+ calcd for
C38H46N5O4S3, 732.96; found: 732.3. Element. Anal. Calcd for C38H42N4O4S3: C, 63.84; H, 5.92;
N, 7.84; found: C, 62.57/62.46; H, 5.56/5.48; N, 7.40/7.37. 1H NMR (400 MHz, CDCl3): d 8.38 (s,
2H), 8.32 (d, J = 4.4 Hz, 2H), 8.10 (s, 2H), 7.95 (d, J= 4.4 Hz, 2H), 4.34 (t, J= 6.8, 4H), 1.79 (m,
4H), 1.35 (m, 20H), 0.92 (m, 6H).
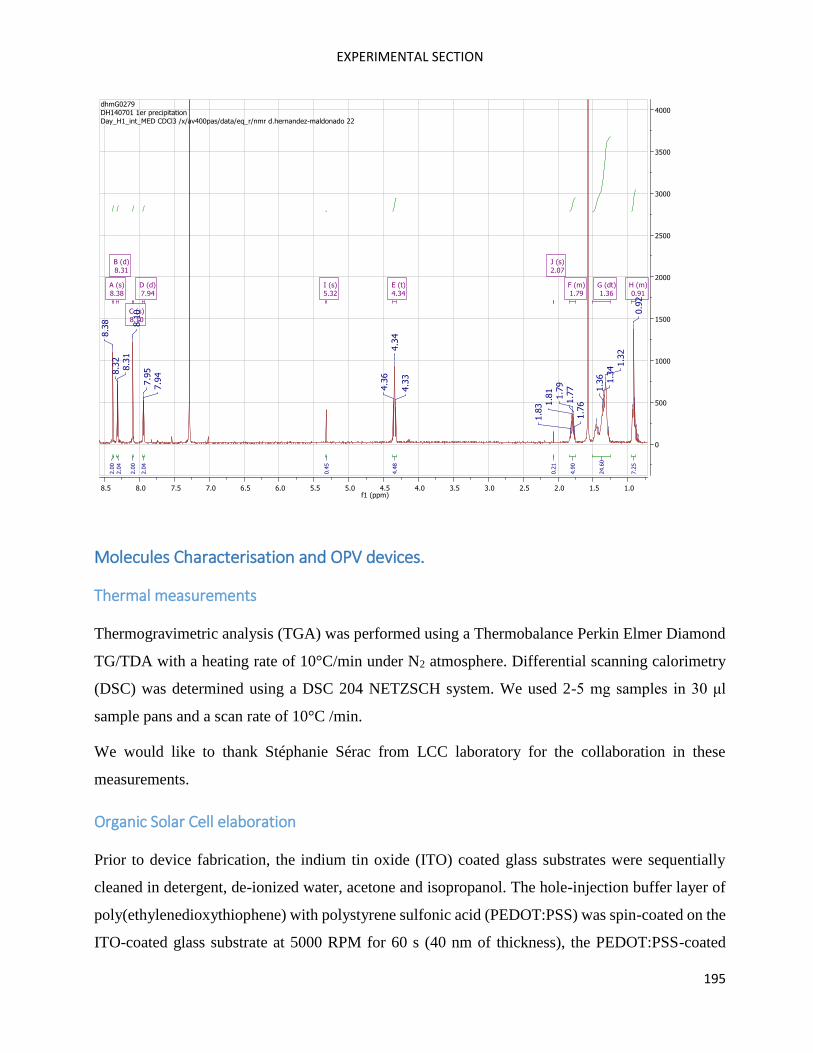
EXPERIMENTAL SECTION
195
Molecules Characterisation and OPV devices.
Thermal measurements
Thermogravimetric analysis (TGA) was performed using a Thermobalance Perkin Elmer Diamond
TG/TDA with a heating rate of 10°C/min under N2 atmosphere. Differential scanning calorimetry
(DSC) was determined using a DSC 204 NETZSCH system. We used 2-5 mg samples in 30 μl
sample pans and a scan rate of 10°C /min.
We would like to thank Stéphanie Sérac from LCC laboratory for the collaboration in these
measurements.
Organic Solar Cell elaboration
Prior to device fabrication, the indium tin oxide (ITO) coated glass substrates were sequentially
cleaned in detergent, de-ionized water, acetone and isopropanol. The hole-injection buffer layer of
poly(ethylenedioxythiophene) with polystyrene sulfonic acid (PEDOT:PSS) was spin-coated on the
ITO-coated glass substrate at 5000 RPM for 60 s (40 nm of thickness), the PEDOT:PSS-coated
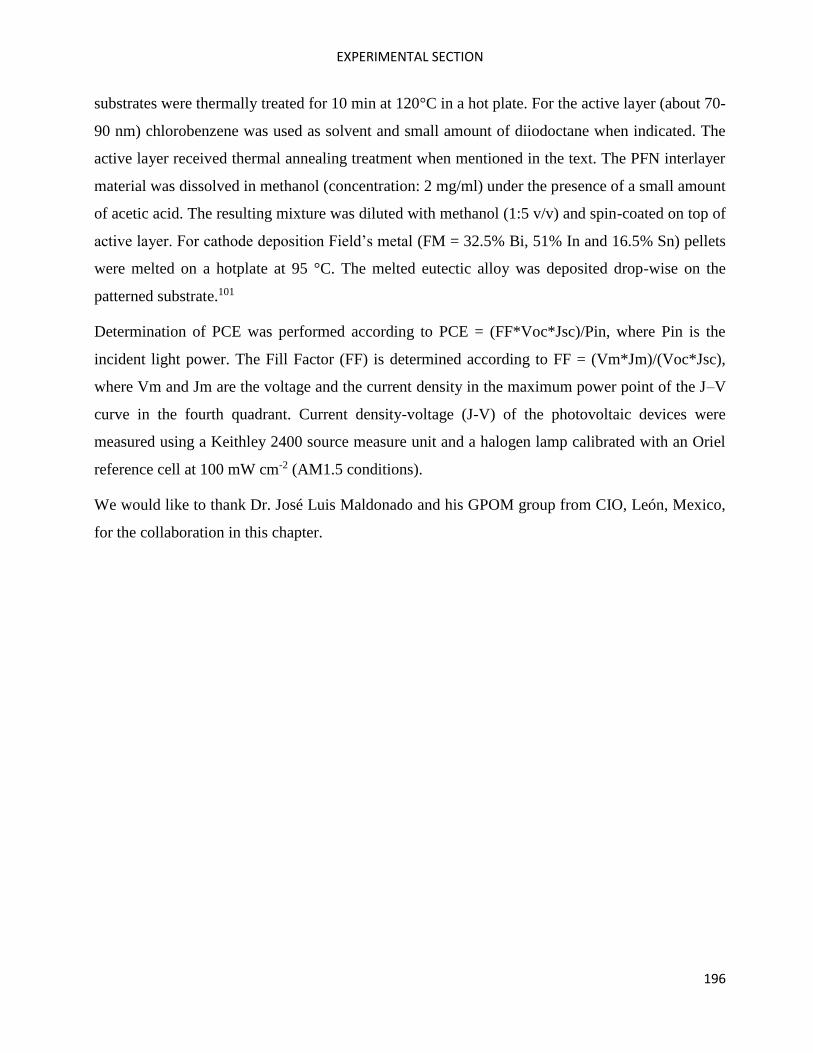
EXPERIMENTAL SECTION
196
substrates were thermally treated for 10 min at 120°C in a hot plate. For the active layer (about 70-
90 nm) chlorobenzene was used as solvent and small amount of diiodoctane when indicated. The
active layer received thermal annealing treatment when mentioned in the text. The PFN interlayer
material was dissolved in methanol (concentration: 2 mg/ml) under the presence of a small amount
of acetic acid. The resulting mixture was diluted with methanol (1:5 v/v) and spin-coated on top of
active layer. For cathode deposition Field’s metal (FM = 32.5% Bi, 51% In and 16.5% Sn) pellets
were melted on a hotplate at 95 °C. The melted eutectic alloy was deposited drop-wise on the
patterned substrate.101
Determination of PCE was performed according to PCE = (FF*Voc*Jsc)/Pin, where Pin is the
incident light power. The Fill Factor (FF) is determined according to FF = (Vm*Jm)/(Voc*Jsc),
where Vm and Jm are the voltage and the current density in the maximum power point of the J–V
curve in the fourth quadrant. Current density-voltage (J-V) of the photovoltaic devices were
measured using a Keithley 2400 source measure unit and a halogen lamp calibrated with an Oriel
reference cell at 100 mW cm-2 (AM1.5 conditions).
We would like to thank Dr. José Luis Maldonado and his GPOM group from CIO, León, Mexico,
for the collaboration in this chapter.

ANNEXES
197
Annexes

ANNEXES
198
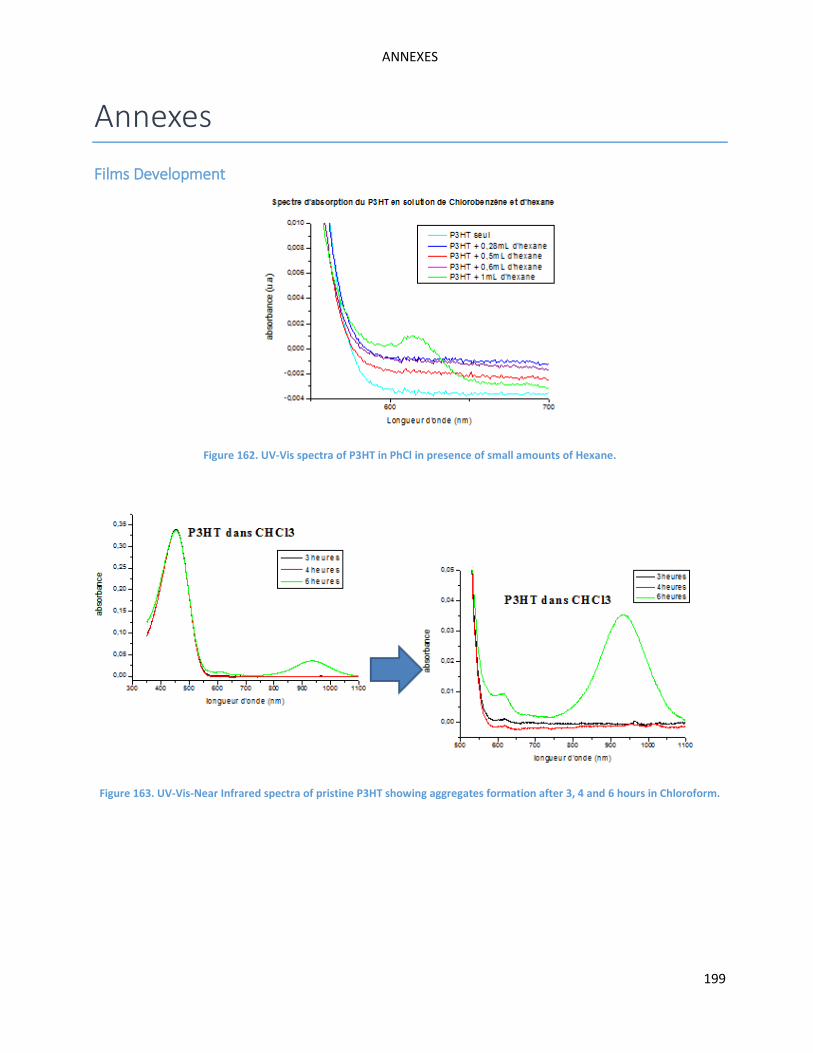
ANNEXES
199
Annexes
Films Development
Figure 162. UV-Vis spectra of P3HT in PhCl in presence of small amounts of Hexane.
Figure 163. UV-Vis-Near Infrared spectra of pristine P3HT showing aggregates formation after 3, 4 and 6 hours in Chloroform.
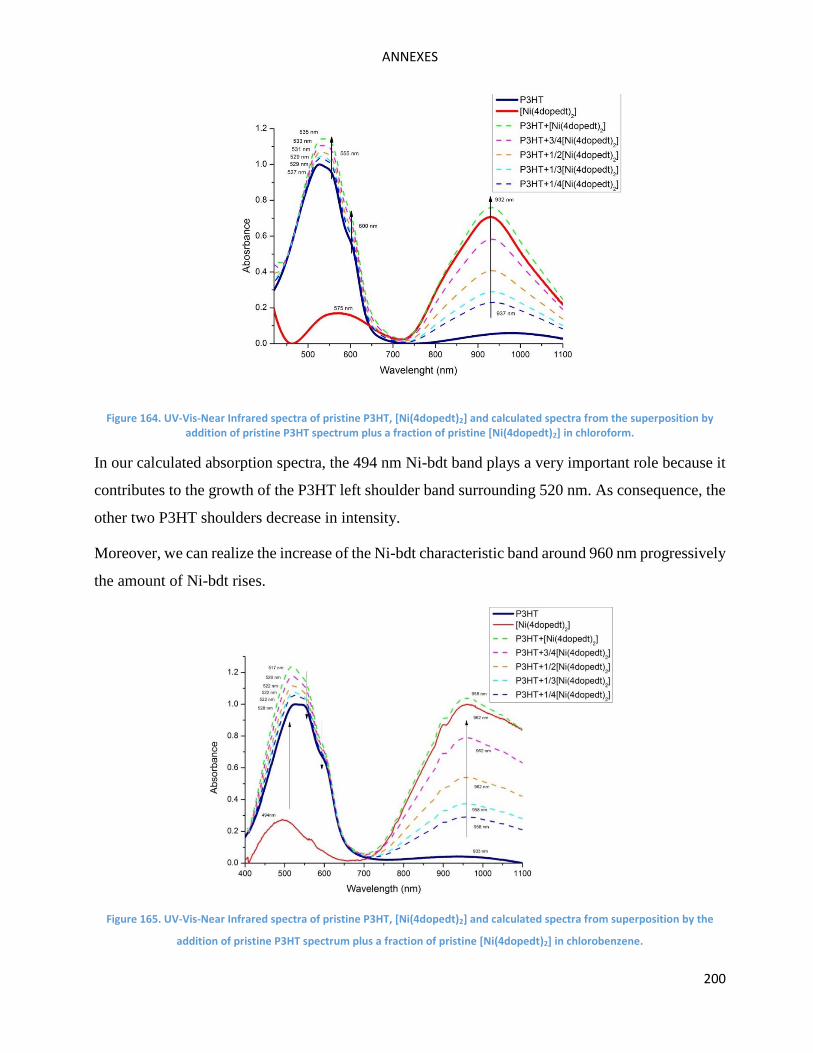
ANNEXES
200
Figure 164. UV-Vis-Near Infrared spectra of pristine P3HT, [Ni(4dopedt)2] and calculated spectra from the superposition by addition of pristine P3HT spectrum plus a fraction of pristine [Ni(4dopedt)2] in chloroform.
In our calculated absorption spectra, the 494 nm Ni-bdt band plays a very important role because it
contributes to the growth of the P3HT left shoulder band surrounding 520 nm. As consequence, the
other two P3HT shoulders decrease in intensity.
Moreover, we can realize the increase of the Ni-bdt characteristic band around 960 nm progressively
the amount of Ni-bdt rises.
Figure 165. UV-Vis-Near Infrared spectra of pristine P3HT, [Ni(4dopedt)2] and calculated spectra from superposition by the
addition of pristine P3HT spectrum plus a fraction of pristine [Ni(4dopedt)2] in chlorobenzene.
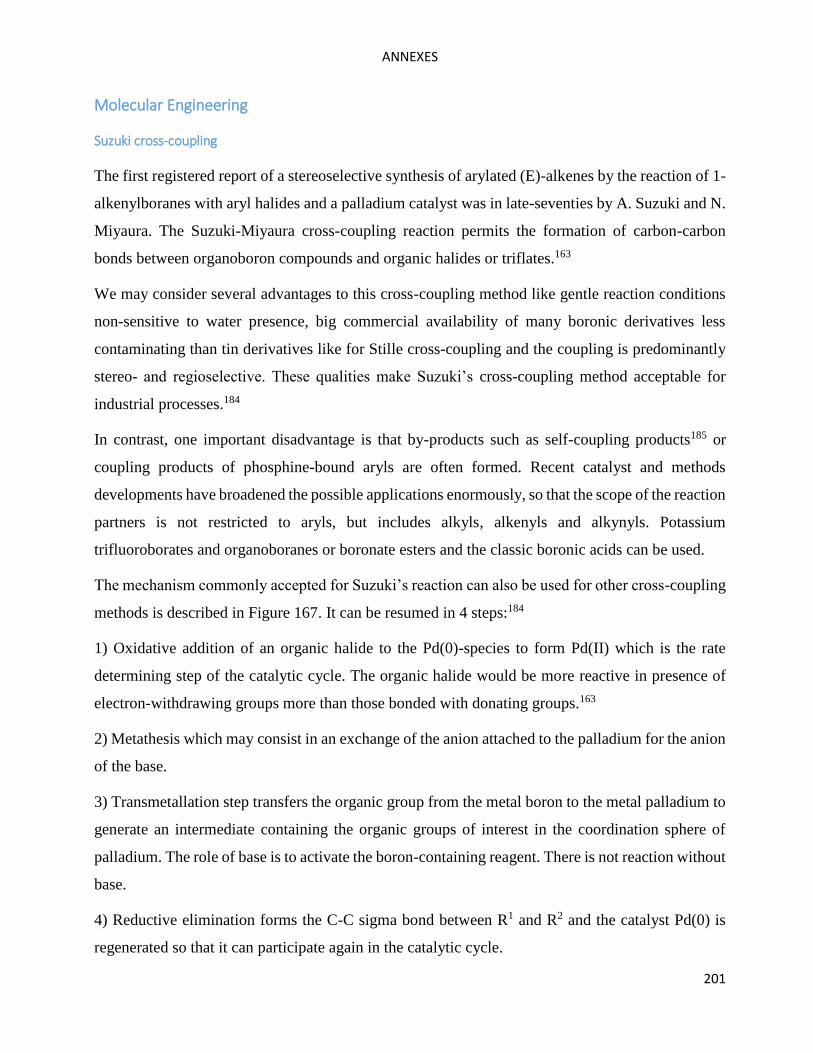
ANNEXES
201
Molecular Engineering
Suzuki cross-coupling
The first registered report of a stereoselective synthesis of arylated (E)-alkenes by the reaction of 1-
alkenylboranes with aryl halides and a palladium catalyst was in late-seventies by A. Suzuki and N.
Miyaura. The Suzuki-Miyaura cross-coupling reaction permits the formation of carbon-carbon
bonds between organoboron compounds and organic halides or triflates.163
We may consider several advantages to this cross-coupling method like gentle reaction conditions
non-sensitive to water presence, big commercial availability of many boronic derivatives less
contaminating than tin derivatives like for Stille cross-coupling and the coupling is predominantly
stereo- and regioselective. These qualities make Suzuki’s cross-coupling method acceptable for
industrial processes.184
In contrast, one important disadvantage is that by-products such as self-coupling products185 or
coupling products of phosphine-bound aryls are often formed. Recent catalyst and methods
developments have broadened the possible applications enormously, so that the scope of the reaction
partners is not restricted to aryls, but includes alkyls, alkenyls and alkynyls. Potassium
trifluoroborates and organoboranes or boronate esters and the classic boronic acids can be used.
The mechanism commonly accepted for Suzuki’s reaction can also be used for other cross-coupling
methods is described in Figure 167. It can be resumed in 4 steps:184
1) Oxidative addition of an organic halide to the Pd(0)-species to form Pd(II) which is the rate
determining step of the catalytic cycle. The organic halide would be more reactive in presence of
electron-withdrawing groups more than those bonded with donating groups.163
2) Metathesis which may consist in an exchange of the anion attached to the palladium for the anion
of the base.
3) Transmetallation step transfers the organic group from the metal boron to the metal palladium to
generate an intermediate containing the organic groups of interest in the coordination sphere of
palladium. The role of base is to activate the boron-containing reagent. There is not reaction without
base.
4) Reductive elimination forms the C-C sigma bond between R1 and R2 and the catalyst Pd(0) is
regenerated so that it can participate again in the catalytic cycle.
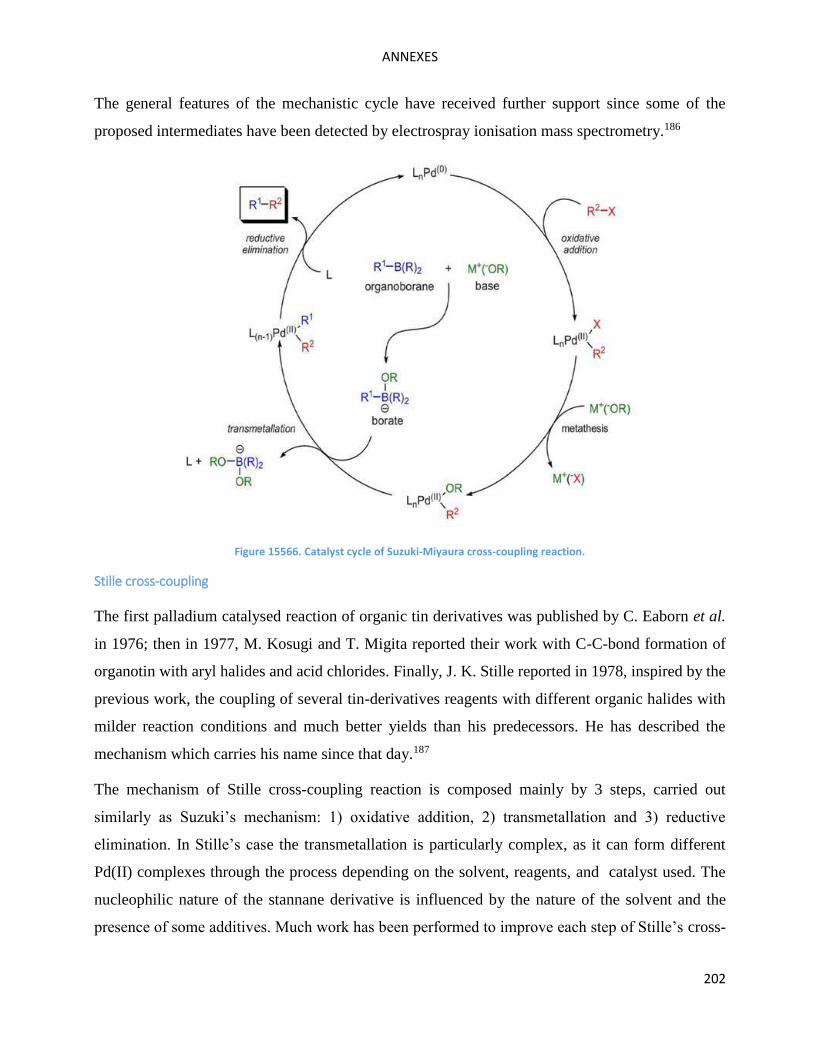
ANNEXES
202
The general features of the mechanistic cycle have received further support since some of the
proposed intermediates have been detected by electrospray ionisation mass spectrometry.186
Figure 15566. Catalyst cycle of Suzuki-Miyaura cross-coupling reaction.
Stille cross-coupling
The first palladium catalysed reaction of organic tin derivatives was published by C. Eaborn et al.
in 1976; then in 1977, M. Kosugi and T. Migita reported their work with C-C-bond formation of
organotin with aryl halides and acid chlorides. Finally, J. K. Stille reported in 1978, inspired by the
previous work, the coupling of several tin-derivatives reagents with different organic halides with
milder reaction conditions and much better yields than his predecessors. He has described the
mechanism which carries his name since that day.187
The mechanism of Stille cross-coupling reaction is composed mainly by 3 steps, carried out
similarly as Suzuki’s mechanism: 1) oxidative addition, 2) transmetallation and 3) reductive
elimination. In Stille’s case the transmetallation is particularly complex, as it can form different
Pd(II) complexes through the process depending on the solvent, reagents, and catalyst used. The
nucleophilic nature of the stannane derivative is influenced by the nature of the solvent and the
presence of some additives. Much work has been performed to improve each step of Stille’s cross-
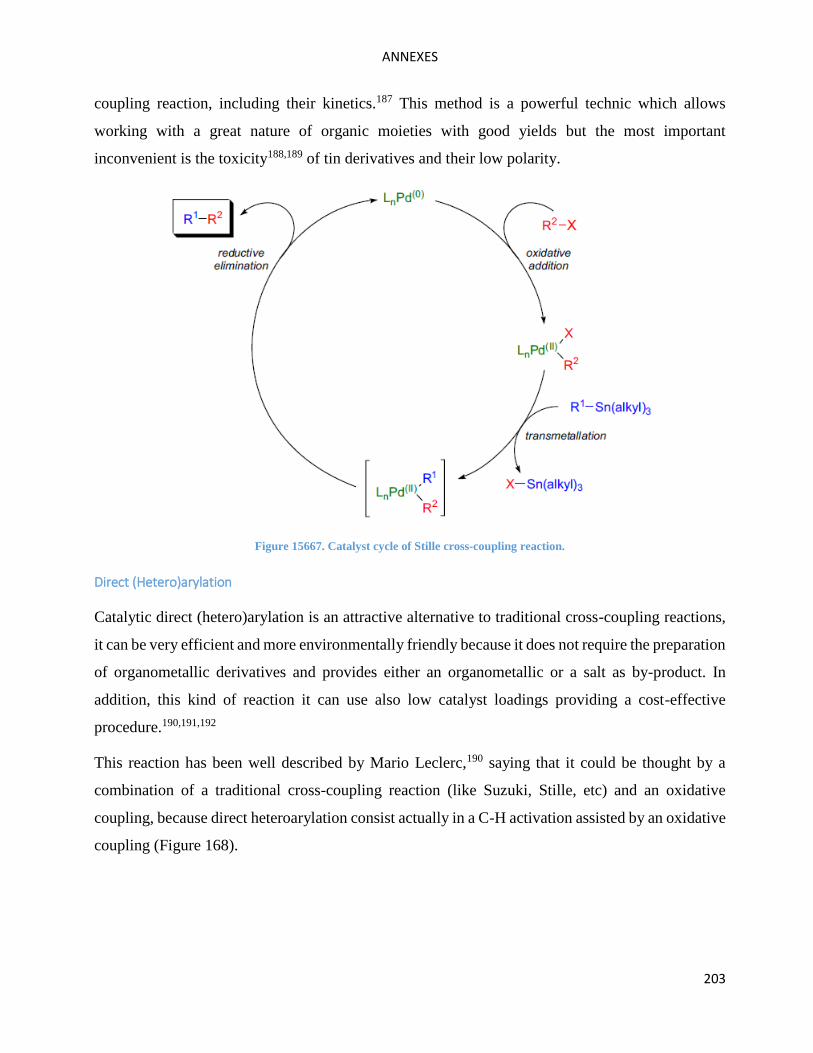
ANNEXES
203
coupling reaction, including their kinetics.187 This method is a powerful technic which allows
working with a great nature of organic moieties with good yields but the most important
inconvenient is the toxicity188,189 of tin derivatives and their low polarity.
Figure 15667. Catalyst cycle of Stille cross-coupling reaction.
Direct (Hetero)arylation
Catalytic direct (hetero)arylation is an attractive alternative to traditional cross-coupling reactions,
it can be very efficient and more environmentally friendly because it does not require the preparation
of organometallic derivatives and provides either an organometallic or a salt as by-product. In
addition, this kind of reaction it can use also low catalyst loadings providing a cost-effective
procedure.190,191,192
This reaction has been well described by Mario Leclerc,190 saying that it could be thought by a
combination of a traditional cross-coupling reaction (like Suzuki, Stille, etc) and an oxidative
coupling, because direct heteroarylation consist actually in a C-H activation assisted by an oxidative
coupling (Figure 168).
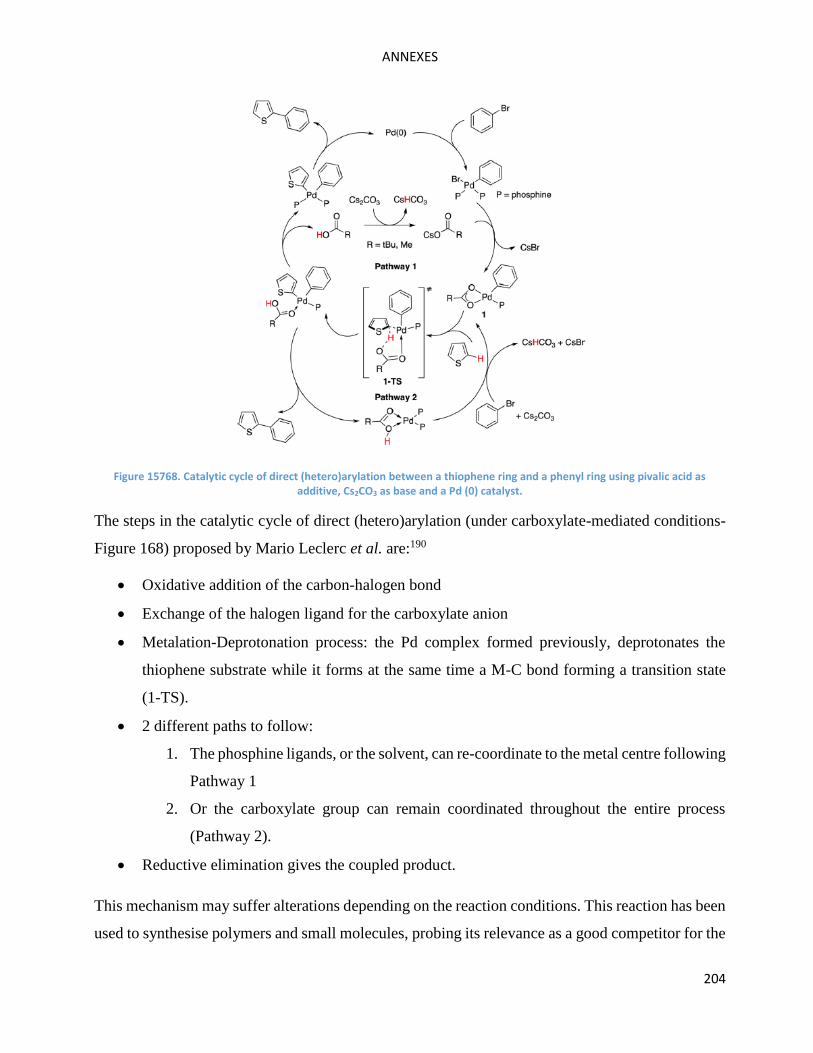
ANNEXES
204
Figure 15768. Catalytic cycle of direct (hetero)arylation between a thiophene ring and a phenyl ring using pivalic acid as additive, Cs2CO3 as base and a Pd (0) catalyst.
The steps in the catalytic cycle of direct (hetero)arylation (under carboxylate-mediated conditions-
Figure 168) proposed by Mario Leclerc et al. are:190
Oxidative addition of the carbon-halogen bond
Exchange of the halogen ligand for the carboxylate anion
Metalation-Deprotonation process: the Pd complex formed previously, deprotonates the
thiophene substrate while it forms at the same time a M-C bond forming a transition state
(1-TS).
2 different paths to follow:
1. The phosphine ligands, or the solvent, can re-coordinate to the metal centre following
Pathway 1
2. Or the carboxylate group can remain coordinated throughout the entire process
(Pathway 2).
Reductive elimination gives the coupled product.
This mechanism may suffer alterations depending on the reaction conditions. This reaction has been
used to synthesise polymers and small molecules, probing its relevance as a good competitor for the
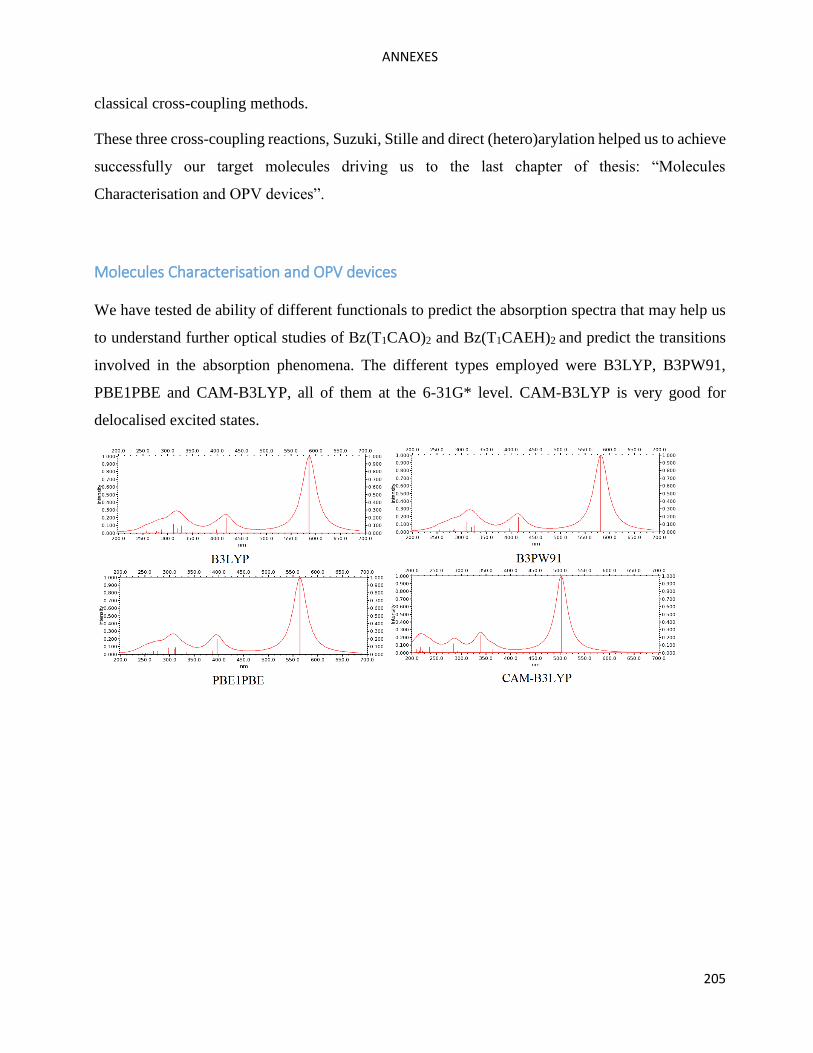
ANNEXES
205
classical cross-coupling methods.
These three cross-coupling reactions, Suzuki, Stille and direct (hetero)arylation helped us to achieve
successfully our target molecules driving us to the last chapter of thesis: “Molecules
Characterisation and OPV devices”.
Molecules Characterisation and OPV devices
We have tested de ability of different functionals to predict the absorption spectra that may help us
to understand further optical studies of Bz(T1CAO)2 and Bz(T1CAEH)2 and predict the transitions
involved in the absorption phenomena. The different types employed were B3LYP, B3PW91,
PBE1PBE and CAM-B3LYP, all of them at the 6-31G* level. CAM-B3LYP is very good for
delocalised excited states.

ANNEXES
206
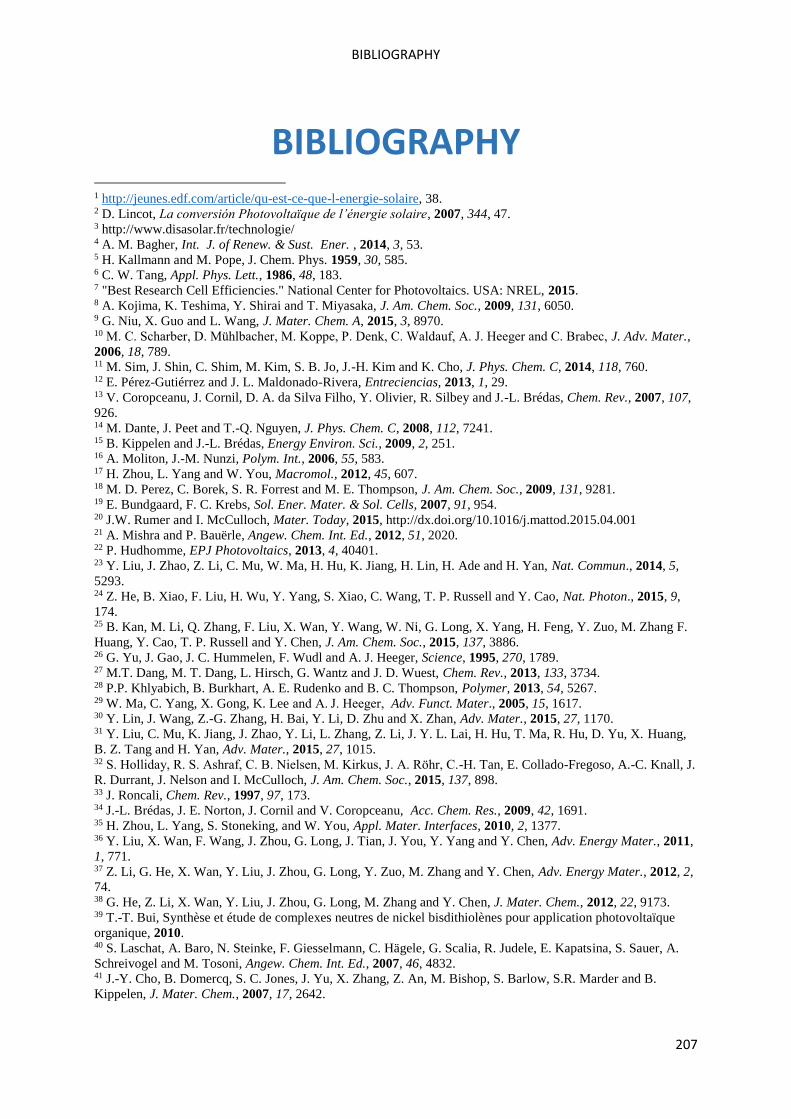
BIBLIOGRAPHY
207
BIBLIOGRAPHY 1 http://jeunes.edf.com/article/qu-est-ce-que-l-energie-solaire, 38. 2 D. Lincot, La conversión Photovoltaïque de l’énergie solaire, 2007, 344, 47. 3 http://www.disasolar.fr/technologie/ 4 A. M. Bagher, Int. J. of Renew. & Sust. Ener. , 2014, 3, 53. 5 H. Kallmann and M. Pope, J. Chem. Phys. 1959, 30, 585. 6 C. W. Tang, Appl. Phys. Lett., 1986, 48, 183. 7 "Best Research Cell Efficiencies." National Center for Photovoltaics. USA: NREL, 2015. 8 A. Kojima, K. Teshima, Y. Shirai and T. Miyasaka, J. Am. Chem. Soc., 2009, 131, 6050. 9 G. Niu, X. Guo and L. Wang, J. Mater. Chem. A, 2015, 3, 8970. 10 M. C. Scharber, D. Muhlbacher, M. Koppe, P. Denk, C. Waldauf, A. J. Heeger and C. Brabec, J. Adv. Mater.,
2006, 18, 789. 11 M. Sim, J. Shin, C. Shim, M. Kim, S. B. Jo, J.-H. Kim and K. Cho, J. Phys. Chem. C, 2014, 118, 760. 12 E. Pérez-Gutiérrez and J. L. Maldonado-Rivera, Entreciencias, 2013, 1, 29. 13 V. Coropceanu, J. Cornil, D. A. da Silva Filho, Y. Olivier, R. Silbey and J.-L. Brédas, Chem. Rev., 2007, 107,
926. 14 M. Dante, J. Peet and T.-Q. Nguyen, J. Phys. Chem. C, 2008, 112, 7241. 15 B. Kippelen and J.-L. Brédas, Energy Environ. Sci., 2009, 2, 251. 16 A. Moliton, J.-M. Nunzi, Polym. Int., 2006, 55, 583. 17 H. Zhou, L. Yang and W. You, Macromol., 2012, 45, 607. 18 M. D. Perez, C. Borek, S. R. Forrest and M. E. Thompson, J. Am. Chem. Soc., 2009, 131, 9281. 19 E. Bundgaard, F. C. Krebs, Sol. Ener. Mater. & Sol. Cells, 2007, 91, 954. 20 J.W. Rumer and I. McCulloch, Mater. Today, 2015, http://dx.doi.org/10.1016/j.mattod.2015.04.001 21 A. Mishra and P. Bauërle, Angew. Chem. Int. Ed., 2012, 51, 2020. 22 P. Hudhomme, EPJ Photovoltaics, 2013, 4, 40401. 23 Y. Liu, J. Zhao, Z. Li, C. Mu, W. Ma, H. Hu, K. Jiang, H. Lin, H. Ade and H. Yan, Nat. Commun., 2014, 5,
5293. 24 Z. He, B. Xiao, F. Liu, H. Wu, Y. Yang, S. Xiao, C. Wang, T. P. Russell and Y. Cao, Nat. Photon., 2015, 9,
174. 25 B. Kan, M. Li, Q. Zhang, F. Liu, X. Wan, Y. Wang, W. Ni, G. Long, X. Yang, H. Feng, Y. Zuo, M. Zhang F.
Huang, Y. Cao, T. P. Russell and Y. Chen, J. Am. Chem. Soc., 2015, 137, 3886. 26 G. Yu, J. Gao, J. C. Hummelen, F. Wudl and A. J. Heeger, Science, 1995, 270, 1789. 27 M.T. Dang, M. T. Dang, L. Hirsch, G. Wantz and J. D. Wuest, Chem. Rev., 2013, 133, 3734. 28 P.P. Khlyabich, B. Burkhart, A. E. Rudenko and B. C. Thompson, Polymer, 2013, 54, 5267. 29 W. Ma, C. Yang, X. Gong, K. Lee and A. J. Heeger, Adv. Funct. Mater., 2005, 15, 1617. 30 Y. Lin, J. Wang, Z.-G. Zhang, H. Bai, Y. Li, D. Zhu and X. Zhan, Adv. Mater., 2015, 27, 1170. 31 Y. Liu, C. Mu, K. Jiang, J. Zhao, Y. Li, L. Zhang, Z. Li, J. Y. L. Lai, H. Hu, T. Ma, R. Hu, D. Yu, X. Huang,
B. Z. Tang and H. Yan, Adv. Mater., 2015, 27, 1015. 32 S. Holliday, R. S. Ashraf, C. B. Nielsen, M. Kirkus, J. A. Rohr, C.-H. Tan, E. Collado-Fregoso, A.-C. Knall, J.
R. Durrant, J. Nelson and I. McCulloch, J. Am. Chem. Soc., 2015, 137, 898. 33 J. Roncali, Chem. Rev., 1997, 97, 173. 34 J.-L. Brédas, J. E. Norton, J. Cornil and V. Coropceanu, Acc. Chem. Res., 2009, 42, 1691. 35 H. Zhou, L. Yang, S. Stoneking, and W. You, Appl. Mater. Interfaces, 2010, 2, 1377. 36 Y. Liu, X. Wan, F. Wang, J. Zhou, G. Long, J. Tian, J. You, Y. Yang and Y. Chen, Adv. Energy Mater., 2011,
1, 771. 37 Z. Li, G. He, X. Wan, Y. Liu, J. Zhou, G. Long, Y. Zuo, M. Zhang and Y. Chen, Adv. Energy Mater., 2012, 2,
74. 38 G. He, Z. Li, X. Wan, Y. Liu, J. Zhou, G. Long, M. Zhang and Y. Chen, J. Mater. Chem., 2012, 22, 9173. 39 T.-T. Bui, Synthèse et étude de complexes neutres de nickel bisdithiolènes pour application photovoltaïque
organique, 2010. 40 S. Laschat, A. Baro, N. Steinke, F. Giesselmann, C. Hägele, G. Scalia, R. Judele, E. Kapatsina, S. Sauer, A.
Schreivogel and M. Tosoni, Angew. Chem. Int. Ed., 2007, 46, 4832. 41 J.-Y. Cho, B. Domercq, S. C. Jones, J. Yu, X. Zhang, Z. An, M. Bishop, S. Barlow, S.R. Marder and B.
Kippelen, J. Mater. Chem., 2007, 17, 2642.
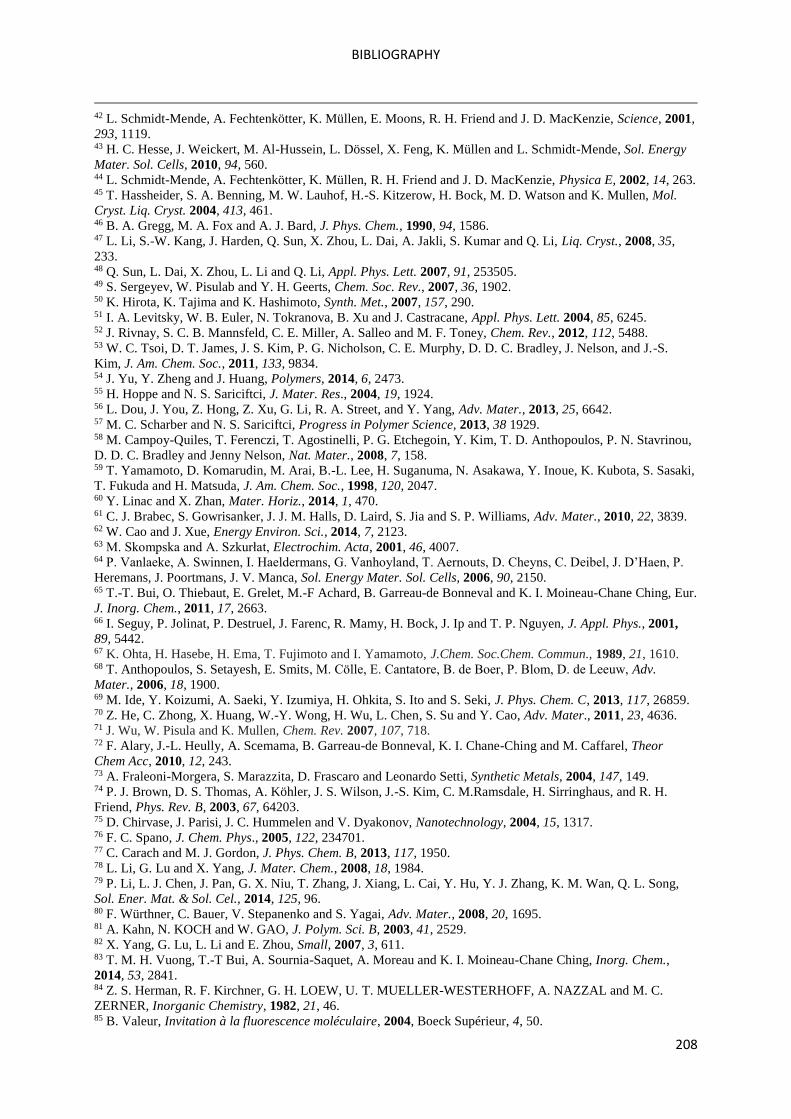
BIBLIOGRAPHY
208
42 L. Schmidt-Mende, A. Fechtenkötter, K. Müllen, E. Moons, R. H. Friend and J. D. MacKenzie, Science, 2001,
293, 1119. 43 H. C. Hesse, J. Weickert, M. Al-Hussein, L. Dössel, X. Feng, K. Müllen and L. Schmidt-Mende, Sol. Energy
Mater. Sol. Cells, 2010, 94, 560. 44 L. Schmidt-Mende, A. Fechtenkötter, K. Müllen, R. H. Friend and J. D. MacKenzie, Physica E, 2002, 14, 263. 45 T. Hassheider, S. A. Benning, M. W. Lauhof, H.-S. Kitzerow, H. Bock, M. D. Watson and K. Mullen, Mol.
Cryst. Liq. Cryst. 2004, 413, 461. 46 B. A. Gregg, M. A. Fox and A. J. Bard, J. Phys. Chem., 1990, 94, 1586. 47 L. Li, S.-W. Kang, J. Harden, Q. Sun, X. Zhou, L. Dai, A. Jakli, S. Kumar and Q. Li, Liq. Cryst., 2008, 35,
233. 48 Q. Sun, L. Dai, X. Zhou, L. Li and Q. Li, Appl. Phys. Lett. 2007, 91, 253505. 49 S. Sergeyev, W. Pisulab and Y. H. Geerts, Chem. Soc. Rev., 2007, 36, 1902. 50 K. Hirota, K. Tajima and K. Hashimoto, Synth. Met., 2007, 157, 290. 51 I. A. Levitsky, W. B. Euler, N. Tokranova, B. Xu and J. Castracane, Appl. Phys. Lett. 2004, 85, 6245. 52 J. Rivnay, S. C. B. Mannsfeld, C. E. Miller, A. Salleo and M. F. Toney, Chem. Rev., 2012, 112, 5488. 53 W. C. Tsoi, D. T. James, J. S. Kim, P. G. Nicholson, C. E. Murphy, D. D. C. Bradley, J. Nelson, and J.-S.
Kim, J. Am. Chem. Soc., 2011, 133, 9834. 54 J. Yu, Y. Zheng and J. Huang, Polymers, 2014, 6, 2473. 55 H. Hoppe and N. S. Sariciftci, J. Mater. Res., 2004, 19, 1924. 56 L. Dou, J. You, Z. Hong, Z. Xu, G. Li, R. A. Street, and Y. Yang, Adv. Mater., 2013, 25, 6642. 57 M. C. Scharber and N. S. Sariciftci, Progress in Polymer Science, 2013, 38 1929. 58 M. Campoy-Quiles, T. Ferenczi, T. Agostinelli, P. G. Etchegoin, Y. Kim, T. D. Anthopoulos, P. N. Stavrinou,
D. D. C. Bradley and Jenny Nelson, Nat. Mater., 2008, 7, 158. 59 T. Yamamoto, D. Komarudin, M. Arai, B.-L. Lee, H. Suganuma, N. Asakawa, Y. Inoue, K. Kubota, S. Sasaki,
T. Fukuda and H. Matsuda, J. Am. Chem. Soc., 1998, 120, 2047. 60 Y. Linac and X. Zhan, Mater. Horiz., 2014, 1, 470. 61 C. J. Brabec, S. Gowrisanker, J. J. M. Halls, D. Laird, S. Jia and S. P. Williams, Adv. Mater., 2010, 22, 3839. 62 W. Cao and J. Xue, Energy Environ. Sci., 2014, 7, 2123. 63 M. Skompska and A. Szkurłat, Electrochim. Acta, 2001, 46, 4007. 64 P. Vanlaeke, A. Swinnen, I. Haeldermans, G. Vanhoyland, T. Aernouts, D. Cheyns, C. Deibel, J. D’Haen, P.
Heremans, J. Poortmans, J. V. Manca, Sol. Energy Mater. Sol. Cells, 2006, 90, 2150. 65 T.-T. Bui, O. Thiebaut, E. Grelet, M.-F Achard, B. Garreau-de Bonneval and K. I. Moineau-Chane Ching, Eur.
J. Inorg. Chem., 2011, 17, 2663. 66 I. Seguy, P. Jolinat, P. Destruel, J. Farenc, R. Mamy, H. Bock, J. Ip and T. P. Nguyen, J. Appl. Phys., 2001,
89, 5442. 67 K. Ohta, H. Hasebe, H. Ema, T. Fujimoto and I. Yamamoto, J.Chem. Soc.Chem. Commun., 1989, 21, 1610. 68 T. Anthopoulos, S. Setayesh, E. Smits, M. Colle, E. Cantatore, B. de Boer, P. Blom, D. de Leeuw, Adv.
Mater., 2006, 18, 1900. 69 M. Ide, Y. Koizumi, A. Saeki, Y. Izumiya, H. Ohkita, S. Ito and S. Seki, J. Phys. Chem. C, 2013, 117, 26859. 70 Z. He, C. Zhong, X. Huang, W.-Y. Wong, H. Wu, L. Chen, S. Su and Y. Cao, Adv. Mater., 2011, 23, 4636. 71 J. Wu, W. Pisula and K. Mullen, Chem. Rev. 2007, 107, 718. 72 F. Alary, J.-L. Heully, A. Scemama, B. Garreau-de Bonneval, K. I. Chane-Ching and M. Caffarel, Theor
Chem Acc, 2010, 12, 243. 73 A. Fraleoni-Morgera, S. Marazzita, D. Frascaro and Leonardo Setti, Synthetic Metals, 2004, 147, 149. 74 P. J. Brown, D. S. Thomas, A. Köhler, J. S. Wilson, J.-S. Kim, C. M.Ramsdale, H. Sirringhaus, and R. H.
Friend, Phys. Rev. B, 2003, 67, 64203. 75 D. Chirvase, J. Parisi, J. C. Hummelen and V. Dyakonov, Nanotechnology, 2004, 15, 1317. 76 F. C. Spano, J. Chem. Phys., 2005, 122, 234701. 77 C. Carach and M. J. Gordon, J. Phys. Chem. B, 2013, 117, 1950. 78 L. Li, G. Lu and X. Yang, J. Mater. Chem., 2008, 18, 1984. 79 P. Li, L. J. Chen, J. Pan, G. X. Niu, T. Zhang, J. Xiang, L. Cai, Y. Hu, Y. J. Zhang, K. M. Wan, Q. L. Song,
Sol. Ener. Mat. & Sol. Cel., 2014, 125, 96. 80 F. Würthner, C. Bauer, V. Stepanenko and S. Yagai, Adv. Mater., 2008, 20, 1695. 81 A. Kahn, N. KOCH and W. GAO, J. Polym. Sci. B, 2003, 41, 2529. 82 X. Yang, G. Lu, L. Li and E. Zhou, Small, 2007, 3, 611. 83 T. M. H. Vuong, T.-T Bui, A. Sournia-Saquet, A. Moreau and K. I. Moineau-Chane Ching, Inorg. Chem.,
2014, 53, 2841. 84 Z. S. Herman, R. F. Kirchner, G. H. LOEW, U. T. MUELLER-WESTERHOFF, A. NAZZAL and M. C.
ZERNER, Inorganic Chemistry, 1982, 21, 46. 85 B. Valeur, Invitation à la fluorescence moléculaire, 2004, Boeck Supérieur, 4, 50.
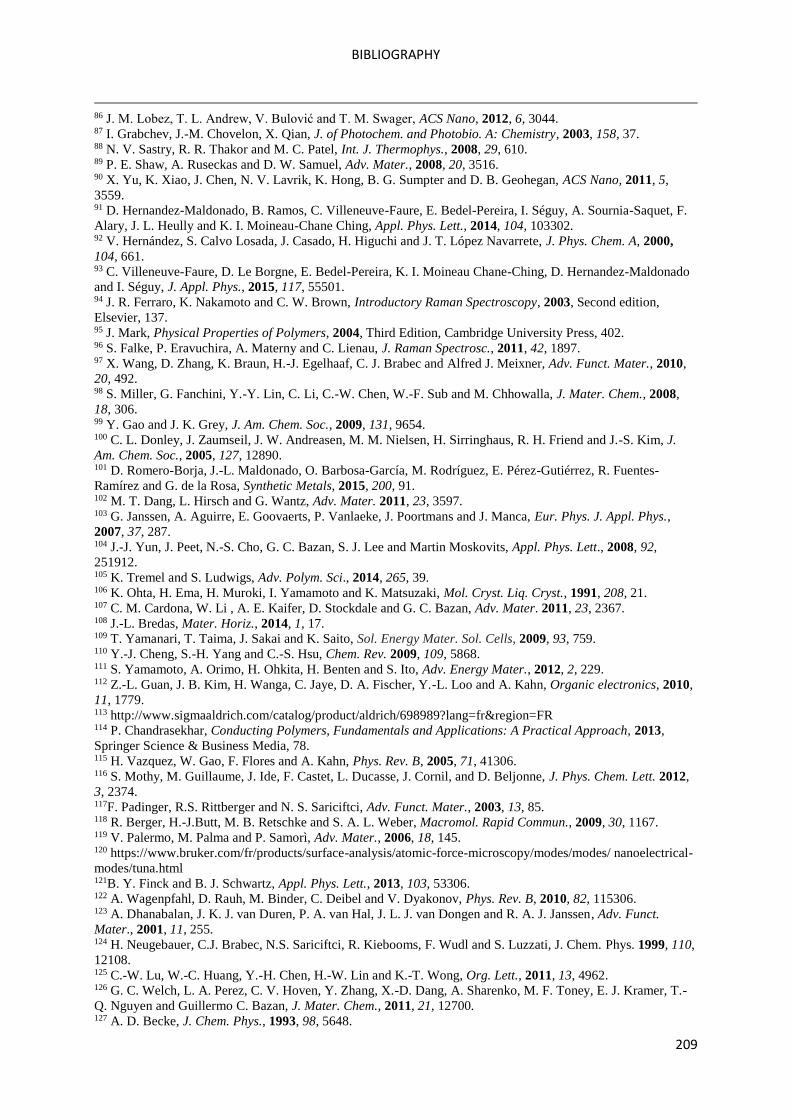
BIBLIOGRAPHY
209
86 J. M. Lobez, T. L. Andrew, V. Bulović and T. M. Swager, ACS Nano, 2012, 6, 3044. 87 I. Grabchev, J.-M. Chovelon, X. Qian, J. of Photochem. and Photobio. A: Chemistry, 2003, 158, 37. 88 N. V. Sastry, R. R. Thakor and M. C. Patel, Int. J. Thermophys., 2008, 29, 610. 89 P. E. Shaw, A. Ruseckas and D. W. Samuel, Adv. Mater., 2008, 20, 3516. 90 X. Yu, K. Xiao, J. Chen, N. V. Lavrik, K. Hong, B. G. Sumpter and D. B. Geohegan, ACS Nano, 2011, 5,
3559. 91 D. Hernandez-Maldonado, B. Ramos, C. Villeneuve-Faure, E. Bedel-Pereira, I. Séguy, A. Sournia-Saquet, F.
Alary, J. L. Heully and K. I. Moineau-Chane Ching, Appl. Phys. Lett., 2014, 104, 103302. 92 V. Hernández, S. Calvo Losada, J. Casado, H. Higuchi and J. T. López Navarrete, J. Phys. Chem. A, 2000,
104, 661. 93 C. Villeneuve-Faure, D. Le Borgne, E. Bedel-Pereira, K. I. Moineau Chane-Ching, D. Hernandez-Maldonado
and I. Séguy, J. Appl. Phys., 2015, 117, 55501. 94 J. R. Ferraro, K. Nakamoto and C. W. Brown, Introductory Raman Spectroscopy, 2003, Second edition,
Elsevier, 137. 95 J. Mark, Physical Properties of Polymers, 2004, Third Edition, Cambridge University Press, 402. 96 S. Falke, P. Eravuchira, A. Materny and C. Lienau, J. Raman Spectrosc., 2011, 42, 1897. 97 X. Wang, D. Zhang, K. Braun, H.-J. Egelhaaf, C. J. Brabec and Alfred J. Meixner, Adv. Funct. Mater., 2010,
20, 492. 98 S. Miller, G. Fanchini, Y.-Y. Lin, C. Li, C.-W. Chen, W.-F. Sub and M. Chhowalla, J. Mater. Chem., 2008,
18, 306. 99 Y. Gao and J. K. Grey, J. Am. Chem. Soc., 2009, 131, 9654. 100 C. L. Donley, J. Zaumseil, J. W. Andreasen, M. M. Nielsen, H. Sirringhaus, R. H. Friend and J.-S. Kim, J.
Am. Chem. Soc., 2005, 127, 12890. 101 D. Romero-Borja, J.-L. Maldonado, O. Barbosa-García, M. Rodríguez, E. Pérez-Gutiérrez, R. Fuentes-
Ramírez and G. de la Rosa, Synthetic Metals, 2015, 200, 91. 102 M. T. Dang, L. Hirsch and G. Wantz, Adv. Mater. 2011, 23, 3597. 103 G. Janssen, A. Aguirre, E. Goovaerts, P. Vanlaeke, J. Poortmans and J. Manca, Eur. Phys. J. Appl. Phys.,
2007, 37, 287. 104 J.-J. Yun, J. Peet, N.-S. Cho, G. C. Bazan, S. J. Lee and Martin Moskovits, Appl. Phys. Lett., 2008, 92,
251912. 105 K. Tremel and S. Ludwigs, Adv. Polym. Sci., 2014, 265, 39. 106 K. Ohta, H. Ema, H. Muroki, I. Yamamoto and K. Matsuzaki, Mol. Cryst. Liq. Cryst., 1991, 208, 21. 107 C. M. Cardona, W. Li , A. E. Kaifer, D. Stockdale and G. C. Bazan, Adv. Mater. 2011, 23, 2367. 108 J.-L. Bredas, Mater. Horiz., 2014, 1, 17. 109 T. Yamanari, T. Taima, J. Sakai and K. Saito, Sol. Energy Mater. Sol. Cells, 2009, 93, 759. 110 Y.-J. Cheng, S.-H. Yang and C.-S. Hsu, Chem. Rev. 2009, 109, 5868. 111 S. Yamamoto, A. Orimo, H. Ohkita, H. Benten and S. Ito, Adv. Energy Mater., 2012, 2, 229. 112 Z.-L. Guan, J. B. Kim, H. Wanga, C. Jaye, D. A. Fischer, Y.-L. Loo and A. Kahn, Organic electronics, 2010,
11, 1779. 113 http://www.sigmaaldrich.com/catalog/product/aldrich/698989?lang=fr®ion=FR 114 P. Chandrasekhar, Conducting Polymers, Fundamentals and Applications: A Practical Approach, 2013,
Springer Science & Business Media, 78. 115 H. Vazquez, W. Gao, F. Flores and A. Kahn, Phys. Rev. B, 2005, 71, 41306. 116 S. Mothy, M. Guillaume, J. Ide, F. Castet, L. Ducasse, J. Cornil, and D. Beljonne, J. Phys. Chem. Lett. 2012,
3, 2374. 117F. Padinger, R.S. Rittberger and N. S. Sariciftci, Adv. Funct. Mater., 2003, 13, 85. 118 R. Berger, H.-J.Butt, M. B. Retschke and S. A. L. Weber, Macromol. Rapid Commun., 2009, 30, 1167. 119 V. Palermo, M. Palma and P. Samorì, Adv. Mater., 2006, 18, 145. 120 https://www.bruker.com/fr/products/surface-analysis/atomic-force-microscopy/modes/modes/ nanoelectrical-
modes/tuna.html 121B. Y. Finck and B. J. Schwartz, Appl. Phys. Lett., 2013, 103, 53306. 122 A. Wagenpfahl, D. Rauh, M. Binder, C. Deibel and V. Dyakonov, Phys. Rev. B, 2010, 82, 115306. 123 A. Dhanabalan, J. K. J. van Duren, P. A. van Hal, J. L. J. van Dongen and R. A. J. Janssen, Adv. Funct.
Mater., 2001, 11, 255. 124 H. Neugebauer, C.J. Brabec, N.S. Sariciftci, R. Kiebooms, F. Wudl and S. Luzzati, J. Chem. Phys. 1999, 110,
12108. 125 C.-W. Lu, W.-C. Huang, Y.-H. Chen, H.-W. Lin and K.-T. Wong, Org. Lett., 2011, 13, 4962. 126 G. C. Welch, L. A. Perez, C. V. Hoven, Y. Zhang, X.-D. Dang, A. Sharenko, M. F. Toney, E. J. Kramer, T.-
Q. Nguyen and Guillermo C. Bazan, J. Mater. Chem., 2011, 21, 12700. 127 A. D. Becke, J. Chem. Phys., 1993, 98, 5648.
BIBLIOGRAPHY
210
128 I. T. Lima, C. Risko, S. G. Aziz, D. A. da Silva Filho and J.-L Brédas, J. Mater. Chem. C, 2014, 2, 8873. 129 L. Zhang, K. Pei, H. Zhao, S. Wua, Y. Wanga and J. Gao, Chem. Phys. Lett., 2012, 543, 199. 130 S. F. Sousa, P. A. Fernandes and M. J. Ramos, J. Phys. Chem. A, 2007, 111, 10439. 131 C.-Y. Yu, C.-Y. Wu, Dyes and Pigments 2014, 106, 81. 132 J. Shi, W. Zhao, L. Xu, Y. Kan, C. Li, J. Song, and H. Wang, J. Phys. Chem. C, 2014, 118, 7844. 133 X. He, J.-B. Lin, W. H. Kan, P. Dong, S. Trudel and T. Baumgartner, Adv. Funct. Mater., 2014, 24, 897. 134 Y. Dienes, M. Eggenstein, T. Kárpáti, T. C. Sutherland, L. Nyulászi and T. Baumgartner, Chem. Eur. J.,
2008, 14, 9878. 135 E. Wang, L. Wang, L. Lan, C. Luo, W. Zhuang, J. Peng and Y. Cao, Appl. Phys. Lett., 2008, 92, 33307. 136 M. Zhang, H. Fan, X. Guo, Y. He, Z. Zhang, J. Min, J. Zhang, G. Zhan and Y. Li, Macromol., 2010, 43,
5706. 137 M. C. Scharber, M. Koppe, J. Gao, F. Cordella, M. A. Loi, P. Denk, M. Morana, H. J. Egelhaaf, K. Forberich,
G. Dennler, R. Gaudiana, D. Waller, Z. Zhu, X. Shi and C. J. Brabec, Adv. Mater., 2010, 22, 367. 138 H. Y. Chen, J. Hou, A. E. Hayden, H. Yang, K. N. Houk and Y. Yang, Adv. Mater., 2010, 22, 371. 139 M. Zhang, X. Guo, Z.-G. Zhang, Y. Li, Polymer, 2011, 52, 5464. 140 G. Lu, H. Usta, C. Risko, L. Wang, A. Facchetti, M. A. Ratner and T. J. Marks, J. Am. Chem. Soc., 2008, 130,
7670. 141 J. Chen and Y. Cao, Acc. Chem. Res., 2009, 42, 1709. 142 J. A. Mikroyannidis, P. Suresh, M. S. Roy and G. D. Sharma, J. Power Sources 2010, 195, 3002. 143 J.-J. Kim, H. Choi, J.-W. Lee, M.-S. Kang, K. Song, S. O. Kang and J. Ko, J. Mater. Chem. 2008, 18, 5223. 144 J. U. Ju, S. O. Jung, Q. H. Zhao, Y. H. Kim, J. T. Je and S. K. Kwon, Bull. Korean Chem. Soc. 2008, 29, 335. 145 S. Haid, M. Marszalek, A. Mishra, M. Wielopolski, J. Teuscher, J.-E. Moser, R. Humphry-Baker, S. M.
Zakeeruddin, M. Grätzel and P. Bäuerle, Adv. Funct. Mater., 2012, 22, 1291. 146 K. Yilgram, M. Zupan and R. Skiles, J. Heterocyclic Chemistry, 1970, 7, 629. 147 Z. Wu, A. Li, B. Fan, F. Xue, C. Adachi and J. Ouyang, Solar Energy Materials & Solar Cells, 2011, 95,
2516. 148 M. Zhou, J. Huang and Y. Liu, Faming Zhuanli Shenqing. 2012 Patent N° CN 102417586 A 20120418. 149 M. M. M. Raposo and G. Kirsch, Tetrahedron, 2003, 59, 4891. 150 H. Meier, J. Gerolda and D. Jacob, Tetrahedron Letters, 2003, 44, 1915. 151 M. M. M. Raposo, A. M. C. Fonsecaa and G. Kirsch, Tetrahedron, 2004, 60, 4071. 152 T. Qi, Y. Liu, W. Qiu, H. Zhang, X. Gao, Y. Liu, K. Lu, C. Du, G. Yua and D. Zhu, J. Mater. Chem., 2008,
18, 1131. 153 J. Chen and Y. Cao, Macromol. Rapid Commun., 2007, 28, 1714. 154 R. C. Coffin, J. Peet, J. Rogers and G. C. Bazan, Nature Chemistry, 2009, 1, 657. 155 J.-H. Huang, C.-M. Teng, Y.-S. Hsiao, F.-W. Yen, P. Chen, F.-C. Chang and C.-W. Chu, J. Phys. Chem. C.,
2011, 115, 2398. 156 C.-H. Chen, C.-H. Hsieh, M. Dubosc, Y.-J. Cheng and C.-S. Hsu, Macromol., 2010, 43, 697. 157 J. Hou, H.-Y. Chen, S. Zhang, G. Li and Y. Yang, J. Am. Chem. Soc., 2008, 130, 16144. 158 S.-W. Chang, H. Waters, J. Kettle, Z.-R. Kuo, C.-H. Li, Chin-Yang Yu and M. Horie, Macromol. Rapid
Commun., 2012, 33, 1927 159 Y. Bouazizi, K. Beydoun, A. Romdhane, H. B. Jannet and H. Doucet, Tetrahedron Lett., 2012, 53, 6801. 160 Y. Fall, H. Doucet and M. Santelli, Appl. Organometal. Chem. 2008, 22, 503. 161 T. Cantat, E. Génin, C. Giroud, G. Meyer, A. Jutand, J. Organomet. Chem., 2003, 687, 365. 162 K. Watanabe, N. Yamagiwa and Y. Torisawa, Org. Proc. Res. & Develop., 2007, 11, 251. 163 N. Miyaura and A. Suzuki, Chem. Rev., 1995, 95, 2457. 164J. Che, C.-J. Zheng, M.-X. Song, Y.-J. Bi, Y. Liu, Y.-J. Li, Y. Wu, L.-P. Sun and H.-R. Piao, Med Chem Res.,
2014, 23, 426. 165Y. Liu, X. Wan, F. Wang, J. Zhou, G. Long, J. Tian, J. You, Y. Yang and Y. Chen, Adv. Energy Mater. 2011,
1, 771. 166 J. Zhou, X. Wan, Y. Liu, G. Long, F. Wang, Z. Li, Y. Zuo, C. Li and Y. Chen, Chem. Mater., 2011, 23,
4666. 167 L. Marin, L. Lutsen, D. Vanderzande and W. Maes, Org. Biomol. Chem., 2013, 11, 5866. 168 Y. Geng, F. Pop, C. Yi, N. Avarvari, M. Grätzel, S. Decurtinsa and S.-X. Liu, New J.Chem., 2014,
38, 3269. 169 B. Kan, Q. Zhang, M. Li, X. Wan, W. Ni, G. Long, Y. Wang, X. Yang, H. Feng and Y. Chen, J. Am. Chem.
Soc., 2014, 136, 15529. 170 Y. Lin, Z.-G. Zhang, Y. Li, D. Zhua and X. Zhan, J. Mater. Chem. A, 2013, 1, 5128 171 J.-L.Wang, Q.-R. Yin, J.- S.Miao, Z. Wu, Z.-F.Chang, Y. Cao, R.-B. Zhang, J.-Y. Wang, H. -B.Wu and Y.
Cao, Adv. Funct. Mater., 2015, DOI: 10.1002/adfm.201500190. 172 I. Dierking, in “Textures of Liquid Crystals”. Wiley-VCH, 2003, eScholarID:4-39.
BIBLIOGRAPHY
211
173 A. Heeger, Chem. Soc. Rev., 2010, 39, 2354. 174 F. Huang, K. Zhang, Z. Hu and Y. Cao, Solar & Alternative Energy, 2014. 175 J.L. Maldonado, G. Ramos-Ortíz, M. L. Miranda, S. Vázquez-Córdova, M. A. Meneses-Nava, O. Barbosa-
García and M. Ortíz-Gutiérrez, Am. J. Phys., 2008, 76, 1130. 176 C. A. Hunter and J. K. M. Sanders, J. Am. Chem. Soc., 1990, 112, 5525. 177 J. L. Brédas, "Solar Technologies." Center for Materials and Devices for Information Technology Research
(CMDITR )Photonics Wiki., 2010. 178 C. Müller, T. A. M. Ferenczi, M. Campoy-Quiles, J. M. Frost, D. D. C. Bradley, Paul Smith, N. Stingelin-
Stutzmann, and J. Nelson, Adv. Mater., 2008, 20, 3510. 179 M. Goel and M. Jayakannan, J. Phys. Chem. B, 2010, 114, 12508. 180 T. Ameri, P. Khoram, J. Min and C. J. Brabec, Adv. Mater., 2013, 25, 4245. 181 Sigma-Aldrich, Fullerene-C60 properties. 182 N. Li, D. Baran, K. Forberich, F. Machui, T. Ameri, M. Turbiez, M. Carrasco-Orozco, M. Drees, A.
Facchetti,
F.C. Krebs and C. J. Brabec, Energy Environ. Sci., 2013, 6, 3407. 183 F. X. Perrin, D. M. Panaitescu, A. N. Frone, C. Radovici and C. Nicolae, Polymer, 2013, 54, 2347. 184 L. Kürti and B. Czakó, Strategic Applications of Named Reactions in Organic Synthesis, 2005, Elsevier
Academic Press, Vol 1, 448. 185M. Moreno-Mañas M. Pérez and R. Pleixats, J. Org. Chem., 1996, 61, 2346. 186 A. 0. Aliprantis and J. W. Canary, J. Am. Chem. Soc., 1994, 116, 6985. 187 P. Espinet and A. M. Echavarren, Angew. Chem. Int. Ed., 2004, 43, 4704. 188 H. B. Stoner, J. M. Barnes, and J. I. Duff , Brit. J. Pharmacol., 1955, 10, 16. 189 W. KA. Adverse Drug React Acute Poisoning Rev., 1988, 7, 19. 190 L. G. Mercier and M. Leclerc, Acc. of Chem. Res., 2013, 46, 1597. 191 R. Rossi, F. Bellina, M. Lessi and C. Manzini, Adv. Synth. Catal., 2014, 356, 17. 192 T. W. Lyons and M. S. Sanford, Chem. Rev., 2010, 110, 1147.

Résumé de thèse Dans le présent travail, nous présentons une étude approfondie en solution et sur des films
minces de poly-3-hexylthiophène (P3HT) pur et en mélange avec des complexes de nickel
(Ni-bdt). Le but était de comprendre comment le P3HT interagit avec les complexes de nickel
pour contrôler des phénomènes d'organisation éventuels. L'objectif principal de cette étude est
de comprendre l'organisation moléculaires au sein des films organiques et son impact sur le
transfert de charge entre les matériaux afin d’optimiser les rendements de photoconversion.
En outre, nous avons conçu et synthétisé trois nouvelles molécules à faible gap électronique,
nommées SilOCAO, Bz(T1CAO)2 et Bz(T1CAEH)2 selon des méthodologies de synthèse
optimisées. Ces molécules ont été conçues avec l’appui de calculs semi-empiriques effectués
avec le programme Gaussian 09 au niveau B3LYP/6-31G* dans le but de les associer
éventuellement aux complexes de nickel. Leurs synthèses et caractérisation complètes sont
décrites en détail. Les techniques analytiques utilisées sont la spectroscopie d’absorption UV-
visible, la photoluminescence, la résonance magnétique nucléaire (RMN), la spectroscopie de
masse, l'électrochimie, l'analyse thermogravimétrique (TGA) et la calorimétrie différentielle à
balayage (DSC).
Ces molécules présentant des propriétés intéressantes pour leur utilisation en photovoltaïque
organique, nous avons réalisé des cellules solaires organiques prototypes. Les résultats
obtenus sont prometteurs, en particulier dans le cas de la molécule SilOCAO, utilisée ici
comme donneur d'électrons en association avec des dérivés du fullerène.
Mots-clés: organisation moléculaire, morphologie des mélanges, molécules à faible gap
électronique, P3HT, complexes de nickel, transfert de charge, SilOCAO, Bz(T1CAO)2,
Bz(T1CAEH)2, heterojonction en volume, photovoltaïque organique.
Abstract In the present work, we present a comprehensive study in solution and on thin films of pristine
P3HT and of nickel bisdithiolene complexes (Ni-bdt), and their blends, in order to understand
how poly(3-hexylthiophene) P3HT interacts with those molecules. The most encouraging result
was obtained with a complex able to self-organise in hexagonal columnar liquid crystal phases
that shows organising properties when blended with P3HT. This major result brings knowledge
about improving order in polymer blends that could also have a positive impact on charge
transfer phenomena.
We have also designed and synthesised 3 new low band gap small molecules, SilOCAO,
Bz(T1CAO)2 and Bz(T1CAEH)2, by using innovating synthetic methodologies. These
molecules were strategically designed via semi-empirical calculations (B3LYP/6-31G*) to
match their energetic levels (LUMO and HOMO) with those of nickel bisdithiolene molecules
for an optimised charge transfer. Their syntheses have been described, and their properties have
been fully investigated by using different techniques such as UV-visible spectroscopy,
photoluminescence, nuclear magnetic resonance (NMR), mass spectroscopy (MS),
electrochemistry, thermogravimetric analysis (TGA) and differential scanning calorimetry
(DSC).
The synthesised molecules have been used in organic solar cells prototypes. Promising results
have been obtained, in particular for SilOCAO as the electron-donor associated with fullerene
derivatives as the acceptors in bulk heterojunction.
Keywords molecules organization, blend morphology, molecular engineering, low band gap
materials, P3HT, Ni-bdt, charge transfer, SilOCAO, Bz(T1CAO)2, Bz(T1CAEH)2, BHJs,
organic solar cells