2017 - env.go.jp · MIROC5 / RCP8.5 AORI / NIES / JAMSTEC / MEXT 2m temperature change...
28
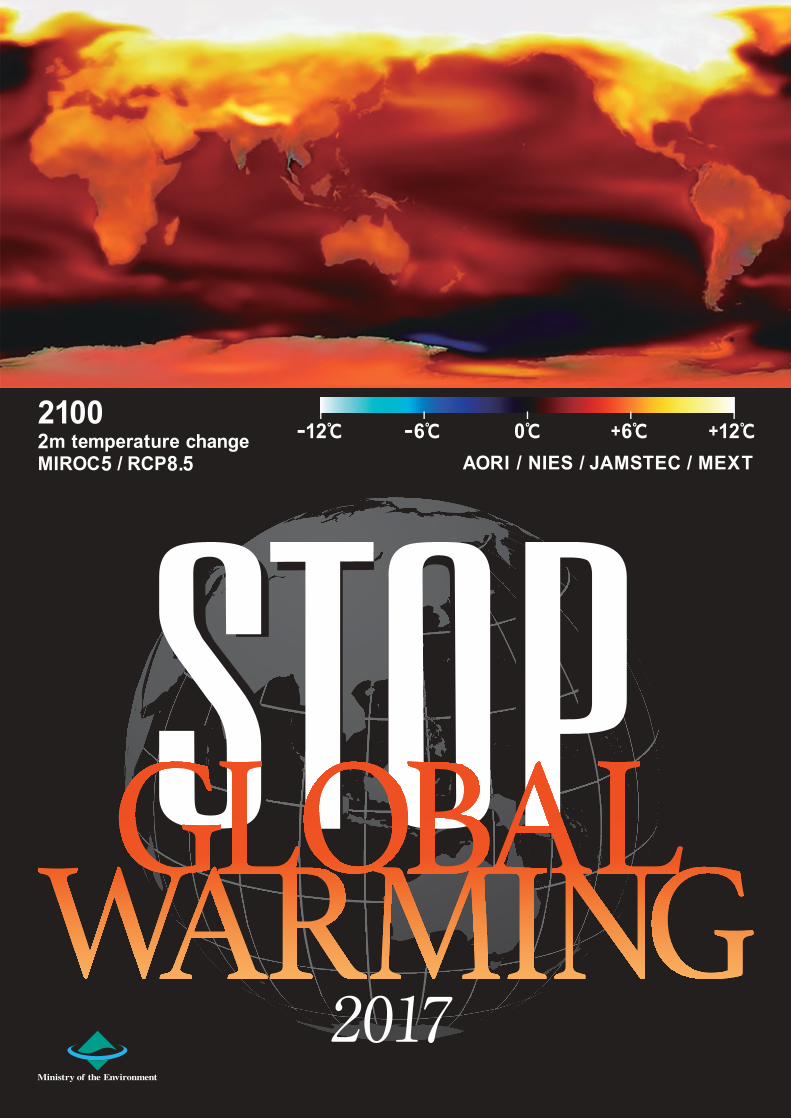
AORI / NIES / JAMSTEC / MEXT MIROC5 / RCP8.5 2m temperature change 2100 - 12℃ +12℃ - 6℃ +6℃ 0℃ 2017
Transcript of 2017 - env.go.jp · MIROC5 / RCP8.5 AORI / NIES / JAMSTEC / MEXT 2m temperature change...
AORI / NIES / JAMSTEC / MEXTMIROC5 / RCP8.52m temperature change2100 -12℃ +12℃-6℃ +6℃0℃
2017
MIROC5 / RCP2.62m temperature change2100 -12℃ +12℃-6℃ +6℃0℃
AORI / NIES / JAMSTEC / MEXT
1. Japan Meteorological Agency (JMA), “Climate Change Monitoring Report 2015” (http://www.data.jma.go.jp/cpdinfo/monitor/2015/pdf/ccmr2015_all.pdf) 2. JMA, “Heavy rainfall and Windstorm Caused by Typhoon No. 7, 11, 9, 10 and Typhoon Front in August 16-31, 2016” (http://www.data.jma.go.jp/obd/stats/data/bosai/report/2016/20160906/jyun_sokuji20160816-31.pdf) 3. JMA website, “Global Average Surface Temperature” (http://www.data.jma.go.jp/cpdinfo/temp/an_wld.html) 4. IPCC, 2013: Climate Change 2013: The Physical Science Basis. Contribution of Working Group I to the Fifth Assessment Report of the Intergovernmental Panel on Climate Change. Original text: http://www.climatechange2013.org/report Japanese translation of “Summary for Policymakers” : http://www.env.go.jp/earth/ipcc/5th/#WG1 5. JMA website, “Long-term Trend of Sea Surface Temperature (Global Mean)” (http://www.data.jma.go.jp/kaiyou/data/shindan/a_1/glb_warm/glb_warm.html) 6. JMA website, “Average Annual Temperature in Japan” (http://www.data.jma.go.jp/cpdinfo/temp/an_jpn.html) 7. JMA website, “Long-term Trend of Sea Surface Temperature (the Sea Near Japan)” (http://www.data.jma.go.jp/kaiyou/data/shindan/a_1/japan_warm/japan_warm.html) 8. JMA website, “Data of Long-term Trend of Sea Surface Temperature (the Sea Near Japan)” (http://www.data.jma.go.jp/kaiyou/data/shindan/a_1/japan_warm/japan_warm_data.html) 9. JMA, “Projections of the Global Temperature Rise Vol. 9” (http://www.data.jma.go.jp/cpdinfo/GWP/index.html)10. JMA, “Projections of the Global Temperature Rise Vol. 8” (http://www.data.jma.go.jp/cpdinfo/GWP/Vol8/pdf/all.pdf)11. IPCC, 2013: Climate Change 2013: The Physical Science Basis. Contribution of Working Group II to the Fifth Assessment Report of the Intergovernmental Panel on Climate Change. Original text: http://ipcc-wg2.gov/AR5/report/ Japanese translation of “Summary for Policymakers” : http://www.env.go.jp/earth/ipcc/5th/#WG212. Ministry of Agriculture, Forestry and Fisheries, Japan (MAFF), “Effects of Global Warming Study Report 2015” (http://www.maff.go.jp/j/seisan/kankyo/ondanka/attach/pdf/index-3.pdf)13. Rural Electronic Library website, “Glossary of ‘Modern Agriculture’” (http://lib.ruralnet.or.jp/genno/yougo/gy056.html)14. MAFF, “Effects of Global Warming Study Report 2014” (http://www.maff.go.jp/j/seisan/kankyo/ondanka/pdf/h26_ondanka_report.pdf)15. Ministry of the Environment (MOE), “Climate Change Adaptation Information Platform portal site” (http://www.adaptation-platform.nies.go.jp/map/national/AgricultureRiceAdp0.html(2017年 2月 10に利用))16. Global Warming Impact and Adaptation Research Project Team (ERTDF S-8, H22-25), “Comprehensive Study on Impact Assessment and Adaptation for Climate Change 2014 Report” (http://www.nies.go.jp/s8_project/symposium/20141110_s8br.pdf)17. National Agriculture and Food Research Organization (NARO) website, “Prediction of the Changes in Suitable Land for Cultivating Apple and Mandarin Orange Caused by Global Warming” (http://www.naro.affrc.go.jp/project/results/laboratory/fruit/2002/fruit02-36.html)18. NARO website, “Holstein Breeding in Our Country: Prediction of Global Warming Impacts on the Summer Extension of Cow” (http://www.naro.affrc.go.jp/project/results/laboratory/nilgs/2009/nilgs09-24.html)19. MAFF, “MAFF Climate Change Adaptation Plan (Overview)” (August 2015) (http://www.maff.go.jp/j/kanbo/kankyo/seisaku/pdf/pdf/3_gaiyou.pdf)20. Toru Taniwaki (2013). Current Situation of Decline21. Toru Suzuki, Masanobu Yamane (2013). Beech Forest Decline Found from Aerial Photographs, Sinrinkagaku, 67, 6-922. National Institute for Environmental Studies (NIES), NEIS Research Booklet No. 53, July, 2014 (http://www.nies.go.jp/kanko/kankyogi/53/53.pdf)23. MOE Naha Natural Environment Office website, “Investigation Result of Coral Bleaching which was Confirmed in Sekisei Lagoon (Notification)” (http://kyushu.env.go.jp/naha/pre_2016/post_22.html)24. Regional Adaptation Forum website, “Regional Adaptation Research Introduction Column (Nagano)” (http://www.adapt-forum.jp/study/column/nagano_2.html)25. Tomohiro Maruoka, Hisanori Itoh(2009).Impact of global warming on flowering of cherry trees (Prunus yedoensis) in Japan, J. Agric. Meteorol. 65(3), 283-29626. Tetsuya Matsui, Nobuyuki Tanaka, Tsutomu Yagihashi, Yuji Kominami, Ikutaro Tsuyama, Kiyoshi Takahashi (2009).Prediction and impact assessment of the changes in suitable habitats for beech (Fagus crenata), Chikyu Kankyo, 14(2), 165-17427. Yara, Yumiko; Yamano, Hiroya; Steinacher, Marco; Fujii, Masahiko; Vogt, Meike; Gruber, Nicolas; Yamanaka, Yasuhiro (2016). Potential Future Coral Habitats Around Japan Depend Strongly on Anthropogenic CO2 Emissions. In: Aquatic Biodiversity Conservation and Ecosystem Services. Ecological Research Monographs (pp. 41-56). Singapore: Springer Singapore 10.1007/978-981-10-0780-4_4 28. Hiroyoshi Higuchi, Shigeto Koike, Mayumi Shigeta (2009).Chikyu kankyo, 14(2), 189-19829. Tohoku Region Ecology and Biodiversity Center, Nature Conservation Bureau, MOE website, “Research Study and Monitoring“ (http://tohoku.env.go.jp/nature/shirakami/research/)30. MOE Office website, “Monitoring Site 1000 -Coral Reef-” (http://www.biodic.go.jp/moni1000/coral_reef.html)31. MOE, “Adaptation to Climate Change in Biodiversity Field” (http://www.env.go.jp/nature/biodic/kikou_tekiou-pamph/tekiou_jp.pdf)32. MOE pamphlet, “Nationwide Efforts of Nature Restoration: Aiming for symbiosis with nature” (https://www.env.go.jp/nature/saisei/network/relate/li_4_1/10.pdf)33. Nagano Prefecture website, “Growth Condition Survey of Grouses “ (http://www.pref.nagano.lg.jp/kanken/chosa/kenkyu/tayose/raicho.html)34. Ryo Sakurai, Hiromi Kobori (2012). Consciousness of People that is Concerned with the Hirosaki Cherry Blossom Festival on Global Warming, People and environment, 38(3) 25-2835. CRED - UNISDR(2016)Poverty & Death: DISASTER MORTALITY, Mortality trends from major disasters from 1996 to 201536. Centre for Research on the Epidemiology of Disasters - CRED(2016)Credcrunch 43: The EM-DAT higher resolution disaster data, CRED37. D. Guha-Sapir, R. Below, Ph. Hoyois - EM-DAT: International Disaster Database – www.emdat.be – Université Catholique de Louvain – Brussels – Belgium.38. Public Relations Office of the Government of Japan website, “’ Water-related Disaster Prevention’ to Protect Your Community from River flooding, High Tide and Urban Flood Damage” (http://www.gov-online.go.jp/useful/article/201507/1.html)39. Public Relations Office of the Government of Japan website, “There are 530,000 Dangerous Places of Landslide Disasters Nationwide! Three Points to Protect Yourself from Landslide Disasters” (http://www.gov-online.go.jp/useful/article/201106/2.html#anc01)40. Ministry of Land, Infrastructure, Transport and Tourism (MLIT), “Situations of Landslide Disasters by Prefecture in Recent Years” (http://www.mlit.go.jp/river/sabo/taisaku_syojoho/dosyasaigai_hasseijokyo.pdf )
41. MOE, “Climate Change Adaptation Information Platform portal site” (http://www.adaptation-platform.nies.go.jp/map/national/DisasterSFGCMc.html)42. EEA (2013), Adaptation in Europe — Addressing risks and opportunities from climate change in the context of socio-economic developments, EEA Report No 3/2013, European Environment Agency, Copenhagen, Denmark. (http://www.eea.europa.eu/publications/adaptation-in-europe/download)43. MLIT, “(Reference) MLIT Climate Change Adaptation Plan” November 2015 (http://www.mlit.go.jp/common/001111531.pdf)44. Meteorological Office website, “Heatwave” (http://www.metoffice.gov.uk/learning/learn-about-the-weather/weather-phenomena/heatwave)45. JMA website, “Temperature, and Humidity” (http://www.jma.go.jp/jma/kishou/know/yougo_hp/kion.html)46. JMA press release, “India Heat Wave Occurred in Late” June 2, 2015 (http://www.data.jma.go.jp/gmd/cpd/monitor/extreme_world/monitor/world20150602.pdf)47. MOE material, “Number of Deaths Caused by 2003 European Heat Wave “ (http://www.env.go.jp/council/06earth/y064-11/mat02-10.pdf)48. MOE pamphlet, “Heat Stroke Environment Health Manual 2014” (http://www.wbgt.env.go.jp/pdf/envman/full.pdf)49. Ministry of Health, Labour and Welfare, “Vital Statistics” (http://www.e-stat.go.jp/SG1/estat/List.do?lid=000001137965)50. JMA website, “Past Weather Data (download)” (http://www.data.jma.go.jp/gmd/risk/obsdl/)51. WHO (2014) Quantitative risk assessment of the effects of climate change on selected causes of death, 2030s and 2050s. (http://apps.who.int/iris/bitstream/10665/134014/1/9789241507691_eng.pdf)52. Japan National Institute of Infectious Diseases, “Response and Countermeasure Handbook for the Occurrence of Domestic Cases of Dengue Fever for Local Governments (Draft)” (http://www.mhlw.go.jp/bunya/kenkou/kekkaku-kansenshou19/dl/20140827-04.pdf)53. MOE, “Climate Change Adaptation Information Platform portal site” (http://www.adaptation-platform.nies.go.jp/map/national/HealthEAAD.htmll(2017年 2月 10に利用))54. Ichiro Kurane(2009).Effect of global warming on infectious diseases, Chikyu kankyo, 14(2), 279-28355. The European Climate Adaptation Platform website, “EuroHEAT online heatwave forecast” (http://climate-adapt.eea.europa.eu/metadata/tools/euroheat-online-heatwave-forecast)56. EuroHEAT project pamphlet, “Cliamate Information Decision Support Tool for Heat in Europe” (http://euroheat-project.org/dwd/flyer_guide.pdf)57. MOE pamphlet, “Guidelines for Measures Against Heat Stroke at Summer Events 2016 -Preliminary Version-” (http://www.wbgt.env.go.jp/pdf/gline/event_guideline2016_all.pdf)58. Yokohama City, “Adaptation Measures of Yokohama City “ (http://www.city.yokohama.lg.jp/ondan/plan/bukai/pdf/3-08shiryou4.pdf)59. MOE website, “Heat Stroke Prevention Site” (http://www.wbgt.env.go.jp/)60. Tokyo Metropolitan Institute of Public Health website, “感染症媒介蚊サーベイランス」 http://www.tokyo-eiken.go.jp/kj_kankyo/mosquito/61. IPCC, 2014: Climate Change 2014: Synthesis Report. Contribution of Working Groups I, II and III to the Fifth Assessment Report of the Intergovernmental Panel on Climate Change. Original text: http://www.ipcc.ch/report/ar5/syr/ Japanese translation of “Summary for Policymakers” : http://www.env.go.jp/earth/ipcc/5th/#SYR62. IPCC, 2014: Climate Change 2014: Mitigation of Climate Change. Contribution of Working Group III to the Fifth Assessment Report of the Intergovernmental Panel on Climate Change. Original text: http://mitigation2014.org/report/ Japanese translation of “Summary for Policymakers” : http://www.env.go.jp/earth/ipcc/5th/#WG363. NIES website, “Whole-atmospheric Monthly CO2 Concentration Based on SATellite ‘IBUKI’ Observation Data (Preliminary Report) “ (http://www.gosat.nies.go.jp/recent-global-co2.html)64. MOE, “Japan’ s National Greenhouse Gas Emissions in Fiscal Year (FY) 2015 (Preliminary Figures)” (http://www.env.go.jp/earth/ondanka/ghg/2015sokuho.pdf)65. MOE materials66. MOE website, “New Mechanism Information Platform” (http://www.mmechanisms.org/initiatives/jcm.html)67. MOE, “Overview of the Bill for the Partial Amendment of the Act on Promotion of Global Warming Measures” (http://www.env.go.jp/press/files/jp/29439.pdf)68. MOE, “Annex 1: Global Warming Countermeasure Plan (Cabinet decision be made in May 13, 2016)” (https://www.env.go.jp/press/files/jp/102816.pdf)69. MOE, “Adaptation Plan for the Impact of Climate Change “ (http://www.env.go.jp/earth/ondanka/tekiou/gaiyou.pdf)70. MOE, “Climate Change Adaptation Information Platform portal site²» (http://www.adaptation-platform.nies.go.jp/)71. MOE website, “COOL CHOICE” (https://ondankataisaku.env.go.jp/coolchoice/index.html)72. WMO, “WMO Statement on the Status of the Global Climate in 2015” (http://library.wmo.int/pmb_ged/wmo_1167_en.pdf)
Front cover: World distribution of temperature deviation of RCP8.5 at 2100 calculated under MIROC5 from annual mean temperature between 1986 and 2005Back cover: World distribution of temperature deviation of RCP2.6 at 2100 calculated under MIROC5 from annual mean temperature between 1986 and 2005
Sources
Planning: Global Environment Bureau, Ministry of the Environment, JapanEditorial Supervisor: National Institute for Environmental StudiesEditing: Mizuho Information & Research Institute, Inc.Published March 31, 2017
1S T O P G L O B A L W A R M I N G 2 017
Chapter Worldwide extreme weather events
01
S T O P G L O B A L W A R M I N G 2 017
Chapter Worldwide extreme weather events1 01
Chapter Global warming--Past and future2
Climate change
Food (agriculture, forestry, and fishery industries)
Natural ecosystem
Natural disaster/coastal area
Human health
2-1
2-2
2-3
2-4
2-5
Factors contributing to global warming
Change in GHG emission
3-1
3-2
Addressing global warming around the world
Addressing global warming in Japan
4-1
4-2
03
Chapter Global warming measures4 21
Chapter FAQLet’s learn more about global warming
526
Chapter Factors contributing to global warming/change in emission
319
Worldwide extreme weather events
S T O P G L O B A L W A R M I N G 2 017
02
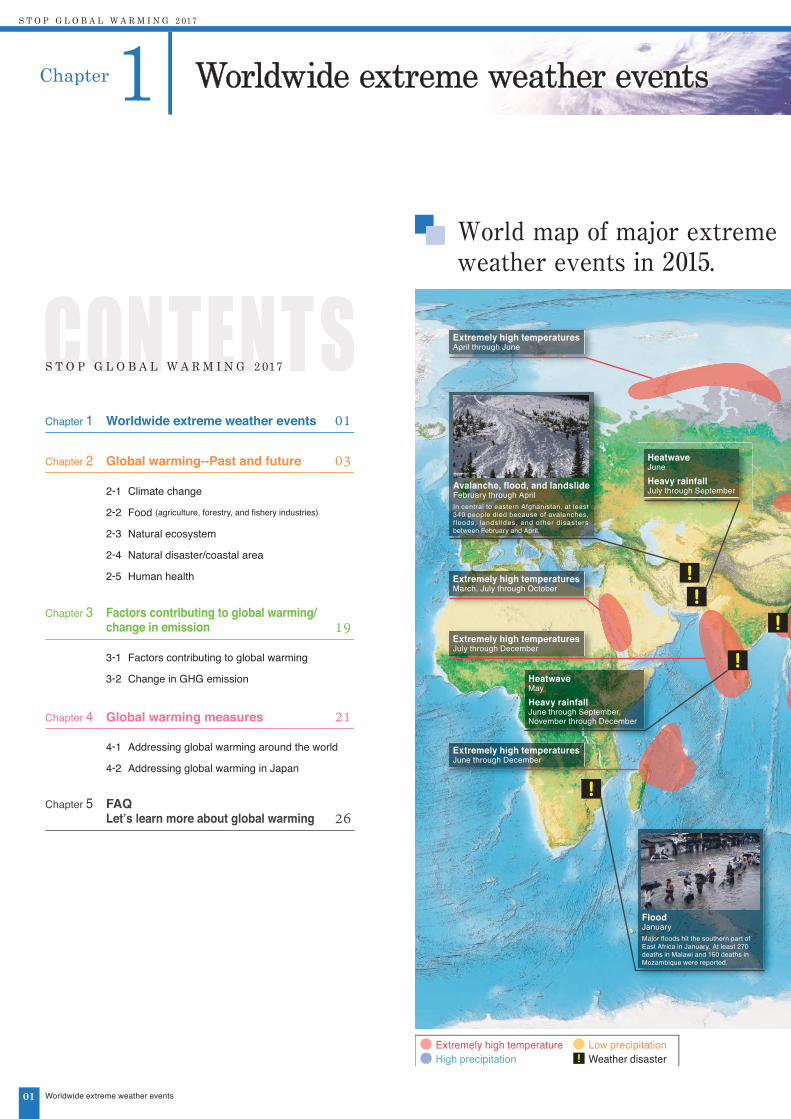
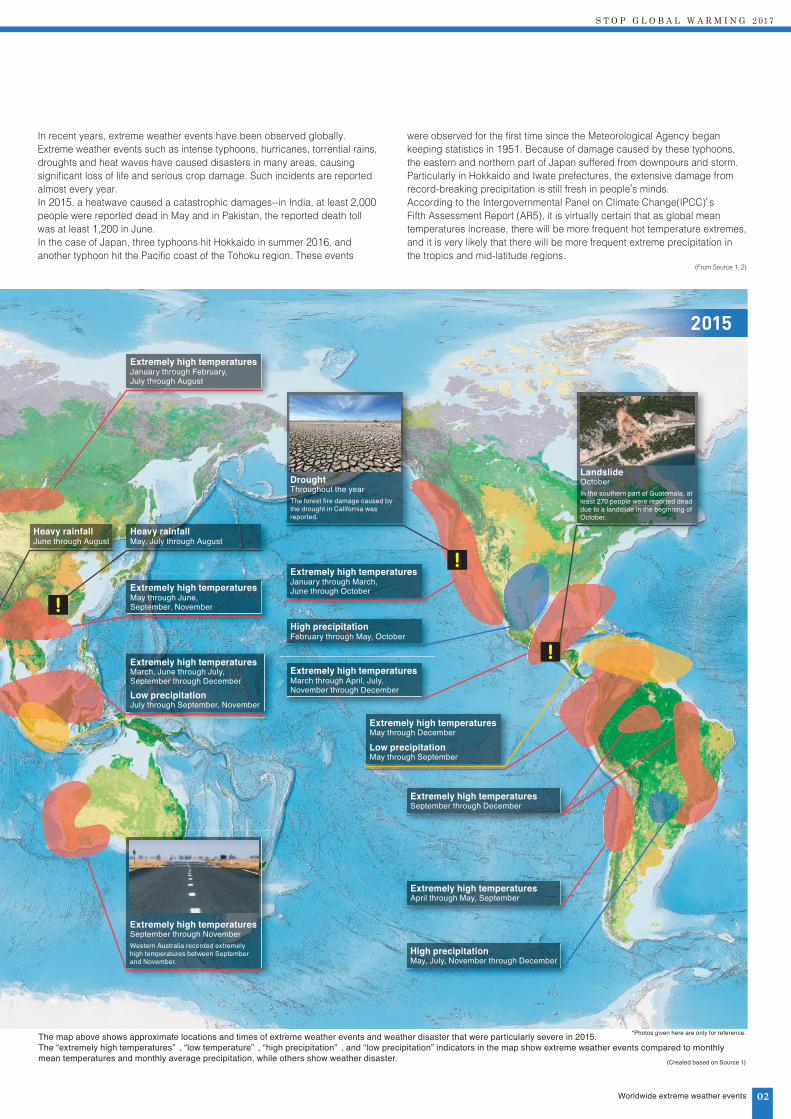
In recent years, extreme weather events have been observed globally. Extreme weather events such as intense typhoons, hurricanes, torrential rains, droughts and heat waves have caused disasters in many areas, causing significant loss of life and serious crop damage. Such incidents are reported almost every year.In 2015, a heatwave caused a catastrophic damages--in India, at least 2,000 people were reported dead in May and in Pakistan, the reported death toll was at least 1,200 in June.In the case of Japan, three typhoons hit Hokkaido in summer 2016, and another typhoon hit the Pacific coast of the Tohoku region. These events
were observed for the first time since the Meteorological Agency began keeping statistics in 1951. Because of damage caused by these typhoons, the eastern and northern part of Japan suffered from downpours and storm. Particularly in Hokkaido and Iwate prefectures, the extensive damage from record-breaking precipitation is still fresh in people’s minds.According to the Intergovernmental Panel on Climate Change(IPCC)’s Fifth Assessment Report (AR5), it is virtually certain that as global mean temperatures increase, there will be more frequent hot temperature extremes, and it is very likely that there will be more frequent extreme precipitation in the tropics and mid-latitude regions.
(From Source 1, 2)
Worldwide extreme weather events
2S T O P G L O B A L W A R M I N G 2 017
Chapter Global warming--Past and future
03
2-1 Climate change
Climate change of the world in the past (global warming)
Temperature increase is continuing
Decreasing snow and ice
The gap between areas with heavy and low rainfall is expanding
Rising sea levels
Increasing sea surface temperatures
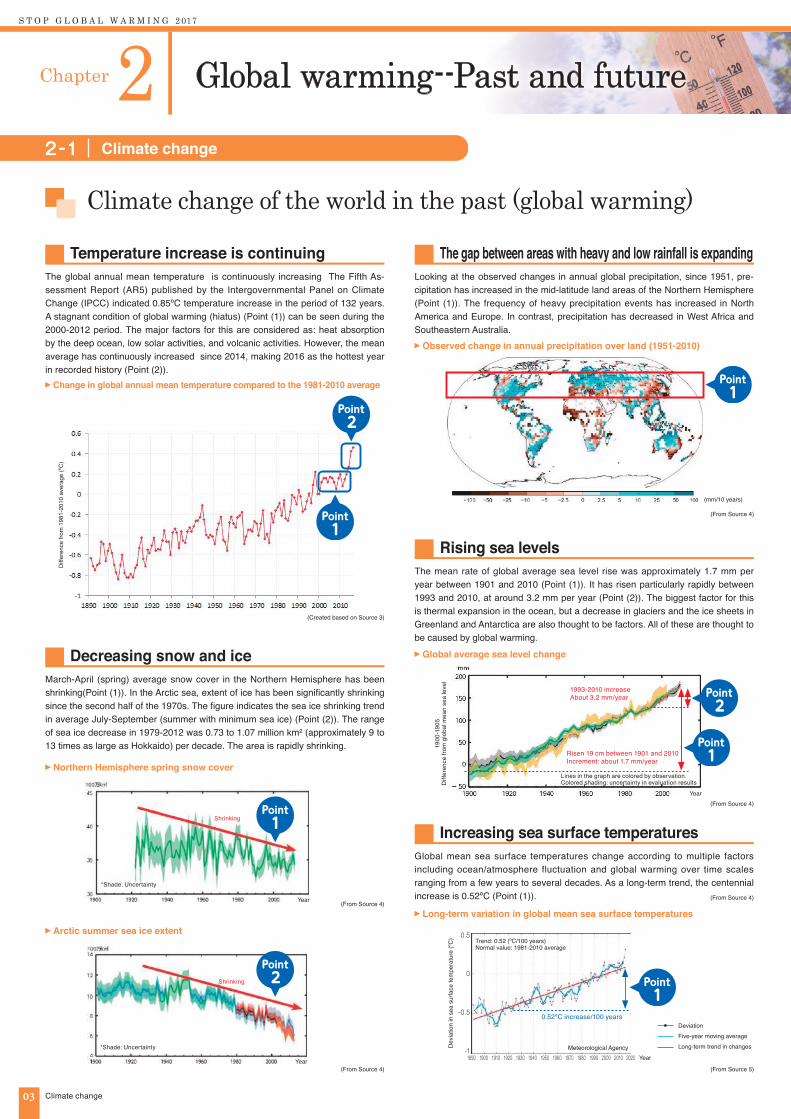
The global annual mean temperature is continuously increasing The Fifth As-sessment Report (AR5) published by the Intergovernmental Panel on Climate Change (IPCC) indicated 0.85ºC temperature increase in the period of 132 years. A stagnant condition of global warming (hiatus) (Point (1)) can be seen during the 2000-2012 period. The major factors for this are considered as: heat absorption by the deep ocean, low solar activities, and volcanic activities. However, the mean average has continuously increased since 2014, making 2016 as the hottest year in recorded history (Point (2)).
March-April (spring) average snow cover in the Northern Hemisphere has been shrinking(Point (1)). In the Arctic sea, extent of ice has been significantly shrinking since the second half of the 1970s. The figure indicates the sea ice shrinking trend in average July-September (summer with minimum sea ice) (Point (2)). The range of sea ice decrease in 1979-2012 was 0.73 to 1.07 million km2 (approximately 9 to 13 times as large as Hokkaido) per decade. The area is rapidly shrinking.
Looking at the observed changes in annual global precipitation, since 1951, pre-cipitation has increased in the mid-latitude land areas of the Northern Hemisphere (Point (1)). The frequency of heavy precipitation events has increased in North America and Europe. In contrast, precipitation has decreased in West Africa and Southeastern Australia.
The mean rate of global average sea level rise was approximately 1.7 mm per year between 1901 and 2010 (Point (1)). It has risen particularly rapidly between 1993 and 2010, at around 3.2 mm per year (Point (2)). The biggest factor for this is thermal expansion in the ocean, but a decrease in glaciers and the ice sheets in Greenland and Antarctica are also thought to be factors. All of these are thought to be caused by global warming.
Global mean sea surface temperatures change according to multiple factors including ocean/atmosphere fluctuation and global warming over time scales ranging from a few years to several decades. As a long-term trend, the centennial increase is 0.52ºC (Point (1)).
Change in global annual mean temperature compared to the 1981-2010 average
Northern Hemisphere spring snow cover
Arctic summer sea ice extent
Observed change in annual precipitation over land (1951-2010)
Global average sea level change
(Created based on Source 3)
Diff
eren
ce fr
om 1
981-
2010
ave
rage
(ºC
)
(mm/10 years)
(From Source 4)
(From Source 4)
(From Source 4)
(From Source 5)
1900
-190
5D
iffer
ence
from
glo
bal m
ean
sea
leve
l
Risen 19 cm between 1901 and 2010Increment: about 1.7 mm/year
1993-2010 increaseAbout 3.2 mm/year
(From Source 4)
(From Source 4)
Lines in the graph are colored by observation.Colored shading: uncertainty in evaluation results
1Point
1Point
1Point
2Point
2Point
0.5
0
-0.5
-1
Trend: 0.52 (ºC/100 years)Normal value: 1981-2010 average
Dev
iatio
n in
sea
sur
face
tem
pera
ture
(ºC
)
Meteorological Agency1890 1900 1910 1920 1930 1940 1950 1960 1970 1980 1990 2000 2010 2020
0.52ºC increase/100 years
1Point
DeviationFive-year moving averageLong-term trend in changes
Climate change
Long-term variation in global mean sea surface temperatures
Year
Year
*Shade: Uncertainty
2Point
Shrinking
Year
*Shade: Uncertainty
1Point
Shrinking
Year

S T O P G L O B A L W A R M I N G 2 017
04Climate change
Climate change of Japan in the past (global warming)
Temperature is increasing in Japan, too The number of extremely hot days is increasing
The number of days with heavy rain is increasing
Increasing sea surface temperature near Japan
As a long-term, annual mean temperature is constantly increasing at a rate of about 1.19ºC per centennial in Japan (Point (1)). When compared to observation results presented in the IPCC AR5, this can be considered a high rate of increase. The report says that global temperature increased by 0.85ºC over a 132 year pe-riod.
Trends in the number of days with a maximum temperature over 35ºC (extremely hot days) clearly indicates an increase over the sample period between 1931 and 2015 of time (Point (1)) The number of days with a minimum temperature under 0ºC (extremely cold days) has decreased, and the number of days with a minimum temperature over 25ºC (hot nights) increased in the same period.
No long-term trends have been observed in Japanese annual precipitation. On the other hand, the number of days in a year with 100 mm precipitation per day increased in the 115 years between 1901 and 2015 (Point (1)). The same trend is observed for the number of days in a year with 200 mm or more precipitation per day. The graph also shows that the number of days in a year with 1.0 mm or more precipitation is decreasing, as the frequency of heavy rain increases. However, the graph also suggests that the number of days with precipitation (including light rain) has decreased (Point (2)).The sea surface temperature near Japan has been constantly increasing*statisti-
cally significant long-term trends can be observed (Point (1)). Annual average sea surface temperature in the sea near Japan (average) up to 2015 is increasing at +1.07ºC/100 years. The rate is higher than the global mean sea surface tempera-ture (+0.52ºC/100 years), and almost equivalent to Japan’s rate of mean tempera-ture increase (+1.19ºC/100 years).
(From Source 6)
(From Source 7)
*Excludes the northeastern part of the Sea of Japan and the area off the coast of Abashiri, where the rate of increase rate has not been calculated.
(From Source 5) (From Source 1)
(From Source 1)
(From Source 1)
Diff
eren
ce b
etw
een
annu
al m
ean
sea
surfa
ce te
mpe
ratu
re
and
mea
n se
a su
rface
tem
pera
ture
for t
he p
erio
d fro
m 1
981
to 2
010
(ºC)
(Created based on Source 8)
Off Kushiro
Off Sanriku
East of Kanto region
South of Kanto region
Off Shikoku and Tokai
East of Okinawa
Northeastern part of the Sea of Japan
Central part of the Sea of Japan
Southwestern part of the Sea of Japan
The Yellow Sea
Northern part of the East China Sea
Southern part of the East China Sea
Sea around the Sakishima Islands
Off Abashiri
1Point
1Point
1Point
Num
ber o
f day
s pe
r yea
r at t
he o
bser
vatio
n po
int
Change in sea surface temperature near Japan
(From Source 1)
(From Source 1)
1Point
2Point
Num
ber o
f day
s pe
r yea
r at t
he o
bser
vatio
n po
int
Num
ber o
f day
s pe
r yea
r at t
he o
bser
vatio
n po
int
The number of days with 100 mm or more precipitation per day in a year
Number of days with 1.0mm or more precipitation per day in a year
Difference between Japanese annual mean temperature and normal value Number of days with a maximum temperature over 35ºC (extremely hot days) in a year
Trend: 0.2 (day/10 years)
Trend: 1.19 (ºC /100 years)
Trend: 0.26 (day/100 years)
Trend: 10.0 (day/100 years)
Diff
eren
ce fr
om 1
981-
2010
ave
rage
(ºC)
Meteorological Agency
Year
Year
Year
Year
Chapter Global warming --Past and future2
05
Climate change of the world in the future (global warming)
Further temperature increases are projected Increasing gap in precipitation between humid and dry regions is projected
Sea ice reduction is accelerated
Sea surface temperature is constantly increasing
Further rise in sea water level is projected
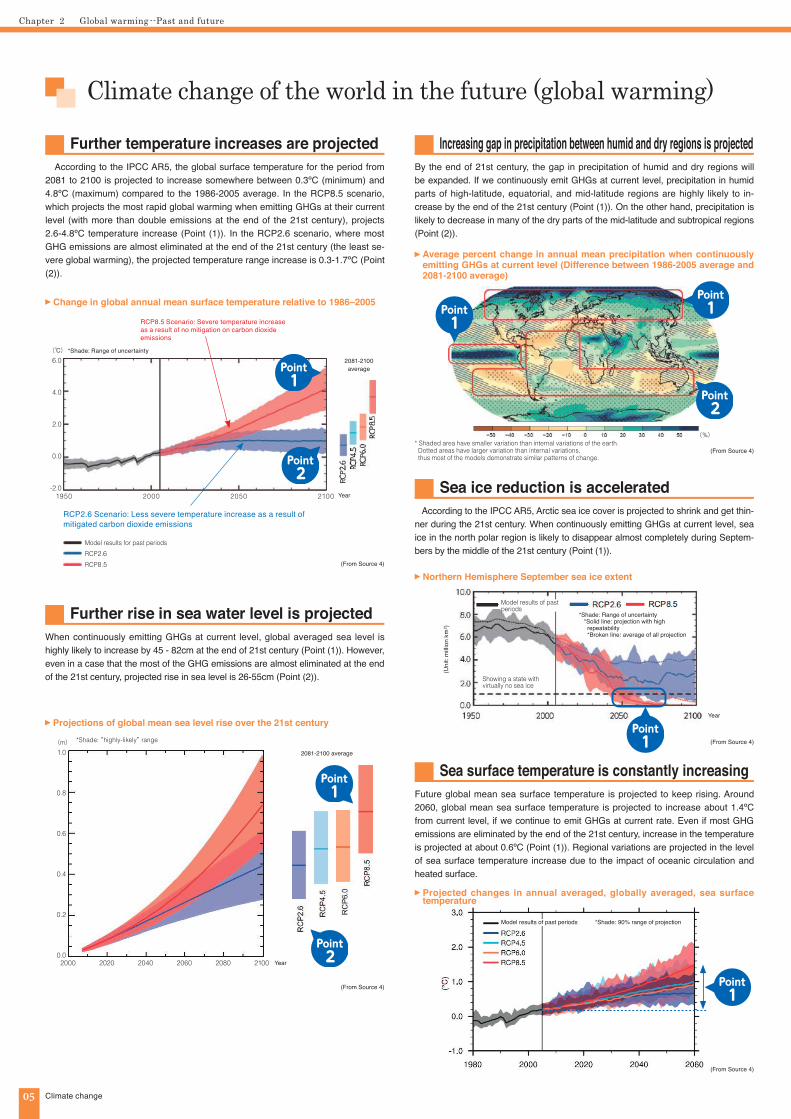
According to the IPCC AR5, the global surface temperature for the period from 2081 to 2100 is projected to increase somewhere between 0.3ºC (minimum) and 4.8ºC (maximum) compared to the 1986-2005 average. In the RCP8.5 scenario, which projects the most rapid global warming when emitting GHGs at their current level (with more than double emissions at the end of the 21st century), projects 2.6-4.8ºC temperature increase (Point (1)). In the RCP2.6 scenario, where most GHG emissions are almost eliminated at the end of the 21st century (the least se-vere global warming), the projected temperature range increase is 0.3-1.7ºC (Point (2)).
By the end of 21st century, the gap in precipitation of humid and dry regions will be expanded. If we continuously emit GHGs at current level, precipitation in humid parts of high-latitude, equatorial, and mid-latitude regions are highly likely to in-crease by the end of the 21st century (Point (1)). On the other hand, precipitation is likely to decrease in many of the dry parts of the mid-latitude and subtropical regions (Point (2)).
According to the IPCC AR5, Arctic sea ice cover is projected to shrink and get thin-ner during the 21st century. When continuously emitting GHGs at current level, sea ice in the north polar region is likely to disappear almost completely during Septem-bers by the middle of the 21st century (Point (1)).
Future global mean sea surface temperature is projected to keep rising. Around 2060, global mean sea surface temperature is projected to increase about 1.4ºC from current level, if we continue to emit GHGs at current rate. Even if most GHG emissions are eliminated by the end of the 21st century, increase in the temperature is projected at about 0.6ºC (Point (1)). Regional variations are projected in the level of sea surface temperature increase due to the impact of oceanic circulation and heated surface.
When continuously emitting GHGs at current level, global averaged sea level is highly likely to increase by 45 - 82cm at the end of 21st century (Point (1)). However, even in a case that the most of the GHG emissions are almost eliminated at the end of the 21st century, projected rise in sea level is 26-55cm (Point (2)).
(From Source 4)
(From Source 4)
* Shaded area have smaller variation than internal variations of the earth. Dotted areas have larger variation than internal variations, thus most of the models demonstrate similar patterns of change.
(From Source 4)
*Shade: Range of uncertainty
(From Source 4)
(From Source 4)
1Point
1Point
*Shade: “highly-likely” range
2Point
2081-2100 average
(m)
(%)
1Point
*Shade: 90% range of projection Model results of past periods
(℃)
Model results for past periodsRCP2.6RCP8.5
1950 2000 2050 2100
2000 2020 2040 2060 2080 2100
6.0
4.0
2.0
0.0
-2.0
1.0
0.8
0.6
0.4
0.2
0.0
2081-2100 average
RCP8.5 Scenario: Severe temperature increase as a result of no mitigation on carbon dioxide emissions
RCP2.6 Scenario: Less severe temperature increase as a result of mitigated carbon dioxide emissions
1Point
2Point
Climate change
1Point
2Point
*Shade: Range of uncertainty *Solid line: projection with high repeatability *Broken line: average of all projection
Model results of past periods
1Point
Showing a state with virtually no sea ice
Change in global annual mean surface temperature relative to 1986–2005
Average percent change in annual mean precipitation when continuously emitting GHGs at current level (Difference between 1986-2005 average and 2081-2100 average)
Northern Hemisphere September sea ice extent
Projected changes in annual averaged, globally averaged, sea surface temperature
Projections of global mean sea level rise over the 21st century
(Uni
t: m
illio
n km
2 )
Year
Year
Year
06
S T O P G L O B A L W A R M I N G 2 017
Climate change of Japan in the future (global warming)
Japan is projected to be hotter Sea surface temperature is projected to increase in most sea area
Frequency of heavy precipitation is projected to increase
Number of hot days are projected to increase
Annual mean temperature at the end of the 21st century is projected to increase throughout Japan. At the end of 21st century, mean Japanese temperature is pro-jected to increase by 3.3-4.9℃ from present level, if we continue to emit GHGs as currently do. Note that high-latitude regions (Point (2)) have severer temperature increase compared to low-latitude regions (Point (1)).
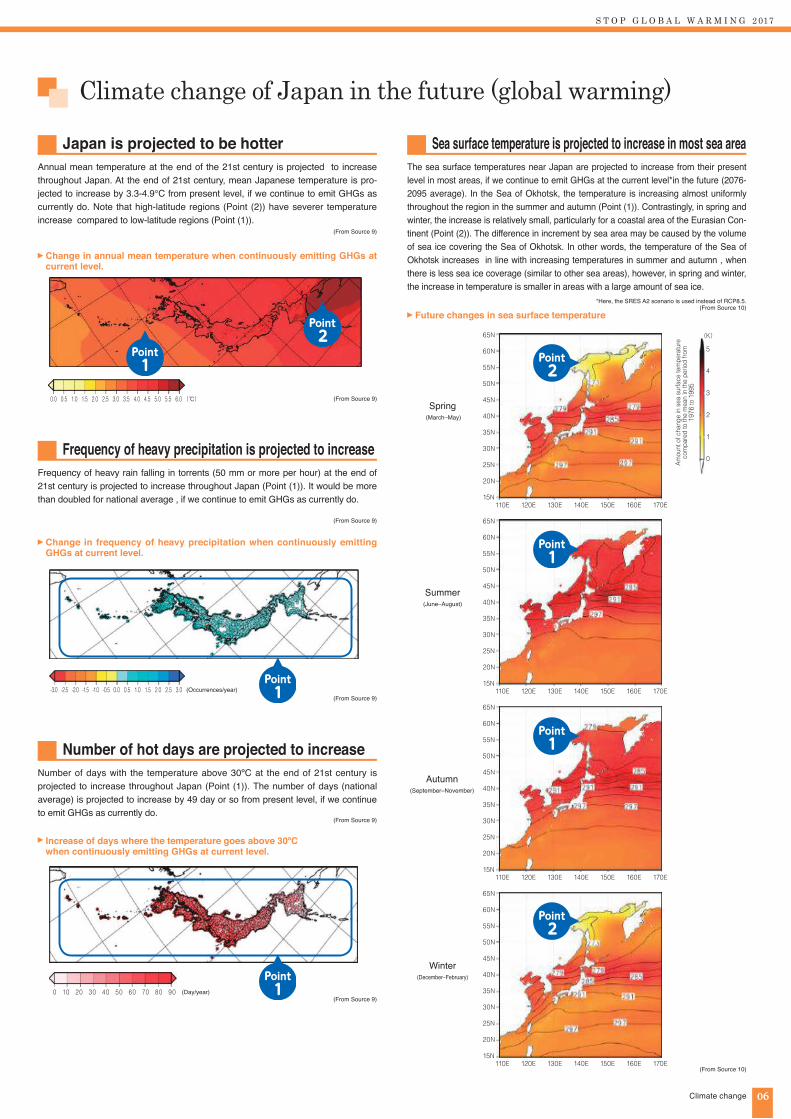
The sea surface temperatures near Japan are projected to increase from their present level in most areas, if we continue to emit GHGs at the current level*in the future (2076-2095 average). In the Sea of Okhotsk, the temperature is increasing almost uniformly throughout the region in the summer and autumn (Point (1)). Contrastingly, in spring and winter, the increase is relatively small, particularly for a coastal area of the Eurasian Con-tinent (Point (2)). The difference in increment by sea area may be caused by the volume of sea ice covering the Sea of Okhotsk. In other words, the temperature of the Sea of Okhotsk increases in line with increasing temperatures in summer and autumn , when there is less sea ice coverage (similar to other sea areas), however, in spring and winter, the increase in temperature is smaller in areas with a large amount of sea ice.
Frequency of heavy rain falling in torrents (50 mm or more per hour) at the end of 21st century is projected to increase throughout Japan (Point (1)). It would be more than doubled for national average , if we continue to emit GHGs as currently do.
Number of days with the temperature above 30ºC at the end of 21st century is projected to increase throughout Japan (Point (1)). The number of days (national average) is projected to increase by 49 day or so from present level, if we continue to emit GHGs as currently do.
(From Source 10)
*Here, the SRES A2 scenario is used instead of RCP8.5.(From Source 10)
Climate change
(From Source 9)
(From Source 9)
(From Source 9)
(From Source 9)
(From Source 9)
(From Source 9)
06
1Point
2Point
1Point
1Point
110E 120E 130E 140E 150E 160E 170E
65N
60N
55N
50N
45N
40N
35N
30N
25N
20N
15N
110E 120E 130E 140E 150E 160E 170E
65N
60N
55N
50N
45N
40N
35N
30N
25N
20N
15N
110E 120E 130E 140E 150E 160E 170E
65N
60N
55N
50N
45N
40N
35N
30N
25N
20N
15N
110E 120E 130E 140E 150E 160E 170E
65N
60N
55N
50N
45N
40N
35N
30N
25N
20N
15N
Spring (March–May)
Summer (June–August)
Autumn (September–November)
Winter (December–February)
1Point
1Point
2Point
2Point
5
4
3
2
1
0
(K)
Amou
nt o
f cha
nge
in s
ea s
urfa
ce te
mpe
ratu
re
com
pare
d to
the
mea
n in
the
perio
d fro
m
1976
to 1
995
0 10 20 30 40 50 60 70 80 90 (Day/year)
-3.0 -2.5 -2.0 -1.5 -1.0 -0.5 0.0 0.5 1.0 1.5 2.0 2.5 3.0 (Occurrences/year)
0.0 0.5 1.0 1.5 2.0 2.5 3.0 3.5 4.0 4.5 5.0 5.5 6.0 (℃)
Increase of days where the temperature goes above 30ºC when continuously emitting GHGs at current level.
Change in frequency of heavy precipitation when continuously emitting GHGs at current level.
Change in annual mean temperature when continuously emitting GHGs at current level.
Future changes in sea surface temperature
Chapter Global warming --Past and future2
07 Food (agriculture, forestry, and fishery industries)
2-2 Food (agriculture, forestry, and fishery industries)
Impact of global warming in the past (Food:agriculture, forestry, and fishery industries)
Yield of major grains is declining in the world
Domestic animals are also impacted
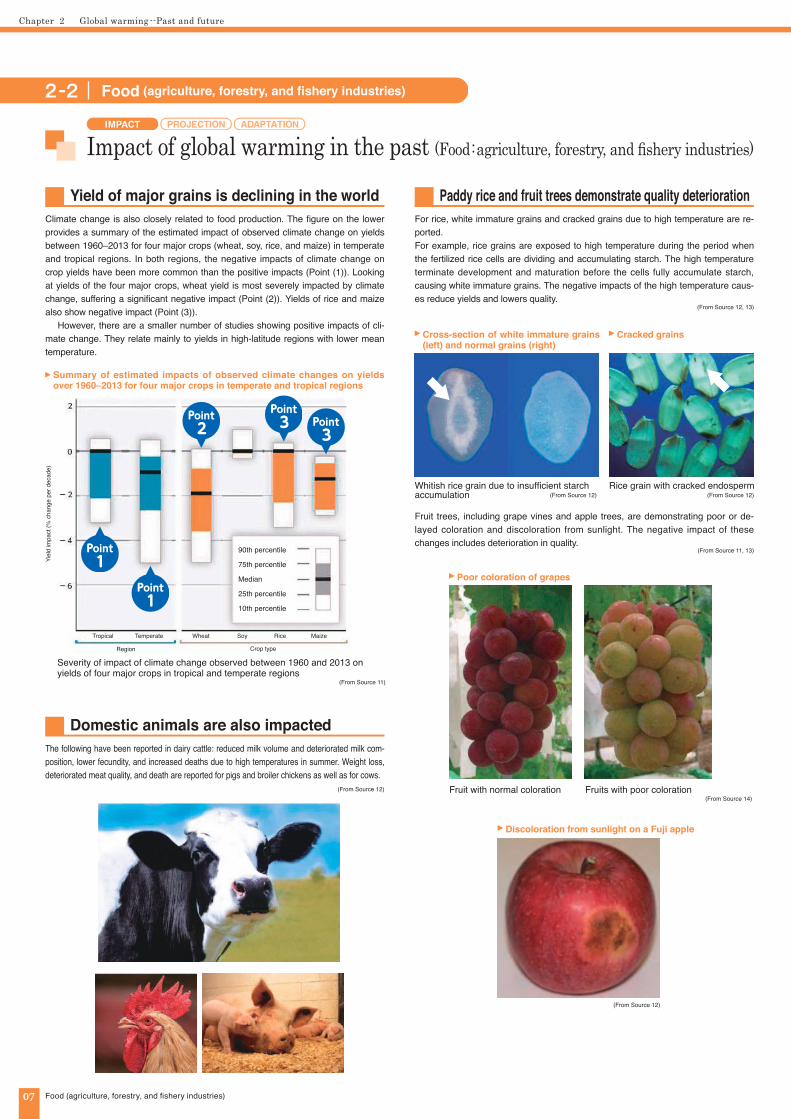
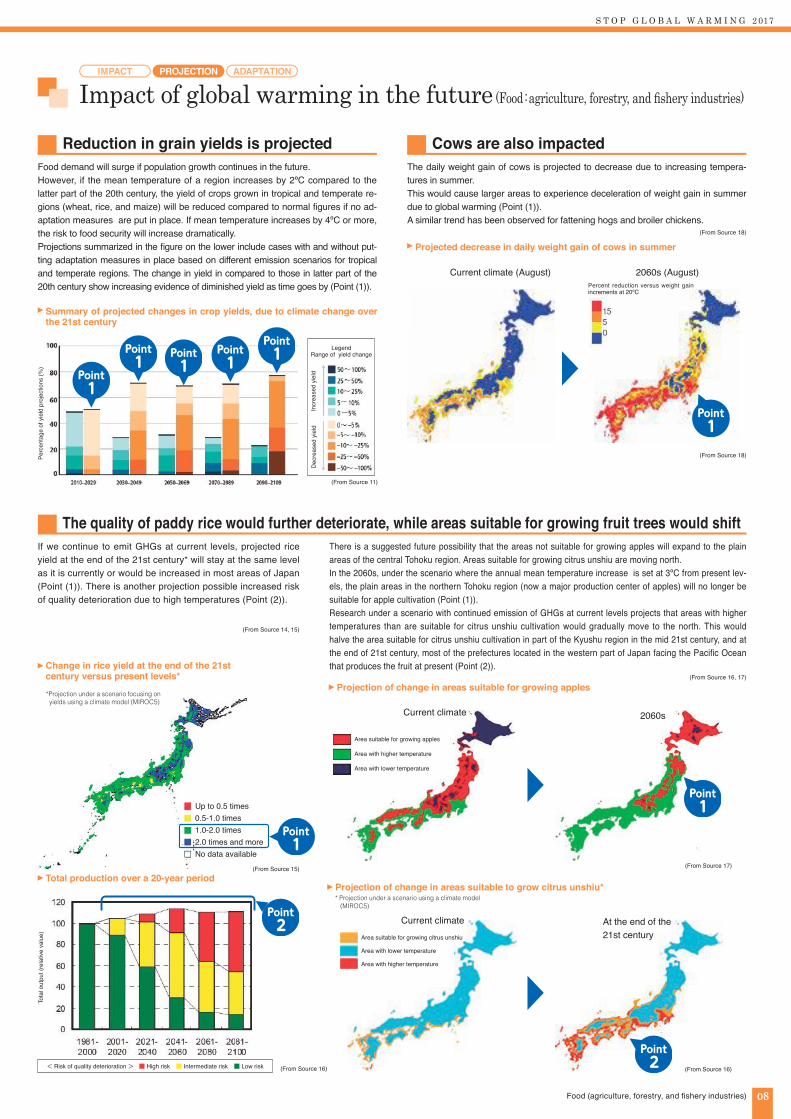
Paddy rice and fruit trees demonstrate quality deteriorationClimate change is also closely related to food production. The figure on the lower provides a summary of the estimated impact of observed climate change on yields between 1960–2013 for four major crops (wheat, soy, rice, and maize) in temperate and tropical regions. In both regions, the negative impacts of climate change on crop yields have been more common than the positive impacts (Point (1)). Looking at yields of the four major crops, wheat yield is most severely impacted by climate change, suffering a significant negative impact (Point (2)). Yields of rice and maize also show negative impact (Point (3)). However, there are a smaller number of studies showing positive impacts of cli-mate change. They relate mainly to yields in high-latitude regions with lower mean temperature.
The following have been reported in dairy cattle: reduced milk volume and deteriorated milk com-position, lower fecundity, and increased deaths due to high temperatures in summer. Weight loss, deteriorated meat quality, and death are reported for pigs and broiler chickens as well as for cows.
For rice, white immature grains and cracked grains due to high temperature are re-ported.For example, rice grains are exposed to high temperature during the period when the fertilized rice cells are dividing and accumulating starch. The high temperature terminate development and maturation before the cells fully accumulate starch, causing white immature grains. The negative impacts of the high temperature caus-es reduce yields and lowers quality.
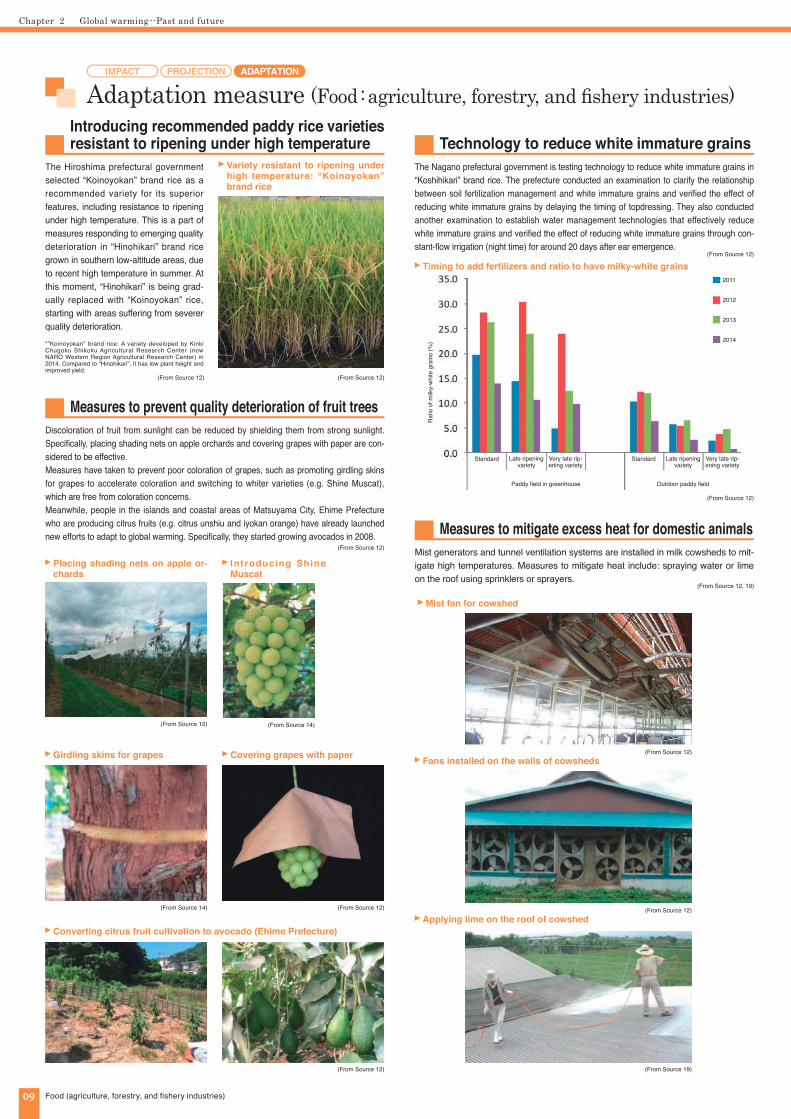
Fruit trees, including grape vines and apple trees, are demonstrating poor or de-layed coloration and discoloration from sunlight. The negative impact of these changes includes deterioration in quality.
(From Source 12)
(From Source 12)
(From Source 11, 13)
(From Source 12, 13)
(From Source 14)
(From Source 12)
Fruit with normal coloration
Whitish rice grain due to insufficient starch accumulation
Rice grain with cracked endosperm
Fruits with poor coloration
(From Source 11)
(From Source 12)
1Point
1Point
2Point
3Point3
Point
IMPACT ADAPTATIONPROJECTION
Summary of estimated impacts of observed climate changes on yields over 1960–2013 for four major crops in temperate and tropical regions
Cross-section of white immature grains (left) and normal grains (right)
Cracked grains
Poor coloration of grapes
Discoloration from sunlight on a Fuji apple
Severity of impact of climate change observed between 1960 and 2013 on yields of four major crops in tropical and temperate regions
Yiel
d im
pact
(% c
hang
e pe
r dec
ade)
Tropical Temperate
Region Crop type
Wheat Soy Rice Maize
90th percentile
75th percentile
Median
25th percentile
10th percentile
S T O P G L O B A L W A R M I N G 2 017
08Food (agriculture, forestry, and fishery industries)
Impact of global warming in the future (Food :agriculture, forestry, and fishery industries)
Reduction in grain yields is projected
The quality of paddy rice would further deteriorate, while areas suitable for growing fruit trees would shift
Cows are also impactedFood demand will surge if population growth continues in the future.However, if the mean temperature of a region increases by 2ºC compared to the latter part of the 20th century, the yield of crops grown in tropical and temperate re-gions (wheat, rice, and maize) will be reduced compared to normal figures if no ad-aptation measures are put in place. If mean temperature increases by 4ºC or more, the risk to food security will increase dramatically.Projections summarized in the figure on the lower include cases with and without put-ting adaptation measures in place based on different emission scenarios for tropical and temperate regions. The change in yield in compared to those in latter part of the 20th century show increasing evidence of diminished yield as time goes by (Point (1)).
If we continue to emit GHGs at current levels, projected rice yield at the end of the 21st century* will stay at the same level as it is currently or would be increased in most areas of Japan (Point (1)). There is another projection possible increased risk of quality deterioration due to high temperatures (Point (2)).
There is a suggested future possibility that the areas not suitable for growing apples will expand to the plain areas of the central Tohoku region. Areas suitable for growing citrus unshiu are moving north.In the 2060s, under the scenario where the annual mean temperature increase is set at 3ºC from present lev-els, the plain areas in the northern Tohoku region (now a major production center of apples) will no longer be suitable for apple cultivation (Point (1)).Research under a scenario with continued emission of GHGs at current levels projects that areas with higher temperatures than are suitable for citrus unshiu cultivation would gradually move to the north. This would halve the area suitable for citrus unshiu cultivation in part of the Kyushu region in the mid 21st century, and at the end of 21st century, most of the prefectures located in the western part of Japan facing the Pacific Ocean that produces the fruit at present (Point (2)).
The daily weight gain of cows is projected to decrease due to increasing tempera-tures in summer.This would cause larger areas to experience deceleration of weight gain in summer due to global warming (Point (1)).A similar trend has been observed for fattening hogs and broiler chickens.
(From Source 15)
Area suitable for growing apples
Area with higher temperature
Area with lower temperature
Area suitable for growing citrus unshiu
Area with lower temperature
Area with higher temperature
(From Source 16)
(From Source 14, 15)
(From Source 16, 17)
(From Source 18)
(From Source 17)
(From Source 16)
Current climate
Current climate
2060s
At the end of the 21st century
*Projection under a scenario focusing on yields using a climate model (MIROC5)
< Risk of quality deterioration> ■ High risk ■ Intermediate risk ■ Low risk
(From Source 11)
* Projection under a scenario using a climate model (MIROC5)
1Point
(From Source 18)
Current climate (August) 2060s (August)Percent reduction versus weight gain increments at 20ºC
1Point
1Point
1Point
1Point
1Point 1
Point
2Point
1Point
2Point
IMPACT ADAPTATIONPROJECTION
Perc
enta
ge o
f yie
ld p
roje
ctio
ns (%
)
Cracked grains
Summary of projected changes in crop yields, due to climate change over the 21st century
Projected decrease in daily weight gain of cows in summer
Change in rice yield at the end of the 21st century versus present levels*
Total production over a 20-year period
Projection of change in areas suitable for growing apples
Projection of change in areas suitable to grow citrus unshiu*
Tota
l out
put (
rela
tive
valu
e)
Incr
ease
d yi
eld
Dec
reas
ed y
ield
Legend Range of yield change
Up to 0.5 times0.5-1.0 times1.0-2.0 times2.0 times and more No data available
Chapter Global warming --Past and future2
09 Food (agriculture, forestry, and fishery industries)
Adaptation measure (Food:agriculture, forestry, and fishery industries) Introducing recommended paddy rice varieties resistant to ripening under high temperature Technology to reduce white immature grains
Measures to mitigate excess heat for domestic animals
Measures to prevent quality deterioration of fruit trees
The Hiroshima prefectural government selected “Koinoyokan” brand rice as a recommended variety for its superior features, including resistance to ripening under high temperature. This is a part of measures responding to emerging quality deterioration in “Hinohikari” brand rice grown in southern low-altitude areas, due to recent high temperature in summer. At this moment, “Hinohikari” is being grad-ually replaced with “Koinoyokan” rice, starting with areas suffering from severer quality deterioration.
The Nagano prefectural government is testing technology to reduce white immature grains in “Koshihikari” brand rice. The prefecture conducted an examination to clarify the relationship between soil fertilization management and white immature grains and verified the effect of reducing white immature grains by delaying the timing of topdressing. They also conducted another examination to establish water management technologies that effectively reduce white immature grains and verified the effect of reducing white immature grains through con-stant-flow irrigation (night time) for around 20 days after ear emergence.
Mist generators and tunnel ventilation systems are installed in milk cowsheds to mit-igate high temperatures. Measures to mitigate heat include: spraying water or lime on the roof using sprinklers or sprayers.
Discoloration of fruit from sunlight can be reduced by shielding them from strong sunlight. Specifically, placing shading nets on apple orchards and covering grapes with paper are con-sidered to be effective.Measures have taken to prevent poor coloration of grapes, such as promoting girdling skins for grapes to accelerate coloration and switching to whiter varieties (e.g. Shine Muscat), which are free from coloration concerns.Meanwhile, people in the islands and coastal areas of Matsuyama City, Ehime Prefecture who are producing citrus fruits (e.g. citrus unshiu and iyokan orange) have already launched new efforts to adapt to global warming. Specifically, they started growing avocados in 2008.
(From Source 12)
(From Source 12)
(From Source 12)
(From Source 12)
(From Source 12)
(From Source 19)
(From Source 12)
(From Source 12, 19)
(From Source 12)
(From Source 14) (From Source 12)
(From Source 14)
(From Source 12)
*”Koinoyokan” brand rice: A variety developed by Kinki Chugoku Shikoku Agricultural Research Center (now NARO Western Region Agricultural Research Center) in 2014. Compared to “Hinohikari”, it has low plant height and improved yield.
IMPACT ADAPTATIONPROJECTION
Variety resistant to ripening under high temperature: “Koinoyokan” brand rice
(From Source 12)
Placing shading nets on apple or-chards
Introducing Shine Muscat
Covering grapes with paperGirdling skins for grapes
Converting citrus fruit cultivation to avocado (Ehime Prefecture)
Mist fan for cowshed
Fans installed on the walls of cowsheds
Applying lime on the roof of cowshed
Timing to add fertilizers and ratio to have milky-white grains
Rat
io o
f milk
y-w
hite
gra
ins
(%)
Paddy field in greenhouse Outdoor paddy field
Standard Late ripening variety
Very late rip-ening variety
Standard Late ripening variety
Very late rip-ening variety
2011
2012
2013
2014
S T O P G L O B A L W A R M I N G 2 017
10
1950 1955 1960 1965 1970 1975 1980 1985 1990 1995 2000 2005 2010 2015
14
12
10
8
6
4
2
0
-2
-4
-6
-8
-10
Devia
tion
from
nor
mal
yea
rs (d
ays)
Natural ecosystem
Impact of global warming in the past(Natural ecosystem)
Earlier flowering date for cherry blossoms Coral bleaching
Concerns over decline of grouse population
Declining beech forests
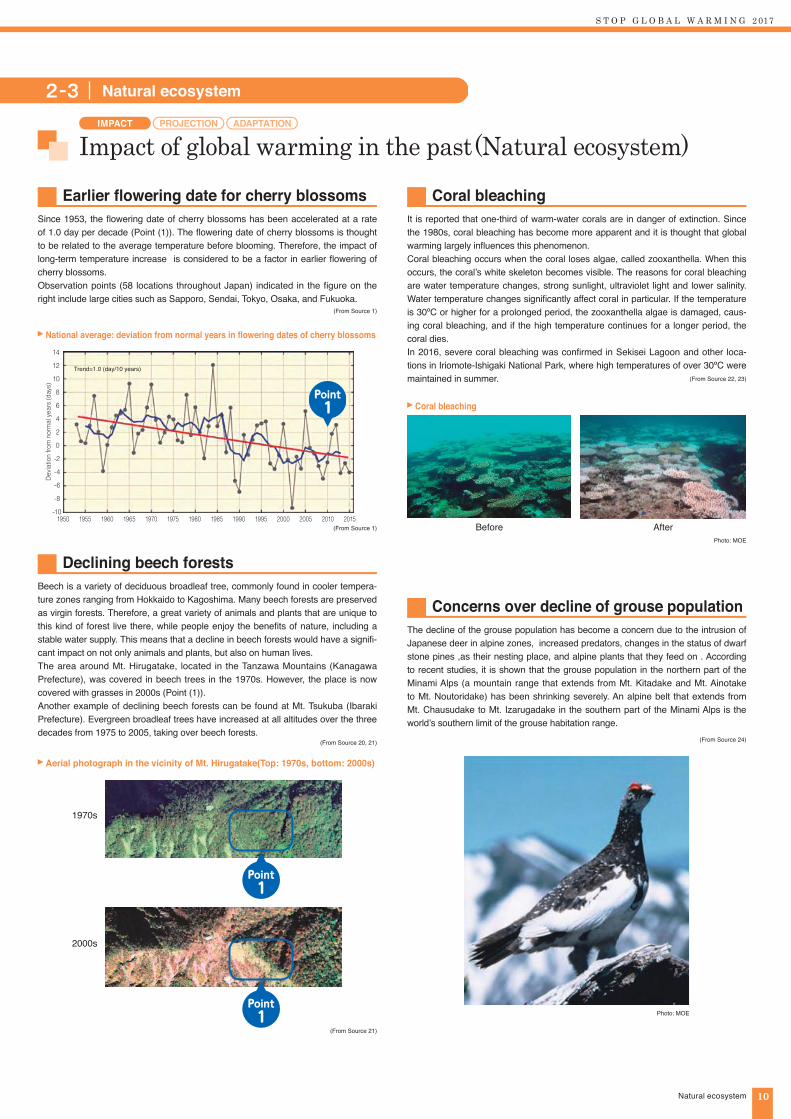
Since 1953, the flowering date of cherry blossoms has been accelerated at a rate of 1.0 day per decade (Point (1)). The flowering date of cherry blossoms is thought to be related to the average temperature before blooming. Therefore, the impact of long-term temperature increase is considered to be a factor in earlier flowering of cherry blossoms.Observation points (58 locations throughout Japan) indicated in the figure on the right include large cities such as Sapporo, Sendai, Tokyo, Osaka, and Fukuoka.
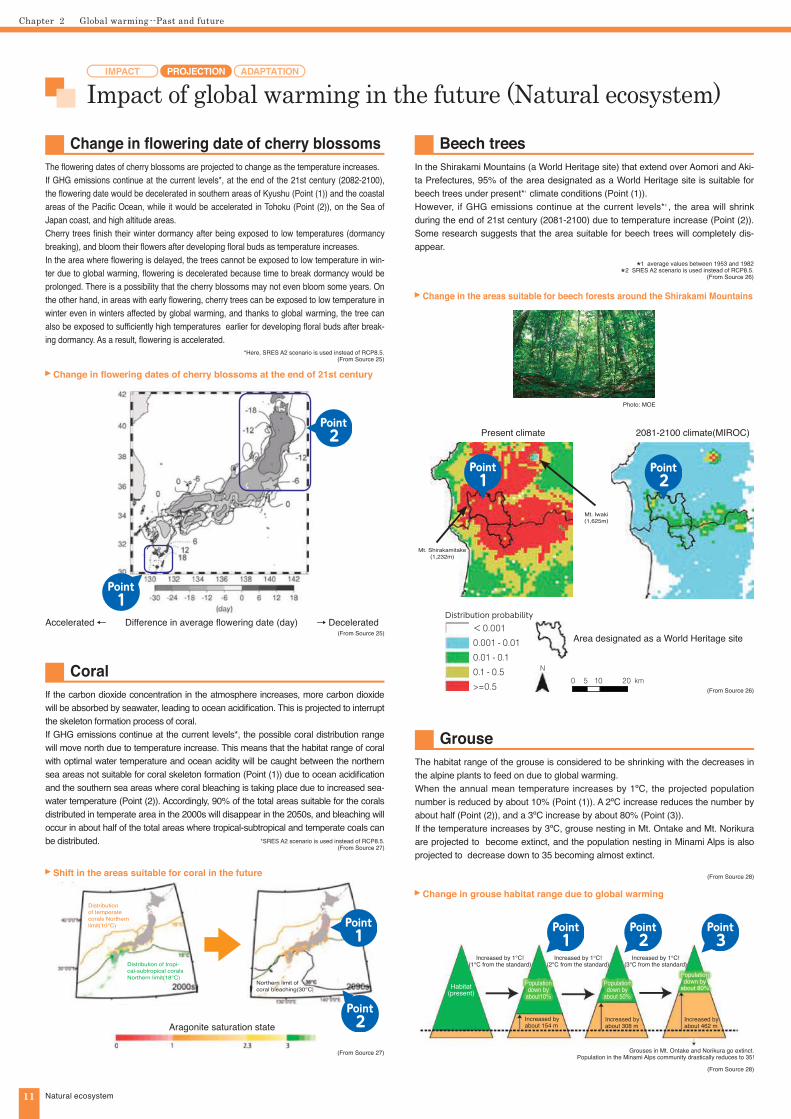
It is reported that one-third of warm-water corals are in danger of extinction. Since the 1980s, coral bleaching has become more apparent and it is thought that global warming largely influences this phenomenon.Coral bleaching occurs when the coral loses algae, called zooxanthella. When this occurs, the coral’s white skeleton becomes visible. The reasons for coral bleaching are water temperature changes, strong sunlight, ultraviolet light and lower salinity. Water temperature changes significantly affect coral in particular. If the temperature is 30ºC or higher for a prolonged period, the zooxanthella algae is damaged, caus-ing coral bleaching, and if the high temperature continues for a longer period, the coral dies.In 2016, severe coral bleaching was confirmed in Sekisei Lagoon and other loca-tions in Iriomote-Ishigaki National Park, where high temperatures of over 30ºC were maintained in summer.
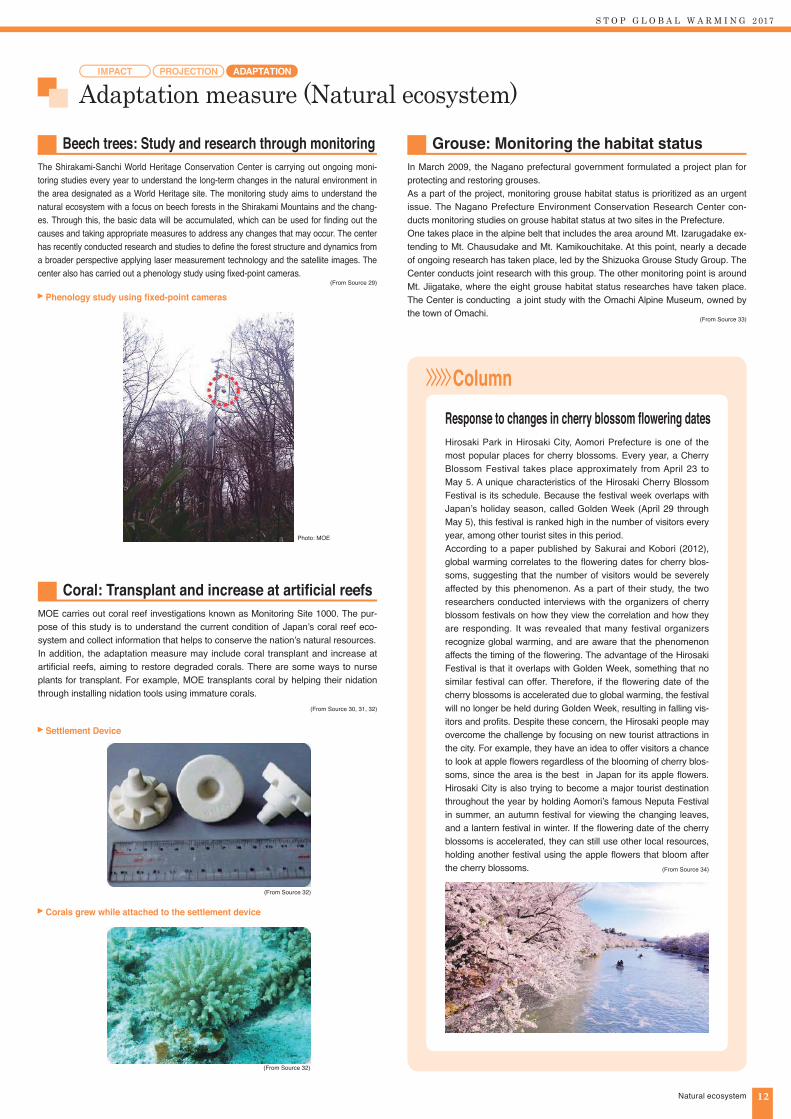
The decline of the grouse population has become a concern due to the intrusion of Japanese deer in alpine zones, increased predators, changes in the status of dwarf stone pines ,as their nesting place, and alpine plants that they feed on . According to recent studies, it is shown that the grouse population in the northern part of the Minami Alps (a mountain range that extends from Mt. Kitadake and Mt. Ainotake to Mt. Noutoridake) has been shrinking severely. An alpine belt that extends from Mt. Chausudake to Mt. Izarugadake in the southern part of the Minami Alps is the world’s southern limit of the grouse habitation range.
Beech is a variety of deciduous broadleaf tree, commonly found in cooler tempera-ture zones ranging from Hokkaido to Kagoshima. Many beech forests are preserved as virgin forests. Therefore, a great variety of animals and plants that are unique to this kind of forest live there, while people enjoy the benefits of nature, including a stable water supply. This means that a decline in beech forests would have a signifi-cant impact on not only animals and plants, but also on human lives.The area around Mt. Hirugatake, located in the Tanzawa Mountains (Kanagawa Prefecture), was covered in beech trees in the 1970s. However, the place is now covered with grasses in 2000s (Point (1)).Another example of declining beech forests can be found at Mt. Tsukuba (Ibaraki Prefecture). Evergreen broadleaf trees have increased at all altitudes over the three decades from 1975 to 2005, taking over beech forests.
(From Source 1)
Photo: MOE
Photo: MOE
(From Source 24)
(From Source 22, 23)
(From Source 21)
(From Source 1)
(From Source 20, 21)
2-3 Natural ecosystem
Before
1970s
2000s
After
1Point
1Point
1Point
IMPACT ADAPTATIONPROJECTION
National average: deviation from normal years in flowering dates of cherry blossoms
Aerial photograph in the vicinity of Mt. Hirugatake(Top: 1970s, bottom: 2000s)
Coral bleaching
Trend=1.0 (day/10 years)
Chapter Global warming --Past and future2
11 Natural ecosystem
Impact of global warming in the future (Natural ecosystem)
Change in flowering date of cherry blossoms Beech trees
Coral
Grouse
The flowering dates of cherry blossoms are projected to change as the temperature increases.If GHG emissions continue at the current levels*, at the end of the 21st century (2082-2100), the flowering date would be decelerated in southern areas of Kyushu (Point (1)) and the coastal areas of the Pacific Ocean, while it would be accelerated in Tohoku (Point (2)), on the Sea of Japan coast, and high altitude areas.Cherry trees finish their winter dormancy after being exposed to low temperatures (dormancy breaking), and bloom their flowers after developing floral buds as temperature increases.In the area where flowering is delayed, the trees cannot be exposed to low temperature in win-ter due to global warming, flowering is decelerated because time to break dormancy would be prolonged. There is a possibility that the cherry blossoms may not even bloom some years. On the other hand, in areas with early flowering, cherry trees can be exposed to low temperature in winter even in winters affected by global warming, and thanks to global warming, the tree can also be exposed to sufficiently high temperatures earlier for developing floral buds after break-ing dormancy. As a result, flowering is accelerated.
In the Shirakami Mountains (a World Heritage site) that extend over Aomori and Aki-ta Prefectures, 95% of the area designated as a World Heritage site is suitable for beech trees under present*1 climate conditions (Point (1)).However, if GHG emissions continue at the current levels*2 , the area will shrink during the end of 21st century (2081-2100) due to temperature increase (Point (2)). Some research suggests that the area suitable for beech trees will completely dis-appear.
If the carbon dioxide concentration in the atmosphere increases, more carbon dioxide will be absorbed by seawater, leading to ocean acidification. This is projected to interrupt the skeleton formation process of coral.If GHG emissions continue at the current levels*, the possible coral distribution range will move north due to temperature increase. This means that the habitat range of coral with optimal water temperature and ocean acidity will be caught between the northern sea areas not suitable for coral skeleton formation (Point (1)) due to ocean acidification and the southern sea areas where coral bleaching is taking place due to increased sea-water temperature (Point (2)). Accordingly, 90% of the total areas suitable for the corals distributed in temperate area in the 2000s will disappear in the 2050s, and bleaching will occur in about half of the total areas where tropical-subtropical and temperate coals can be distributed.
The habitat range of the grouse is considered to be shrinking with the decreases in the alpine plants to feed on due to global warming.When the annual mean temperature increases by 1ºC, the projected population number is reduced by about 10% (Point (1)). A 2ºC increase reduces the number by about half (Point (2)), and a 3ºC increase by about 80% (Point (3)).If the temperature increases by 3ºC, grouse nesting in Mt. Ontake and Mt. Norikura are projected to become extinct, and the population nesting in Minami Alps is also projected to decrease down to 35 becoming almost extinct.
*1 average values between 1953 and 1982
*2 SRES A2 scenario is used instead of RCP8.5.(From Source 26)
*Here, SRES A2 scenario is used instead of RCP8.5.(From Source 25)
Photo: MOE
(From Source 26)
(From Source 27)
(From Source 28)
Aragonite saturation state
1Point
1Point
1Point
2Point
2Point
3Point
2Point
(From Source 25)Accelerated← Difference in average flowering date (day) → Decelerated
Present climate 2081-2100 climate(MIROC)
N0 5 10 20 km
1Point
2Point
Mt. Shirakamitake(1,232m)
< 0.0010.001 - 0.010.01 - 0.10.1 - 0.5>=0.5
Distribution probability
Area designated as a World Heritage site
Mt. Iwaki(1,625m)
Distribution of temperate corals Northern limit(10℃)
Distribution of tropi-cal-subtropical corals Northern limit(18℃)
Northern limit of coral bleaching(30℃)
Change in flowering dates of cherry blossoms at the end of 21st century
Change in the areas suitable for beech forests around the Shirakami Mountains
*SRES A2 scenario is used instead of RCP8.5.(From Source 27)
Shift in the areas suitable for coral in the future (From Source 28)
Change in grouse habitat range due to global warming
Increased by 1°C!(1°C from the standard)
Increased by 1°C!(2°C from the standard)
Increased by 1°C!(3°C from the standard)
Increased by about 154 m
Increased by about 308 m
Increased by about 462 m
Habitat (present)
Population down by
about 50%
Population down by
about10%
Population down by
about 80%
Grouses in Mt. Ontake and Norikura go extinct.Population in the Minami Alps community drastically reduces to 35!
IMPACT ADAPTATIONPROJECTION
S T O P G L O B A L W A R M I N G 2 017
12Natural ecosystem
Adaptation measure (Natural ecosystem)
Beech trees: Study and research through monitoring Grouse: Monitoring the habitat status
Coral: Transplant and increase at artificial reefs
The Shirakami-Sanchi World Heritage Conservation Center is carrying out ongoing moni-toring studies every year to understand the long-term changes in the natural environment in the area designated as a World Heritage site. The monitoring study aims to understand the natural ecosystem with a focus on beech forests in the Shirakami Mountains and the chang-es. Through this, the basic data will be accumulated, which can be used for finding out the causes and taking appropriate measures to address any changes that may occur. The center has recently conducted research and studies to define the forest structure and dynamics from a broader perspective applying laser measurement technology and the satellite images. The center also has carried out a phenology study using fixed-point cameras.
In March 2009, the Nagano prefectural government formulated a project plan for protecting and restoring grouses.As a part of the project, monitoring grouse habitat status is prioritized as an urgent issue. The Nagano Prefecture Environment Conservation Research Center con-ducts monitoring studies on grouse habitat status at two sites in the Prefecture.One takes place in the alpine belt that includes the area around Mt. Izarugadake ex-tending to Mt. Chausudake and Mt. Kamikouchitake. At this point, nearly a decade of ongoing research has taken place, led by the Shizuoka Grouse Study Group. The Center conducts joint research with this group. The other monitoring point is around Mt. Jiigatake, where the eight grouse habitat status researches have taken place. The Center is conducting a joint study with the Omachi Alpine Museum, owned by the town of Omachi.
MOE carries out coral reef investigations known as Monitoring Site 1000. The pur-pose of this study is to understand the current condition of Japan’s coral reef eco-system and collect information that helps to conserve the nation’s natural resources. In addition, the adaptation measure may include coral transplant and increase at artificial reefs, aiming to restore degraded corals. There are some ways to nurse plants for transplant. For example, MOE transplants coral by helping their nidation through installing nidation tools using immature corals.
(From Source 30, 31, 32)
Photo: MOE
(From Source 32)
(From Source 32)
Response to changes in cherry blossom flowering datesHirosaki Park in Hirosaki City, Aomori Prefecture is one of the most popular places for cherry blossoms. Every year, a Cherry Blossom Festival takes place approximately from April 23 to May 5. A unique characteristics of the Hirosaki Cherry Blossom Festival is its schedule. Because the festival week overlaps with Japan’s holiday season, called Golden Week (April 29 through May 5), this festival is ranked high in the number of visitors every year, among other tourist sites in this period.According to a paper published by Sakurai and Kobori (2012), global warming correlates to the flowering dates for cherry blos-soms, suggesting that the number of visitors would be severely affected by this phenomenon. As a part of their study, the two researchers conducted interviews with the organizers of cherry blossom festivals on how they view the correlation and how they are responding. It was revealed that many festival organizers recognize global warming, and are aware that the phenomenon affects the timing of the flowering. The advantage of the Hirosaki Festival is that it overlaps with Golden Week, something that no similar festival can offer. Therefore, if the flowering date of the cherry blossoms is accelerated due to global warming, the festival will no longer be held during Golden Week, resulting in falling vis-itors and profits. Despite these concern, the Hirosaki people may overcome the challenge by focusing on new tourist attractions in the city. For example, they have an idea to offer visitors a chance to look at apple flowers regardless of the blooming of cherry blos-soms, since the area is the best in Japan for its apple flowers. Hirosaki City is also trying to become a major tourist destination throughout the year by holding Aomori’s famous Neputa Festival in summer, an autumn festival for viewing the changing leaves, and a lantern festival in winter. If the flowering date of the cherry blossoms is accelerated, they can still use other local resources, holding another festival using the apple flowers that bloom after the cherry blossoms.
>>>>> Column
(From Source 29)
Phenology study using fixed-point cameras
Settlement Device
Corals grew while attached to the settlement device
(From Source 33)
(From Source 34)
IMPACT ADAPTATIONPROJECTION
Chapter Global warming --Past and future2
13
水害(河川)が10回以上の市町村:925市区町村
水害(河川)が5~9回の市町村 :425市区町村
水害(河川)が1~4回の市町村 :337市区町村
水害(河川)が0回の市町村 :55市区町村
(平成25年末 全市区町村数) :1742市区町村
(出典:水害統計)
53.1%
24.4%
19.3%
3.2%
100%
Natural disaster/coastal area
2-4 Natural disaster/coastal area
Damage in the past (Natural disaster/coastal area)
Flood damage in the world
Flood and landslide disasters in Japan
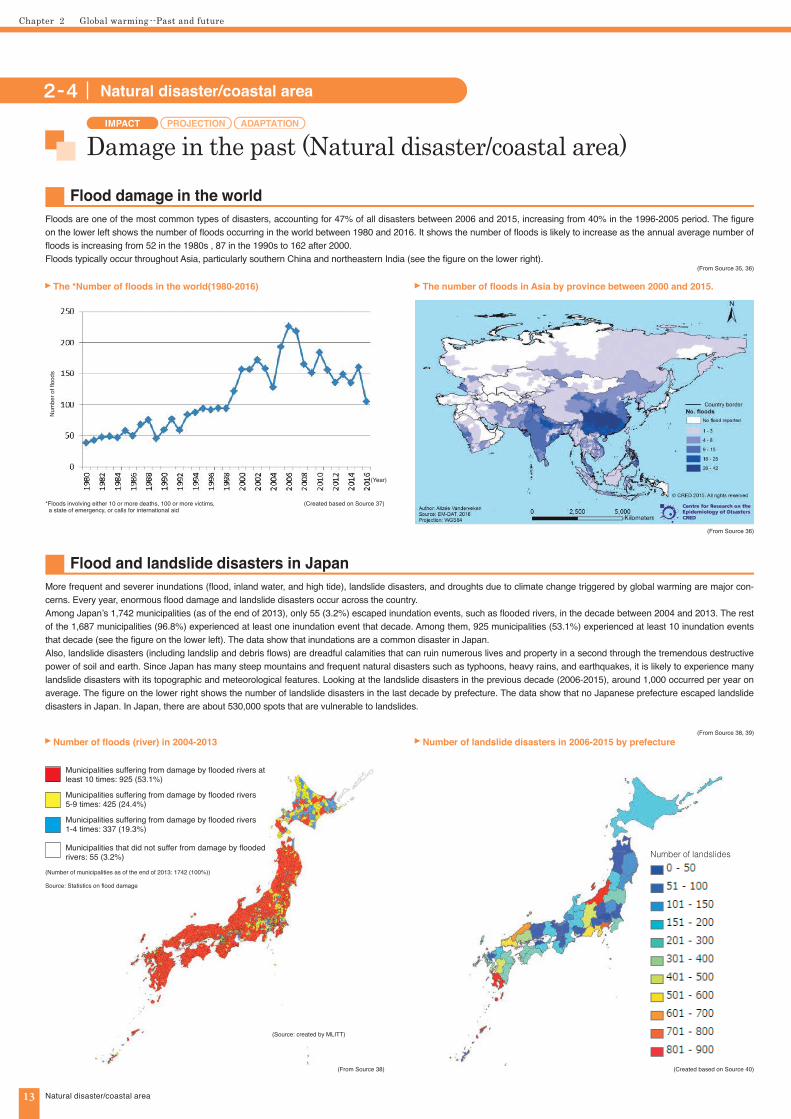
Floods are one of the most common types of disasters, accounting for 47% of all disasters between 2006 and 2015, increasing from 40% in the 1996-2005 period. The figure on the lower left shows the number of floods occurring in the world between 1980 and 2016. It shows the number of floods is likely to increase as the annual average number of floods is increasing from 52 in the 1980s , 87 in the 1990s to 162 after 2000.Floods typically occur throughout Asia, particularly southern China and northeastern India (see the figure on the lower right).
More frequent and severer inundations (flood, inland water, and high tide), landslide disasters, and droughts due to climate change triggered by global warming are major con-cerns. Every year, enormous flood damage and landslide disasters occur across the country.Among Japan’s 1,742 municipalities (as of the end of 2013), only 55 (3.2%) escaped inundation events, such as flooded rivers, in the decade between 2004 and 2013. The rest of the 1,687 municipalities (96.8%) experienced at least one inundation event that decade. Among them, 925 municipalities (53.1%) experienced at least 10 inundation events that decade (see the figure on the lower left). The data show that inundations are a common disaster in Japan.Also, landslide disasters (including landslip and debris flows) are dreadful calamities that can ruin numerous lives and property in a second through the tremendous destructive power of soil and earth. Since Japan has many steep mountains and frequent natural disasters such as typhoons, heavy rains, and earthquakes, it is likely to experience many landslide disasters with its topographic and meteorological features. Looking at the landslide disasters in the previous decade (2006-2015), around 1,000 occurred per year on average. The figure on the lower right shows the number of landslide disasters in the last decade by prefecture. The data show that no Japanese prefecture escaped landslide disasters in Japan. In Japan, there are about 530,000 spots that are vulnerable to landslides.
(From Source 38, 39)
(Created based on Source 37)
(From Source 36)
(Created based on Source 40)(From Source 38)
*Floods involving either 10 or more deaths, 100 or more victims, a state of emergency, or calls for international aid
Num
ber o
f floo
ds
(Year)
水害(河川)が10回以上の市町村 :925市区町村 53.1%
水害(河川)が5~9回の市町村 :425市区町村 24.4%
水害(河川)が1~4回の市町村 :337市区町村 19.3%
水害(河川)が0回の市町村 :55市区町村
(平成25年末 全市区町村数):1742市区町村
3.2%
100%Source: Statistics on flood damage
Number of landslides
IMPACT ADAPTATIONPROJECTION
(From Source 35, 36)
The *Number of floods in the world(1980-2016) The number of floods in Asia by province between 2000 and 2015.
Number of floods (river) in 2004-2013 Number of landslide disasters in 2006-2015 by prefecture
(Source: created by MLITT)
Municipalities suffering from damage by flooded rivers at least 10 times: 925 (53.1%)
Municipalities suffering from damage by flooded rivers 5-9 times: 425 (24.4%)
Municipalities suffering from damage by flooded rivers 1-4 times: 337 (19.3%)
Municipalities that did not suffer from damage by flooded rivers: 55 (3.2%)
(Number of municipalities as of the end of 2013: 1742 (100%))
S T O P G L O B A L W A R M I N G 2 017
14Natural disaster/coastal area
Impact of global warming in the future (Natural disaster/coastal area)
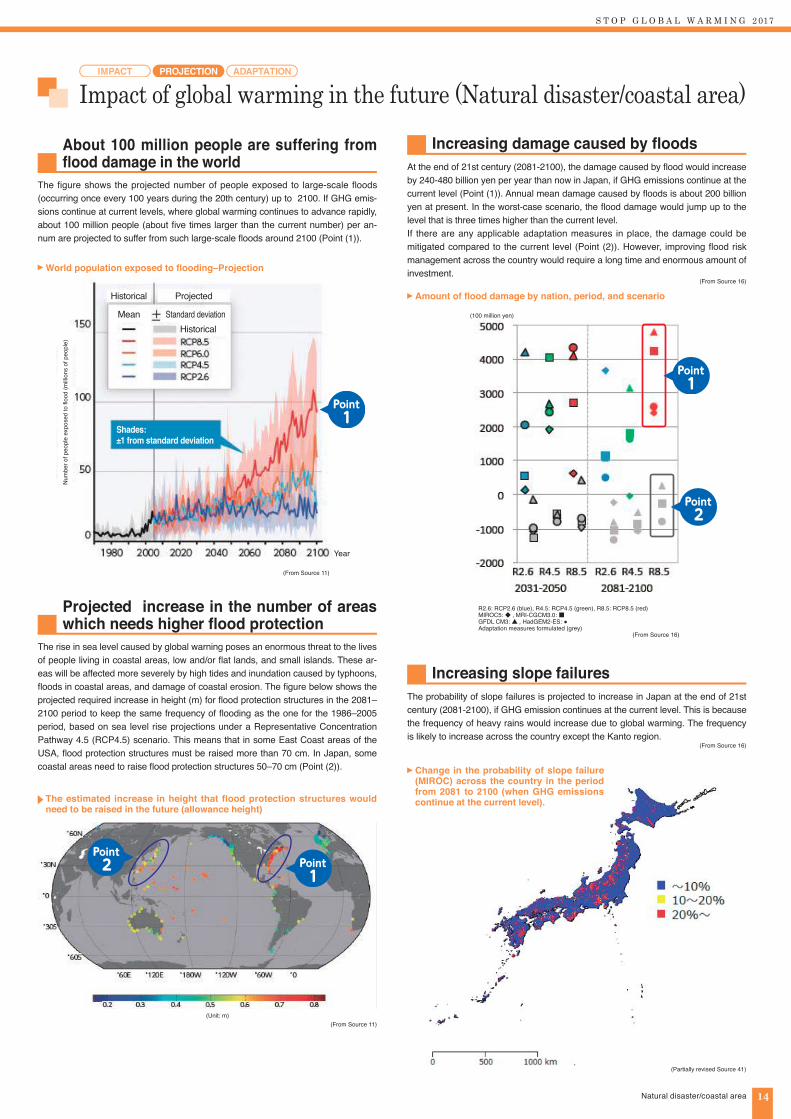
About 100 million people are suffering from flood damage in the world
Increasing damage caused by floods
Increasing slope failures
Projected increase in the number of areas which needs higher flood protection
The figure shows the projected number of people exposed to large-scale floods (occurring once every 100 years during the 20th century) up to 2100. If GHG emis-sions continue at current levels, where global warming continues to advance rapidly, about 100 million people (about five times larger than the current number) per an-num are projected to suffer from such large-scale floods around 2100 (Point (1)).
At the end of 21st century (2081-2100), the damage caused by flood would increase by 240-480 billion yen per year than now in Japan, if GHG emissions continue at the current level (Point (1)). Annual mean damage caused by floods is about 200 billion yen at present. In the worst-case scenario, the flood damage would jump up to the level that is three times higher than the current level.If there are any applicable adaptation measures in place, the damage could be mitigated compared to the current level (Point (2)). However, improving flood risk management across the country would require a long time and enormous amount of investment.
The probability of slope failures is projected to increase in Japan at the end of 21st century (2081-2100), if GHG emission continues at the current level. This is because the frequency of heavy rains would increase due to global warming. The frequency is likely to increase across the country except the Kanto region.
The rise in sea level caused by global warning poses an enormous threat to the lives of people living in coastal areas, low and/or flat lands, and small islands. These ar-eas will be affected more severely by high tides and inundation caused by typhoons, floods in coastal areas, and damage of coastal erosion. The figure below shows the projected required increase in height (m) for flood protection structures in the 2081–2100 period to keep the same frequency of flooding as the one for the 1986–2005 period, based on sea level rise projections under a Representative Concentration Pathway 4.5 (RCP4.5) scenario. This means that in some East Coast areas of the USA, flood protection structures must be raised more than 70 cm. In Japan, some coastal areas need to raise flood protection structures 50–70 cm (Point (2)).
(From Source 16)
(Partially revised Source 41)
Shades: ±1 from standard deviation
Mean
Historical Projected
HistoricalStandard deviation
1Point
1Point
2Point
(100 million yen)
(From Source 11)
IMPACT ADAPTATIONPROJECTION
2Point
1Point
(From Source 11)
World population exposed to flooding–Projection
Amount of flood damage by nation, period, and scenario
The estimated increase in height that flood protection structures would need to be raised in the future (allowance height)
Change in the probability of slope failure (MIROC) across the country in the period from 2081 to 2100 (when GHG emissions continue at the current level).
(From Source 16)
(From Source 16)
Year
Num
ber o
f peo
ple
expo
sed
to fl
ood
(milli
ons
of p
eopl
e)
(Unit: m)
R2.6: RCP2.6 (blue), R4.5: RCP4.5 (green), R8.5: RCP8.5 (red)MIROC5: ◆ , MRI-CGCM3.0: ■GFDL CM3: ▲ , HadGEM2-ES: ●Adaptation measures formulated (grey)
Chapter Global warming --Past and future2
15
Anti-disaster education Having residents’ associations create hazard maps
Natural disaster/coastal area
Adaptation measure(Natural disaster/coastal area)
Tide embankment in UK Sand Motor installed in coastal areas of the Netherlands
Promoting land use and residential areas in consideration of disaster risks
Designing facilities that can endure the change in future sea level
Raising public awareness and anti-disaster education
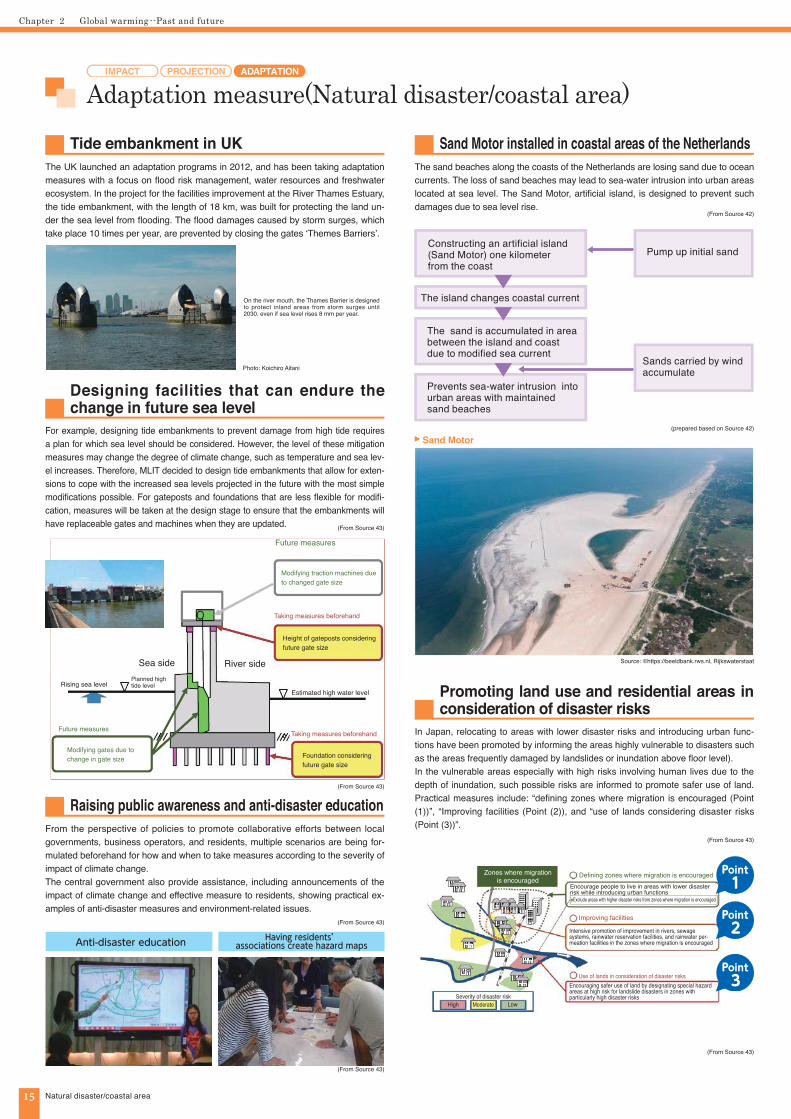
The UK launched an adaptation programs in 2012, and has been taking adaptation measures with a focus on flood risk management, water resources and freshwater ecosystem. In the project for the facilities improvement at the River Thames Estuary, the tide embankment, with the length of 18 km, was built for protecting the land un-der the sea level from flooding. The flood damages caused by storm surges, which take place 10 times per year, are prevented by closing the gates ‘Themes Barriers’.
The sand beaches along the coasts of the Netherlands are losing sand due to ocean currents. The loss of sand beaches may lead to sea-water intrusion into urban areas located at sea level. The Sand Motor, artificial island, is designed to prevent such damages due to sea level rise.
In Japan, relocating to areas with lower disaster risks and introducing urban func-tions have been promoted by informing the areas highly vulnerable to disasters such as the areas frequently damaged by landslides or inundation above floor level).In the vulnerable areas especially with high risks involving human lives due to the depth of inundation, such possible risks are informed to promote safer use of land. Practical measures include: “defining zones where migration is encouraged (Point (1))”, “Improving facilities (Point (2)), and “use of lands considering disaster risks (Point (3))”.
For example, designing tide embankments to prevent damage from high tide requires a plan for which sea level should be considered. However, the level of these mitigation measures may change the degree of climate change, such as temperature and sea lev-el increases. Therefore, MLIT decided to design tide embankments that allow for exten-sions to cope with the increased sea levels projected in the future with the most simple modifications possible. For gateposts and foundations that are less flexible for modifi-cation, measures will be taken at the design stage to ensure that the embankments will have replaceable gates and machines when they are updated.
From the perspective of policies to promote collaborative efforts between local governments, business operators, and residents, multiple scenarios are being for-mulated beforehand for how and when to take measures according to the severity of impact of climate change.The central government also provide assistance, including announcements of the impact of climate change and effective measure to residents, showing practical ex-amples of anti-disaster measures and environment-related issues.
Photo: Koichiro Aitani
(prepared based on Source 42)
(From Source 42)
(From Source 43)
(From Source 43)
Source: ©https://beeldbank.rws.nl, Rijkswaterstaat
(From Source 43)
(From Source 43)
(From Source 43)
(From Source 43)
On the river mouth, the Thames Barrier is designed to protect inland areas from storm surges until 2030, even if sea level rises 8 mm per year.
Constructing an artificial island (Sand Motor) one kilometer from the coast
Sands carried by wind accumulate
Pump up initial sand
The sand is accumulated in area between the island and coast due to modified sea current
Prevents sea-water intrusion into urban areas with maintained sand beaches
The island changes coastal current
1Point
2Point
3Point
IMPACT ADAPTATIONPROJECTION
Sand Motor
Future measures
Modifying traction machines due to changed gate size
Foundation considering future gate size
Zones where migration is encouraged
Rising sea levelEstimated high water level
Planned high tide level
Height of gateposts considering future gate size
Modifying gates due to change in gate size
Future measures
Sea side River side
Taking measures beforehand
Taking measures beforehand
Defining zones where migration is encouraged
Use of lands in consideration of disaster risks
Improving facilities
Encourage people to live in areas with lower disaster risk while introducing urban functions
Intensive promotion of improvement in rivers, sewage systems, rainwater reservation facilities, and rainwater per-meation facilities in the zones where migration is encouraged
Severity of disaster riskHigh Moderate Low
Encouraging safer use of land by designating special hazard areas at high risk for landslide disasters in zones with particularly high disaster risks
※Exclude areas with higher disaster risks from zones where migration is encouraged
S T O P G L O B A L W A R M I N G 2 017
16Human health
Impact of global warming in the past (Human health)
Number of heat waves in the world
Deaths caused by heatstroke in Japan
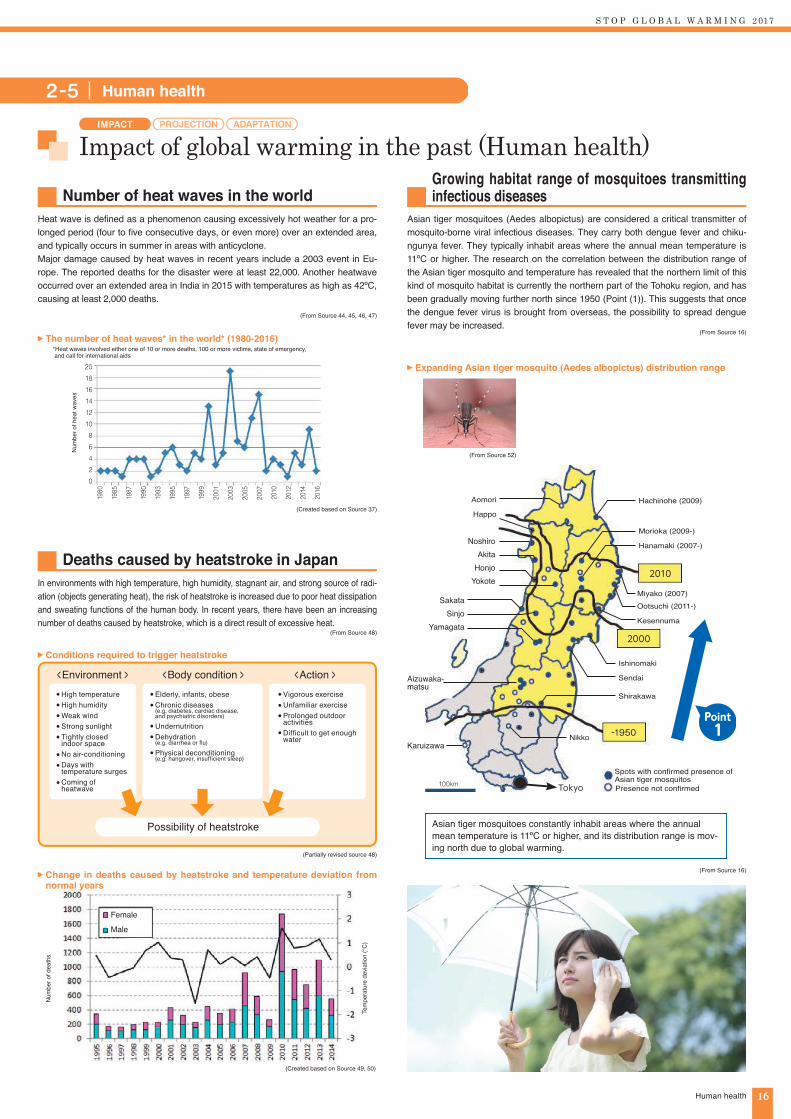
Growing habitat range of mosquitoes transmitting infectious diseases
Heat wave is defined as a phenomenon causing excessively hot weather for a pro-longed period (four to five consecutive days, or even more) over an extended area, and typically occurs in summer in areas with anticyclone. Major damage caused by heat waves in recent years include a 2003 event in Eu-rope. The reported deaths for the disaster were at least 22,000. Another heatwave occurred over an extended area in India in 2015 with temperatures as high as 42ºC, causing at least 2,000 deaths.
In environments with high temperature, high humidity, stagnant air, and strong source of radi-ation (objects generating heat), the risk of heatstroke is increased due to poor heat dissipation and sweating functions of the human body. In recent years, there have been an increasing number of deaths caused by heatstroke, which is a direct result of excessive heat.
Asian tiger mosquitoes (Aedes albopictus) are considered a critical transmitter of mosquito‐borne viral infectious diseases. They carry both dengue fever and chiku-ngunya fever. They typically inhabit areas where the annual mean temperature is 11ºC or higher. The research on the correlation between the distribution range of the Asian tiger mosquito and temperature has revealed that the northern limit of this kind of mosquito habitat is currently the northern part of the Tohoku region, and has been gradually moving further north since 1950 (Point (1)). This suggests that once the dengue fever virus is brought from overseas, the possibility to spread dengue fever may be increased.
(From Source 44, 45, 46, 47)
(From Source 48)
(From Source 16)
2-5 Human health
(Created based on Source 37)
(Partially revised source 48)
(Created based on Source 49, 50)
(From Source 16)
(From Source 52)
*Heat waves involved either one of 10 or more deaths, 100 or more victims, state of emergency, and call for international aids
IMPACT ADAPTATIONPROJECTION
20181614121086420
1980
1985
1987
1990
1993
1995
1997
1999
2001
2003
2005
2007
2010
2012
2014
2016
< Environment > < Body condition >
Possibility of heatstroke
< Action >High temperatureHigh humidityWeak windStrong sunlightTightly closed indoor spaceNo air-conditioningDays with temperature surgesComing of heatwave
Vigorous exerciseUnfamiliar exerciseProlonged outdoor activitiesDifficult to get enough water
Elderly, infants, obeseChronic diseases (e.g. diabetes, cardiac disease, and psychiatric disorders)
UndernutritionDehydration (e.g. diarrhea or flu)
Physical deconditioning (e.g. hangover, insufficient sleep)
1Point
2010
Hachinohe (2009)Aomori
Happo
Shirakawa
Nikko
Aizuwaka-matsu
Tokyo
Morioka (2009-)
Hanamaki (2007-)NoshiroAkita
HonjoYokote
SakataSinjo
Yamagata
Miyako (2007)Ootsuchi (2011-)
Kesennuma
Ishinomaki
Sendai
2000
-1950
Spots with confirmed presence of Asian tiger mosquitos100km
Karuizawa
Asian tiger mosquitoes constantly inhabit areas where the annual mean temperature is 11ºC or higher, and its distribution range is mov-ing north due to global warming.
The number of heat waves* in the world* (1980-2016)
Conditions required to trigger heatstroke
Change in deaths caused by heatstroke and temperature deviation from normal years
Expanding Asian tiger mosquito (Aedes albopictus) distribution range
Presence not confirmed
Num
ber o
f dea
ths
Tem
pera
ture
dev
iatio
n (°
C)
Female
Male
Num
ber o
f hea
t wav
es
Chapter Global warming --Past and future2
17
(From Source 53)
0 500 1000 kmNon-habitat area Habitat area
Human health
Impact of global warming in the future (Human health)
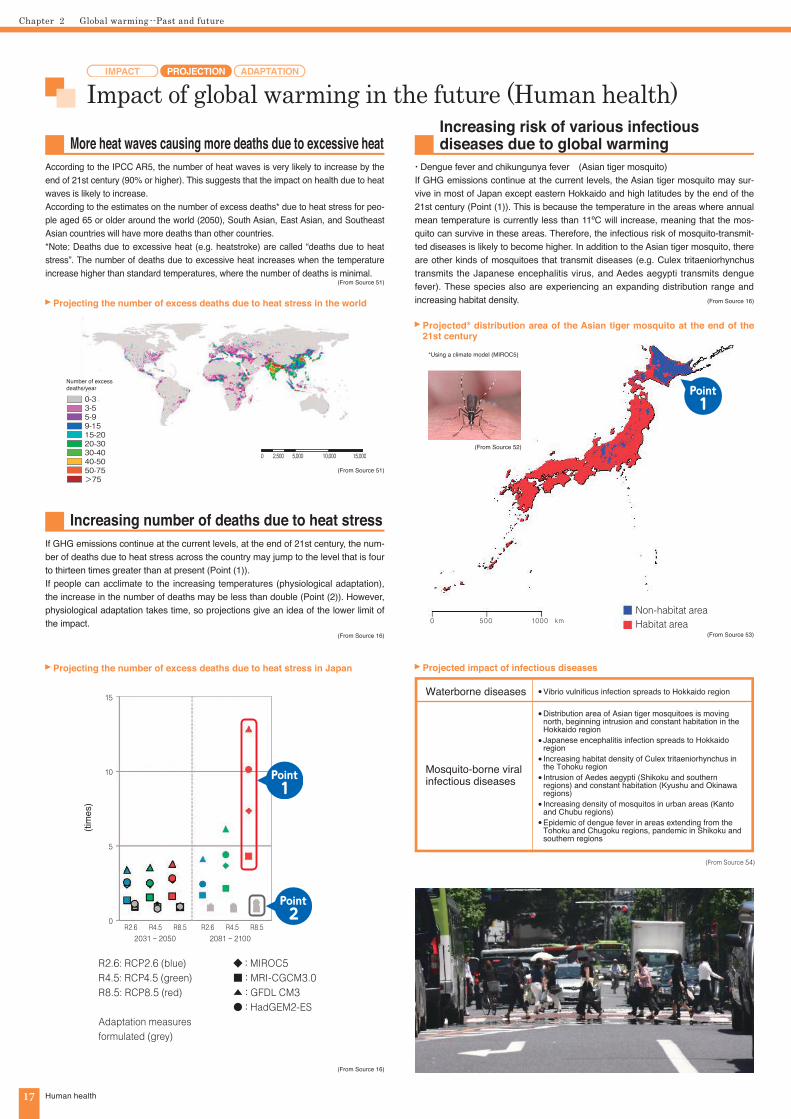
More heat waves causing more deaths due to excessive heatIncreasing risk of various infectious diseases due to global warming
Increasing number of deaths due to heat stress
According to the IPCC AR5, the number of heat waves is very likely to increase by the end of 21st century (90% or higher). This suggests that the impact on health due to heat waves is likely to increase.According to the estimates on the number of excess deaths* due to heat stress for peo-ple aged 65 or older around the world (2050), South Asian, East Asian, and Southeast Asian countries will have more deaths than other countries. *Note: Deaths due to excessive heat (e.g. heatstroke) are called “deaths due to heat stress”. The number of deaths due to excessive heat increases when the temperature increase higher than standard temperatures, where the number of deaths is minimal.
・Dengue fever and chikungunya fever (Asian tiger mosquito)If GHG emissions continue at the current levels, the Asian tiger mosquito may sur-vive in most of Japan except eastern Hokkaido and high latitudes by the end of the 21st century (Point (1)). This is because the temperature in the areas where annual mean temperature is currently less than 11ºC will increase, meaning that the mos-quito can survive in these areas. Therefore, the infectious risk of mosquito-transmit-ted diseases is likely to become higher. In addition to the Asian tiger mosquito, there are other kinds of mosquitoes that transmit diseases (e.g. Culex tritaeniorhynchus transmits the Japanese encephalitis virus, and Aedes aegypti transmits dengue fever). These species also are experiencing an expanding distribution range and increasing habitat density.
If GHG emissions continue at the current levels, at the end of 21st century, the num-ber of deaths due to heat stress across the country may jump to the level that is four to thirteen times greater than at present (Point (1)).If people can acclimate to the increasing temperatures (physiological adaptation), the increase in the number of deaths may be less than double (Point (2)). However, physiological adaptation takes time, so projections give an idea of the lower limit of the impact.
(From Source 51)
(From Source 16)
(From Source 16)
(From Source 51)
(From Source 54)
(From Source 16)
1Point
0 2,500 5,000 10,000 15,000
Number of excess deaths/year
0-33-55-99-1515-2020-3030-4040-5050-75>75
IMPACT ADAPTATIONPROJECTION
(From Source 52)
Waterborne diseases
Mosquito-borne viral infectious diseases
Vibrio vulnificus infection spreads to Hokkaido region
Distribution area of Asian tiger mosquitoes is moving north, beginning intrusion and constant habitation in the Hokkaido regionJapanese encephalitis infection spreads to Hokkaido regionIncreasing habitat density of Culex tritaeniorhynchus in the Tohoku regionIntrusion of Aedes aegypti (Shikoku and southern regions) and constant habitation (Kyushu and Okinawa regions)Increasing density of mosquitos in urban areas (Kanto and Chubu regions)Epidemic of dengue fever in areas extending from the Tohoku and Chugoku regions, pandemic in Shikoku and southern regions
R2.6: RCP2.6 (blue)R4.5: RCP4.5 (green)R8.5: RCP8.5 (red)
Adaptation measures formulated (grey)
◆:MIROC5■:MRI-CGCM3.0▲:GFDL CM3●:HadGEM2-ES
R2.6 R4.5 R8.5 R2.6 R4.5 R8.5 2031 - 2050 2081 - 2100
15
10
5
0
1Point
2Point
*Using a climate model (MIROC5)
Projecting the number of excess deaths due to heat stress in the world
Projecting the number of excess deaths due to heat stress in Japan
(tim
es)
Projected※ distribution area of the Asian tiger mosquito at the end of the 21st century
Projected impact of infectious diseases
S T O P G L O B A L W A R M I N G 2 017
18Human health
Adaptation measure (Human health)
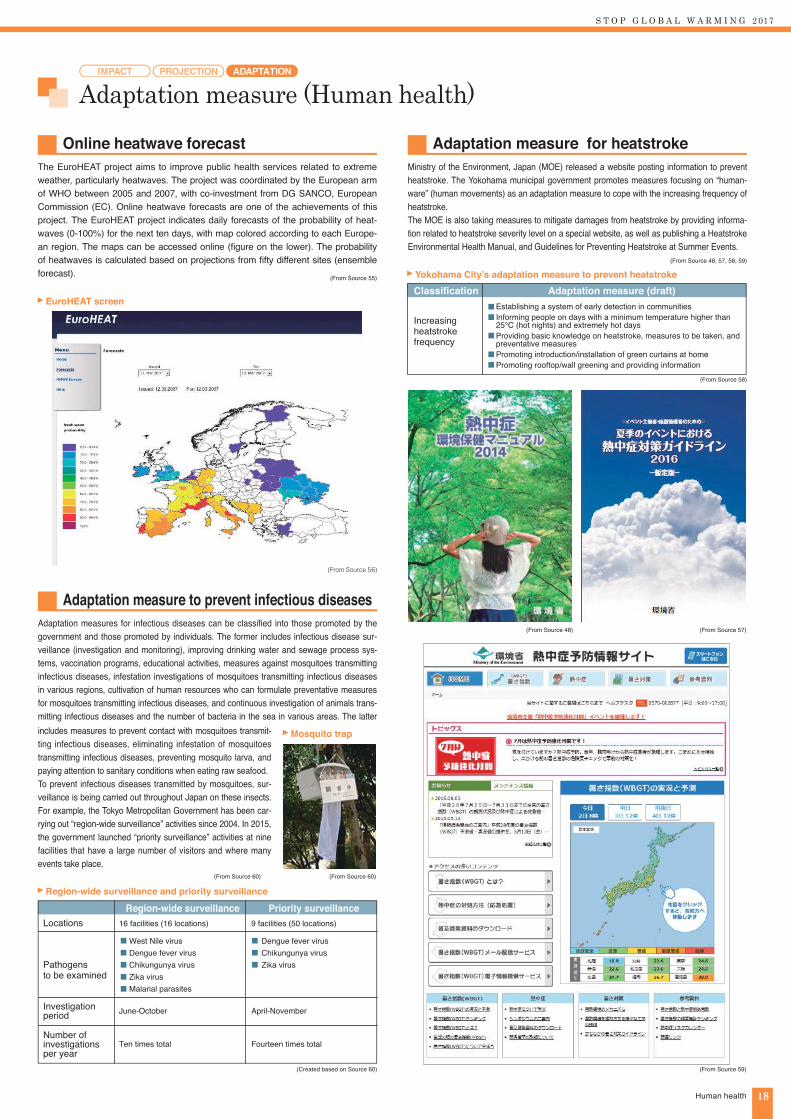
Online heatwave forecast
Adaptation measure to prevent infectious diseases
Adaptation measure for heatstrokeThe EuroHEAT project aims to improve public health services related to extreme weather, particularly heatwaves. The project was coordinated by the European arm of WHO between 2005 and 2007, with co-investment from DG SANCO, European Commission (EC). Online heatwave forecasts are one of the achievements of this project. The EuroHEAT project indicates daily forecasts of the probability of heat-waves (0-100%) for the next ten days, with map colored according to each Europe-an region. The maps can be accessed online (figure on the lower). The probability of heatwaves is calculated based on projections from fifty different sites (ensemble forecast).
Adaptation measures for infectious diseases can be classified into those promoted by the government and those promoted by individuals. The former includes infectious disease sur-veillance (investigation and monitoring), improving drinking water and sewage process sys-tems, vaccination programs, educational activities, measures against mosquitoes transmitting infectious diseases, infestation investigations of mosquitoes transmitting infectious diseases in various regions, cultivation of human resources who can formulate preventative measures for mosquitoes transmitting infectious diseases, and continuous investigation of animals trans-mitting infectious diseases and the number of bacteria in the sea in various areas. The latter includes measures to prevent contact with mosquitoes transmit-ting infectious diseases, eliminating infestation of mosquitoes transmitting infectious diseases, preventing mosquito larva, and paying attention to sanitary conditions when eating raw seafood.To prevent infectious diseases transmitted by mosquitoes, sur-veillance is being carried out throughout Japan on these insects. For example, the Tokyo Metropolitan Government has been car-rying out “region-wide surveillance” activities since 2004. In 2015, the government launched “priority surveillance” activities at nine facilities that have a large number of visitors and where many events take place.
Ministry of the Environment, Japan (MOE) released a website posting information to prevent heatstroke. The Yokohama municipal government promotes measures focusing on “human-ware” (human movements) as an adaptation measure to cope with the increasing frequency of heatstroke.The MOE is also taking measures to mitigate damages from heatstroke by providing informa-tion related to heatstroke severity level on a special website, as well as publishing a Heatstroke Environmental Health Manual, and Guidelines for Preventing Heatstroke at Summer Events.
(From Source 55)
(From Source 60)(From Source 60)
(From Source 59)(Created based on Source 60)
(From Source 48, 57, 58, 59)
(From Source 58)
(From Source 57)(From Source 48)
Classification Adaptation measure (draft)
Increasing heatstroke frequency
Establishing a system of early detection in communitiesInforming people on days with a minimum temperature higher than 25℃ (hot nights) and extremely hot daysProviding basic knowledge on heatstroke, measures to be taken, and preventative measuresPromoting introduction/installation of green curtains at homePromoting rooftop/wall greening and providing information
Region-wide surveillance Priority surveillanceLocations
Pathogens to be examined
Investigation period
Number of investigations per year
16 facilities (16 locations) 9 facilities (50 locations)
June-October April-November
Ten times total Fourteen times total
West Nile virusDengue fever virusChikungunya virusZika virusMalarial parasites
Dengue fever virusChikungunya virusZika virus
(From Source 56)
IMPACT ADAPTATIONPROJECTION
EuroHEAT screen
Yokohama City’s adaptation measure to prevent heatstroke
Region-wide surveillance and priority surveillance
Mosquito trap
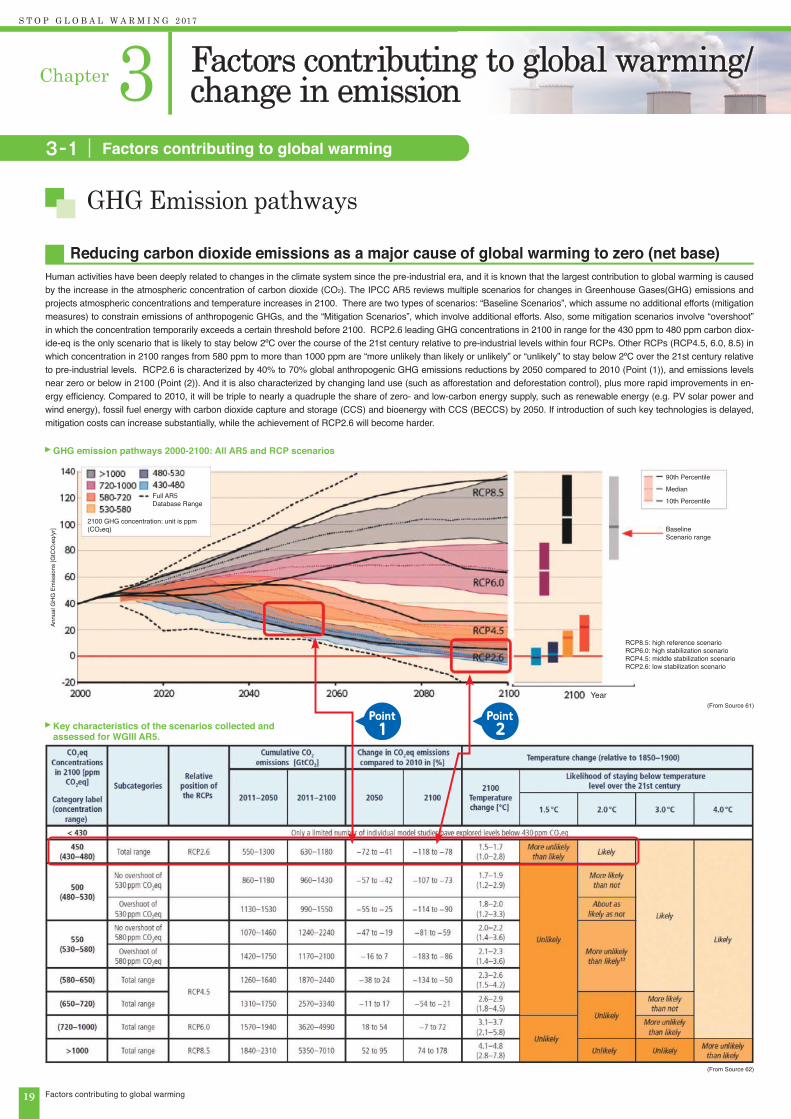
3S T O P G L O B A L W A R M I N G 2 017
Chapter Factors contributing to global warming/change in emission
19 Factors contributing to global warming
3-1 Factors contributing to global warming
1Point
2Point
GHG Emission pathways
Reducing carbon dioxide emissions as a major cause of global warming to zero (net base)Human activities have been deeply related to changes in the climate system since the pre-industrial era, and it is known that the largest contribution to global warming is caused by the increase in the atmospheric concentration of carbon dioxide (CO2). The IPCC AR5 reviews multiple scenarios for changes in Greenhouse Gases(GHG) emissions and projects atmospheric concentrations and temperature increases in 2100. There are two types of scenarios: “Baseline Scenarios”, which assume no additional efforts (mitigation measures) to constrain emissions of anthropogenic GHGs, and the “Mitigation Scenarios”, which involve additional efforts. Also, some mitigation scenarios involve “overshoot” in which the concentration temporarily exceeds a certain threshold before 2100. RCP2.6 leading GHG concentrations in 2100 in range for the 430 ppm to 480 ppm carbon diox-ide-eq is the only scenario that is likely to stay below 2ºC over the course of the 21st century relative to pre-industrial levels within four RCPs. Other RCPs (RCP4.5, 6.0, 8.5) in which concentration in 2100 ranges from 580 ppm to more than 1000 ppm are “more unlikely than likely or unlikely” or “unlikely” to stay below 2ºC over the 21st century relative to pre-industrial levels. RCP2.6 is characterized by 40% to 70% global anthropogenic GHG emissions reductions by 2050 compared to 2010 (Point (1)), and emissions levels near zero or below in 2100 (Point (2)). And it is also characterized by changing land use (such as afforestation and deforestation control), plus more rapid improvements in en-ergy efficiency. Compared to 2010, it will be triple to nearly a quadruple the share of zero- and low-carbon energy supply, such as renewable energy (e.g. PV solar power and wind energy), fossil fuel energy with carbon dioxide capture and storage (CCS) and bioenergy with CCS (BECCS) by 2050. If introduction of such key technologies is delayed, mitigation costs can increase substantially, while the achievement of RCP2.6 will become harder.
GHG emission pathways 2000-2100: All AR5 and RCP scenarios
Key characteristics of the scenarios collected andassessed for WGIII AR5.
(From Source 61)
(From Source 62)
Annu
al G
HG
Em
issi
ons
[GtC
O2e
q/yr
]
RCP8.5: high reference scenarioRCP6.0: high stabilization scenarioRCP4.5: middle stabilization scenarioRCP2.6: low stabilization scenario
BaselineScenario range
Full AR5 Database Range
2100 GHG concentration: unit is ppm (CO2eq)
90th Percentile
Median
10th Percentile
Year
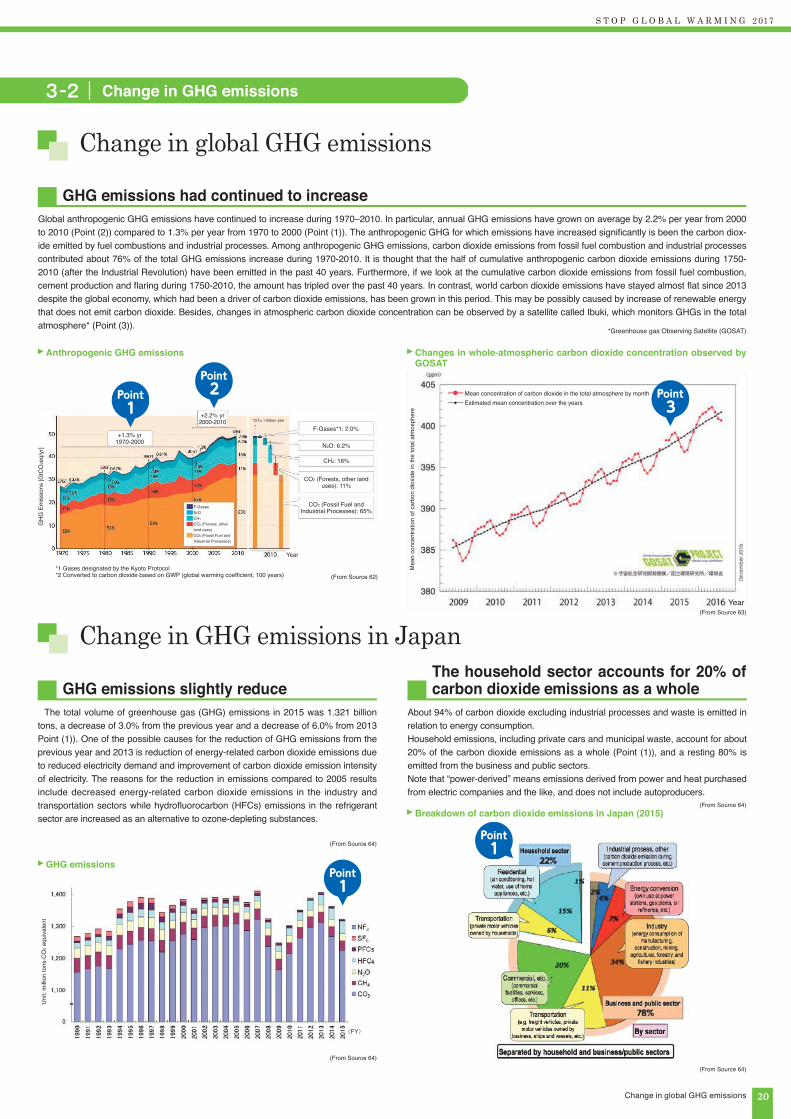
S T O P G L O B A L W A R M I N G 2 017
20
Change in global GHG emissions
Change in GHG emissions in Japan
GHG emissions had continued to increase
GHG emissions slightly reduceThe household sector accounts for 20% of carbon dioxide emissions as a whole
The total volume of greenhouse gas (GHG) emissions in 2015 was 1.321 billion tons, a decrease of 3.0% from the previous year and a decrease of 6.0% from 2013 Point (1)). One of the possible causes for the reduction of GHG emissions from the previous year and 2013 is reduction of energy-related carbon dioxide emissions due to reduced electricity demand and improvement of carbon dioxide emission intensity of electricity. The reasons for the reduction in emissions compared to 2005 results include decreased energy-related carbon dioxide emissions in the industry and transportation sectors while hydrofluorocarbon (HFCs) emissions in the refrigerant sector are increased as an alternative to ozone-depleting substances.
About 94% of carbon dioxide excluding industrial processes and waste is emitted in relation to energy consumption.Household emissions, including private cars and municipal waste, account for about 20% of the carbon dioxide emissions as a whole (Point (1)), and a resting 80% is emitted from the business and public sectors.Note that “power-derived” means emissions derived from power and heat purchased from electric companies and the like, and does not include autoproducers.
*Greenhouse gas Observing Satellite (GOSAT)
3-2 Change in GHG emissions
1Point
1Point
2Point
3Point
Change in global GHG emissions
1Point
Global anthropogenic GHG emissions have continued to increase during 1970–2010. In particular, annual GHG emissions have grown on average by 2.2% per year from 2000 to 2010 (Point (2)) compared to 1.3% per year from 1970 to 2000 (Point (1)). The anthropogenic GHG for which emissions have increased significantly is been the carbon diox-ide emitted by fuel combustions and industrial processes. Among anthropogenic GHG emissions, carbon dioxide emissions from fossil fuel combustion and industrial processes contributed about 76% of the total GHG emissions increase during 1970-2010. It is thought that the half of cumulative anthropogenic carbon dioxide emissions during 1750-2010 (after the Industrial Revolution) have been emitted in the past 40 years. Furthermore, if we look at the cumulative carbon dioxide emissions from fossil fuel combustion, cement production and flaring during 1750-2010, the amount has tripled over the past 40 years. In contrast, world carbon dioxide emissions have stayed almost flat since 2013 despite the global economy, which had been a driver of carbon dioxide emissions, has been grown in this period. This may be possibly caused by increase of renewable energy that does not emit carbon dioxide. Besides, changes in atmospheric carbon dioxide concentration can be observed by a satellite called Ibuki, which monitors GHGs in the total atmosphere* (Point (3)).
Anthropogenic GHG emissions
GHG emissions
Breakdown of carbon dioxide emissions in Japan (2015)
Changes in whole-atmospheric carbon dioxide concentration observed by GOSAT
(From Source 63)
(From Source 62)
(From Source 64)
(From Source 64)
(From Source 64)
(From Source 64)
Year
(FY)
Mea
n co
ncen
tratio
n of
car
bon
diox
ide
in th
e to
tal a
tmos
pher
e
Uni
t: m
illion
tons
-CO
2 equ
ival
ent
GH
G E
mis
sion
s [G
tCO
2eq/
yr]
F-Gases*1: 2.0%
CO2 (Forests, other land uses): 11%
CH4: 16%
N2O: 6.2%
CO2 (Fossil Fuel andIndustrial Processes): 65%
+1.3% yr1970-2000
*1 Gases designated by the Kyoto Protocol*2 Converted to carbon dioxide based on GWP (global warming coefficient, 100 years)
*GT= 1 billion yen
F-GasesN2OCH4
CO2 (Forests, other land uses)CO2 (Fossil Fuel and Industrial Processes)
+2.2% yr2000-2010
Mean concentration of carbon dioxide in the total atmosphere by monthEstimated mean concentration over the years
Year
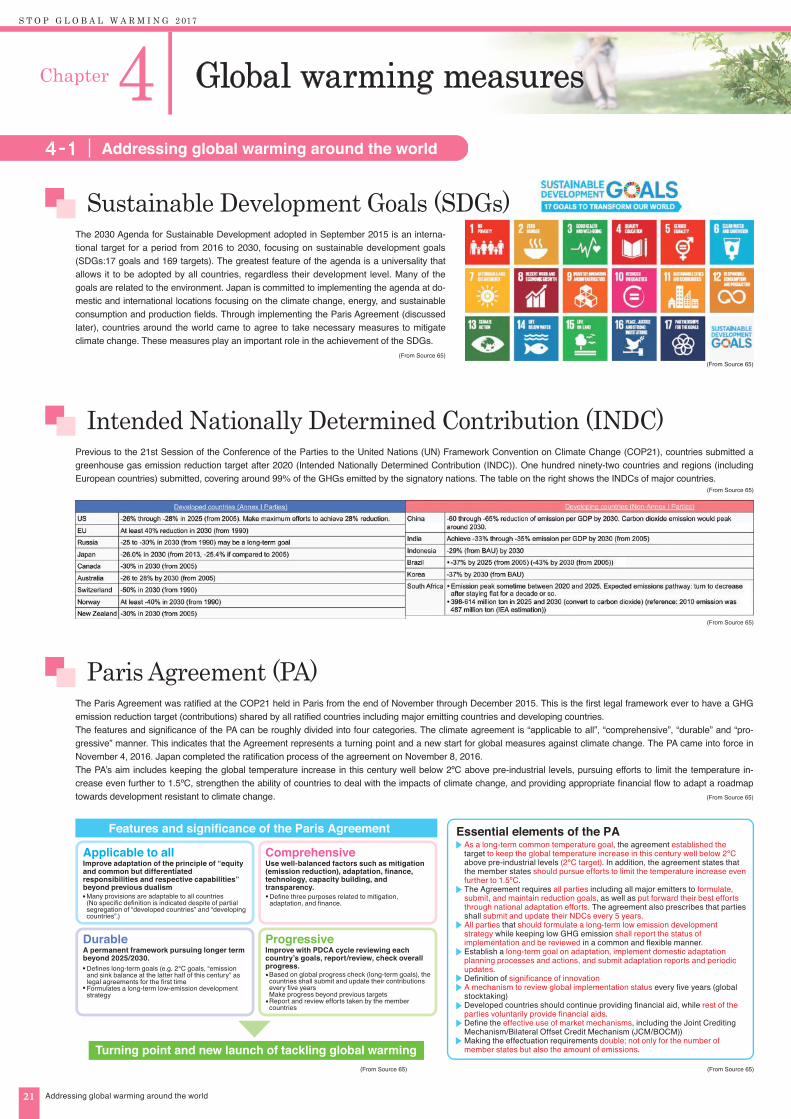
4S T O P G L O B A L W A R M I N G 2 017
Chapter Global warming measures
21 Addressing global warming around the world
Addressing global warming around the world4-1
Sustainable Development Goals (SDGs)
Intended Nationally Determined Contribution (INDC)
Paris Agreement (PA)
The 2030 Agenda for Sustainable Development adopted in September 2015 is an interna-tional target for a period from 2016 to 2030, focusing on sustainable development goals (SDGs:17 goals and 169 targets). The greatest feature of the agenda is a universality that allows it to be adopted by all countries, regardless their development level. Many of the goals are related to the environment. Japan is committed to implementing the agenda at do-mestic and international locations focusing on the climate change, energy, and sustainable consumption and production fields. Through implementing the Paris Agreement (discussed later), countries around the world came to agree to take necessary measures to mitigate climate change. These measures play an important role in the achievement of the SDGs.
Previous to the 21st Session of the Conference of the Parties to the United Nations (UN) Framework Convention on Climate Change (COP21), countries submitted a greenhouse gas emission reduction target after 2020 (Intended Nationally Determined Contribution (INDC)). One hundred ninety-two countries and regions (including European countries) submitted, covering around 99% of the GHGs emitted by the signatory nations. The table on the right shows the INDCs of major countries.
The Paris Agreement was ratified at the COP21 held in Paris from the end of November through December 2015. This is the first legal framework ever to have a GHG emission reduction target (contributions) shared by all ratified countries including major emitting countries and developing countries.The features and significance of the PA can be roughly divided into four categories. The climate agreement is “applicable to all”, “comprehensive”, “durable” and “pro-gressive” manner. This indicates that the Agreement represents a turning point and a new start for global measures against climate change. The PA came into force in November 4, 2016. Japan completed the ratification process of the agreement on November 8, 2016.The PA’s aim includes keeping the global temperature increase in this century well below 2ºC above pre-industrial levels, pursuing efforts to limit the temperature in-crease even further to 1.5ºC, strengthen the ability of countries to deal with the impacts of climate change, and providing appropriate financial flow to adapt a roadmap towards development resistant to climate change.
(From Source 65)
(From Source 65)
(From Source 65) (From Source 65)
(From Source 65)
(From Source 65)
(From Source 65)
Features and significance of the Paris Agreement Essential elements of the PAApplicable to allImprove adaptation of the principle of “equity and common but differentiated responsibilities and respective capabilities” beyond previous dualismMany provisions are adaptable to all countries(No specific definition is indicated despite of partial segregation of “developed countries” and “developing countries”.)
Comprehensive
Turning point and new launch of tackling global warming
Use well-balanced factors such as mitigation (emission reduction), adaptation, finance, technology, capacity building, and transparency.
Define three purposes related to mitigation, adaptation, and finance.
As a long-term common temperature goal, the agreement established the target to keep the global temperature increase in this century well below 2ºC above pre-industrial levels (2ºC target). In addition, the agreement states that the member states should pursue efforts to limit the temperature increase even further to 1.5ºC.The Agreement requires all parties including all major emitters to formulate, submit, and maintain reduction goals, as well as put forward their best efforts through national adaptation efforts. The agreement also prescribes that parties shall submit and update their NDCs every 5 years.All parties that should formulate a long-term low emission development strategy while keeping low GHG emission shall report the status of implementation and be reviewed in a common and flexible manner.Establish a long-term goal on adaptation, implement domestic adaptation planning processes and actions, and submit adaptation reports and periodic updates.Definition of significance of innovationA mechanism to review global implementation status every five years (global stocktaking)Developed countries should continue providing financial aid, while rest of the parties voluntarily provide financial aids.Define the effective use of market mechanisms, including the Joint Crediting Mechanism/Bilateral Offset Credit Mechanism (JCM/BOCM))Making the effectuation requirements double; not only for the number of member states but also the amount of emissions.
DurableA permanent framework pursuing longer term beyond 2025/2030.
Defines long-term goals (e.g. 2°C goals, “emission and sink balance at the latter half of this century” as legal agreements for the first time Formulates a long-term low-emission development strategy
ProgressiveImprove with PDCA cycle reviewing each country’s goals, report/review, check overall progress.
Based on global progress check (long-term goals), the countries shall submit and update their contributions every five yearsMake progress beyond previous targetsReport and review efforts taken by the member countries
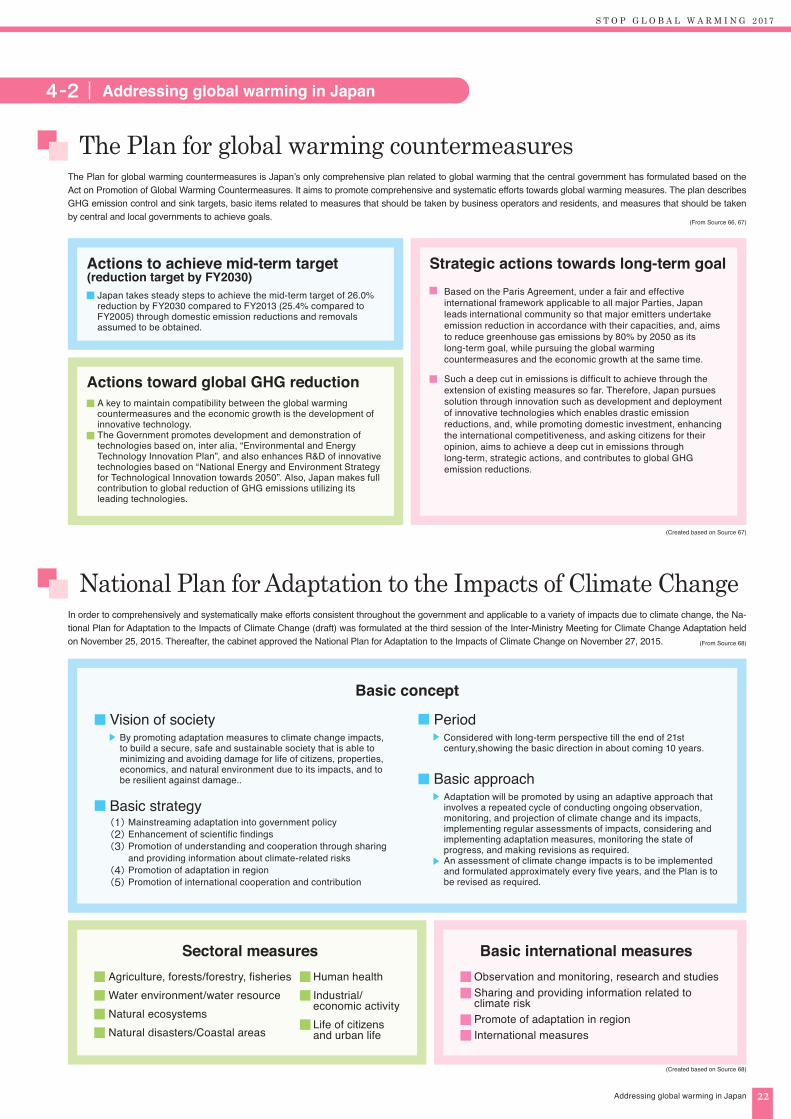
S T O P G L O B A L W A R M I N G 2 017
22Addressing global warming in Japan
The Plan for global warming countermeasures
National Plan for Adaptation to the Impacts of Climate Change
Addressing global warming in Japan4-2
The Plan for global warming countermeasures is Japan’s only comprehensive plan related to global warming that the central government has formulated based on the Act on Promotion of Global Warming Countermeasures. It aims to promote comprehensive and systematic efforts towards global warming measures. The plan describes GHG emission control and sink targets, basic items related to measures that should be taken by business operators and residents, and measures that should be taken by central and local governments to achieve goals.
In order to comprehensively and systematically make efforts consistent throughout the government and applicable to a variety of impacts due to climate change, the Na-tional Plan for Adaptation to the Impacts of Climate Change (draft) was formulated at the third session of the Inter-Ministry Meeting for Climate Change Adaptation held on November 25, 2015. Thereafter, the cabinet approved the National Plan for Adaptation to the Impacts of Climate Change on November 27, 2015.
(From Source 66, 67)
(Created based on Source 67)
(From Source 68)
(Created based on Source 68)
Basic concept
Sectoral measures Basic international measures
Vision of society
Agriculture, forests/forestry, fisheriesWater environment/water resourceNatural ecosystemsNatural disasters/Coastal areas
Observation and monitoring, research and studiesSharing and providing information related to climate riskPromote of adaptation in regionInternational measures
Human healthIndustrial/economic activityLife of citizens and urban life
By promoting adaptation measures to climate change impacts, to build a secure, safe and sustainable society that is able to minimizing and avoiding damage for life of citizens, properties, economics, and natural environment due to its impacts, and to be resilient against damage..
PeriodConsidered with long-term perspective till the end of 21st century,showing the basic direction in about coming 10 years.
Basic approachAdaptation will be promoted by using an adaptive approach that involves a repeated cycle of conducting ongoing observation, monitoring, and projection of climate change and its impacts, implementing regular assessments of impacts, considering and implementing adaptation measures, monitoring the state of progress, and making revisions as required.An assessment of climate change impacts is to be implemented and formulated approximately every five years, and the Plan is to be revised as required.
Basic strategyMainstreaming adaptation into government policyEnhancement of scientific findingsPromotion of understanding and cooperation through sharing and providing information about climate-related risksPromotion of adaptation in regionPromotion of international cooperation and contribution
(1)(2)(3)
(4)(5)
Actions to achieve mid-term target (reduction target by FY2030)
Japan takes steady steps to achieve the mid-term target of 26.0% reduction by FY2030 compared to FY2013 (25.4% compared to FY2005) through domestic emission reductions and removals assumed to be obtained.
Actions toward global GHG reductionA key to maintain compatibility between the global warming countermeasures and the economic growth is the development of innovative technology.The Government promotes development and demonstration of technologies based on, inter alia, “Environmental and Energy Technology Innovation Plan”, and also enhances R&D of innovative technologies based on “National Energy and Environment Strategy for Technological Innovation towards 2050”. Also, Japan makes full contribution to global reduction of GHG emissions utilizing its leading technologies.
Strategic actions towards long-term goalBased on the Paris Agreement, under a fair and effective international framework applicable to all major Parties, Japan leads international community so that major emitters undertake emission reduction in accordance with their capacities, and, aims to reduce greenhouse gas emissions by 80% by 2050 as its long-term goal, while pursuing the global warming countermeasures and the economic growth at the same time.
Such a deep cut in emissions is difficult to achieve through the extension of existing measures so far. Therefore, Japan pursues solution through innovation such as development and deployment of innovative technologies which enables drastic emission reductions, and, while promoting domestic investment, enhancing the international competitiveness, and asking citizens for their opinion, aims to achieve a deep cut in emissions through long-term, strategic actions, and contributes to global GHG emission reductions.
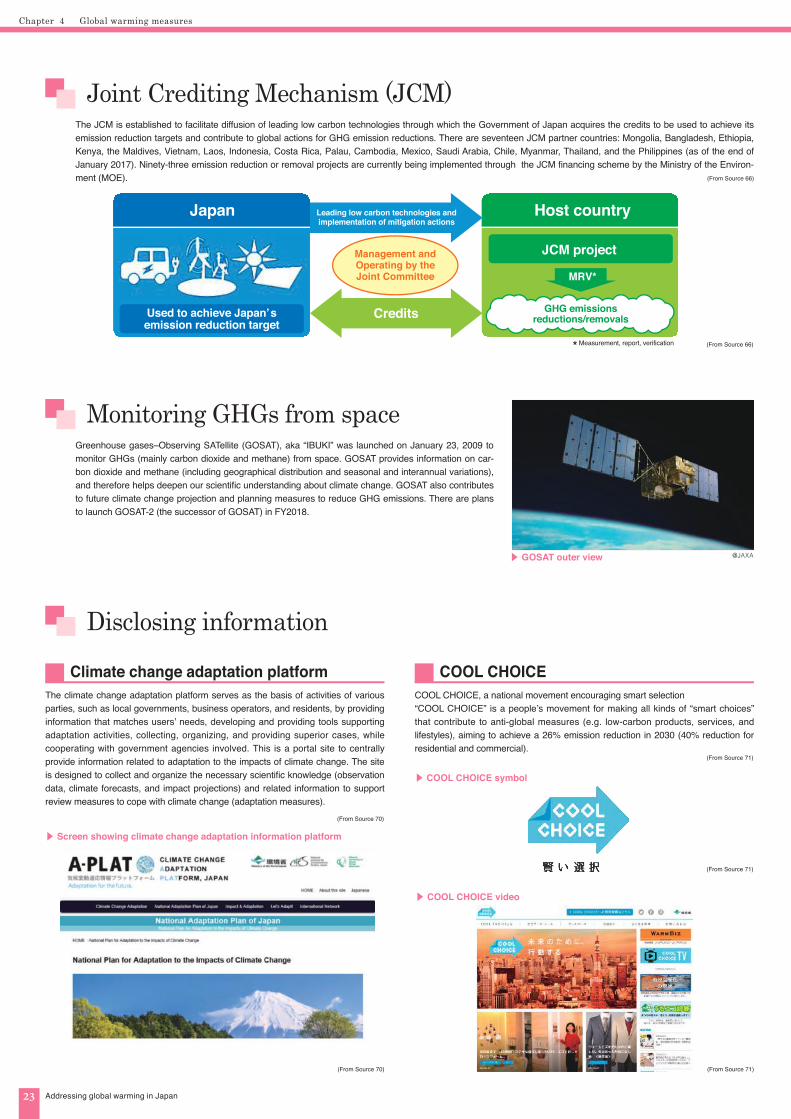
Chapter Global warming measures4
23
Joint Crediting Mechanism (JCM)
Monitoring GHGs from space
The JCM is established to facilitate diffusion of leading low carbon technologies through which the Government of Japan acquires the credits to be used to achieve its emission reduction targets and contribute to global actions for GHG emission reductions. There are seventeen JCM partner countries: Mongolia, Bangladesh, Ethiopia, Kenya, the Maldives, Vietnam, Laos, Indonesia, Costa Rica, Palau, Cambodia, Mexico, Saudi Arabia, Chile, Myanmar, Thailand, and the Philippines (as of the end of January 2017). Ninety-three emission reduction or removal projects are currently being implemented through the JCM financing scheme by the Ministry of the Environ-ment (MOE).
Greenhouse gases–Observing SATellite (GOSAT), aka “IBUKI” was launched on January 23, 2009 to monitor GHGs (mainly carbon dioxide and methane) from space. GOSAT provides information on car-bon dioxide and methane (including geographical distribution and seasonal and interannual variations), and therefore helps deepen our scientific understanding about climate change. GOSAT also contributes to future climate change projection and planning measures to reduce GHG emissions. There are plans to launch GOSAT-2 (the successor of GOSAT) in FY2018.
(From Source 66)
(From Source 66)
@JAXA▶ GOSAT outer view
Disclosing information
Climate change adaptation platform COOL CHOICEThe climate change adaptation platform serves as the basis of activities of various parties, such as local governments, business operators, and residents, by providing information that matches users’ needs, developing and providing tools supporting adaptation activities, collecting, organizing, and providing superior cases, while cooperating with government agencies involved. This is a portal site to centrally provide information related to adaptation to the impacts of climate change. The site is designed to collect and organize the necessary scientific knowledge (observation data, climate forecasts, and impact projections) and related information to support review measures to cope with climate change (adaptation measures).
COOL CHOICE, a national movement encouraging smart selection“COOL CHOICE” is a people’s movement for making all kinds of “smart choices” that contribute to anti-global measures (e.g. low-carbon products, services, and lifestyles), aiming to achieve a 26% emission reduction in 2030 (40% reduction for residential and commercial).
(From Source 70)
(From Source 71)
(From Source 70) (From Source 71)
(From Source 71)
▶ Screen showing climate change adaptation information platform
▶ COOL CHOICE symbol
▶ COOL CHOICE video
Addressing global warming in Japan
Japan
CreditsUsed to achieve Japan’semission reduction target
JCM project
MRV*
Leading low carbon technologies andimplementation of mitigation actions
Management andOperating by theJoint Committee
GHG emissionsreductions/removals
Measurement, report, verification
Host country
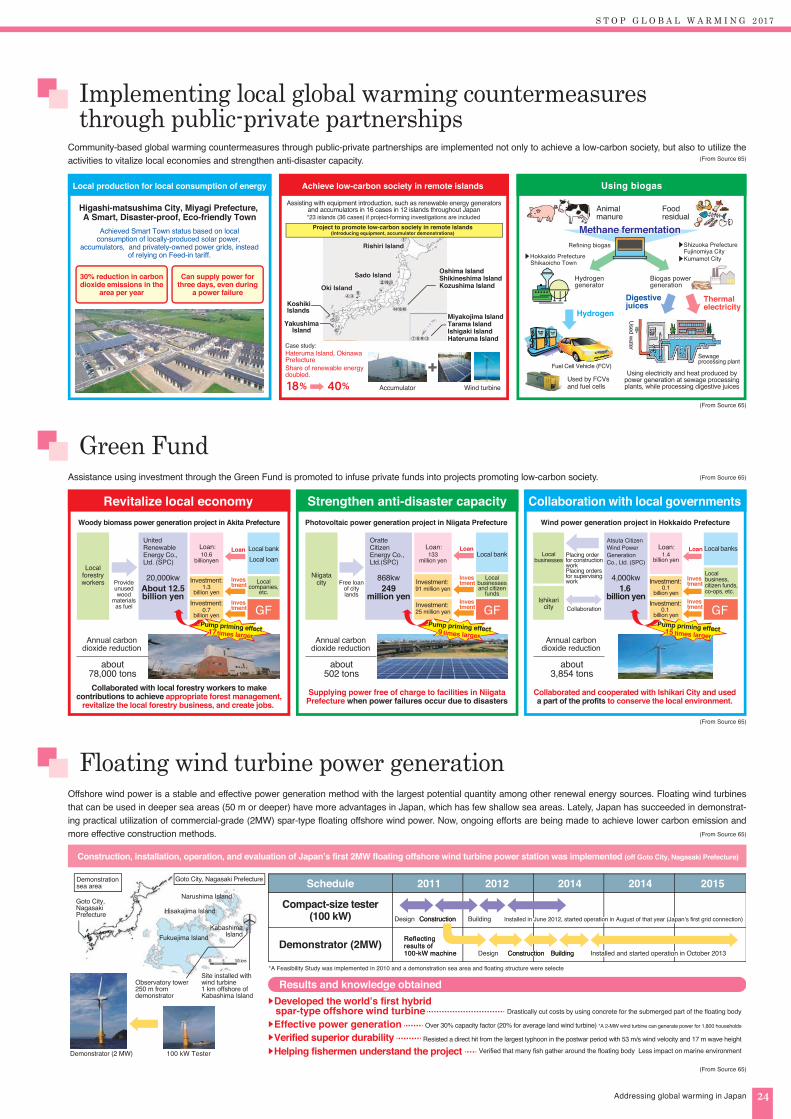
S T O P G L O B A L W A R M I N G 2 017
24Addressing global warming in Japan
Implementing local global warming countermeasures through public-private partnerships
Green Fund
Floating wind turbine power generation
Community-based global warming countermeasures through public-private partnerships are implemented not only to achieve a low-carbon society, but also to utilize the activities to vitalize local economies and strengthen anti-disaster capacity.
Assistance using investment through the Green Fund is promoted to infuse private funds into projects promoting low-carbon society.
Offshore wind power is a stable and effective power generation method with the largest potential quantity among other renewal energy sources. Floating wind turbines that can be used in deeper sea areas (50 m or deeper) have more advantages in Japan, which has few shallow sea areas. Lately, Japan has succeeded in demonstrat-ing practical utilization of commercial-grade (2MW) spar-type floating offshore wind power. Now, ongoing efforts are being made to achieve lower carbon emission and more effective construction methods.
(From Source 65)
(From Source 65)
(From Source 65)
(From Source 65)
(From Source 65)
(From Source 65)
Biogas powergeneration
Hydrogengenerator
Refining biogas
Local production for local consumption of energy Achieve low-carbon society in remote islands Using biogas
Higashi-matsushima City, Miyagi Prefecture, A Smart, Disaster-proof, Eco-friendly Town
Hateruma Island, OkinawaPrefectureShare of renewable energydoubled.
Wind turbineUsed by FCVsand fuel cells
Using electricity and heat produced bypower generation at sewage processingplants, while processing digestive juices
Assisting with equipment introduction, such as renewable energy generatorsand accumulators in 16 cases in 12 islands throughout Japan
Achieved Smart Town status based on localconsumption of locally-produced solar power,
accumulators, and privately-owned power grids, insteadof relying on Feed-in tariff.
30% reduction in carbondioxide emissions in the
area per year
Can supply power forthree days, even during
a power failure
Project to promote low-carbon society in remote islands(Introducing equipment, accumulator demonstrations)
Oshima IslandShikineshima IslandKozushima Island
Rishiri Island
Sado Island
Oki Island
KoshikiIslands
YakushimaIsland
Miyakojima IslandTarama IslandIshigaki IslandHateruma Island
Accumulator
Case study:
18% 40%
Animalmanure
▶Hokkaido PrefectureShikaoicho Town
▶Shizuoka Prefecture Fujinomiya City▶Kumamot City
Foodresidual
Methane fermentation
Hydrogen
Digestivejuices
Thermalelectricity
Used w
ater
Sewageprocessing plant
Fuel Cell Vehicle (FCV)
*23 islands (36 cases) if project-forming investigations are included
Revitalize local economy Strengthen anti-disaster capacity Collaboration with local governmentsWoody biomass power generation project in Akita Prefecture
about78,000 tons
Photovoltaic power generation project in Niigata Prefecture Wind power generation project in Hokkaido Prefecture
Collaborated with local forestry workers to makecontributions to achieve appropriate forest management,
revitalize the local forestry business, and create jobs.
GF GF GF
UnitedRenewableEnergy Co.,Ltd. (SPC)
20,000kwAbout 12.5billion yen
Localforestryworkers
Local bankLocal loan
Local bankLocal banks
Localcompanies,
etc.Provideunusedwood
materialsas fuel
Loan: Loan: 10.6
billionyen
Investment:
Investment:
Investment:
Investment:
Loan:
Investment:
Investment: 1.3
billion yen
0.7billion yen
Loan Loan Loan
Investment
Investment
Investment
Investment
Investment
Investment
Pump priming effect17 times larger
Pump priming effect9 times larger
Pump priming effect15 times largerAnnual carbondioxide reduction
about502 tons
Annual carbondioxide reduction
about3,854 tons
Annual carbondioxide reduction
Supplying power free of charge to facilities in NiigataPrefecture when power failures occur due to disasters
868kw249
million yen
Niigatacity
Localbusinessesand citizen
funds
Free loanof citylands
133million yen
91 million yen
25 million yen
Collaborated and cooperated with Ishikari City and useda part of the profits to conserve the local environment.
Atsuta CitizenWind PowerGenerationCo., Ltd. (SPC)
4,000kw1.6
billion yen
Localbusinesses
1.4billion yen
0.1billion yen
0.1 billion yen
Ishikaricity
Localbusiness,citizen funds,co-ops, etc.
Placing orderfor constructionworkPlacing ordersfor supervisingwork
Collaboration
OratteCitizen Energy Co., Ltd.(SPC)
*A Feasibility Study was implemented in 2010 and a demonstration sea area and floating structure were selecte
Construction, installation, operation, and evaluation of Japan’s first 2MW floating offshore wind turbine power station was implemented (off Goto City, Nagasaki Prefecture)
Over 30% capacity factor (20% for average land wind turbine) *A 2-MW wind turbine can generate power for 1,800 households
Results and knowledge obtained▶Developed the world’s first hybrid spar-type offshore wind turbine Drastically cut costs by using concrete for the submerged part of the floating body
Demonstrator (2 MW) 100 kW Tester
Goto City, Nagasaki Prefecture
Fukuejima Island
Hisakajima Island
Narushima Island
KabashimaIsland
Site installed withwind turbine1 km offshore ofKabashima Island
Observatory tower250 m from demonstrator
Demonstrationsea area
Goto City, Nagasaki Prefecture Schedule
Design
Compact-size tester(100 kW)
Demonstrator (2MW)
Building
Design Construction Construction
Construction Construction
BuildingBuilding
Installed in June 2012, started operation in August of that year (Japan’s first grid connection)
Reflecting results of100-kW machine
Reflecting results of100-kW machine Installed and started operation in October 2013
2011 2012 2014 2014 2015
Resisted a direct hit from the largest typhoon in the postwar period with 53 m/s wind velocity and 17 m wave height
Verified that many fish gather around the floating body Less impact on marine environment
▶Effective power generation▶Verified superior durability▶Helping fishermen understand the project
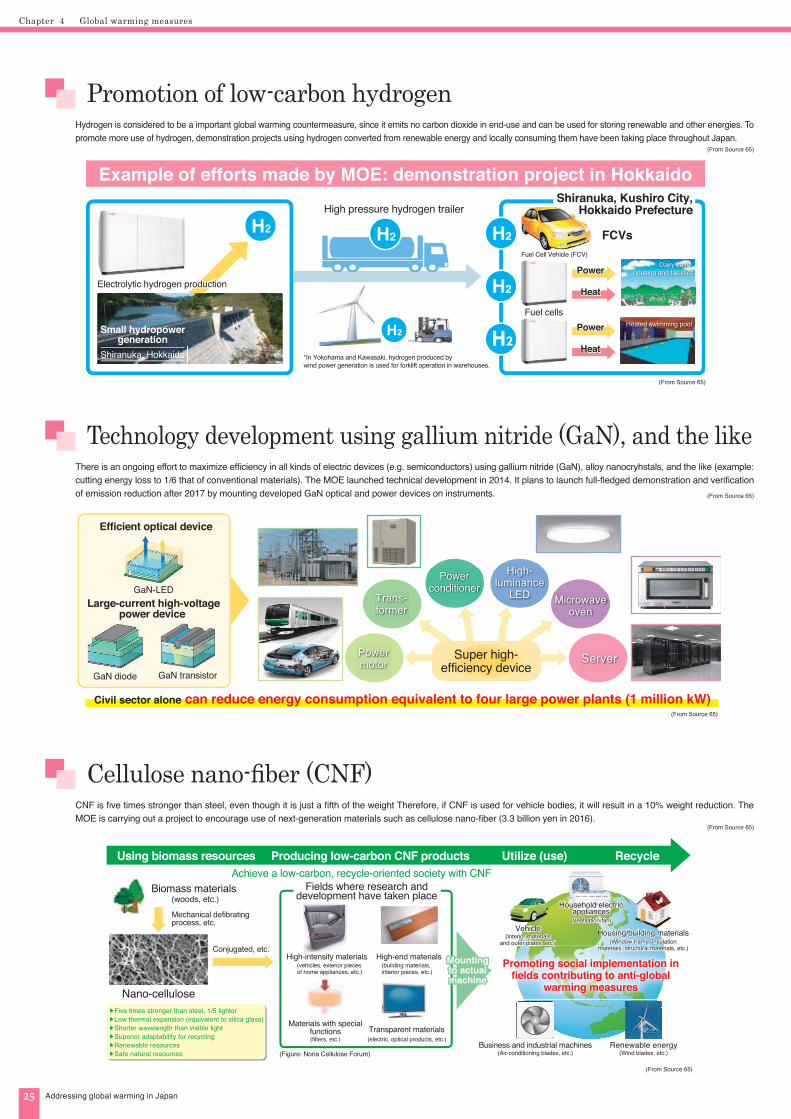
5Chapter FAQ
S T O P G L O B A L W A R M I N G 2 017
Let’s learn more about global warming
Chapter Global warming measures4
25 Addressing global warming in Japan
Promotion of low-carbon hydrogen
Technology development using gallium nitride (GaN), and the like
Cellulose nano-fiber (CNF)
Hydrogen is considered to be a important global warming countermeasure, since it emits no carbon dioxide in end-use and can be used for storing renewable and other energies. To promote more use of hydrogen, demonstration projects using hydrogen converted from renewable energy and locally consuming them have been taking place throughout Japan.
There is an ongoing effort to maximize efficiency in all kinds of electric devices (e.g. semiconductors) using gallium nitride (GaN), alloy nanocryhstals, and the like (example: cutting energy loss to 1/6 that of conventional materials). The MOE launched technical development in 2014. It plans to launch full-fledged demonstration and verification of emission reduction after 2017 by mounting developed GaN optical and power devices on instruments.
CNF is five times stronger than steel, even though it is just a fifth of the weight Therefore, if CNF is used for vehicle bodies, it will result in a 10% weight reduction. The MOE is carrying out a project to encourage use of next-generation materials such as cellulose nano-fiber (3.3 billion yen in 2016).
(From Source 65)
(From Source 65)
(From Source 65)
(From Source 65)
(From Source 65)
(From Source 65)
H2 H2
H2
H2
Example of efforts made by MOE: demonstration project in Hokkaido
H2
H2
Electrolytic hydrogen productionElectrolytic hydrogen production
Shiranuka, Kushiro City,Hokkaido PrefectureHigh pressure hydrogen trailer
FCVs
Fuel cells
Heat
Power
Heat
Power
Dairy cattle housing and facilities
Heated swimming pool
*In Yokohama and Kawasaki, hydrogen produced by wind power generation is used for forklift operation in warehouses.
Small hydropowergeneration
Shiranuka, Hokkaido
Fuel Cell Vehicle (FCV)
Efficient optical device
Large-current high-voltagepower device
Super high-efficiency device
Powermotor
Microwaveoven
Server
Powerconditioner
High-luminance
LEDGaN-LED
GaN diode GaN transistor
Civil sector alone can reduce energy consumption equivalent to four large power plants (1 million kW)
Trans-former
(Ventilation fan)
Biomass materials (woods, etc.)
Fields where research anddevelopment have taken place
Nano-cellulose
High-end materials
Vehicle
Business and industrial machines
Housing/building materials
Household electricappliances
▶Five times stronger than steel, 1/5 lighter▶Low thermal expansion (equivalent to silica glass)▶Shorter wavelength than visible light▶Superior adaptability for recycling▶Renewable resources▶Safe natural resources
Mechanical defibratingprocess, etc.
High-intensity materials
Transparent materialsMaterials with special
functions
Conjugated, etc.
Using biomass resources Producing low-carbon CNF products Utilize (use) Recycle
(Figure: Nona Cellulose Forum)
Mountingto actualmachine
Promoting social implementation infields contributing to anti-global
warming measures
(Wind blades, etc.)Renewable energy
(Air-conditioning blades, etc.)
(Interior materialsand outer plates, etc.) (Window frame, insulation
materials, structural materials, etc.)
(vehicles, exterior pieces of home appliances, etc.)
(building materials,interior pieces, etc.)
(filters, etc.) (electric, optical products, etc.)
Achieve a low-carbon, recycle-oriented society with CNF

5Chapter FAQ
S T O P G L O B A L W A R M I N G 2 017
Let’s learn more about global warming
26Let’s learn more about global warming
(From Source 72)
Q. Isn’t global warming a result of solar activity?
Q. Hasn’t temperature increase stagnated in recent years?
A. The temperature increases cannot be fully explained by the impact of naturally-occurring phenomena such as solar activities.
A. This is a phenomenon called Hiatus. In the past few years, the temperature has been increasing.
This graph shows a comparison between three data: (1) black line: observed annual mean temperature over the last 100 years as published in the IPCC AR5, (2) Blue line: simulation results considering only the impact caused by natural phenomena (e.g. solar and volcanic activities); and (3) red line: another simulation result adding the impact of human activities (carbon dioxide emission due to industrial activities). The three graphs suggest that the observed results (black line) are consistent with the simulation results considering both nature-derived and human activity-derived impacts (red line). In other words, the simulation results (blue line) only considering nature-derived impacts (solar, volcanic, and similar activities only), excluding human activities-derived impacts, is inconsistent with observed data. In other words, the increase in global mean temperature in the 20th century can be explained by the increase of GHGs due to human activities, and the explanation would not be sufficient without considering human activities. It is clear that global warming is caused by human activities, since the temperature keep increasing despite weakened solar activities in recent years.
In the period between around 2000 and 2012, the rate of increase of global mean temperature remained at the same level. This stagnant condition of global warming is called a hiatus. Temperature varies not only with natural mechanisms such as El Niño, but also external factors, including impacts due to volcanic activities and carbon dioxide. These factors are complexly intertwined. Therefore, even in the process of ongoing global warming, the temperature does not always simply increase as time goes by. Alternating be-tween periods of moderate and radical temperature increases, the global temperature is increasing from a long-term perspective.According to the IPCC AR5, the temperature increase was stagnant in the period from around 2000 through 2012. The major causes of the Hiatus includes heat sunk into the deep ocean shores, inactivated solar activities, and impact of volcanic activities. In addition, the temperature has again drastically increased recently, setting new world records of annual mean temperature for three consecutive years since 2014.
▶ Comparisons with climate change produced by observation and simulations
G l o b a l m e a n
▶ Change in difference of global annual mean temperature compared to the 1961-1990 average
(From Source 4)
Observation
Model using nature-de-rived force only
Model using both nature and human-derived forces
2
1
0
-11910 1960 2010
Tem
pera
ture
(°C
)
Surface temperature (land area)2
1
0
-11910 1960 2010
Tem
pera
ture
(°C
)
Surface temperature (land and ocean areas)
20
10
0
-10
1910 1960 2010
Stor
ed h
eat q
uant
ity (1
022J)
Stored heat on the ocean surface
Diff
eren
ce b
etw
een
annu
al m
ean
tem
pera
ture
and
mea
n te
mpe
ratu
re fo
r th
e pe
riod
from
196
1 to
199
0 (ºC
)
(Year)
Met Office (UK)National Oceanic and Atmospheric Administration (NOAA, US)The National Aeronautics and Space Administration (NASA, US)
Temperature is increasing again in recent years
Stagnant temperature increase(Hiatus)
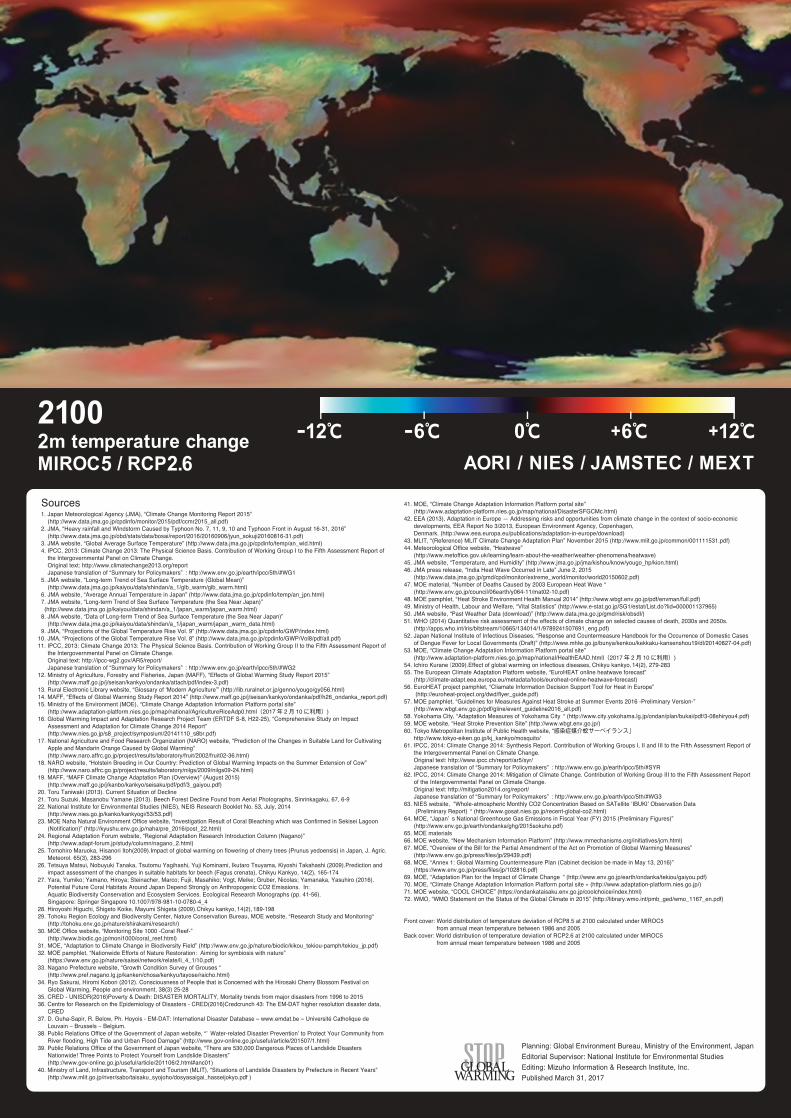
MIROC5 / RCP2.62m temperature change2100 -12℃ +12℃-6℃ +6℃0℃
AORI / NIES / JAMSTEC / MEXT
1. Japan Meteorological Agency (JMA), “Climate Change Monitoring Report 2015” (http://www.data.jma.go.jp/cpdinfo/monitor/2015/pdf/ccmr2015_all.pdf) 2. JMA, “Heavy rainfall and Windstorm Caused by Typhoon No. 7, 11, 9, 10 and Typhoon Front in August 16-31, 2016” (http://www.data.jma.go.jp/obd/stats/data/bosai/report/2016/20160906/jyun_sokuji20160816-31.pdf) 3. JMA website, “Global Average Surface Temperature” (http://www.data.jma.go.jp/cpdinfo/temp/an_wld.html) 4. IPCC, 2013: Climate Change 2013: The Physical Science Basis. Contribution of Working Group I to the Fifth Assessment Report of the Intergovernmental Panel on Climate Change. Original text: http://www.climatechange2013.org/report Japanese translation of “Summary for Policymakers” : http://www.env.go.jp/earth/ipcc/5th/#WG1 5. JMA website, “Long-term Trend of Sea Surface Temperature (Global Mean)” (http://www.data.jma.go.jp/kaiyou/data/shindan/a_1/glb_warm/glb_warm.html) 6. JMA website, “Average Annual Temperature in Japan” (http://www.data.jma.go.jp/cpdinfo/temp/an_jpn.html) 7. JMA website, “Long-term Trend of Sea Surface Temperature (the Sea Near Japan)” (http://www.data.jma.go.jp/kaiyou/data/shindan/a_1/japan_warm/japan_warm.html) 8. JMA website, “Data of Long-term Trend of Sea Surface Temperature (the Sea Near Japan)” (http://www.data.jma.go.jp/kaiyou/data/shindan/a_1/japan_warm/japan_warm_data.html) 9. JMA, “Projections of the Global Temperature Rise Vol. 9” (http://www.data.jma.go.jp/cpdinfo/GWP/index.html)10. JMA, “Projections of the Global Temperature Rise Vol. 8” (http://www.data.jma.go.jp/cpdinfo/GWP/Vol8/pdf/all.pdf)11. IPCC, 2013: Climate Change 2013: The Physical Science Basis. Contribution of Working Group II to the Fifth Assessment Report of the Intergovernmental Panel on Climate Change. Original text: http://ipcc-wg2.gov/AR5/report/ Japanese translation of “Summary for Policymakers” : http://www.env.go.jp/earth/ipcc/5th/#WG212. Ministry of Agriculture, Forestry and Fisheries, Japan (MAFF), “Effects of Global Warming Study Report 2015” (http://www.maff.go.jp/j/seisan/kankyo/ondanka/attach/pdf/index-3.pdf)13. Rural Electronic Library website, “Glossary of ‘Modern Agriculture’” (http://lib.ruralnet.or.jp/genno/yougo/gy056.html)14. MAFF, “Effects of Global Warming Study Report 2014” (http://www.maff.go.jp/j/seisan/kankyo/ondanka/pdf/h26_ondanka_report.pdf)15. Ministry of the Environment (MOE), “Climate Change Adaptation Information Platform portal site” (http://www.adaptation-platform.nies.go.jp/map/national/AgricultureRiceAdp0.html(2017年 2月 10に利用))16. Global Warming Impact and Adaptation Research Project Team (ERTDF S-8, H22-25), “Comprehensive Study on Impact Assessment and Adaptation for Climate Change 2014 Report” (http://www.nies.go.jp/s8_project/symposium/20141110_s8br.pdf)17. National Agriculture and Food Research Organization (NARO) website, “Prediction of the Changes in Suitable Land for Cultivating Apple and Mandarin Orange Caused by Global Warming” (http://www.naro.affrc.go.jp/project/results/laboratory/fruit/2002/fruit02-36.html)18. NARO website, “Holstein Breeding in Our Country: Prediction of Global Warming Impacts on the Summer Extension of Cow” (http://www.naro.affrc.go.jp/project/results/laboratory/nilgs/2009/nilgs09-24.html)19. MAFF, “MAFF Climate Change Adaptation Plan (Overview)” (August 2015) (http://www.maff.go.jp/j/kanbo/kankyo/seisaku/pdf/pdf/3_gaiyou.pdf)20. Toru Taniwaki (2013). Current Situation of Decline21. Toru Suzuki, Masanobu Yamane (2013). Beech Forest Decline Found from Aerial Photographs, Sinrinkagaku, 67, 6-922. National Institute for Environmental Studies (NIES), NEIS Research Booklet No. 53, July, 2014 (http://www.nies.go.jp/kanko/kankyogi/53/53.pdf)23. MOE Naha Natural Environment Office website, “Investigation Result of Coral Bleaching which was Confirmed in Sekisei Lagoon (Notification)” (http://kyushu.env.go.jp/naha/pre_2016/post_22.html)24. Regional Adaptation Forum website, “Regional Adaptation Research Introduction Column (Nagano)” (http://www.adapt-forum.jp/study/column/nagano_2.html)25. Tomohiro Maruoka, Hisanori Itoh(2009).Impact of global warming on flowering of cherry trees (Prunus yedoensis) in Japan, J. Agric. Meteorol. 65(3), 283-29626. Tetsuya Matsui, Nobuyuki Tanaka, Tsutomu Yagihashi, Yuji Kominami, Ikutaro Tsuyama, Kiyoshi Takahashi (2009).Prediction and impact assessment of the changes in suitable habitats for beech (Fagus crenata), Chikyu Kankyo, 14(2), 165-17427. Yara, Yumiko; Yamano, Hiroya; Steinacher, Marco; Fujii, Masahiko; Vogt, Meike; Gruber, Nicolas; Yamanaka, Yasuhiro (2016). Potential Future Coral Habitats Around Japan Depend Strongly on Anthropogenic CO2 Emissions. In: Aquatic Biodiversity Conservation and Ecosystem Services. Ecological Research Monographs (pp. 41-56). Singapore: Springer Singapore 10.1007/978-981-10-0780-4_4 28. Hiroyoshi Higuchi, Shigeto Koike, Mayumi Shigeta (2009).Chikyu kankyo, 14(2), 189-19829. Tohoku Region Ecology and Biodiversity Center, Nature Conservation Bureau, MOE website, “Research Study and Monitoring“ (http://tohoku.env.go.jp/nature/shirakami/research/)30. MOE Office website, “Monitoring Site 1000 -Coral Reef-” (http://www.biodic.go.jp/moni1000/coral_reef.html)31. MOE, “Adaptation to Climate Change in Biodiversity Field” (http://www.env.go.jp/nature/biodic/kikou_tekiou-pamph/tekiou_jp.pdf)32. MOE pamphlet, “Nationwide Efforts of Nature Restoration: Aiming for symbiosis with nature” (https://www.env.go.jp/nature/saisei/network/relate/li_4_1/10.pdf)33. Nagano Prefecture website, “Growth Condition Survey of Grouses “ (http://www.pref.nagano.lg.jp/kanken/chosa/kenkyu/tayose/raicho.html)34. Ryo Sakurai, Hiromi Kobori (2012). Consciousness of People that is Concerned with the Hirosaki Cherry Blossom Festival on Global Warming, People and environment, 38(3) 25-2835. CRED - UNISDR(2016)Poverty & Death: DISASTER MORTALITY, Mortality trends from major disasters from 1996 to 201536. Centre for Research on the Epidemiology of Disasters - CRED(2016)Credcrunch 43: The EM-DAT higher resolution disaster data, CRED37. D. Guha-Sapir, R. Below, Ph. Hoyois - EM-DAT: International Disaster Database – www.emdat.be – Université Catholique de Louvain – Brussels – Belgium.38. Public Relations Office of the Government of Japan website, “’ Water-related Disaster Prevention’ to Protect Your Community from River flooding, High Tide and Urban Flood Damage” (http://www.gov-online.go.jp/useful/article/201507/1.html)39. Public Relations Office of the Government of Japan website, “There are 530,000 Dangerous Places of Landslide Disasters Nationwide! Three Points to Protect Yourself from Landslide Disasters” (http://www.gov-online.go.jp/useful/article/201106/2.html#anc01)40. Ministry of Land, Infrastructure, Transport and Tourism (MLIT), “Situations of Landslide Disasters by Prefecture in Recent Years” (http://www.mlit.go.jp/river/sabo/taisaku_syojoho/dosyasaigai_hasseijokyo.pdf )
41. MOE, “Climate Change Adaptation Information Platform portal site” (http://www.adaptation-platform.nies.go.jp/map/national/DisasterSFGCMc.html)42. EEA (2013), Adaptation in Europe — Addressing risks and opportunities from climate change in the context of socio-economic developments, EEA Report No 3/2013, European Environment Agency, Copenhagen, Denmark. (http://www.eea.europa.eu/publications/adaptation-in-europe/download)43. MLIT, “(Reference) MLIT Climate Change Adaptation Plan” November 2015 (http://www.mlit.go.jp/common/001111531.pdf)44. Meteorological Office website, “Heatwave” (http://www.metoffice.gov.uk/learning/learn-about-the-weather/weather-phenomena/heatwave)45. JMA website, “Temperature, and Humidity” (http://www.jma.go.jp/jma/kishou/know/yougo_hp/kion.html)46. JMA press release, “India Heat Wave Occurred in Late” June 2, 2015 (http://www.data.jma.go.jp/gmd/cpd/monitor/extreme_world/monitor/world20150602.pdf)47. MOE material, “Number of Deaths Caused by 2003 European Heat Wave “ (http://www.env.go.jp/council/06earth/y064-11/mat02-10.pdf)48. MOE pamphlet, “Heat Stroke Environment Health Manual 2014” (http://www.wbgt.env.go.jp/pdf/envman/full.pdf)49. Ministry of Health, Labour and Welfare, “Vital Statistics” (http://www.e-stat.go.jp/SG1/estat/List.do?lid=000001137965)50. JMA website, “Past Weather Data (download)” (http://www.data.jma.go.jp/gmd/risk/obsdl/)51. WHO (2014) Quantitative risk assessment of the effects of climate change on selected causes of death, 2030s and 2050s. (http://apps.who.int/iris/bitstream/10665/134014/1/9789241507691_eng.pdf)52. Japan National Institute of Infectious Diseases, “Response and Countermeasure Handbook for the Occurrence of Domestic Cases of Dengue Fever for Local Governments (Draft)” (http://www.mhlw.go.jp/bunya/kenkou/kekkaku-kansenshou19/dl/20140827-04.pdf)53. MOE, “Climate Change Adaptation Information Platform portal site” (http://www.adaptation-platform.nies.go.jp/map/national/HealthEAAD.htmll(2017年 2月 10に利用))54. Ichiro Kurane(2009).Effect of global warming on infectious diseases, Chikyu kankyo, 14(2), 279-28355. The European Climate Adaptation Platform website, “EuroHEAT online heatwave forecast” (http://climate-adapt.eea.europa.eu/metadata/tools/euroheat-online-heatwave-forecast)56. EuroHEAT project pamphlet, “Cliamate Information Decision Support Tool for Heat in Europe” (http://euroheat-project.org/dwd/flyer_guide.pdf)57. MOE pamphlet, “Guidelines for Measures Against Heat Stroke at Summer Events 2016 -Preliminary Version-” (http://www.wbgt.env.go.jp/pdf/gline/event_guideline2016_all.pdf)58. Yokohama City, “Adaptation Measures of Yokohama City “ (http://www.city.yokohama.lg.jp/ondan/plan/bukai/pdf/3-08shiryou4.pdf)59. MOE website, “Heat Stroke Prevention Site” (http://www.wbgt.env.go.jp/)60. Tokyo Metropolitan Institute of Public Health website, “感染症媒介蚊サーベイランス」 http://www.tokyo-eiken.go.jp/kj_kankyo/mosquito/61. IPCC, 2014: Climate Change 2014: Synthesis Report. Contribution of Working Groups I, II and III to the Fifth Assessment Report of the Intergovernmental Panel on Climate Change. Original text: http://www.ipcc.ch/report/ar5/syr/ Japanese translation of “Summary for Policymakers” : http://www.env.go.jp/earth/ipcc/5th/#SYR62. IPCC, 2014: Climate Change 2014: Mitigation of Climate Change. Contribution of Working Group III to the Fifth Assessment Report of the Intergovernmental Panel on Climate Change. Original text: http://mitigation2014.org/report/ Japanese translation of “Summary for Policymakers” : http://www.env.go.jp/earth/ipcc/5th/#WG363. NIES website, “Whole-atmospheric Monthly CO2 Concentration Based on SATellite ‘IBUKI’ Observation Data (Preliminary Report) “ (http://www.gosat.nies.go.jp/recent-global-co2.html)64. MOE, “Japan’ s National Greenhouse Gas Emissions in Fiscal Year (FY) 2015 (Preliminary Figures)” (http://www.env.go.jp/earth/ondanka/ghg/2015sokuho.pdf)65. MOE materials66. MOE website, “New Mechanism Information Platform” (http://www.mmechanisms.org/initiatives/jcm.html)67. MOE, “Overview of the Bill for the Partial Amendment of the Act on Promotion of Global Warming Measures” (http://www.env.go.jp/press/files/jp/29439.pdf)68. MOE, “Annex 1: Global Warming Countermeasure Plan (Cabinet decision be made in May 13, 2016)” (https://www.env.go.jp/press/files/jp/102816.pdf)69. MOE, “Adaptation Plan for the Impact of Climate Change “ (http://www.env.go.jp/earth/ondanka/tekiou/gaiyou.pdf)70. MOE, “Climate Change Adaptation Information Platform portal site²» (http://www.adaptation-platform.nies.go.jp/)71. MOE website, “COOL CHOICE” (https://ondankataisaku.env.go.jp/coolchoice/index.html)72. WMO, “WMO Statement on the Status of the Global Climate in 2015” (http://library.wmo.int/pmb_ged/wmo_1167_en.pdf)
Front cover: World distribution of temperature deviation of RCP8.5 at 2100 calculated under MIROC5 from annual mean temperature between 1986 and 2005Back cover: World distribution of temperature deviation of RCP2.6 at 2100 calculated under MIROC5 from annual mean temperature between 1986 and 2005
Sources
Planning: Global Environment Bureau, Ministry of the Environment, JapanEditorial Supervisor: National Institute for Environmental StudiesEditing: Mizuho Information & Research Institute, Inc.Published March 31, 2017