2014 And Dairy and Associated Forage Crop Production in ...
22
2014 Projected Commodity Costs And Returns D D a a i i r r y y a a n n d d A A s s s s o o c c i i a a t t e e d d F F o o r r a a g g e e C C r r o o p p P P r r o o d d u u c c t t i i o o n n i i n n L L o o u u i i s s i i a a n n a a Robert W. Boucher, Jeffrey M. Gillespie and Charles F. Hutchison Farm Management Research & Extension Department of Agricultural Economics & Agribusiness A.E.A. Information Series No. 297 - February 2014
Transcript of 2014 And Dairy and Associated Forage Crop Production in ...

22001144 PPrroojjeecctteedd CCoommmmooddiittyy CCoossttss AAnndd RReettuurrnnss
DDaaiirryy aanndd AAssssoocciiaatteedd FFoorraaggee
CCrroopp PPrroodduuccttiioonn iinn LLoouuiissiiaannaa
Robert W. Boucher, Jeffrey M. Gillespie and Charles F. Hutchison
Farm Management Research & Extension Department of Agricultural Economics & Agribusiness
A.E.A. Information Series No. 297 - February 2014
February 2014 A.E.A. Information Series No. 297
PROJECTED COSTS AND RETURNS FOR DAIRYAND ASSOCIATED
FORAGE CROP PRODUCTION IN LOUISIANA, 2014
by
Robert W. Boucher Jeffrey M. Gillespie
Charles F. Hutchison
Louisiana State University Agricultural Center Louisiana Agricultural Experiment Station/Louisiana Cooperate Extension Service

TABLE OF CONTENTS PAGE
INTRODUCTION C1DAIRY PRODUCTION BUDGETS C2FORAGE CROP BUDGETS C2SUMMARY OF COSTS AND RETURNS C2
LIST OF TABLESTABLE1 Summary of Estimated Costs and Returns per Head for
Dairy Production, Louisiana, 2014. C3
2 Summary of Estimated Costs per Acre and per Ton forSelected Forage Crops, Louisiana, 2014. C3
3 Breakeven Selling Prices for Milk, Selected Production Levels, Louisiana, 2014. C3
4A-5A Estimated Costs and Returns per Dairy Cow for C4-C5(4B-5B) Selected Situations, Louisiana, 2014. (C10-C11)
6A-7A Estimated Costs per Acre and per Ton for Selected C6(6B-7B) Harvested Forage Crops, Louisiana, 2014. (C12)
8A-9A Estimated Costs per Acre for Establishment of C7(8B-9B) Selected Permanent Pasture Crops, Louisiana, 2014. (C13) 10A-12A Estimated Costs per Acre for Selected Summer C8-C9(10B-12B) Pasture Crops, Louisiana, 2014. (C13-C14)
13A Estimated Costs per Acre, Temporary Winter Pastures, C9(13B) Prepared Seedbed, Dairy Herds, Louisiana, 2014. (C14)
APPENDIX TABLES
1 Powered Equipment: Estimated Performance Rate, Useful Life, Annual Use, Purchase Price, Repair Cost, Fuel Consumption Rate, and Direct and Fixed Costs per Hour and per Acre, 2014. C15
2 Implements: Estimated Performance Rate, Useful Life, Annual Use, Purchase Price, Repair Cost, andDirect and Fixed Costs per Hour and per Acre, 2014. C16
3 Durable Inputs: Estimated Repair Cost, Fuel Consumption Rate,Direct Cost per Unit of Measure and Fixed Cost per Unit of Measure
per Acre, Louisiana, 2014. C17
4 Operating Inputs: Estimated Prices, Louisiana, 2014. C18

ACKNOWLEDGMENTS
Annual cost projections published by the Department of Agricultural Economics andAgribusiness are a joint effort of the Farm Management Research Committee. The authors areindebted to many persons within the Louisiana State University Agricultural Center who provideddata and/or consultation for the budget projections. The authors are grateful to Ms. LyndaShoalmire and to County Agents and dairy producers who generously gave both time andinformation to make these estimates possible. Acknowledgment of the contributions of the aboveindividuals is not intended to imply their endorsement of the published budgets. The authors acceptsole responsibility for the content of this publication.
PROJECTED COSTS AND RETURNS FOR DAIRYAND ASSOCIATED
FORAGE CROP PRODUCTION IN LOUISIANA, 2014
by
Robert W. Boucher 1 , Jeffrey M. Gillespie 1 and Charles F. Hutchison 2
INTRODUCTION
This report presents projected costs and returns for dairy and associated forage cropproduction in Louisiana for 2014. Data for this report are based on Louisiana AgriculturalExperiment Station research results and selected surveys. The procedure used in this report wasto apply new machinery and other current input price data to production practice data. This reportis organized as follows: Tables 1 - 2 present dairy production summaries of costs and returns foreach of the enterprises examined in this report. Table 3 reports breakeven selling prices for milk.
Budgets in this publication are presented in two sections. The first section (tables with ̀ A'designation) presents budgets showing a summary of estimated costs and returns for eachenterprise. The second section (tables with `B' designation) presents cost budgets showingdetailed costs and labor requirements by operation for each enterprise. The detailed cost budgetsare presented in the same sequence and bear the same table numbers for each enterprisepresented in the first section.
Expenses are itemized as fixed and direct, and returns above direct and total specifiedexpenses are also calculated. Each of the budgets incorporates overhead costs as a residualclaimant. The total overhead costs for a firm are related to tenure and size of business. Theoverhead costs included in this report are estimated on a per acre basis, and thus are included inenterprise budgets on a per acre of land use basis. Land use for dairy is calculated as acres ofopen permanent pasture plus acres used for silage or summer annual forages. Since livestockenterprises are combinations of both crop and livestock production activities and some pasturecrops are double cropped, particular attention is called to the accounting procedures used. Nooverhead is charged to forage production activities. Therefore, overhead costs appear directly asa residual cost in dairy enterprise budgets.
A land opportunity cost is charged. This is interpreted as the amount that would becharged for the land if it were being rented to another producer. It assumes that pasture is rentedat $30/acre. 1 Research Associate and Martin D. Woodin Endowed Professor, Department of AgriculturalEconomics and Agribusiness, Louisiana Agricultural Experiment Station, Louisiana State UniversityAgricultural Center, Baton Rouge. 2 Associate Professor of Dairy Science, School of AnimalSciences, Louisiana State University Agricultural Center, Baton Rouge.

DAIRY PRODUCTION BUDGETS
Budgets showing projected costs and returns for two feeding programs for dairy productionare presented (Tables 4-5). Production practices and feeding programs are based on unpublishedsurveys of Louisiana dairy producers and consultation with panels of dairy farmers, the managersof the LSU dairy herds and Louisiana Cooperative Extension Service Dairy Specialists. The higherproduction level approximates the average production level for Louisiana DHIA herds. The lowerproduction level approximates the average production level for Louisiana commercial dairy herds. These budgets are presented to indicate anticipated costs and returns for average and aboveaverage producers and should not be interpreted as representative of all Louisiana dairy producers.
Table 3 shows breakeven selling prices for milk for five production levels for each productionsituation presented. Breakeven selling prices are presented for two levels of costs:
(1) Breakeven selling prices required to recover direct cash expenses
(2) Breakeven selling prices required to recover total specified expenses.
Particular note should be made that Total Specified Expenses do not include land andoverhead costs. Therefore, prices higher than those shown in Table 3 would be required beforeany return to investment in overhead and land would be realized. These income estimates also donot include MILC payments.
FORAGE CROP BUDGETS
A cost budget is presented for corn-silage production typical of Louisiana dairies (Table 6). A hay harvest situation is presented that reflects harvest technology used by producers (Tables 7). Production cost budgets are also shown for establishment and production of winter and summerforages for herds in Louisiana (Tables 8-13). Production practices are based on survey datasupplemented with information obtained by consultation with Louisiana Cooperative ExtensionService Agronomists and Dairy Specialists.
The sizes of machines assumed in the budgets are representative of the majority of dairyproducers. Dairy farmers operating large crop farms experience lower labor requirements andslightly lower machinery costs by taking advantage of larger land preparation equipment. Themachinery information presented in the appendix can be used to adjust machinery costs and laborrequirements for budgets presented in this report to fit a particular farm situation.
SUMMARY OF COSTS AND RETURNS
Summaries of estimated costs and returns and breakeven selling prices for the dairysituations included in this report are presented in Table 3. Dairy production shows returns abovedirect costs for 2014 (Tables 1, 4, and 5).
Breakeven selling prices presented in this report (Table 3) represent the cost per unit ofoutput at alternative yield levels. A price higher than the breakeven price would have to be receivedbefore the operator would receive a positive net return. Breakeven prices have been presented fordirect costs (a close approximation of cash costs for most producers) and for total specified costs,which represent all costs except land, overhead and risk for the business. Therefore, owner-operators would need a price above the breakeven price before a positive return to land, overheadand risk would be realized.
C-2
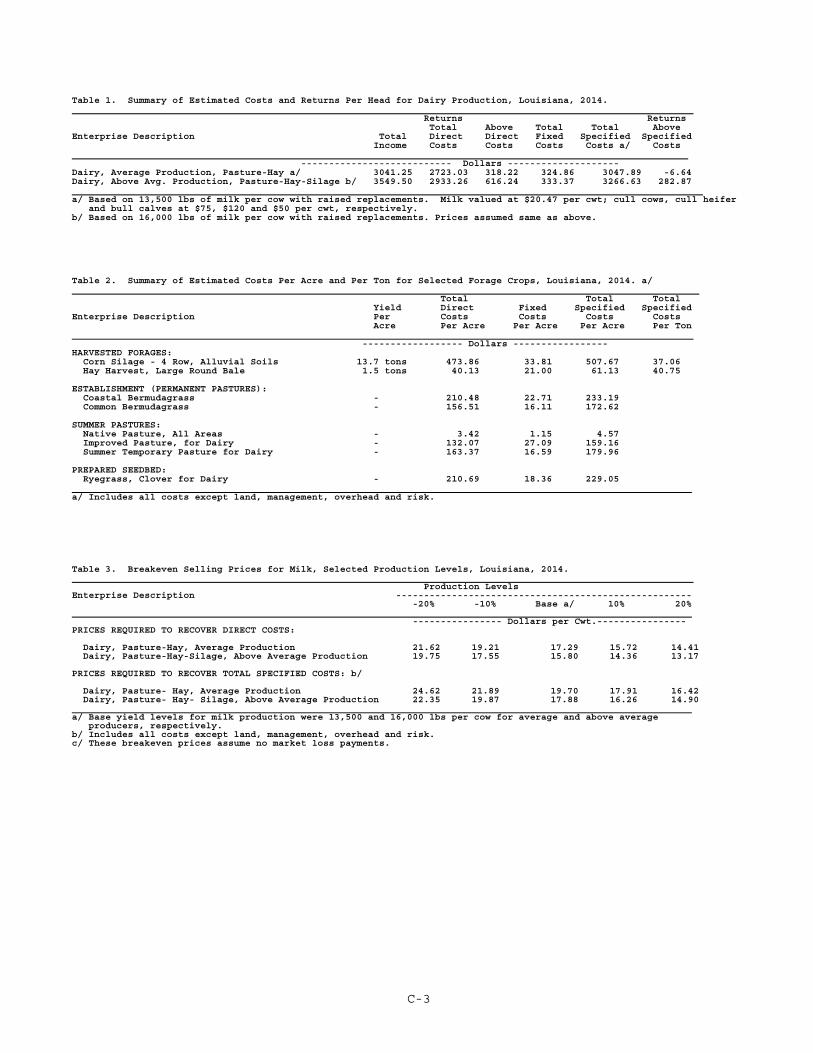
Table 1. Summary of Estimated Costs and Returns Per Head for Dairy Production, Louisiana, 2014. Returns Returns Total Above Total Total AboveEnterprise Description Total Direct Direct Fixed Specified Specified Income Costs Costs Costs Costs a/ Costs --------------------------- Dollars --------------------Dairy, Average Production, Pasture-Hay a/ 3041.25 2723.03 318.22 324.86 3047.89 -6.64Dairy, Above Avg. Production, Pasture-Hay-Silage b/ 3549.50 2933.26 616.24 333.37 3266.63 282.87 a/ Based on 13,500 lbs of milk per cow with raised replacements. Milk valued at $20.47 per cwt; cull cows, cull heifer and bull calves at $75, $120 and $50 per cwt, respectively.b/ Based on 16,000 lbs of milk per cow with raised replacements. Prices assumed same as above.
Table 2. Summary of Estimated Costs Per Acre and Per Ton for Selected Forage Crops, Louisiana, 2014. a/ Total Total Total Yield Direct Fixed Specified Specified Enterprise Description Per Costs Costs Costs Costs Acre Per Acre Per Acre Per Acre Per Ton ------------------ Dollars -----------------HARVESTED FORAGES: Corn Silage - 4 Row, Alluvial Soils 13.7 tons 473.86 33.81 507.67 37.06 Hay Harvest, Large Round Bale 1.5 tons 40.13 21.00 61.13 40.75 ESTABLISHMENT (PERMANENT PASTURES): Coastal Bermudagrass - 210.48 22.71 233.19 Common Bermudagrass - 156.51 16.11 172.62 SUMMER PASTURES: Native Pasture, All Areas - 3.42 1.15 4.57 Improved Pasture, for Dairy - 132.07 27.09 159.16 Summer Temporary Pasture for Dairy - 163.37 16.59 179.96 PREPARED SEEDBED: Ryegrass, Clover for Dairy - 210.69 18.36 229.05 a/ Includes all costs except land, management, overhead and risk.
Table 3. Breakeven Selling Prices for Milk, Selected Production Levels, Louisiana, 2014. Production Levels Enterprise Description ----------------------------------------------------- -20% -10% Base a/ 10% 20% ---------------- Dollars per Cwt.----------------PRICES REQUIRED TO RECOVER DIRECT COSTS: Dairy, Pasture-Hay, Average Production 21.62 19.21 17.29 15.72 14.41 Dairy, Pasture-Hay-Silage, Above Average Production 19.75 17.55 15.80 14.36 13.17 PRICES REQUIRED TO RECOVER TOTAL SPECIFIED COSTS: b/ Dairy, Pasture- Hay, Average Production 24.62 21.89 19.70 17.91 16.42 Dairy, Pasture- Hay- Silage, Above Average Production 22.35 19.87 17.88 16.26 14.90 a/ Base yield levels for milk production were 13,500 and 16,000 lbs per cow for average and above average producers, respectively.b/ Includes all costs except land, management, overhead and risk.c/ These breakeven prices assume no market loss payments.
C-3
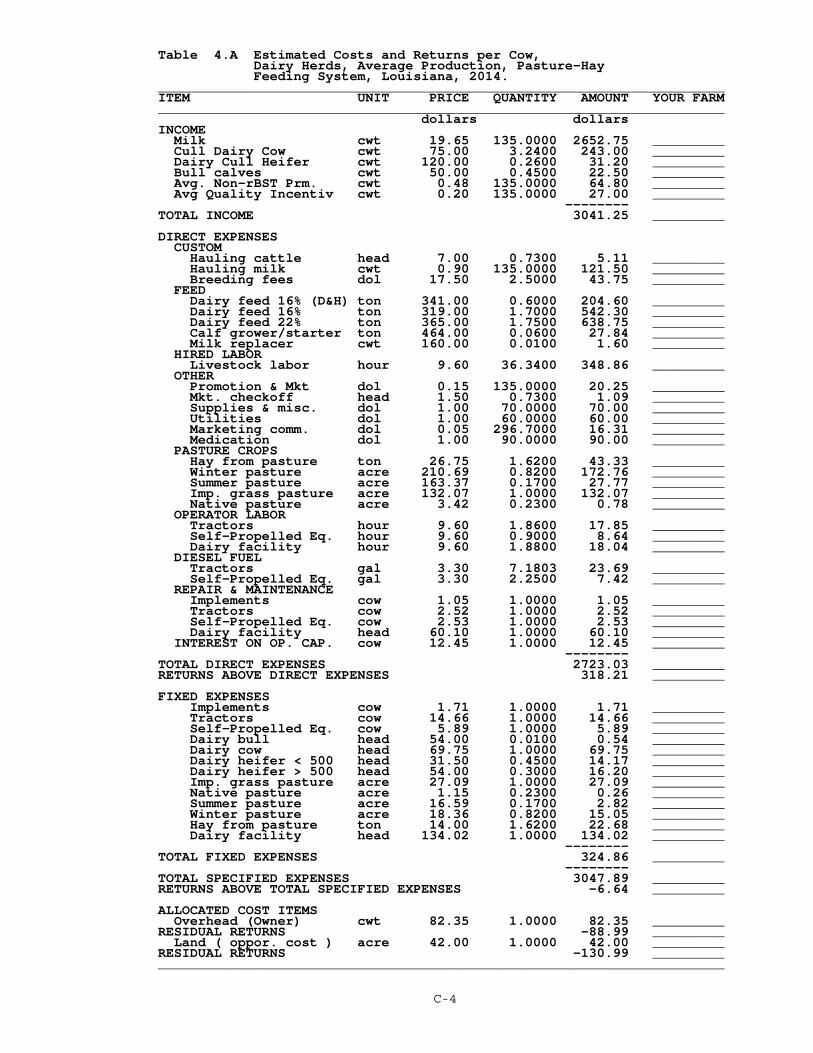
Table 4.A Estimated Costs and Returns per Cow, Dairy Herds, Average Production, Pasture-Hay Feeding System, Louisiana, 2014. _______________________________________________________________________ITEM UNIT PRICE QUANTITY AMOUNT YOUR FARM_______________________________________________________________________ dollars dollars INCOME Milk cwt 19.65 135.0000 2652.75 _________ Cull Dairy Cow cwt 75.00 3.2400 243.00 _________ Dairy Cull Heifer cwt 120.00 0.2600 31.20 _________ Bull calves cwt 50.00 0.4500 22.50 _________ Avg. Non-rBST Prm. cwt 0.48 135.0000 64.80 _________ Avg Quality Incentiv cwt 0.20 135.0000 27.00 _________ -------- TOTAL INCOME 3041.25 _________ DIRECT EXPENSES CUSTOM Hauling cattle head 7.00 0.7300 5.11 _________ Hauling milk cwt 0.90 135.0000 121.50 _________ Breeding fees dol 17.50 2.5000 43.75 _________ FEED Dairy feed 16% (D&H) ton 341.00 0.6000 204.60 _________ Dairy feed 16% ton 319.00 1.7000 542.30 _________ Dairy feed 22% ton 365.00 1.7500 638.75 _________ Calf grower/starter ton 464.00 0.0600 27.84 _________ Milk replacer cwt 160.00 0.0100 1.60 _________ HIRED LABOR Livestock labor hour 9.60 36.3400 348.86 _________ OTHER Promotion & Mkt dol 0.15 135.0000 20.25 _________ Mkt. checkoff head 1.50 0.7300 1.09 _________ Supplies & misc. dol 1.00 70.0000 70.00 _________ Utilities dol 1.00 60.0000 60.00 _________ Marketing comm. dol 0.05 296.7000 16.31 _________ Medication dol 1.00 90.0000 90.00 _________ PASTURE CROPS Hay from pasture ton 26.75 1.6200 43.33 _________ Winter pasture acre 210.69 0.8200 172.76 _________ Summer pasture acre 163.37 0.1700 27.77 _________ Imp. grass pasture acre 132.07 1.0000 132.07 _________ Native pasture acre 3.42 0.2300 0.78 _________ OPERATOR LABOR Tractors hour 9.60 1.8600 17.85 _________ Self-Propelled Eq. hour 9.60 0.9000 8.64 _________ Dairy facility hour 9.60 1.8800 18.04 _________ DIESEL FUEL Tractors gal 3.30 7.1803 23.69 _________ Self-Propelled Eq. gal 3.30 2.2500 7.42 _________ REPAIR & MAINTENANCE Implements cow 1.05 1.0000 1.05 _________ Tractors cow 2.52 1.0000 2.52 _________ Self-Propelled Eq. cow 2.53 1.0000 2.53 _________ Dairy facility head 60.10 1.0000 60.10 _________ INTEREST ON OP. CAP. cow 12.45 1.0000 12.45 _________ -------- TOTAL DIRECT EXPENSES 2723.03 _________RETURNS ABOVE DIRECT EXPENSES 318.21 _________ FIXED EXPENSES Implements cow 1.71 1.0000 1.71 _________ Tractors cow 14.66 1.0000 14.66 _________ Self-Propelled Eq. cow 5.89 1.0000 5.89 _________ Dairy bull head 54.00 0.0100 0.54 _________ Dairy cow head 69.75 1.0000 69.75 _________ Dairy heifer < 500 head 31.50 0.4500 14.17 _________ Dairy heifer > 500 head 54.00 0.3000 16.20 _________ Imp. grass pasture acre 27.09 1.0000 27.09 _________ Native pasture acre 1.15 0.2300 0.26 _________ Summer pasture acre 16.59 0.1700 2.82 _________ Winter pasture acre 18.36 0.8200 15.05 _________ Hay from pasture ton 14.00 1.6200 22.68 _________ Dairy facility head 134.02 1.0000 134.02 _________ -------- TOTAL FIXED EXPENSES 324.86 _________ -------- TOTAL SPECIFIED EXPENSES 3047.89 _________RETURNS ABOVE TOTAL SPECIFIED EXPENSES -6.64 _________ ALLOCATED COST ITEMS Overhead (Owner) cwt 82.35 1.0000 82.35 _________RESIDUAL RETURNS -88.99 _________ Land ( oppor. cost ) acre 42.00 1.0000 42.00 _________RESIDUAL RETURNS -130.99 ________________________________________________________________________________
C-4

Table 5.A Estimated Costs and Returns per Cow, Dairy Herds, Above Average Production, Pasture-Hay-Silage Feeding System, Louisiana, 2014. _______________________________________________________________________ITEM UNIT PRICE QUANTITY AMOUNT YOUR FARM_______________________________________________________________________ dollars dollars INCOME Milk cwt 19.65 160.0000 3144.00 _________ Cull Dairy Cow cwt 75.00 3.2400 243.00 _________ Dairy Cull Heifer cwt 120.00 0.2600 31.20 _________ Bull calves cwt 50.00 0.4500 22.50 _________ Avg Quality Incentiv cwt 0.20 160.0000 32.00 _________ Avg. Non-rBST Prm. cwt 0.48 160.0000 76.80 _________ -------- TOTAL INCOME 3549.50 _________ DIRECT EXPENSES CUSTOM Hauling cattle head 7.00 0.7300 5.11 _________ Hauling milk cwt 0.90 160.0000 144.00 _________ Breeding fees dol 17.50 2.5000 43.75 _________ FEED Dairy feed 16% (D&H) ton 341.00 0.6000 204.60 _________ Dairy feed 16% ton 319.00 1.7000 542.30 _________ Dairy feed 22% ton 365.00 1.7500 638.75 _________ Calf grower/starter ton 464.00 0.0600 27.84 _________ Milk replacer cwt 160.00 0.0100 1.60 _________ HIRED LABOR Livestock labor hour 9.60 36.3400 348.86 _________ OTHER Promotion & Mkt dol 0.15 160.0000 24.00 _________ Mkt. checkoff head 1.50 0.7300 1.09 _________ Supplies & misc. dol 1.00 70.0000 70.00 _________ Utilities dol 1.00 60.0000 60.00 _________ Marketing comm. dol 0.05 296.7000 16.31 _________ Medication dol 1.00 90.0000 90.00 _________ PASTURE CROPS Corn silage ton 34.59 7.2500 250.77 _________ Hay from pasture ton 26.75 1.0000 26.75 _________ Winter pasture acre 210.69 0.6300 132.73 _________ Summer pasture acre 163.37 0.1900 31.04 _________ Imp. grass pasture acre 132.07 0.7100 93.76 _________ OPERATOR LABOR Tractors hour 9.60 1.4080 13.51 _________ Self-Propelled Eq. hour 9.60 0.9000 8.64 _________ Silo hour 9.60 3.0260 29.04 _________ Dairy facility hour 9.60 1.8800 18.04 _________ DIESEL FUEL Tractors gal 3.30 5.2192 17.22 _________ Self-Propelled Eq. gal 3.30 2.2500 7.42 _________ REPAIR & MAINTENANCE Implements cow 2.02 1.0000 2.02 _________ Tractors cow 1.78 1.0000 1.78 _________ Self-Propelled Eq. cow 2.53 1.0000 2.53 _________ Silo ton 0.33 8.9000 2.93 _________ Dairy facility head 60.10 1.0000 60.10 _________ INTEREST ON OP. CAP. cow 16.68 1.0000 16.68 _________ -------- TOTAL DIRECT EXPENSES 2933.26 _________RETURNS ABOVE DIRECT EXPENSES 616.23 _________ FIXED EXPENSES Implements cow 2.69 1.0000 2.69 _________ Tractors cow 10.36 1.0000 10.36 _________ Self-Propelled Eq. cow 5.89 1.0000 5.89 _________ Silo ton 1.56 8.9000 13.88 _________ Dairy bull head 54.00 0.0100 0.54 _________ Dairy cow head 69.75 1.0000 69.75 _________ Dairy heifer < 500 head 31.50 0.4500 14.17 _________ Dairy heifer > 500 head 54.00 0.3000 16.20 _________ Imp. grass pasture acre 27.09 0.7100 19.23 _________ Summer pasture acre 16.59 0.1900 3.15 _________ Winter pasture acre 18.36 0.6300 11.56 _________ Hay from pasture ton 14.00 1.0000 14.00 _________ Dairy facility head 134.02 1.0000 134.02 _________ Corn silage ton 2.47 7.2500 17.90 _________ -------- TOTAL FIXED EXPENSES 333.37 _________ -------- TOTAL SPECIFIED EXPENSES 3266.63 _________RETURNS ABOVE TOTAL SPECIFIED EXPENSES 282.86 _________ ALLOCATED COST ITEMS Overhead (Owner) cwt 97.60 1.0000 97.60 _________RESIDUAL RETURNS 185.26 _________ Land ( oppor. cost ) acre 27.00 1.0000 27.00 _________RESIDUAL RETURNS 158.26 ________________________________________________________________________________
C-5

Table 6.A Estimated Costs per Acre, Corn Silage, Alluvial Soils, Custom Cut Haul Pack, Louisiana, 2014. _______________________________________________________________________ITEM UNIT PRICE QUANTITY AMOUNT YOUR FARM_______________________________________________________________________ dollars dollars DIRECT EXPENSES CUSTOM Fertilizer truck acre 4.50 1.0000 4.50 _________ Direct Cut ton 6.00 13.7000 82.20 _________ Hauling Silage mile 0.20 13.7000 2.74 _________ Kernal Processing ton 1.50 13.7000 20.55 _________ Inoculants ton 1.00 13.7000 13.70 _________ Silage Packing ton 1.50 13.7000 20.55 _________ FERTILIZER Nitrogen lbs 0.50 201.0000 100.50 _________ Phosphate lbs 0.50 76.0000 38.00 _________ Potash lbs 0.37 94.0000 34.78 _________ HERBICIDE Atrazine 4L pt 1.75 4.0000 7.00 _________ Lasso 4EC pt 3.30 4.0000 13.20 _________ INSECTICIDE Counter 15G lbs 2.55 5.0000 12.75 _________ SEED Corn seed thou 2.53 29.0000 73.37 _________ OPERATOR LABOR Tractors hour 9.60 1.0278 9.86 _________ DIESEL FUEL Tractors gal 3.30 7.6696 25.30 _________ REPAIR & MAINTENANCE Implements acre 4.76 1.0000 4.76 _________ Tractors acre 3.93 1.0000 3.93 _________ INTEREST ON OP. CAP. acre 6.15 1.0000 6.15 _________ -------- TOTAL DIRECT EXPENSES 473.86 _________FIXED EXPENSES Implements acre 10.96 1.0000 10.96 _________ Tractors acre 22.84 1.0000 22.84 _________ -------- TOTAL FIXED EXPENSES 33.81 _________ -------- TOTAL SPECIFIED EXPENSES 507.68 ________________________________________________________________________________
Table 7.A Estimated Costs per Ton, Hay Harvested from Pasture, Round Baler, One and One-Half Ton Yield per Cutting, Louisiana, 2014. _______________________________________________________________________ITEM UNIT PRICE QUANTITY AMOUNT YOUR FARM_______________________________________________________________________ dollars dollars DIRECT EXPENSES OTHER Twine ton 0.75 1.0000 0.75 _________ OPERATOR LABOR Tractors hour 9.60 0.8304 7.97 _________ DIESEL FUEL Tractors gal 3.30 2.8339 9.35 _________ REPAIR & MAINTENANCE Implements ton 7.36 1.0000 7.36 _________ Tractors ton 0.90 1.0000 0.90 _________ INTEREST ON OP. CAP. ton 0.41 1.0000 0.41 _________ -------- TOTAL DIRECT EXPENSES 26.75 _________FIXED EXPENSES Implements ton 8.72 1.0000 8.72 _________ Tractors ton 5.28 1.0000 5.28 _________ -------- TOTAL FIXED EXPENSES 14.00 _________ -------- TOTAL SPECIFIED EXPENSES 40.75 ________________________________________________________________________________
C-6
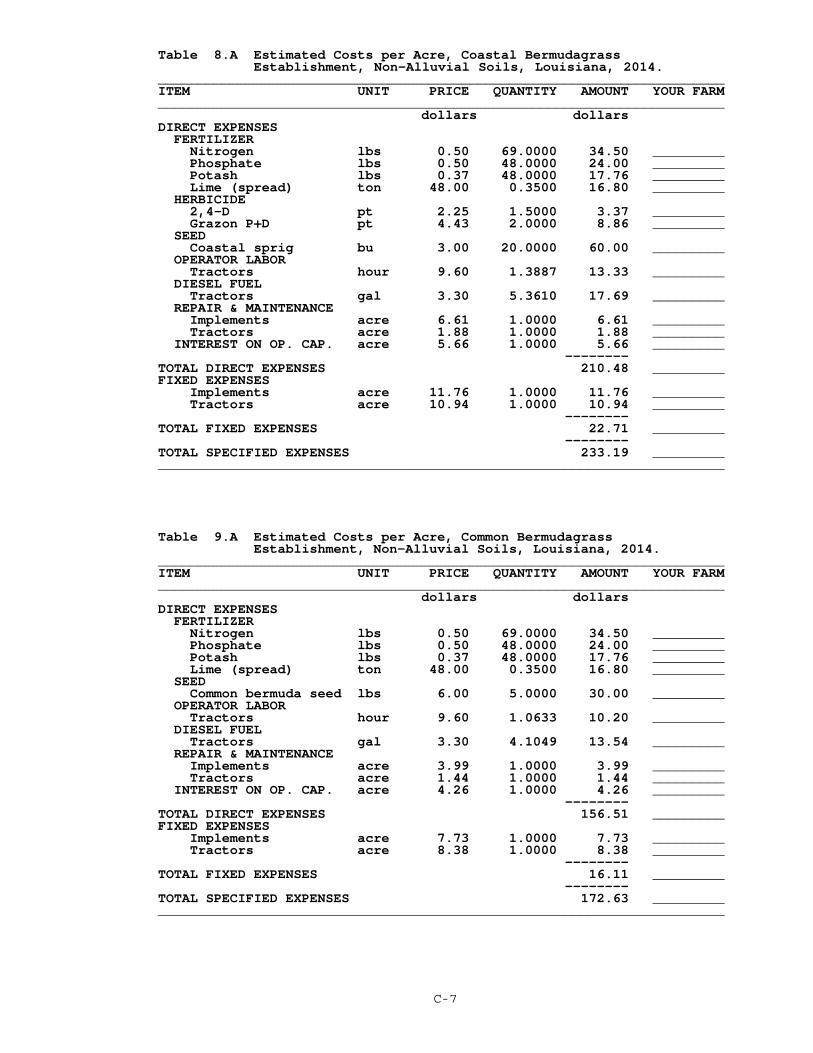
Table 8.A Estimated Costs per Acre, Coastal Bermudagrass Establishment, Non-Alluvial Soils, Louisiana, 2014.
_______________________________________________________________________ITEM UNIT PRICE QUANTITY AMOUNT YOUR FARM_______________________________________________________________________ dollars dollars DIRECT EXPENSES FERTILIZER Nitrogen lbs 0.50 69.0000 34.50 _________ Phosphate lbs 0.50 48.0000 24.00 _________ Potash lbs 0.37 48.0000 17.76 _________ Lime (spread) ton 48.00 0.3500 16.80 _________ HERBICIDE 2,4-D pt 2.25 1.5000 3.37 _________ Grazon P+D pt 4.43 2.0000 8.86 _________ SEED Coastal sprig bu 3.00 20.0000 60.00 _________ OPERATOR LABOR Tractors hour 9.60 1.3887 13.33 _________ DIESEL FUEL Tractors gal 3.30 5.3610 17.69 _________ REPAIR & MAINTENANCE Implements acre 6.61 1.0000 6.61 _________ Tractors acre 1.88 1.0000 1.88 _________ INTEREST ON OP. CAP. acre 5.66 1.0000 5.66 _________ -------- TOTAL DIRECT EXPENSES 210.48 _________FIXED EXPENSES Implements acre 11.76 1.0000 11.76 _________ Tractors acre 10.94 1.0000 10.94 _________ -------- TOTAL FIXED EXPENSES 22.71 _________ -------- TOTAL SPECIFIED EXPENSES 233.19 ________________________________________________________________________________
Table 9.A Estimated Costs per Acre, Common BermudagrassEstablishment, Non-Alluvial Soils, Louisiana, 2014.
_______________________________________________________________________ITEM UNIT PRICE QUANTITY AMOUNT YOUR FARM_______________________________________________________________________ dollars dollars DIRECT EXPENSES FERTILIZER Nitrogen lbs 0.50 69.0000 34.50 _________ Phosphate lbs 0.50 48.0000 24.00 _________ Potash lbs 0.37 48.0000 17.76 _________ Lime (spread) ton 48.00 0.3500 16.80 _________ SEED Common bermuda seed lbs 6.00 5.0000 30.00 _________ OPERATOR LABOR Tractors hour 9.60 1.0633 10.20 _________ DIESEL FUEL Tractors gal 3.30 4.1049 13.54 _________ REPAIR & MAINTENANCE Implements acre 3.99 1.0000 3.99 _________ Tractors acre 1.44 1.0000 1.44 _________ INTEREST ON OP. CAP. acre 4.26 1.0000 4.26 _________ -------- TOTAL DIRECT EXPENSES 156.51 _________FIXED EXPENSES Implements acre 7.73 1.0000 7.73 _________ Tractors acre 8.38 1.0000 8.38 _________ -------- TOTAL FIXED EXPENSES 16.11 _________ -------- TOTAL SPECIFIED EXPENSES 172.63 ________________________________________________________________________________
C-7
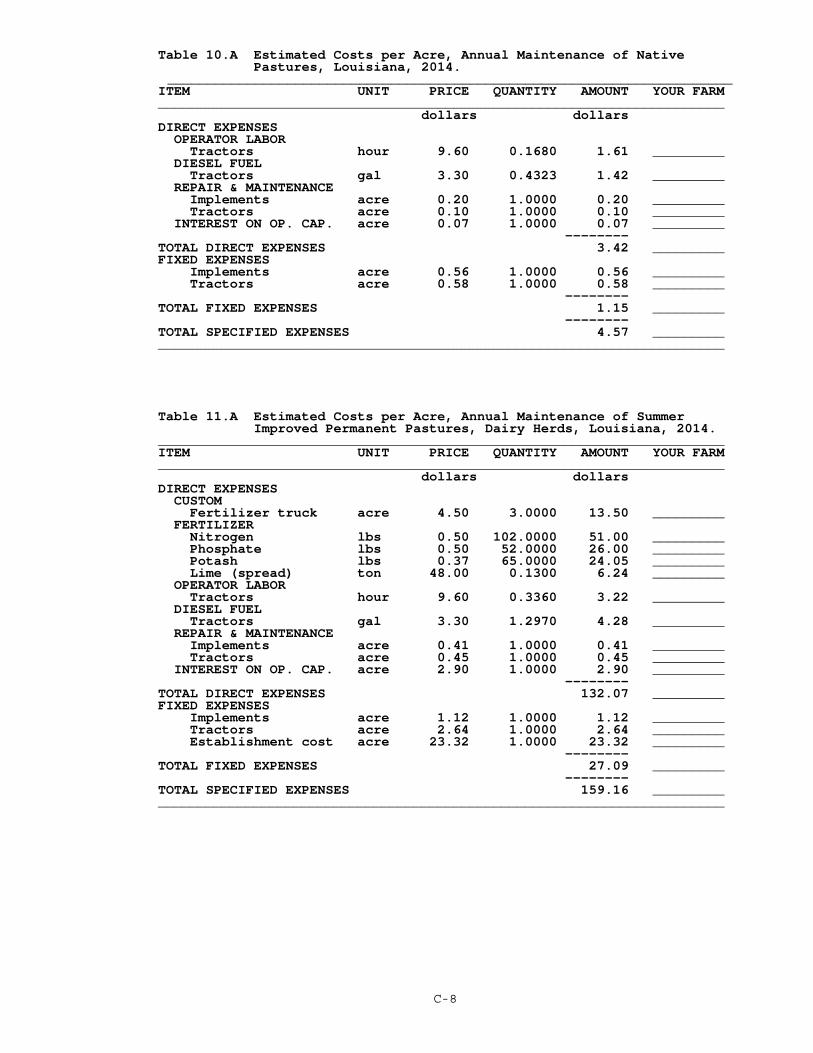
Table 10.A Estimated Costs per Acre, Annual Maintenance of NativePastures, Louisiana, 2014.
_______________________________________________________________________ITEM UNIT PRICE QUANTITY AMOUNT YOUR FARM_______________________________________________________________________ dollars dollars DIRECT EXPENSES OPERATOR LABOR Tractors hour 9.60 0.1680 1.61 _________ DIESEL FUEL Tractors gal 3.30 0.4323 1.42 _________ REPAIR & MAINTENANCE Implements acre 0.20 1.0000 0.20 _________ Tractors acre 0.10 1.0000 0.10 _________ INTEREST ON OP. CAP. acre 0.07 1.0000 0.07 _________ -------- TOTAL DIRECT EXPENSES 3.42 _________FIXED EXPENSES Implements acre 0.56 1.0000 0.56 _________ Tractors acre 0.58 1.0000 0.58 _________ -------- TOTAL FIXED EXPENSES 1.15 _________ -------- TOTAL SPECIFIED EXPENSES 4.57 ________________________________________________________________________________
Table 11.A Estimated Costs per Acre, Annual Maintenance of SummerImproved Permanent Pastures, Dairy Herds, Louisiana, 2014.
_______________________________________________________________________ITEM UNIT PRICE QUANTITY AMOUNT YOUR FARM_______________________________________________________________________ dollars dollars DIRECT EXPENSES CUSTOM Fertilizer truck acre 4.50 3.0000 13.50 _________ FERTILIZER Nitrogen lbs 0.50 102.0000 51.00 _________ Phosphate lbs 0.50 52.0000 26.00 _________ Potash lbs 0.37 65.0000 24.05 _________ Lime (spread) ton 48.00 0.1300 6.24 _________ OPERATOR LABOR Tractors hour 9.60 0.3360 3.22 _________ DIESEL FUEL Tractors gal 3.30 1.2970 4.28 _________ REPAIR & MAINTENANCE Implements acre 0.41 1.0000 0.41 _________ Tractors acre 0.45 1.0000 0.45 _________ INTEREST ON OP. CAP. acre 2.90 1.0000 2.90 _________ -------- TOTAL DIRECT EXPENSES 132.07 _________FIXED EXPENSES Implements acre 1.12 1.0000 1.12 _________ Tractors acre 2.64 1.0000 2.64 _________ Establishment cost acre 23.32 1.0000 23.32 _________ -------- TOTAL FIXED EXPENSES 27.09 _________ -------- TOTAL SPECIFIED EXPENSES 159.16 ________________________________________________________________________________
C-8
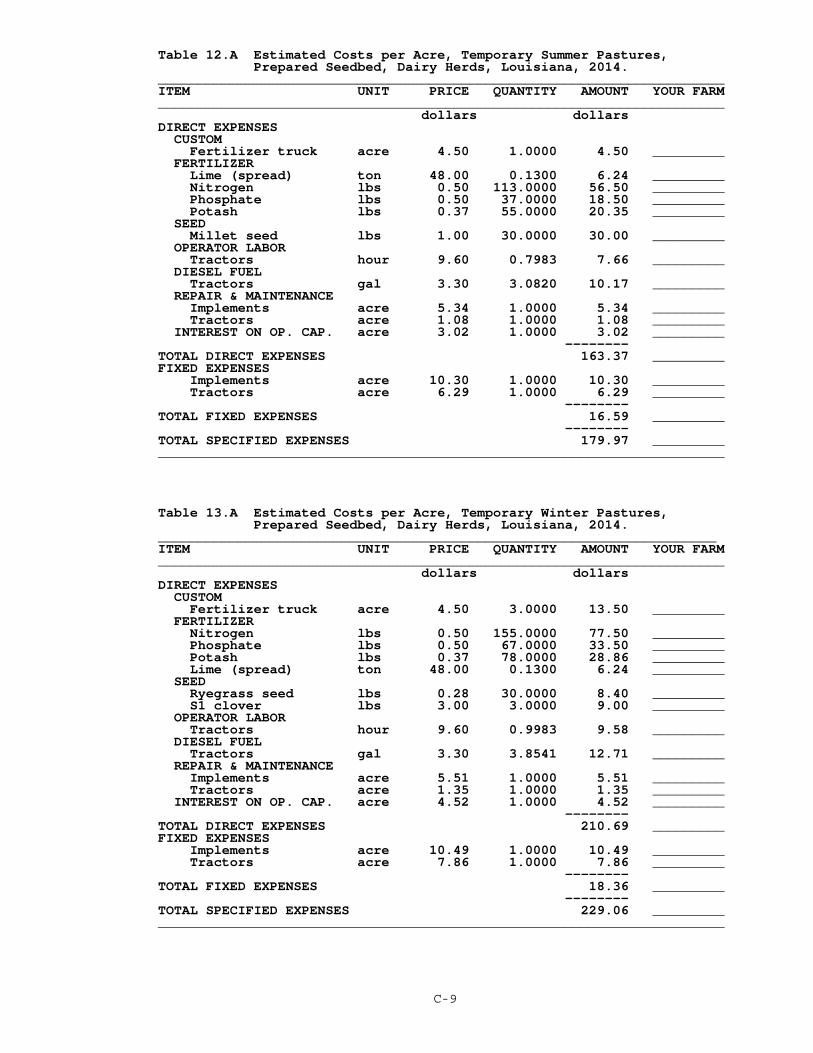
Table 12.A Estimated Costs per Acre, Temporary Summer Pastures,Prepared Seedbed, Dairy Herds, Louisiana, 2014.
_______________________________________________________________________ITEM UNIT PRICE QUANTITY AMOUNT YOUR FARM_______________________________________________________________________ dollars dollars DIRECT EXPENSES CUSTOM Fertilizer truck acre 4.50 1.0000 4.50 _________ FERTILIZER Lime (spread) ton 48.00 0.1300 6.24 _________ Nitrogen lbs 0.50 113.0000 56.50 _________ Phosphate lbs 0.50 37.0000 18.50 _________ Potash lbs 0.37 55.0000 20.35 _________ SEED Millet seed lbs 1.00 30.0000 30.00 _________ OPERATOR LABOR Tractors hour 9.60 0.7983 7.66 _________ DIESEL FUEL Tractors gal 3.30 3.0820 10.17 _________ REPAIR & MAINTENANCE Implements acre 5.34 1.0000 5.34 _________ Tractors acre 1.08 1.0000 1.08 _________ INTEREST ON OP. CAP. acre 3.02 1.0000 3.02 _________ -------- TOTAL DIRECT EXPENSES 163.37 _________FIXED EXPENSES Implements acre 10.30 1.0000 10.30 _________ Tractors acre 6.29 1.0000 6.29 _________ -------- TOTAL FIXED EXPENSES 16.59 _________ -------- TOTAL SPECIFIED EXPENSES 179.97 ________________________________________________________________________________
Table 13.A Estimated Costs per Acre, Temporary Winter Pastures,Prepared Seedbed, Dairy Herds, Louisiana, 2014.
______________________________________________________________________ITEM UNIT PRICE QUANTITY AMOUNT YOUR FARM_______________________________________________________________________ dollars dollars DIRECT EXPENSES CUSTOM Fertilizer truck acre 4.50 3.0000 13.50 _________ FERTILIZER Nitrogen lbs 0.50 155.0000 77.50 _________ Phosphate lbs 0.50 67.0000 33.50 _________ Potash lbs 0.37 78.0000 28.86 _________ Lime (spread) ton 48.00 0.1300 6.24 _________ SEED Ryegrass seed lbs 0.28 30.0000 8.40 _________ S1 clover lbs 3.00 3.0000 9.00 _________ OPERATOR LABOR Tractors hour 9.60 0.9983 9.58 _________ DIESEL FUEL Tractors gal 3.30 3.8541 12.71 _________ REPAIR & MAINTENANCE Implements acre 5.51 1.0000 5.51 _________ Tractors acre 1.35 1.0000 1.35 _________ INTEREST ON OP. CAP. acre 4.52 1.0000 4.52 _________ -------- TOTAL DIRECT EXPENSES 210.69 _________FIXED EXPENSES Implements acre 10.49 1.0000 10.49 _________ Tractors acre 7.86 1.0000 7.86 _________ -------- TOTAL FIXED EXPENSES 18.36 _________ -------- TOTAL SPECIFIED EXPENSES 229.06 ________________________________________________________________________________
C-9
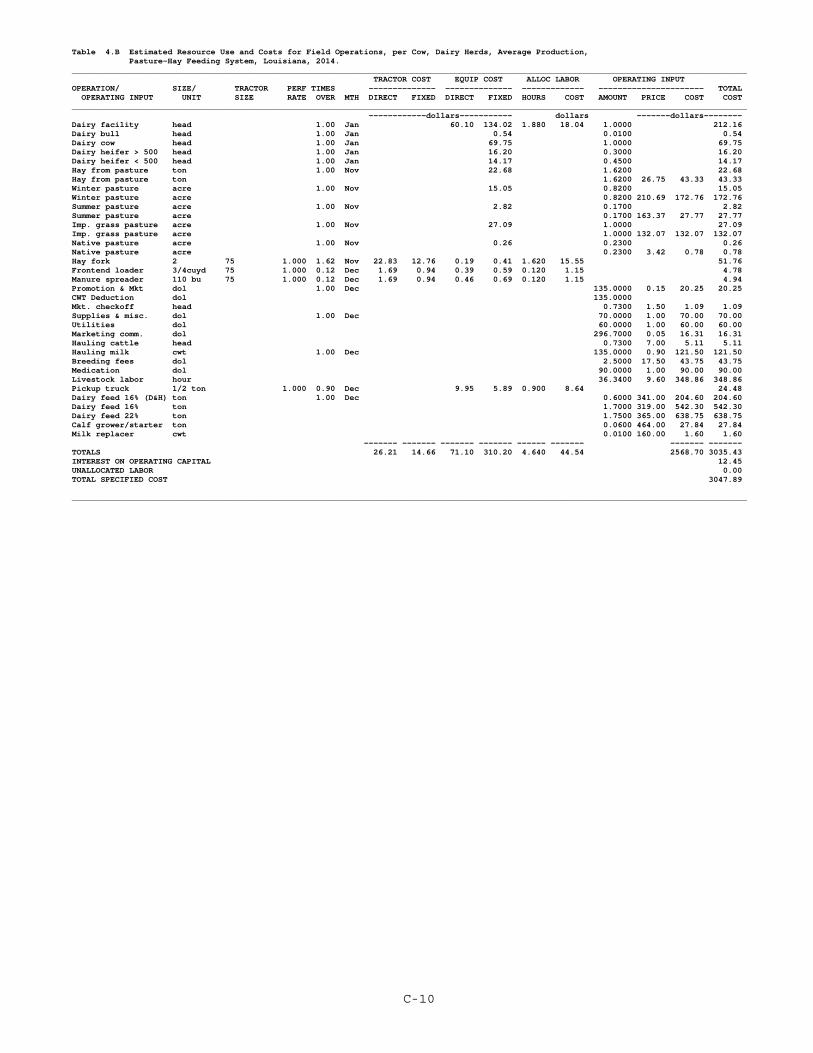
Table 4.B Estimated Resource Use and Costs for Field Operations, per Cow, Dairy Herds, Average Production, Pasture-Hay Feeding System, Louisiana, 2014._____________________________________________________________________________________________________________________________________________ TRACTOR COST EQUIP COST ALLOC LABOR OPERATING INPUT OPERATION/ SIZE/ TRACTOR PERF TIMES -------------- -------------- ------------- ---------------------- TOTAL OPERATING INPUT UNIT SIZE RATE OVER MTH DIRECT FIXED DIRECT FIXED HOURS COST AMOUNT PRICE COST COST _____________________________________________________________________________________________________________________________________________ ------------dollars----------- dollars -------dollars-------- Dairy facility head 1.00 Jan 60.10 134.02 1.880 18.04 1.0000 212.16 Dairy bull head 1.00 Jan 0.54 0.0100 0.54 Dairy cow head 1.00 Jan 69.75 1.0000 69.75 Dairy heifer > 500 head 1.00 Jan 16.20 0.3000 16.20 Dairy heifer < 500 head 1.00 Jan 14.17 0.4500 14.17 Hay from pasture ton 1.00 Nov 22.68 1.6200 22.68 Hay from pasture ton 1.6200 26.75 43.33 43.33 Winter pasture acre 1.00 Nov 15.05 0.8200 15.05 Winter pasture acre 0.8200 210.69 172.76 172.76 Summer pasture acre 1.00 Nov 2.82 0.1700 2.82 Summer pasture acre 0.1700 163.37 27.77 27.77 Imp. grass pasture acre 1.00 Nov 27.09 1.0000 27.09 Imp. grass pasture acre 1.0000 132.07 132.07 132.07 Native pasture acre 1.00 Nov 0.26 0.2300 0.26 Native pasture acre 0.2300 3.42 0.78 0.78 Hay fork 2 75 1.000 1.62 Nov 22.83 12.76 0.19 0.41 1.620 15.55 51.76 Frontend loader 3/4cuyd 75 1.000 0.12 Dec 1.69 0.94 0.39 0.59 0.120 1.15 4.78 Manure spreader 110 bu 75 1.000 0.12 Dec 1.69 0.94 0.46 0.69 0.120 1.15 4.94 Promotion & Mkt dol 1.00 Dec 135.0000 0.15 20.25 20.25 CWT Deduction dol 135.0000 Mkt. checkoff head 0.7300 1.50 1.09 1.09 Supplies & misc. dol 1.00 Dec 70.0000 1.00 70.00 70.00 Utilities dol 60.0000 1.00 60.00 60.00 Marketing comm. dol 296.7000 0.05 16.31 16.31 Hauling cattle head 0.7300 7.00 5.11 5.11 Hauling milk cwt 1.00 Dec 135.0000 0.90 121.50 121.50 Breeding fees dol 2.5000 17.50 43.75 43.75 Medication dol 90.0000 1.00 90.00 90.00 Livestock labor hour 36.3400 9.60 348.86 348.86 Pickup truck 1/2 ton 1.000 0.90 Dec 9.95 5.89 0.900 8.64 24.48 Dairy feed 16% (D&H) ton 1.00 Dec 0.6000 341.00 204.60 204.60 Dairy feed 16% ton 1.7000 319.00 542.30 542.30 Dairy feed 22% ton 1.7500 365.00 638.75 638.75 Calf grower/starter ton 0.0600 464.00 27.84 27.84 Milk replacer cwt 0.0100 160.00 1.60 1.60 ------- ------- ------- ------- ------ ------- ------- ------- TOTALS 26.21 14.66 71.10 310.20 4.640 44.54 2568.70 3035.43 INTEREST ON OPERATING CAPITAL 12.45 UNALLOCATED LABOR 0.00 TOTAL SPECIFIED COST 3047.89 _____________________________________________________________________________________________________________________________________________
C-10

Table 5.B Estimated Resource Use and Costs for Field Operations, per Cow, Dairy Herds, Above Average Production, Pasture-Hay-Silage Feeding System, Louisiana, 2014. ____________________________________________________________________________________________________________________________________________ TRACTOR COST EQUIP COST ALLOC LABOR OPERATING INPUT OPERATION/ SIZE/ TRACTOR PERF TIMES -------------- -------------- ------------- ---------------------- TOTAL OPERATING INPUT UNIT SIZE RATE OVER MTH DIRECT FIXED DIRECT FIXED HOURS COST AMOUNT PRICE COST COST _____________________________________________________________________________________________________________________________________________ ------------dollars----------- dollars -------dollars-------- Dairy facility head 1.00 Jan 60.10 134.02 1.880 18.04 1.0000 212.16 Dairy bull head 1.00 Jan 0.54 0.0100 0.54 Dairy cow head 1.00 Jan 69.75 1.0000 69.75 Dairy heifer > 500 head 1.00 Jan 16.20 0.3000 16.20 Dairy heifer < 500 head 1.00 Jan 14.17 0.4500 14.17 Corn silage ton 1.00 Jul 17.90 7.2500 17.90 Corn silage ton 7.2500 34.59 250.77 250.77 Hay from pasture ton 1.00 Nov 14.00 1.0000 14.00 Hay from pasture ton 1.0000 26.75 26.75 26.75 Winter pasture acre 1.00 Nov 11.56 0.6300 11.56 Winter pasture acre 0.6300 210.69 132.73 132.73 Summer pasture acre 1.00 Nov 3.15 0.1900 3.15 Summer pasture acre 0.1900 163.37 31.04 31.04 Imp. grass pasture acre 1.00 Nov 19.23 0.7100 19.23 Imp. grass pasture acre 0.7100 132.07 93.76 93.76 Hay fork 2 75 1.000 1.00 Nov 14.09 7.88 0.11 0.25 1.000 9.60 31.95 Frontend loader 3/4cuyd 75 1.000 0.12 Dec 1.69 0.94 0.39 0.59 0.120 1.15 4.78 Manure spreader 110 bu 75 1.000 0.12 Dec 1.69 0.94 0.46 0.69 0.120 1.15 4.94 Promotion & Mkt dol 1.00 Dec 160.0000 0.15 24.00 24.00 CWT Deduction dol 160.0000 Mkt. checkoff head 0.7300 1.50 1.09 1.09 Supplies & misc. dol 1.00 Dec 70.0000 1.00 70.00 70.00 Utilities dol 60.0000 1.00 60.00 60.00 Marketing comm. dol 296.7000 0.05 16.31 16.31 Hauling cattle head 0.7300 7.00 5.11 5.11 Hauling milk cwt 1.00 Dec 160.0000 0.90 144.00 144.00 Breeding fees dol 2.5000 17.50 43.75 43.75 Medication dol 90.0000 1.00 90.00 90.00 Livestock labor hour 36.3400 9.60 348.86 348.86 Pickup truck 1/2 ton 1.000 0.90 Dec 9.95 5.89 0.900 8.64 24.48 Self unload wagon 4 ton 50 0.200 0.84 Dec 1.52 0.58 1.05 1.13 0.168 1.61 5.91 Silo ton 1.00 Dec 2.93 13.88 3.026 29.04 8.9000 45.87 Dairy feed 16% (D&H) ton 1.00 Dec 0.6000 341.00 204.60 204.60 Dairy feed 16% ton 1.7000 319.00 542.30 542.30 Dairy feed 22% ton 1.7500 365.00 638.75 638.75 Calf grower/starter ton 0.0600 464.00 27.84 27.84 Milk replacer cwt 0.0100 160.00 1.60 1.60 ------- ------- ------- ------- ------ ------- ------- ------- TOTALS 19.00 10.36 75.02 323.01 7.214 69.25 2753.29 3249.95 INTEREST ON OPERATING CAPITAL 16.68 UNALLOCATED LABOR 0.00 TOTAL SPECIFIED COST 3266.63 _____________________________________________________________________________________________________________________________________________
C-11

Table 6.B Estimated Resource Use and Costs for Field Operations, per Acre, Corn Silage, Alluvial Soils, Custom Cut Haul Pack, Louisiana, 2014. ____________________________________________________________________________________________________________________________________________ TRACTOR COST EQUIP COST ALLOC LABOR OPERATING INPUT OPERATION/ SIZE/ TRACTOR PERF TIMES -------------- -------------- ------------- ---------------------- TOTAL OPERATING INPUT UNIT SIZE RATE OVER MTH DIRECT FIXED DIRECT FIXED HOURS COST AMOUNT PRICE COST COST _____________________________________________________________________________________________________________________________________________ ------------dollars----------- dollars -------dollars-------- Disk 14 ft 150 0.140 2.00 Feb 8.28 6.62 1.72 3.51 0.280 2.69 22.84 Fertilizer truck acre 1.00 Feb 1.0000 4.50 4.50 4.50 Nitrogen lbs 201.0000 0.50 100.50 100.50 Phosphate lbs 76.0000 0.50 38.00 38.00 Potash lbs 94.0000 0.37 34.78 34.78 Hipper 4R-38 150 0.147 1.00 Feb 4.36 3.48 0.28 0.73 0.147 1.41 10.28 Conditioner 13.3 ft 105 0.114 1.00 Mar 2.27 1.29 0.20 0.83 0.114 1.10 5.70 Plant + pre 4R-38 150 0.159 1.00 Mar 4.72 3.77 1.60 2.96 0.159 1.53 14.60 Corn seed thou 29.0000 2.53 73.37 73.37 Atrazine 4L pt 4.0000 1.75 7.00 7.00 Lasso 4EC pt 4.0000 3.30 13.20 13.20 Counter 15G lbs 5.0000 2.55 12.75 12.75 Cultivator 4R-38 150 0.162 1.00 Mar 4.79 3.83 0.47 1.46 0.162 1.55 12.12 Cultivator 4R-38 150 0.162 1.00 Apr 4.79 3.83 0.47 1.46 0.162 1.55 12.12 Direct Cut ton 1.00 Jul 13.7000 6.00 82.20 82.20 Hauling Silage mile 13.7000 0.20 2.74 2.74 Kernal Processing ton 13.7000 1.50 20.55 20.55 Inoculants ton 13.7000 1.00 13.70 13.70 Silage Packing ton 13.7000 1.50 20.55 20.55 ------- ------- ------- ------- ------ ------- ------- ------- TOTALS 29.24 22.84 4.76 10.96 1.027 9.86 423.84 501.52 INTEREST ON OPERATING CAPITAL 6.15 UNALLOCATED LABOR 0.00 TOTAL SPECIFIED COST 507.68 _____________________________________________________________________________________________________________________________________________
Table 7.B Estimated Resource Use and Costs for Field Operations, per Ton, Hay Harvested from Pasture, Round Baler, One and One-Half Ton Yield per Cutting, Louisiana, 2014. ____________________________________________________________________________________________________________________________________________ TRACTOR COST EQUIP COST ALLOC LABOR OPERATING INPUT OPERATION/ SIZE/ TRACTOR PERF TIMES -------------- -------------- ------------- ---------------------- TOTAL OPERATING INPUT UNIT SIZE RATE OVER MTH DIRECT FIXED DIRECT FIXED HOURS COST AMOUNT PRICE COST COST _____________________________________________________________________________________________________________________________________________ ------------dollars----------- dollars -------dollars-------- Mower conditioner 9 ft 50 0.229 0.67 Jun 1.39 0.53 2.25 2.44 0.153 1.47 8.11 Hay rake 8.5 ft 50 0.202 0.67 Jun 1.23 0.47 0.55 0.75 0.135 1.30 4.32 Baler round large 75 0.211 1.00 Jun 2.98 1.66 4.50 5.43 0.211 2.03 16.61 Twine ton 1.0000 0.75 0.75 0.75 Hay fork 2 75 1.000 0.33 Jun 4.65 2.60 0.03 0.08 0.330 3.16 10.54 ------- ------- ------- ------- ------ ------- ------- ------- TOTALS 10.26 5.28 7.36 8.72 0.830 7.97 0.75 40.34 INTEREST ON OPERATING CAPITAL 0.41 UNALLOCATED LABOR 0.00 TOTAL SPECIFIED COST 40.75 _____________________________________________________________________________________________________________________________________________
C-12
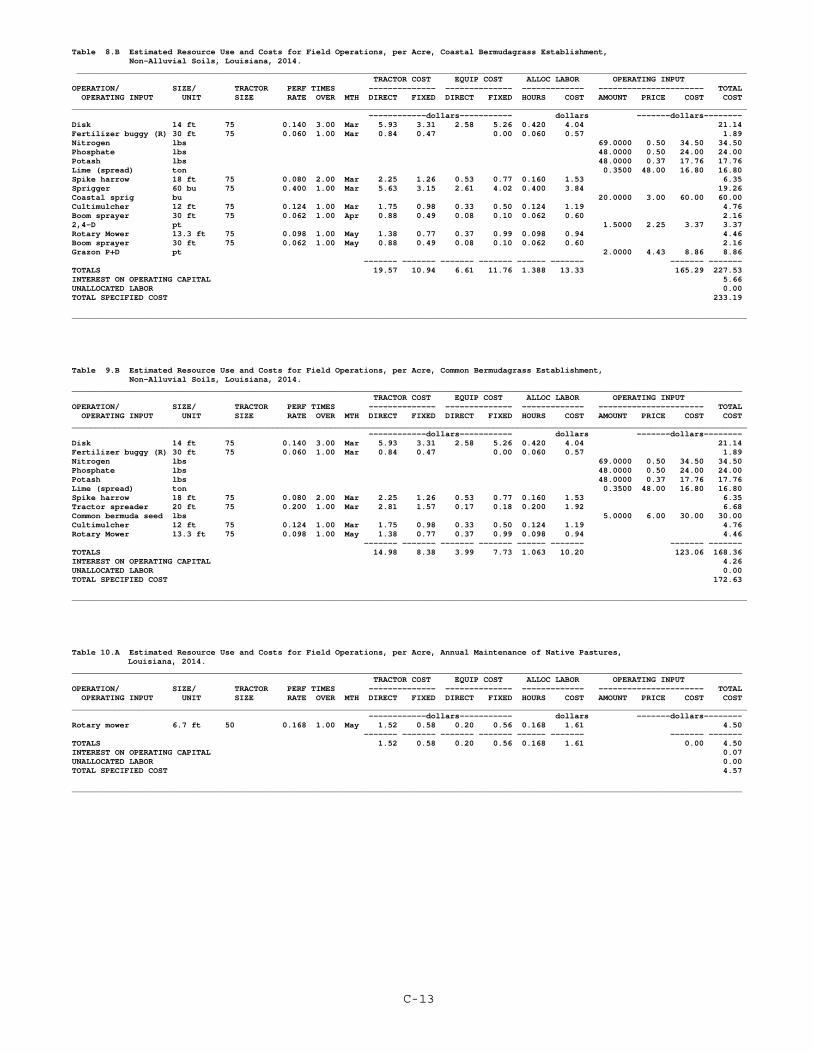
Table 8.B Estimated Resource Use and Costs for Field Operations, per Acre, Coastal Bermudagrass Establishment, Non-Alluvial Soils, Louisiana, 2014. ____________________________________________________________________________________________________________________________________________ TRACTOR COST EQUIP COST ALLOC LABOR OPERATING INPUT OPERATION/ SIZE/ TRACTOR PERF TIMES -------------- -------------- ------------- ---------------------- TOTAL OPERATING INPUT UNIT SIZE RATE OVER MTH DIRECT FIXED DIRECT FIXED HOURS COST AMOUNT PRICE COST COST _____________________________________________________________________________________________________________________________________________ ------------dollars----------- dollars -------dollars-------- Disk 14 ft 75 0.140 3.00 Mar 5.93 3.31 2.58 5.26 0.420 4.04 21.14 Fertilizer buggy (R) 30 ft 75 0.060 1.00 Mar 0.84 0.47 0.00 0.060 0.57 1.89 Nitrogen lbs 69.0000 0.50 34.50 34.50 Phosphate lbs 48.0000 0.50 24.00 24.00 Potash lbs 48.0000 0.37 17.76 17.76 Lime (spread) ton 0.3500 48.00 16.80 16.80 Spike harrow 18 ft 75 0.080 2.00 Mar 2.25 1.26 0.53 0.77 0.160 1.53 6.35 Sprigger 60 bu 75 0.400 1.00 Mar 5.63 3.15 2.61 4.02 0.400 3.84 19.26 Coastal sprig bu 20.0000 3.00 60.00 60.00 Cultimulcher 12 ft 75 0.124 1.00 Mar 1.75 0.98 0.33 0.50 0.124 1.19 4.76 Boom sprayer 30 ft 75 0.062 1.00 Apr 0.88 0.49 0.08 0.10 0.062 0.60 2.16 2,4-D pt 1.5000 2.25 3.37 3.37 Rotary Mower 13.3 ft 75 0.098 1.00 May 1.38 0.77 0.37 0.99 0.098 0.94 4.46 Boom sprayer 30 ft 75 0.062 1.00 May 0.88 0.49 0.08 0.10 0.062 0.60 2.16 Grazon P+D pt 2.0000 4.43 8.86 8.86 ------- ------- ------- ------- ------ ------- ------- ------- TOTALS 19.57 10.94 6.61 11.76 1.388 13.33 165.29 227.53 INTEREST ON OPERATING CAPITAL 5.66 UNALLOCATED LABOR 0.00 TOTAL SPECIFIED COST 233.19 _____________________________________________________________________________________________________________________________________________
Table 9.B Estimated Resource Use and Costs for Field Operations, per Acre, Common Bermudagrass Establishment, Non-Alluvial Soils, Louisiana, 2014.____________________________________________________________________________________________________________________________________________ TRACTOR COST EQUIP COST ALLOC LABOR OPERATING INPUT OPERATION/ SIZE/ TRACTOR PERF TIMES -------------- -------------- ------------- ---------------------- TOTAL OPERATING INPUT UNIT SIZE RATE OVER MTH DIRECT FIXED DIRECT FIXED HOURS COST AMOUNT PRICE COST COST _____________________________________________________________________________________________________________________________________________ ------------dollars----------- dollars -------dollars-------- Disk 14 ft 75 0.140 3.00 Mar 5.93 3.31 2.58 5.26 0.420 4.04 21.14 Fertilizer buggy (R) 30 ft 75 0.060 1.00 Mar 0.84 0.47 0.00 0.060 0.57 1.89 Nitrogen lbs 69.0000 0.50 34.50 34.50 Phosphate lbs 48.0000 0.50 24.00 24.00 Potash lbs 48.0000 0.37 17.76 17.76 Lime (spread) ton 0.3500 48.00 16.80 16.80 Spike harrow 18 ft 75 0.080 2.00 Mar 2.25 1.26 0.53 0.77 0.160 1.53 6.35 Tractor spreader 20 ft 75 0.200 1.00 Mar 2.81 1.57 0.17 0.18 0.200 1.92 6.68 Common bermuda seed lbs 5.0000 6.00 30.00 30.00 Cultimulcher 12 ft 75 0.124 1.00 Mar 1.75 0.98 0.33 0.50 0.124 1.19 4.76 Rotary Mower 13.3 ft 75 0.098 1.00 May 1.38 0.77 0.37 0.99 0.098 0.94 4.46 ------- ------- ------- ------- ------ ------- ------- ------- TOTALS 14.98 8.38 3.99 7.73 1.063 10.20 123.06 168.36 INTEREST ON OPERATING CAPITAL 4.26 UNALLOCATED LABOR 0.00 TOTAL SPECIFIED COST 172.63 _____________________________________________________________________________________________________________________________________________
Table 10.A Estimated Resource Use and Costs for Field Operations, per Acre, Annual Maintenance of Native Pastures, Louisiana, 2014. ____________________________________________________________________________________________________________________________________________ TRACTOR COST EQUIP COST ALLOC LABOR OPERATING INPUT OPERATION/ SIZE/ TRACTOR PERF TIMES -------------- -------------- ------------- ---------------------- TOTAL OPERATING INPUT UNIT SIZE RATE OVER MTH DIRECT FIXED DIRECT FIXED HOURS COST AMOUNT PRICE COST COST _____________________________________________________________________________________________________________________________________________ ------------dollars----------- dollars -------dollars-------- Rotary mower 6.7 ft 50 0.168 1.00 May 1.52 0.58 0.20 0.56 0.168 1.61 4.50 ------- ------- ------- ------- ------ ------- ------- ------- TOTALS 1.52 0.58 0.20 0.56 0.168 1.61 0.00 4.50 INTEREST ON OPERATING CAPITAL 0.07 UNALLOCATED LABOR 0.00 TOTAL SPECIFIED COST 4.57 ____________________________________________________________________________________________________________________________________________
C-13
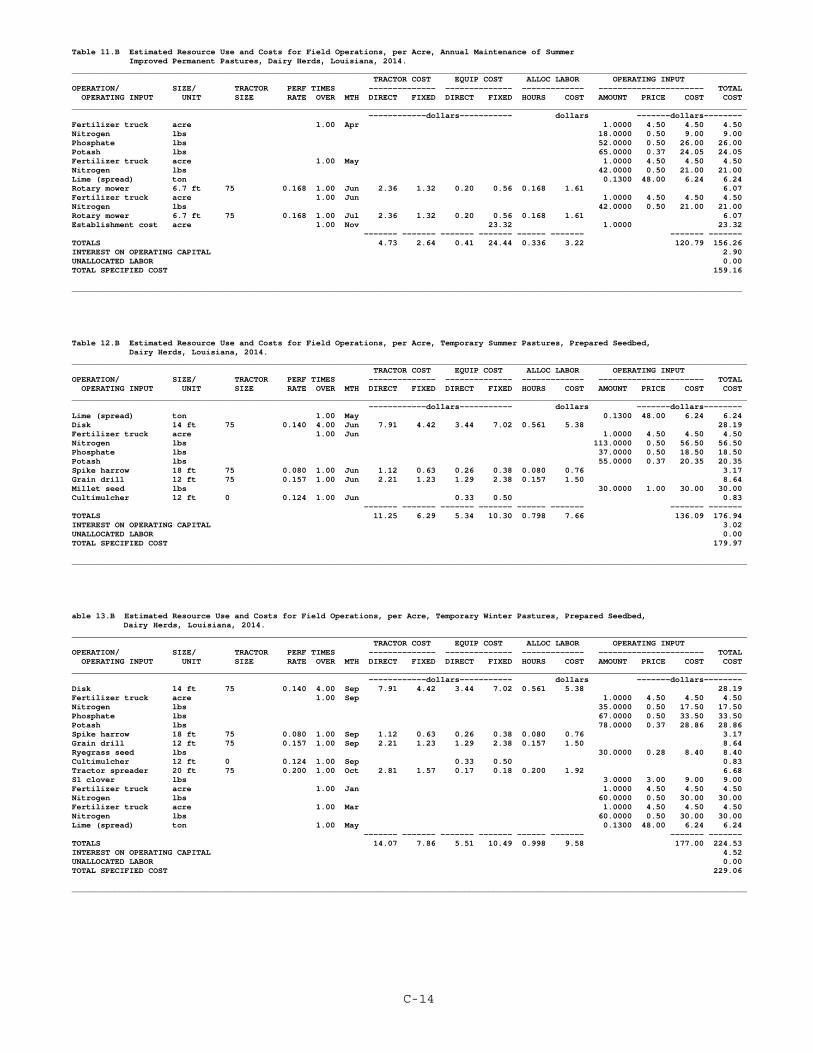
Table 11.B Estimated Resource Use and Costs for Field Operations, per Acre, Annual Maintenance of Summer Improved Permanent Pastures, Dairy Herds, Louisiana, 2014. _____________________________________________________________________________________________________________________________________________ TRACTOR COST EQUIP COST ALLOC LABOR OPERATING INPUT OPERATION/ SIZE/ TRACTOR PERF TIMES -------------- -------------- ------------- ---------------------- TOTAL OPERATING INPUT UNIT SIZE RATE OVER MTH DIRECT FIXED DIRECT FIXED HOURS COST AMOUNT PRICE COST COST _____________________________________________________________________________________________________________________________________________ ------------dollars----------- dollars -------dollars-------- Fertilizer truck acre 1.00 Apr 1.0000 4.50 4.50 4.50 Nitrogen lbs 18.0000 0.50 9.00 9.00 Phosphate lbs 52.0000 0.50 26.00 26.00 Potash lbs 65.0000 0.37 24.05 24.05 Fertilizer truck acre 1.00 May 1.0000 4.50 4.50 4.50 Nitrogen lbs 42.0000 0.50 21.00 21.00 Lime (spread) ton 0.1300 48.00 6.24 6.24 Rotary mower 6.7 ft 75 0.168 1.00 Jun 2.36 1.32 0.20 0.56 0.168 1.61 6.07 Fertilizer truck acre 1.00 Jun 1.0000 4.50 4.50 4.50 Nitrogen lbs 42.0000 0.50 21.00 21.00 Rotary mower 6.7 ft 75 0.168 1.00 Jul 2.36 1.32 0.20 0.56 0.168 1.61 6.07 Establishment cost acre 1.00 Nov 23.32 1.0000 23.32 ------- ------- ------- ------- ------ ------- ------- ------- TOTALS 4.73 2.64 0.41 24.44 0.336 3.22 120.79 156.26 INTEREST ON OPERATING CAPITAL 2.90 UNALLOCATED LABOR 0.00 TOTAL SPECIFIED COST 159.16 ____________________________________________________________________________________________________________________________________________
Table 12.B Estimated Resource Use and Costs for Field Operations, per Acre, Temporary Summer Pastures, Prepared Seedbed, Dairy Herds, Louisiana, 2014._____________________________________________________________________________________________________________________________________________ TRACTOR COST EQUIP COST ALLOC LABOR OPERATING INPUT OPERATION/ SIZE/ TRACTOR PERF TIMES -------------- -------------- ------------- ---------------------- TOTAL OPERATING INPUT UNIT SIZE RATE OVER MTH DIRECT FIXED DIRECT FIXED HOURS COST AMOUNT PRICE COST COST _____________________________________________________________________________________________________________________________________________ ------------dollars----------- dollars -------dollars-------- Lime (spread) ton 1.00 May 0.1300 48.00 6.24 6.24 Disk 14 ft 75 0.140 4.00 Jun 7.91 4.42 3.44 7.02 0.561 5.38 28.19 Fertilizer truck acre 1.00 Jun 1.0000 4.50 4.50 4.50 Nitrogen lbs 113.0000 0.50 56.50 56.50 Phosphate lbs 37.0000 0.50 18.50 18.50 Potash lbs 55.0000 0.37 20.35 20.35 Spike harrow 18 ft 75 0.080 1.00 Jun 1.12 0.63 0.26 0.38 0.080 0.76 3.17 Grain drill 12 ft 75 0.157 1.00 Jun 2.21 1.23 1.29 2.38 0.157 1.50 8.64 Millet seed lbs 30.0000 1.00 30.00 30.00 Cultimulcher 12 ft 0 0.124 1.00 Jun 0.33 0.50 0.83 ------- ------- ------- ------- ------ ------- ------- ------- TOTALS 11.25 6.29 5.34 10.30 0.798 7.66 136.09 176.94 INTEREST ON OPERATING CAPITAL 3.02 UNALLOCATED LABOR 0.00 TOTAL SPECIFIED COST 179.97 _____________________________________________________________________________________________________________________________________________
able 13.B Estimated Resource Use and Costs for Field Operations, per Acre, Temporary Winter Pastures, Prepared Seedbed, Dairy Herds, Louisiana, 2014. _____________________________________________________________________________________________________________________________________________ TRACTOR COST EQUIP COST ALLOC LABOR OPERATING INPUT OPERATION/ SIZE/ TRACTOR PERF TIMES -------------- -------------- ------------- ---------------------- TOTAL OPERATING INPUT UNIT SIZE RATE OVER MTH DIRECT FIXED DIRECT FIXED HOURS COST AMOUNT PRICE COST COST _____________________________________________________________________________________________________________________________________________ ------------dollars----------- dollars -------dollars-------- Disk 14 ft 75 0.140 4.00 Sep 7.91 4.42 3.44 7.02 0.561 5.38 28.19 Fertilizer truck acre 1.00 Sep 1.0000 4.50 4.50 4.50 Nitrogen lbs 35.0000 0.50 17.50 17.50 Phosphate lbs 67.0000 0.50 33.50 33.50 Potash lbs 78.0000 0.37 28.86 28.86 Spike harrow 18 ft 75 0.080 1.00 Sep 1.12 0.63 0.26 0.38 0.080 0.76 3.17 Grain drill 12 ft 75 0.157 1.00 Sep 2.21 1.23 1.29 2.38 0.157 1.50 8.64 Ryegrass seed lbs 30.0000 0.28 8.40 8.40 Cultimulcher 12 ft 0 0.124 1.00 Sep 0.33 0.50 0.83 Tractor spreader 20 ft 75 0.200 1.00 Oct 2.81 1.57 0.17 0.18 0.200 1.92 6.68 S1 clover lbs 3.0000 3.00 9.00 9.00 Fertilizer truck acre 1.00 Jan 1.0000 4.50 4.50 4.50 Nitrogen lbs 60.0000 0.50 30.00 30.00 Fertilizer truck acre 1.00 Mar 1.0000 4.50 4.50 4.50 Nitrogen lbs 60.0000 0.50 30.00 30.00 Lime (spread) ton 1.00 May 0.1300 48.00 6.24 6.24 ------- ------- ------- ------- ------ ------- ------- ------- TOTALS 14.07 7.86 5.51 10.49 0.998 9.58 177.00 224.53 INTEREST ON OPERATING CAPITAL 4.52 UNALLOCATED LABOR 0.00 TOTAL SPECIFIED COST 229.06 _____________________________________________________________________________________________________________________________________________
C-14
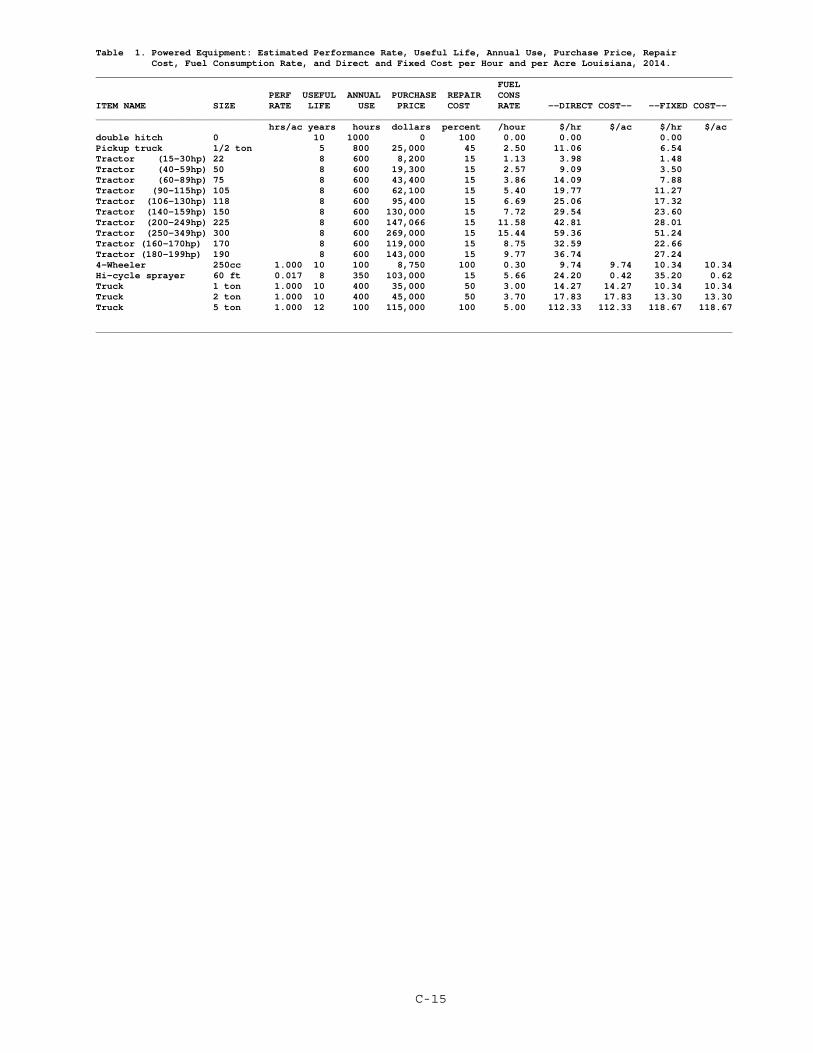
Table 1. Powered Equipment: Estimated Performance Rate, Useful Life, Annual Use, Purchase Price, Repair Cost, Fuel Consumption Rate, and Direct and Fixed Cost per Hour and per Acre Louisiana, 2014. __________________________________________________________________________________________________________________ FUEL PERF USEFUL ANNUAL PURCHASE REPAIR CONS ITEM NAME SIZE RATE LIFE USE PRICE COST RATE --DIRECT COST-- --FIXED COST-- __________________________________________________________________________________________________________________ hrs/ac years hours dollars percent /hour $/hr $/ac $/hr $/ac double hitch 0 10 1000 0 100 0.00 0.00 0.00 Pickup truck 1/2 ton 5 800 25,000 45 2.50 11.06 6.54 Tractor (15-30hp) 22 8 600 8,200 15 1.13 3.98 1.48 Tractor (40-59hp) 50 8 600 19,300 15 2.57 9.09 3.50 Tractor (60-89hp) 75 8 600 43,400 15 3.86 14.09 7.88 Tractor (90-115hp) 105 8 600 62,100 15 5.40 19.77 11.27 Tractor (106-130hp) 118 8 600 95,400 15 6.69 25.06 17.32 Tractor (140-159hp) 150 8 600 130,000 15 7.72 29.54 23.60 Tractor (200-249hp) 225 8 600 147,066 15 11.58 42.81 28.01 Tractor (250-349hp) 300 8 600 269,000 15 15.44 59.36 51.24 Tractor (160-170hp) 170 8 600 119,000 15 8.75 32.59 22.66 Tractor (180-199hp) 190 8 600 143,000 15 9.77 36.74 27.24 4-Wheeler 250cc 1.000 10 100 8,750 100 0.30 9.74 9.74 10.34 10.34 Hi-cycle sprayer 60 ft 0.017 8 350 103,000 15 5.66 24.20 0.42 35.20 0.62 Truck 1 ton 1.000 10 400 35,000 50 3.00 14.27 14.27 10.34 10.34 Truck 2 ton 1.000 10 400 45,000 50 3.70 17.83 17.83 13.30 13.30 Truck 5 ton 1.000 12 100 115,000 100 5.00 112.33 112.33 118.67 118.67
__________________________________________________________________________________________________________________
C-15

Appendix Table 2. Implements: Estimated Performance Rate, Useful Life, Annual Use, Purchase Price, Repair Cost, and Direct and Fixed Cost per Hour and per Acre Louisiana, 2014. PERF USEFUL ANNUAL PURCHASE REPAIR ITEM NAME SIZE RATE LIFE USE PRICE COST --DIRECT COST-- --FIXED COST- hrs/ac years hours dollars percent $/hr $/ac $/hr $/acBaler conventional 20 ft 0.229 8 200 20,908 80 10.45 2.39 14.17 3.24Baler round large 0.211 8 200 37,863 90 21.29 4.50 25.67 5.43Boom sprayer 30 ft 0.062 8 200 3,000 75 1.40 0.08 1.63 0.10Conditioner 13.3 ft 0.114 10 100 7,120 25 1.78 0.20 7.25 0.83Conditioner 21 ft 0.071 10 100 11,700 25 2.92 0.20 11.92 0.84Cultimulcher 12 ft 0.124 15 120 5,500 88 2.68 0.33 4.04 0.50Disk 14 ft 0.140 10 180 22,100 50 6.13 0.86 12.51 1.75Disk 24 ft 0.081 10 180 35,900 50 9.97 0.81 20.33 1.66Disk 28 ft 0.070 10 180 42,200 50 11.72 0.82 23.90 1.67Disk 6 ft 0.410 10 200 1,750 88 0.77 0.31 1.03 0.42Disk + pre 14 ft 0.149 10 200 27,600 60 8.28 1.23 14.07 2.10Disk + pre 24ft 0.087 10 200 41,400 60 12.42 1.08 21.10 1.84Ditcher rotary 1.5 ft 0.020 10 200 4,860 80 1.94 0.03 2.47 0.04Ditcher side 1.5 ft 0.009 10 200 4,860 80 1.94 0.01 2.47 0.02Dozer blade 8 ft 0.880 20 100 3,030 66 0.99 0.87 2.23 1.96Drag 14 ft 0.130 8 200 500 88 0.27 0.03 0.35 0.04Fertilizer app (R) 20 ft 0.090 10 200 1 0 0.00 0.00 0.00 0.00Fertilizer buggy (R) 30 ft 0.060 10 150 1 0 0.00 0.00 0.00 0.00Field cult + pre 24 ft 0.066 10 100 24,679 25 6.16 0.40 25.16 1.66Field cult + pre 32 ft 0.049 10 100 33,211 25 8.30 0.41 33.86 1.67Field cultivator 24 ft 0.062 10 100 26,000 25 6.50 0.40 26.51 1.64Frontend loader 3/4cuyd 1.000 15 100 5,652 88 3.31 3.31 4.99 4.99Grain cart 500 bu 0.057 12 200 23,700 65 6.41 0.36 10.69 0.61Grain drill 12 ft 0.157 8 150 22,000 45 8.25 1.29 15.19 2.38Grain drill 20 ft 0.094 8 150 35,500 45 13.31 1.25 24.52 2.31Harrow 13 ft 0.233 10 200 3,780 70 1.32 0.30 1.92 0.44Hay fork 2 1.000 8 200 382 50 0.11 0.11 0.25 0.25Hay rake 17 ft 0.101 8 200 5,061 80 2.53 0.25 3.43 0.34Hay rake 8.5 ft 0.202 8 200 8,258 80 4.12 0.83 5.59 1.13Hay tedder 17 ft 0.101 8 200 8,722 80 4.36 0.44 5.91 0.59Honey wagon 3000 gal 1.000 10 200 6,380 88 2.80 2.80 3.77 3.77Land level 13 ft 0.151 10 200 7,500 40 1.50 0.22 3.82 0.57Manure spreader 110 bu 1.000 15 100 6,550 88 3.84 3.84 5.78 5.78Moldboard 4 bottom 6 ft 0.330 15 200 7,809 108 2.81 0.92 3.44 1.13Mower conditioner 9 ft 0.229 8 200 23,535 100 14.70 3.36 15.95 3.65Mower drum 8 ft 0.257 8 200 10,272 100 6.42 1.64 6.96 1.79Mower sickle 7 ft 0.340 10 150 3,750 175 4.37 1.48 2.95 1.00No till planter 8R-38 0.077 8 150 39,800 45 14.92 1.15 27.49 2.13Nurse tank 1000 gal 0.130 10 130 3,500 22 0.59 0.07 3.18 0.41Ripper-hipper 13.3 ft 0.160 10 200 7,780 88 3.42 0.54 4.59 0.73Rotary hoe 18 ft 0.080 20 75 4,500 110 3.30 0.26 4.42 0.35Rotary Mower 13.3 ft 0.098 10 150 12,900 44 3.78 0.37 10.16 0.99Rotary mower 6.7 ft 0.168 10 150 4,250 44 1.24 0.20 3.35 0.56Self unload wagon 4 ton 0.200 8 200 10,000 100 6.25 1.25 6.78 1.35Silage blower large 0.060 8 200 5,500 100 3.43 0.20 3.72 0.22Silage blower small 0.080 8 200 4,200 100 2.62 0.21 2.84 0.22Silage harvester 1 row 0.080 8 200 22,000 100 13.75 1.10 14.91 1.19Silage harvester 2 row 0.510 8 200 40,362 100 25.22 12.86 27.36 13.95Silage wagon 12 ton 0.510 15 200 16,284 60 3.25 1.66 6.99 3.56Silage wagon 6 ton 0.080 15 200 11,838 60 2.36 0.18 5.08 0.40Sodseeder 12 ft 0.196 8 150 34,000 45 12.75 2.50 23.49 4.61Spike harrow 18 ft 0.080 10 200 9,500 70 3.32 0.26 4.84 0.38Sprayer cattle 6 ft 1.000 15 70 700 71 0.47 0.47 0.88 0.88Sprigger 60 bu 0.400 10 100 8,500 77 6.54 2.61 10.05 4.02Springtooth harrow 20 ft 0.110 13 150 3,690 132 2.49 0.27 2.39 0.26Stalk cutter 14 ft 0.117 10 200 13,000 175 11.37 1.34 6.62 0.78Stalk cutter 20 ft 0.082 10 200 30,500 175 26.68 2.20 15.54 1.28Subsoiler 3 shank 0.204 15 100 3,550 50 1.18 0.24 2.79 0.57Tractor blade 6 ft 1.000 20 200 1,030 190 0.48 0.48 0.37 0.37Tractor spreader 20 ft 0.200 8 100 700 100 0.87 0.17 0.94 0.18Trailer gooseneck 6 ft 1.000 15 200 7,300 80 1.94 1.94 3.13 3.13Trailer hay 20 ft 0.500 15 200 4,296 80 1.14 0.57 1.84 0.92Trailer utility 10 ft 1.000 15 200 2,000 80 0.53 0.53 0.85 0.85V-Ripper 7 shank 0.170 15 100 10,200 110 7.48 1.27 9.00 1.53V-Ripper 9 shank 0.130 15 100 19,400 110 14.22 1.84 17.13 2.22Water level 16 ft 0.220 15 100 3,500 66 1.54 0.33 3.09 0.67
__________________________________________________________________________________________________________
C-16
Appendix Table 3. Durable Inputs: Estimated Repair Cost, Fuel Consumption Rate, Direct Cost per Unit of Measure, and Fixed Cost per Unit of Measure or per Acre, Louisiana, 2014. ________________________________________________________________________________ FUEL REPAIR CONS ITEM NAME UNIT COST RATE DIRECT COST FIXED COST ________________________________________________________________________________ $/U of M /U of M $/U of M $/U of M Barn each 34.000 0.000 34.000 615.400 Beef bull head 0.000 0.000 0.000 123.750 Beef cow head 0.000 0.000 0.000 56.250 Beef heifer head 0.000 0.000 0.000 45.000 Belt feeder ton 0.130 0.540 0.205 0.970 Corn silage ton 0.000 0.000 0.000 2.470 Corral each 72.780 0.000 72.780 211.050 Dairy bull head 0.000 0.000 0.000 54.000 Dairy cow head 0.000 0.000 0.000 69.750 Dairy facility head 60.100 0.000 60.100 134.020 Dairy facility head 60.100 0.000 60.100 134.020 Dairy heifer < 500 head 0.000 0.000 0.000 31.500 Dairy heifer > 500 head 0.000 0.000 0.000 54.000 Establishment cost acre 0.000 0.000 0.000 23.320Establishment cost acre 0.000 0.000 0.000 17.260Establishment cost acre 0.000 0.000 0.000 119.740Feed bunk each 5.250 0.000 5.250 12.860 Feedmill hour 0.750 0.640 0.839 3.610 Fence 5-wire mile 210.000 0.000 210.000 444.520 Fence electric mile 38.000 0.000 38.000 243.770 Finish operation head 5.400 0.000 5.400 14.630 Hay from pasture ton 0.000 0.000 0.000 14.000 Hay production ton 0.000 0.000 0.000 19.190 Hay rack each 9.040 0.000 9.040 25.140 Imp. grass pasture acre 0.000 0.000 0.000 27.090 Interest on op. cap. dol 0.000 0.000 0.000 1.000 Lagoon system each 286.670 0.000 286.670 1917.080 Loafing shed each 20.000 0.000 20.000 362.000 Milk parlor & equip each 7333.330 0.000 7333.330 10303.330 Native pasture acre 0.000 0.000 0.000 1.150 Ryegrass prepared acre 0.000 0.000 0.000 8.430 Ryegrass sodseeded acre 0.000 0.000 0.000 0.420 Semi-imp. grass past acre 0.000 0.000 0.000 25.270 Shop bld. & equip. acre 8.190 0.000 8.190 6.350 Silo ton 0.330 0.000 0.330 1.560 Squeeze chute each 28.580 0.000 28.580 138.110 Summer pasture acre 0.000 0.000 0.000 16.590 Wash area & equip each 666.670 0.000 666.670 936.670 Water tank & pump each 40.000 0.000 40.000 122.500 Winter pasture acre 0.000 0.000 0.000 18.360 ________________________________________________________________________________
C-17
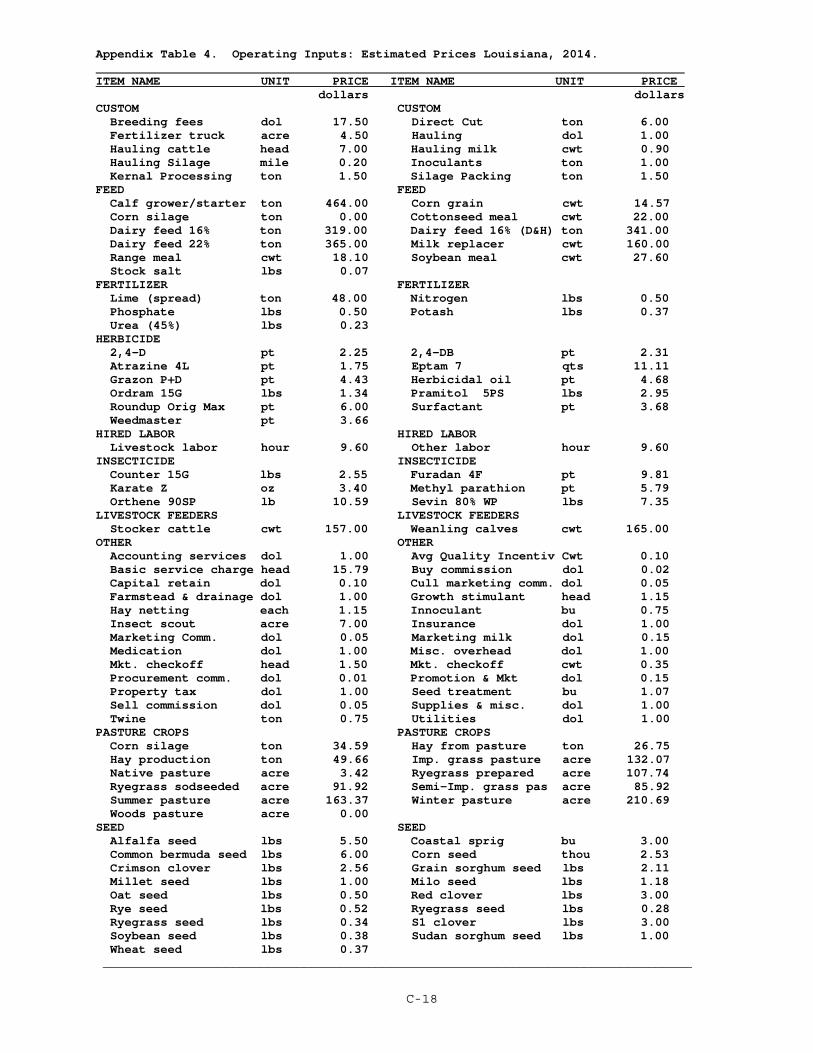
Appendix Table 4. Operating Inputs: Estimated Prices Louisiana, 2014. ITEM NAME UNIT PRICE ITEM NAME UNIT PRICE dollars dollarsCUSTOM CUSTOM Breeding fees dol 17.50 Direct Cut ton 6.00 Fertilizer truck acre 4.50 Hauling dol 1.00 Hauling cattle head 7.00 Hauling milk cwt 0.90 Hauling Silage mile 0.20 Inoculants ton 1.00 Kernal Processing ton 1.50 Silage Packing ton 1.50 FEED FEED Calf grower/starter ton 464.00 Corn grain cwt 14.57 Corn silage ton 0.00 Cottonseed meal cwt 22.00 Dairy feed 16% ton 319.00 Dairy feed 16% (D&H) ton 341.00 Dairy feed 22% ton 365.00 Milk replacer cwt 160.00 Range meal cwt 18.10 Soybean meal cwt 27.60 Stock salt lbs 0.07 FERTILIZER FERTILIZER Lime (spread) ton 48.00 Nitrogen lbs 0.50 Phosphate lbs 0.50 Potash lbs 0.37 Urea (45%) lbs 0.23 HERBICIDE 2,4-D pt 2.25 2,4-DB pt 2.31 Atrazine 4L pt 1.75 Eptam 7 qts 11.11 Grazon P+D pt 4.43 Herbicidal oil pt 4.68 Ordram 15G lbs 1.34 Pramitol 5PS lbs 2.95 Roundup Orig Max pt 6.00 Surfactant pt 3.68 Weedmaster pt 3.66 HIRED LABOR HIRED LABOR Livestock labor hour 9.60 Other labor hour 9.60 INSECTICIDE INSECTICIDE Counter 15G lbs 2.55 Furadan 4F pt 9.81 Karate Z oz 3.40 Methyl parathion pt 5.79 Orthene 90SP lb 10.59 Sevin 80% WP lbs 7.35 LIVESTOCK FEEDERS LIVESTOCK FEEDERS Stocker cattle cwt 157.00 Weanling calves cwt 165.00 OTHER OTHER Accounting services dol 1.00 Avg Quality Incentiv Cwt 0.10 Basic service charge head 15.79 Buy commission dol 0.02 Capital retain dol 0.10 Cull marketing comm. dol 0.05 Farmstead & drainage dol 1.00 Growth stimulant head 1.15 Hay netting each 1.15 Innoculant bu 0.75 Insect scout acre 7.00 Insurance dol 1.00 Marketing Comm. dol 0.05 Marketing milk dol 0.15 Medication dol 1.00 Misc. overhead dol 1.00 Mkt. checkoff head 1.50 Mkt. checkoff cwt 0.35 Procurement comm. dol 0.01 Promotion & Mkt dol 0.15 Property tax dol 1.00 Seed treatment bu 1.07 Sell commission dol 0.05 Supplies & misc. dol 1.00 Twine ton 0.75 Utilities dol 1.00 PASTURE CROPS PASTURE CROPS Corn silage ton 34.59 Hay from pasture ton 26.75 Hay production ton 49.66 Imp. grass pasture acre 132.07 Native pasture acre 3.42 Ryegrass prepared acre 107.74 Ryegrass sodseeded acre 91.92 Semi-Imp. grass pas acre 85.92 Summer pasture acre 163.37 Winter pasture acre 210.69 Woods pasture acre 0.00 SEED SEED Alfalfa seed lbs 5.50 Coastal sprig bu 3.00 Common bermuda seed lbs 6.00 Corn seed thou 2.53 Crimson clover lbs 2.56 Grain sorghum seed lbs 2.11 Millet seed lbs 1.00 Milo seed lbs 1.18 Oat seed lbs 0.50 Red clover lbs 3.00 Rye seed lbs 0.52 Ryegrass seed lbs 0.28 Ryegrass seed lbs 0.34 S1 clover lbs 3.00 Soybean seed lbs 0.38 Sudan sorghum seed lbs 1.00 Wheat seed lbs 0.37 __________________________________________________________________________________
C-18
![三tt口 ],11...sakuntala.saijai@gmail.com [Background] Organic hydroponics consist of nitrification process enriching nitrifying-microorganisms and crop cultivation maintaining the](https://static.fdocuments.fr/doc/165x107/5e7c57d0bfdfb06d7b179f70/tt-11-sakuntalasaijaigmailcom-background-organic-hydroponics-consist.jpg)